

Review of In-Situ and Remote Sensing-Based Indices and Their Applicability for Integrated Drought Monitoring in South Africa

1
Department of Water and Sanitation, 178 Francis Baard Street, Pretoria 0001, South Africa
2
Department of Earth Sciences, University of the Western Cape, Cape Town 7535, South Africa
3
Center for Environmental Research and Education, Duquesne University, Pittsburgh, PA 15282, USA
*
Author to whom correspondence should be addressed.
Water 2023, 15(2), 240; https://doi.org/10.3390/w15020240
Submission received: 27 October 2022
/
Revised: 22 December 2022
/
Accepted: 24 December 2022
/
Published: 5 January 2023
(This article belongs to the Special Issue Impacts of Climate Change on Water Resources and Water Risks)
Abstract
:The devastating socioeconomic impacts of recent droughts have intensified the need for improved drought monitoring in South Africa (SA). This study has shown that not all indices can be universally applicable at all regions worldwide, and there is no single index that can represent all aspects of droughts. The aim of this study was to review the performance and applicability of the Palmer drought severity index (PDSI), surface water supply index (SWSI), vegetation condition index (VCI), standardised precipitation index (SPI), standardised precipitation evapotranspiration index (SPEI), standardised streamflow index (SSI), standardised groundwater index (SGI), and GRACE (Gravity Recovery and Climate Experiment)-based drought indices in SA and provide guidelines for selecting feasible candidates for integrated drought monitoring. The review is based on the ‘2016 World Meteorological Organisation (WMO) Handbook of Drought Indicators and Indices’ guidelines. The PDSI and SWSI are not feasible in SA, mainly because they are relatively complex to compute and interpret and cannot use readily available and accessible data. Combining the SPI, SPEI, VCI, SSI, and SGI using multi-index or hybrid methods is recommended. Hence, with best fitting probability distribution functions (PDFs) used, and with an informed choice between parametric and non-parametric approaches, this combination has the potential for integrated drought monitoring. Due to the scarcity of groundwater data, investigations on the use of GRACE-based groundwater drought indices must be carried out. These findings may contribute to improved drought early warning and monitoring in SA.
1. Introduction
Drought is a costly natural hazard whose impact is significant and widespread, affecting many economic sectors such as agriculture, water resources, tourism, energy, ecosystems, etc. [1]. Historical records prove that drought is a recurrent phenomenon and affects relatively larger areas when compared to other hazards, such as floods, which are usually constrained to floodplains, coastal regions, storm tracks, or fault zones [2,3]. The impacts of droughts have been and continue to be witnessed at a wide range of geographical scales and climate regimes around the world. For instance, between 1980 and 2013, the United States of America (USA) reportedly experienced 18 droughts that resulted in over USD 250 billion in damages [1,2,3]. Sub-Saharan Africa has experienced several drought events, such as the 1982–1983 and the 1991–1992 droughts, which were reportedly the most severe meteorological droughts in the 20th century [4,5]. In South Africa (SA), the 1992 droughts were reportedly the worst droughts since the year 1900 and led to approximately 70% crop failure, livestock deaths, and malnutrition in humans. Between the years 2014 and 2017, the Western Cape (WC) province in SA reportedly experienced the worst water shortage in 113 years. Water levels from some major dams in the province were reportedly at approximately 23%, translating effectively to approximately 12.3% of the usable dam water. As a result, the SA government imposed strict water restrictions to water consumers and users [6]. It is thus evident that throughout most of the known history of humankind, drought has proven to be a recurrent feature, occurring with increasing frequency and intensity, resulting in significant economic, environmental, and social impacts [1,7]. Projections on global warming due to climate change indicate that there is a likelihood of an average global temperature increase of approximately 3 °C [5,8]. Records indicate that, during the 20th century, Sub-Saharan Africa has warmed at the average rate of 0.5 °C. Furthermore, it is projected that land areas of the Sahara and semi-arid parts of Southern Africa will experience warming by as much as 1.6 °C by 2050. These projections imply that many regions worldwide will continue to experience more frequent and more intense drought events, with irreversible impacts on human beings and ecosystems [8,9,10,11]. Hence, drought monitoring for early warning, mitigation, and response has become a topic for urgent scientific research in recent years [10,11,12].
Drought is a complex phenomenon, which varies every time in terms of its onset, intensity, duration, and geographical coverage. The South African Weather Service (SAWS) defined drought as the degree of dryness in comparison to normal or average amounts of rainfall for a particular area or place and the duration of the dry period [13]. A few more definitions exist in the literature, and, judging by their number and variety, it is apparent that there is no universal definition for drought [5,13]. However, from these existing definitions, it can be deduced that the primary driver for drought is precipitation. Hence, for simplicity, drought occurs when less than normal precipitation falls for an extended period, reaching a point of threatening water storage and supply [13]. The storage and supply of water could be through soil moisture, streamflow, as well as surface and groundwater storage. Drought is therefore a multivariate phenomenon and affects water supply and storage by propagating through four main phases: (1) It originates as meteorological drought characterised by below-normal precipitation over a relatively short period of time. (2) If the below-normal precipitation persists such that the impact results in insufficient soil moisture, thereby affecting crop growth, it becomes agricultural drought. (3) Hydrological drought ensues when the below-normal precipitation manifests in terms of reduced water levels in the surface and groundwater water reservoirs. (4) Socioeconomic drought conditions manifest when the physical water shortage begins to negatively affect water availability (supply vs. demand) for human consumption [4,7,11,13,14,15,16,17,18]. The complexity and lack of a clear definition makes drought challenging to quantify and monitor [19]. However, the description of the propagation of drought throughout its four phases (meteorological, agricultural, hydrological, and socio-economic) is very crucial because it helps to identify key drought indicators, leading to the development of appropriate indices for monitoring the different types of droughts. Indicators such as precipitation, temperature, soil moisture, vegetation condition, streamflow, groundwater levels, dam levels, etc., have been used to develop indices for tracking droughts throughout their phases [7,14].
Drought indices are quantitative measures that characterise drought by assimilating data from one or several indicators into a single numerical value. Drought indicators and indices are used to describe physical characteristics of drought, such as duration, magnitude, intensity, severity, spatial extent, and frequency. Hence, their strength may be measured by their ability to quantify drought duration, magnitude, intensity, severity, spatial extent, and frequency [3,11]. It is noteworthy, however, that the strength and quality of drought indices may also be measured by their computational simplicity as well as method flexibility [18]. Furthermore, the performance of any drought index or indices depends on the availability and accessibility of credible climatic and hydrological data. Data scarcity combined with the fact that a plethora of drought indices have been developed throughout the 20th and 21st centuries, make the selection of appropriate indices for meteorological, agricultural, and hydrological droughts a challenge. The selection of appropriate drought indices is a crucial step in the development of integrated drought monitoring systems that may enable effective drought risk monitoring and management and contribute to the implementation of SA’s national disaster management policies that relate to drought risk preparedness, mitigation, and response. Effective drought risk monitoring and management is therefore achieved when appropriate drought indicators and indices are properly selected and utilised to develop integrated systems capable of providing early warning information on drought duration, magnitude, intensity, severity, spatial extent, and frequency [11]. Globally, various drought indices have been developed and tested [11]. However, not all have been thoroughly and rigorously tested and reconfigured for the SA geological and hydro-climatic conditions. Hence, this study hypothesises that not all the existing drought indices developed to date can be applicable for SA hydro-climatic conditions and that there is no single index that can represent all aspects of meteorological, agricultural, and hydrological drought conditions and impacts in SA. It is thus imperative that a review of the performance and applicability of selected drought indices be carried out to identify suitable candidates for characterising meteorological, agricultural, and hydrological droughts in a comprehensive and integrated manner in SA. Many reviews have been conducted focussing on comparing the strengths and weaknesses of the existing drought indices, but none have been presented that focus on the applicability of these indices for integrated drought monitoring in the SA context [11,13].
Hence, the aim of this study is to provide a review of the performance and applicability of insitu and satellite-based drought indices and provide guidance on the selection of suitable and feasible indices for integrated drought monitoring in SA. The WMO recommended that the SPI be used by national meteorological and hydrological services globally to characterise meteorological drought. However, the WMO acknowledged that other indices should be assessed and recommended for hydrological and agricultural drought monitoring [20,21]. It is thus essential that an assessment be carried out before drought indices are selected for meteorological, agricultural, and hydrological drought monitoring in SA. Section 2 of this paper provides a brief overview of some of the vegetation types, climate, as well as surface and groundwater systems in SA; Section 3 describes the methodology or approach used to carry out the review; Section 4 presents and discusses the review results; and Section 5 provides concluding remarks and recommendations on feasible drought indices and alternative methods for drought index development and drought monitoring in SA.
2. The South African Context
SA is semi-arid, water scarce, and reportedly the 30th driest country in the world. Meteorological, agricultural, and hydrological drought impacts typically affect two main types of natural resources in SA, i.e., vegetation and water resources, before their socioeconomic impacts are evident [22,23].
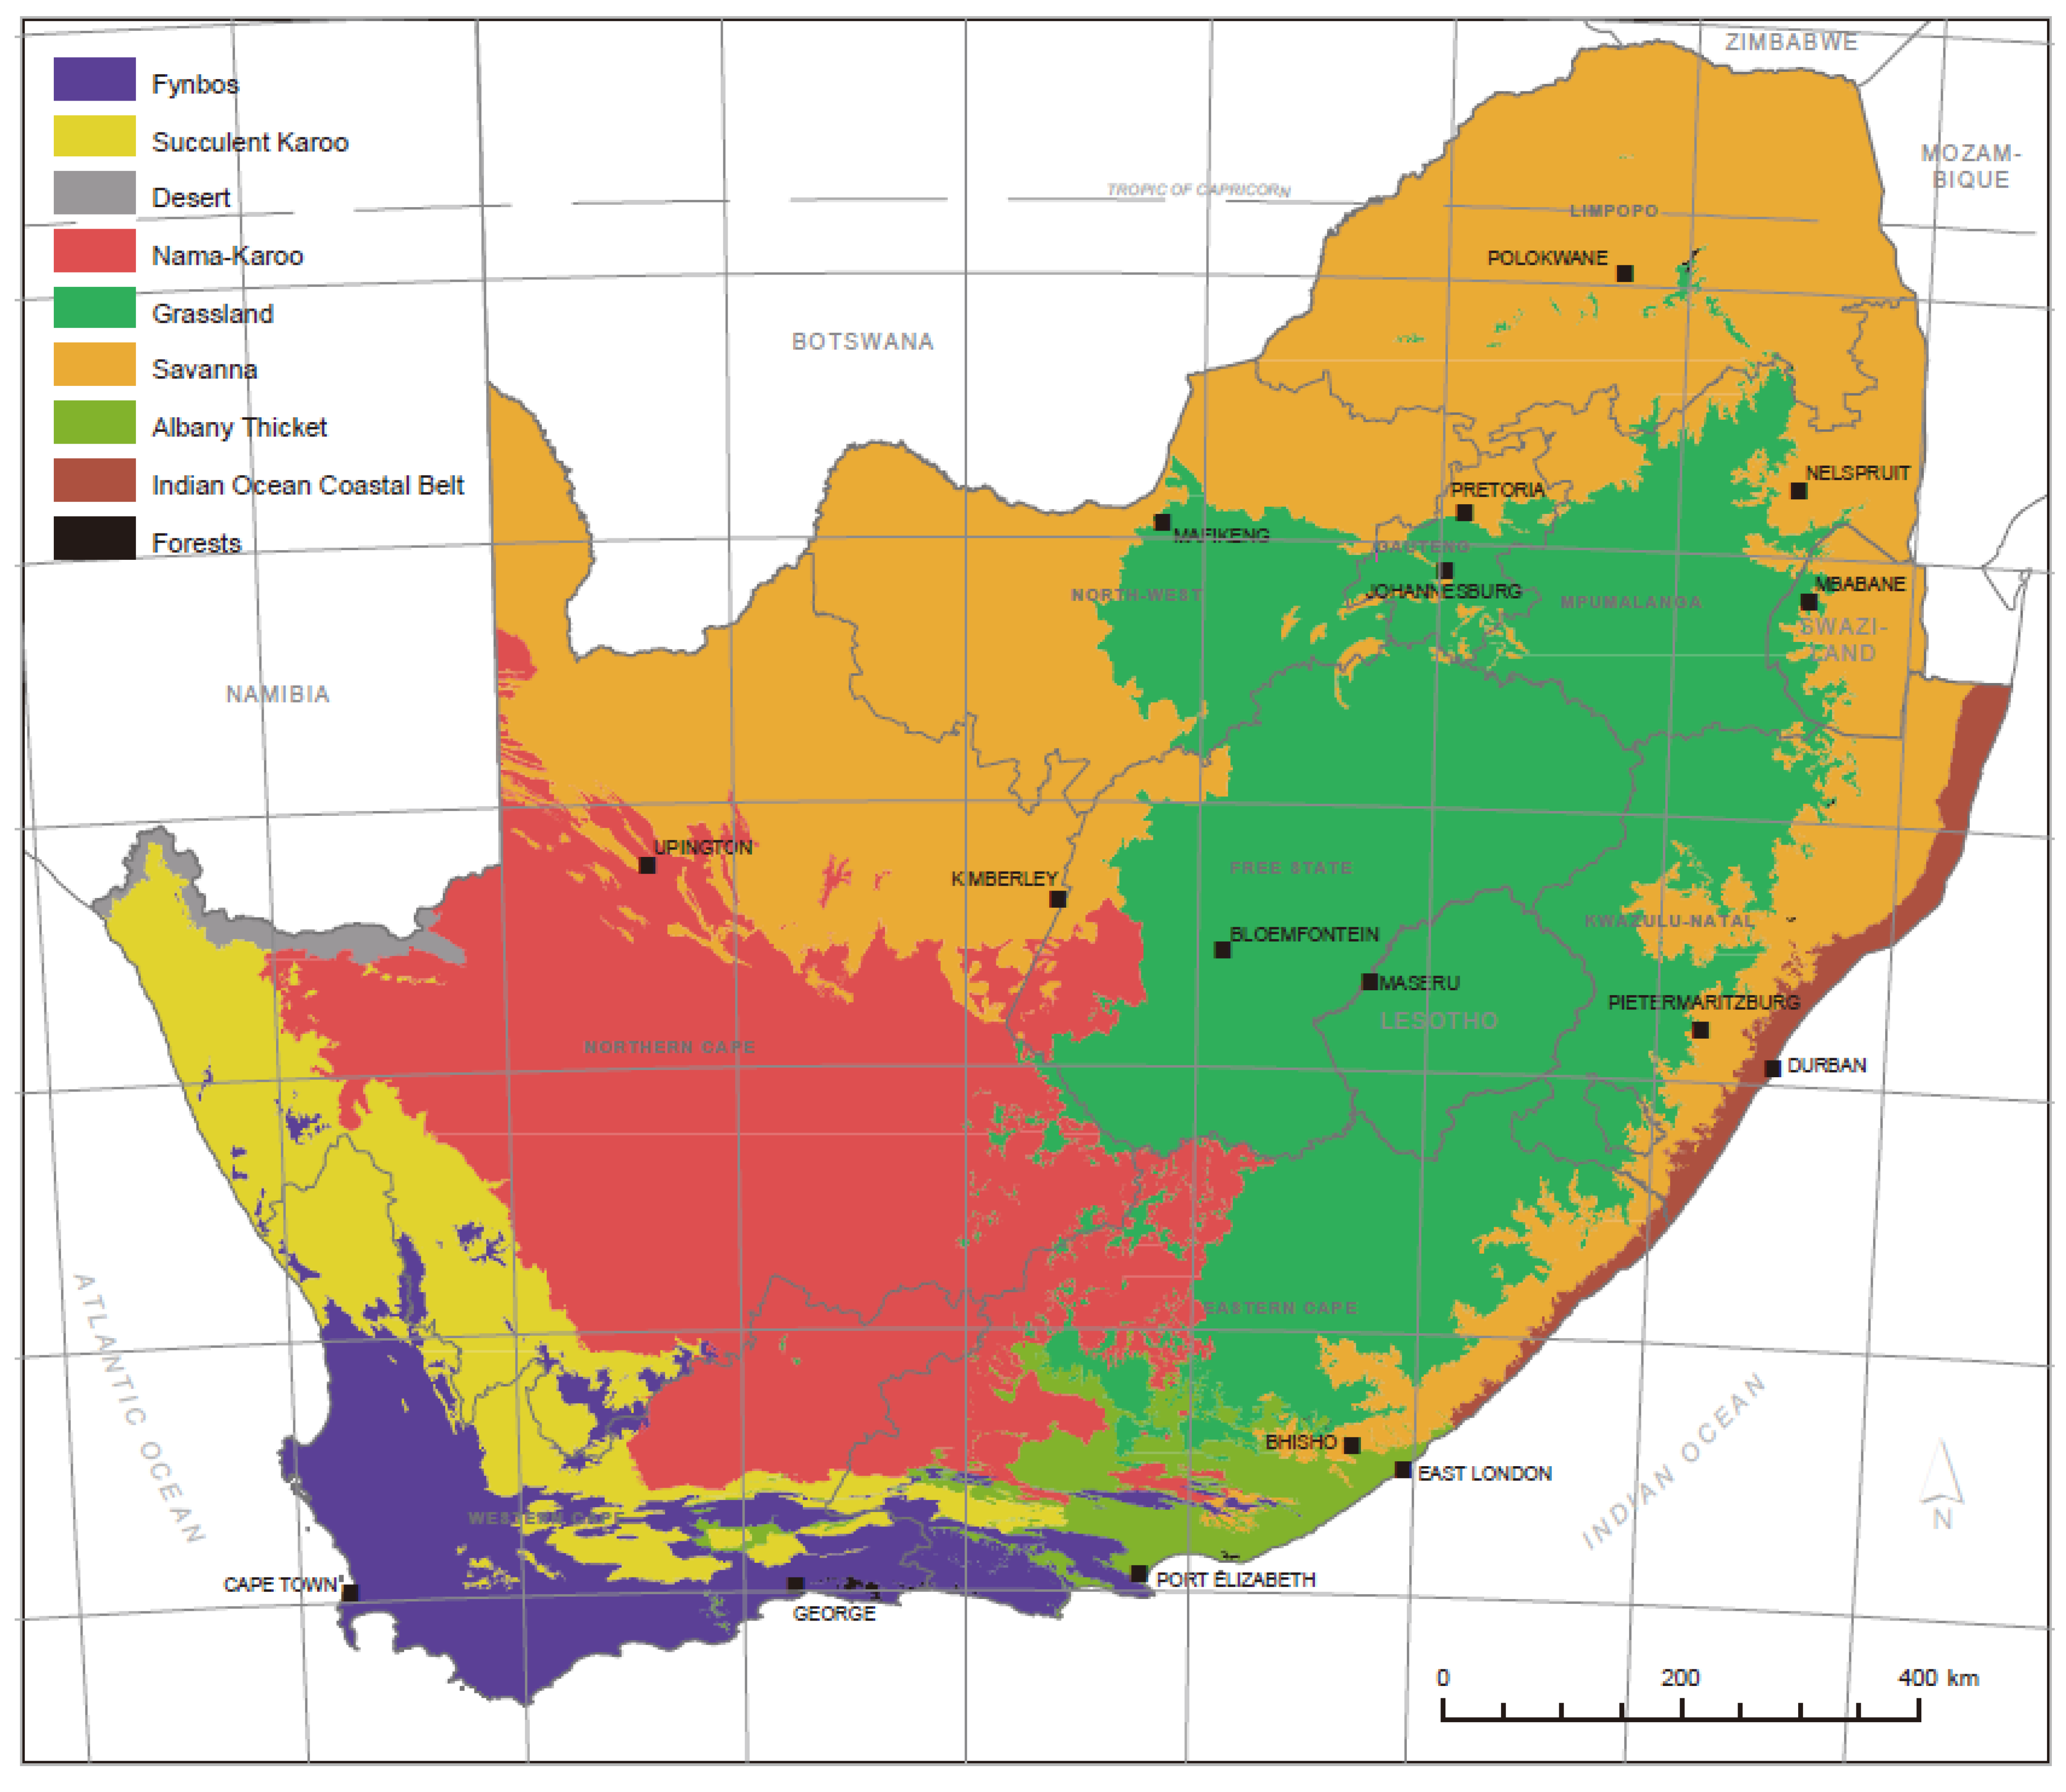
Vegetation in SA can be classified into nine key vegetation groups or biomes, according to Rutherford et al. (2006) (Figure 1). The winter rainfall fynbos biome in the southwestern Cape region; the winter rainfall Succulent Karoo biome (smallest of the world’s six floristic kingdoms) found over the Cape Fold Mountains and sandy lowlands regions of the southwestern Cape; the summer rainfall savanna biome situated on the north and east region of SA; the summer rainfall grassland biome situated in the interior region of SA (home to a wealth of species limited to the southern African region); the Indian Ocean coastal belt (IOCB) biome (makes up SA’s southernmost extent of coastal (sub)tropical forests of the wet, tropical, and subtropical seaboard of East Africa); the desert biome located at the extreme northwest of SA (forms the southern tip of the winter-rainfall domain of the Namib Desert as well as a summer-rainfall Gariep Desert); the Albany thicket biome in the south-eastern region of SA (contains plant species that overlap between savanna, Nama-Karoo, and subtropical forest biomes); the summer-rainfall Nama-Karoo biome (possibly the least species-rich amongst all the biomes); and the forests biome, which is highly distinctive and characterised by its small and patchy occurrence over the wetter parts of the winter- and summer-rainfall areas. It is clearly part of the global warm-temperate forest biome [24]. Vegetation in SA plays an important role in drought monitoring and management because changes in vegetation cover may negatively or positively impact agricultural productivity. It is therefore imperative that indices that are based on vegetation condition be considered when monitoring drought in SA [24].
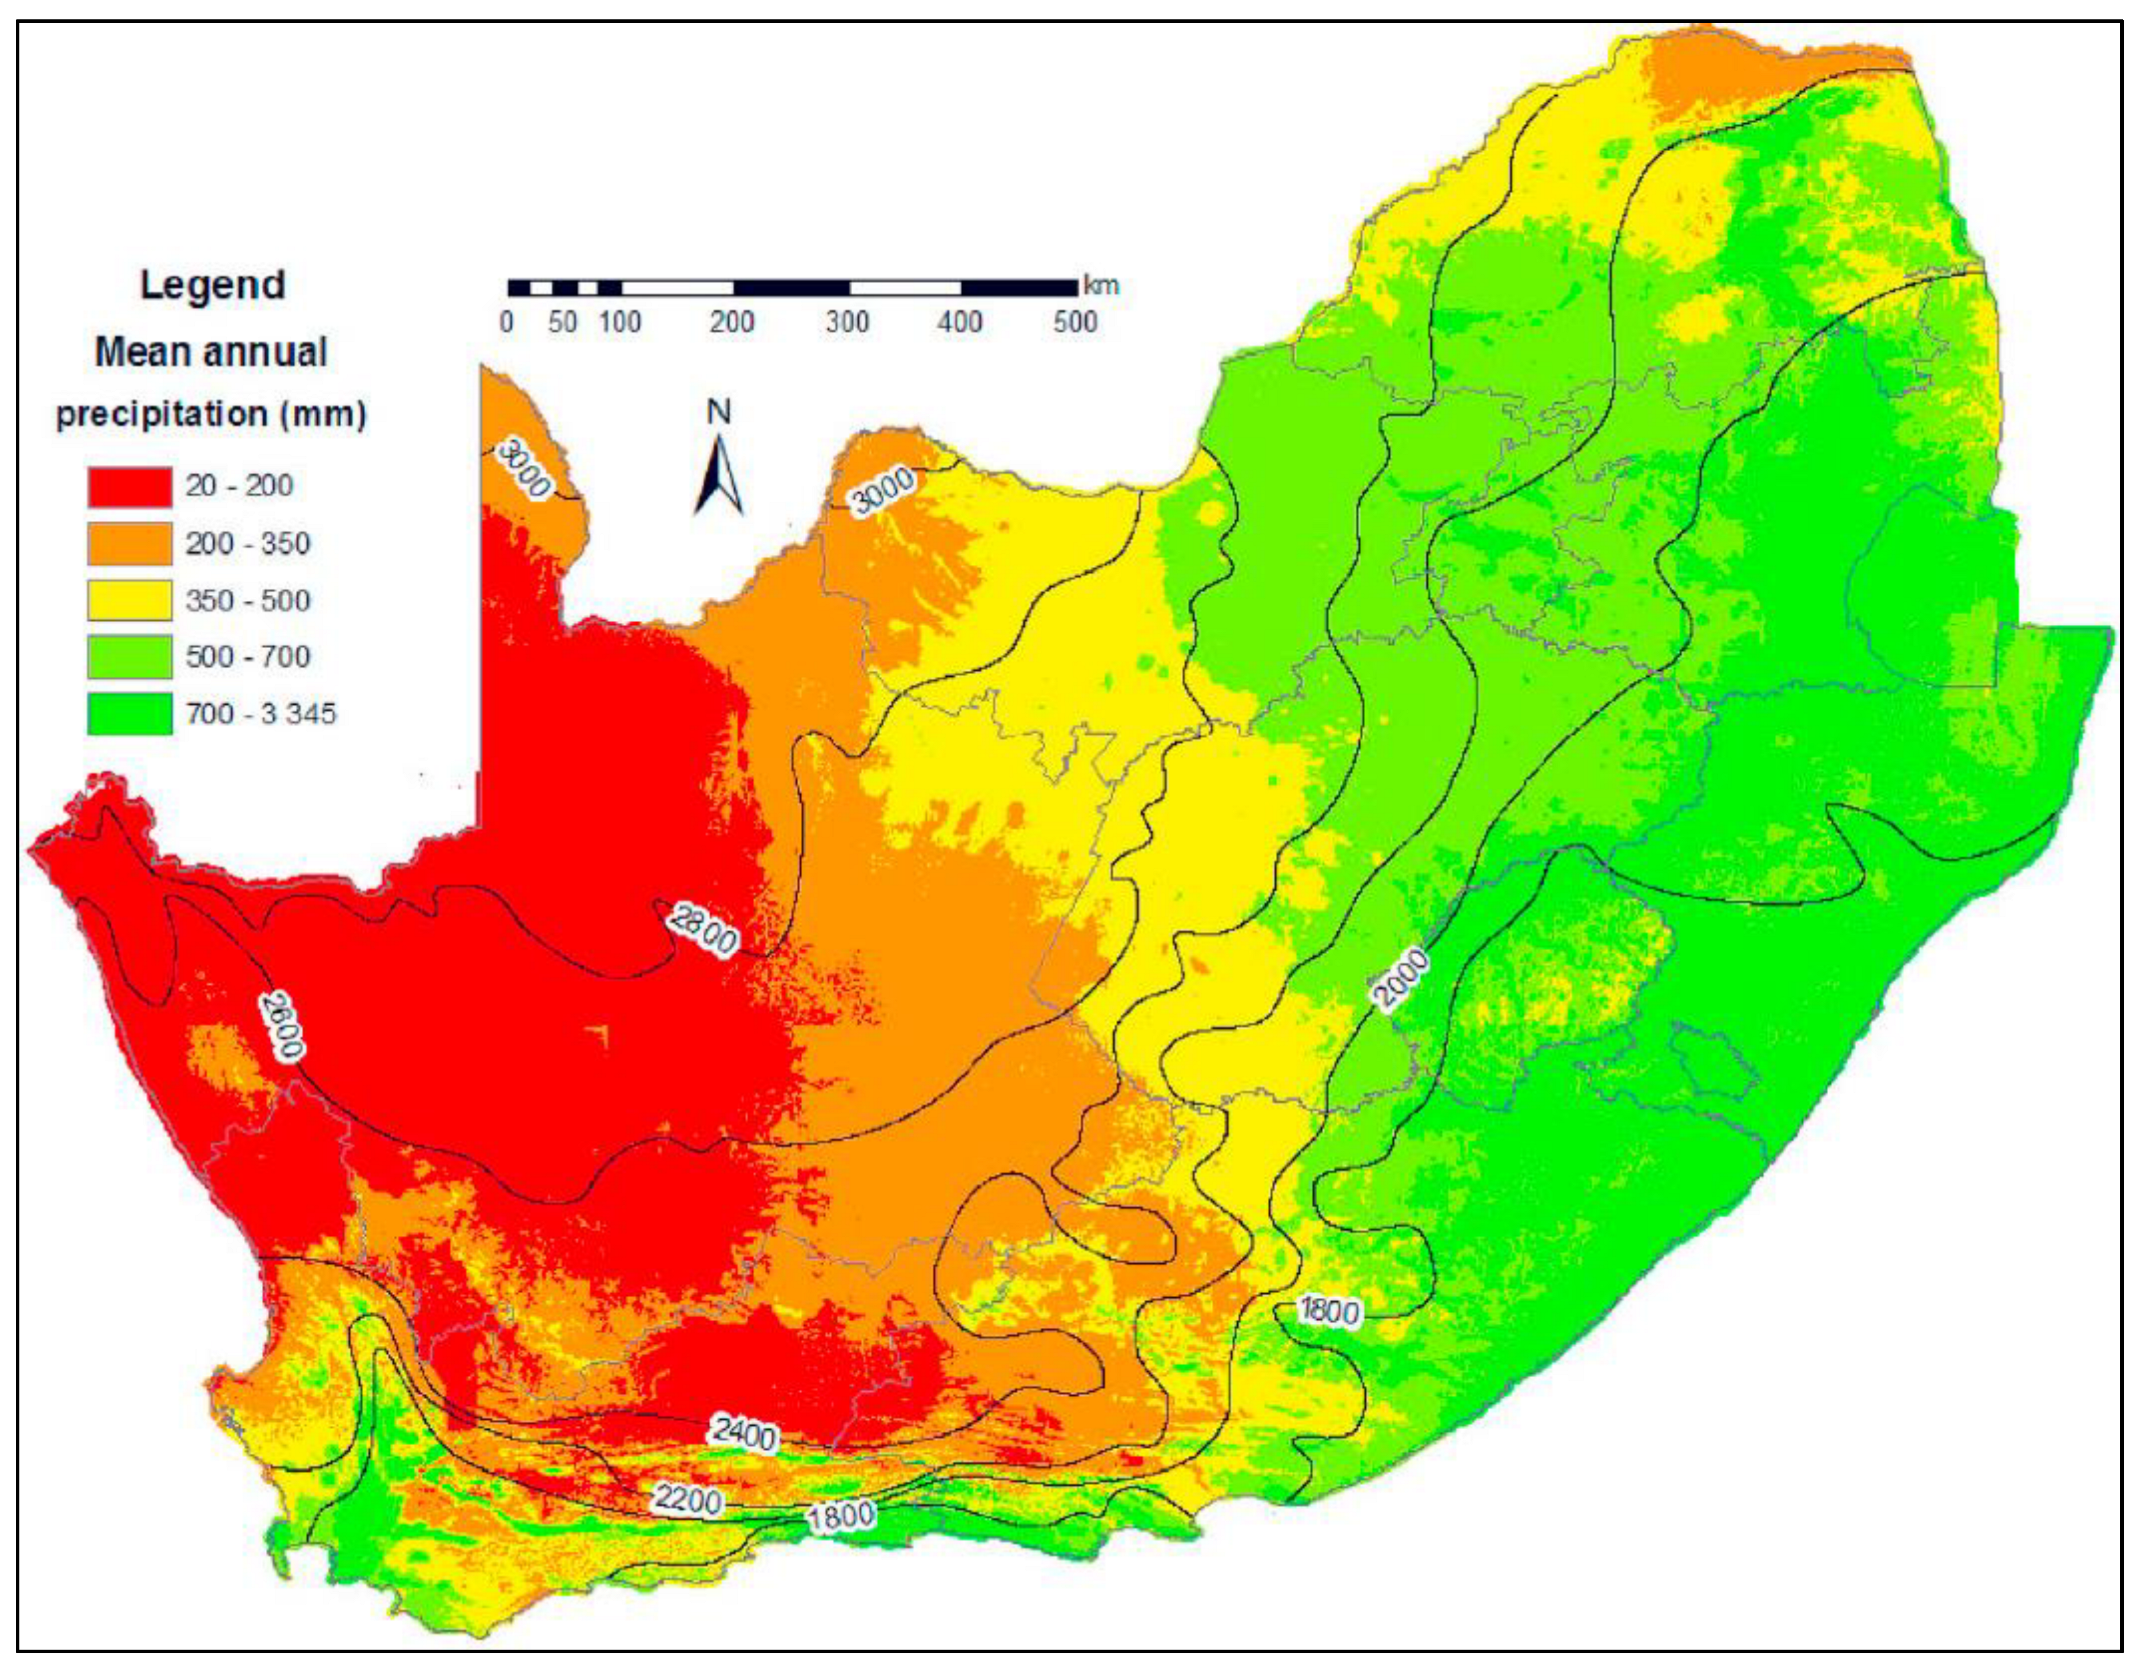
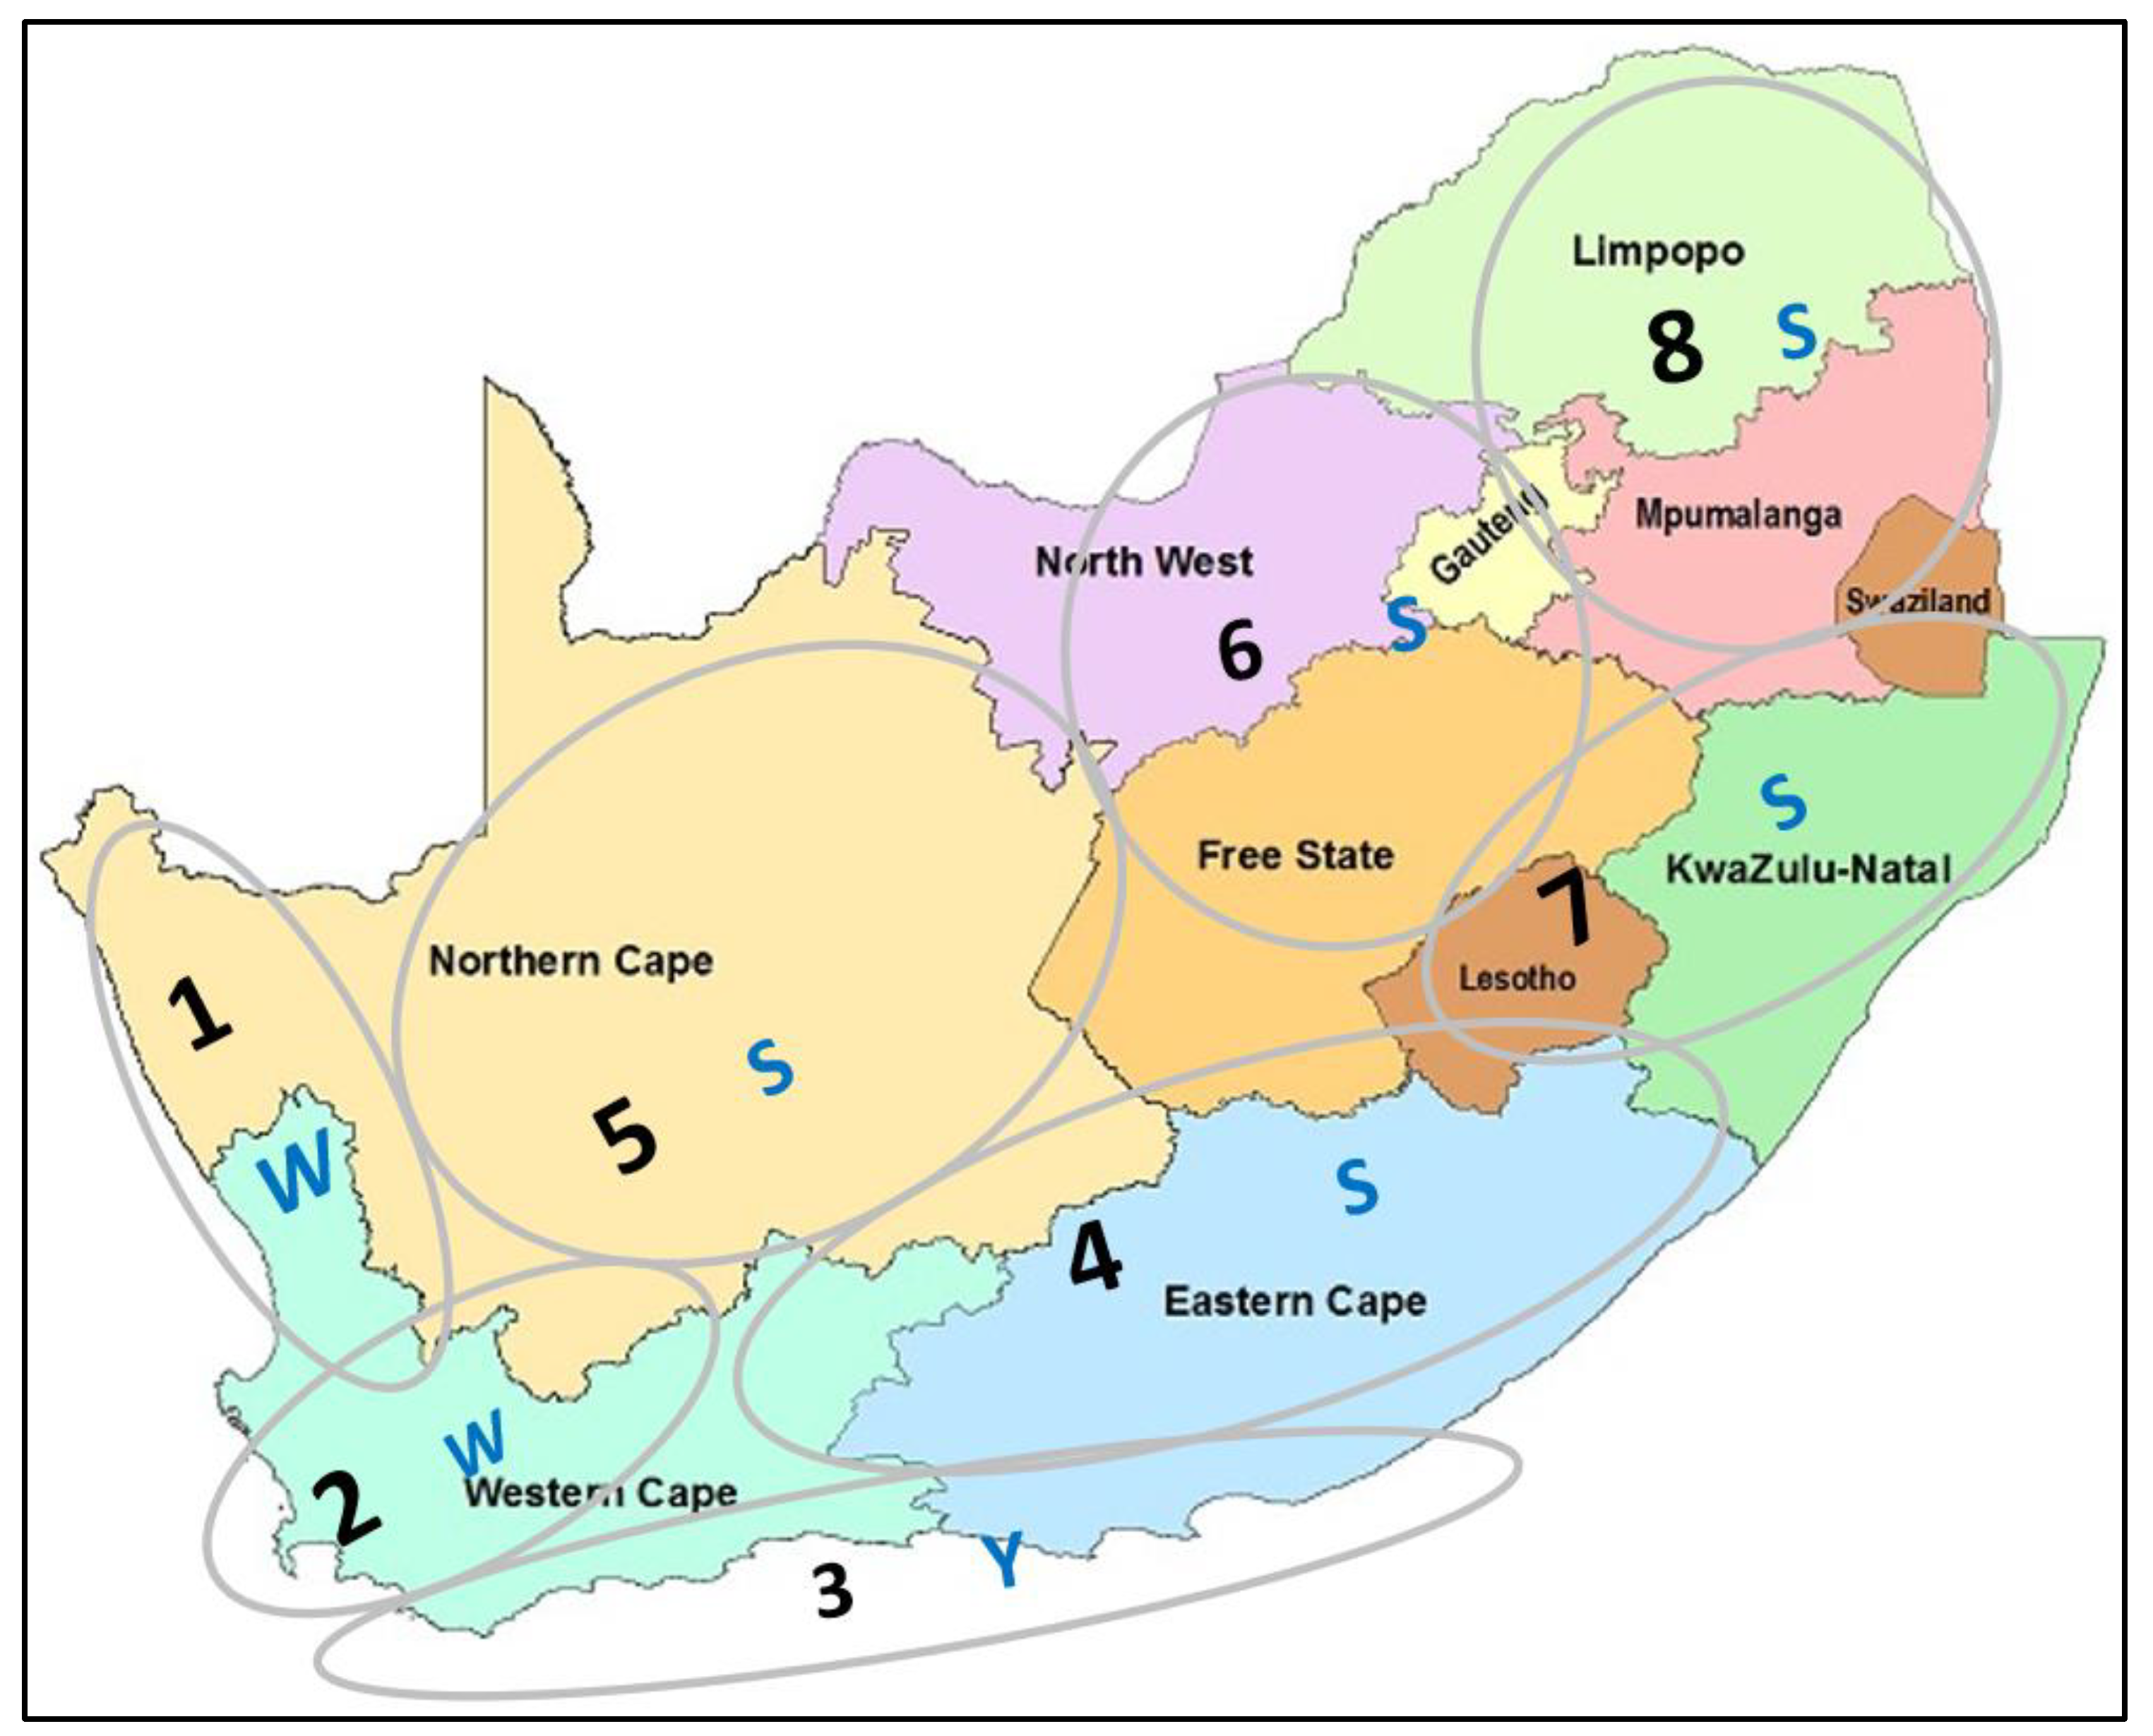
With an average precipitation of about 460 mm per year, SA receives only slightly more than half of the world’s average precipitation (860 mm per year). Furthermore, SA is subject to relatively high potential evapotranspiration, ranging from under 1800 mm per year in the east of the country to over 3000 mm per year in the north-western part of the country (Figure 2) [25,26,27]. Rainfall in SA is highly variable and unevenly spread [28]. At a regional scale, the SA rainfall regime is complex, consisting of eight climatic regions (Figure 3). The north-western Cape (1) and the southwestern Cape (2) experience winter rainfall with maxima of approximately 30 and 70 mm, respectively. The South Coast (3) experiences regular all-year rainfall ranging between 30 to 40 mm. The southern interior (4) and the western interior (5) experience summer rainfall with maxima of about 60 mm in March; while the central interior (6), KwaZulu-Natal (7), and the north-eastern interior (8) experience summer rainfall with maximum rainfall of approximately 130 mm in January [28]. This complex rainfall regime may have the potential to complicate drought monitoring in SA [28]. It is therefore imperative that indices that are based on temperature (evapotranspiration) and rainfall (precipitation) be considered when monitoring drought in SA.
SA has two main strategic water sources, i.e., surface water, and groundwater storages. It is reported that approximately 8 to 10% of the land area in SA is the source of about 50% of the country’s surface water storage [27]. The water demand on SA’s surface water sources is mainly from the water supply systems that provide water to more than 50% of SA’s population as well as cities and towns that generate more than 64% of national economic activity [27]. There also exists approximately 70% of the water demand for irrigation in SA. Some of the major water supply systems in SA include the Western Cape Water Supply System (WCWSS), which comprises six interlinked major dams (Theewaterskloof, Wemmershoek, Steenbras Lower, Steenbras Upper, Voëlvlei, and the Berg River dams) [27]. The Breede-Gouritz Water Management Area (BGWMA) and the Berg-Olifants Water Management Area (BOWMA) are the main surface water drainage systems for the WCWSS [28]. The WCWSS provides approximately 99.6% of the combined storage capacity, supplying bulk water to Cape Town (324 Mm3/year), the agricultural sector (144 Mm3/year), and nearby municipalities (23 Mm3/year), amongst others (Mm3 ≈ million cubic meters) [29]. The Integrated Vaal River System (IVRS) is an important bulk water supply system in SA, supplying water to 46% of the country’s economy and 33% of the population (Johannesburg, Midrand, Vereeniging, Rustenburg, Secunda, and others). The major dams in the IVRS are Bloemhof Dam on the Vaal River (total storage capacity (TSC) of 1.16 billion m3), Vaal Dam on the Vaal River (TSC = 2.57 billion m3), Grootdraai Dam on the Vaal River (TSC = 0.35 billion m3), Katse Dam on the Vaal River (TSC = 1.95 billion m3), Sterkfontein Dam on the Wilge River (TSC = 2.62 m3), Mohale Dam on the As River/Tunnel (0.94 billion m3), and the Woodstock Dam (0.38 billion m3) through pumped transfer to the IVRS. As well established as they are, the WCWSS, IVRS, and other water supply systems, such as the Algoa, Olifants, Luvuvhu-Lethaba, etc., all suffer from the negative impacts of droughts [27]. It is therefore imperative that indices that are based on surface water parameters such as streamflow and/or dam levels be considered when monitoring drought in SA.
Groundwater is equally important as a water supply source in SA because it sustains perennial rivers during the dry seasons, and it can be exploited directly through abstractions. It supplies approximately 32% of SA’s human settlements that rely on groundwater supply. About 44% of the groundwater in SA is used for agriculture, while about 32% is used for industrial purposes. For instance, the Cape Town region has three major aquifers, i.e., the Table Mountain Group (TMG) aquifer, the Cape Flats aquifer, and the Atlantis aquifer, which have the potential to supplement the WCWSS during both dry and wet periods [27]. For example, by 01 January 2022, the WC province has been reported to have a total of approximately 744 Mm3/year available groundwater, with approximately 589 Mm3/year being abstracted from the total available groundwater. From the water management area perspective, by 1 January 2022, the BGWMA had approximately 467 Mm3/year available groundwater, with approximately 263 Mm3/year abstracted; while the BOWMA had approximately 262 Mm3/year available groundwater, with approximately 319 Mm3/year being abstracted (NIWIS.DWS.gov.za/NIWIS2/GroundWaterStatus). Groundwater sources may also be negatively affected by droughts. However, groundwater supply and availability appear to last longer than surface water availability during prolonged droughts. Hence, an integrated approach using indices based on both vegetation, temperature, rainfall, surface water, as well as groundwater is recommended for drought monitoring in SA.
3. The Review Approach
A literature review can broadly be described as a systematic approach for collecting and synthesizing previous research. It serves as a foundation for emerging research, and, if well conducted, it may produce new ideas for future research [30]. Therefore, the literature review conducted for this study focused mainly on published studies containing method descriptions as well as empirical information on the performance, strengths, weaknesses, and applicability of selected drought indices. The review outcome was used to recommend suitable or feasible approaches for integrated drought monitoring in SA.
The criteria for the review of the insitu and remote sensing-based drought indices and their applicability in SA is based on the 2016 WMO Handbook of Drought Indicators and Indices. The handbook provides guidelines and recommendations on the criteria to be used to help users decide which indicators and indices are most appropriate for drought monitoring and early warning. The handbook recommends that drought indices’ selection be guided by the following 7 questions [31] (pp. 5–6): (1) Do the indices allow for timely detection of drought to trigger appropriate communication and coordination of drought response or mitigation actions? (2) Are the indices sensitive to climate, space, and time to determine drought onset and termination? (3) Are the indices and various severity levels responsive and reflective of the impacts occurring on the ground for a given location or region? (4) Are the chosen indicators, indices, and triggers the same, or different, for going into and coming out of drought? It is critical to account for both situations. (5) Are composite (hybrid) indicators being used to take many factors and inputs into account? (6) Are the data and resultant indices/indicators available and stable? In other words, is there a long period of record for the data source that can give planners and decision-makers a strong historical and statistical marker? (7) Are the indices easy to implement? Do the users have the resources (time and human) to dedicate to efforts, and will they be maintained diligently when not in a drought situation? Hence, based on the 7 questions in the 2016 WMO Handbook of Drought Indicators and Indices, the following criteria was derived and used in the review of the selected insitu and remote sensing-based drought indices [31] (pp. 5–6): (I) Capability of the indices to characterise meteorological, agricultural, and hydrological droughts according to their duration, magnitude, intensity, severity, spatial extent, and frequency (WMO Question 1–4). (II) Sensitivity of the indices to SA geological, hydrological, and climatic (geo-hydro-climatic) conditions (WMO Question 2). (III) Performance, strengths, and weaknesses of the indices when using readily available and accessible data in SA (WMO Question 6). (IV) Computational and interpretation simplicity of the indices (WMO Question 7). (V) Versatility of the indices for integrated drought monitoring (WMO Question 5) [31] (pp. 5–6).
The selection of the indices to be reviewed in this study was based on the Bachmair et al. (2016) study, which used questionnaire surveys to identify indices that are commonly preferred and used by government, research, and academic institutions worldwide. The precipitation percentile (PP), standardised precipitation index (SPI), standardised precipitation evapotranspiration index (SPEI), Palmer drought severity index (PDSI), and self-calibrated (Sc-PDSI) were listed by Bachmair et al. (2016) as the most preferred indices for meteorological drought monitoring. The soil moisture deficit (SMD), normalised difference vegetation index (NDVI), vegetation condition index (VCI), crop moisture index (CMI), and the Palmer moisture anomaly index (PMAI) were listed as the most preferred indices for agricultural drought monitoring. The streamflow percentile (SP), reservoir levels (RL), surface water supply index (SWSI), Palmer hydrological drought severity index (PHDSI), cumulative streamflow anomaly (CSA), and the standardised streamflow index (SSI) were the most preferred indices for hydrological drought monitoring. The institutions that participated in the survey highlighted calculation and interpretation simplicity, data availability and accessibility (timeliness), as well as common practice as some of the main reasons for the method preferences [32]. From the Bachmair (2016) list, this study selected the PDSI, SWSI, VCI, SPI, SPEI, and the SSI for review. To account for groundwater drought monitoring, the standardised groundwater index (SGI), and the GRACE groundwater drought index (GGDI) were reviewed in this study. To account for the review criteria that deals with the versatility of the indices for integrated drought monitoring (WMO Question 5), multivariate drought indices were also reviewed.
4. Review Results and Discussion
The Palmer drought severity index (PDSI) (Equation (3)) was developed by Palmer (1965) and became widely used in the United States of America (USA) to monitor drought. It is based mainly on anomalies in the supply and demand in the water balance equation, using temperature and soil moisture as the main indicators. It uses a two-layer soil water balance model to estimate the soil moisture supply and demand with the inputs including temperature, precipitation, and available water content of the soil on a monthly time scale, or other scales, such as weekly [3,13,17,33,34].
The PDSI calculation procedure is carried out using evapotranspiration (ET), recharge (R), runoff (RO), loss (L), potential evapotranspiration (PE), potential recharge (PR), potential runoff (PRO), and potential loss (PL), which are derived from meteorological and soil data [35]. Ochieng et al. (2021) summarised the PDSI calculation process as follows [35]: Compute the moisture departure and moisture anomalies based on the water balance model, resulting in the climate characteristic, K, as shown in Equation (1):
where
is the summation of the annual moisture departure and is the mean moisture anomaly for a specific month.
A predefined PDSI value is a weighted sum of the previous PDSI value and the current moisture anomaly leading to Equation (3):
If and then self-calibrated PDSI (Sc-PDSI) is given, as shown in Equation (4):
where C represents the drought category, m is the slope, and b is the y- intercept.
The PDSI is an effective method but complex, data demanding, and computationally intensive, which is not feasible for operational drought monitoring in SA. The inherently fixed time scale of 9 months makes it unable to detect drought onset, an important feature in drought early warning and preparedness. According to several studies, the PDSI is more effective for monitoring meteorological and agricultural droughts than for hydrological drought, which is not favourable for integrated drought monitoring in SA. Being a multi-parameter/indicator index, it can integrate the combined effects of both precipitation, temperature, evapotranspiration, and soil moisture, excluding groundwater storage. A major drawback is that the PDSI cannot perform well in hydroclimatic conditions, other than that of the regions it was initially developed for, without a recalibration process [3,13,17,33,34]. The PDSI is therefore capable of characterising meteorological and agricultural droughts according to their duration, magnitude, intensity, severity, spatial extent, and frequency, but very sensitive to varying geo-hydro-climatic conditions because it would require recalibration or reconfiguration. Due to the scarcity of data such as soil moisture, the PDSI would not be feasible for SA because such data is not readily available and accessible in SA, specifically for operational use. Due to its complexity, the PDSI would not be versatile for integrated drought monitoring in SA. It is anticipated that combining it with other indices to form multivariate indices would be challenging. The summary of the review of the PDSI based on the 2016 WMO Handbook of Drought Indicators and Indices is provided in Table 1.
The self-calibrated Palmer drought severity index (Sc-PDSI) (Equation (4)) was then developed to account for the shortcomings of the PDSI. It is based on the original PDSI but replaces the constants with values that can be calibrated for the region of interest, making it more flexible than the original PDSI [13]. The PDSI is among the frequently used drought monitoring tools in the USA and has laid a good foundation for drought monitoring and management in the rest of the world, including Africa [35].
Gizaw and Gan (2016) used the Sc-PDSI and climate data such as precipitation and temperature to study the impact of climate change on the frequency, severity, and spatial distribution of drought events in sub-Saharan Africa. The self-calibrating feature in the Sc-PDSI algorithm enables automatic calibration of the PDSI parameters from historical climate data at the location of interest, making the Sc-PDSI more flexible than the original PDSI. The study by Gizaw and Gan (2016) has thus shown that the Sc-PDSI can be a useful tool for drought early warning, preparedness, and mitigation in sub-Saharan Africa [36].
Ochieng et al. (2021) used the Sc-PDSI to study the spatiotemporal behaviour of historical (39 years) and projected drought characteristics such as its duration, severity, and intensity in a Kenyan region. Using monthly mean precipitation data from the Climate Hazard Group Infrared Precipitation with Station (CHIRPS), monthly average temperature data from the Climate Research Unit (CRU), and soil water content from Oak Ridge National Laboratory Distributed Active Archive Center (ORNL DAAC), the Sc-PDSI identified various drought with varying spatiotemporal characteristics. The study also used the Sc-PDSI and projection models to conclude that there is a likelihood of increased future dry periods in their region of interest [35].
Edossa et al. (2015) used the Sc-PDSI to study the characteristics of drought in the Modder River Basin (MRB) tertiary catchment in SA. Using long-term records (1950–1999) of precipitation, temperature, and soil moisture data, the Sc-PDSI enabled the identification of the number, location, severity, magnitude, and intensity of drought events in the study area. The Sc-PDSI study results enabled Edossa et al. (2015) to identify lag times between hydrological and meteorological drought events, which is crucial information for policy makers and effective drought risk management in SA [37].
It is evident that the Sc-PDSI is a powerful tool that has already been tested in many regions across the world, but, as noted by Ochieng et al. (2021) and Edossa et al. (2015), the PDSI and/or the Sc-PDSI is generally a complex and data-intensive method. When comparing the PDSI with the SPEI and the SPI, Balbo et al. (2019) found that both were equally capable of identifying and quantifying meteorological and agricultural drought events. However, the authors did note that the SPI would be a preferred choice over the PDSI due to the SPI’s simplicity and versatility. Hence, in the SA context, the use of the PDSI and/or the Sc-PDSI is not feasible for integrated drought monitoring, more especially if it is intended for use to develop the already complex multivariate drought indices [35,37,38]. Hence, according to the review criteria used in this study, the PDSI and the Sc-PDSI are not recommended for integrated drought monitoring in SA.

Table 1.
Review of the PDSI and the SWSI; based on the 2016 WMO Handbook of Drought Indicators and Indices [31] (pp. 5–6).
Table 1.
Review of the PDSI and the SWSI; based on the 2016 WMO Handbook of Drought Indicators and Indices [31] (pp. 5–6).
| Reviewed Drought Indices | Review Criteria [31] (pp. 5–6) | ||||
| (I) Capability of the indices to characterise meteorological, agricultural, and hydrological droughts according to their duration, magnitude, intensity, severity, spatial extent, and frequency | (II) Sensitivity of the indices to SA geological, hydrological, and climatic (geo-hydroclimatic) conditions | (III) Performance, strengths, and weaknesses of the indices when using readily available and accessible data in SA | (IV) Computational and interpretation simplicity of the indices | (V) Versatility of the indices for integrated drought monitoring | |
| Palmer Drought Severity Index (PDSI) |
|
|
|
|
|
| Surface Water Supply Index (SWSI) | The SWSI has the capability to characterise meteorological, agricultural, and hydrological droughts according to their duration, magnitude, intensity, severity, spatial extent, and frequency. |
|
|
|
|
Shafer and Dezman (1982) presented the surface water supply index (SWSI) as a hydrological drought index aimed at addressing the shortcomings of PDSI. The SWSI uses weighted sum of non-exceedance probabilities of four drought indicators, i.e., precipitation, reservoir storage, snowpack, and streamflow, taken from probability distributions fitted to each drought indicator. The indicators are subjectively assigned weighted values based on the total contributions to the water balance in a catchment [13,39]. The SWSI is not accurate at all catchments, especially where inter- and intra-basin transfers are taking place [13,17]. The SWSI can be calculated using Equation (5) [39]:
where
SWSI = Surface water supply index (dimensionless)
PN = Probability of non-exceedance
rn = Rainfall (mm)
sf = Streamflow (m2/s)
rs = Storage reservoir level component (m)
a, b and c = Weighting factors. Provided a + b + c = 1
C1 = 50 and C2 =12
SWSImod = Modified surface water supply index (dimensionless)
df = Dam inflow
The advantage of developing a drought index based on the water balance model is that it allows the index to consider various physical processes that contribute to drought development [17]. However, Garen (1993) highlighted a major drawback of the SWSI. The weights of the indicators used in original SWSI were obtained using a subjective assessment of the impact of each component on water availability in the catchment of interest. No criterion existed for assigning weights to the indicators [40].
To address this and other inherent weaknesses in the SWSI method, Garen (1993) presented a revised SWSI, and, according to this review, it has made the calculation and computation even more complex [40]. The summary of the review of the SWSI based on the 2016 WMO Handbook of Drought Indicators and Indices is provided in Table 1.
Wambua (2019) presented a hydrological drought forecasting approach based on the modified SWSI (Equation (6)), the streamflow drought index (SDI) and artificial neural networks (ANNs). To calculate the SWSI at a catchment in Kenya, the authors used monthly precipitation, stream flow, reservoir levels, and dam inflows. To address the issue related to the subjective weighting of each drought indicator, the authors estimated the weights using a method they referred to as the proportioning objective procedure. The authors asserted that the approach computes the weighting parameters more accurately compared to the subjective method developed by Shafer and Dezman (1982) [41].
The positive aspect from the studies carried out by Shafer and Dezman (1982) and Wambua (2019) is that the SWSI can be applied at different catchments with different geo-hydro-climatic conditions and using different input parameters. This is an indication that the SWSI can be flexible [39,41]. Its ability to utilise various combinations of input parameters of choice into a single index indicates that it may be possible to design or modify the SWSI to incorporate drought indicators that account for both meteorological, agricultural, and hydrological droughts. [42]. When appropriate parameters are utilised, the SWSI has the capability to characterise meteorological, agricultural, and hydrological droughts according to their duration, magnitude, intensity, severity, spatial extent, and frequency. The SWSI is flexible enough to be applied at SA’s various geo-hydroclimatic conditions. It performs well when using readily available and accessible data in SA, such as rainfall, streamflow, and dam levels. However, a major drawback is its computational and interpretation complexity, due to the uncertainty or lack of criterion for assigning weights to the indicators used in its calculation. Hence, according to the study review criteria, the SWSI would not be a preferred method for integrated drought monitoring in SA.
Kogan (1990) developed the vegetation condition index (VCI) using satellite-based vegetation condition data, which is collected using Advanced Very High-Resolution Radiometer (AVHRR) designed by the National Oceanic and Atmospheric Administration (NOAA). Spectral reflectance data are used to calculate the normalised difference vegetation index (NDVI), which ultimately is used to calculate and compute the VCI. The VCI can be calculated using Equation (7) [43,44,45]:
where NDVIj is the average NDVI over a composite period interest, NDVImin and NDVImax are the corresponding multi-year minimum and maximum NDVI for the specific analysed period of a year.
This study has found that the VCI is a useful tool for monitoring agricultural drought, in terms of its onset, duration, end, and intensity, as well its impact on vegetation. Kogan (1995) further presented the temperature condition index (TCI) as an enhancement for monitoring drought using remotely sensed data because it incorporates temperature related vegetation stress [43]. Hence, by combining the VCI and the TCI, an improved method for monitoring drought, the vegetation health index (VHI) was developed. The VHI is more representative of the ecological/agricultural drought conditions [5,43,44]. The VCI is advantageous because it is based on remotely sensed data, which improve spatial resolution for drought detection. Remotely sensed data are almost always available in most areas where in situ data are not available and/or accessible [5,43]. The VCI is simple to compute and spatially versatile due to its use of satellite data. The VCI can provide agricultural drought information in terms of impact on vegetation or crop health, which other indices such as the SPI and SPEI cannot achieve. However, it must be applied with caution by taking into consideration the anthropogenetic activities that affect the vegetation and land cover. The summary of the review of the VCI based on the 2016 WMO Handbook of Drought Indicators and Indices is provided in Table 2.
Winkler et al. (2017) used the VCI and the SPI to study the spatiotemporal evolution of droughts that affected the agricultural sector in Africa and their connection to ENSO events during the 16-year period between 2000 and 2016. Using the Tropical Rainfall Measuring Mission (TRMM)-based SPI together with the Moderate Resolution Imaging Spectroradiometer (MODIS)-derived VCI, the authors identified and provided an analysis of the spatiotemporal patterns of droughts in the African continent. The study by Winkler et al. (2017) proved the applicability of the VCI and the SPI for a comprehensive and integrated continental-scale monitoring of agricultural droughts and provided a better understanding of spatiotemporal patterns of droughts affecting agriculture in Africa [45].
Kganyago et al. (2021) demonstrated that the VCI has a potential for application in the WC province of SA by testing and comparing its performance with that of the SPI. The authors found that the SPI-12 and VCI correlation results were consistent in identifying drought. The results from the study by Kganyago et al. (2021) and the consideration that the SPI and VCI represent various hydrological, environmental, and agroecological parameters make the two indices good candidates for integrated drought monitoring in SA [44].
Table 2.
Review of the VCI; based on the 2016 WMO Handbook of Drought Indicators and Indices [31] (pp. 5–6).
Table 2.
Review of the VCI; based on the 2016 WMO Handbook of Drought Indicators and Indices [31] (pp. 5–6).
| Reviewed Drought Indices | Review Criteria [31] (pp. 5–6) | ||||
| (I) Capability of the indices to characterise meteorological, agricultural, and hydrological droughts according to their duration, magnitude, intensity, severity, spatial extent, and frequency | (II) Sensitivity of the indices to SA geological, hydrological, and climatic (geo-hydroclimatic) conditions | (III) Performance, strengths, and weaknesses of the indices when using readily available and accessible data in SA | (IV) Computational and interpretation simplicity of the indices | (V) Versatility of the indices for integrated drought monitoring | |
| Vegetation Condition Index (VCI) |
|
|
|
|
|
Cole and Dudumashe (2021) used the VCI, the TCI, and the VHI to study changes in vegetation health in the North West (NW) province of SA between 2010 and 2020. The authors calculated the VCI and TCI using data from the MODIS sensor and succeeded in establishing spatiotemporal vegetation health trends between 2010 and 2020 and across the NW province, wherein some regions showed a gradual decrease in drought conditions. The authors further highlighted that the good vegetation health observed in some regions during drought episodes may be attributed to the underlying geology, which plays an important role in moisture retention. The authors also highlighted in their study that mining activities, not just climate change, may also influence changes in vegetation health. Cole and Dudumashe (2021) have thus demonstrated the important role that the VCI can play in helping to understand the relationship between agricultural drought and climate change and anthropogenic activities [46]. Mukwada et al. (2021) used the NDVI and the VCI to study the effect of the recuring drought between 1980 and 2016 on the agricultural environment. The authors reported that the VCI was able to identify major droughts that negatively affected agricultural production, and, when compared with SPI results in the same area and during the same period, there were some strong correlations in the grassland and subsistence farming areas. The authors’ findings highlighted the ability of the VCI, in combination with the SPI, to identify vulnerable agricultural sectors and assist in policy making for improved disaster management planning and response strategies in South Africa [47].
The literature review from this study shows that the VCI may be applicable for integrated drought monitoring in SA. The VCI has the potential to play a significant role in guiding policy on land recovery and mitigation opportunities, as well as prioritisation of drought-stricken areas that seek immediate intervention [48]. The VCI is therefore expected to provide important opportunities for improved assessment of droughts with high spatial and temporal resolutions in SA. The VCI is capable of characterising agricultural drought, is simple to calculate and compute, uses readily available satellite-based data, and is applicable in SA’s geo-hydro-climatic conditions. Hence, according to the study review criteria, the VCI is suitable for integrated drought monitoring in SA. Since the VCI cannot be applied for hydrological drought monitoring, it must be used in combination with other indices such as the SPI to enable comprehensive and integrated drought monitoring in SA.
The standardised precipitation index (SPI) was presented by Mackee et al. (1993). It is based only on precipitation, making it a relatively simple method to calculate and compute when compared with the PDSI and the SWSI. The computation of the SPI requires few steps. The precipitation time series is averaged over the time scale of interest (e.g., 3, 6, and 12 months). An appropriate probability distribution function (PDF) is fitted to the time series over the time scale of interest. After the parameters of the PDF are determined from the historic records, the corresponding cumulative distribution function is then used to calculate the cumulative probability of any observed value of the variable. Finally, the inverse normal cumulative distribution function with a mean of zero and variance of one is applied to convert the cumulative probability function of the observed value of the variable to the SPI, where the zero value corresponds to the median precipitation [49,50,51]. The cumulative probability function is given in Equation (8) [7,14]:
where
τ(α) is the gamma function given by Equation (9) [7,14]:
where g(x) is the gamma distribution given by Equation (10) [7,14]:
where α > 0 represents the shape of the parameter, β > 0 is a scalar parameter, and x > 0 represents the amount of rainfall.
Drought characterisation using the SPI is also simple: The severity of a drought is determined by the departure of a negative SPI value from zero. For instance, an SPI ≤ −2 indicates extreme drought, −2 < SPI ≤ −1.5 severe drought, −1.5 < SPI ≤ −1.0 moderate drought, −1.0 < SPI ≤ 0 minor drought, and an SPI greater than 0 indicates no drought [49,50,51]. The SPI allows for a selection of multiple time scales or accumulation periods (e.g., 1, 3, 6, 12, 24 months), making it more flexible and robust than the PDSI and the SWSI. It can be used to monitor meteorological, agricultural, and hydrological droughts in terms of their start, duration, end, intensity, and frequency, spatially and temporally [3,13,33,49]. The SPI has been used extensively to identify periods of meteorological, agricultural, and hydrological droughts without the use of the water balance component. It can be used to identify drought onset more effectively because its short time scale responds quickly to meteorological drought conditions [13]. The SPI has been well tested to an extent that a consensus has been reached that the gamma and Pearson type III (PTIII) are the PDFs that best fit the precipitation time series over a wide range of climate regions [49,50,52]. The SPI was endorsed by world leading institutions and research institutions as the recommended method for the characterization of meteorological droughts [20,21]. The summary of the review of the SPI based on the 2016 WMO Handbook of Drought Indicators and Indices is provided in Table 3.
Rouault and Richard (2003) used the SPI to correctly identify the 1983 and the 1992 droughts as the most severe droughts that have ever happened in SA, since 1921. Using the SPI, the authors further discovered that: since the late 1960s, drought are more often associated with El Niño events; droughts are occurring with increasing frequency; and wet years are enhanced since the 1970s. The authors successfully applied the gamma PDF-based SPI in SA, which has a complex rainfall regime, and demonstrated its potential for real-time monitoring of drought [28].
Botai et al. (2016) used the gamma PDF-based SPI and the SPEI to investigate the historical evolution of drought in the Free State (FS) and North West (NW) provinces in SA, during the 1985 to 2015 (30 years) period. The authors identified and characterised the various droughts that occurred between 1985 and 2015 and quantified them according to their intensity, duration, frequency, and severity in FS and NW provinces. The authors reported that both the SPI and the SPEI produced similar results for mild drought occurrences when using the same rainfall accumulation periods. The authors emphasised that using the SPI and SPEI to characterise and understand the historical evolution of droughts helps to determine the potential risk of droughts occurring in the future [14].
Botai et al. (2017) identified and assessed drought characteristics in the Western Cape (WC) province using the gamma PDF-based SPI-3, SPI-6, and the SPI-12 during the period between 1985 and 2016. The authors found that, although the 2015/16 WC drought events were relatively more severe, they were a regular part of nature’s hydrological cycle. Hence, the authors have shown that analysis of historical drought characteristics using the SPI is an important first step towards understanding droughts and improving preparedness, mitigation, and response [7].
Tfwala et al. (2018) used the gamma PDF-based SPI to study occurrences and severity of droughts between 1918 and 2014 at the Ghaap Plateau, located in the Northern Cape (NC) province of SA. The authors recommended the SPI because of its accuracy, simplicity, and versatility, making it possible to detect the occurrence of both dry and wet spells at different time scales. The SPI, as used by Tfwala et al. (2018), revealed that predominantly moderate droughts have become more prevalent in the plateau after 1990. The SPI approach is thus important in drought monitoring because it can generate information that can be used in drought forecasting models for early warning, to improve preparedness, mitigation, and response strategies. The authors emphasised the need to incorporate other climatic parameters such as temperature to calculate drought indices, to fully accommodate all aspects of climatic variability when monitoring and forecasting droughts [53].
Nkamisa et al. (2022) demonstrated the performance of the SPI at the local municipal boundary, which is finer than the provincial boundaries in SA. The authors used the SPI and the Meteorological Drought Monitor (MDM) software to identify and profile hydrological drought occurrences in the OR Tambo District Municipality (ORTDM) from 1998 to 2018. Using the SPI, the authors could identify the most vulnerable drought areas in the ORTDM, areas of high drought intensity, and most severely affected areas in the district. This information is crucial for preparedness, adaptation, and mitigating the impacts of future droughts at the local municipality scale. The authors concurred with Tfwala et al. (2018) and Botai et al. (2016), amongst others, that the SPI has a potential to be a useful tool when forecasting and estimating the frequency, duration, and intensity of droughts [54].
More studies have been carried out using the SPI to study the socioeconomic impact of drought. For instance, Mathivha et al. (2017) used the SPI to analyse the correlation between drought and the number of tourist arrivals to Kruger National Park (KNP) in SA. The authors found that 19.36% of the drought years corresponded to a negative change in tourist arrivals, leading to the conclusion that drought is one of the natural disasters apart from flood that negatively impact the tourism industry [55]. Smith and Fitchett (2020) used the SPI to assess the impacts of drought periods on tourism within the Sabi Sands Game Reserve (SSGR) in SA and emphasised the need for an improved understanding of the relationship between weather, climate, and tourism. The study by Smith and Fitchett (2020) has shown that the SPI is one the candidate methods that has a potential to provide essential drought information to improve tourism management in SA [56].
Table 3.
Review of the SPI; based on the 2016 WMO Handbook of Drought Indicators and Indices [31] (pp. 5–6).
Table 3.
Review of the SPI; based on the 2016 WMO Handbook of Drought Indicators and Indices [31] (pp. 5–6).
| Reviewed Drought Indices | Review Criteria [31] (pp. 5–6) | ||||
| (I) Capability of the indices to characterise meteorological, agricultural, and hydrological droughts according to their duration, magnitude, intensity, severity, spatial extent, and frequency | (II) Sensitivity of the indices to SA geological, hydrological, and climatic (geo-hydroclimatic) conditions | (III) Performance, strengths, and weaknesses of the indices when using readily available and accessible data in SA | (IV) Computational and interpretation simplicity of the indices | (V) Versatility of the indices for integrated drought monitoring | |
| Standardised Precipitation Index (SPI) |
|
|
|
| The SPI was endorsed by world leading institutions and research institutions as the recommended method for the characterization of meteorological droughts [20,21]. The SPI uses only precipitation, thus unable to account for the direct impacts of drought on surface and groundwater resources; however, this study has concluded that it is versatile enough to be used in combination with other indices such as the VCI, SPEI, SSI, SGI, etc., for integrated drought monitoring in South Africa. |
Based on the study review criterion, the SPI should be highly recommended for integrated drought monitoring in SA, not only because it has been tested all over the world and extensively in SA, but mainly because it is simple to compute, robust, and spatially versatile, requiring only rainfall data, and because it has the capability to characterise meteorological, agricultural, and hydrological droughts according to their duration, magnitude, intensity, severity, spatial extent, and frequency. Furthermore, rainfall data can be derived from satellite information, which is an advantage when applying the SPI in regions where in situ data are scarce.
For instance, Pitman (2011) assessed the state of water resources observational networks (rainfall, surface and groundwater, water quality) in SA and found that there existed a decline in hydrological monitoring networks country-wide [57]. The decline continues to deteriorate today due to inadequate maintenance of monitoring stations as well as vandalism. In addition to precipitation data scarcity, different meteorological stations often have different record lengths and variable data quality, which result in inconsistent regional drought analysis when using in situ rainfall data alone. Hence, to fully capture the spatiotemporal variability of drought using the SPI in the study area, remote sensing-based rainfall data are recommended [58]. However, as highlighted by Tfwala et al. (2018), there is a need to incorporate other climatic parameters such as temperature to calculate drought indices to fully accommodate all aspects of climate variability when monitoring and forecasting droughts. Since it uses only precipitation in its computation, the SPI is not capable of quantifying hydrological drought in terms of its impact (supply vs. demand) on surface and groundwater availability. Hence, the SPI should be used in combination with other indices such as the SPEI to enable comprehensive and integrated drought monitoring in SA.
Vicente-Serrano et al. (2010) presented the standardised precipitation evapotranspiration index (SPEI), a modified version of the SPI [59]. The computation and drought characterisation using the SPEI is the same as that of the SPI (Equation (10)) and thus possess all the advantages of the SPI. It is different from the SPI only in that, in addition to precipitation, it uses evapotranspiration in its computation [3,59]. Thus, the SPEI uses a simple climatic water balance calculation that is based on the Thornthwaite (1948), Hargreaves and Samani (1985), or Penman–Monteith (1965) models for evaluating potential evapotranspiration (PET) [13]. The climatic water balance expression is given in Equation (11):
where
D is the water surplus or deficit for i month (mm), and PET is the potential evapotranspiration for the i month (mm).
The Penman–Monteith method often requires extensive data which are usually not readily available [23]. The SPEI has the potential to track agricultural drought more efficiently [13]. Empirical studies have shown that evapotranspiration (PET) plays a major role in determining drought severity. Since the SPEI accounts for temperature variability, it can be used to monitor the effect of past, present, and future climate variabilities on drought severity, thus providing long term early warning drought information [3,17,59]. This study has found that the SPEI has been well tested to an extent that the log-logistic has been recommended as the preferred PDF that best fits the water balance time series over a wide range of climate regions [50,59].
Theron et al. (2021) used the Hargreaves and log-logistic-based SPEI to study the 2015–2018 agricultural and hydrological drought events and their impact on wheat production in the winter rainfall region of the WC province in SA. The authors generated a historical SPEI-based drought record from 1988 to 2018 for the wheat growing areas in the WC province and found that the 2015–2018 drought appeared to be the most severe in the 30-year study period, using a maximum of five rainfall gauging stations. The 2015–2018 drought thus had a negative impact on wheat production. A steep decrease in wheat production was observed in 2015 and 2017, and recoveries were observed in 2016 and 2018. The authors further reported increases in temperature trends at most stations, and, if these are because of climate change, then similar or worse drought conditions may be anticipated soon. The SPEI is thus a useful tool for drought early warning because of its use of the temperature parameter [60]. The summary of the review of the SPEI based on the 2016 WMO Handbook of Drought Indicators and Indices is provided in Table 4.
Table 4.
Review of the SPEI based on the 2016 WMO Handbook of Drought Indicators and Indices [31] (pp. 5–6).
Table 4.
Review of the SPEI based on the 2016 WMO Handbook of Drought Indicators and Indices [31] (pp. 5–6).
| Reviewed Drought Indices | Review Criteria [31] (pp. 5–6) | ||||
| (I) Capability of the indices to characterise meteorological, agricultural, and hydrological droughts according to their duration, magnitude, intensity, severity, spatial extent, and frequency | (II) Sensitivity of the indices to SA geological, hydrological, and climatic (geo-hydroclimatic) conditions | (III) Performance, strengths, and weaknesses of the indices when using readily available and accessible data in SA | (IV) Computational and interpretation simplicity of the indices | (V) Versatility of the indices for integrated drought monitoring | |
| Standardised Precipitation Evapotranspiration Index (SPEI) |
|
|
|
| The SPEI uses precipitation and temperature, thus unable to account for the direct impacts of drought on surface and groundwater resources; however, this study has concluded that it is versatile enough to be used in combination with other indices such as the SPI, VCI, SPEI, SSI, SGI, etc., for integrated drought monitoring in South Africa. |
Edossa et al. (2014) used the Thornthwaite-based SPEI to characterise meteorological droughts in the central regions of SA and subsequently used the outcomes to examine the relationship between drought and El Niño events. Using the SPEI, the authors identified the number of major drought events, their frequency, their severity, as well as lag times between them, and El Niño events during the 1952–1999 period. The authors further used the SPEI to determine lag times between hydrological and meteorological drought events in the central regions of SA. This information is vital for forecasting drought events and the development of drought early warning systems to mitigate impacts and improve planning and management of water resources in SA [37].
Naik and Abiodun (2019) used the Hargreaves-based SPEI to quantify drought in terms of frequency and intensity and examine the role of potential evapotranspiration (PET) on future drought characterization in the WC province of SA. The study was carried out for the WC’s four river systems, viz., Berg, Olifants, Breede, and Gouritz river catchments. The authors compared the drought patterns from the Hargreaves and Samani (1985)-based SPEI with that from the SPI and found that changes in the drought intensity and frequency are weaker when using the SPI than the SPEI. This suggest that SPI projections may underestimate the influence of global warming on drought because they do not account for the influence of PET. Naik and Abiodun (2019) thus highlighted the role of PET as a key variable in characterizing drought in the WC. The authors further highlighted the need for future studies to be carried out using alternative drought indices for comparison with the SPI and SPEI or translate the SPI and SPEI drought projections to hydrological drought impacts in selected river catchments [23]. These studies by Edossa et al. (2014) and Naik and Abiodun (2019) demonstrated that the log-logistic or PTIII-based SPEI plays an important role in integrated drought monitoring because it accounts for the effects of temperature of droughts, which is crucial for climate change related drought projections [23,37].
Thus, based on the study review criteria, the SPEI is recommended for integrated drought monitoring in SA because it is capable of characterising meteorological, agricultural, and hydrological droughts according to their duration, magnitude, intensity, severity, spatial extent, and frequency, using both precipitation and temperature parameters. Like the SPI, the SPEI is relatively simple to compute and interpret, and adopts well to various SA geo-hydroclimatic conditions. However, Naik and Abiodun (2019) highlighted an important fact that, to enable comprehensive and integrated drought monitoring, drought indices that are capable of directly quantifying hydrological drought impacts must be investigated and tested [23]. Hence, the SPEI should be used in combination with other indices such as the SSI to enable comprehensive and integrated drought monitoring in SA that caters for meteorological, agricultural, and hydrological drought impacts.
Standardised streamflow index (SSI): The description of hydrological drought as provided in the introduction section of this paper implies that its impact affects surface water storages and supply such as streamflow and reservoirs [61]. Streamflow appears to be the most frequently used indicator for monitoring surface water-based hydrological drought [62]. This study suggests that since streamflow commonly provides much wider spatial coverage, it should be preferred for hydrological drought monitoring. The quantification of hydrological droughts as independent phenomena has recently received much attention in research because it allows direct quantification of water deficits in rivers [61]. Due to its computational and drought characterisation simplicity, the SPI’s calculation methodology (Equation (10)) has been used to develop river flow indices such as the streamflow drought index (SDI) [63], standardised runoff index (SRI) [64], and the SSI [61]. Pathak et al. (2016) studied hydrological droughts in India using the SDI and SRI for a 36-year (1972–2007) record of streamflow data. The authors observed good correlation between 9-month SRI and 9-month SDI, and the correlation increased for 12-month SRI and 12-month SDI. Hence, longer time scales produced better correlation between the SRI and SDI than shorter time scales [19]. The summary of the review of the SSI based on the 2016 WMO Handbook of Drought Indicators and Indices is provided in Table 5.
Kerman and Gül (2018) carried out a study and provided a comparative analysis of the SDI and the SSI, using selected catchments in Turkey, a 54-year monthly stream flow record from eight stream flow gauging stations, and the gamma PDF. The authors found that, when using the Mann–Kendall rank correlation method, both the SSI and the SDI showed increasing trends for 6- and 12-month time scale, and both indices identified nearly the same periods for severe and extreme drought in the catchment. The authors thus concluded that the similarity of results from the SSI and the SDI converges when using longer time scales [65]. This study suggests that more comparative studies may be essential to improve confidence on the suitable method between the SSI, SDI, and the SRI for hydrological drought monitoring in SA. In the meantime, this paper recommends the SSI as the preferred method because it is the only recommended drought index for streamflow drought monitoring and early warning in the 2016 version of the ‘Handbook of Drought Indicators and Indices’ [31,66]. Furthermore, the SSI has been commonly used and has produced promising results in some SA catchments [67,68].
The SSI is described as a standardised hydrological drought indicator, used to characterise anomalies in observed streamflow and allows comparisons of drought severity across time and space. It inherits the same simple computation and drought characterisation method as the SPI but is different in that it uses streamflow data in its calculation [61,66]. This review study has found that the major challenge associated with standardising streamflow is the high spatial variability caused by varying catchment topography, lithology, vegetation, and anthropogenic activities, leading to a high degree of uncertainty in the choice of the PDFs that best fit the streamflow time series data [61]. For example, the complex and interconnected interactions between vegetation and river flows affect river flow dynamics, and this effect may vary from one catchment to another. This is mainly due the influence of the vegetative drag forces on flow resistance, flow velocity, water levels, etc. Approaches such as leaf area index (LAI) may be employed to provide a better understanding of these vegetation and river flow interactions [69,70].
Nabaltis and Tsakiris (2009) and Shukla and Wood (2008) preferred the two-parameter log-normal PDF when computing the SDI and SRI, respectively, because it was reported to be simple to normalise. Shukla and Wood (2008) did, however, acknowledge the need to test other PDFs to potentially improve the SRI performance [63,64].
Vicente-Serrano et al. (2012) tested six different three-parameter PDFs and two non-parametric PDFs to compute the SSI for a set of rivers across the Iberian Peninsula in Spain. This large Mediterranean basin is characterised by high variability in the magnitude of stream flows and in seasonal regimes. The authors recommended the non-parametric best monthly fit (BMF) and the minimum orthogonal distance (MOD) to improve the performance of the SSI. According to Vicente-Serrano et al. (2012), when using the BMF and MOD methods, the process of selection of a unique distribution for each river flow gauging station is eliminated, and the SSI is expected to perform better than the SDI and the SRI. However, Vicente-Serrano et al. (2012) further concluded that, should the parametric approach be preferred, the generalised extreme value (GEV) or log-logistic PDFs should be preferred because they showed better performance than the log-normal, Pearson type III, log-logistic, general extreme value, generalised Pareto, and Weibull [61].
Tijdeman et al. (2020) tested the sensitivity of the SSI by comparing 40 years of monthly streamflow time series data computed with seven different PDFs (normal, log-normal, gamma, Pearson type III, GEV, generalised logistic (Genlog), and Tweedie) and with different nonparametric methods (the transformation of plotting positions (PP) to the standard normal distribution and the kernel density estimation (KDE)) for 369 rivers across Europe, including Southwest Germany. The authors affirmed that not all parametric PDFs are equally suited to derive the SSI, because not all are flexible enough to describe streamflow data. However, their goodness-of-fit tests indicated that the parametric SSI derived with the Tweedie, GEV, or Genlog PDFs are best fitting and suitable candidates, which agreed with the findings by Vicente-Serrano et al. (2012). Hence, the authors found that the gamma PDF, which is recommended for SPI calculation, is not appropriate for SSI calculation due to its non-negligible overestimation or underestimation of SSI values. Tijdeman et al. (2020) found that the non-parametric SSI derived from empirical PP produced large uncertainty bounds and did not resemble the spread and magnitude of minimum SSI values expected from a probabilistic index. From the comparison of the parametric SSI and the non-parametric SSI, the authors also suggested that using the non-parametric PP method and the best fitting distribution approach (non-parametric best monthly fit (BMF)), as suggested in Vicente-Serrano et al. (2012), may not be relevant for their study setting [66].
Svensson et al. (2017) tested the sensitivity of the SSI to twelve different PDFs (kappa, generalised logistic, Pearson type III, GEV, Tweedie, gamma, log-normal, normal, Gumbel, and Weibull) using monthly mean streamflow datasets from 121 near-natural catchments across the United Kingdom (UK). The aim was to systematically test the suitability of the PDFs for describing river flow data. The authors found that when using the Shapiro–Wilk goodness-of-fit test, the gamma PDF performed the worst and hence is not suitable. The generalised logistic and GEV PDFs fitted the transformed stream flow data best. Despite its relative complexity, the Tweedie PDF was the most accurate method over the generalised logistic and the GEV because it has a lower bound at zero, not allowing negative stream flow values [71]. This agrees with the studies performed by Vicente-Serrano et al. (2012) and Tijdeman et al. (2020) in European and UK catchments [61,66,71]. However, according to Svensson et al. (2017), due to recent advances in parameter estimation methods, and implementation of these methods in the ‘R software package’, the Tweedie PDF is now a viable option [71].
Botai et al. (2021) conducted a study to evaluate hydrological drought conditions in the Eastern Cape (EC), Northern Cape (NC), and the WC provinces in SA. The authors used the SSI calculated using a gamma PDF and 35 years (1985–2020) of streamflow records from 39 stations across the EC, NC, and WC provinces to characterise drought conditions in terms of its duration and severity. While the authors acknowledged that there currently is no consensus on a single PDF that is most suitable for calculating the SSI, they however selected the gamma PDF; it was successfully used by Shamshirband et al. (2020) and Salimi et al. (2021) at catchments in Iran and East Azerbaijan, with predominantly semi-arid, wet, and dry climatic conditions. The authors’ results from most of the streamflow gauging stations revealed that the EC, NC, and WC provinces experienced pronounced, yet localised drought conditions. This may be attributed to reduced streamflow influenced by reduced precipitation, coupled with increased temperature, among other factors. The Botai et al. (2021) study results further affirm the need for more research to determine best fitting PDFs to calculate the SSI in SA catchments [67,72,73]. The recent local studies such as Botai et al. (2021) have laid an important foundation for streamflow drought monitoring in SA, demonstrating the potential of the SSI to become a preferred hydrological drought index for use to develop integrated drought monitoring systems.
Table 5.
Review of the SSI; based on the 2016 WMO Handbook of Drought Indicators and Indices [31] (pp. 5–6).
Table 5.
Review of the SSI; based on the 2016 WMO Handbook of Drought Indicators and Indices [31] (pp. 5–6).
| Reviewed Drought Indices | Review Criteria [31] (pp. 5–6) | ||||
| (I) Capability of the indices to characterise meteorological, agricultural, and hydrological droughts according to their duration, magnitude, intensity, severity, spatial extent, and frequency | (II) Sensitivity of the indices to SA geological, hydrological, and climatic (geo-hydroclimatic) conditions | (III) Performance, strengths, and weaknesses of the indices when using readily available and accessible data in SA | (IV) Computational and interpretation simplicity of the indices | (V) Versatility of the indices for integrated drought monitoring | |
| Standardised Streamflow Index (SSI) |
|
|
|
|
|
Thus, based on the study review criteria, the SSI is recommended for integrated drought monitoring in SA because it is capable of characterising hydrological droughts according to their duration, magnitude, intensity, severity, spatial extent, and frequency, using streamflow data. Like the SPI and the SPEI, the SSI is relatively simple to compute and interpret. If appropriate PDFs are selected, it has the potential to adapt well to various SA geo-hydroclimatic conditions. This study has found that there remains uncertainty on the suitable PDFs for calculating the SSI at different catchments with varying properties (geo-hydroclimatic conditions, topography, lithology, vegetation, and anthropogenic activities) in SA [61,66]. Hence, this study proposes that the sensitivity of the SSI must be rigorously tested in SA, leading to recommendations on the best fitting PDFs for calculating the SSI. A good balance on the trade-offs between method simplicity and accuracy must be prioritised.
Standardised groundwater index (SGI) (Table 6): The description of hydrological drought, as provided in the introduction section of this paper, further implies that drought affects groundwater storages and supply from aquifers. The use of groundwater level data and information is crucial for hydrological and integrated drought monitoring. It has thus become essential to develop groundwater-based indices for hydrological drought monitoring [74]. Bloomfield and Marchant (2013) constructed the SGI using the same calculation approach as the SPI (Equation (10)). Thus, just like the SSI, the SGI inherits the computation and drought characterisation simplicity of the SPI. The SGI, as constructed by Bloomfield and Marchant (2013), differed from the SPI in that it uses monthly groundwater level data and non-parametric normal scores transform of groundwater level data for each calendar month. According to the authors, the non-parametric approach was selected because they found that the monthly groundwater level time series used were highly irregular, leading to different best fitting distribution functions at different locations and, ultimately, highly variable and incomparable results. Hence, the authors failed to obtain a unique PDF when using the parametric approach for calculation of the SGI. Ultimately, the authors found that, when using the non-parametric normal scores transform (NST), the resulting SGI distribution always passed the Kolmogorov–Smirnov (K-S) normality test [75].
By comparing the SPI with the SGI, Kumar et al. (2016) demonstrated the inability of the SPI to characterise groundwater-based drought at local and regional scales. Their findings revealed the pitfalls of using the SPI as a groundwater drought indicator at both local and regional scales [74]. Hence, the use of the standardised groundwater indices such as the SGI is recommended for hydrological drought monitoring in SA.
Bloomfield et al. (2018) used the SGI, SPI, and the standardised temperature index (STI) to investigate the effect of anthropogenic warming on groundwater levels in a UK aquifer, between the period 1891 and 2015. The authors followed the Bloomfield and Marchant (2013) approach and used the non-parametric method to calculate the SGI. When the SGI was compared with the STI and SPI, the authors observed an overall increase in groundwater drought frequency, duration, and intensity at the UK catchments that coincided with precipitation droughts and an increase in evapotranspiration (ET). The authors concluded that the increase in groundwater drought frequency, duration, and intensity is due to changes in evapotranspiration (ET) associated with anthropogenic warming. This study by Bloomfield et al. (2018) highlights the applicability of the SGI in combination with the SPI and SPEI in integrated drought monitoring [76].
Guo et al. (2021) used the SGI to quantitatively characterise groundwater drought at four different geographical locations with varying hydroclimatic conditions and land use activities in the USA. The SGI was calculated using monthly groundwater level data from 1981 to 2010 and the log-logistic PDF. Similarly, to the SSI, the authors found it essential to test various PDFs to identify the best fitting and most suitable one for the selected aquifers. The authors used the Anderson–Darling (AD) test to identify the log-normal PDF as the best fitting when compared with gamma, normal, log-normal, GEV, and Weibull PDFs. When comparing the SPI with the SGI, the authors found that the start and end times, as well as severity of drought conditions at different time scales in the same area, varied. They also found that groundwater drought varied significantly in different areas. The authors attributed this to the complexity of geographical locations, agricultural irrigation activities, as well as other natural environment and human activities. However, the higher the computation time scales were, the better the correlation between the SPI and the SGI. Finally, the authors attributed the inconsistencies or lag time differences between the SPI and the SGI at the different locations, to varying conditions such as vadose zone, lithology, soil, and human activities [51].
Sorensen et al. (2021) investigated the relationship between groundwater level trends and the El Niño–Southern Oscillation (ENSO) at the semi-arid Limpopo River basin, Limpopo, between 1965 and 2013. The authors followed the Bloomfield and Marchant (2013) non-parametric approach to calculate the SGI and were able to identify and distinguish between groundwater drought events that resulted from ENSO years and those that resulted from high groundwater abstraction such as municipal wellfields and intensive commercial agriculture [77]. The recent studies by Bloomfield et al. (2018), Guo et al. (2021), and Sorensen et al. (2021) have laid an important foundation for groundwater drought monitoring in SA, demonstrating the potential of the SGI to become a preferred groundwater drought index to develop integrated drought monitoring systems.
Thus, based on the study review criteria, the SGI is recommended for integrated drought monitoring in SA because is capable of characterising groundwater-based hydrological droughts according to their duration, magnitude, intensity, severity, spatial extent, and frequency. Like the SPI, SPEI, and the SSI, the SGI is relatively simple to compute and interpret, and has the potential to adapt well to various SA geo-hydroclimatic conditions. However, further investigations will be required on the suitable method (parametric vs. non-parametric) as well as suitable PDFs for calculating the SGI at different catchments with varying properties (hydroclimatic conditions, topography, lithology, vegetation, and anthropogenic activities), especially in SA. A good balance on the trade-offs between method simplicity and accuracy must be reached. The review of the SGI based on the 2016 WMO Handbook of Drought Indicators and Indices is summarised in Table 6.
Table 6.
Review of the SGI; based on the 2016 WMO Handbook of Drought Indicators and Indices [31] (pp. 5–6).
Table 6.
Review of the SGI; based on the 2016 WMO Handbook of Drought Indicators and Indices [31] (pp. 5–6).
| Reviewed Drought Indices | Review Criteria [31] (pp. 5–6) | ||||
| (I) Capability of the indices to characterise meteorological, agricultural, and hydrological droughts according to their duration, magnitude, intensity, severity, spatial extent, and frequency | (II) Sensitivity of the indices to SA geological, hydrological, and climatic (geo-hydroclimatic) conditions | (III) Performance, strengths, and weaknesses of the indices when using readily available and accessible data in SA | (IV) Computational and interpretation simplicity of the indices | (V) Versatility of the indices for integrated drought monitoring | |
| Standardised Ground water Index (SGI) |
|
|
|
|
|
Multivariate drought indices: During the late 20th century and into the 21st century, drought characterisation from a multivariate perspective was introduced to mitigate the shortfalls that result from drought monitoring using individual drought indices. In this approach, the existing individual indices are combined to form blended or hybrid or multivariate indices. The main advantage of the multivariate approach is that it enables the development of comprehensive, integrated, multi-indicator drought indices that incorporate the quantifiable impacts of meteorological, agricultural, and hydrological droughts [12,16,17]. For example, the United States Drought Monitor (USDM) integrates multiple indices (such as SPI and PDSI), vegetation and hydrologic drought indicators, and expert observations to generate drought monitoring information such as weekly drought maps. The USDM is a useful tool for drought monitoring for both operational and research purposes and can respond to the needs of various water users including water planners and the agriculture industry. The USDM has proved useful in the provision of reference data and information when examining the performance of multivariate drought indices [17]. Hence, this study recommends that investigations be conducted to test the performance and applicability of multivariate drought indices in SA.
Some of the multivariate indices that may be considered for investigation are the aggregate drought index (ADI), which integrates the meteorological, agricultural, and hydrological drought indicators using a linear approach called the principal component analysis (PCA). As described by Hao and Singh (2015), the ADI is a linear combination of drought indices based on precipitation, streamflow, soil moisture, evapotranspiration, reservoir storage, and snow water content. According to Hao and Singh (2015), the ADI is flexible, allowing selective use of preferred combination of indices, depending on the region’s characteristics of interest, which is an appealing feature for integrated drought monitoring in SA. However, using the ADI comes with uncertainties; for instance, the linear combination of drought indices does not adequately represent the actual non-linear relationship between meteorological, agricultural, and hydrological drought characteristics. Furthermore, indicator weighting applied in the ADI introduces further uncertainties because they are usually subjective and relatively difficult to determine [17].
On the other hand, the blended drought index (BDI) uses a non-linear copula function to combine the SPI, SPEI, standardised soil moisture index, and the VCI, which, individually, are standardised single drought indices that use precipitation, evapotranspiration, soil moisture, and vegetation conditions to monitor drought. However, when combined using the BDI, they form a comprehensive, integrated, multi-indicator drought index that incorporates the quantifiable impacts of meteorological, agricultural, and hydrological droughts. An advantage of using the non-linear copula method over non-linear methods is that the mathematical models used are developed to closely preserve the relationship between selected drought indices, enabling the provision of an objective description of the overall conditions [18].
This study therefore recommends that investigations be carried out to test the performance and applicability of both the linear ADI and the non-linear BDI to combine the SPI, SPEI, VCI, SSI, and the SGI for integrated drought monitoring in SA. The investigations should not be aimed at suggesting a superior approach for multivariate drought monitoring in SA, but to establish and present the trade-offs and cost benefit analysis leading guidelines on the selection of the preferred method at various SA catchments.
GRACE (Gravity Recovery and Climate Experiment) groundwater drought index (GGDI): The study has found that the major challenge associated with developing the SGI is groundwater data scarcity. In many instances, this challenge makes it impossible to monitor groundwater-based hydrological droughts at larger temporal and spatial scales [10,62]. Several studies have suggested exploiting total water storage data from the GRACE satellite gravity mission to analyse groundwater droughts. This has led to the development of GRACE-based drought indices [62]. Some of them are the “Zhao Method”, which uses the GRACE derived monthly gridded total water storage changes (TWSC) to define drought severity index (GRACE-DSI) as a standardised anomaly. The “Houborg Method”, which uses percentile approach to surface soil moisture, root zone soil moisture, and groundwater storage. The “Thomas Method” defines a drought by considering the number of consecutive months below a threshold of total water storage change (TWSC) and identifies drought events through the computation of their magnitude, duration, and severity. These GRACE-based drought indices are discussed in detail by Gerdener et al. (2020) [62]. Gerdener et al. (2020) further presented a modified version of the three methods, based on time-accumulated and time-differenced GRACE data and proposed that future work should focus on better defining the onset and end of a drought and developing a signature for a TWSC drought [62]. Thomas et al. (2017) introduced the GRACE groundwater drought index (GGDI) which uses normalised GRACE-derived groundwater storage deviations to quantify groundwater storage deficits during the GRACE record.
According to Thomas et al. (2017), the GGDI is capable of capturing characteristics of groundwater drought that occur because of both complex human activities and natural changes. Hence, as demonstrated by Thomas et al. (2017), the GGDI is capable of characterizing groundwater drought in regions without adequate in situ observations [78].
Van Loon et al. (2017) evaluated two approaches to monitor groundwater drought as alternatives to real-time groundwater observations at aquifers in Germany and the Netherlands. The first approach is based on spatially explicit relationships between meteorological conditions and historic groundwater level observations, while the second approach used the GRACE terrestrial water storage (TWS) and groundwater anomalies derived from GRACE-TWS and (near-)surface storage simulations by the Global Land Data Assimilation System (GLDAS) models. The authors found that the first approach performed better than the satellite-based GRACE-TWS and GRACE-GLDAS groundwater anomalies and attributed it to the coarse resolution of the GRACE-TWS and the inability of the GRACE-GLDAS models to simulate groundwater anomalies realistically. As a result, the authors concluded that GRACE-based groundwater anomalies, as evaluated in their study, were not suitable for use in real-time groundwater drought monitoring in Germany and the Netherlands [79].
To enable groundwater droughts monitoring at finer resolutions, the GRACE information must be downscaled from the original monthly spatial resolution of approximately 150,000 km2 into local study area scale. Thus, assimilation of GRACE data must therefore be carried out to enable vertical disaggregation as well as spatial and temporal downscaling of the data such that groundwater can be monitored at scales finer than that of the original GRACE. This is essential for drought monitoring at local scales and on a weekly basis.
Li et al. (2019) demonstrated the use of an “ensemble Kalman smoother” to assimilate GRACE-derived total water storage (TWS) into a catchment and land surface model (CLSM), which, according to their study, enabled vertical disaggregation as well as spatial and temporal downscaling (to 0.25° resolution and daily intervals in this study) of GRACE TWS data. This has the potential to generate near real-time groundwater GRACE data. They concluded that, in general and across the world, GRACE data assimilation improves the simulation of groundwater storage variations in comparison to in situ measurements [10]. It is therefore recommended that research be conducted to assimilate, compute, and test the GGDI in SA.
5. Conclusions
This review study has shown that extensive research progress has been made on the development of drought indices, especially during the 20th and into the 21st century. Overall, the literature review has shown that most of the drought indices that have been developed and tested throughout the 20th and the 21st century perform well for the purposes for which they have been developed for. Furthermore, it has revealed that no drought index can be universally applicable at all regions across the world, and that none of them has the capacity to individually account for the impacts on meteorological, agricultural, and hydrological drought monitoring in an integrated manner. (Masih et al., 2014; Bachmair et al., 2016). This is an affirmation of the study’s hypothesis. Hence, the study recommends that there must exist processes for the selection of suitable or feasible indices that must either be used directly or be ‘re-calibrated’ or ‘re-configured’ to adapt to different geo-hydroclimatic conditions in SA.
In this study, the performance and applicability of the PDSI, SWSI, VCI, SPI, SPEI, SSI, SGI, GGDI, and multivariate indices were evaluated using a review approach described in Section 3. The aim of this review study was to evaluate the performance and applicability of the PDSI, SWSI, VCI, SPI, SPEI, SGI, GGDI, and multivariate indices and provide guidelines on the selection of suitable and feasible candidates for integrated drought monitoring in SA. Published empirical studies were synthesised to acquire empirical evidence on the performance and applicability of the selected drought indices. The primary focus was on the ability of the indices to characterise meteorological, agricultural, and hydrological droughts according to duration, magnitude, intensity, severity, spatial extent, and frequency; interpretation and computational simplicity, their sensitivity to varying SA geo-hydroclimatic conditions; their performance when using readily available and accessible data in SA; and their versatility for integrated drought monitoring in SA.
This review study has found that, despite their good performance and applicability in the regions for which they were developed and calibrated, the PDSI, ScPDSI, and the SWSI are not feasible candidates in the SA context, because they are relatively computationally complex, data intensive, and not spatio-temporally flexible, hence, not versatile enough for integrated drought monitoring in SA. Credible data such as soil moisture is not readily available and accessible in SA compared to precipitation, streamflow, and groundwater levels. The method development uncertainty in the SWSI due to subjective determination of parameter weights estimations eliminates the SWSI for integrated drought monitoring in SA. On the other hand, the SPI, SPEI, VCI, SSI, and SGI were found to be the most feasible candidates for integrated drought monitoring in SA because they met the study review criteria more than the PDSI and the SWSI. Key to the findings is that the empirical studies have shown that they are capable of characterising meteorological, agricultural, and hydrological droughts according to their duration, magnitude, intensity, severity, spatial extent, and frequency. They are relatively simple to compute and interpret, less data intensive, and spatio-temporally flexible. Their use of simple, similar, and internationally recognised standardisation and drought characterisation methods makes them good candidates for combining them into multivariate indices. Furthermore, the standardisation approach is approved by the WMO as common practice for characterising droughts using the SPI and the SSI.
However, this review study has found that there is not yet consensus or common practice regarding suitable PDFs for calculating the SSI and the SGI. This is due to the high spatial variability of streamflow and groundwater levels, caused by varying catchment geology, topography, lithology, vegetation, and anthropogenic activities, leading to a high degree of uncertainty in the choice of the best fitting PDFs to the streamflow and groundwater time series data. Since the gamma distribution was found to be unsuitable for calculating the SSI, this study thus proposes that investigations be carried out to recommend suitable distribution functions for calculating the SSI and the SGI as common practice in SA. Furthermore, since insufficient empirical studies were found to suggest that a consensus may have been reached on the choice between parametric or non-parametric approaches for calculating the SGI, this paper calls for research on the evaluation of the performance of parametric and non-parametric approaches to improve confidence in the preferred method for computing the SGI in SA. Due to the scarcity of groundwater data, the study recommends that research be carried out to investigate the assimilation of GRACE information to generate GRACE-based groundwater drought indices in SA.
Hence, when combined, and with suitable best fitting distributions used, and informed choice between parametric and/or non-parametric approaches, the combination of the SPI, SPEI, VCI, SSI, and SGI have the potential to produce comprehensive and integrated drought monitoring and early warning information system in SA. Hence, this study calls for an improved approach for monitoring of droughts in SA, which is the integrated approach, using the combination of the SPI, SPEI, VCI, SSI, and the SGI. To achieve this, this review study recommends that investigations be carried out to evaluate the performance and applicability of both the linear ADI and the non-linear BDI to combine the SPI, SPEI, VCI, SSI, and the SGI for integrated drought monitoring in SA. It is anticipated that these findings and recommendations, if implemented, will contribute to the development and improvement of integrated drought monitoring systems as well as drought risk management policies in SA.
Author Contributions
The original draft was prepared by the M.B.M. The original draft was reviewed by the T.K., D.K. All authors were involved in the final editing of the paper. All authors have read and agreed to the published version of the manuscript.
Funding
It is funded by South African National Department of Water and Sanitation (DWS).
Acknowledgments
The South African National Department of Water and Sanitation (DWS) is acknowledged for providing funding to publish this review paper.
Conflicts of Interest
The authors declare no conflict of interest. The funders had no role in the design of the study; in the collection, analyses, or interpretation of data; in the writing of the manuscript; or in the decision to publish the results.
References
- Masih, I.; Maskey, S.; Mussá, F.E.F.; Trambauer, P. A review of droughts on the African continent: A geospatial and long-term perspective. Hydrol. Earth Syst. Sci. 2014, 18, 3635–3649. [Google Scholar] [CrossRef] [Green Version]
- Svoboda, M.D.; Fuchs, B.A.; Poulsen, C.C.; Nothwehr, J.R. The drought risk atlas: Enhancing decision support for drought risk management in the United States. J. Hydrol. 2015, 526, 274–286. [Google Scholar] [CrossRef] [Green Version]
- Svoboda, M.; Fuchs, B.A. Handbook of Drought Indicators and Indices Integrated Drought Management Programme (IDMP), Integrated Drought Management Tools and Guidelines Series 2; World Meteorological Organization (WMO): Geneva, Switzerland; Global Water Partnership (GWP): Stockholm, Sweden, 2016. [Google Scholar]
- Monnik, K. Role of Drought Early Warning Systems in South Africa’s Evolving Drought Policy. 2000. Available online: https://www.researchgate.net/publication/253446727 (accessed on 1 May 2021).
- West, H.; Quinn, N.; Horswell, M. Remote Sensing for Drought Monitoring & Impact Assessment: Progress, Past Challenges and Future Opportunities. Remote Sens. Environ. 2019, 232, 111291. [Google Scholar]
- Van Zyl, K. Lessons on Drought in South Africa. Discussion Paper for Drought Dialogue at Elsenburg. 2016. Available online: https://www.greenagri.org.za/assets/documents-/Drought-dialogue-2016-/Mnr-Kosie-van-Zyl.pdf (accessed on 23 April 2020).
- Botai, C.M.; Botai, J.O.; de Wit, J.P.; Katlego, P.; Ncongwane, K.P.; Abiodun, M.; Adeola, A.M. Drought Characteristics over the Western Cape Province, South Africa. Water 2017, 9, 876. [Google Scholar] [CrossRef] [Green Version]
- Serdeczny, O.; Adams, S.; Baarsch, F.; Coumou, D.; Robinson, A.; Hare, W.; Schaeffer, M.; Perrette, M.; Reinhardt, J. Climate change impacts in Sub-Saharan Africa: From physical changes to their social repercussions. Reg. Environ. Change 2015, 15, 1585–1600. [Google Scholar] [CrossRef]
- Cairns, J.E.; Hellin, J.; Sonder, K.; Araus, J.L.; MacRobert, J.F.; Thierfelder, C.; Prasanna, B.M. Adapting maize production to climate change in sub-Saharan Africa. Food Secur. 2013, 5, 345–360. [Google Scholar] [CrossRef] [Green Version]
- Li, B.; Rodell, M.; Kumar, S.; Beaudoing, H.K.; Getirana, A.; Zaitchik, B.F.; De Goncalves, L.G.; Cossetin, C.; Bhanja, S.; Mukherjee, A.; et al. Global GRACE data assimilation for groundwater and drought monitoring: Advances and challenges. Water Resour. Res. 2019, 55, 7564–7586. [Google Scholar] [CrossRef] [Green Version]
- Zargar, A.; Sadiq, R.; Naser, B.; Khan, F.I. A review of drought indices. Environ. Rev. 2011, 19, 333–349. [Google Scholar] [CrossRef] [Green Version]
- Hao, Z.; Aghakouchak, A. A Nonparametric Multivariate Multi-Index Drought Monitoring Framework. Special Advances in Drought Monitoring Collection. J. Hydrometeorol. 2014, 15, 89–101. [Google Scholar] [CrossRef]
- Yihdego, Y.; Vaheddoost, B.; Al-Weshah, R.A. Drought indices and indicators revisited. Arab. J. Geosci. 2019, 12, 69. [Google Scholar] [CrossRef]
- Botai, C.M.; Botai, J.O.; Dlamini, L.C.; Zwane, N.S.; Phaduli, E. Characteristics of Droughts in South Africa: A Case Study of Free State and North West Provinces. Water 2016, 8, 439. [Google Scholar] [CrossRef]
- Chang, J.; Li, Y.; Wang, Y.; Yuan, M. Copula-based drought risk assessment combined with an integrated index in the Wei River Basin, China. J. Hydrol. 2016, 540, 824–834. [Google Scholar] [CrossRef]
- Hao, Z.; Aghakouchak, A. Multivariate Standardized Drought Index: A parametric multi-index model. Adv. Water Resour. 2013, 57, 12–18. [Google Scholar] [CrossRef] [Green Version]
- Hao, Z.; Singh, V.P. Drought characterization from a multivariate perspective: A review. J. Hydrol. 2015, 527, 668–678. [Google Scholar] [CrossRef]
- Luetkemeier, R.; Stein, L.; Drees, L.; Liehr, S. Blended Drought Index: Integrated Drought Hazard Assessment in the Cuvelai-Basin. Climate 2017, 5, 51. [Google Scholar] [CrossRef] [Green Version]
- Pathak, A.A.; Dodamani, B.M.C. Department Comparison of two hydrological drought indices. Perspect. Sci. 2016, 8, 626–628. [Google Scholar] [CrossRef] [Green Version]
- WMO-No. 1090; Standardized Precipitation Index User Guide. World Meteorological Organization: Geneva, Switzerland, 2012.
- KSA4/1002947/2280; Vulnerability, Adaptation to and Coping with Drought: The Case of Commercial and Subsistence Rain Fed Farming in the Eastern Cape. Deliverable 2: Drought Hazard Assessment. Water Research Commission: Geneva, Switzerland, 2014.
- Otto, F.E.L.; Wolski, P.; Lehner, F.; Tebaldi, C.; van Oldenborgh, G.J.; Hogesteeger, S.; Singh, R.; Holden, R.; Fučkar, N.S.; Odoulami, R.C.; et al. Anthropogenic influence on the drivers of the Western Cape drought 2015–2017. Environ. Res. Lett. 2018, 13, 124010. [Google Scholar] [CrossRef]
- Naik, M.; Abiodun, B.J. Projected changes in drought characteristics over the Western Cape, South Africa. Meteorol. Appl. 2019, 27, e1802. [Google Scholar] [CrossRef] [Green Version]
- Rutherford, C.M.; Mucina, L.; Powrie, L.W. Biomes and Bioregions of South Africa. Strelitzia 2006, 19, 30–51. [Google Scholar]
- Du Preez, C.C.; Van Huyssteen, C.W. Threats to soil and water resources in South Africa. Environ. Res. 2020, 183, 109015. [Google Scholar] [CrossRef]
- Hedden, S.; Cilliers, J. Parched Prospects: The Emerging Water Crisis in South Africa; African Futures Paper 11; Institute for Security Studies (ISS): Pretoria, South Africa, 2014. [Google Scholar]
- SP 128/19; Strategic Water Resource Areas: Vital for South Africa’s Water, Food and Energy Security. Water Research Commission: Pretoria, South Africa, 2019.
- Rouault, M.; Richard, Y. Intensity and spatial extension of drought in South Africa at different time scales. Water SA 2003, 29, 489–500. [Google Scholar] [CrossRef] [Green Version]
- LaVanchy, G.T.; Kerwin, M.W.; Adamson, J.K. Beyond ‘Day Zero’: Insights and lessons from Cape Town (South Africa). Hydrogeol. J. 2019, 27, 1537–1540. [Google Scholar] [CrossRef]
- Snyder, H. Literature review as a research methodology: An overview and guidelines. J. Bus. Res. 2019, 104, 333–339. [Google Scholar] [CrossRef]
- WMO-No. 1173; Handbook of Drought Indicators and Indices. World Meteorological Organization: Geneva, Switzerland, 2016.
- Bachmair, S.; Stahl, K.; Collins, K.; Hannaford, J.; Acreman, M.; Svoboda, M.; Knutson, C.; Smith, K.H.; Wall, N.; Fuchs, B.; et al. Drought indicators revisited: The need for a wider consideration of environment and society. WIREs Water 2016, 3, 516–536. [Google Scholar] [CrossRef] [Green Version]
- Hayes, M.J.; Svoboda, M.D.; Wilhite, D.A.; Vanyarkho, V.O. Monitoring the 1996 Drought Using the Standardized Precipitation Index. Bull. Am. Meteorol. Soc. 1999, 80, 429–438. [Google Scholar] [CrossRef]
- Palmer, W.C. Meteorological Drought; U.S. Department of Commerce Weather Bureau Research Paper 45; US Department of Commerce, Weather Bureau: Washington, DC, USA, 1965; p. 58.
- Ochieng, P.; Nyandenga, I.; Wambua, B. Spatial-Temporal Assessment of Historical and Projected Drought Events over Isiolo County, Kenya Using Self Calibrating Palmer Drought Severity Index; Research Square: Durham, NC, USA, 2021. [Google Scholar]
- Gizaw, S.M.; Gan, T.Y. Impact of Climate Change and El Niño Episodes on Droughts in Sub-Saharan Africa; Springer: Berlin/Heidelberg, Germany, 2016. [Google Scholar]
- Edossa, D.C.; Woyessa, Y.E.; Welderufael, W.A. Analysis of Droughts in the Central Region of South Africa and Their Association with SST Anomalies. Int. J. Atmos. Sci. 2014, 2014, 508953. [Google Scholar] [CrossRef] [Green Version]
- Balbo, F.; Wulandari, R.A.; Nugraha, M.R.R.; Dwiandani, A.; Syahputra, M.R.; Suwarman, R. The evaluation of drought indices: Standard Precipitation Index, Standard Precipitation Evapotranspiration Index, and Palmer Drought Severity Index in Cilacap-Central Java. International Conference on Tropical Meteorology and Atmospheric Sciences. IOP Conf. Ser. Earth Environ. Sci. 2019, 303, 012012. [Google Scholar] [CrossRef]
- Shafer, B.A.; Dezman, L.E. Development of a Surface Water Supply Index (SWSI) to assess the severity of drought conditions in snowpack runoff areas. In Proceedings of the Western Snow Conference, Reno, Nevada, 19–23 April 1982; pp. 164–175. [Google Scholar]
- Garen, D.C. Revised Surface-Water Supply Index for Western United States. J. Water Resour. Plan. Manag. 1993, 119, 437–454. [Google Scholar] [CrossRef]
- Wambua, R.M. Hydrological Drought Forecasting Using Modified Surface Water Supply Index (SWSI) and Streamflow Drought Index (SDI) in Conjunction with Artificial Neural Networks (ANNs). Int. J. Serv. Sci. Manag. Eng. Technol. 2019, 10, 39–57. [Google Scholar] [CrossRef]
- Balti, H.; Abbes, A.B.; Mellouli, N.; Farah, I.R.; Sang, Y.; Lamolle, M. A review of drought monitoring with big data: Issues, methods, challenges, and research directions. Ecol. Inform. 2020, 60, 101136. [Google Scholar] [CrossRef]
- Kogan, F. Remote sensing of weather impacts on vegetation in non-homogeneous areas. Int. J. Remote Sens. 1990, 11, 1405–1419. [Google Scholar] [CrossRef]
- Kganyago, M.; Mukhawana, M.B.; Mashalane, M.; Mgabisa, A.; Moloele, S. Recent trends of drought using remotely sensed and in-situ indices: Towards an integrated drought monitoring system for South Africa. In Proceedings of the IGARSS (International Geoscience and Remote Sensing Symposium), Brussels, Belgium, 11–16 July 2021. [Google Scholar] [CrossRef]
- Winkler, K.; Gessner, U.; Hochschild, V. Identifying Droughts Affecting Agriculture in Africa Based on Remote Sensing Time Series between 2000–2016: Rainfall Anomalies and Vegetation Condition in the Context of ENSO. Remote Sens. 2017, 9, 831. [Google Scholar] [CrossRef] [Green Version]
- Cole, J.; Dudumashe, N. An overview of vegetation health in the North West Province, South Africa, between 2010 and 2020. FORECO 2021. IOP Conf. Ser. Earth Environ. Sci. 2021, 932, 012004. [Google Scholar] [CrossRef]
- Mukwada, G.; Mazibuko, S.M.; Moeletsi, M.; Robinson, G.M. A Spatiotemporal Assessment of the Impact of Climate Change on Food Security in The Luvuvhu River Catchment of South Africa. Land 2021, 10, 527. [Google Scholar] [CrossRef]
- Petja, B.M.; Van Zyl, D.; Sibandze, P.C.; Moeletsi, M.E.; Mpandeli, S.N.; Motsepe, M.; Mashego, T. Assessing the use of Coarse Resolution Imagery for Prioritizing Drought Prone/Severely Degraded Areas for Mitigation Policy Options in South Africa. In Proceedings of the IGARSS 2008: International Geoscience and Remote Sensing Symposium, Boston, MA, USA, 6–11 July 2008. [Google Scholar]
- McKee, T.B.; Doesken, N.J.; Kleist, J. The relationship of drought frequency and duration to time scales. In Proceedings of the Preprints, Eighth Conference on Applied Climatology, Anaheim, CA, USA, 17–22 January 1993; American Meteorology Society: Boston, MA, USA, 1993; pp. 179–184. [Google Scholar]
- Guttman, N.B. Accepting the Standardized Precipitation Index: A Calculation Algorithm. J. Am. Water Resour. Assoc. 1999, 35, 311–322. [Google Scholar] [CrossRef]
- Guo, M.; Yue, W.; Wang, T.; Zheng, N.; Wu, L. Assessing the use of standardized groundwater index for quantifying groundwater drought over the conterminous US. J. Hydrol. 2021, 598, 126227. [Google Scholar] [CrossRef]
- Vicente-Serrano, S.M.; Begueria, S. Short Communication Comment on ‘Candidate distributions for climatological drought indices (SPI and SPEI)’ by James H. Stagge et al. Int. J. Climatol. 2016, 36, 2120–2131. [Google Scholar] [CrossRef] [Green Version]
- Tfwala, C.M.; Van Rensburg, L.D.; Schall, R.; Dlamini, P. Drought dynamics and interannual rainfall variability on the Ghaap plateau, South Africa, 1918–2014. Phys. Chem. Earth 2018, 107, 1–7. [Google Scholar] [CrossRef]
- Nkamisa, M.; Ndhleve, S.; Nakin, V.M.; Mngeni, A.; Kabiti, H.M. Analysis of trends, recurrences, severity, and frequency of droughts using standardised precipitation index: Case of OR Tambo District Municipality, Eastern Cape, South Africa. Jàmbá J. Disaster Risk Stud. 2022, 14, a1147. [Google Scholar] [CrossRef]
- Mathivha, F.I.; Tshipala, N.N.; Nkuna, Z. The relationship between drought and tourist arrivals: A case study of Kruger National Park, South Africa. Jàmbá J. Disaster Risk Stud. 2017, 9, a471. [Google Scholar] [CrossRef] [Green Version]
- Smith, T.; Fitchett, J.M. Drought challenges for nature tourism in the Sabi Sands Game Reserve in the eastern region of South Africa. Afr. J. Range Forage Sci. 2020, 37, 107–117. [Google Scholar] [CrossRef]
- Pitman, W.C. Overview of water resource assessment in South Africa: Current state and future challenges. Water SA 2011, 37, 659–664. [Google Scholar] [CrossRef] [Green Version]
- Aghakouchak, A.; Farahmand, A.; Melton, F.S.; Teixeira, J.; Anderson, M.C.; Wardlow, B.D.; Hain, C.R. Remote sensing of drought: Progress, challenges, and opportunities. Remote Sens. Drought Prog. Chall. Oppor. Rev. Geophys. 2015, 53, 452–480. [Google Scholar] [CrossRef] [Green Version]
- Vicente-Serrano, S.M.; Beguería, S.; López-Moreno, J.I. A Multiscalar Drought Index Sensitive to Global Warming: The Standardized Precipitation Evapotranspiration Index. J. Clim. 2010, 23, 1696–1718. [Google Scholar] [CrossRef] [Green Version]
- Theron, S.N.; Archer, E.; Midgley, S.J.E.; Walker, S. Agricultural perspectives on the 2015–2018 Western Cape drought, South Africa: Characteristics and spatial variability in the core wheat growing regions. Agric. For. Meteorol. 2021, 304–305, 108405. [Google Scholar] [CrossRef]
- Vicente-Serrano, S.M.; Beguería, S.; Lorenzo-Lacruz, J.; Camarero, J.J.; López-Moreno, J.I.; Azorin-Molina, C.; Revuelto, J.; Morán-Tejeda, E.; Sanchez-Lorenzo, A. Performance of Drought Indices for Ecological, Agricultural, and Hydrological Applications. Earth Interact. 2012, 16, 1. [Google Scholar] [CrossRef] [Green Version]
- Gerdener, H.; Engels, O.; Kusche, J. A framework for deriving drought indicators from the Gravity Recovery and Climate Experiment (GRACE). Hydrol. Earth Syst. Sci. 2020, 24, 227–248. [Google Scholar] [CrossRef] [Green Version]
- Nabaltis, I.; Tsakiris, G. Assessment of hydrological drought revisited. Water Resour. Manag. 2009, 23, 881–897. [Google Scholar]
- Shukla, S.; Wood, A.W. Use of a standardized runoff index for characterizing hydrologic drought. Geophys. Res. Lett. 2008, 35, L02405. [Google Scholar] [CrossRef] [Green Version]
- Kermen, C.; Gül, G.O. Comparing two streamflow-based Drought Indices. In Proceedings of the 4th International Conference Water Resources and Wetlands, Tulcea, Romania, 5–9 September 2018. [Google Scholar]
- Tijdeman, E.; Stahl, K.; Tallaksen, L.M. Drought characteristics derived based on the Standardized Streamflow Index: A large sample comparison for parametric and nonparametric methods. Water Resour. Res. 2020, 56, e2019WR026315. [Google Scholar] [CrossRef]
- Botai, C.M.; Botai, J.O.; de Wit, J.P.; Ncongwane, K.P.; Murambadoro, M.; Barasa, P.M.; Adeola, A.M. Hydrological Drought Assessment Based on the Standardized Streamflow Index: A Case Study of the Three Cape Provinces of South Africa. Water 2021, 13, 3498. [Google Scholar] [CrossRef]
- Zalokar, L.; Kobold, M.; Šraj, M. Investigation of Spatial and Temporal Variability of Hydrological Drought in Slovenia Using the Standardised Streamflow Index (SSI). Water 2021, 13, 3197. [Google Scholar] [CrossRef]
- Box, W.; Jarvela, J.; Kaisa Vastila, K. Flow resistance of floodplain vegetation mixtures for modelling river flows. J. Hydrol. 2021, 601, 126593. [Google Scholar] [CrossRef]
- Lama, G.F.C.; Errico, A.; Pasquino, V.; Mirzaei, S.; Preti, F.; Chirico, B. Velocity uncertainty quantification based on Riparian vegetation indices in open channels colonized by Phragmites australis. J. Ecohydraulics 2021, 7, 71–76. [Google Scholar] [CrossRef]
- Svensson, C.; Hannaford, J.; Prosdocimi, I. Statistical distributions for monthly aggregations of precipitation and streamflow in drought indicator applications. Water Resour. Res. 2017, 53, 999–1018. [Google Scholar] [CrossRef] [Green Version]
- Shamshirband, S.; Hashemi, S.; Salimi, H.; Samadianfard, S.; Asadi, E.; Shadkani, S.; Kargar, K.; Mosavi, M.; Nabipour, N.; Chau, K.-W. Predicting Standardized Streamflow index for hydrological drought using machine learning models. Eng. Appl. Comput. Fluid Mech. 2020, 14, 339–350. [Google Scholar] [CrossRef]
- Salimi, H.; Asadi, E.; Darbandi, S. Meteorological and hydrological drought monitoring using several drought indices. Appl. Water Sci. 2021, 11, 1–10. [Google Scholar] [CrossRef]
- Kumar, R.; Musuuza, J.L.; Van Loon, A.F.; Teuling, A.J.; Barthel, R.; Ten Broek, J.T.; Mai, J.; Samaniego, L.; Attinger, S. Multiscale evaluation of the Standardized Precipitation Index as a groundwater drought indicator. Hydrol. Earth Syst. Sci. 2016, 20, 1117–1131. [Google Scholar] [CrossRef] [Green Version]
- Bloomfield, J.P.; Marchant, B.P. Analysis of groundwater drought building on the standardised precipitation index approach. Hydrol. Earth Syst. Sci. 2013, 17, 4769–4787. [Google Scholar] [CrossRef] [Green Version]
- Bloomfield, J.P.; Marchant, B.P.; McKenzie, A.A. Increased incidence, duration and intensity of groundwater drought associated with anthropogenic warming. Hydrol. Earth Syst. Sci. Discuss 2018, 1–23. [Google Scholar] [CrossRef]
- Sorensen, J.P.R.; Davies, J.; Ebrahim, G.Y.; Lindle, J.; Marchant, B.P.; Ascott, M.J.; Bloomfield, J.P.; Cuthbert, M.O.; Holland, M.; Jensen, K.H.; et al. The influence of groundwater abstraction on interpreting climate controls and extreme recharge events from well hydrographs in semi-arid South Africa. Hydrogeol. J. 2021, 29, 2773–2787. [Google Scholar] [CrossRef]
- Thomas, B.F.; Famiglietti, J.S.; Landerer, F.W.; Wiese, D.N.; Molotch, N.P.; Argus, D.F. GRACE Groundwater Drought Index: Evaluation of California Central Valley groundwater drought. Remote Sens. Environ. 2017, 198, 384–392. [Google Scholar] [CrossRef]
- Van Loon, A.F.; Kumar, R.; Mishra, V. Testing the use of standardised indices and GRACE satellite data to estimate the European 2015 groundwater drought in near-real time. Hydrol. Earth Syst. Sci. 2017, 21, 1947–1971. [Google Scholar] [CrossRef]
Figure 1.
Map of nine biomes in South Africa: Fynbos, Succulent Karoo, Desert, Nama-Karoo, Grassland, Savanna, Albany Thicket, Indian Ocean Coastal Belt, and Forests [24].
Figure 1.
Map of nine biomes in South Africa: Fynbos, Succulent Karoo, Desert, Nama-Karoo, Grassland, Savanna, Albany Thicket, Indian Ocean Coastal Belt, and Forests [24].

Figure 2.
Mean annual precipitation and mean annual potential evapotranspiration isohyets (mm) in South Africa [25].
Figure 2.
Mean annual precipitation and mean annual potential evapotranspiration isohyets (mm) in South Africa [25].

Figure 3.
8 Rainfall Regimes of South Africa. W = Winter Maximum Rainfall, Y = All Year Rainfall, S = Summer Maximum Rainfall. The numbers 1 to 8 represent the 8 climatic regions of SA [28].
Figure 3.
8 Rainfall Regimes of South Africa. W = Winter Maximum Rainfall, Y = All Year Rainfall, S = Summer Maximum Rainfall. The numbers 1 to 8 represent the 8 climatic regions of SA [28].

Disclaimer/Publisher’s Note: The statements, opinions and data contained in all publications are solely those of the individual author(s) and contributor(s) and not of MDPI and/or the editor(s). MDPI and/or the editor(s) disclaim responsibility for any injury to people or property resulting from any ideas, methods, instructions or products referred to in the content. |
© 2023 by the authors. Licensee MDPI, Basel, Switzerland. This article is an open access article distributed under the terms and conditions of the Creative Commons Attribution (CC BY) license (https://creativecommons.org/licenses/by/4.0/).
Share and Cite
MDPI and ACS Style
Mukhawana, M.B.; Kanyerere, T.; Kahler, D. Review of In-Situ and Remote Sensing-Based Indices and Their Applicability for Integrated Drought Monitoring in South Africa. Water 2023, 15, 240. https://doi.org/10.3390/w15020240
AMA Style
Mukhawana MB, Kanyerere T, Kahler D. Review of In-Situ and Remote Sensing-Based Indices and Their Applicability for Integrated Drought Monitoring in South Africa. Water. 2023; 15(2):240. https://doi.org/10.3390/w15020240
Chicago/Turabian StyleMukhawana, Mxolisi B., Thokozani Kanyerere, and David Kahler. 2023. "Review of In-Situ and Remote Sensing-Based Indices and Their Applicability for Integrated Drought Monitoring in South Africa" Water 15, no. 2: 240. https://doi.org/10.3390/w15020240
Note that from the first issue of 2016, this journal uses article numbers instead of page numbers. See further details here.