Article

Equation Chapter 1 Section 1 Techno-Economic Analysis for the Selection of Cost-Effective Treatment for Algae Removal in Drinking Water Treatment Plants

1
State Key Laboratory of Freshwater Ecology and Biotechnology, Institute of Hydrobiology, Chinese Academy of Sciences, Wuhan 430072, China
2
University of Chinese Academy of Sciences, Beijing 100049, China
3
Beihai Water Supply Co., Ltd., Beihai 536000, China
*
Author to whom correspondence should be addressed.
Water 2023, 15(2), 243; https://doi.org/10.3390/w15020243
Submission received: 1 December 2022 / Revised: 15 December 2022 / Accepted: 1 January 2023 / Published: 5 January 2023

Abstract

:
In this study, the responses of Dissolved Air Flotation (DAF), sedimentation, and sand filtration treatment processes on feed water with varied algal concentrations were investigated, based on a technical–economic analysis using data collected from a drinking water treatment plant (DWTP) in Guangxi, China. Cost-effective drinking water treatment processes for water sources with varied algae concentrations were proposed. The results showed that DAF was able to achieve almost 95% removal efficiency, while sedimentation was only able to reach 90% under different Polyaluminum Chloride (PACl)/dry cell weight concentrations in the DWTP. When algae concentrations increase, switching from sedimentation to DAF reduces treatment costs as DAF is more efficient for algae removal, which extends the backwashing interval of sand filtration. The threshold of sedimentation/DAF switching also depends on the quality requirement of the treated water. The lower the algae concentration in the treated water, the earlier the switch should be made from sedimentation to DAF. For instance, when the effluent thresholds are 1.2 mg·L−1, 0.8 mg·L−1, or 0.4 mg·L−1, DAF should be adopted instead of sedimentation—at feed algae concentrations of 43.9 mg·L−1, 31.5 mg·L−1, and 17.3 mg·L−1, respectively, in the raw water. The results set a baseline for a cost-effective drinking water treatment strategy based on a techno-economic model, which can precisely control the coagulation dosage and backwash interval of sand filtration coupled with sedimentation/DAF switching in algae-laden raw water.

1. Introduction

Increasing algae blooms in surface waters are costing the world economy billions of dollars every year [1]. In recent years, there have been many different intense anthropological activities such as urbanization [2], mining [3], agriculture fertilizer or manure application [4], and aquaculture practices [5]. Eutrophication occurs in aquatic ecosystems when nutrients such as Phosphorus (P) and Nitrogen (N) exceed certain levels, e.g., 0.02–0.3 mg-P·L−1 and 2 mg-N·L−1 [6]. This phenomenon is often accompanied by the aggressive growth of algae blooms, which reduces the safety of drinking water and poses an increasing risk to Drinking Water Treatment Plants (DWTPs) worldwide [7,8,9].
Algae-laden raw water has a degraded taste, odor, oxygen content, and appearance and increased treatment costs [1,10]. Higher doses of chemicals and additional operations and maintenance costs are required to counteract the adverse effects of algae growth. Treatment costs for algae removal are closely related to the processes employed and the operating characteristics of DWTPs. Several studies have investigated the costs of harmful algal bloom removal from drinking water resources [10,11]. For instance, the city of Wichita, Kan., spent USD 8.5 million to install an ozone treatment facility to address the taste and odor problems associated with algae in its DWTPs [12]. From 2002 to 2012, treatment costs in the city of Waco, Tex., were estimated at USD 70.4 million because of abnormal algae proliferation in the city’s drinking water resources [11]. In practice, DWTPs generally adjust their chemical dosages and treatment processes according to the effluent water quality feedback. This increases the operating costs and difficulty of securing the water supply. Therefore, it is necessary to analyze the effects of algae concentrations in raw water on treatment processes and treatment costs required to efficiently operate DWTPs.
Algae blooms apply tremendous pressure on DWTPs and have become a prominent issue affecting DWTP operations and water purification performance [13]. For instance, if DWTPs respond improperly when dealing with high algae concentrations in raw water, algae cells may substantially penetrate through their filters into the water supply pipe network. The cells in the water supply pipe network may rupture and release algogenic substances such as microcystins, nodularins, geosmin (GSM), and 2-methylisoborneol (MIB); this may result in a wide range of symptoms in humans including hepatotoxicity and allergic reactions [14,15]. Furthermore, reactions between disinfectants and algae organic matter (AOM) in water sources may produce disinfection by-products (DBPs)—some of which display high mutagenicity and carcinogenicity in animals [16,17]. Coagulation–sedimentation and DAF, followed by sand filtration, are the most effective ways to remove algae without disrupting their integrity in surface waters [18,19]. Both sedimentation and DAF need coagulation pre-treatments, but their removal efficiency and costs are different—thus influencing the following sand filtration. The advantage of DAF over sedimentation is the higher loading rate, faster separating time, and higher efficiency, while the disadvantage is its higher cost. Therefore, it is essential to improve the effective response capabilities of DWTPs on algae.
Several studies have been made to test the algae removal efficiency of individual processes [20], but there is a lack of quantifiable analyses on the synergy between processes based on varied algae concentrations in DWTPs. Therefore, the operation of the sand filtration process needs to be altered to achieve synergy with the sedimentation/DAF process to achieve an optimal techno-economic strategy. A quantifiable combination of coagulation–sedimentation/DAF–filtration to remove algae efficiently can reduce operation costs and improve the quality of drinking water [21]. The current study analyzed the cost of drinking water treatment processes with different algae concentrations in water sources using the data collected from the Beijiao DWTP located in Beihai, Guangxi Zhuang Autonomous Region, China. The main objectives of this study were: (1) disclosing the effects of algae concentrations on the cost of DWTP through a techno-economic model and (2) determining how to precisely select DAF or sedimentation coupled with sand filtration in DWTPs with varied algae concentrations. The present study outcomes were used to set a baseline for a cost-effective drinking water treatment strategy and to improve the operation management of DWTPs with algae-laden raw water.

2. Data Sources and Methods

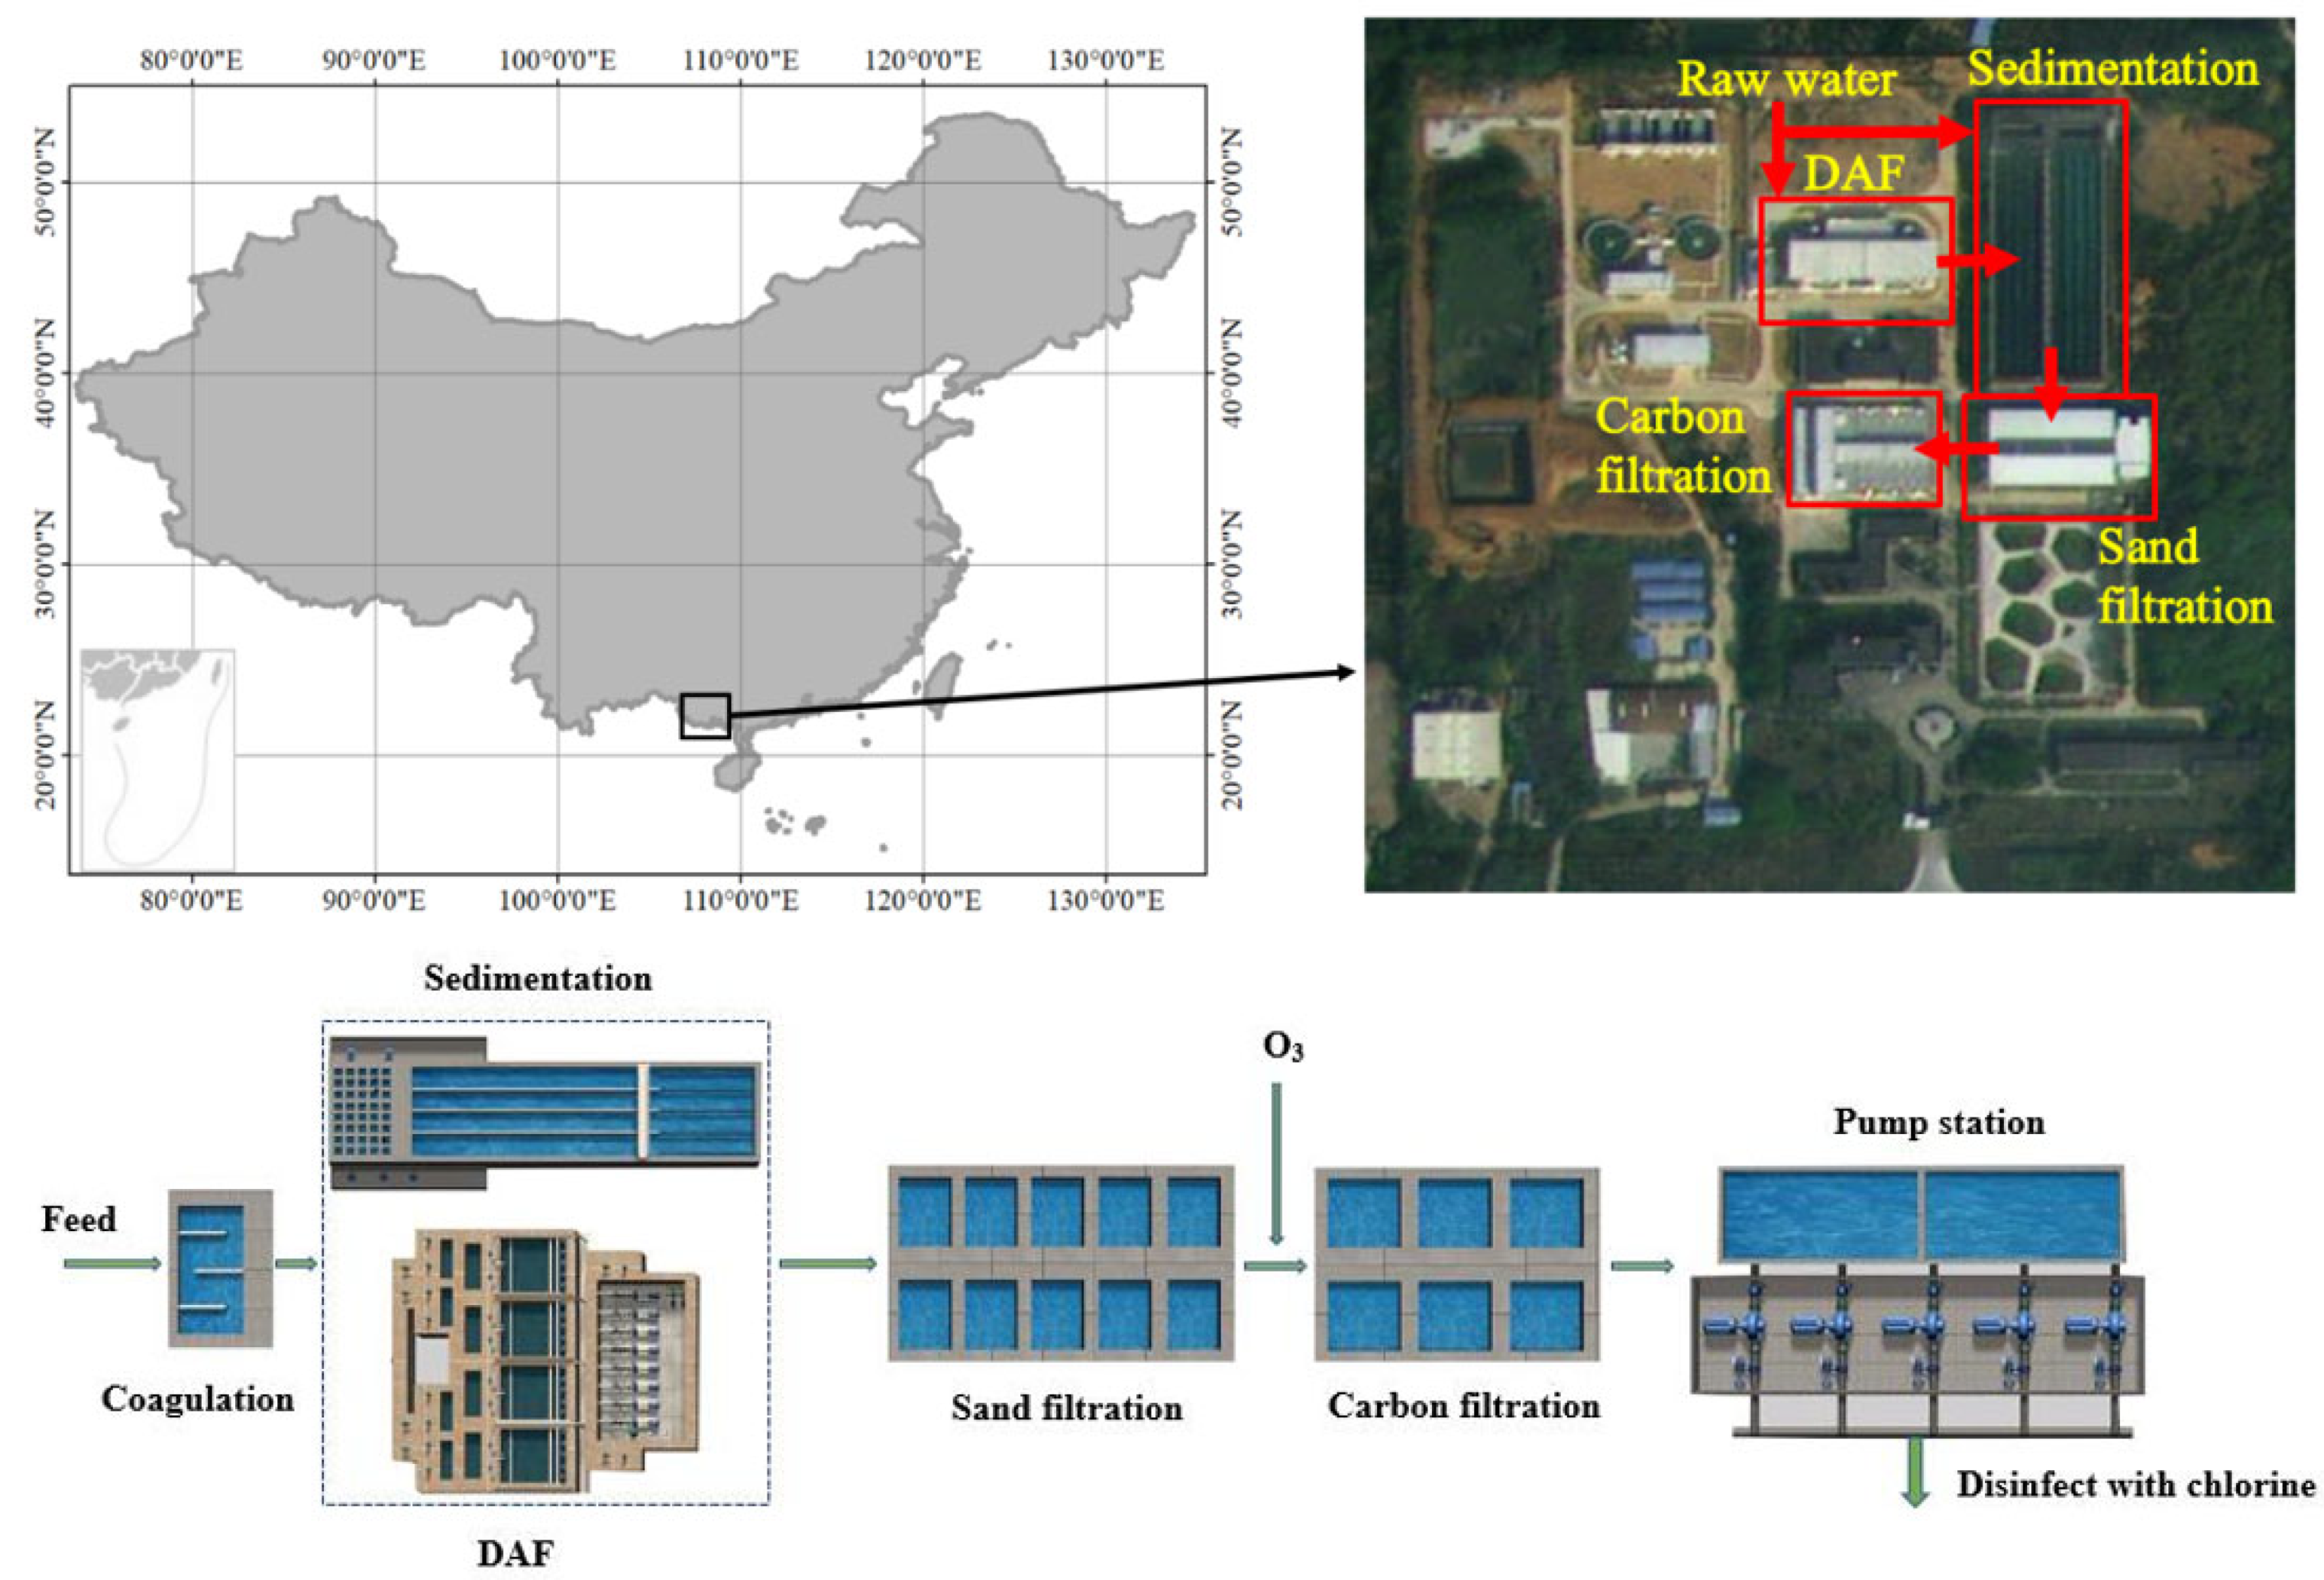
2.1. Treatment Processes in Beijiao DWTP

Beijiao DWTP is located in Beihai, Guangxi Zhuang Autonomous Region, south of China. Water samples were taken from a drinking water reservoir 7.3 km away from the plant. The operating process of the water treatment plant is coagulation (Polyaluminum Chloride, PACl)–sedimentation/DAF–sand filtration–ozone–carbon filtration, and chlorination disinfection. As shown in Figure 1, coagulation–sedimentation/DAF–sand filtration are the main processes used for removing algae. The managers of the DWTP deal with algae blooms based on their past experiences; they adjust the usage of chemicals, sedimentation, or DAF processes based on the effluent algae concentration. The backwash interval of the sand and activated carbon filtration was fixed for this DWTP.

2.2. Operational Costs of the Beijiao DWTP

Operational costs mainly consist of electricity and chemical costs and the renewal costs of activated carbon. This controls the economy of the system and can be changed by adjusting the working conditions. To calculate the economic operational costs over a 5-year period using DAF at the PACl dosage of 14 mg·L−1, the power consumption of the equipment and the unit costs of the electricity and chemicals are listed in Table 1 and Table 2.
Based on a 5-year lifetime, a discount rate of 7%, and a 96,000 m3d−1 treatment capacity, the average annual operation cost (Car) was [22]:
c a r = T C 0 ( P / F , i , T ) ( A / P , i , T )
where Co is the operation cost and T is the system’s lifetime.
The operating cost was:
Co = Ed + Eo + Ec + Ep + Ea + Cp + Co + Cc + Ws + Wc
where Ed, Eo, Ec, Ep, and Ea are the electricity costs of the DAF, Ozonator, chemical dosing, backwash pump, and backwash air blower, respectively. Cp, Co, and Cc are the chemical costs of the PACl, liquid oxygen, and liquid chlorine, respectively. Ws and Wc are the water costs of the sand filtration backwashing and activated carbon filtration backwashing, respectively.
The discount factor (P/F,i,T) was defined as [23]:
( P / F , i , T ) = 1 ( 1 + i ) T
The capital recovery factor (A/P,i,T) was defined as [24]:
( A / P , i , T ) = ( 1 + i ) T i ( 1 + i ) T 1
Therefore, the economic treatment cost per unit ($·m−3) was:
c u = c a f + c a v Q w t
where Qwt is the amount of water treated by the DWTP per year (m3).

2.3. Algae Removal Using DAF or Sedimentation Batch Experiment in the Beijiao DWTP

The DAF and sedimentation processes of the Beijiao DWTP for algae removal were simulated using jar tests with 1000 mL beakers (Phipps Bird, Richmond, VA 23230, USA). PACl powder (30%, 25 ± 0.2 kg) was sourced from the Gongyi Zhenyu Water-Purifying Materials Factory (Henan, China) and dispersed in an aqueous solution to obtain a PACl suspension (10 g·L−1). Water samples were collected from the feedline (28 °C). Experimental conditions were determined according to the actual operating parameters. PACl with different dosages was quickly added into the beakers under rapid stirring (200 rpm, for 2 min). Then, the pH was adjusted to 6.2 ± 0.2 by adding 1 M NaOH, followed by slow stirring (30 rpm, for 10 min). After this, the samples were allowed to settle for 120 min before taking the supernatant. For DAF experiments, air bubbles were introduced into the jars under slow mixing, and the subnatant were taken after 2 min of floatation. Finally, the algae concentrations in the supernatant and subnatant were analyzed.
For algae biomass concentrations, 20 mL of de-ionized (DI) water was passed through the 0.7 μm glass microfiber filters (Whatman, GF/F 1825-055) via a vacuum pump. Then, 500 mL samples were passed through the prepared filters. The filters were placed in porcelain dishes and heated at 105 °C to a constant weight to obtain the mass of water-free particles, m105 (mg). Then, the filters were heated at 550 °C to obtain a constant weight with the aim of volatilizing all the biomass, m550 (mg). Finally, the filters were weighed after cooling to room temperature in a desiccator. The dry cell weight (DCW, mg·L−1) was calculated using Equation (1), as follows:
DCW = m 105 m 550 v
where m105 and m550 are the mass of filter membrane dried at 105 °C and 550 °C for 24 h, respectively, mg; v is the volume of culture filtered, L.
The algae removal efficiency was calculated using Equation (2):
Algae   removal   efficiency = c i c j c i × 100 %
where   c i and c j are the initial and final algae concentrations before and after DAF/sedimentation, respectively, mg·L−1.

2.4. Simulation Removal Efficiency and Backwash Interval of the Sand Filtration Process

Sand filtration relies on interception and adsorption to remove algae cells, whereas the filtration efficiency is a function of time, and is mainly related to the mass of aggregated particles per unit volume of the filter bed. Therefore, the filtration efficiency is:
λ = c 0 c e c 0 × 100 %
where c 0 is the influent algae concentration and mg·L−1; c e is the effluent algae concentration, mg·L−1.
c 0 and c e satisfied the following equation [25]:
c e = c 0 exp [ 3 ( 1 ε ) η α L 2 d ]
where ε is the porosity; L is the depth of the granular media, m; d is the media’s grain diameter, m; η is the migration efficiency; α is the adhesive efficiency; the ε of the DWTP is 0.415 and the particle size of the quartz sand d is 0.6 × 10⁻³ m; and the sand filter depth L and square of the DWTP are 1.2 m and 40 m2 (4 m × 10 m), respectively. The filtration rate v is 12.5 m·h−1. η is 0.91 × 10⁻³ and α is 1 in the sand filter [26].
The sand filtration feed satisfied the following equation:
c 0 , m = c e , t 1 λ m
where c 0 ,   m is the threshold of the sand filtration feed; c e ,   t is the threshold of the sand filtration effluent; and λ m is the maximum filtration efficiency.
The backwash interval of the sand filtration is the time taken to reach the threshold of the sand filtration effluent, which can be calculated as:
t b = t l t s
where tl is the time taken to reach the ultimate head loss, h and t s is the time taken to reach the ultimate head loss at the maximum filtration efficiency, h.
The head loss through granular media under Forchheimer flow conditions can be determined with the following equation [27]:
h l = k v ( 1 ε ) 2 μ L v ε 3 β w g d 2 + k 1 ( 1 ε ) L v 2 ε 3 g d
where h l is the head loss, m; k v is the head loss coefficient due to viscous forces, unitless; k1 is the head loss coefficient due to inertial forces, unitless; β w is the density of water, kg·m−3; μ is the dynamic viscosity of the fluid, kg·(m·s)−1; v is the filtration rate (superficial velocity), m·h−1; g is the acceleration due to gravity, 9.81 m·s−2. The kV and k1 of the sand filter are 112.25 and 2.25, respectively. βw and μ (25 °C, mean water temperature of the feed) are 999 and 1.14 × 10⁻³, respectively. The Beijiao DWTP has a limited head loss of no more than 2.3 m.
The influent of the sand filtration was pretreated by sedimentation or DAF. Therefore, the algae concentration in the influent was low, which would not cause rapid clogging of the filter bed. If the rate of solid media aggregation is stable during the operation cycle of the sand filter, the head loss increase rate is stable:
h l , t = h 0 + k σ t
where h l , t is the filter head loss at time t, m; h0 is the initial head loss, m and k is the increase rate constant of head loss as 0.00191d−0.81 [28], L·m·mg−1.
According to the mass balance of the filter bed, we have:
σ t = ( c 0 c e ) Q t V
where σ t is the specific deposition of algae particles in the filter media at time t, cells·L−1; Qt is the flow through the filter during time t (h), m3 and V is the sand bed volume, m3.
Then, the backwash interval is:
t = ( h l , t h 0 ) L v λ a c 0 k
where λ a is the average efficiency of the sand filter. The algae concentration of the influent and effluent of the sand filter was sampled and determined 2 times a day (9:00 and 15:00) for 10 days in the Beijiao DWTP to determine the average filtration efficiency of the sand filter.

3. Results and Discussion

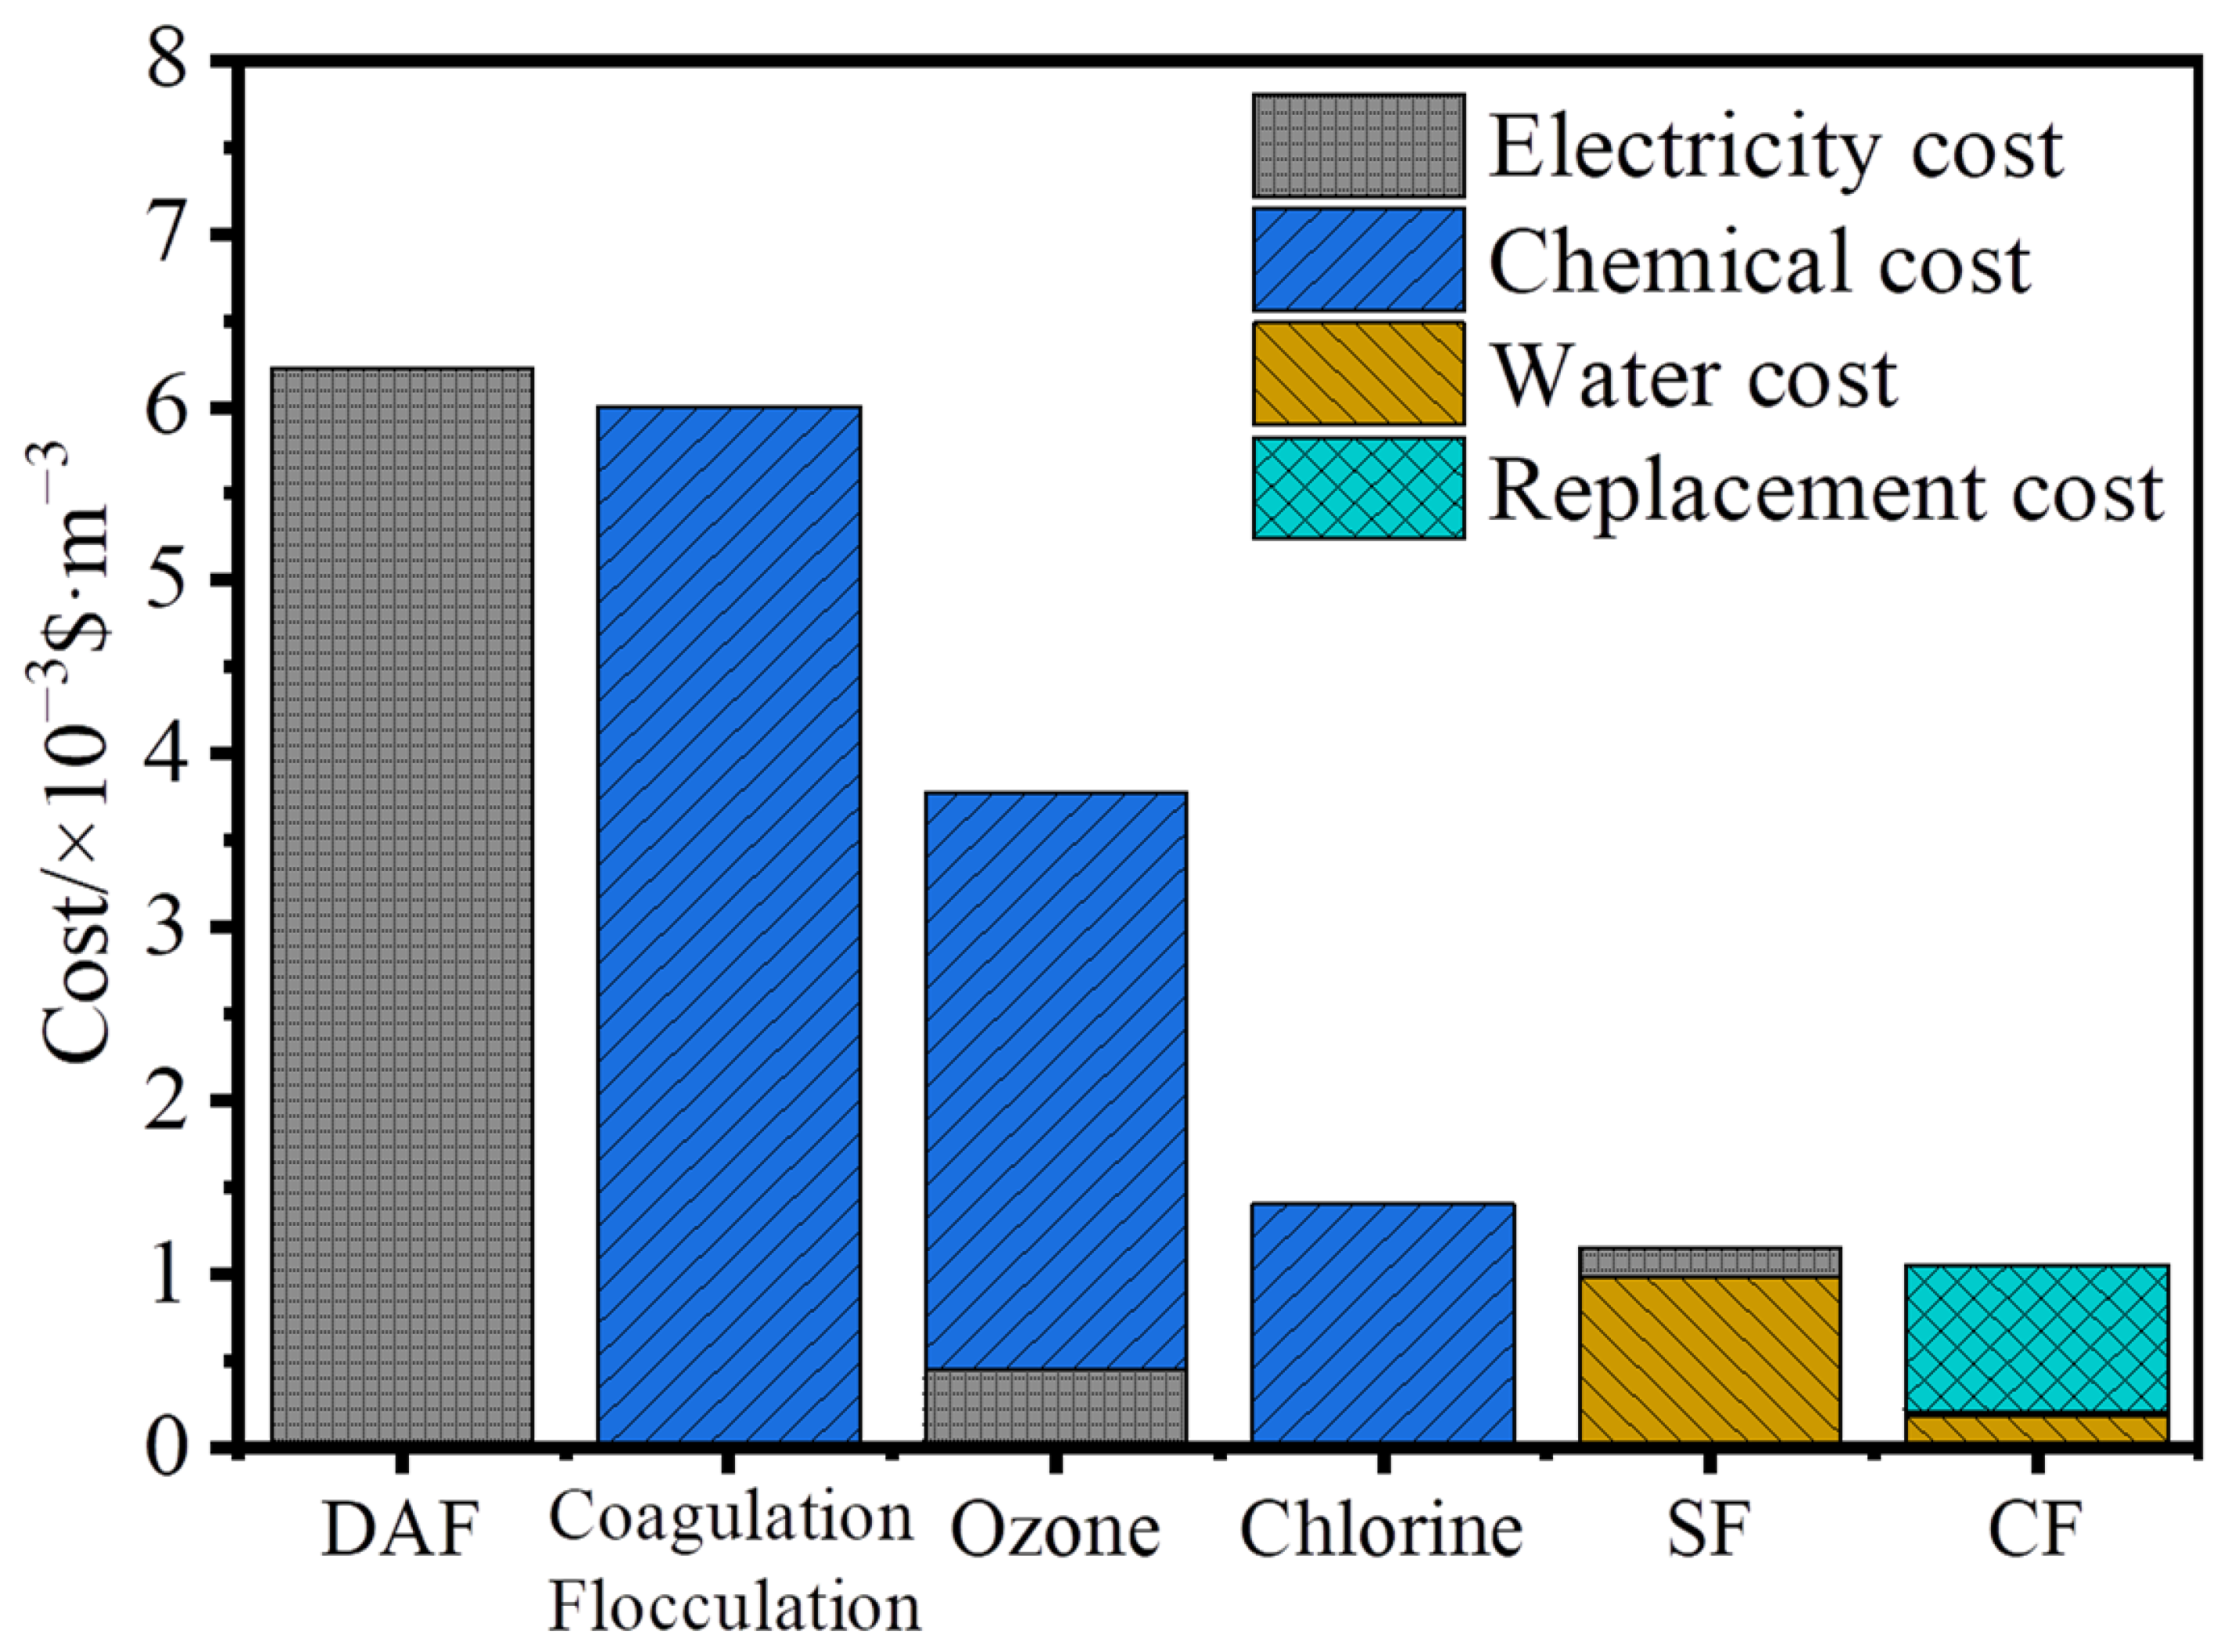
3.1. Economic Costs of the Beijiao DWTP

The parameters for calculating the economic operational costs over a 5-year period are listed in Table 1 and Table 2. The operating costs of the DWTP were USD 250,539.5·year−1 and USD 0.0176·m−3 using DAF at the PACl dosage of 14 mg·L−1. To improve the effluent quality and reduce the pressure of the activated carbon filtration, sand-filter effluent water was strictly set at a concentration of 0.4 mg·L−1 in the Beijiao DWTP. For the Beijiao DWTP—shown in Figure 2—the electricity cost of the DAF was USD 0.00622·m−3, accounting for the highest percentage of 31.74%. The cost of coagulation was USD 0.006$·m−3, accounting for 30.62%. The annual operating cost of the sand filtration was 5.86% of the total operating costs, reaching USD 46,030.88·year−1. Although the annual costs of the ozone and liquid chlorine in the operating process was high, their dosage was stable during the DWTP’s actual operation. Reducing the use of ozone and liquid chlorine can lead to an increase in harmful substances and threaten the safety of the drinking water supply [29,30]. The cost of activated carbon filtration only accounts for 5.37% of costs and mainly provides solutions to remove organic matter [31]; it increases with high algae concentrations from the sand filter effluent because of the high backwashing frequency and replacement costs. Therefore, cost optimization is mainly focused on the processes of coagulation, DAF, and sand filtration.

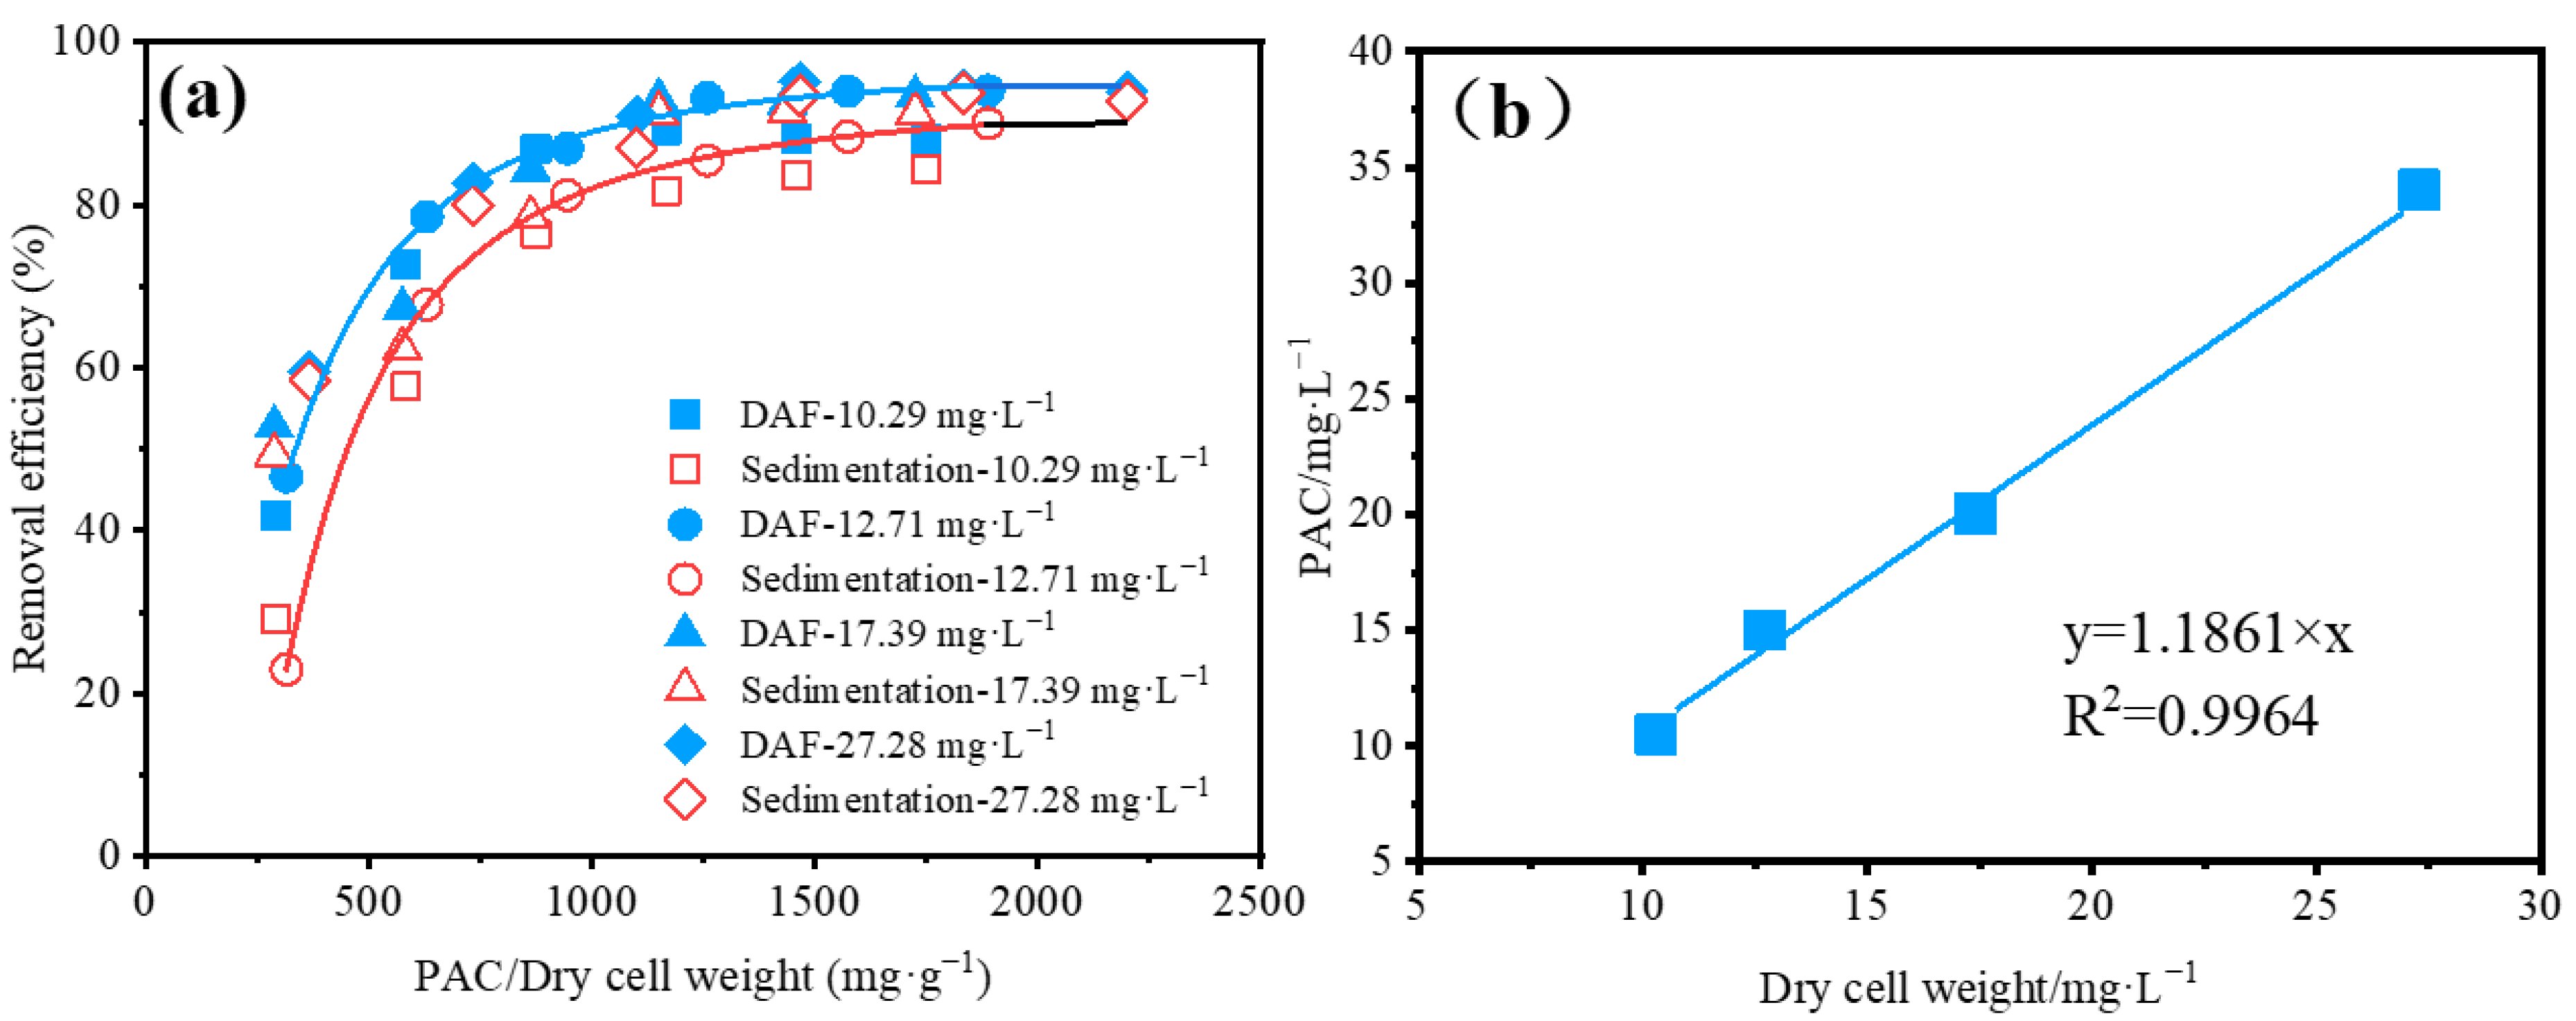
3.2. Evaluation of the Performance of Algae Removal Using DAF or Sedimentation

DAF and sedimentation have different treatment capabilities for the removal of algae cells. The performances of DAF and sedimentation to remove algae cells are shown in Figure 3a. DAF can achieve almost 95% removal efficiency, while sedimentation can only reach 90% under different PACl/dry cell weight concentrations. This is consistent with the literature [32,33]. Sedimentation depends on the aggregated algae particles sinking to the bottom to be removed. Therefore, it is difficult to separate light particles. However, DAF is achieved by introducing air bubbles. As the bubbles move upward, the formed floc-bubbles have a density lower than that of water; thus, they rise to the surface, making their removal easier [34]. Figure 3a indicates that when the PACl/dry cell weight reached 1200 mg·g−1, the efficiencies of the air floatation and sedimentation were at their highest. According to the four different algae concentration feeds, a correlation between PACl dosage and algae concentration under optimal operating conditions was obtained, which is shown in Figure 3b. Clearly, DAF can achieve higher treatment efficiency with less land use but has higher energy consumption. Therefore, the precise selection of DAF or sedimentation depends on subsequent processes such as sand filtration.

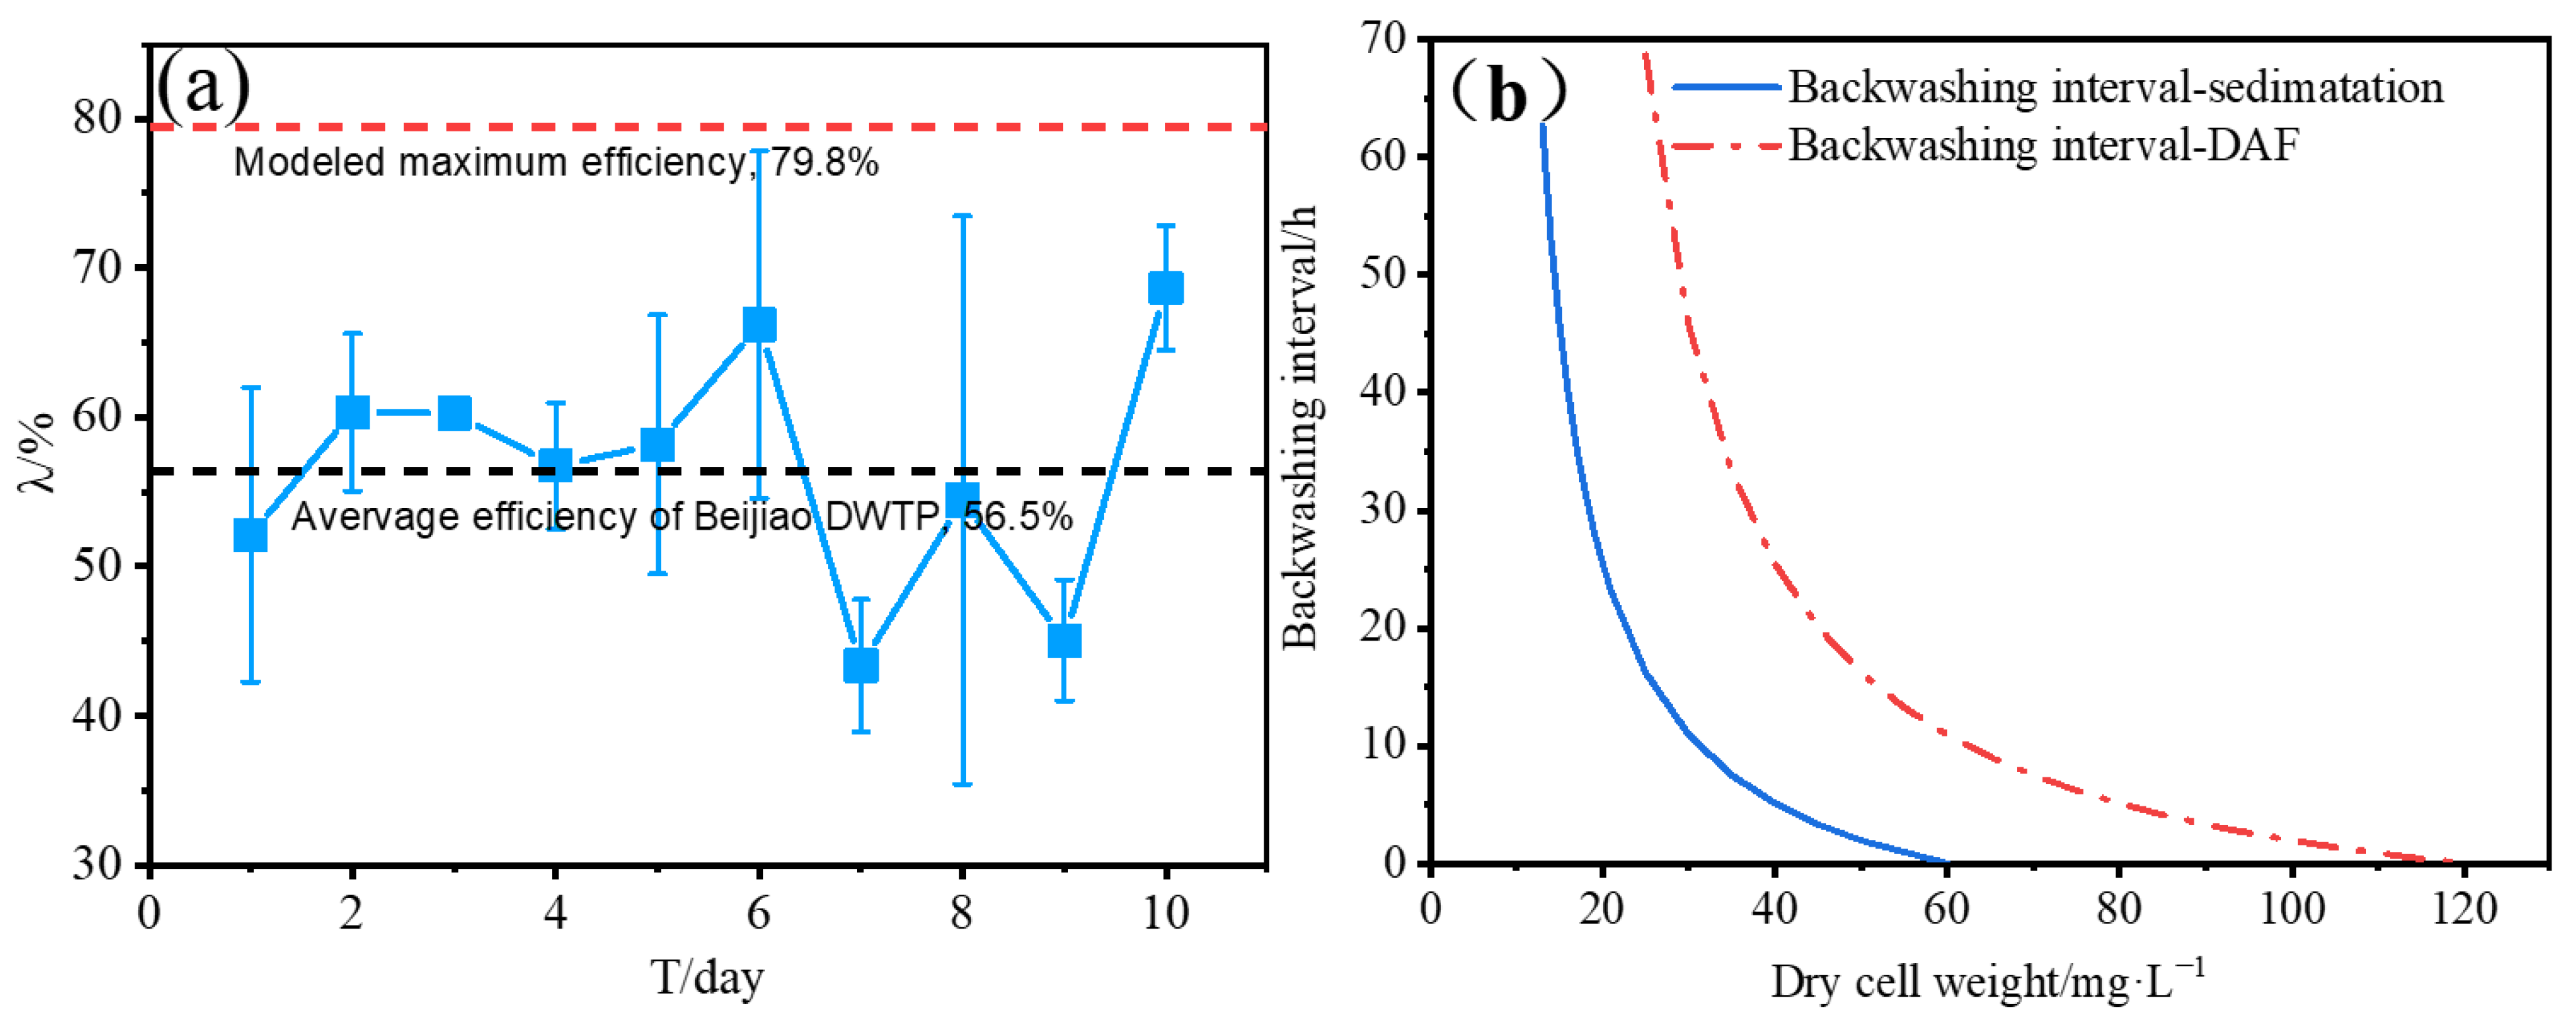
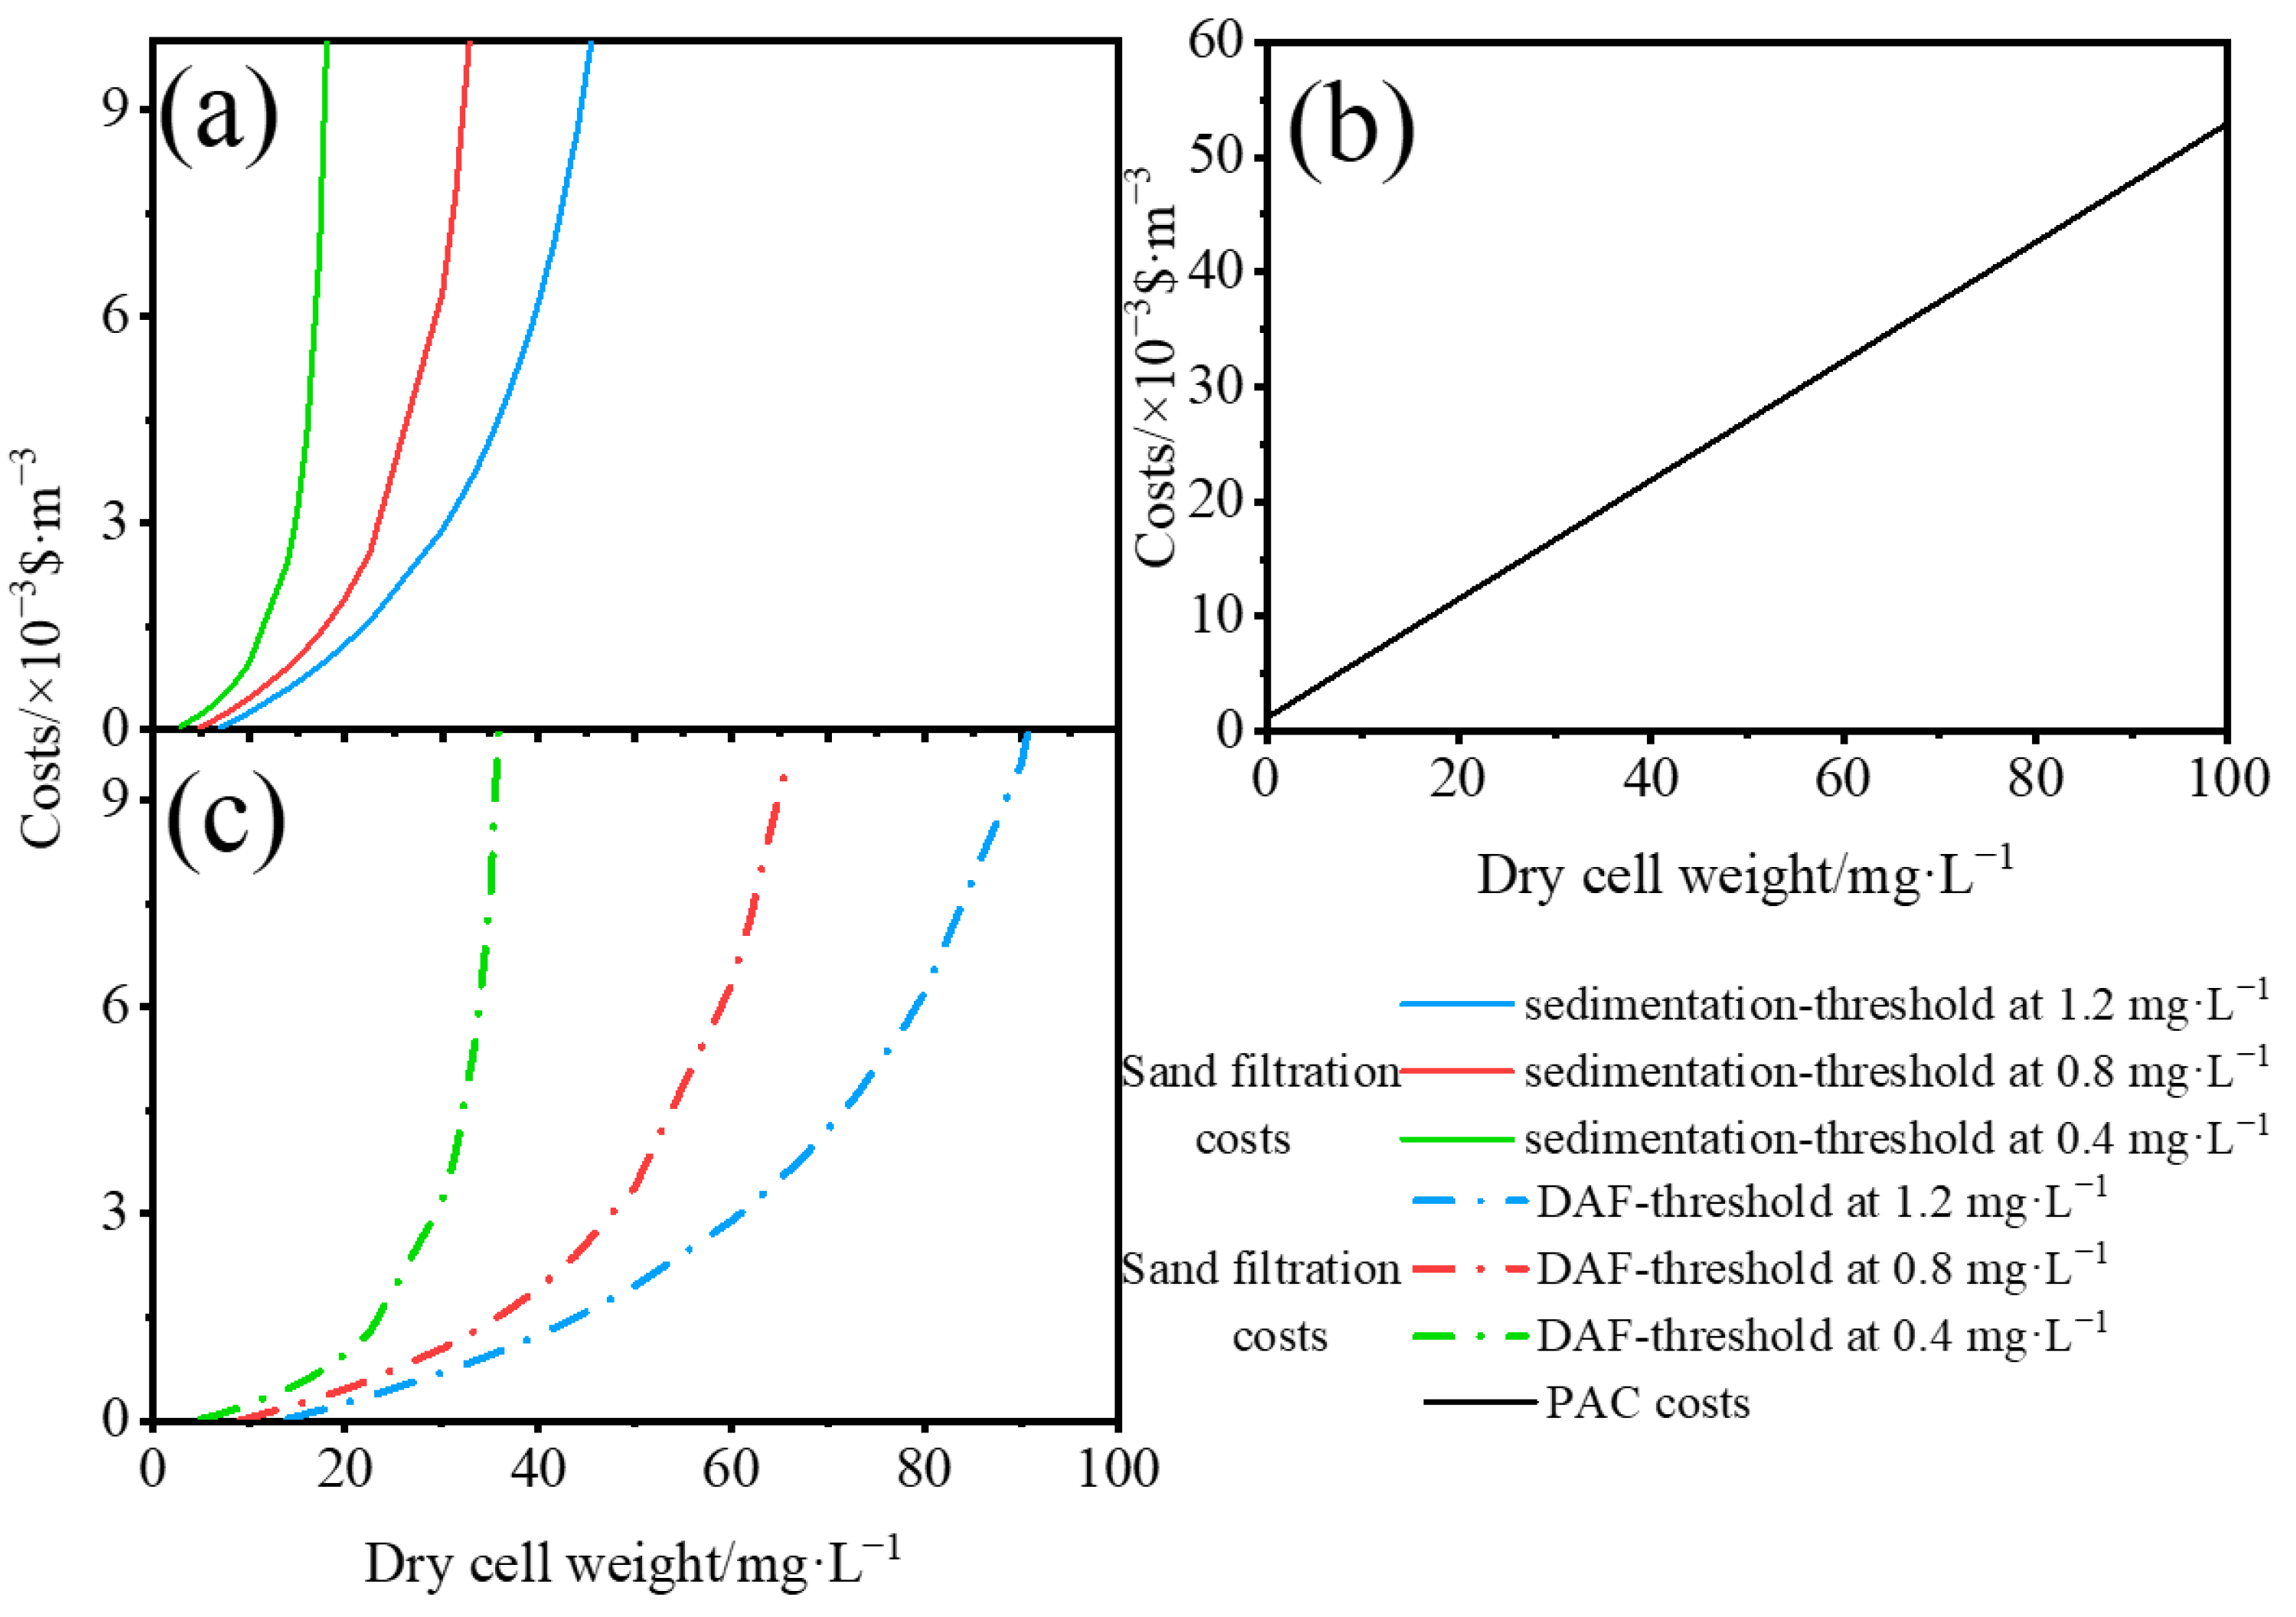
3.3. Influence of Algae Concentration on the Backwash Interval of Sand Filtration

Backwashing constitutes the cost of sand filtration, which relies on the optimization of its frequency. DWTPs generally set a fixed backwash interval to reduce the labor costs of management. However, it easily clogs the sand filter and exceeds the limit of water head loss when the algae concentration is too high. Under the condition of low algae concentrations, this results in costly waste. According to Equations (2) and (3), the maximum efficiency of sand filtration for this DWTP can reach up to 79.8%. Sampling of the sand filter inlet and outlet water of the Beijiao DWTP for 10 consecutive days, the maximum and minimum sand filtration efficiencies were 74.4% and 40.2% (Figure 4a), respectively. The average sand filtration efficiency was 56.5% and the net water head loss of the sand filter was 0.7686 m (Equation (12)). According to the 95% efficiency of DAF and 90% efficiency of sedimentation, the relationship between the backwash interval and feed concentration (c) under the effluent water concentration of 1.2 mg·L−1 is shown in Figure 4b.
The backwash interval of sand filtration is closely related to the inlet water supply to meet the standards of the water supply. When the influent algae concentration of sand filtration reaches 6 mg·L−1, its effluent algae concentration will exceed the threshold of 1.2 mg·L−1. Sedimentation can meet the demand of the water supply at an algae concentration in raw water below 60 mg·L−1, DAF must be used when the algae concentration in the raw water is between 60 mg·L−1 and 120 mg·L−1. However, the selection of sedimentation instead of DAF at 60 mg·L−1 only considers the costs of sedimentation or DAF; the selection of sedimentation or DAF also need to consider the costs of the system coupled with sand filtration.

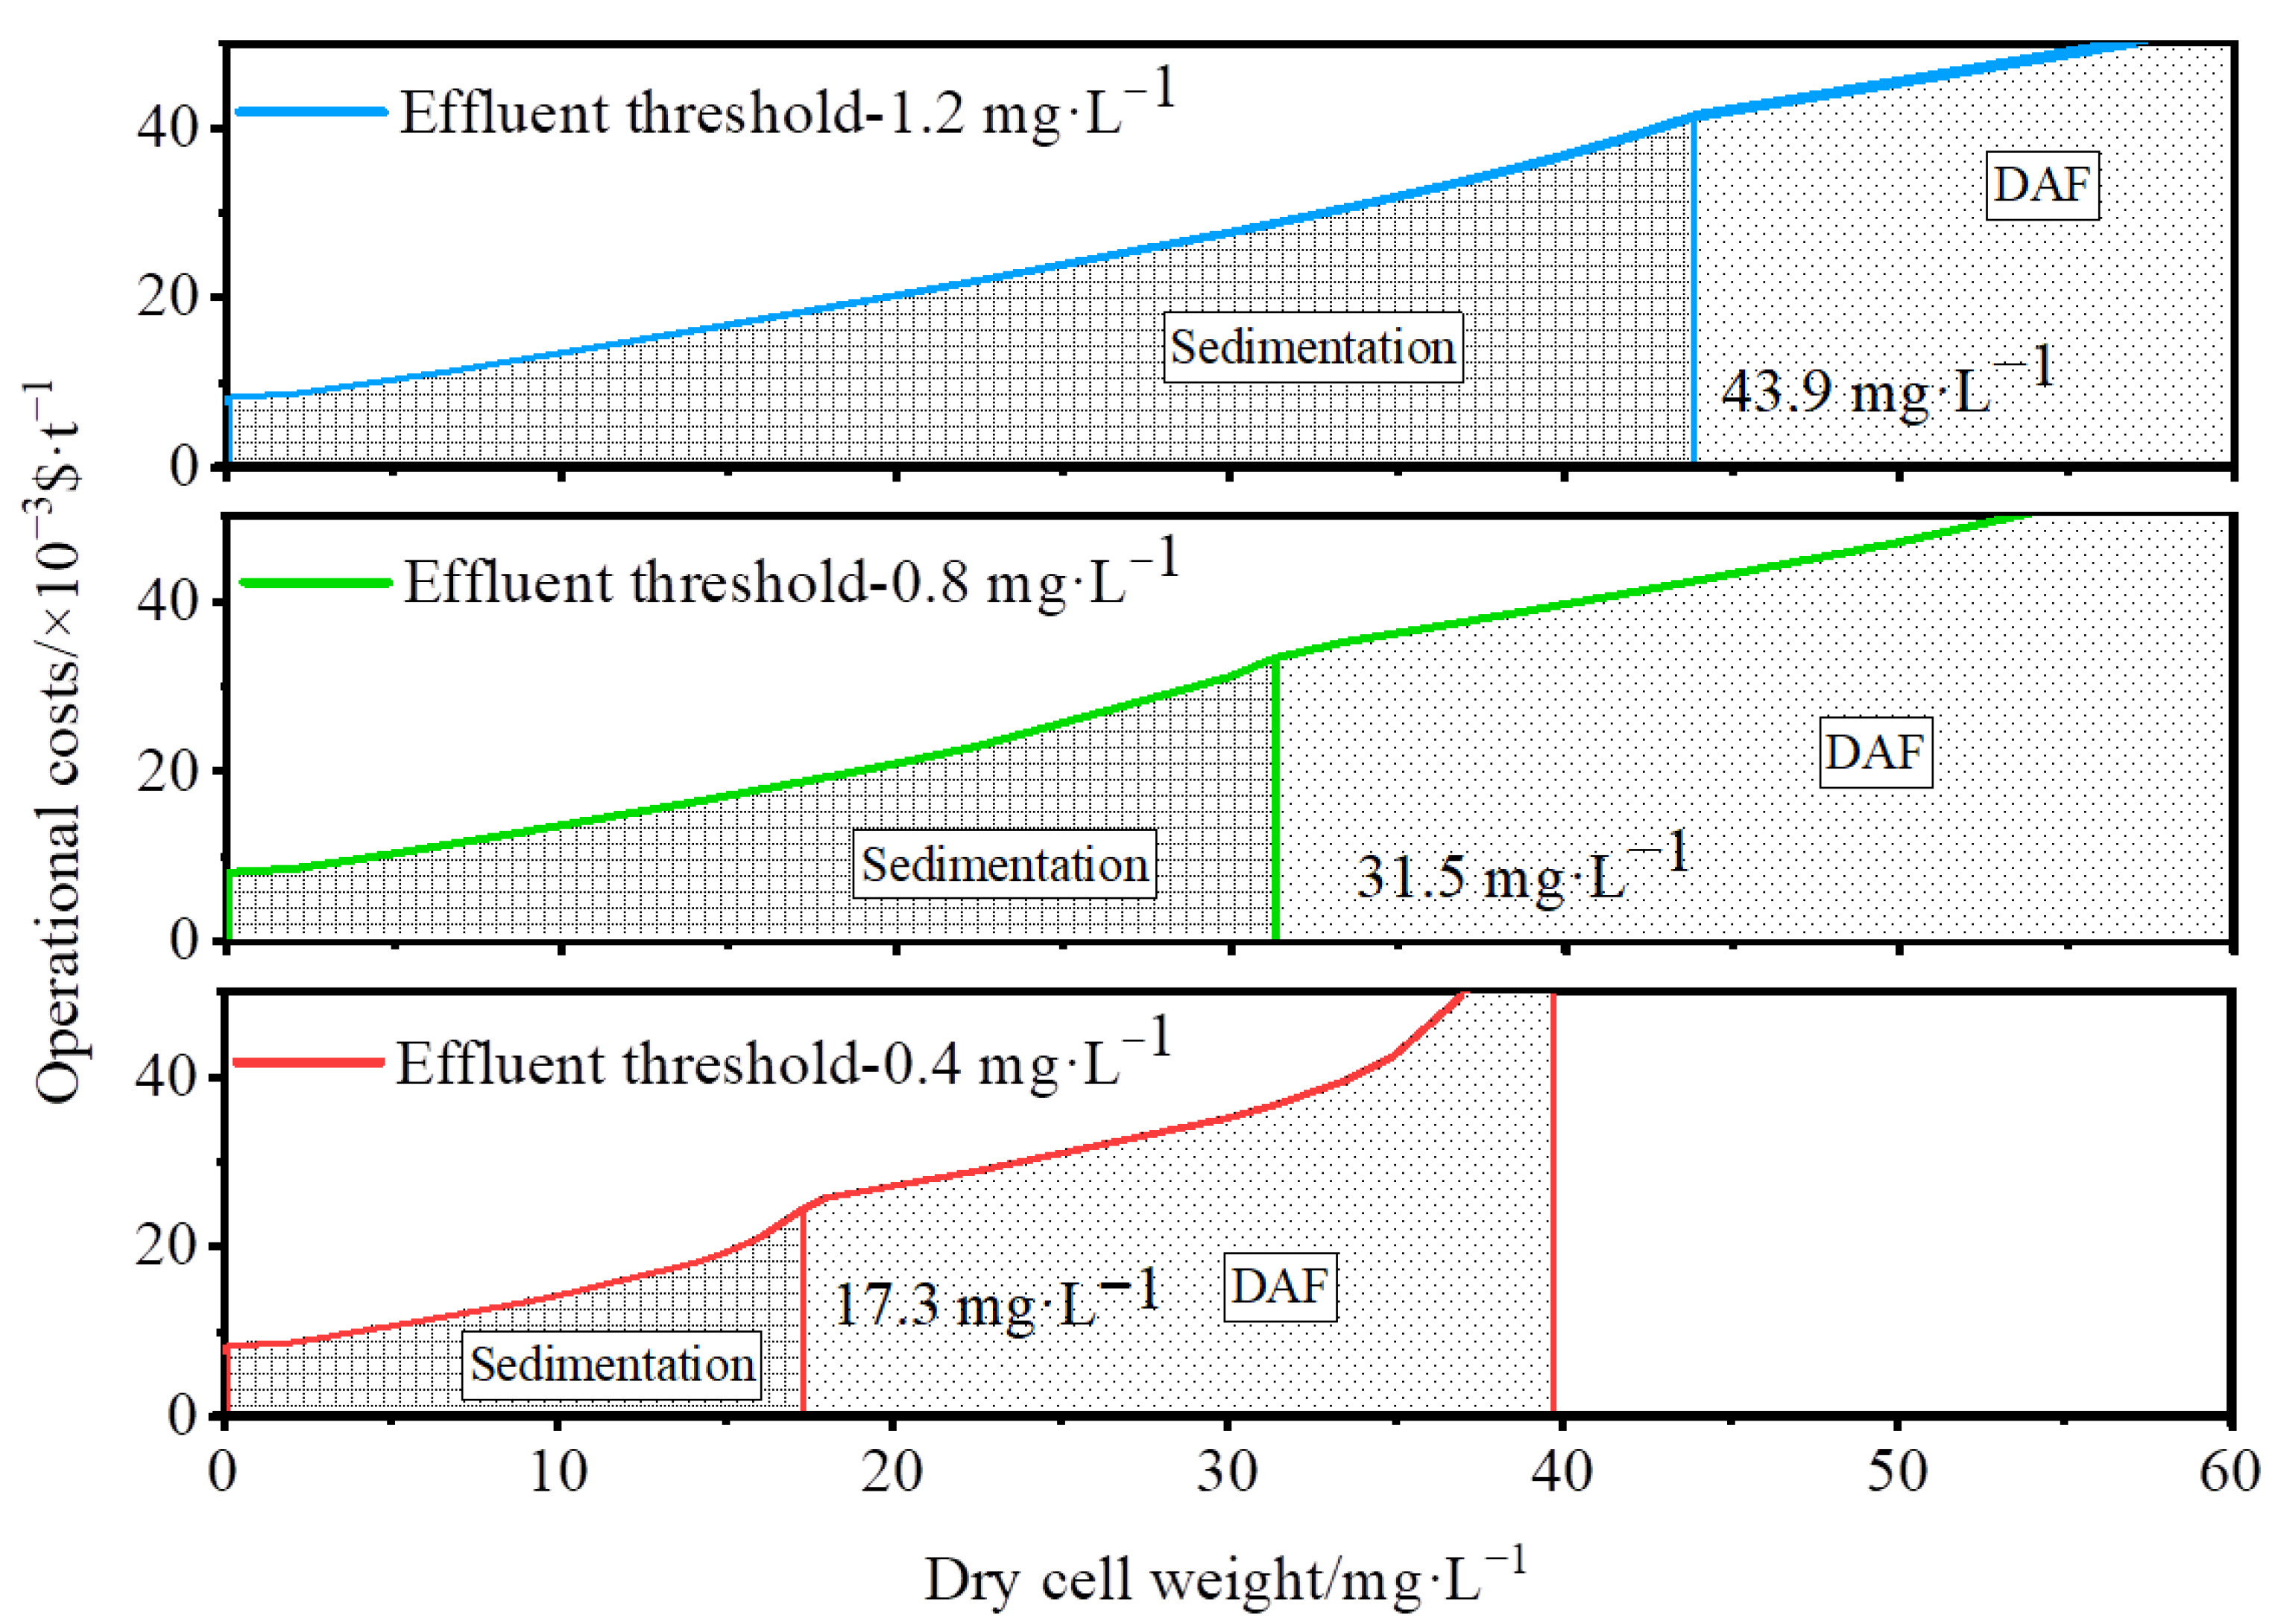
3.4. Protocol for Cost-Effective Treatment Processes for Algae Removal

The operational costs of the entire DWTP system depend on the algae concentrations in the raw water and the tolerances after sand filtration. The increase in operating costs is mainly caused by sand filtration under different effluent standards. The higher effluent threshold of sand filtration indicates that sedimentation will also meet the effluent standard of the sand filter, even if the algae concentration in the raw water increases. In Figure 5a, when sedimentation was used, sand filtration was increased with the increase of the algae concentration in raw water. The high effluent threshold of the sand filtration resulted in high sand filtration costs; this was due to the increase in backwash frequency. However, Figure 5c shows that DAF can be used before sand filtration under the same algae concentrations in raw water. The cost of sand filtration when using DAF before sand filtration is significantly lower than that when using sedimentation, because of the lower backwash frequency. Both sedimentation and DAF require PACl pre-treatment and the cost of PACl increases with increases in algae concentrations, as shown in Figure 5b; their dosages show a positive linear correlation with algae concentrations, as described above.
The relationship between effective operational costs and algae concentrations in raw water under different effluent thresholds is shown in Figure 6. The total operating cost was increased with increases in the algae concentration in raw water and decreases in the sand filter effluent threshold; this is because higher algae concentrations resulted in higher PACl usage and faster sand filtration backwash frequencies. This difference was not significant when the concentration of raw water was less than 10 mg·L−1. The cost of sedimentation was only from the PACl; however, DAF not only consumes PACl, but also needs a lot of operating electricity. Therefore, the Beijiao DWTP can save USD 250,539.5 per year by substituting sedimentation with DAF, while guaranteeing treatment capacity and safety. If the concentration of algae in the raw water is high, the DAF process must replace sedimentation, because the cost of sand filtration backwashing is higher than the electricity cost of DAF. The use of DAF instead of sedimentation is not only related to the raw water algae concentrations, but also to the effluent thresholds, as shown in Figure 6. The higher sand filter effluent thresholds result in higher algae concentrations in raw water when sedimentation is switched to DAF. DAF replaced sedimentation at the feed algae concentrations of 43.9 mg·L−1, 31.5 mg·L−1, and 17.3 mg·L−1, when effluent thresholds were 1.2 mg·L−1, 0.8 mg·L−1, and 0.4 mg·L−1, respectively. It is cost-effective to precisely control the usage of DAF or sedimentation, coagulation dosages, and the backwash intervals of sand filters based on algae concentrations in raw water and effluent thresholds.
Varied algae concentrations in the source water bring challenges for DWTPs. To improve the resilience of DWTPs toward variations in water quality caused by harmful algae blooms, many water plants adopt conservative strategies and add traditional modules to deal with algae-laden raw water [35,36]. Although this can ensure water quality and improve the impact resistance of DWTPs, it leads to higher treatment costs and complex management. It is necessary to reduce the number of treatment modules and adjust new technologies for further treatments—such as intensive activated-carbon filtration or other advanced approaches including electrolysis [37], ultrafiltration [38], and enhanced coagulation [39]—to maintain the quality and reduce the economic costs of water supplies [40,41].
Algae biomasses have been considered a valuable feedstock for many applications including biofuel production, in combination with treated wastewater—such as industrial and aquaculture wastewater—and landfill leachate for environmental pollution reduction [42,43,44,45,46,47]. Conventional water treatment processes are highly efficient in the removal of algae. Therefore, the collected algae biomass can be reused to further reduce the costs of DWTPs. However, cyanotoxins and the odor and taste of the algae cannot be completely removed by conventional processes and should be further studied for their impact on DWTPs’ costs [48].

4. Conclusions

The operational costs of drinking water treatment plants (DWTP) were USD 0.0176·m−3 using dissolved air flotation (DAF) at the polyaluminum chloride (PACl) dosage of 14 mg·L−1; the electricity costs of the DAF accounted for the highest percentage, which was 31.74%, and the coagulation costs accounted for 30.62%. Cost optimization is mainly focused on the processes of coagulation, DAF, and sand filtration. When the PACl/dry cell weight reached 1200 mg·g−1, the maximum efficiencies of the DAF and sedimentation were 90% and 95%, respectively. The surface loading rate per unit area of DAF was greater than that of sedimentation, but it also had a higher energy consumption. The use of DAF instead of sedimentation is not only related to the raw water algae concentration, but also to the effluent thresholds. When the effluent thresholds are 1.2 mg·L−1, 0.8 mg·L−1, and 0.4 mg·L−1, DAF should be adopted instead of sedimentation at the feed algae concentrations of 43.9 mg·L−1, 31.5 mg·L−1, and 17.3 mg·L−1, respectively. Higher algae concentrations in raw water and lower sand filtration effluent thresholds result in higher total operational costs. The effluent thresholds of algae concentrations in drinking water need to be standardized to better guide the operation of water plant processes and their costs.

Author Contributions

Conceptualization, methodology, M.L. and X.Z.; formal analysis, L.L. and M.M.; data curation, X.S. and Y.L.; writing—review and editing, H.Z. All authors have read and agreed to the published version of the manuscript.

Funding

This work was partially supported by the National Key Research and Development Program “Intergovernmental International Science and Technology Innovation Cooperation” of China (2018YFE0110600) and the Features Institute Service Projects from the Institute of Hydrobiology, the Chinese Academy of Sciences (Y85Z02-1-3-1).

Institutional Review Board Statement

Not applicable.

Informed Consent Statement

Not applicable.

Data Availability Statement

Not applicable.

Conflicts of Interest

The authors declare no conflict of interest.

References

  1. Dodds, W.K.; Bouska, W.W.; Eitzmann, J.L.; Pilger, T.J.; Pitts, K.L.; Riley, A.J.; Schloesser, J.T.; Thornbrugh, D.J. Eutrophication of U.S. Freshwaters: Analysis of Potential Economic Damages. Environ. Sci. Technol. 2009, 43, 12–19. [Google Scholar] [CrossRef] [PubMed] [Green Version]
  2. Howarth, R.W.; Marino, R. Nitrogen as the limiting nutrient for eutrophication in coastal marine ecosystems: Evolving views over three decades. Limnol. Oceanogr. 2006, 51, 364–376. [Google Scholar] [CrossRef] [Green Version]
  3. Li, K.; Xu, T.; Xi, J.; Jia, H.; Gao, Z.; Sun, Z.; Yin, D.; Leng, L. Multi-factor analysis of algal blooms in gate-controlled urban water bodies by data mining. Sci. Total Environ. 2021, 753, 141821. [Google Scholar] [CrossRef] [PubMed]
  4. Moss, B.; Jeppesen, E.; Søndergaard, M.; Lauridsen, T.L.; Liu, Z. Nitrogen, macrophytes, shallow lakes and nutrient limitation: Resolution of a current controversy? Hydrobiologia 2013, 710, 3–21. [Google Scholar] [CrossRef]
  5. Trottet, A.; George, C.; Drillet, G.; Lauro, F.M. Aquaculture in coastal urbanized areas: A comparative review of the challenges posed by Harmful Algal Blooms. Crit. Rev. Environ. Sci. Technol. 2022, 52, 2888–2929. [Google Scholar] [CrossRef]
  6. Xu, X.; Zhou, Y.; Han, R.; Song, K.; Zhou, X.; Wang, G.; Wang, Q. Eutrophication triggers the shift of nutrient absorption pathway of submerged macrophytes: Implications for the phytoremediation of eutrophic waters. J. Environ. Manag. 2019, 239, 376–384. [Google Scholar] [CrossRef]
  7. Ma, J.; Wang, P. Effects of rising atmospheric CO2 levels on physiological response of cyanobacteria and cyanobacterial bloom development: A review. Sci. Total Environ. 2021, 754, 141889. [Google Scholar] [CrossRef]
  8. Zamyadi, A.; MacLeod, S.L.; Fan, Y.; McQuaid, N.; Dorner, S.; Sauve, S.; Prevost, M. Toxic cyanobacterial breakthrough and accumulation in a drinking water plant: A monitoring and treatment challenge. Water Res. 2012, 46, 1511–1523. [Google Scholar] [CrossRef]
  9. Chapra, S.C.; Boehlert, B.; Fant, C.; Bierman, V.J.; Henderson, J.; Mills, D.; Mas, D.M.L.; Rennels, L.; Jantarasami, L.; Martinich, J.; et al. Climate Change Impacts on Harmful Algal Blooms in U.S. Freshwaters: A Screening-Level Assessment. Environ. Sci. Technol. 2017, 51, 8933–8943. [Google Scholar] [CrossRef] [Green Version]
  10. Smith, R.B.; Bass, B.; Sawyer, D.; Depew, D.; Watson, S.B. Estimating the economic costs of algal blooms in the Canadian Lake Erie Basin. Harmful Algae 2019, 87, 101624. [Google Scholar] [CrossRef]
  11. Dunlap, C.R.; Sklenar, K.S.; Blake, L.J. A Costly Endeavor: Addressing Algae Problems in a Water Supply. J. AWWA 2015, 107, E255–E262. [Google Scholar] [CrossRef]
  12. K.D.o. Health, Environment, Water Quality Standards White Paper: Chlorophyll—A Criteria for Public Water Supply Lakes and Reservoirs; Kansas Department of Health and Environment Bureau of Water: Topeka, KS, USA, 2011. [Google Scholar]
  13. Treuer, G.; Kirchhoff, C.; Lemos, M.C.; McGrath, F. Challenges of managing harmful algal blooms in US drinking water systems. Nat. Sustain. 2021, 4, 958–964. [Google Scholar] [CrossRef]
  14. Westrick, J.A.; Szlag, D.C.; Southwell, B.J.; Sinclair, J. A review of cyanobacteria and cyanotoxins removal/inactivation in drinking water treatment. Anal. Bioanal. Chem. 2010, 397, 1705–1714. [Google Scholar] [CrossRef] [PubMed]
  15. Li, H.; Gu, X.; Chen, H.; Mao, Z.; Shen, R.; Zeng, Q.; Ge, Y. Co-occurrence of multiple cyanotoxins and taste-and-odor compounds in the large eutrophic Lake Taihu, China: Dynamics, driving factors, and challenges for risk assessment. Environ. Pollut. 2022, 294, 118594. [Google Scholar] [CrossRef] [PubMed]
  16. Pichel, N.; Vivar, M.; Fuentes, M. The problem of drinking water access: A review of disinfection technologies with an emphasis on solar treatment methods. Chemosphere 2019, 218, 1014–1030. [Google Scholar] [CrossRef]
  17. Liu, X.; Chen, L.; Yang, M.; Tan, C.; Chu, W. The occurrence, characteristics, transformation and control of aromatic disinfection by-products: A review. Water Res. 2020, 184, 116076. [Google Scholar] [CrossRef]
  18. Cho, K.J.; Choi, Y.; Shin, J.-K.; Lee, J. Problematic algae in the sedimentation and filtration process of water treatment plants. Aqua 2011, 60, 219. [Google Scholar] [CrossRef]
  19. Mahmoud, E.; Gad, A.; Farrag, A.; Aboeldahb, S. Evaluation of the most promising techniques overcoming the algal problems takes place during the purification of drinking water. Environ. Sci. Pollut. Res. 2021, 28, 44239–44248. [Google Scholar] [CrossRef]
  20. Sze, Y.S.; Aris, A.B.; Zaidi, N.S.; Bahrodin, M.B. Performance of Sand Filtration System with Different Sand Bed Depth for Polishing Wastewater Treatment. J. Environ. Treat. Tech. 2021, 9, 452–457. [Google Scholar]
  21. Saravanan, A.; Kumar, P.S.; Varjani, S.; Jeevanantham, S.; Yaashikaa, P.R.; Thamarai, P.; Abirami, B.; George, C.S. A review on algal-bacterial symbiotic system for effective treatment of wastewater. Chemosphere 2021, 271, 129540. [Google Scholar] [CrossRef]
  22. Esen, M.; Yuksel, T. Experimental evaluation of using various renewable energy sources for heating a greenhouse. Energy Build. 2013, 65, 340–351. [Google Scholar] [CrossRef]
  23. Taner, T.; Sivrioglu, M. A techno-economic & cost analysis of a turbine power plant: A case study for sugar plant. Renew. Sustain. Energy Rev. 2017, 78, 722–730. [Google Scholar]
  24. Taner, T. Optimisation processes of energy efficiency for a drying plant: A case of study for Turkey. Appl. Therm. Eng. 2015, 80, 247–260. [Google Scholar] [CrossRef]
  25. Roy, S.; Ghosh, S.; Bhowmick, N. Application of Colloidal Filtration Theory on Textile Fibrous Media: Effect of Fiber Orientation on Bacterial Removal Efficiency and Attachment. J. Inst. Eng. India Ser. E 2018, 99, 111–117. [Google Scholar] [CrossRef]
  26. Tufenkji, N.; Elimelech, M. Correlation Equation for Predicting Single-Co llector Efficiency in Physicochemical Filtration in Saturated Porous Media. Environ. Sci. Technol. 2004, 38, 529–536. [Google Scholar] [CrossRef] [PubMed]
  27. Hu, Y.; Wu, W.; Liu, H.; Huang, Y.; Bi, X.; Liao, R.; Yin, S. Dimensional Analysis Model of Head Loss for Sand Media Filters in a Drip Irrigation System Using Reclaimed Water. Water 2022, 14, 961. [Google Scholar] [CrossRef]
  28. Najdawi, F.; Neptune, K. Optimizing Reverse Osmosis Membrane Parameters through the Use of the Solution-Diffusion Model: A Review. Engineering 2022, 14, 9–32. [Google Scholar] [CrossRef]
  29. Li, C.; Luo, F.; Duan, H.; Dong, F.; Chen, X.; Feng, M.; Zhang, Z.; Cizmas, L.; Sharma, V.K. Degradation of chloramphenicol by chlorine and chlorine dioxide in a pilot-scale water distribution system. Sep. Purif. Technol. 2019, 211, 564–570. [Google Scholar] [CrossRef]
  30. Zhang, J.; Liao, Y.; Wang, Q.; Wang, C.; Yu, J. Degradation of odorous sulfide compounds by different oxidation processes in drinking water: Performance, reaction kinetics and mechanism. Water Res. 2020, 189, 116643. [Google Scholar] [CrossRef]
  31. dos Santos, P.R.; Daniel, L.A. A review: Organic matter and ammonia removal by biological activated carbon filtration for water and wastewater treatment. Int. J. Environ. Sci. Technol. 2020, 17, 591–606. [Google Scholar] [CrossRef]
  32. Teixeira, M.R.; Rosa, M.J. Comparing dissolved air flotation and conventional sedimentation to remove cyanobacterial cells of Microcystis aeruginosa: Part II. The effect of water background organics. Sep. Purif. Technol. 2007, 53, 126–134. [Google Scholar] [CrossRef]
  33. Khiadani, M.; Kolivand, R.; Ahooghalandari, M.; Mohajer, M. Removal of turbidity from water by dissolved air flotation and conventional sedimentation systems using poly aluminum chloride as coagulant. Desalination Water Treat. 2014, 52, 985–989. [Google Scholar] [CrossRef]
  34. Edzwald, J.K. Principles and applications of dissolved air flotation. Water Sci. Technol. 1995, 31, 1–23. [Google Scholar] [CrossRef]
  35. Song, Z.; Zhang, X.; Ngo, H.H.; Guo, W.; Wen, H.; Li, C. Occurrence, fate and health risk assessment of 10 common antibiotics in two drinking water plants with different treatment processes. Sci. Total Environ. 2019, 674, 316–326. [Google Scholar] [CrossRef] [PubMed]
  36. Kato, R.; Asami, T.; Utagawa, E.; Furumai, H.; Katayama, H. Pepper mild mottle virus as a process indicator at drinking water treatment plants employing coagulation-sedimentation, rapid sand filtration, ozonation, and biological activated carbon treatments in Japan. Water Res. 2018, 132, 61–70. [Google Scholar] [CrossRef] [PubMed]
  37. Xu, Y.; Yang, J.; Ou, M.; Wang, Y.; Jia, J. Study of Microcystis aeruginosa inhibition by electrochemical method. Biochem. Eng. J. 2007, 36, 215–220. [Google Scholar] [CrossRef]
  38. Liang, H.; Gong, W.; Chen, J.; Li, G. Cleaning of fouled ultrafiltration (UF) membrane by algae during reservoir water treatment. Desalination 2008, 220, 267–272. [Google Scholar] [CrossRef]
  39. Tsai, M.-H.; Hua, L.-C.; Huang, K.; Huang, C. NOM removal and residual Al minimization by enhanced coagulation: Roles of sequence dosing with PACl–FeCl3. J. Water Supply: Res. Technol. Aqua 2020, 69, 616–628. [Google Scholar] [CrossRef]
  40. Di Marcantonio, C.; Bertelkamp, C.; van Bel, N.; Pronk, T.E.; Timmers, P.H.A.; van der Wielen, P.; Brunner, A.M. Organic micropollutant removal in full-scale rapid sand filters used for drinking water treatment in The Netherlands and Belgium. Chemosphere 2020, 260, 127630. [Google Scholar] [CrossRef] [PubMed]
  41. Matilainen, A.; Vieno, N.; Tuhkanen, T. Efficiency of the activated carbon filtration in the natural organic matter removal. Environ. Int. 2006, 32, 324–331. [Google Scholar] [CrossRef]
  42. Zhang, X.; Wang, L.; Sommerfeld, M.; Hu, Q. Harvesting microalgal biomass using magnesium coagulation-dissolved air flotation. Biomass Bioenergy 2016, 93, 43–49. [Google Scholar] [CrossRef]
  43. Ashour, M.; Alprol, A.E.; Heneash, A.M.M.; Saleh, H.; Abualnaja, K.M.; Alhashmialameer, D.; Mansour, A.T. Ammonia Bioremediation from Aquaculture Wastewater Effluents Using Arthrospira platensis NIOF17/003: Impact of Biodiesel Residue and Potential of Ammonia-Loaded Biomass as Rotifer Feed. Materials 2021, 14, 5460. [Google Scholar] [CrossRef]
  44. Mansour, A.T.; Ashour, M.; Alprol, A.E.; Alsaqufi, A.S. Aquatic Plants and Aquatic Animals in the Context of Sustainability: Cultivation Techniques, Integration, and Blue Revolution. Sustainability 2022, 14, 3257. [Google Scholar] [CrossRef]
  45. Yin, Z.; Chu, R.; Zhu, L.; Li, S.; Mo, F.; Hu, D.; Liu, C. Application of chitosan-based flocculants to harvest microalgal biomass for biofuel production: A review. Renew. Sustain. Energy Rev. 2021, 145, 111159. [Google Scholar] [CrossRef]
  46. Koyande, A.K.; Chew, K.W.; Rambabu, K.; Tao, Y.; Chu, D.-T.; Show, P.-L. Microalgae: A potential alternative to health supplementation for humans. Food Sci. Hum. Wellness 2019, 8, 16–24. [Google Scholar] [CrossRef]
  47. Leng, L.; Wei, L.; Xiong, Q.; Xu, S.; Li, W.; Lv, S.; Lu, Q.; Wan, L.; Wen, Z.; Zhou, W. Use of microalgae based technology for the removal of antibiotics from wastewater: A review. Chemosphere 2020, 238, 124680. [Google Scholar] [CrossRef] [PubMed]
  48. He, X.X.; Liu, Y.L.; Conklin, A.; Westrick, J.; Weavers, L.K.; Dionysiou, D.D.; Lenhart, J.J.; Mouser, P.J.; Szlag, D.; Walker, H.W. Toxic cyanobacteria and drinking water: Impacts, detection, and treatment. Harmful Algae 2016, 54, 174–193. [Google Scholar] [CrossRef]
Figure 1. The water treatment process in Beijiao DWTP, Beihai, China. The scale of the feed was 96,000 m3·d−1, and the dosages of the ozone and liquid chlorine were fixed at 1.6 mg·L−1 and 3 mg·L−1, respectively. The sand filtration was backwashed every 24 h with a flow of 1440 m3·s−1, with 8 min of air backwashing and 8 min of water backwashing. The activated carbon filtration was backwashed every 7 days with an 8 min water wash and every 30 days with a 5 min air wash and an 8 min water wash, both with a flow of 1310 m3·s−1.
Water 15 00243 g001
Figure 2. Components of the individual unit processes in the water plant; SF is sand filtration, CF is activated carbon filtration, and activated carbon is designed to be replaced every 5 years.
Water 15 00243 g002
Figure 3. (a) The performances of DAF and sedimentation in removing algae cells from different types of raw water (pH 7, temperature 28 °C, algae concentrations were 10.29 mg·L−1, 12.7 mg·L−1, 17.39 mg·L−1 and 27.28 mg·L−1, respectively), (b) relationship between PACl dosage and algae cells when coagulation reaches the best level based on 4 different raw waters.
Water 15 00243 g003
Figure 4. (a) Modeled maximum sand filtration sufficiency and actual sand filtration efficiency obtained by sampling 1 backwash interval (24 h) in the Beijiao DWTP, (b) changes in the backwash interval with differing algae concentrations in raw water under a sand filter effluent water concentration of 1.2 mg·L−1.
Water 15 00243 g004
Figure 5. (a) Sand filtration costs when using sedimentation under different sand filter effluent thresholds with algae concentrations in raw water, (b) PACl costs under different algae concentrations in raw water, (c) sand filtration costs when using DAF under different sand filter effluent thresholds with different algae concentrations in raw water.
Water 15 00243 g005
Figure 6. Relationship between the total operating costs and algae concentrations in the raw water at different effluent thresholds of the sand filter; 17.3 mg·L−1, 31.5 mg·L−1, and 43.9 mg·L−1 are the concentrations at which DAF is selected instead of sedimentation.
Water 15 00243 g006
Table 1. Power consumption of the equipment.
ParametersValueUnit
Ozonator35kw
Ozonator-supporting equipment8.9kw
Ozone dosing16.08kw
Air floating return pump37kw
Air floating supporting equipment32kw
Chemical dosing2.7kw
Backwash pump of sand filtration45kw
Backwash pump of activated carbon filtration55kw
Air blower75kw
Table 2. The unit costs of the electricity and chemicals *.
ParametersValueUnit
Electricity0.1126$·kwh−1
Water0.0563$·m−3
PACl0.4927$·kg−1
Liquid oxygen0.2393$·kg−1
Liquid chlorine0.5631$·kg−1
Activated carbon0.357$·kg−1
* Data provided by the Beijiao DWTP.
Disclaimer/Publisher’s Note: The statements, opinions and data contained in all publications are solely those of the individual author(s) and contributor(s) and not of MDPI and/or the editor(s). MDPI and/or the editor(s) disclaim responsibility for any injury to people or property resulting from any ideas, methods, instructions or products referred to in the content.

