
A GIS-Based Probabilistic Spatial Multicriteria Roof Water Inrush Risk Evaluation Method Considering Decision Makers’ Risk-Coping Attitude

Abstract
:1. Introduction
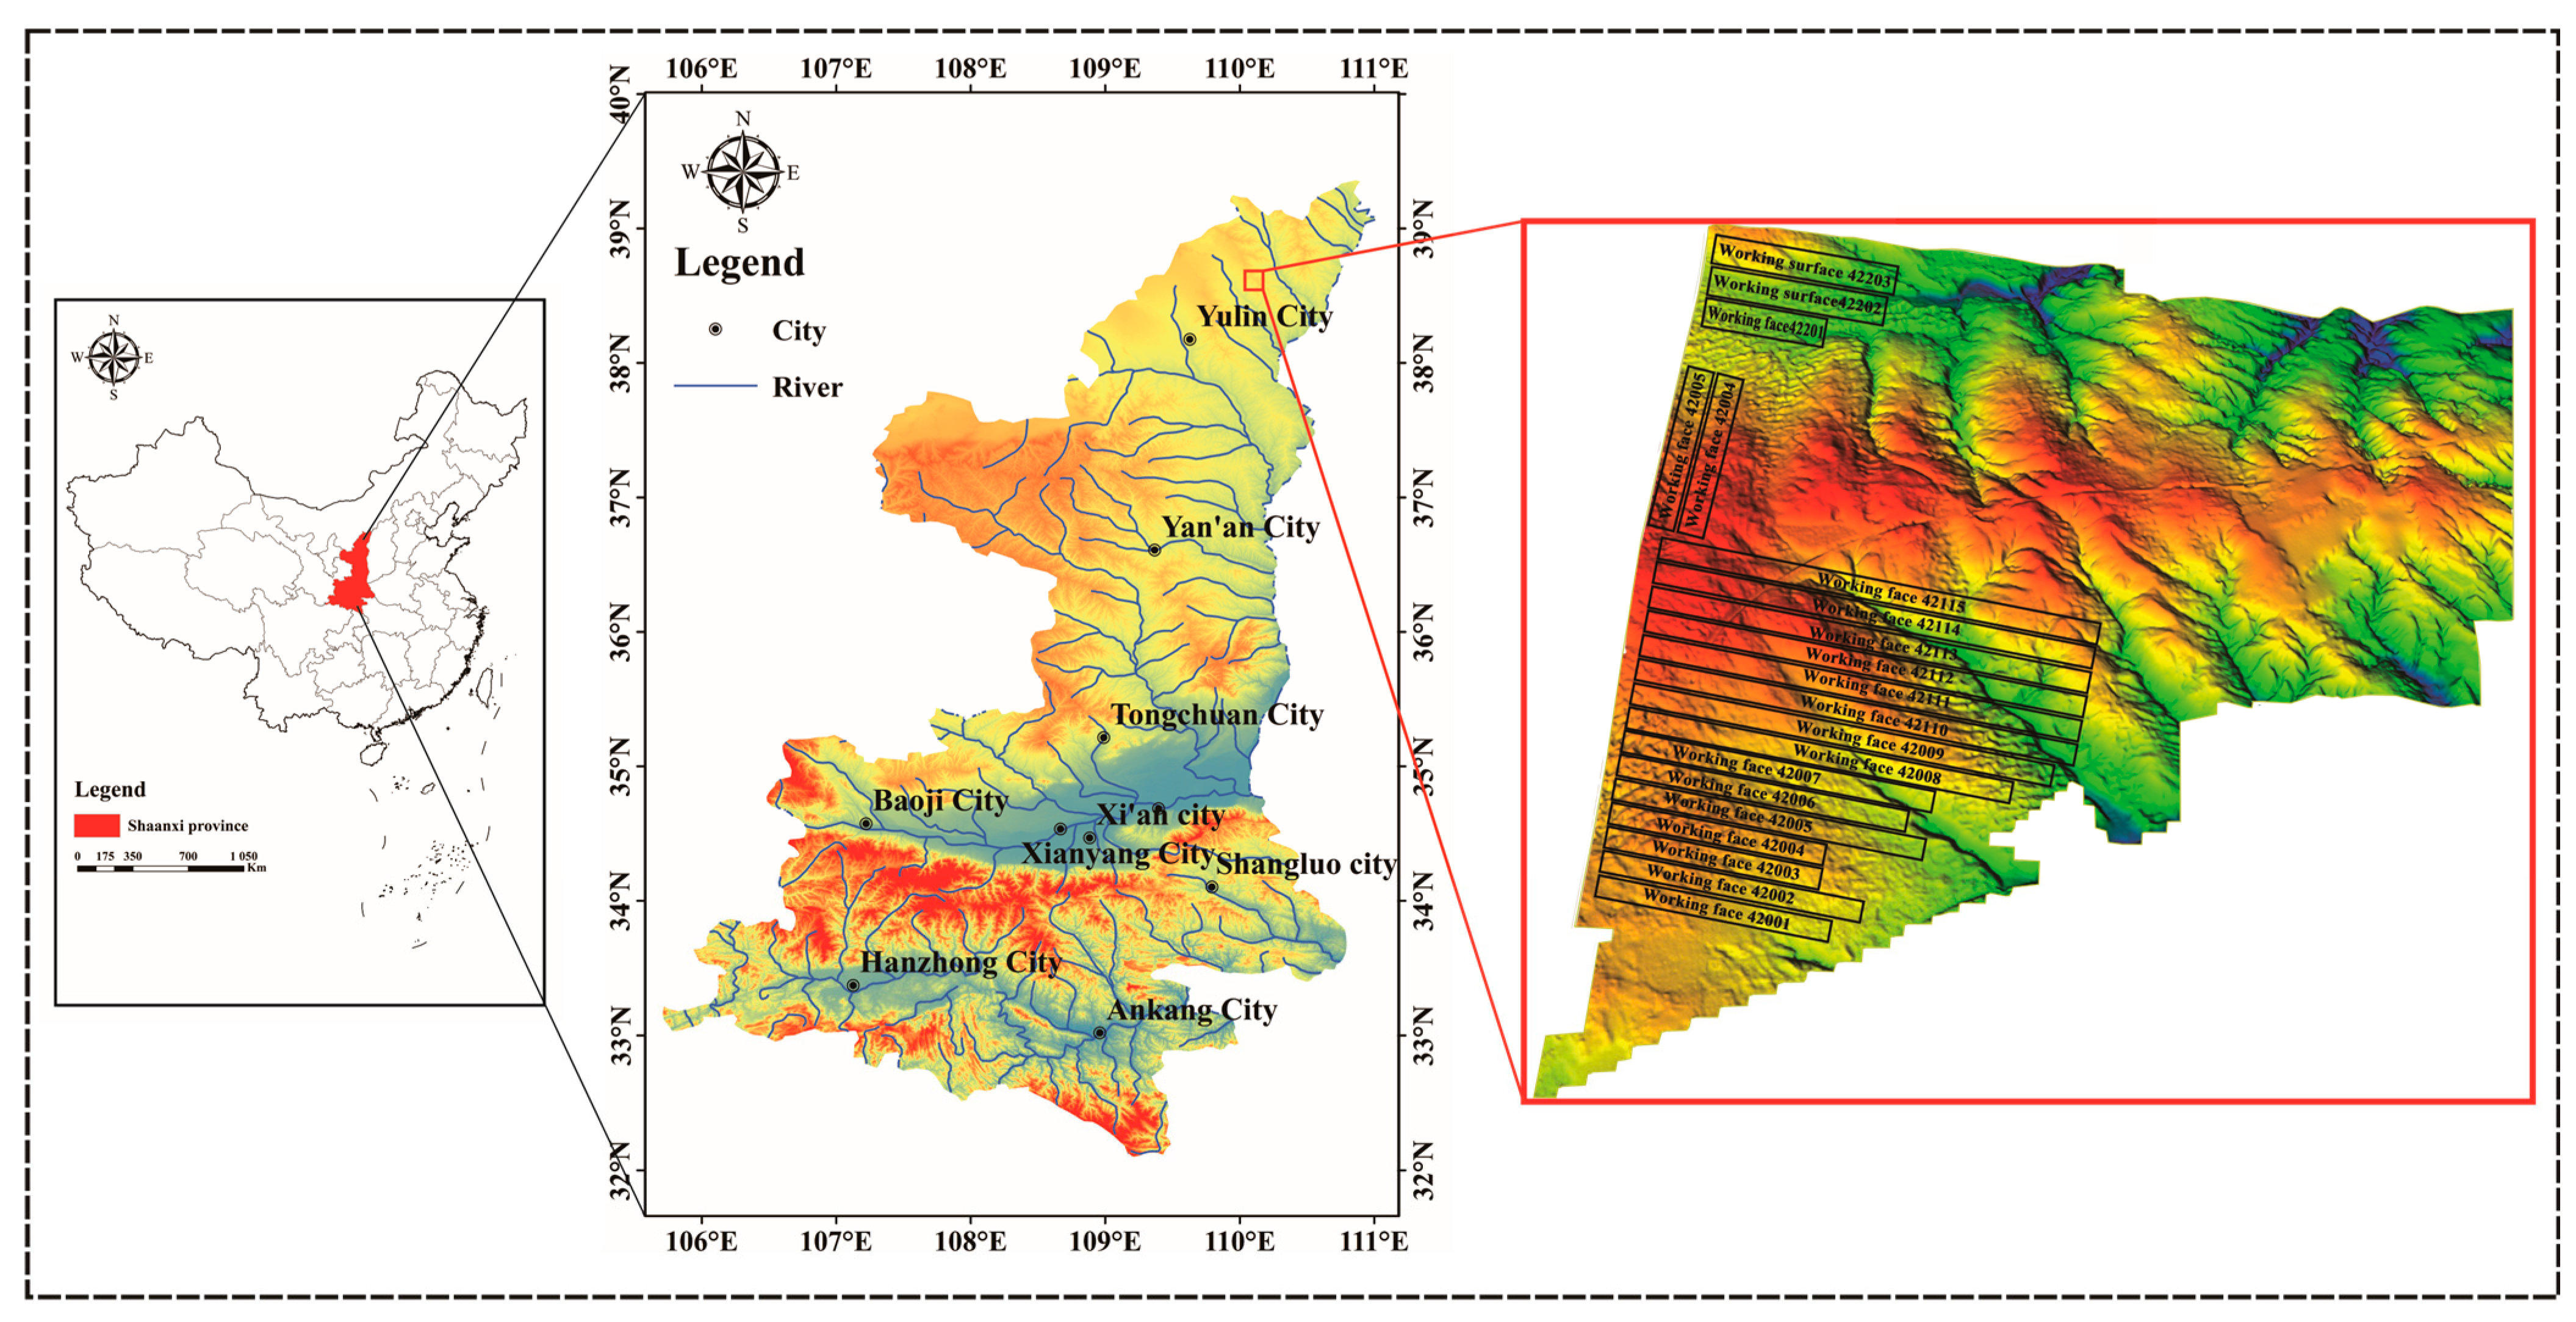
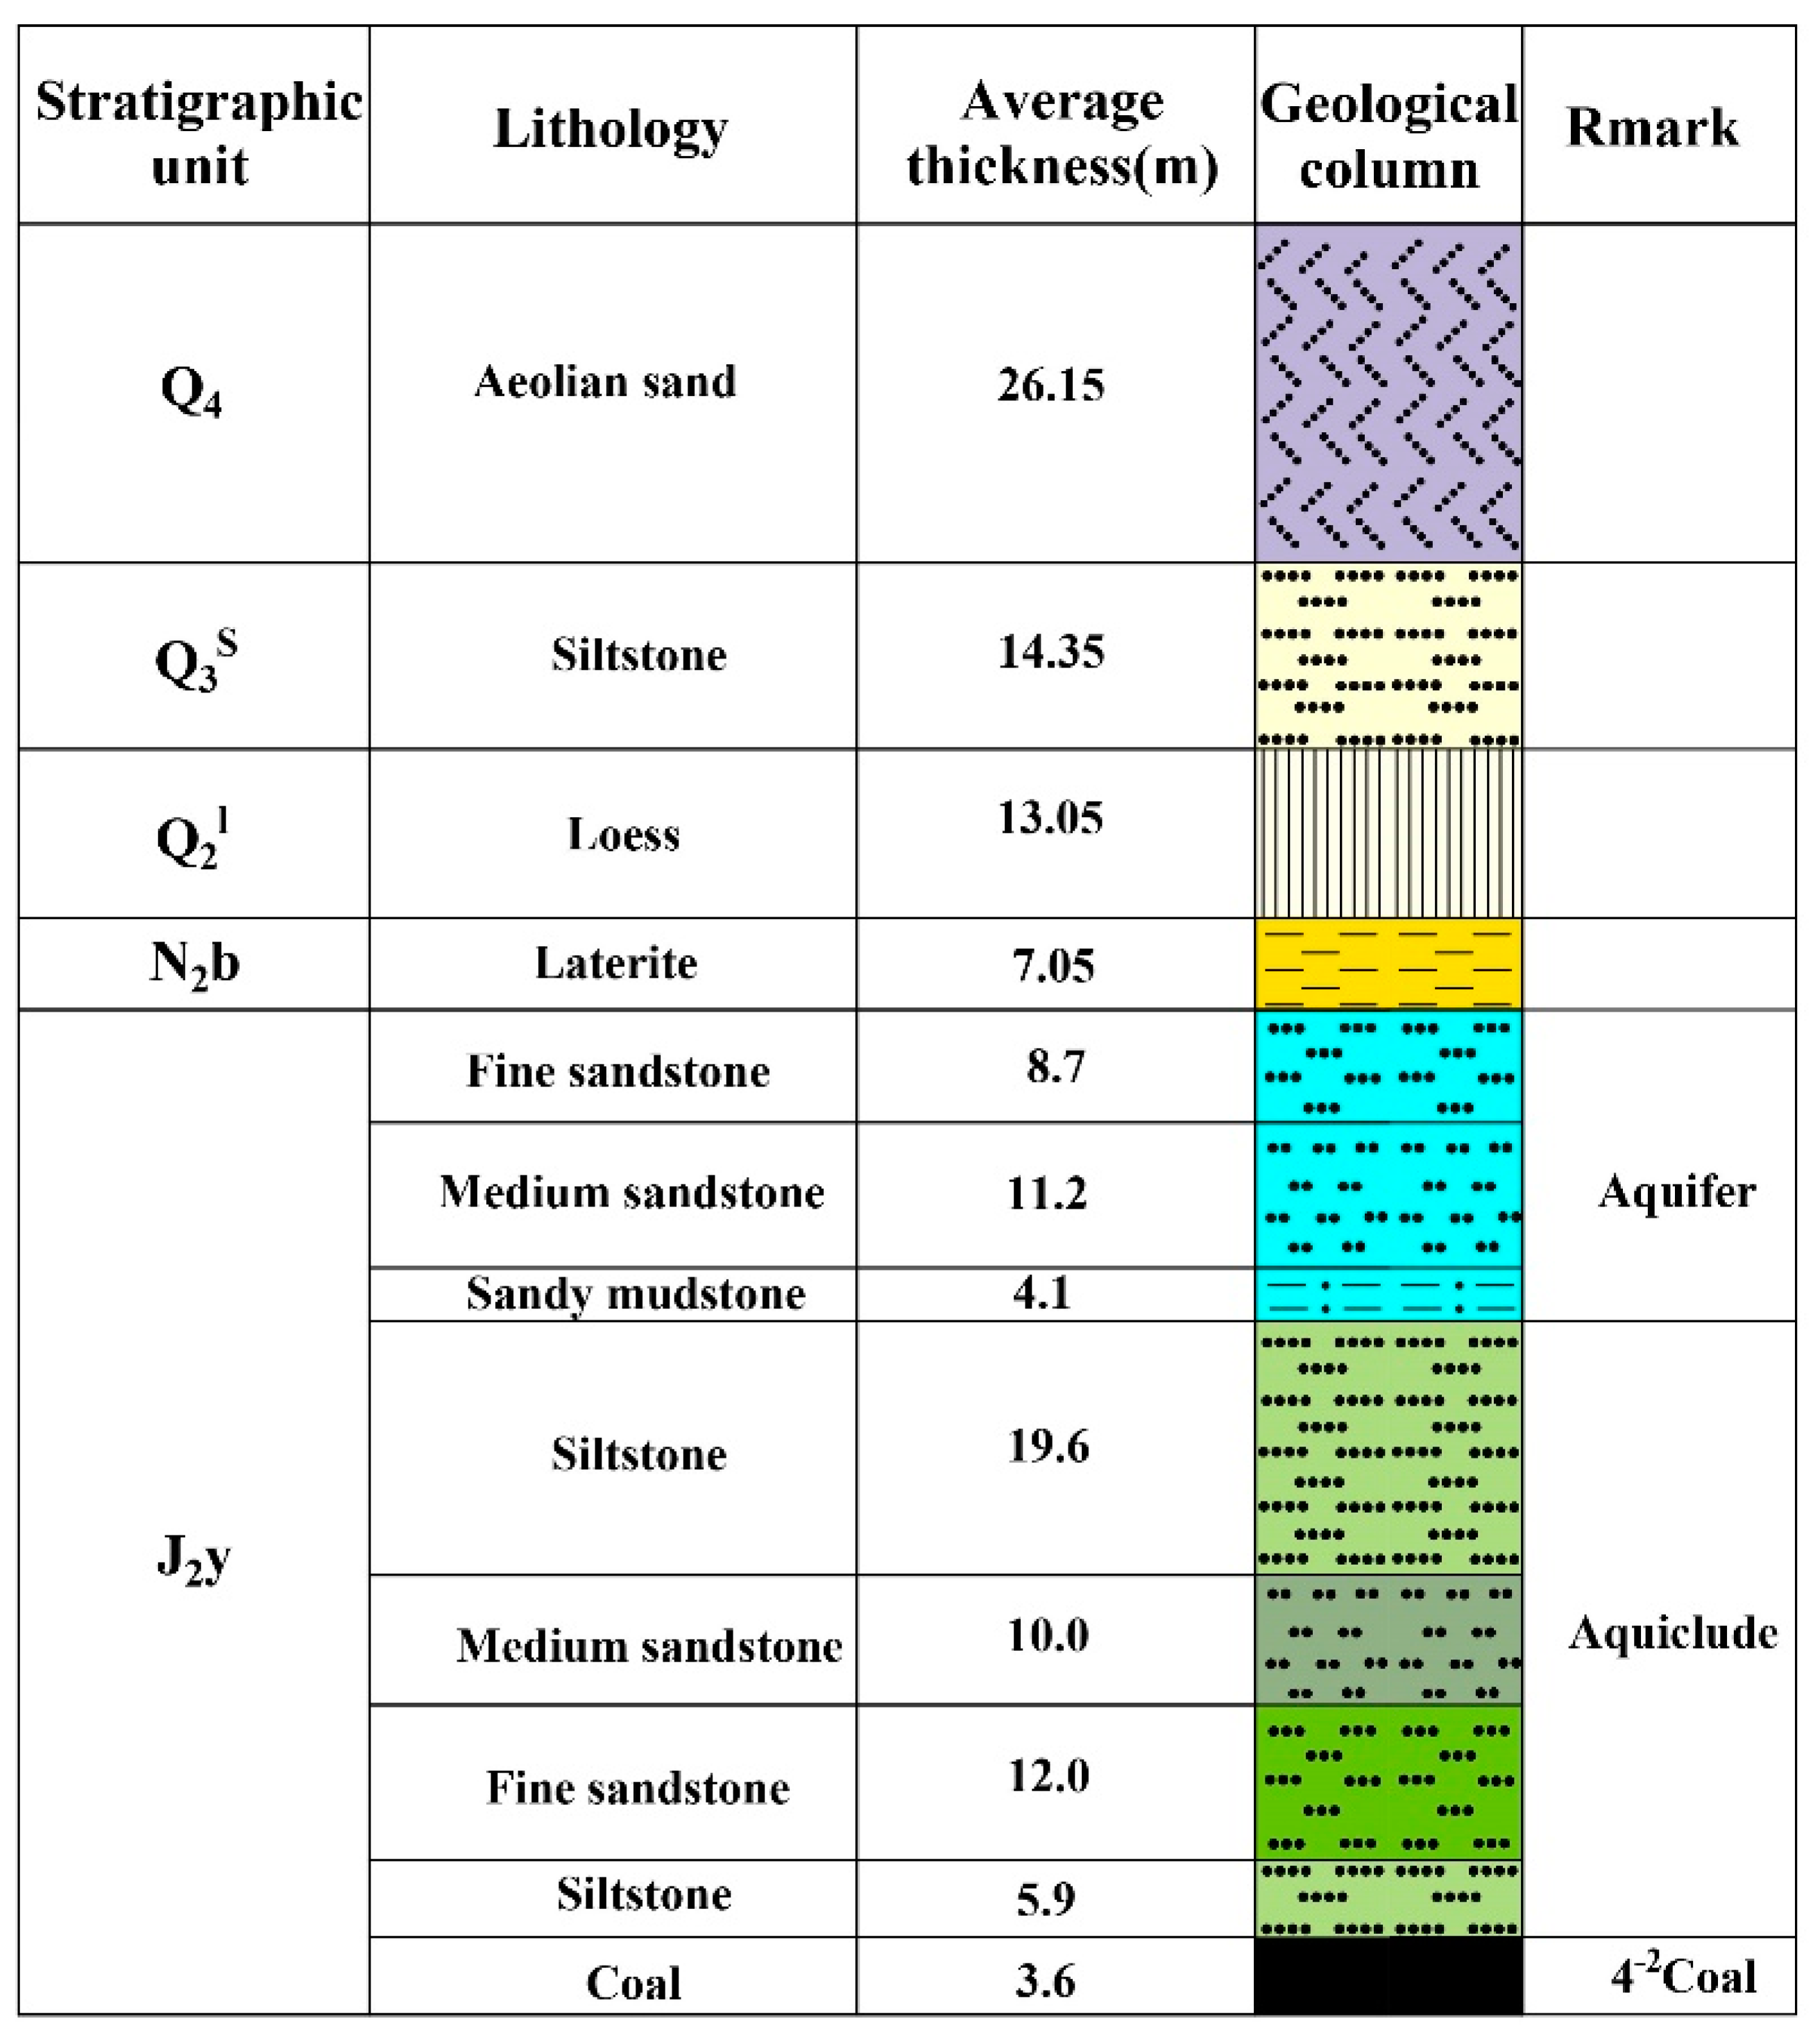
2. Study Area
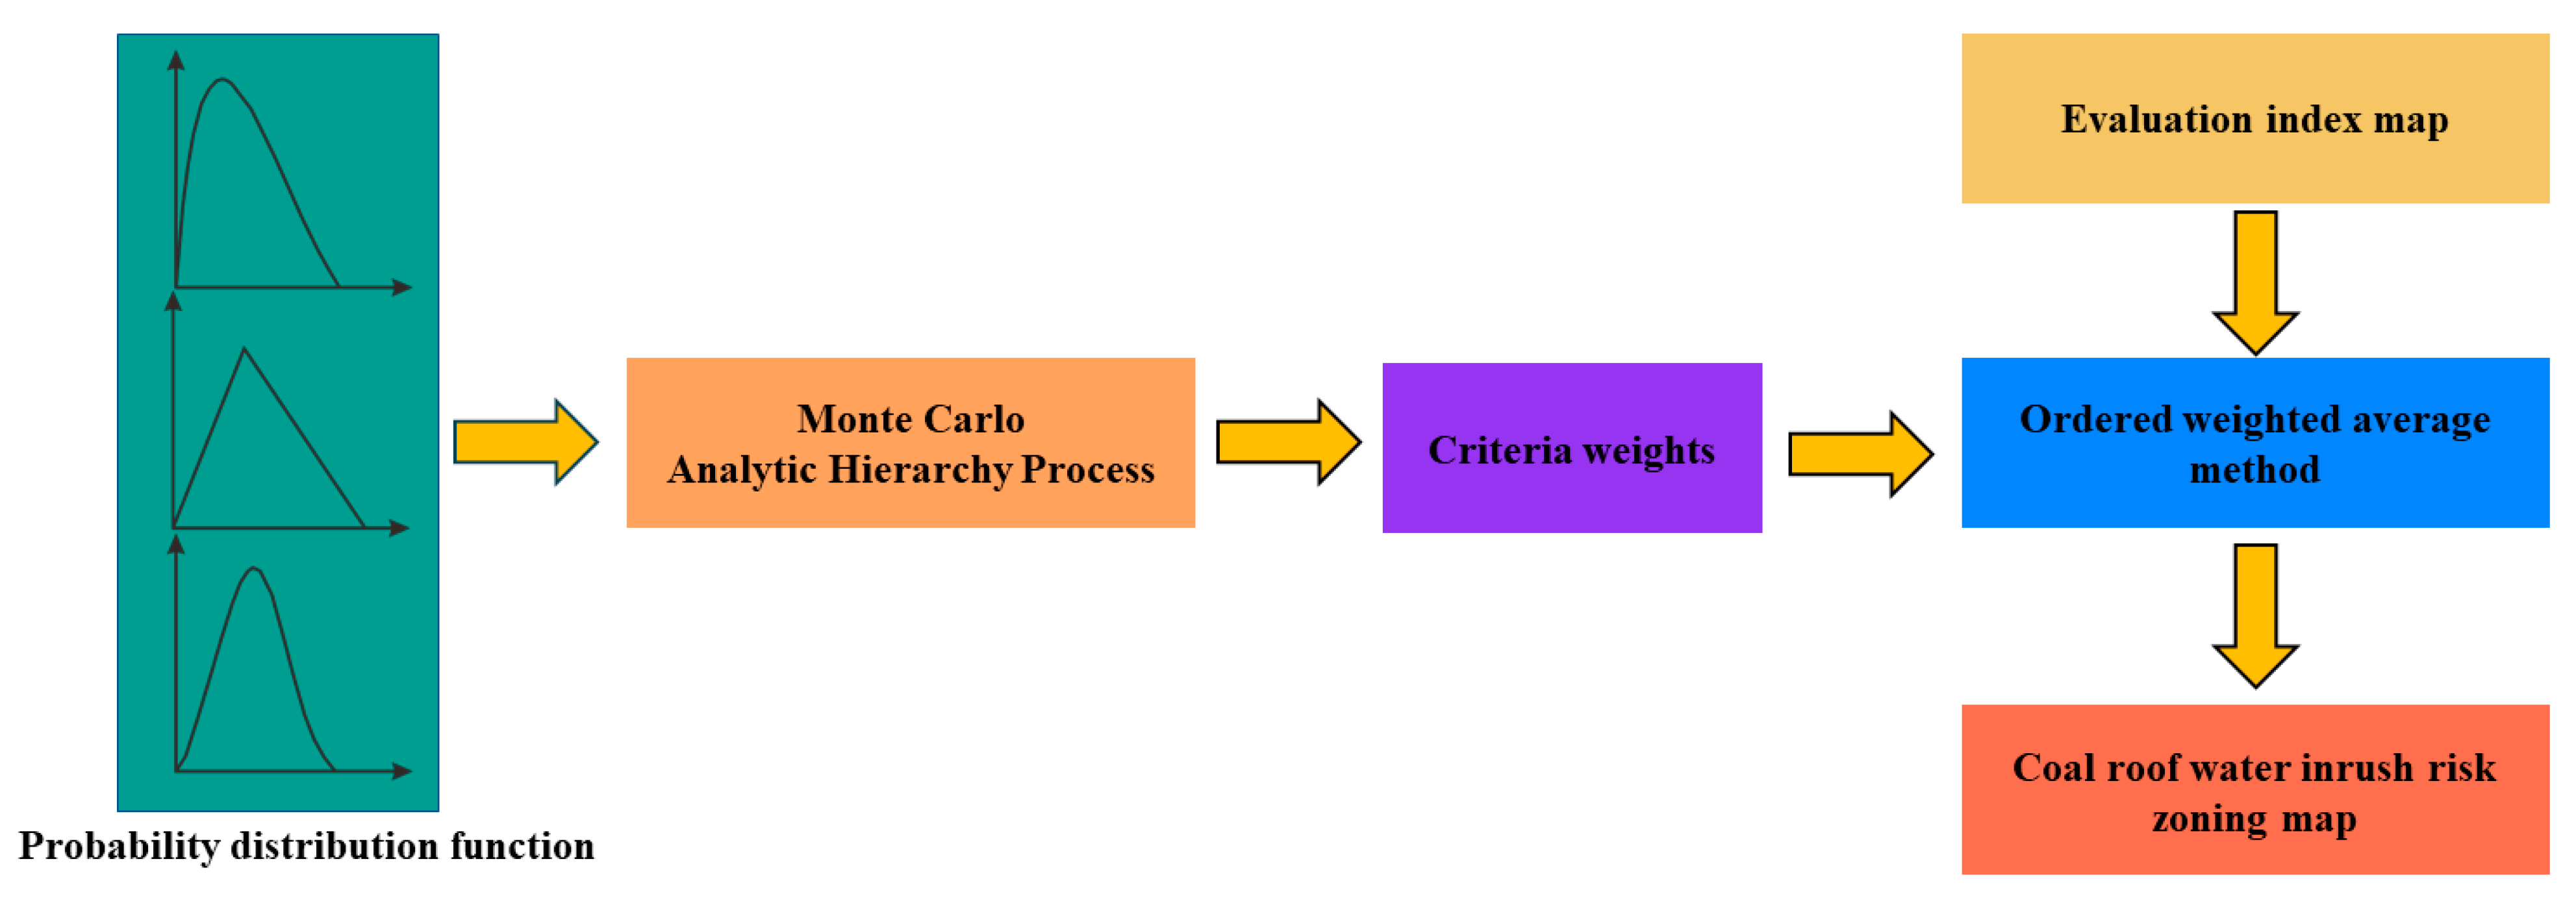
3. Probabilistic Spatial Multicriteria Analysis Method
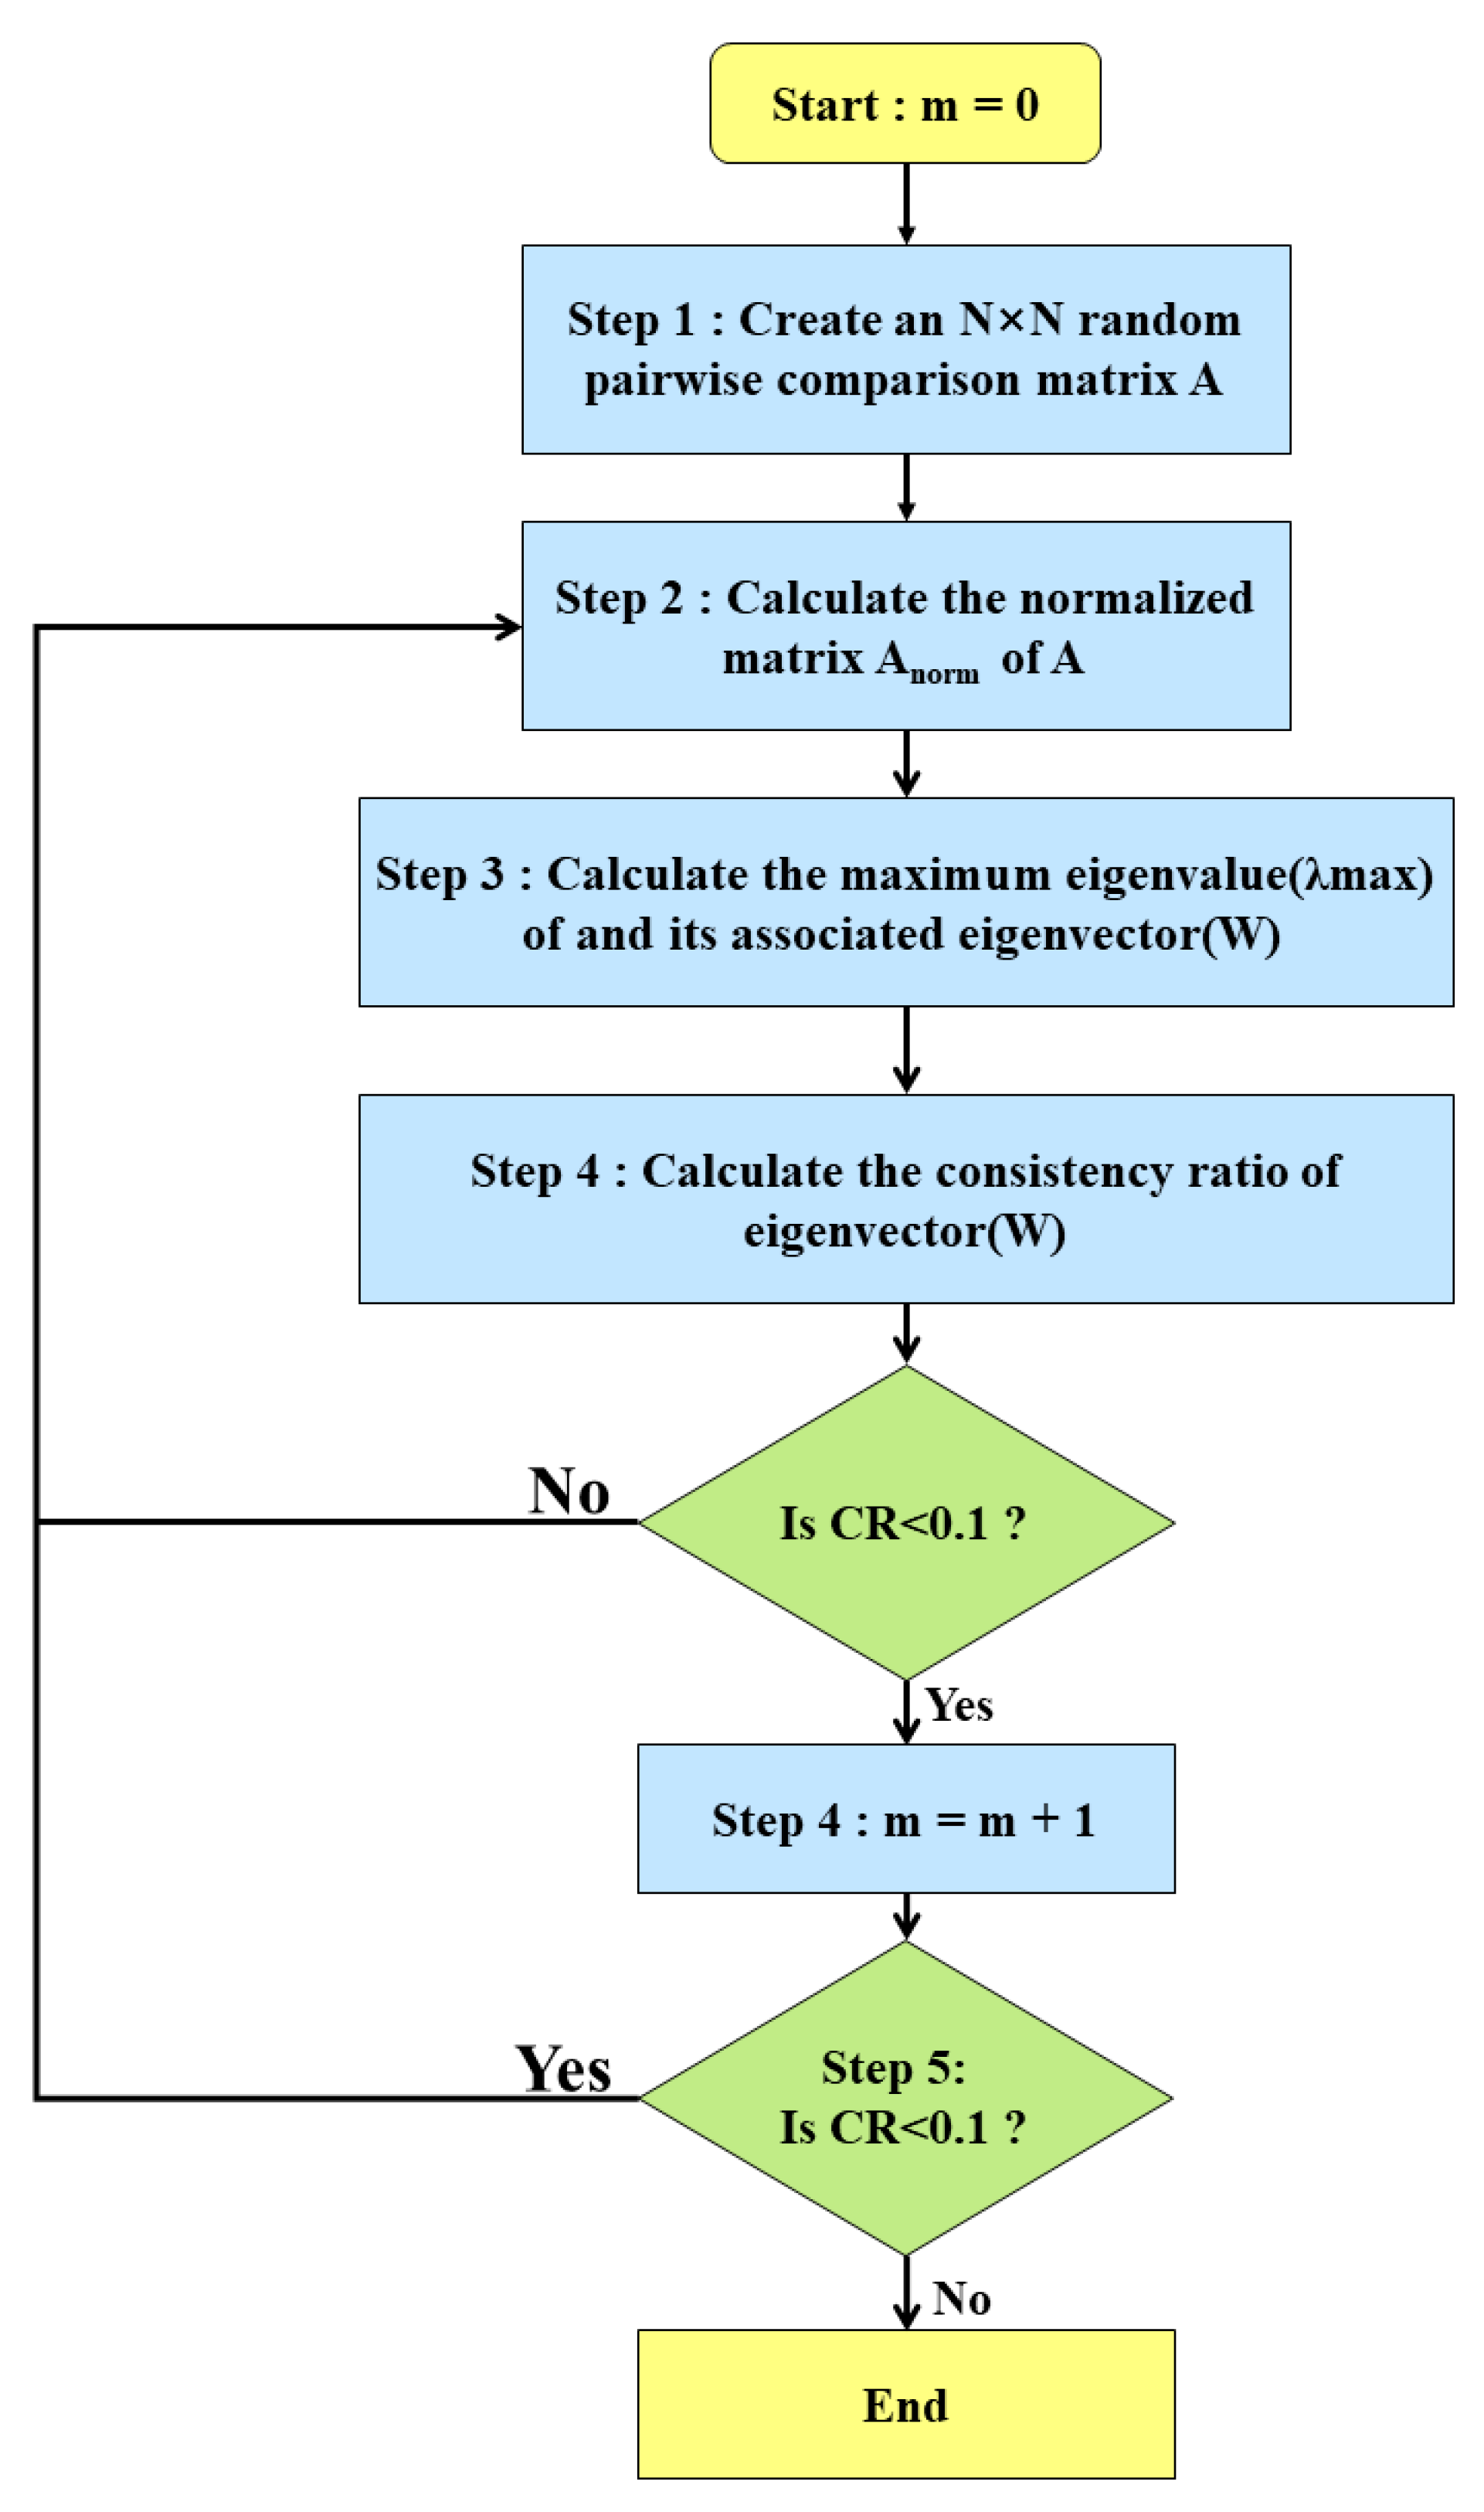
3.1. Monte Carlo Analytical Hierarchy Process (MAHP)
- (1)
- Experts are required to use an accurate numerical value to describe the relative importance between criteria, but it is often difficult to give a precise numerical description.
- (2)
- The unbalanced criterion judgment scale is used to quantify the relative importance of the criteria.
- (3)
- When the relative importance of multiple criteria is very close, it is impossible to determine which criterion is the most important.
- (4)
- The various possibilities of the relative importance of each element criterion in the pairwise judgment matrix are not fully examined.
3.2. Ordered Weighted Averaging (OWA)
4. Results and Discussion
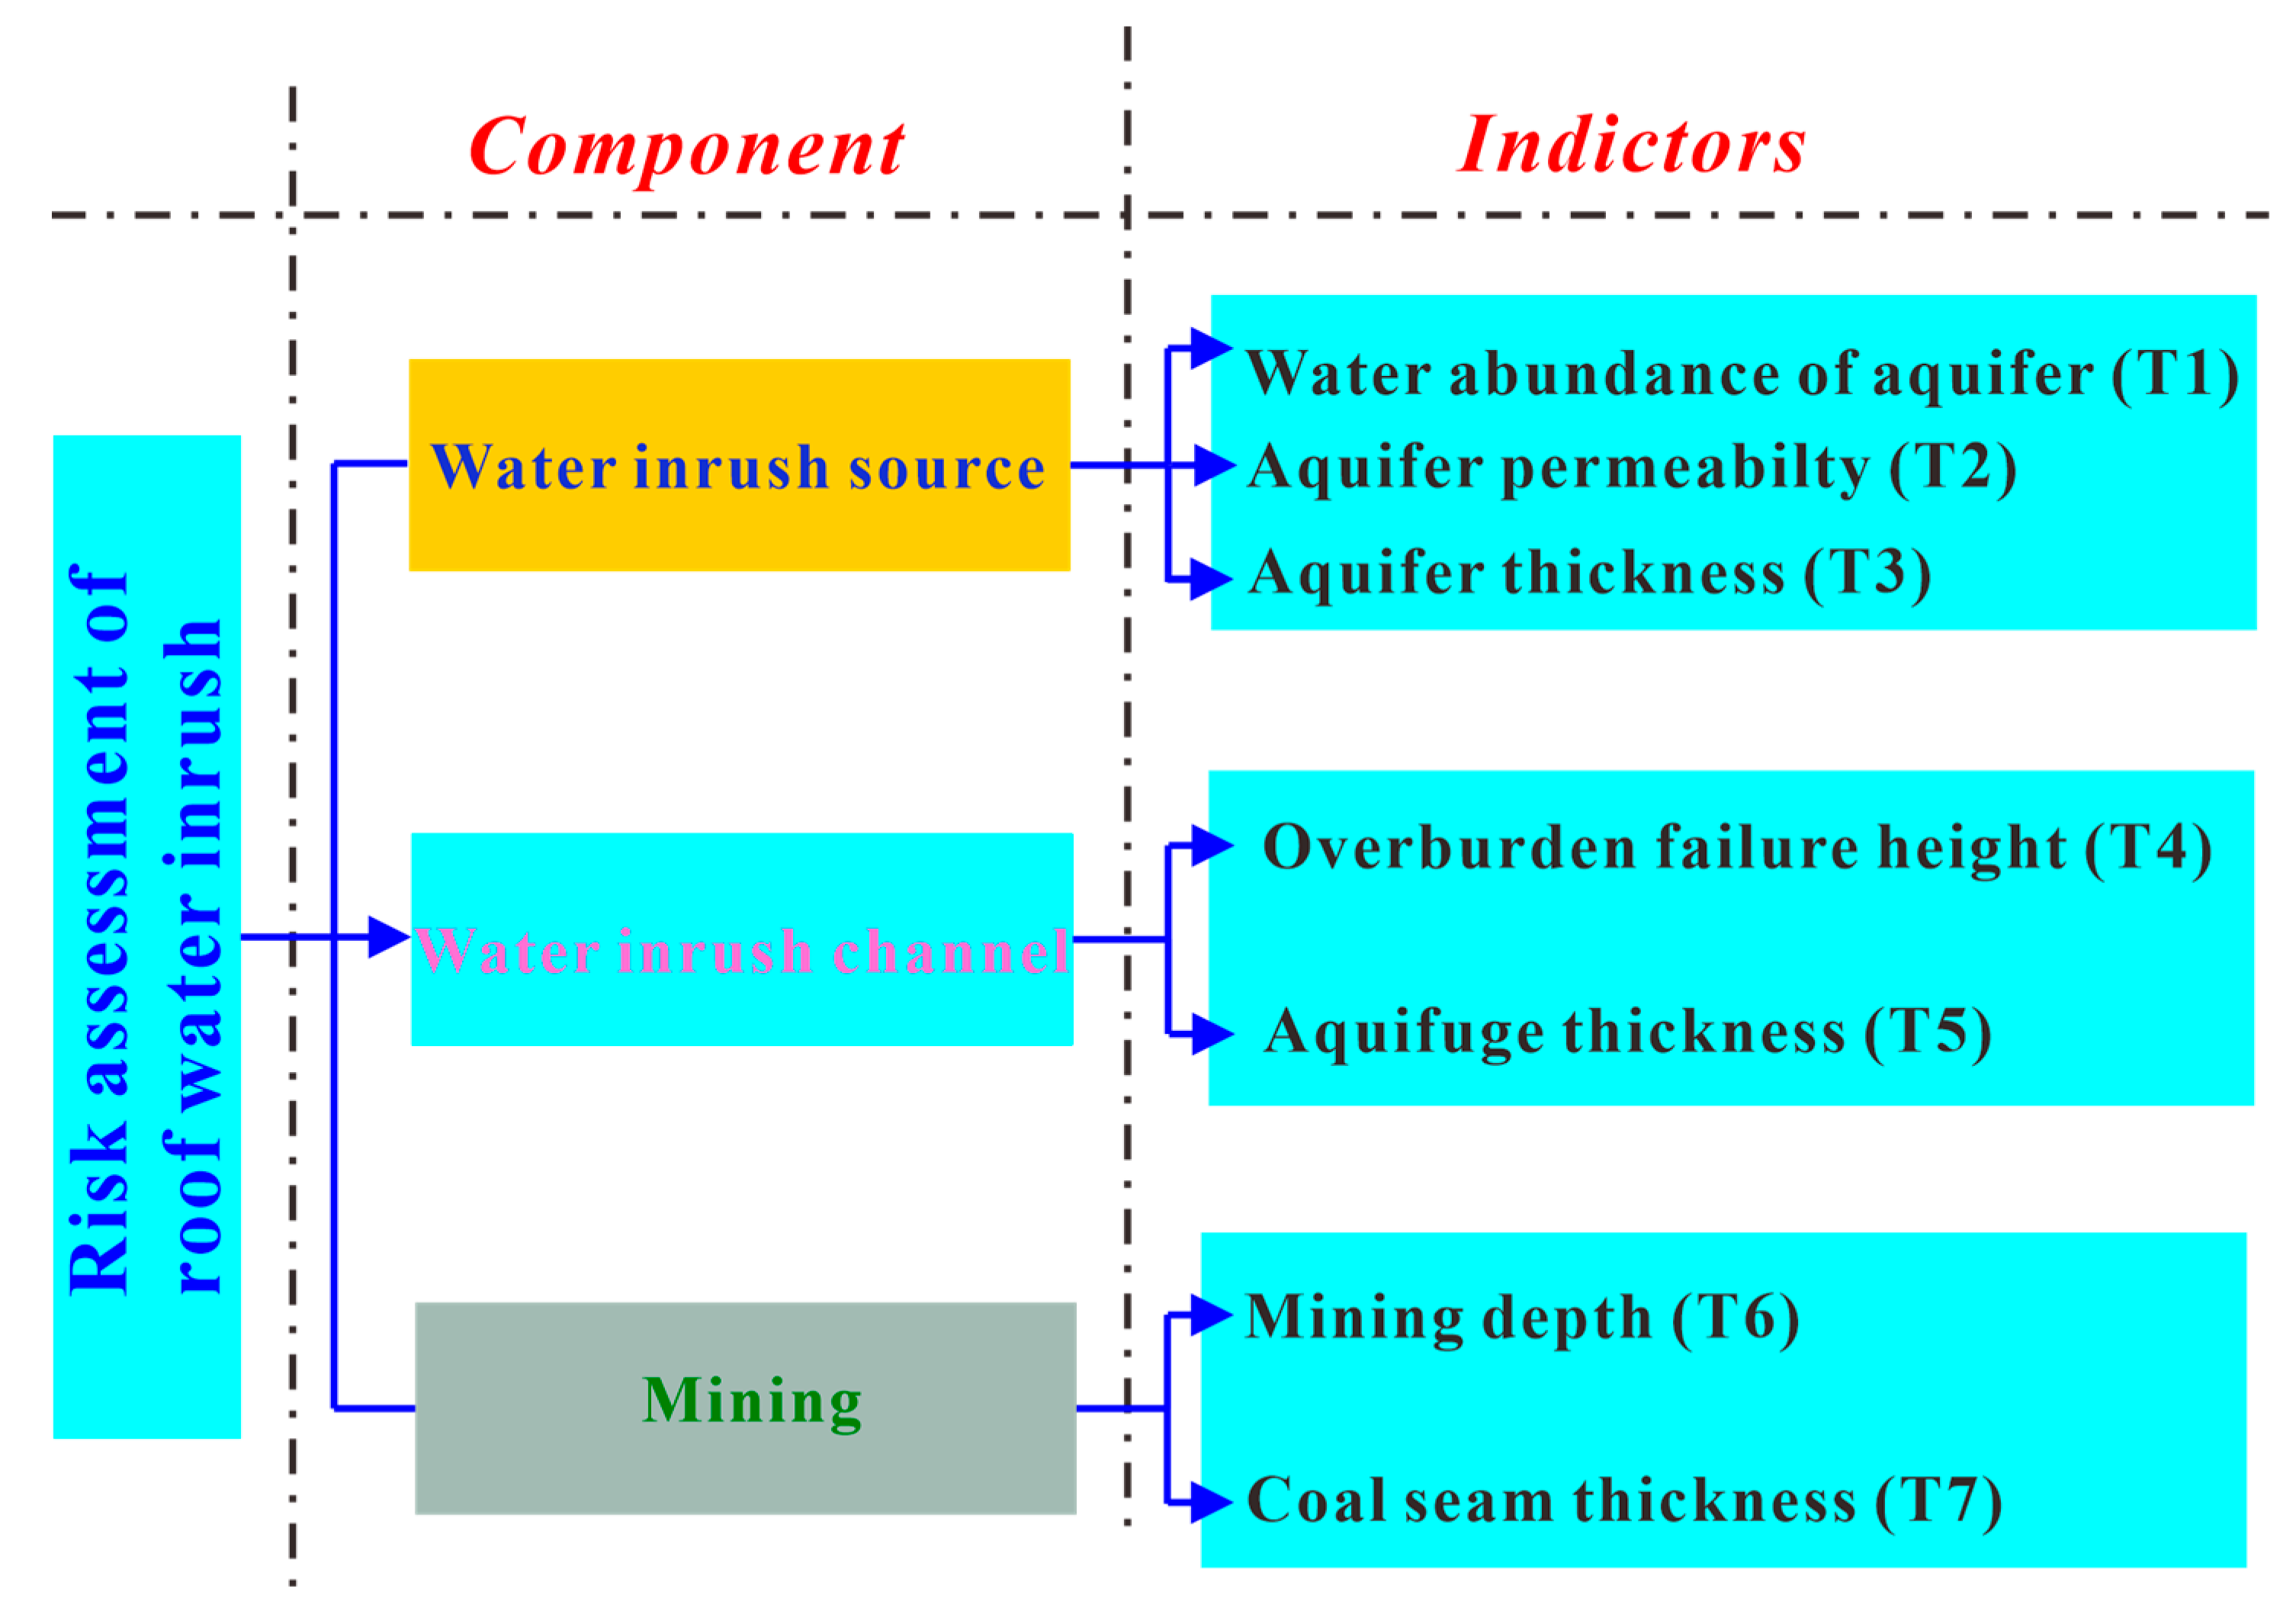
4.1. Determining Evaluation Criteria of Roof Water Inrush
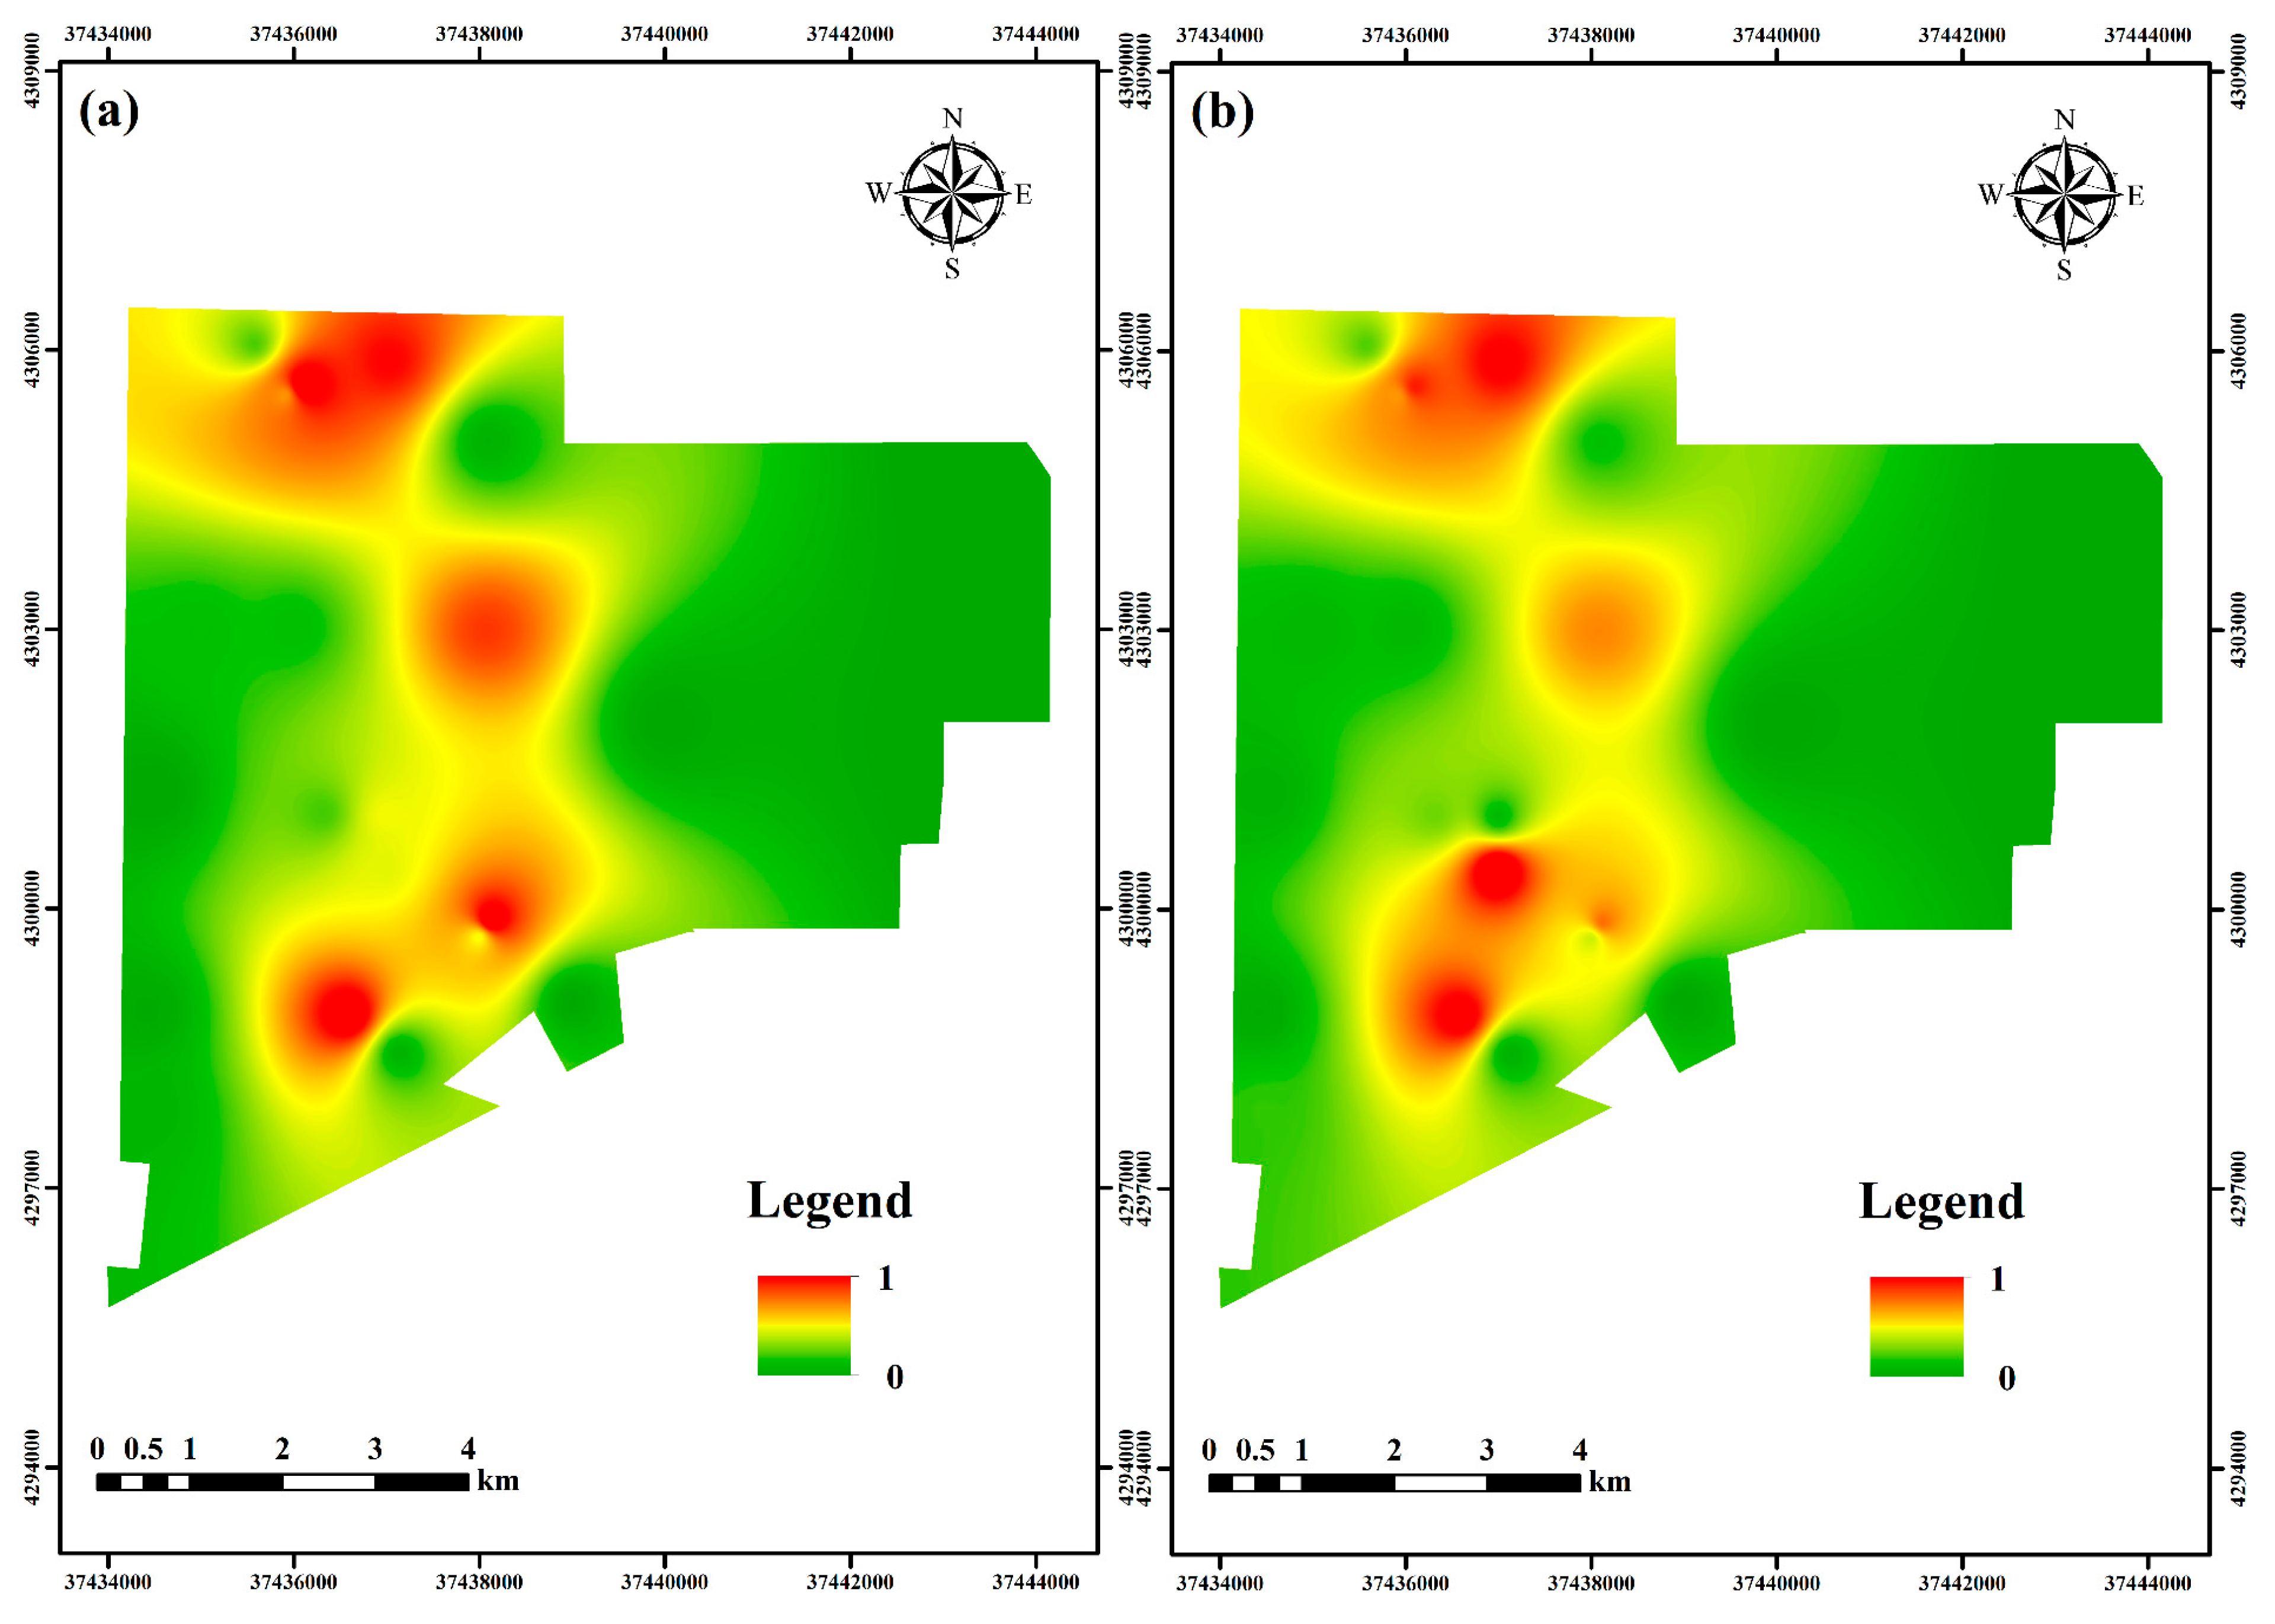
4.2. Standardization of Evaluation Criteria
4.3. Evaluation Criteria Weight
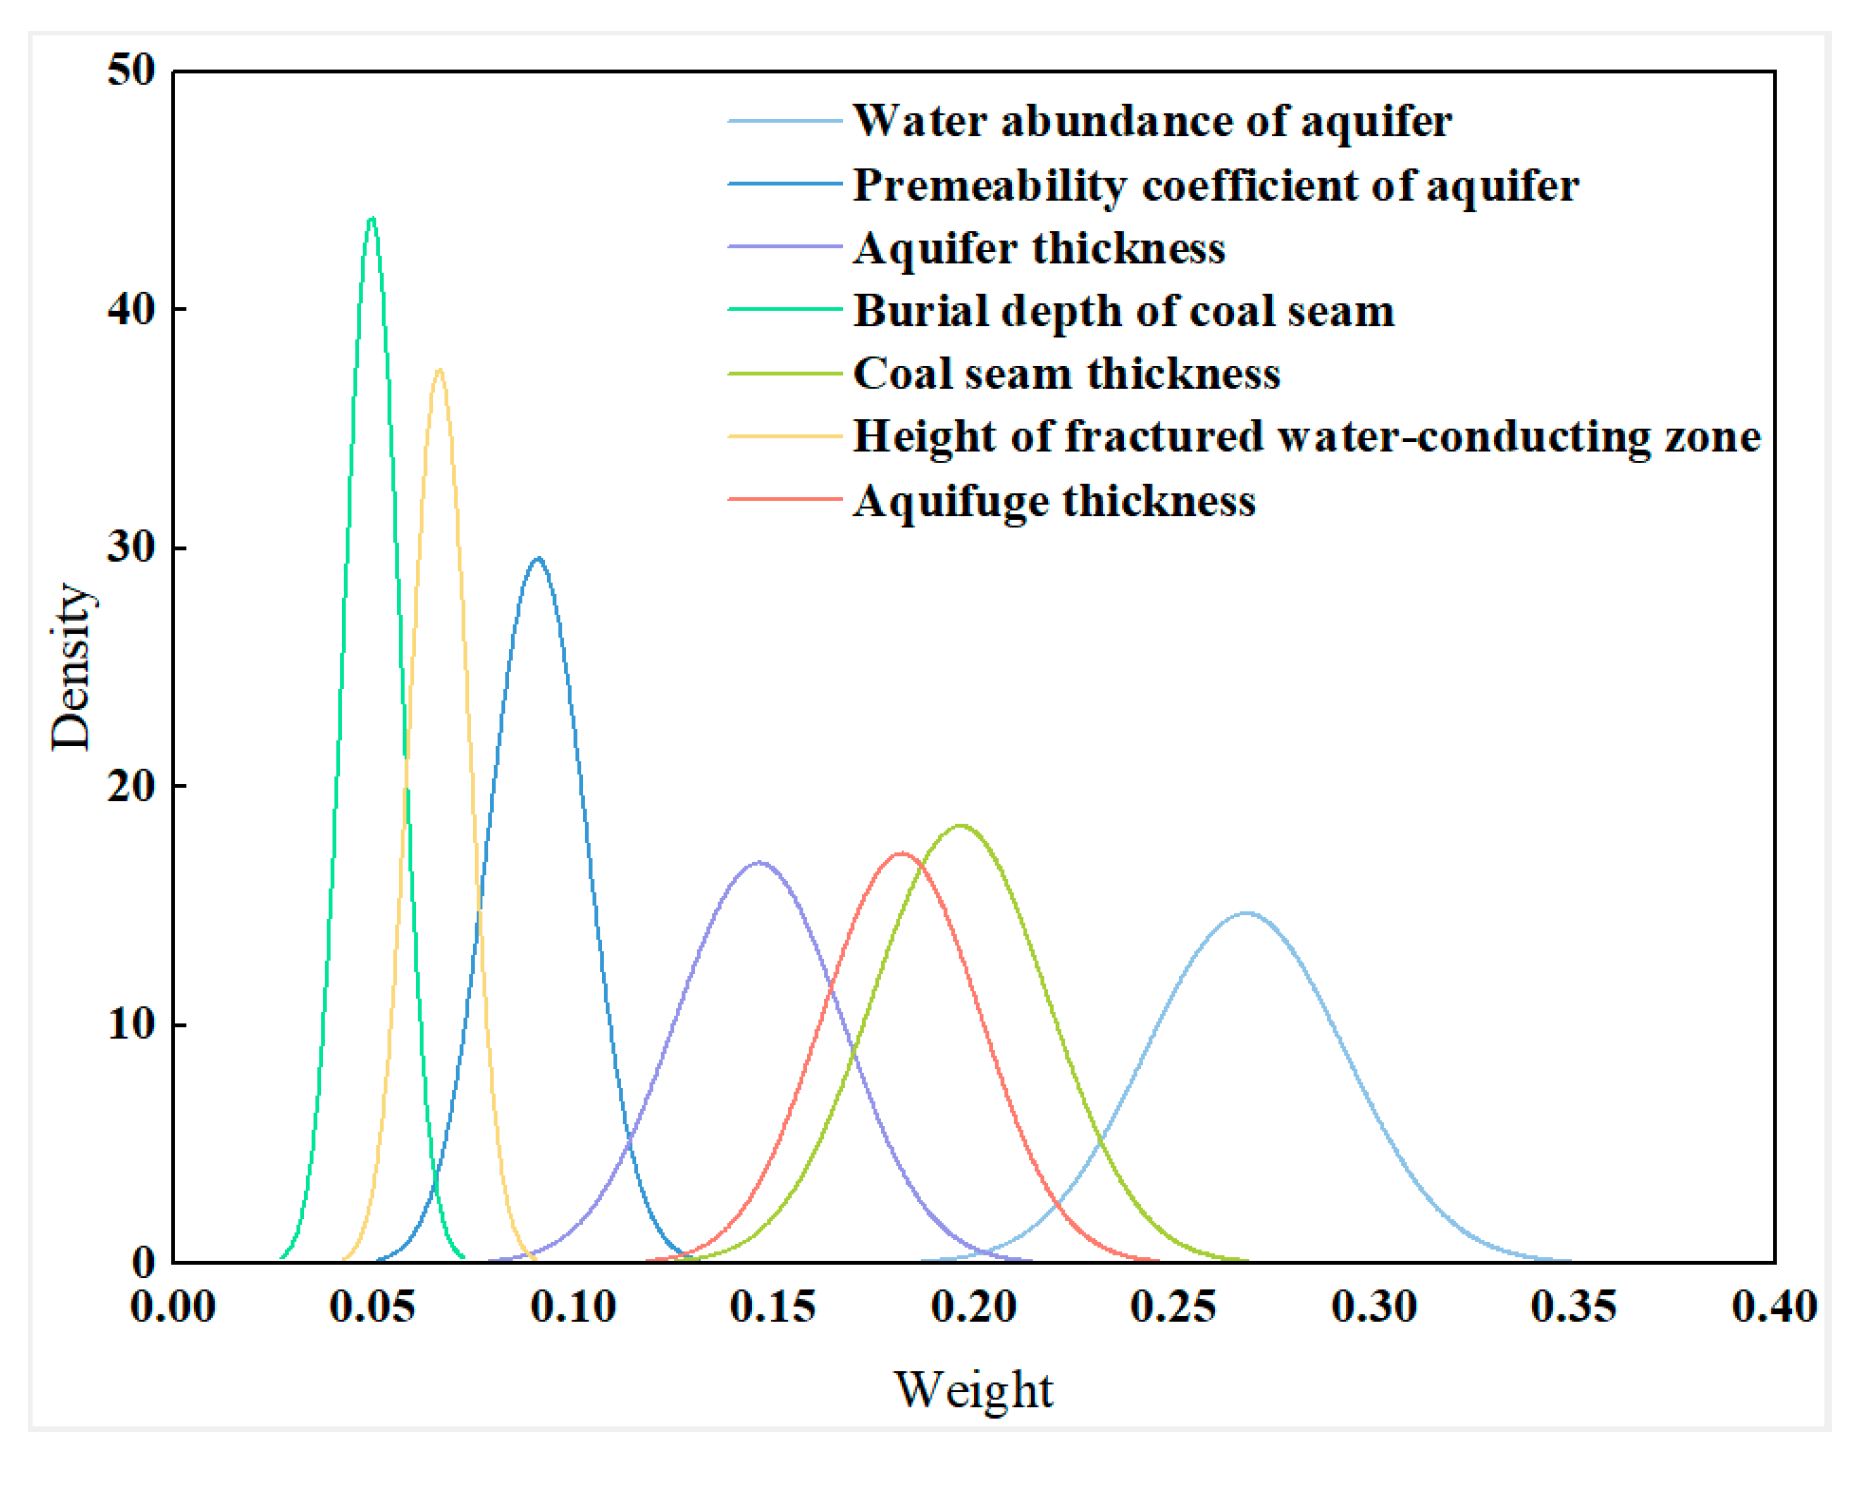
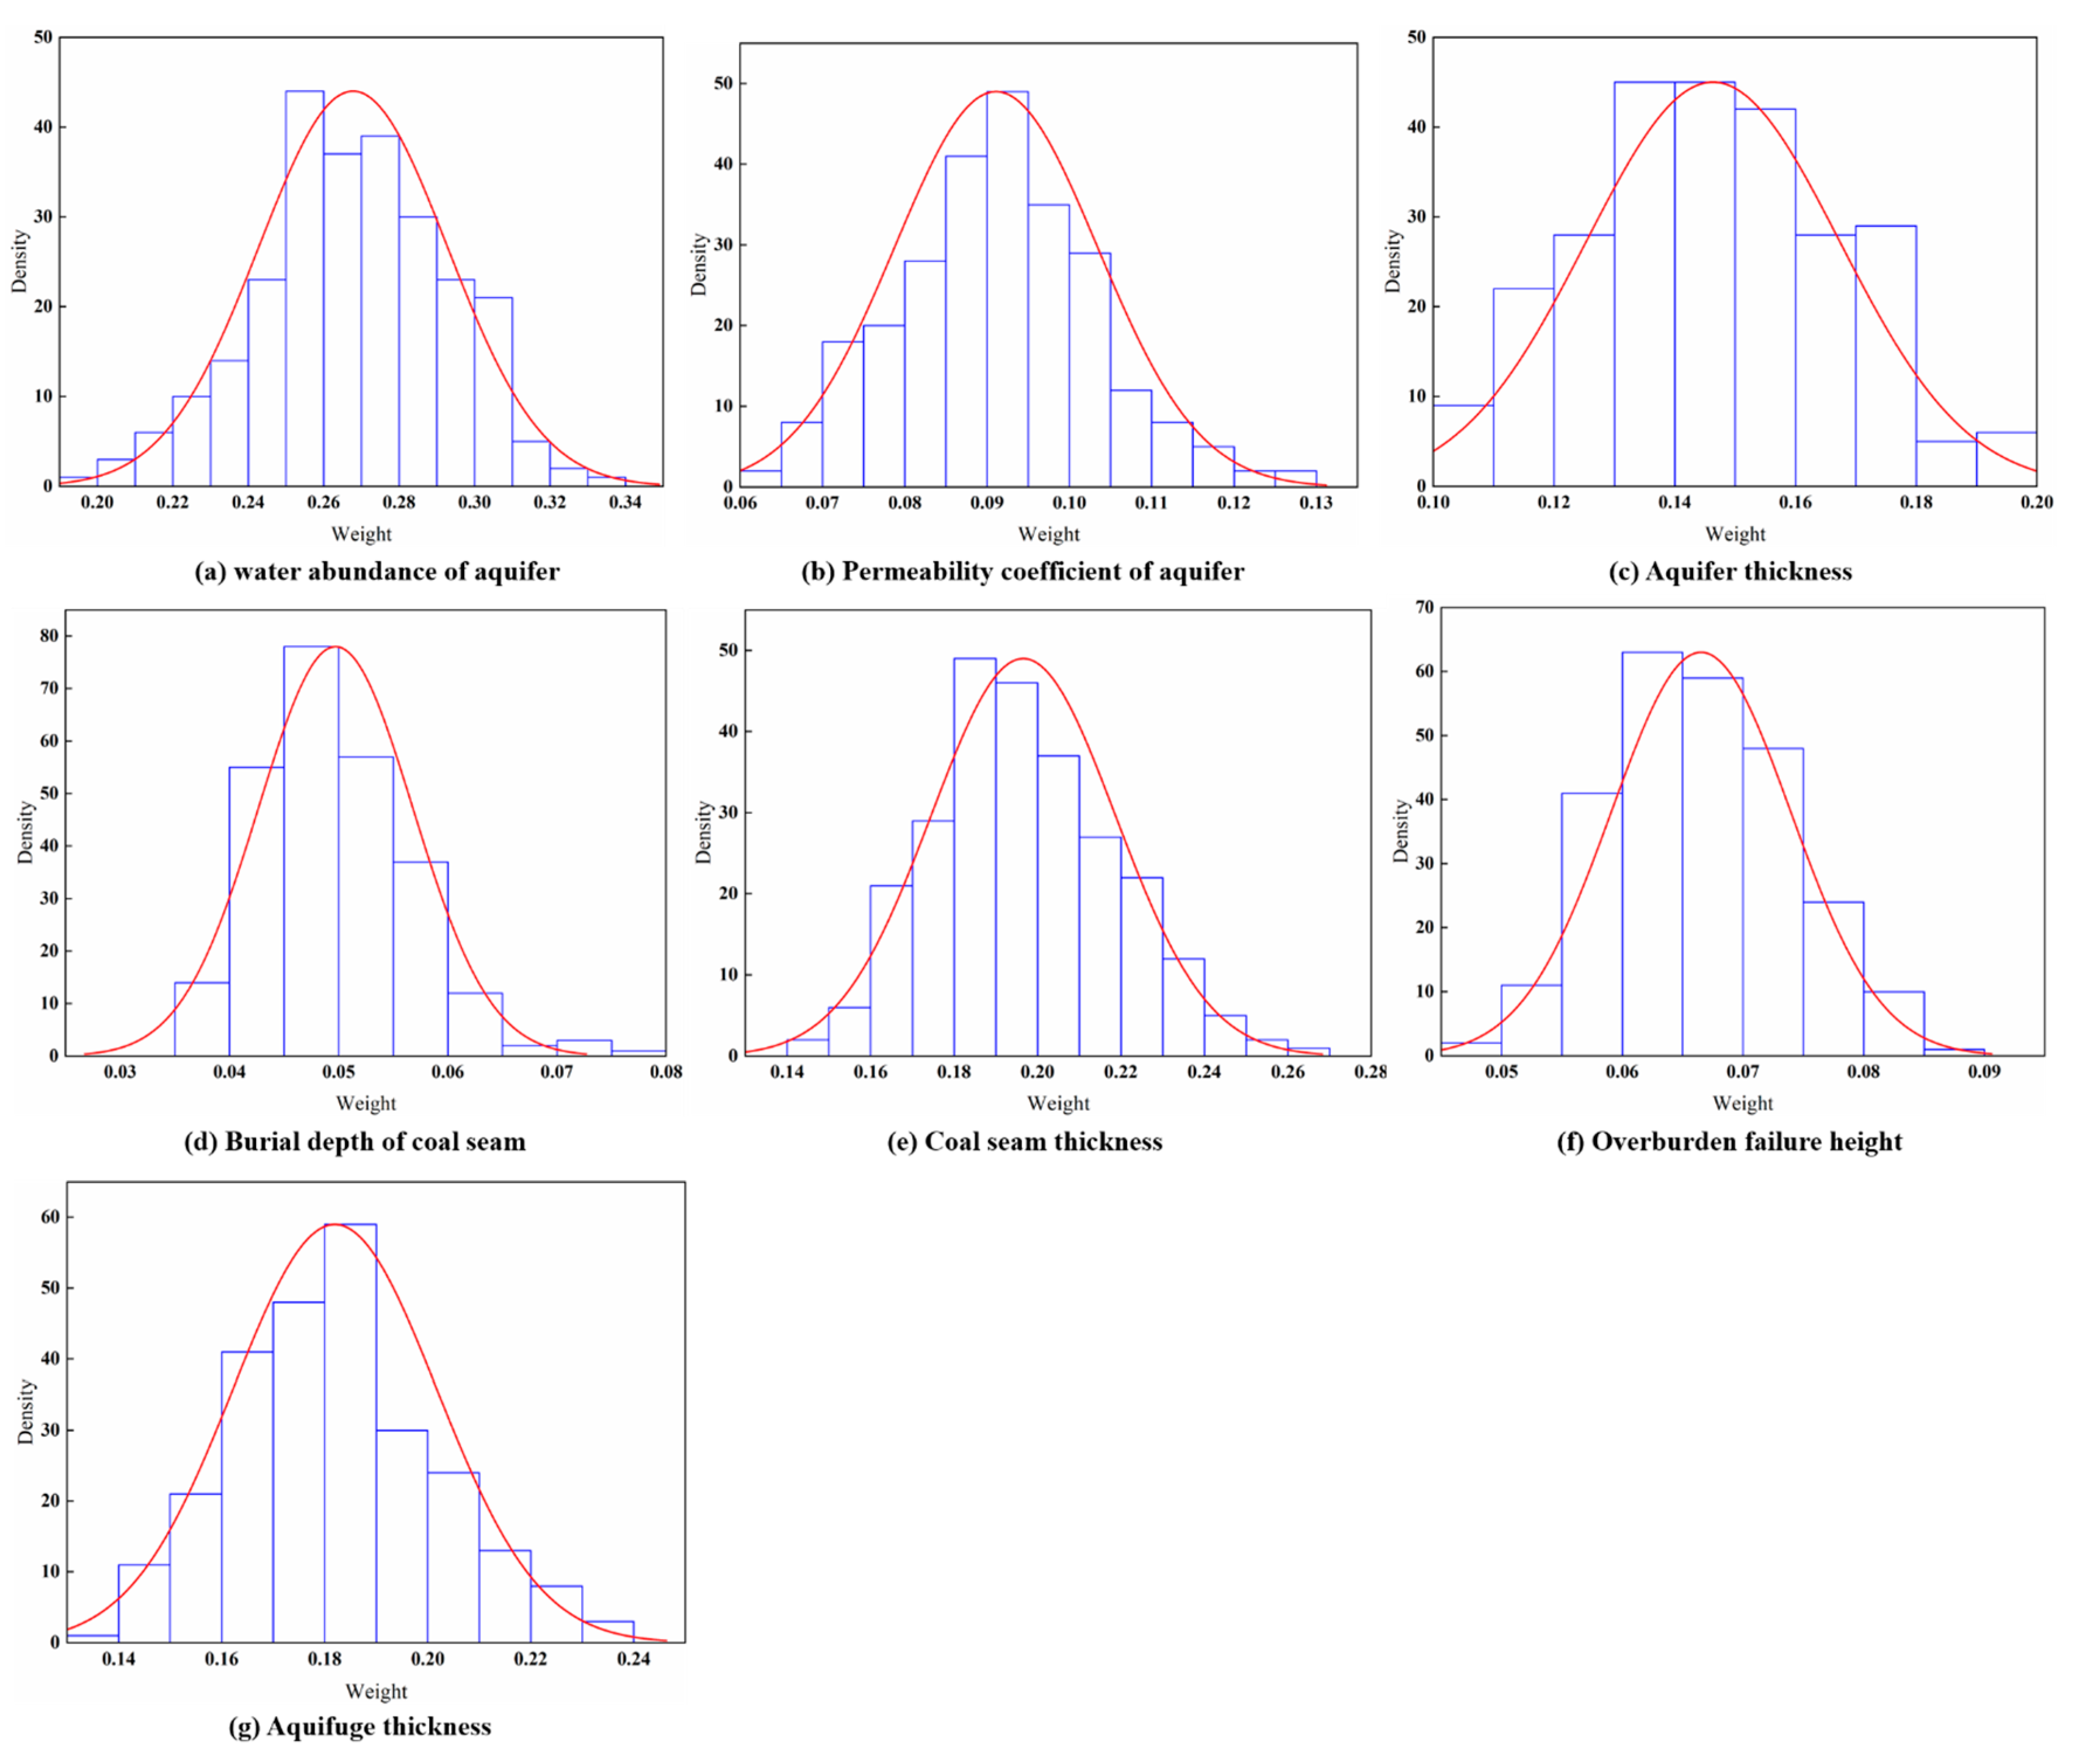
4.3.1. Criteria Weight
4.3.2. Order Weight
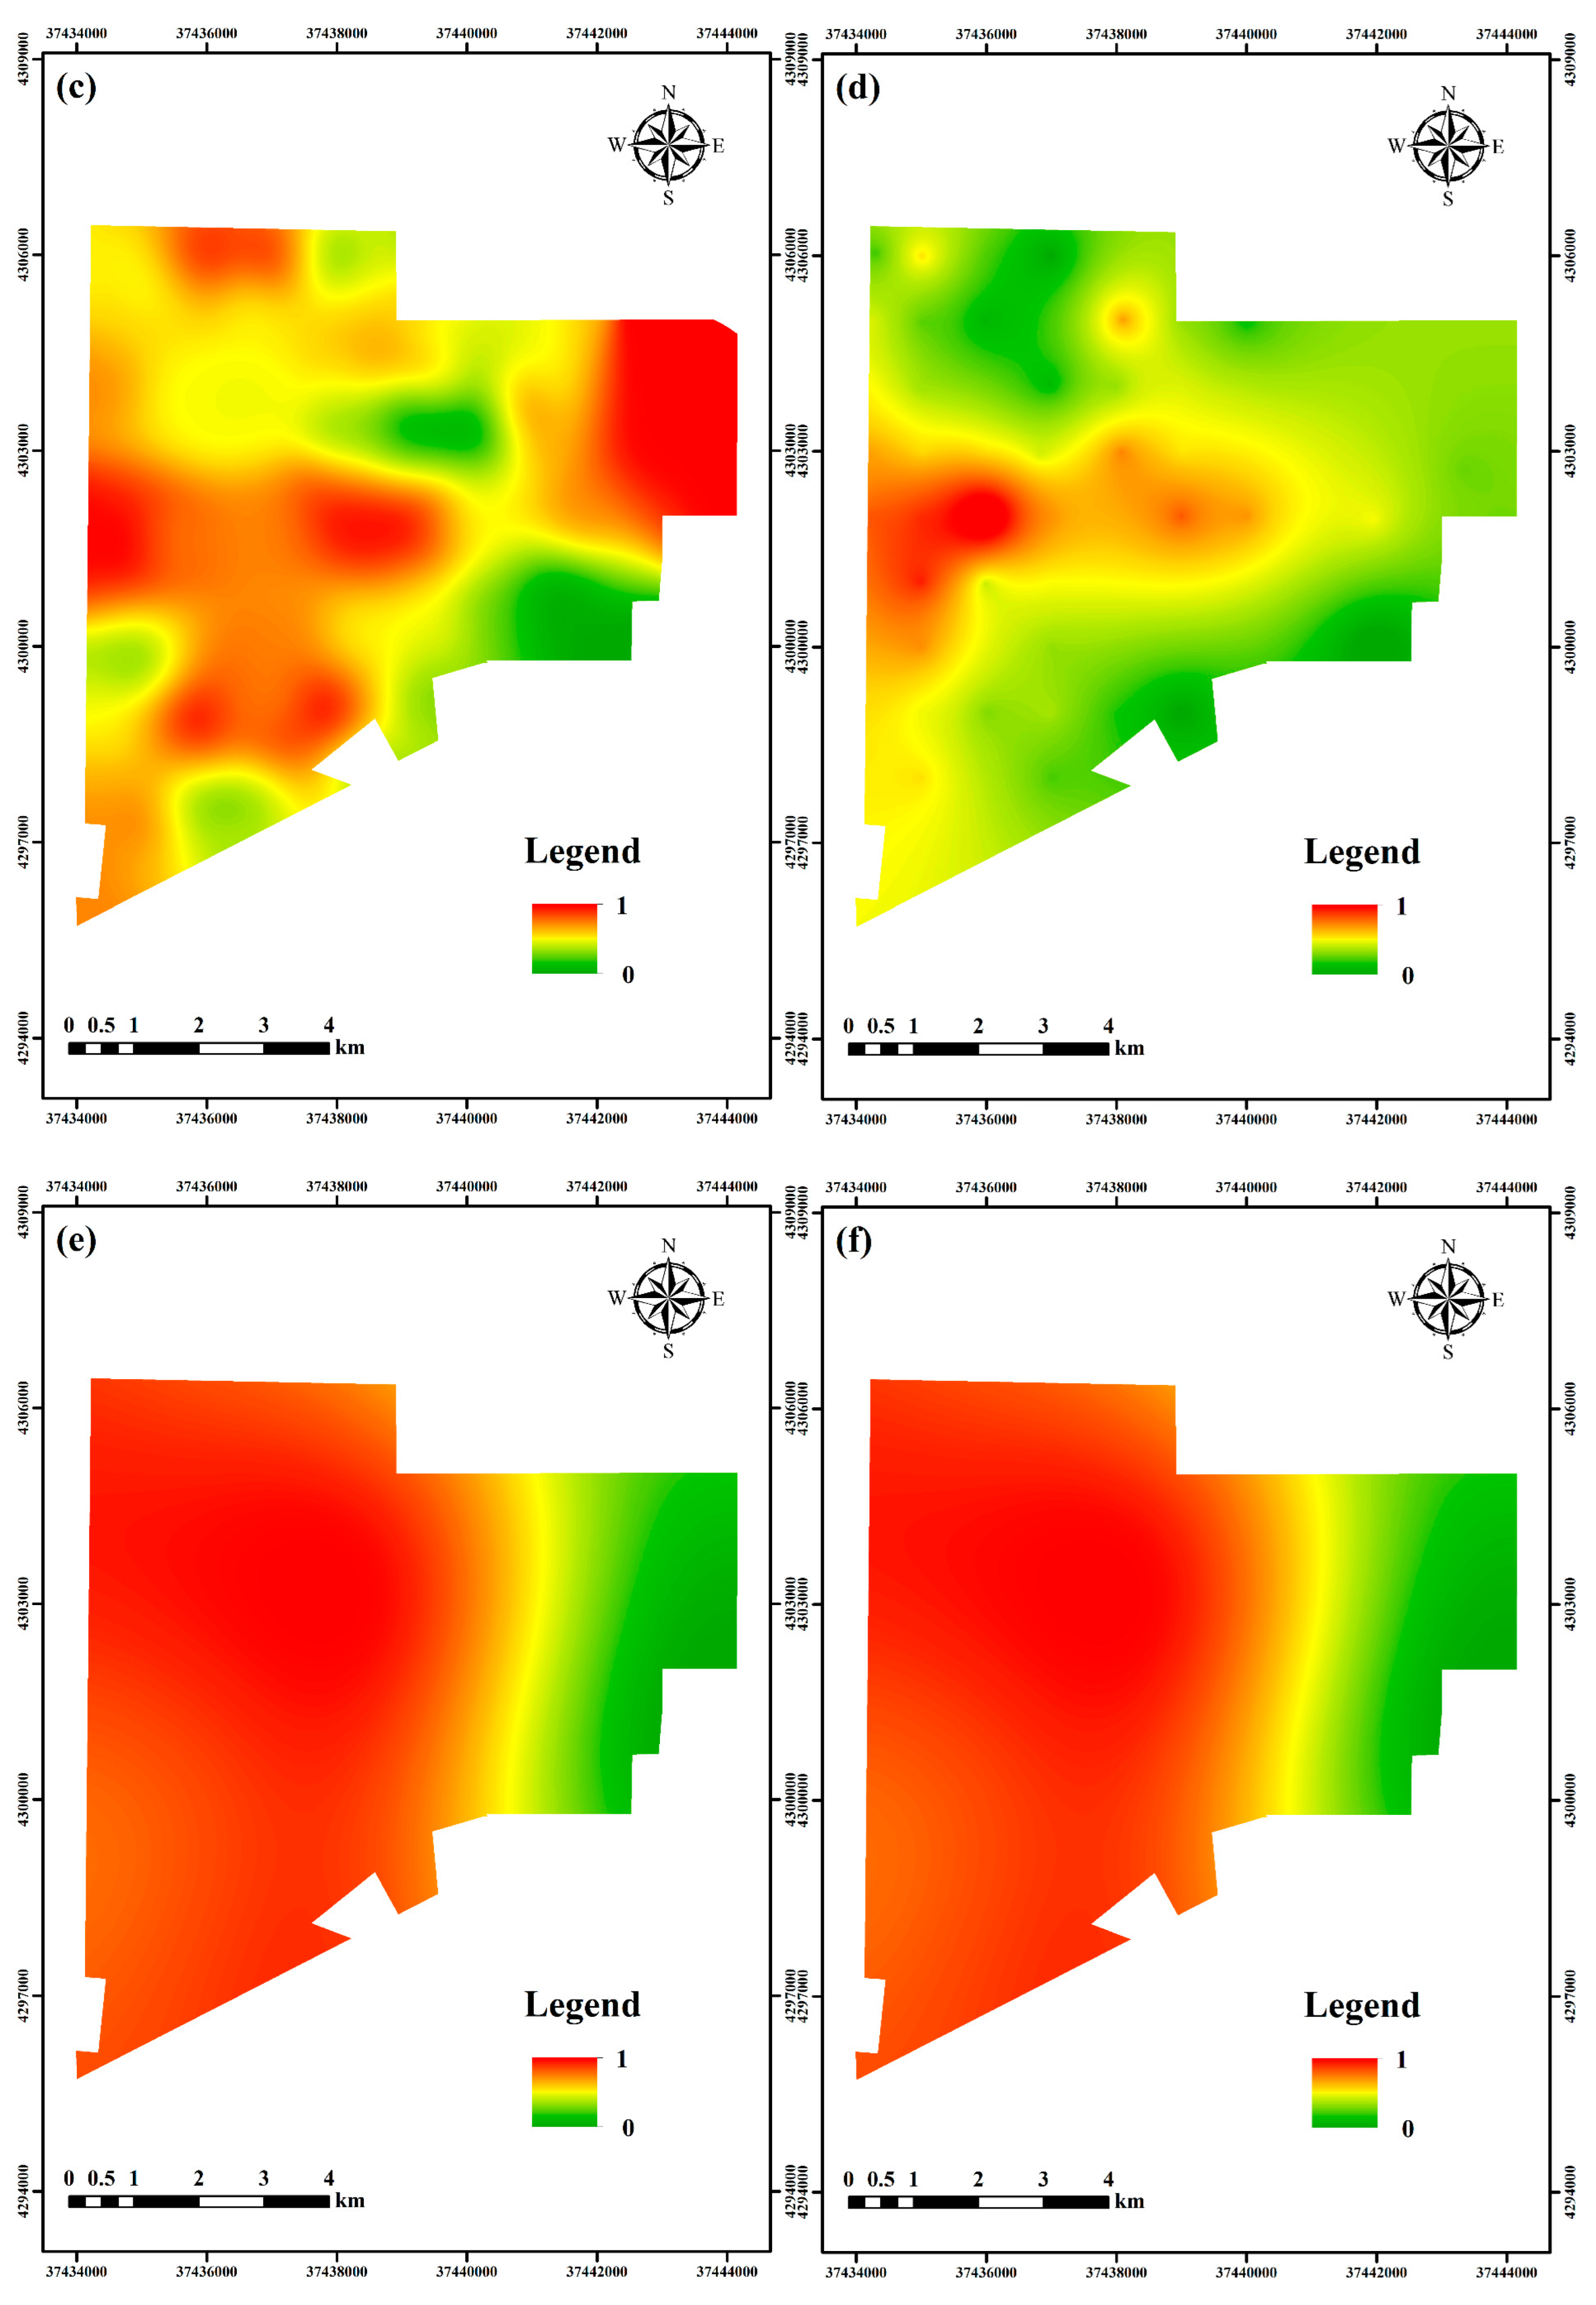
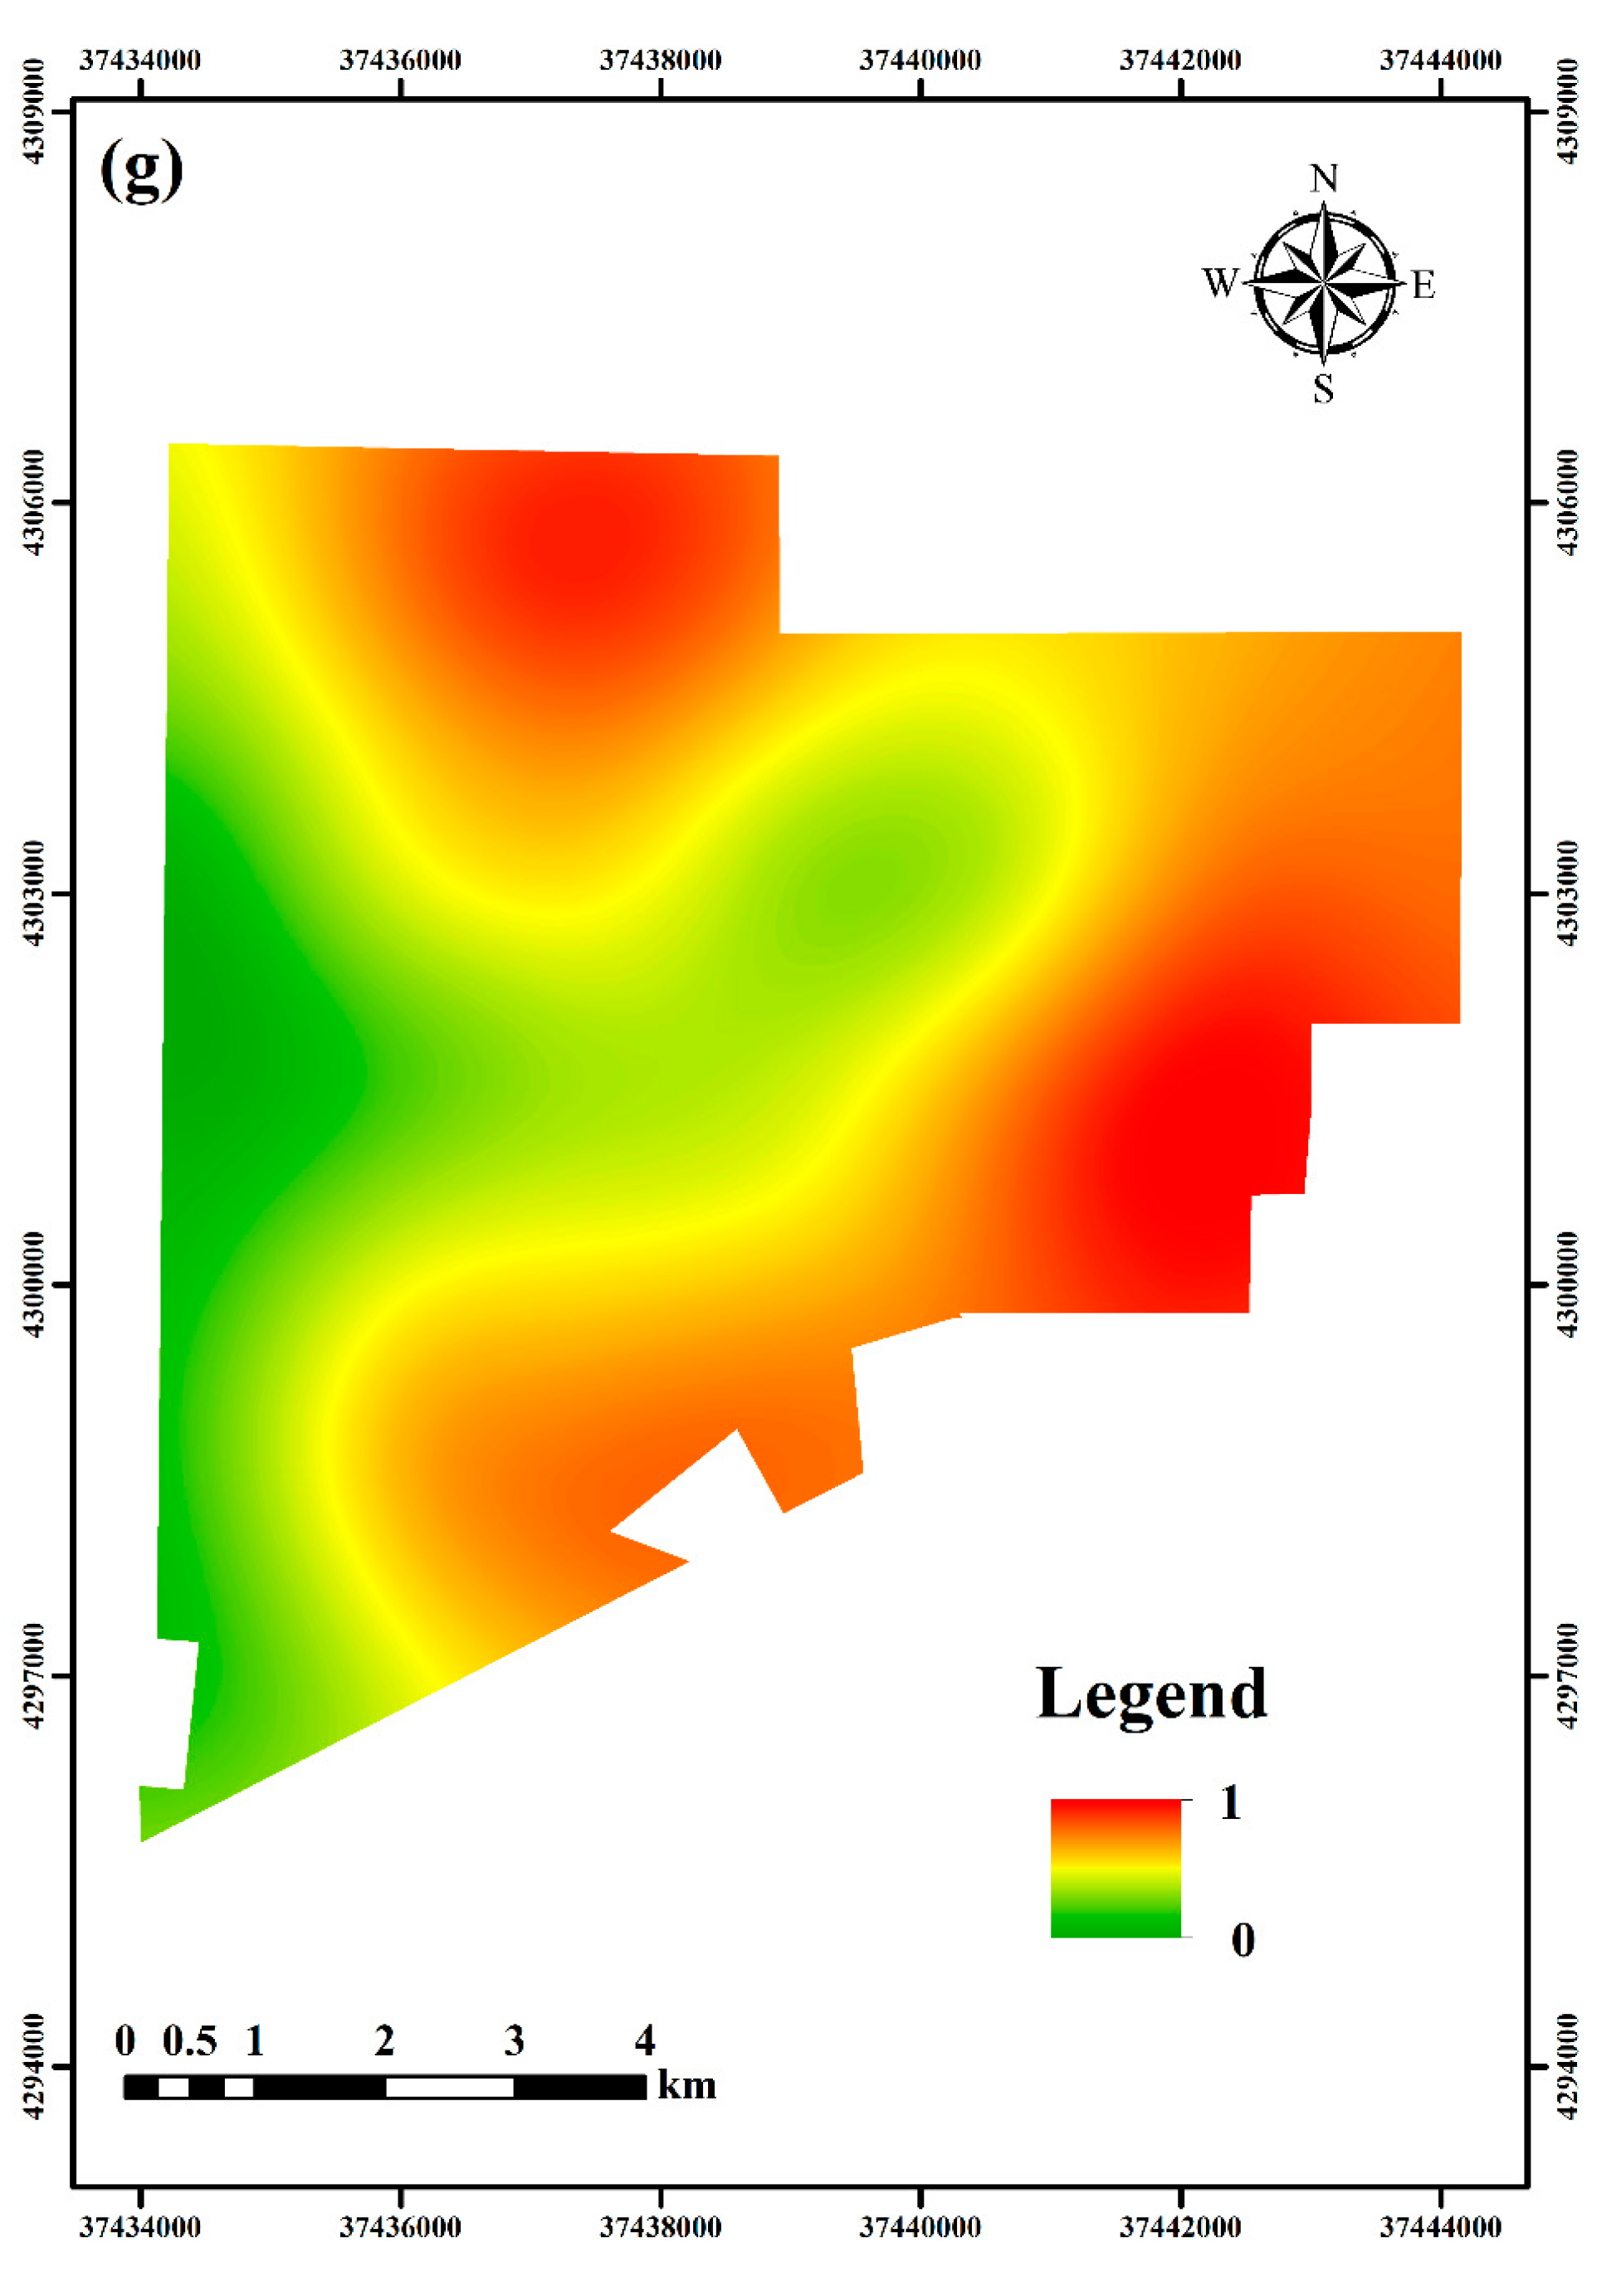
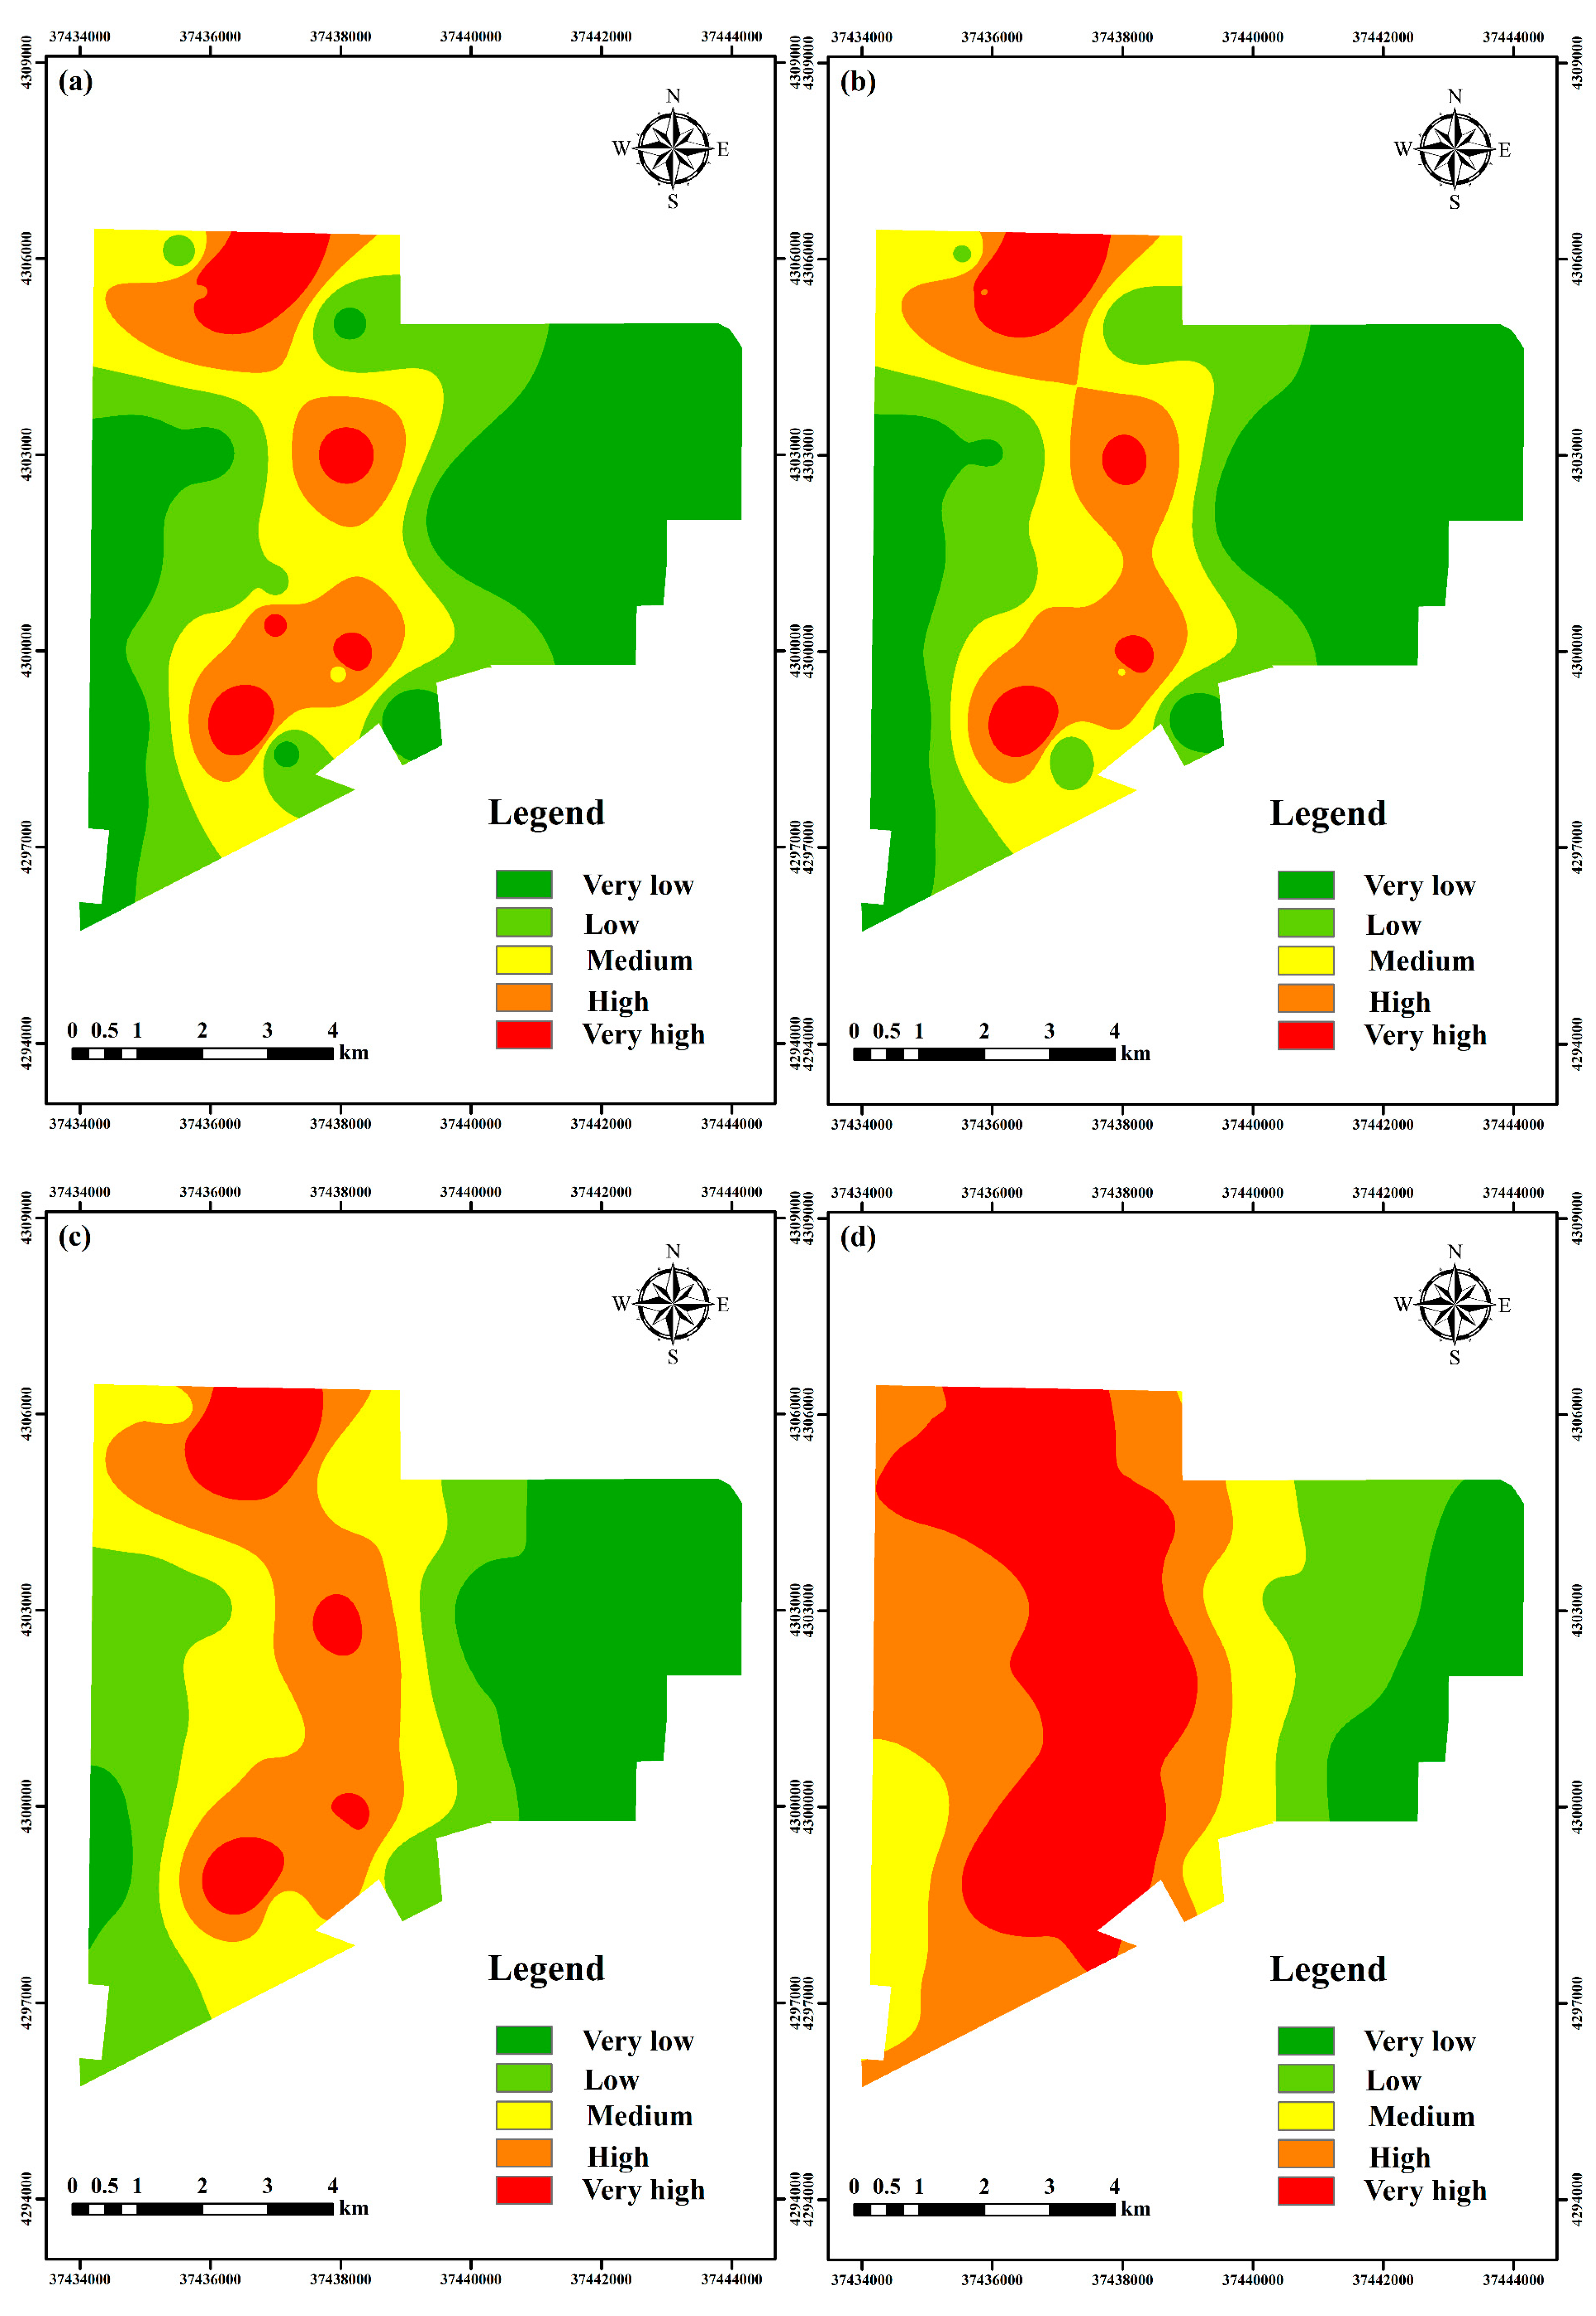
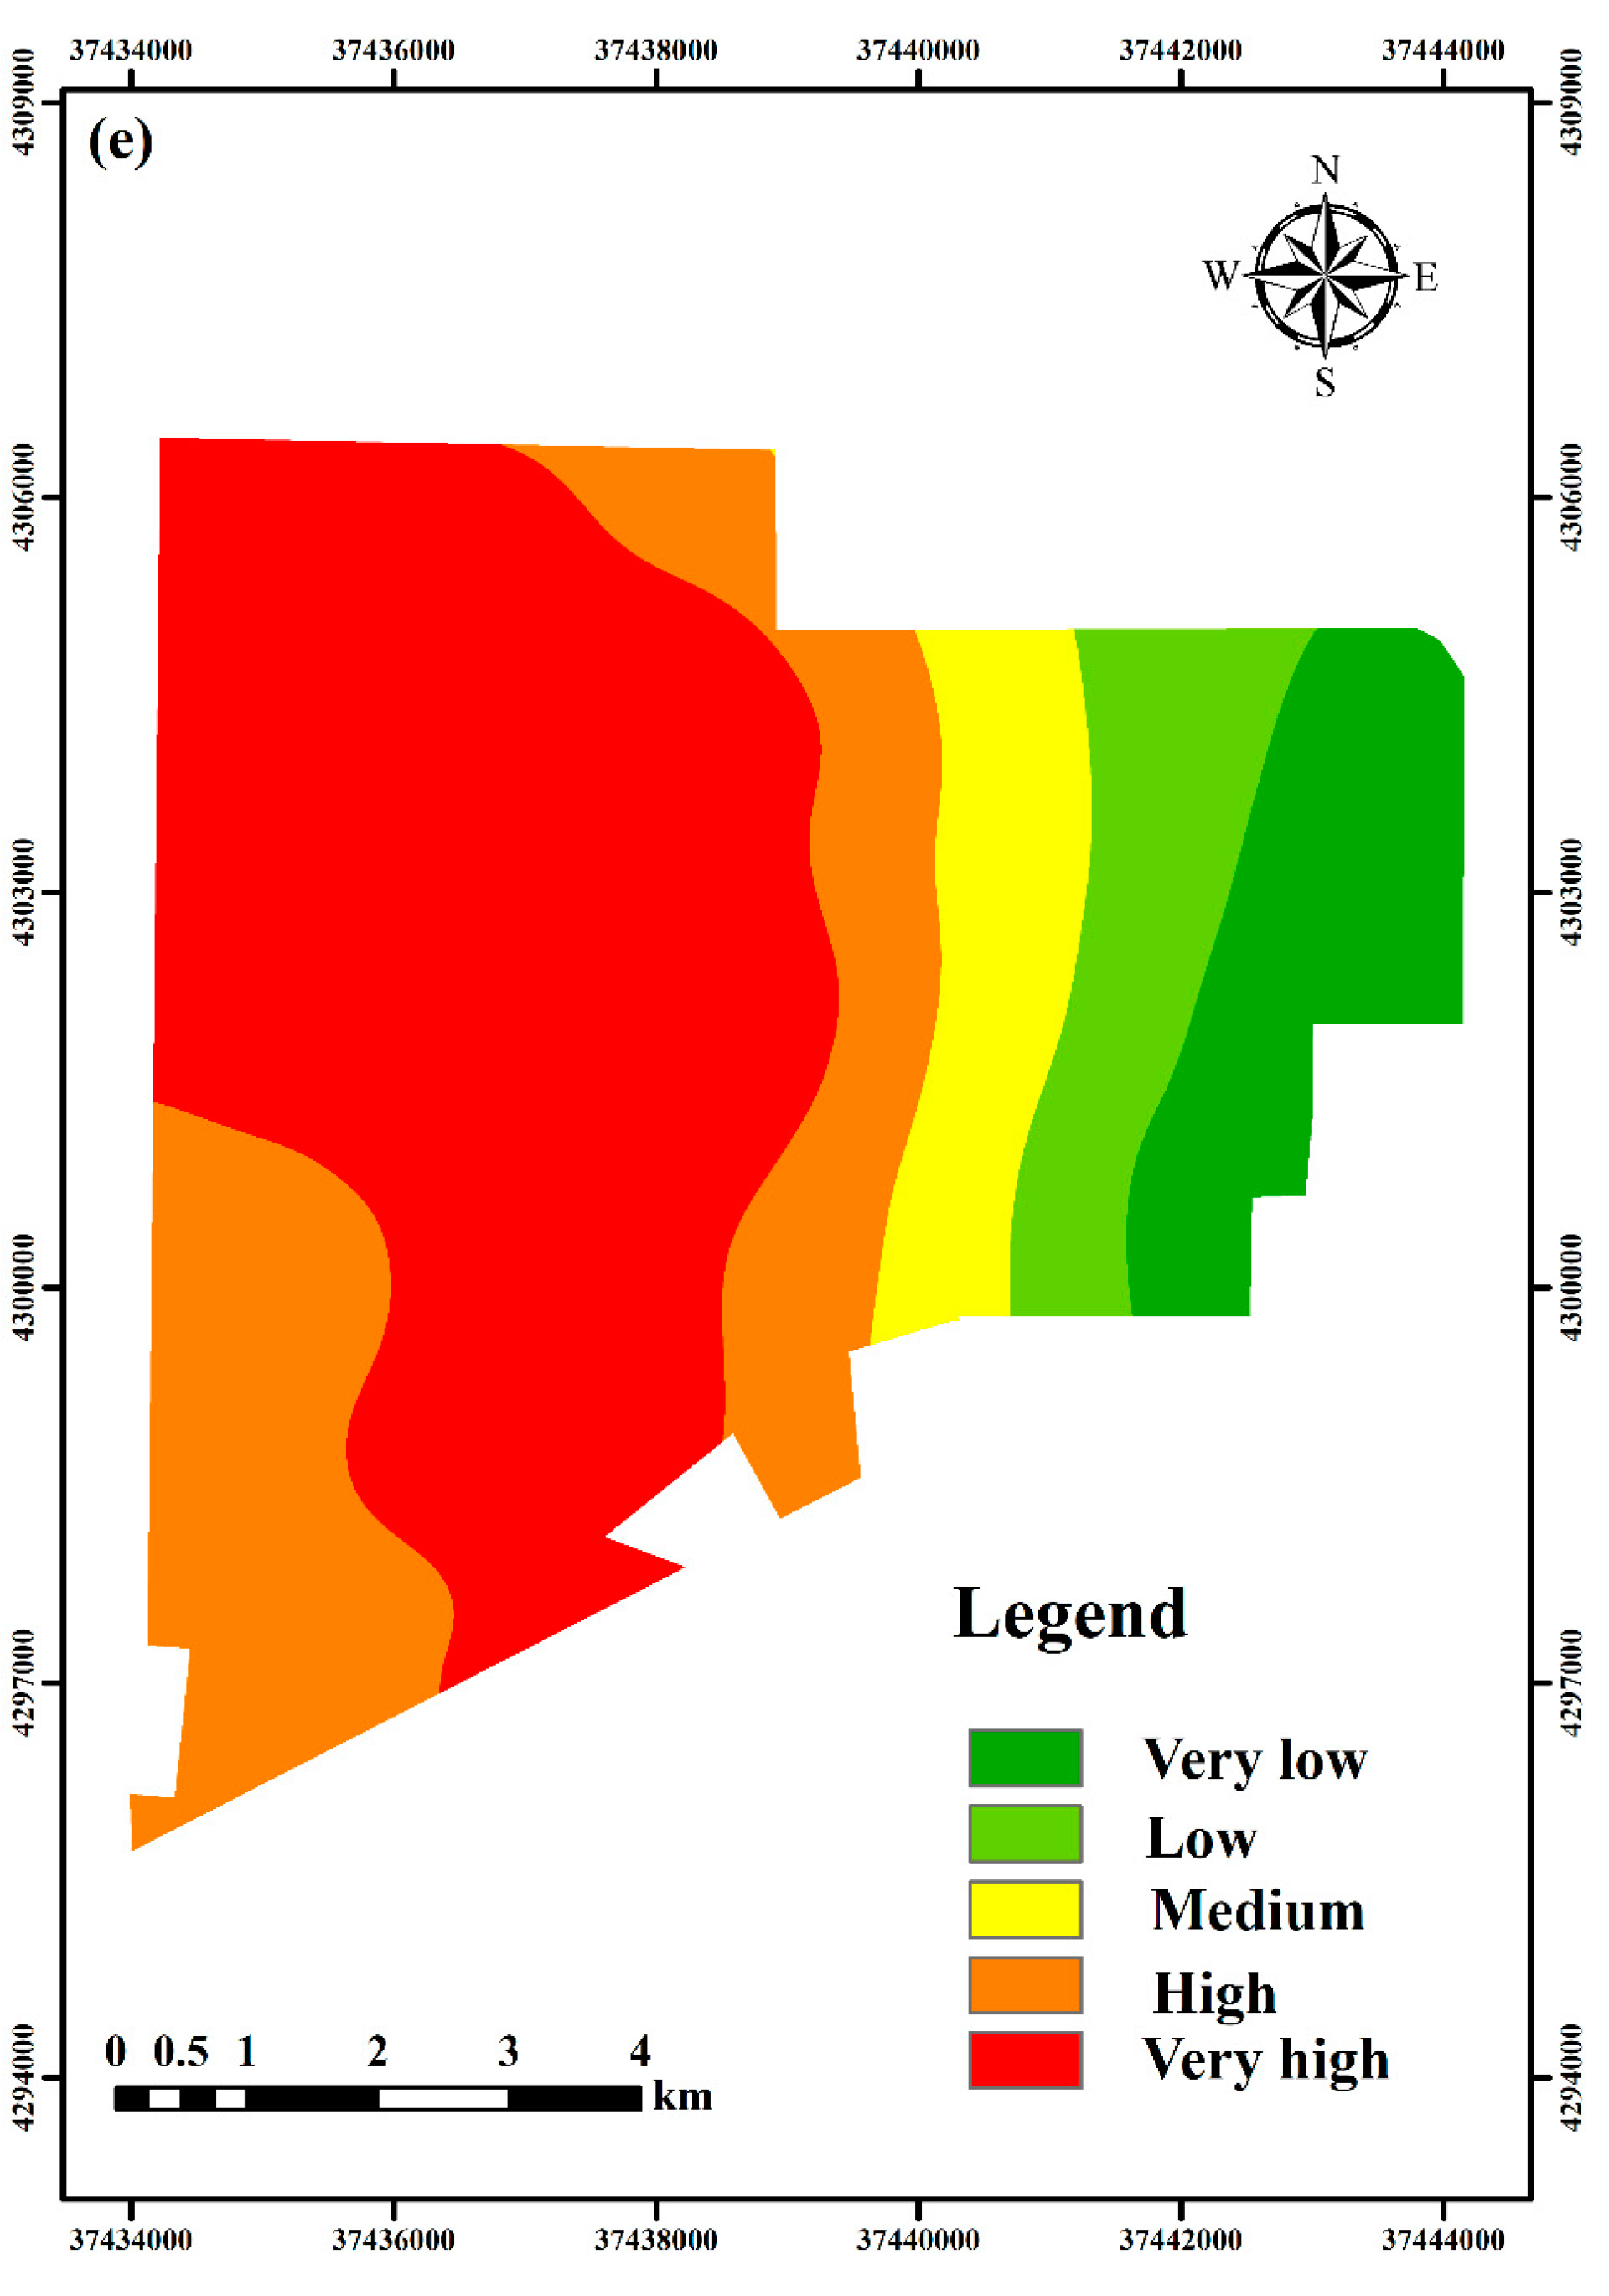
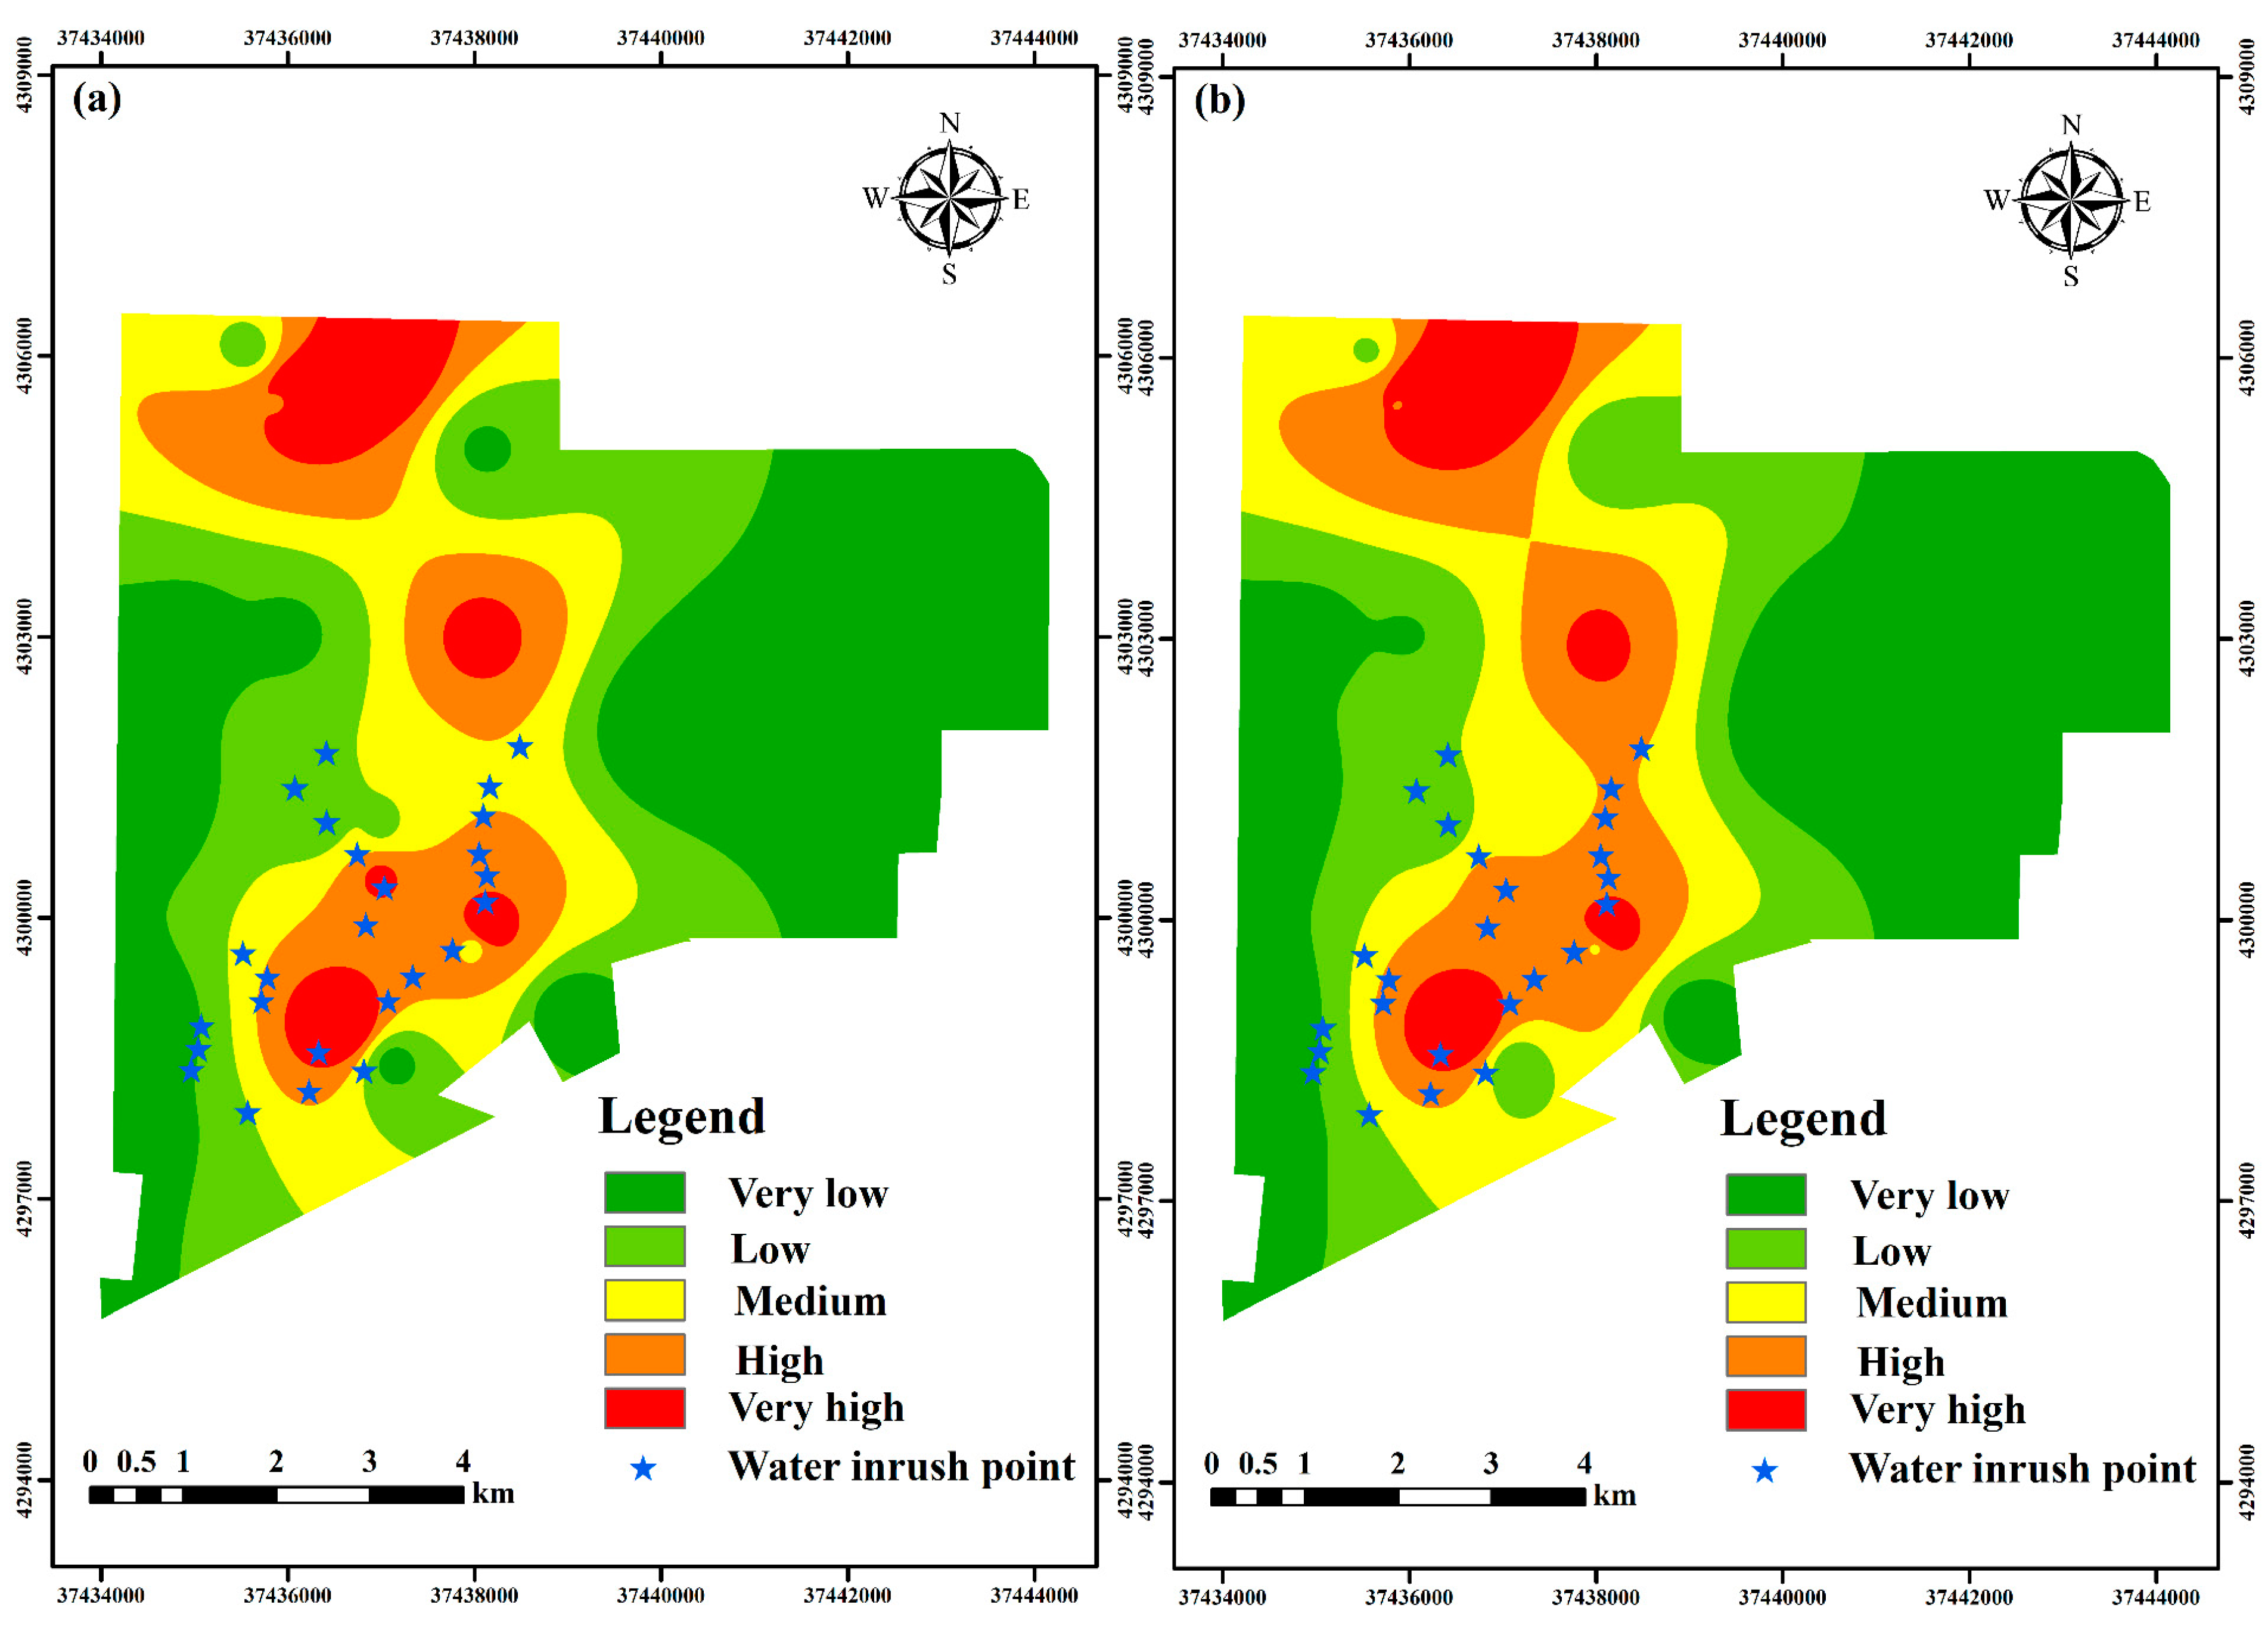
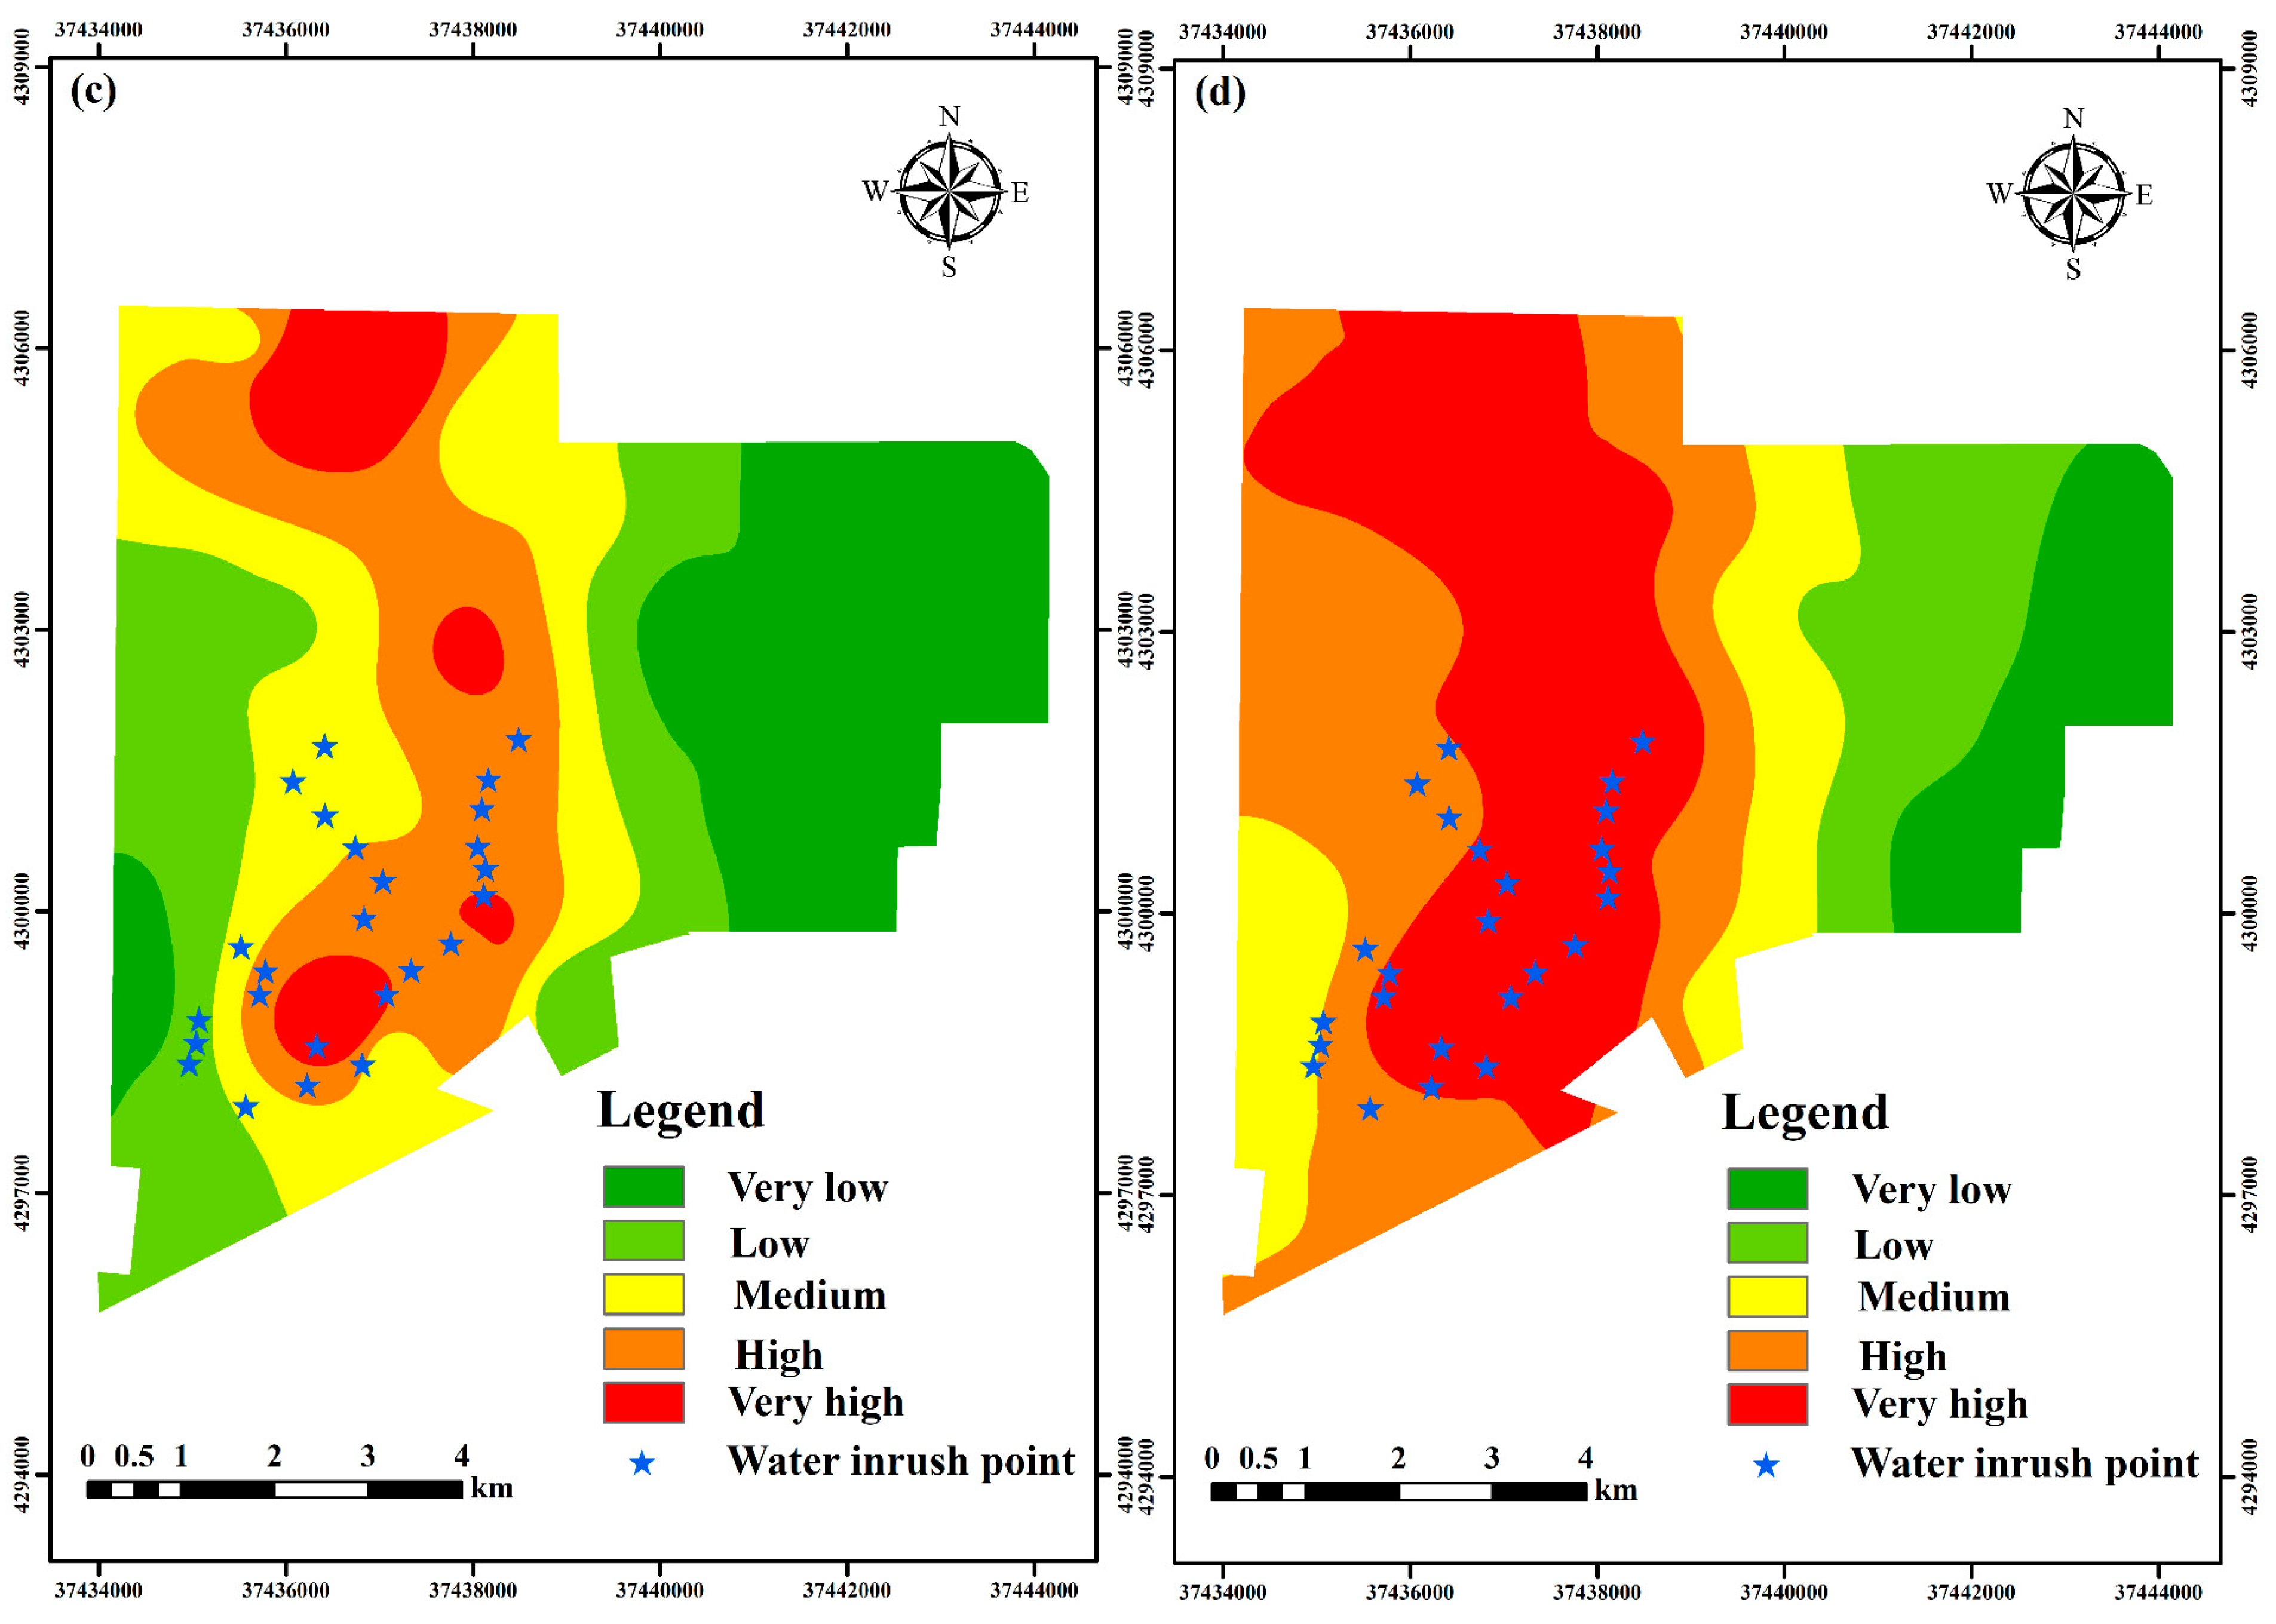
4.4. Influence of Risk Attitudes on Roof Water Inrush Risk Evaluation Results
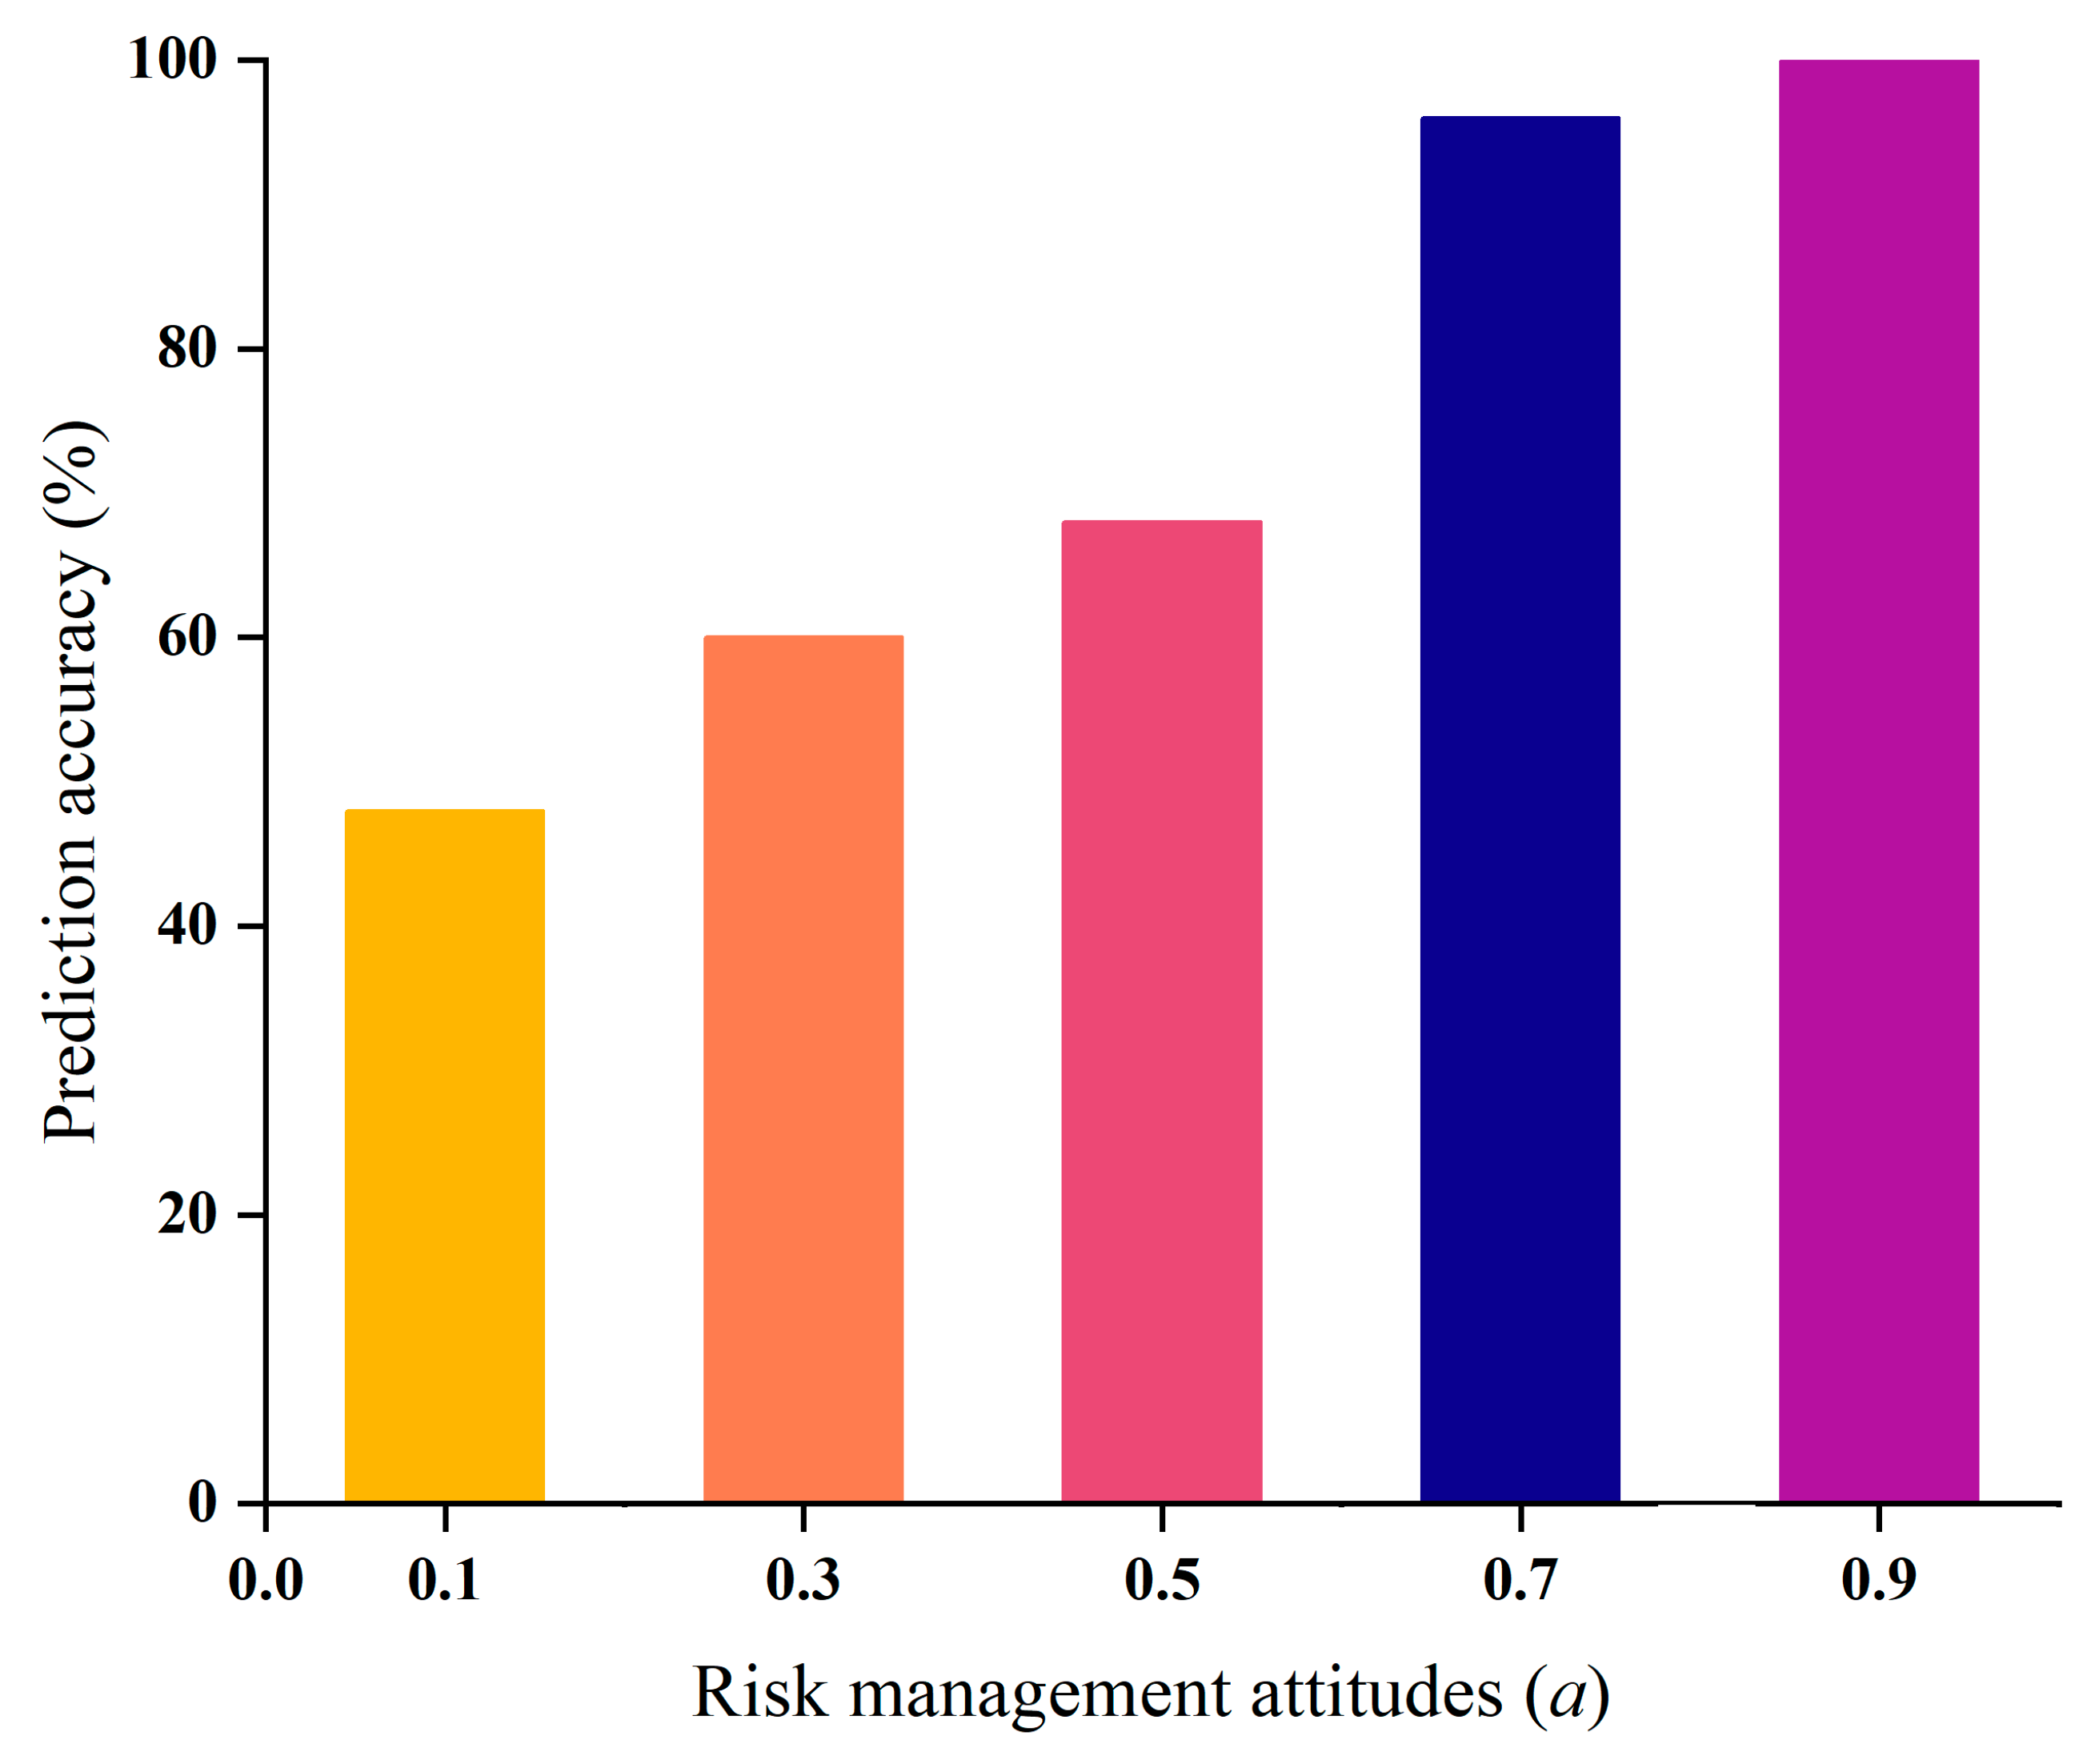
4.5. Verification and Comparison of Evaluation Results under Different Risk Attitudes
5. Conclusions
- (1)
- In this paper, the Monte Carlo analytical hierarchy process (MAHP) was used to calculate the evaluation criteria weight, which eliminates randomness and uncertainty in the process of determining the evaluation indicators in the traditional analytical hierarchy process. This gives the relative importance of the evaluation criteria in descending order: water abundance of the aquifer, coal seam thickness, aquifuge thickness, aquifer thickness, aquifer permeability, overburden failure height, and mining depth.
- (2)
- In this paper, the risk-coping attitude of decision makers was considered during the risk evaluation of roof water inrush. The OWA operator quantifies the impact of the risk attitude of decision makers on the water inrush risk evaluation. This paper assumed that the risk-coping attitude of decision makers to deal with roof water inrush has five situations: pessimistic, moderately pessimistic, neutral, moderately optimistic, and optimistic. The corresponding a values were 0.1, 0.3, 0.5, 0.7, and 0.9, respectively.
- (3)
- As decision makers become more optimistic about their risk-coping attitudes, the area of high-risk areas for roof water inrush within mining becomes significantly larger. The roof water inrush risk assessment results strongly depend on the risk-coping attitude of decision makers. A slight change in the decision makers’ risk-coping attitude can have a significant impact on the final risk assessment results..
- (4)
- Using the method proposed in this paper, the roof water inrush risk assessment results can be made more objective and accurate, thereby reducing or eliminating the risks associated with subjective decision making.
Author Contributions
Funding
Data Availability Statement
Acknowledgments
Conflicts of Interest
References
- Hu, W.; Tian, G. Mine water Disaster Type and Prevention and Control Counten measures in China. Coal Sci. Technol. 2010, 38, 92–96. [Google Scholar]
- Dong, S.; Ji, Y.; Wang, H.; Zhao, B.; Cao, H.; Liu, Y.; Liu, Y.; Ji, Z.; Liu, B. Prevention and control technology and application of roof water disaster in Jurassic coal field of Ordos Basin. J. China Coal Soc. 2020, 45, 2367–2375. [Google Scholar]
- Zeng, Y.; Li, Z.; Gong, H.; Zheng, J. Water abundance characteristics in aquifer of weathered roof bedrock and prediction on water inrush risk. Coal Eng. 2018, 50, 100–104. [Google Scholar]
- Li, P. Mine Water Problems and Solutions in China. Mine Water Environ. 2018, 37, 217–221. [Google Scholar] [CrossRef]
- Papaioannou, G.; Vasiliades, L.; Loukas, A. Multi-Criteria Analysis Framework for Potential Flood Prone Areas Mapping. Water Resour. Manag. 2015, 29, 399–418. [Google Scholar] [CrossRef]
- Dahri, N.; Abida, H. Monte Carlo simulation-aided analytical hierarchy process (AHP) for flood susceptibility mapping in Gabes Basin (southeastern Tunisia). Environ. Earth Sci. 2017, 76, 302. [Google Scholar] [CrossRef]
- Tang, Z.; Zhang, H.; Yi, S.; Xiao, Y. Assessment of flood susceptible areas using spatially explicit, probabilistic multi-criteria decision analysis. J. Hydrol. 2018, 558, 144–158. [Google Scholar] [CrossRef]
- Lin, K.; Chen, H.; Xu, C.; Yan, P.; Lan, T.; Liu, Z.; Dong, C. Assessment of flash flood risk based on improved analytic hierarchy process method and integrated maximum likelihood clustering algorithm. J. Hydrol. 2020, 584, 124696. [Google Scholar] [CrossRef]
- Xiao, Y.; Yi, S.; Tang, Z. A Spatially Explicit Multi-Criteria Analysis Method on Solving Spatial Heterogeneity Problems for Flood Hazard Assessment. Water Resour. Manag. 2018, 32, 3317–3335. [Google Scholar] [CrossRef]
- Liu, Y.; Yuan, S.; Yang, B.; Liu, J.; Ye, Z. Predicting the height of the water-conducting fractured zone using multiple regression analysis and GIS. Environ. Earth Sci. 2019, 78, 422. [Google Scholar] [CrossRef]
- Yang, P.; Yang, W.; Nie, Y.; Saleem, F.; Lu, F.; Ma, R.; Li, R. Predicting the Height of the Water-conducting Fractured Zone Based on a Multiple Regression Model and Information Entropy in the Northern Ordos Basin, China. Mine Water Environ. 2022, 41, 225–236. [Google Scholar] [CrossRef]
- Liang, Y.; Sui, W.; Qi, J. Experimental investigation on chemical grouting of inclined fracture to control sand and water flow. Tunn. Undergr. Space Technol. 2019, 83, 82–90. [Google Scholar] [CrossRef]
- Liu, Y.; Liu, J.; Yang, B.; Yuan, S. Assessing Water and Sand Inrushes Hazard Reductions due to Backfill Mining by Combining GIS and Entropy Methods. Mine Water Environ. 2021, 40, 956–969. [Google Scholar] [CrossRef]
- Liu, J.; Yang, B.; Yuan, S.; Li, Z.; Yang, M.; Duan, L. A Fuzzy Analytical Process to Assess the Risk of Disaster when Backfill Mining Under Aquifers and Buildings. Mine Water Environ. 2021, 40, 891–901. [Google Scholar] [CrossRef]
- Liu, J.; Yang, B.; Yuan, S.; Li, L.; Duan, L. A fuzzy analytic hierarchy process model to assess the risk of disaster reduction due to grouting in coal mining. Arab. J. Geosci. 2020, 13, 227. [Google Scholar] [CrossRef]
- Li, J.; Wang, S.; Wang, Y.; Wang, X.; Wang, X. Water Inrush Risk Assessment of Coal Floor After CBM Development Based on the Fractal-AHP-Vulnerability Index Method. Geotech. Geol. Eng. 2021, 39, 3487–3497. [Google Scholar] [CrossRef]
- Shen, J.; Wu, Q.; Liu, W. The Development of the Water-Richness Evaluation Model for the Unconsolidated Aquifers Based on the Extension Matter-Element Theory. Geotech. Geol. Eng. 2020, 38, 2639–2652. [Google Scholar] [CrossRef]
- Li, Q.; Sui, W. Risk evaluation of mine-water inrush based on principal component logistic regression analysis and an improved analytic hierarchy process. Hydrogeol. J. 2021, 29, 1299–1311. [Google Scholar] [CrossRef]
- Cheng, X.; Qiao, W.; Li, G.; Yu, Z. Risk assessment of roof water disaster due to multi-seam mining at Wulunshan Coal Mine in China. Arab. J. Geosci. 2021, 14, 1116. [Google Scholar] [CrossRef]
- Zhu, T.; Li, W.; Chen, W. Risk assessment of Cretaceous water inrush in the Ordos Basin based on the FAHP-EM. Water Policy 2021, 23, 1249–1265. [Google Scholar] [CrossRef]
- Zhang, Y.; Zhang, L.; Li, H.; Chi, B. Evaluation of the Water Yield of Coal Roof Aquifers Based on the FDAHP-Entropy Method: A Case Study in the Donghuantuo Coal Mine, China. Geofluids 2021, 2021, 1–16. [Google Scholar] [CrossRef]
- Sun, Z.; Bao, W.; Li, M. Comprehensive Water Inrush Risk Assessment Method for Coal Seam Roof. Sustainability 2022, 14, 10475. [Google Scholar] [CrossRef]
- Xiao, L.; Wu, Q.; Niu, C.; Dai, G.; Wang, S.; Ren, D.; Luo, S. Application of a new evaluation method for floor water inrush risk from the Ordovician fissure confined aquifer in Xiayukou coal mine, Shanxi, China. Carbonates Evaporites 2020, 35, 97. [Google Scholar] [CrossRef]
- Qiang, W.; Liu, Y.z.; Liu, Y. Using the Vulnerable Index Method to Assess the Likelihood of a Water Inrush through the Floor of a Multi-seam Coal Mine in China. Mine Water Environ. 2011, 30, 54–60. [Google Scholar] [CrossRef]
- Wu, Q.; Xu, K.; Zhang, W.; Wei, Z. Roof aquifer water abundance evaluation: A case study in Taigemiao, China. Arab. J. Geosci. 2017, 10, 254. [Google Scholar] [CrossRef]
- Wu, Q.; Guo, X.; Shen, J.; Xu, S.; Liu, S.; Zeng, Y. Risk Assessment of Water Inrush from Aquifers Underlying the Gushuyuan Coal Mine, China. Mine Water Environ. 2017, 36, 96–103. [Google Scholar] [CrossRef]
- Wu, Q.; Liu, Y.; Luo, L.; Liu, S.; Sun, W.; Zeng, Y. Quantitative evaluation and prediction of water inrush vulnerability from aquifers overlying coal seams in Donghuantuo Coal Mine, China. Environ. Earth Sci. 2015, 74, 1429–1437. [Google Scholar] [CrossRef]
- Wu, Q.; Zhao, D.; Wang, Y.; Shen, J.; Mu, W.; Liu, H. Method for assessing coal-floor water-inrush risk based on the variable-weight model and unascertained measure theory. Hydrogeol. J. 2017, 25, 2089–2103. [Google Scholar] [CrossRef]
- Wu, Q.; Liu, Y.; Zhou, W.; Li, B.; Zhao, B.; Liu, S.; Sun, W.; Zeng, Y. Evaluation of Water Inrush Vulnerability from Aquifers Overlying Coal Seams in the Menkeqing Coal Mine, China. Mine Water Environ. 2015, 34, 258–269. [Google Scholar] [CrossRef]
- Zeng, Y.; Wu, Q.; Liu, S.; Zhai, Y.; Lian, H.; Zhang, W. Evaluation of a coal seam roof water inrush: Case study in the Wangjialing coal mine, China. Mine Water Environ. 2018, 37, 174–184. [Google Scholar] [CrossRef]
- Gao, C.; Wang, D.; Liu, K.; Deng, G.; Li, J.; Jie, B. A Multifactor Quantitative Assessment Model for Safe Mining after Roof Drainage in the Liangshuijing Coal Mine. ACS Omega 2022, 7, 26437–26454. [Google Scholar] [CrossRef] [PubMed]
- Liu, M.; Qiao, W.; Meng, Q.; Bu, Z. A new risk zoning method for water inrush from separated layers at coal mines: A case study, Cuimu coal mine, China. Arab. J. Geosci. 2021, 14, 2544. [Google Scholar] [CrossRef]
- Stewart, T.J.; Durbach, I. Dealing with Uncertainties in MCDA; Springer: New York, NY, USA, 2016; pp. 467–496. [Google Scholar]
- Zimmermann, H.J. An application-oriented view of modeling uncertainty. Eur. J. Oper. Res. 2000, 122, 190–198. [Google Scholar] [CrossRef]
- Liu, W.; Han, M.; Meng, X.; Qin, Y. Mine Water Inrush Risk Assessment Evaluation Based on the GIS and Combination Weight-Cloud Model: A Case Study. ACS Omega 2021, 6, 32671–32681. [Google Scholar] [CrossRef] [PubMed]
- Chen, H.; Wood, M.D.; Linstead, C.; Maltby, E. Uncertainty analysis in a GIS-based multi-criteria analysis tool for river catchment management. Environ. Model. Softw. 2011, 26, 395–405. [Google Scholar] [CrossRef]
- Chen, Y.; Yu, J.; Khan, S. The spatial framework for weight sensitivity analysis in AHP-based multi-criteria decision making. Environ. Model. Softw. 2013, 48, 129–140. [Google Scholar] [CrossRef]
- Saaty, T.L. How to Make a Decision: The Analytic Hierarchy Process. Interfaces 1994, 24, 19–43. [Google Scholar] [CrossRef] [Green Version]
- Wang, T.; Chen, Y. Applying consistent fuzzy preference relations to partnership selection. Omega 2007, 35, 384–388. [Google Scholar] [CrossRef]
- Deng, H. Multicriteria analysis with fuzzy pairwise comparison. Int. J. Approx. Reason. 1999, 21, 215–231. [Google Scholar] [CrossRef] [Green Version]
- Jing, L.; Chen, B.; Zhang, B.; Li, P.; Zheng, J. Monte Carlo Simulation–Aided Analytic Hierarchy Process Approach: Case Study of Assessing Preferred Non-Point-Source Pollution Control Best Management Practices. J. Environ. Eng. 2013, 139, 618–626. [Google Scholar] [CrossRef]
- Yaraghi, N.; Tabesh, P.; Guan, P.; Zhuang, J. Comparison of AHP and Monte Carlo AHP Under Different Levels of Uncertainty. IEEE Trans. Eng. Manag. 2015, 62, 122–132. [Google Scholar] [CrossRef]
- Anagnostopoulos, K.; Vavatsikos, A. Site Suitability Analysis for Natural Systems for Wastewater Treatment with Spatial Fuzzy Analytic Hierarchy Process. J. Water Resour. Plan. Manag. 2012, 138, 125–134. [Google Scholar] [CrossRef]
- Vadrevu, K.P.; Eaturu, A.; Badarinath, K.V.S. Fire risk evaluation using multicriteria analysis—A case study. Environ. Monit. Assess. 2010, 166, 223–239. [Google Scholar] [CrossRef]
- Kordi, M.; Brandt, S.A. Effects of increasing fuzziness on analytic hierarchy process for spatial multicriteria decision analysis. Comput. Environ. Urban Syst. 2012, 36, 43–53. [Google Scholar] [CrossRef] [Green Version]
- Malczewski, J.; Rinner, C. Multicriteria Decision Analysis in Geographic Information Science; Springer: Berlin/Heidelberg, Germany, 2015. [Google Scholar]
- Elaalem, M.; Comber, A.; Fisher, P. A Comparison of Fuzzy AHP and Ideal Point Methods for Evaluating Land Suitability. Trans. GIS 2011, 15, 329–346. [Google Scholar] [CrossRef]
- Fu, G.; Yin, W.; Dong, J.; Di, F.; Zhu, C. Behavior-based accident causation: The “2–4”model and its safety implications in coal mines. J. China Coal Soc. 2013, 38, 1123–1129. [Google Scholar]
- Wu, Q. Progress, problems and prospects of prevention and control technology of mine water and reutilization in China. J. China Coal Soc. 2014, 39, 795–805. [Google Scholar]
- Che, H. In fact, 96% of dangerous accidents can be avoided—DuPont executives talk about safety management. China’s Natl. Cond. Strength 2003, 02, 57. [Google Scholar]
- Kang, S.; Min, S.; Won, D.; Kang, Y.; Kim, S. Suggestion of an Improved Evaluation Method of Construction Companies’ Industrial Accident Prevention Activities in South Korea. Int. J. Environ. Res. Public Health 2021, 18, 8442. [Google Scholar] [CrossRef]
- Chen, H.; Qi, H.; Long, R.; Zhang, M. Research on 10-year tendency of China coal mine accidents and the characteristics of human factors. Saf. Sci. 2012, 50, 745–750. [Google Scholar] [CrossRef]
- Khanzode, V.V.; Maiti, J.; Ray, P.K. Occupational injury and accident research: A comprehensive review. Saf. Sci. 2012, 50, 1355–1367. [Google Scholar] [CrossRef]
- Mahdevari, S.; Shahriar, K.; Esfahanipour, A. Human health and safety risks management in underground coal mines using fuzzy TOPSIS. Sci. Total Environ. 2014, 488–489, 85–99. [Google Scholar] [CrossRef] [PubMed]
- Hallowell, M.R.; Alexander, D.; Gambatese, J.A. Energy-based safety risk assessment: Does magnitude and intensity of energy predict injury severity? Constr. Manag. Econ. 2017, 35, 64–77. [Google Scholar] [CrossRef] [Green Version]
- Tu, W.; Li, L.; Shang, C.; Liu, S.; Zhu, Y. Comprehensive risk assessment and engineering application of mine water inrush based on normal cloud model and local variable weight. Energy sources. Part A Recovery Util. Environ. Eff. 2019. [Google Scholar] [CrossRef]
- ANSI/ASSP/ISO 45001-2018 Occupational Health and Safety Management Systems—Requirements with Guidance for Use. Chilton’s Ind. Saf. Hyg. News 2019, 53, 34.
- Wang, C.; Yang, S.; Jiang, C.; Wu, G.; Liu, Q. Monte Carlo analytic hierarchy process for selection of the longwall mining method in thin coal seams. J. S. Afr. Inst. Min. Metall. 2019, 119, 1005–1012. [Google Scholar]
- Ataei, M.; Shahsavany, H.; Mikaeil, R. Monte Carlo Analytic Hierarchy Process (MAHP) approach to selection of optimum mining method. Int. J. Min. Sci. Technol. 2013, 23, 573–578. [Google Scholar] [CrossRef]
- Hsu, T.; Pan, F.F.C. Application of Monte Carlo AHP in ranking dental quality attributes. Expert Syst. Appl. 2009, 36, 2310–2316. [Google Scholar] [CrossRef]
- Rosenbloom, E.S. A probabilistic interpretation of the final rankings in AHP. Eur. J. Oper. Res. 1997, 96, 371–378. [Google Scholar] [CrossRef]
- Prato, T. Stochastic multiple attribute evaluation of land use policies. Ecol. Model. 2008, 219, 115–124. [Google Scholar] [CrossRef]
- Durbach, I.N.; Stewart, T.J. Modeling uncertainty in multi-criteria decision analysis. Eur. J. Oper. Res. 2012, 223, 1–14. [Google Scholar] [CrossRef]
- Marinoni, O. A stochastic spatial decision support system based on PROMETHEE. Int. J. Geogr. Inf. Sci. IJGIS 2005, 19, 51–68. [Google Scholar] [CrossRef]
- Benke, K.K.; Pelizaro, C. A spatial-statistical approach to the visualisation of uncertainty in land suitability analysis. J. Spat. Sci. 2010, 55, 257–272. [Google Scholar] [CrossRef]
- Tang, Z.; Yi, S.; Wang, C.; Xiao, Y. Incorporating probabilistic approach into local multi-criteria decision analysis for flood susceptibility assessment. Stoch. Environ. Res. Risk Assess. 2018, 32, 701–714. [Google Scholar] [CrossRef]
- Malczewski, J. Ordered weighted averaging with fuzzy quantifiers: GIS-based multicriteria evaluation for land-use suitability analysis. Int. J. Appl. Earth Obs. Geoinf. 2006, 8, 270–277. [Google Scholar] [CrossRef]
- Yager, R.R. On ordered weighted averaging aggregation operators in multicriteria decision making. IEEE Trans. Syst. Man Cybern. 1988, 18, 183–190. [Google Scholar] [CrossRef]
- Jiang, H.; Eastman, J.R. Application of fuzzy measures in multi-criteria evaluation in GIS. Int. J. Geogr. Inf. Sci. IJGIS 2000, 14, 173–184. [Google Scholar] [CrossRef]
- Makropoulos, C.K.; Butler, D. Spatial ordered weighted averaging: Incorporating spatially variable attitude towards risk in spatial multi-criteria decision-making. Environ. Model. Softw. Environ. Data News 2006, 21, 69–84. [Google Scholar] [CrossRef]
- Malczewski, J.; Liu, X. Local ordered weighted averaging in GIS-based multicriteria analysis. Annals of GIS 2014, 20, 117–129. [Google Scholar] [CrossRef]
- Tang, Z. Flood Hazard Assessment based on Spatially Explicit Multi-criteria Decision Analysis Under Uncertainty. Ph.D. Thesis, Huazhong University of Science and Technology, Wuhan, China, 2018; p. 144. [Google Scholar]
- O’Hagan, M. Aggregating Template or Rule Antecedents in Real-Time Expert Systems with Fuzzy Set Logic. In Proceedings of the Twenty-Second Asilomar Conference on Signals, Systems and Computers, Pacific Grove, CA, USA, 31 October–2 November 1988; Volume 2, pp. 681–689. [Google Scholar]
- Fullér, R.; Majlender, P. An analytic approach for obtaining maximal entropy OWA operator weights. Fuzzy Sets Syst. 2001, 124, 53–57. [Google Scholar] [CrossRef]
- O’Hagan, M. A Fuzzy Neuron Based upon Maximum Entropy Ordered Weighted Averaging; Springer: Berlin/Heidelberg, Germany, 2005; pp. 598–609. [Google Scholar]


| Criteria | Mean | Min | Max | Standardization | Confidence Interval |
|---|---|---|---|---|---|
| Water abundance of the aquifer | 0.2678 | 0.1974 | 0.3301 | 0.02498 | (0.2647–0.2708) |
| Aquifer permeability | 0.0911 | 0.0633 | 0.1288 | 0.01233 | (0.0895–0.0925) |
| Aquifer thickness | 0.1463 | 0.1044 | 0.1985 | 0.0209 | (0.1437–0.1488) |
| Mining depth | 0.0497 | 0.0370 | 0.0761 | 0.0070 | (0.0488–0.0505) |
| Coal seam thickness | 0.1965 | 0.1401 | 0.2613 | 0.0220 | (0.1938–0.1992) |
| Overburden failure height | 0.0665 | 0.0484 | 0.0875 | 0.0074 | (0.0656–0.0674) |
| Aquifuge thickness | 0.1819 | 0.1395 | 0.2398 | 0.01979 | (0.1795–0.1843) |
| a | 0.1 | 0.3 | 0.5 | 0.7 | 0.9 |
|---|---|---|---|---|---|
| Order weight v1 | 0.002 | 0.0438 | 0.1428 | 0.3096 | 0.6226 |
| Order weight v2 | 0.0052 | 0.0607 | 0.1428 | 0.2236 | 0.2367 |
| Order weight v3 | 0.0136 | 0.0841 | 0.1428 | 0.1614 | 0.09 |
| Order weight v4 | 0.0353 | 0.1165 | 0.1429 | 0.1166 | 0.0342 |
| Order weight v5 | 0.0918 | 0.1614 | 0.1429 | 0.0842 | 0.0130 |
| Order weight v6 | 0.2391 | 0.2236 | 0.1429 | 0.0608 | 0.0049 |
| Order weight v7 | 0.6224 | 0.3097 | 0.1429 | 0.0439 | 0.0019 |
| Risk Attitude | a | Number of Pixels |
|---|---|---|
| Pessimistic | 0.1 | 13,774,955 |
| Moderately pessimistic | 0.3 | 15,245,159 |
| Neutral | 0.5 | 19,685,325 |
| Moderately optimistic | 0.7 | 43,416,472 |
| Optimistic | 0.9 | 50,369,478 |
Disclaimer/Publisher’s Note: The statements, opinions and data contained in all publications are solely those of the individual author(s) and contributor(s) and not of MDPI and/or the editor(s). MDPI and/or the editor(s) disclaim responsibility for any injury to people or property resulting from any ideas, methods, instructions or products referred to in the content. |
© 2023 by the authors. Licensee MDPI, Basel, Switzerland. This article is an open access article distributed under the terms and conditions of the Creative Commons Attribution (CC BY) license (https://creativecommons.org/licenses/by/4.0/).
Share and Cite
Wang, D.; Gao, C.; Liu, K.; Gong, J.; Fang, Y.; Xiong, S. A GIS-Based Probabilistic Spatial Multicriteria Roof Water Inrush Risk Evaluation Method Considering Decision Makers’ Risk-Coping Attitude. Water 2023, 15, 254. https://doi.org/10.3390/w15020254
Wang D, Gao C, Liu K, Gong J, Fang Y, Xiong S. A GIS-Based Probabilistic Spatial Multicriteria Roof Water Inrush Risk Evaluation Method Considering Decision Makers’ Risk-Coping Attitude. Water. 2023; 15(2):254. https://doi.org/10.3390/w15020254
Chicago/Turabian StyleWang, Dangliang, Chengyue Gao, Kerui Liu, Junling Gong, Yafei Fang, and Shijie Xiong. 2023. "A GIS-Based Probabilistic Spatial Multicriteria Roof Water Inrush Risk Evaluation Method Considering Decision Makers’ Risk-Coping Attitude" Water 15, no. 2: 254. https://doi.org/10.3390/w15020254