
Water Scarcity Risk Index: A Tool for Strategic Drought Risk Management
by
 ,
,
Fernanda Rocha Thomaz
1,*,
Marcelo Gomes Miguez
1,2,*,
João Gabriel de Souza Ribeiro de Sá
2,
Gabriel Windsor de Moura Alberto
2 and
João Pedro Moreira Fontes
2 1
Programa de Engenharia Civil—PEC, COPPE/Universidade Federal do Rio de Janeiro—UFRJ, Rio de Janeiro 21941-450, Brazil
2
Escola Politécnica—POLI/Universidade Federal do Rio de Janeiro—UFRJ, Rio de Janeiro 21941-909, Brazil
*
Authors to whom correspondence should be addressed.
Water 2023, 15(2), 255; https://doi.org/10.3390/w15020255
Submission received: 18 November 2022
/
Revised: 23 December 2022
/
Accepted: 3 January 2023
/
Published: 7 January 2023
(This article belongs to the Special Issue Assessing Hydrological Drought in a Climate Change: Methods and Measures)
Abstract
:Drought events have affected many regions of the world, having negative economic, environmental and social impacts. When accompanied by increasing water demands, these events can lead to water scarcity. Since droughts can significantly vary in each geographic area, several indices have been developed around the world. Hazard indexes are commonly used to predict meteorological, agricultural and hydrological droughts. These indexes intend to predict hazards, but they do not provide information on when and where deficits can have negative consequences. This study presents a new planning and decision-support tool for monitoring water scarcity situations in a given region. This tool, called the Water Scarcity Risk Index (W-ScaRI), is formed by two subindices, which are proposed to describe a hazard and its consequences. Each subindex was constructed using a group of indicators and indices selected from the technical literature or originally proposed in this work. The W-ScaRI was applied to the Rio de Janeiro Metropolitan Region (RJMR), supplied with water by the Guandu/Lajes/Acari system. The RJMR is one of the most densely populated regions in Brazil, located in an area that has no natural water bodies capable of meeting its supply needs. Therefore, the Guandu River, which, in fact, is formed by two discharge transpositions from the Paraíba do Sul River, is the main drinking water supply source for this region. The RJMR suffered the consequences of unexpected, prolonged droughts in the Southeast region in 2003 and 2014–2015, leading the local authorities to implement temporary emergency measures in the management system of Paraíba do Sul and Guandu Basins, avoiding water shortage but showing the urgent need for planning and management support tools to anticipate possible future problems. The results of the study show that the formulation of the W-ScaRI can represent the water scarcity risk in a relatively simple way and, at the same time, with adequate conceptual and methodological consistency.
1. Introduction
Drought is characterized as a gradual natural hazard ([1], [2] cited in [3]) usually driven by climatic characteristics on a regional or even global scale [3]. For this reason, it is difficult to identify the beginning and ending of a drought period, as well as the affected area [4]. According to Wilhite [5] and De Stefano et al. [6], the main features that make droughts different from other natural hazards are as follows: (a) droughts are difficult to define—there is no universally accepted definition; (b) it is difficult to determine the beginning and the end of the event; (c) the impacts are mainly functional and nonstructural over socioeconomic systems, and they are spread over large geographical areas; (d) droughts are a normal, recurrent and cyclical aspect of climate in virtually all regions of the world (but varying in intensity and duration).
In recent decades, drought events have increased in intensity and frequency, affecting many regions of the world and having negative economic, environmental and social impacts [7]. Thus, several socioeconomic systems and sectors in the world have suffered heavy losses due to the consequences of droughts [8]. In Europe, from 1976 to 2006, drought costs were estimated at EUR 100 billion [4]. In 2015, California’s agriculture losses during the drought period reached USD 1.84 billion, in addition to the loss of 10,000 seasonal jobs [9]. In Canada, an increase in tree mortality was observed across the Boreal Forest following a series of regional droughts from 1963 to 2008 [10].
While droughts are natural phenomena caused by abnormal precipitation deficits, water scarcity combined with human action results in a water availability insufficient to satisfy water demands for different socioeconomic uses [11]. According to Van Loon and Van Lanen [12], water scarcity represents the overexploitation of water resources when the water demand is greater than the water availability. Dolan et al. [13] said that water scarcity is dynamic and complex, emerging from the combined influences of climate change, basin-level water resources and managed systems’ adaptive capacities.
The increasing water demand accompanied by a changing climate can lead to the unsustainable use of freshwater, consequently increasing water scarcity [14]. Regions with water scarcity may suffer from strong constraints in terms of social integrity and economic development [15]. This situation will be aggravated as rapidly growing urban areas place heavy pressure on local water resources [16,17]. Therefore, it is necessary to revise water management procedures, especially in areas with demographic changes and that are vulnerable to climatic conditions, in order to ensure a sustainable and safe water supply [15].
Understanding the evolution of and variation in drought events at different spatial and temporal scales is crucial in drought planning [8]. One way to monitor drought and water scarcity in a basin is to use indices and indicators. Indices are important decision-support tools, as they aggregate information from indicators of different types, forming a single representative value of a more complex situation. This integration of several indicators allows for fast and easy comparisons across time and space [18,19]. Well-constructed indicators can translate information about complex phenomena in a simple way by aggregating and quantifying information with diverse sources and scales so that their significance becomes more apparent [20].
Since drought events are significantly different around the world, several indices have been developed and published internationally. According to Wang et al. [21], more than 58 index types from different countries are listed in the World Meteorological Organization (WMO) technical reports. Many indices were developed to assess the characteristics of a given type of drought according to its meteorological, agricultural or hydrological origin [22]. Cuartas et al. [23], for example, analyzed different drought indicators to assess hydrological droughts in several regions of Brazil and their impact on hydropower generation.
Drought alert systems, usually called drought monitors, use indices to detect and predict drought hazard situations. For example, the US Drought Monitor uses five indices to classify droughts [24,25]: the Palmer Drought Severity index (PDSI), CPC Soil Moisture Model, USG Weekly Streamflow, Standardized Precipitation Index (SPI) and Objective Drought Indicator Blends. In Brazil, the Northeast Drought Monitor was recently developed based on the US Drought Monitor and experiences from Spain and Mexico [26]. The Northeast Drought Monitor uses three indices: SPI, the Standardized Precipitation-Evapotranspiration Index (SPEI) and the standardized runoff index (SRI). These drought warning systems, while able to predict hazards, do not provide information on when and where deficits can have negative consequences [27]. However, this is important information for drought risk planning and management strategies, which can be used to trigger and prioritize specific actions [28].
In recent years, the number of studies related to the consequences of droughts has increased due to the growing concern about the importance of changing the way of handling natural disasters, moving from a crisis management approach to a risk-management-based prevention approach. In addition, the rising severity of the impacts of droughts has also contributed to improving and optimizing management during these events [29]. One of the most common ways to assess vulnerability is the use of indicators, which may or may not be aggregated into indices [6], helping to jointly consider different system aspects.
Tsakiris [30], for example, assessed drought risk as a functional relation of hazard (H) and vulnerability (V). In the vulnerability assessment, the study presented several factors that can be used in formulations, such as exposure, the capacity of the system, social factors, the severity and destructive capacity of the event, conditions and interrelated factors. However, to show an application case, the study only used the RDI index to represent the drought severity classes, which was associated with crop production losses.
Dabanli [31] developed a framework to assess drought risk in Turkey using hazard components (SPI) and vulnerability (four socioeconomic indicators). The study did not use exposure in its formulation.
Meza et al. [32] presented an integrated drought risk assessment that considers hazard, exposure and vulnerability components to evaluate the impact of droughts on irrigated and rainfed systems (separately) at the national level. To assess vulnerability, they used more than 20 indicators. Tien Le et al. [33] also proposed a drought risk assessment using hazard, exposure and vulnerability components, and it was applied to 27 province areas in Vietnam. Both studies used specific indicators, indices and data to assess the drought risk in agricultural areas.
Carrão et al. [34] also used a combination of hazard, exposure and vulnerability indicators (most of them at the country scale). The drought hazard was derived from a non-parametric analysis of historical precipitation deficits; drought exposure was based on indicators of population and livestock densities, crop cover and water stress; and drought vulnerability was computed as the arithmetic composite of social, economic and infrastructural indicators, using 15 indicators. The study mapped the global distribution of drought risk, serving as a kind of first triage analysis to determine where local risk assessments should be carried out in detail. However, with significant intra-annual variations in water use and availability, it is important to understand when water is available [28].
The study by Dunne and Kuleshov [35] assessed the spatial–temporal distribution of agricultural drought risk across the Murray–Darling Basin. The developed drought risk index included nine indicators. One of the vulnerability component indicators was the same as that used by Carrão et al. [34], and it aggregates several socioeconomic factors.
Sayers et al. [3] described a new approach called “Strategic Drought Risk Management” (GERS). According to this approach, drought risk is defined as “an emerging property of natural and human systems that reflects the interaction between the hazard of meteorological drought, blue drought (hydrological) and green drought (agricultural) and the vulnerability of exposed people, ecosystems and economies”.
Considering the presented aspects, this paper proposes a new index named the Water Scarcity Risk Index (W-ScaRI), which aims to assess the risk of water scarcity in a given region, especially focusing on urbanized watersheds and, particularly, in metropolitan regions. The drought hazard, in a broad way, is related to the meteorological drought, the blue drought and the green drought, as proposed by Sayers [3], while vulnerability is expressed to convey the environmental, social and economic consequences of the event. However, this new proposal attempts to maintain a simple vulnerability component, using a small number of representative indicators. In this context, the proposed index is built to be applied mainly in urban areas in order to assess the risk of water scarcity related to human and industry supplies. Thus, the indicators and indices chosen to compose the W-ScaRI were selected or created to represent this risk, within an adequate scale of analysis, in a relatively simple way, using fewer but representative parameters of the risk components. The main contribution of this work lies in the possibility of establishing a relatively simple index that can be integrated in daily management operations, allowing for the definition of both a spatial hierarchization of critical areas (according to the mapped vulnerabilities) and a set of threshold values for the W-ScaRI that can raise warning flags and implement specific actions to diminish drought risks (for example, limiting water supply to the least affected activities, rationalizing water uses and temporarily using alternative water source supplies).
The W-ScaRI was tested in the Rio de Janeiro Metropolitan Region (RJMR) for the period of 2014–2015, when a serious water crisis occurred in the Paraíba do Sul River Basin, the main water supply source for the region. The successful application of W-ScaRI can validate its use in the future in the preparation of a strategic drought risk management plan for the region, helping to understand the temporal evolution of drought risks and supporting actions that can promote reduced vulnerability of exposed systems and increased resilience. However, the W-ScaRI is not limited to the tested region—it can be applied to other basins, with the possible adaptation of weights and indicators.
2. Materials and Methods
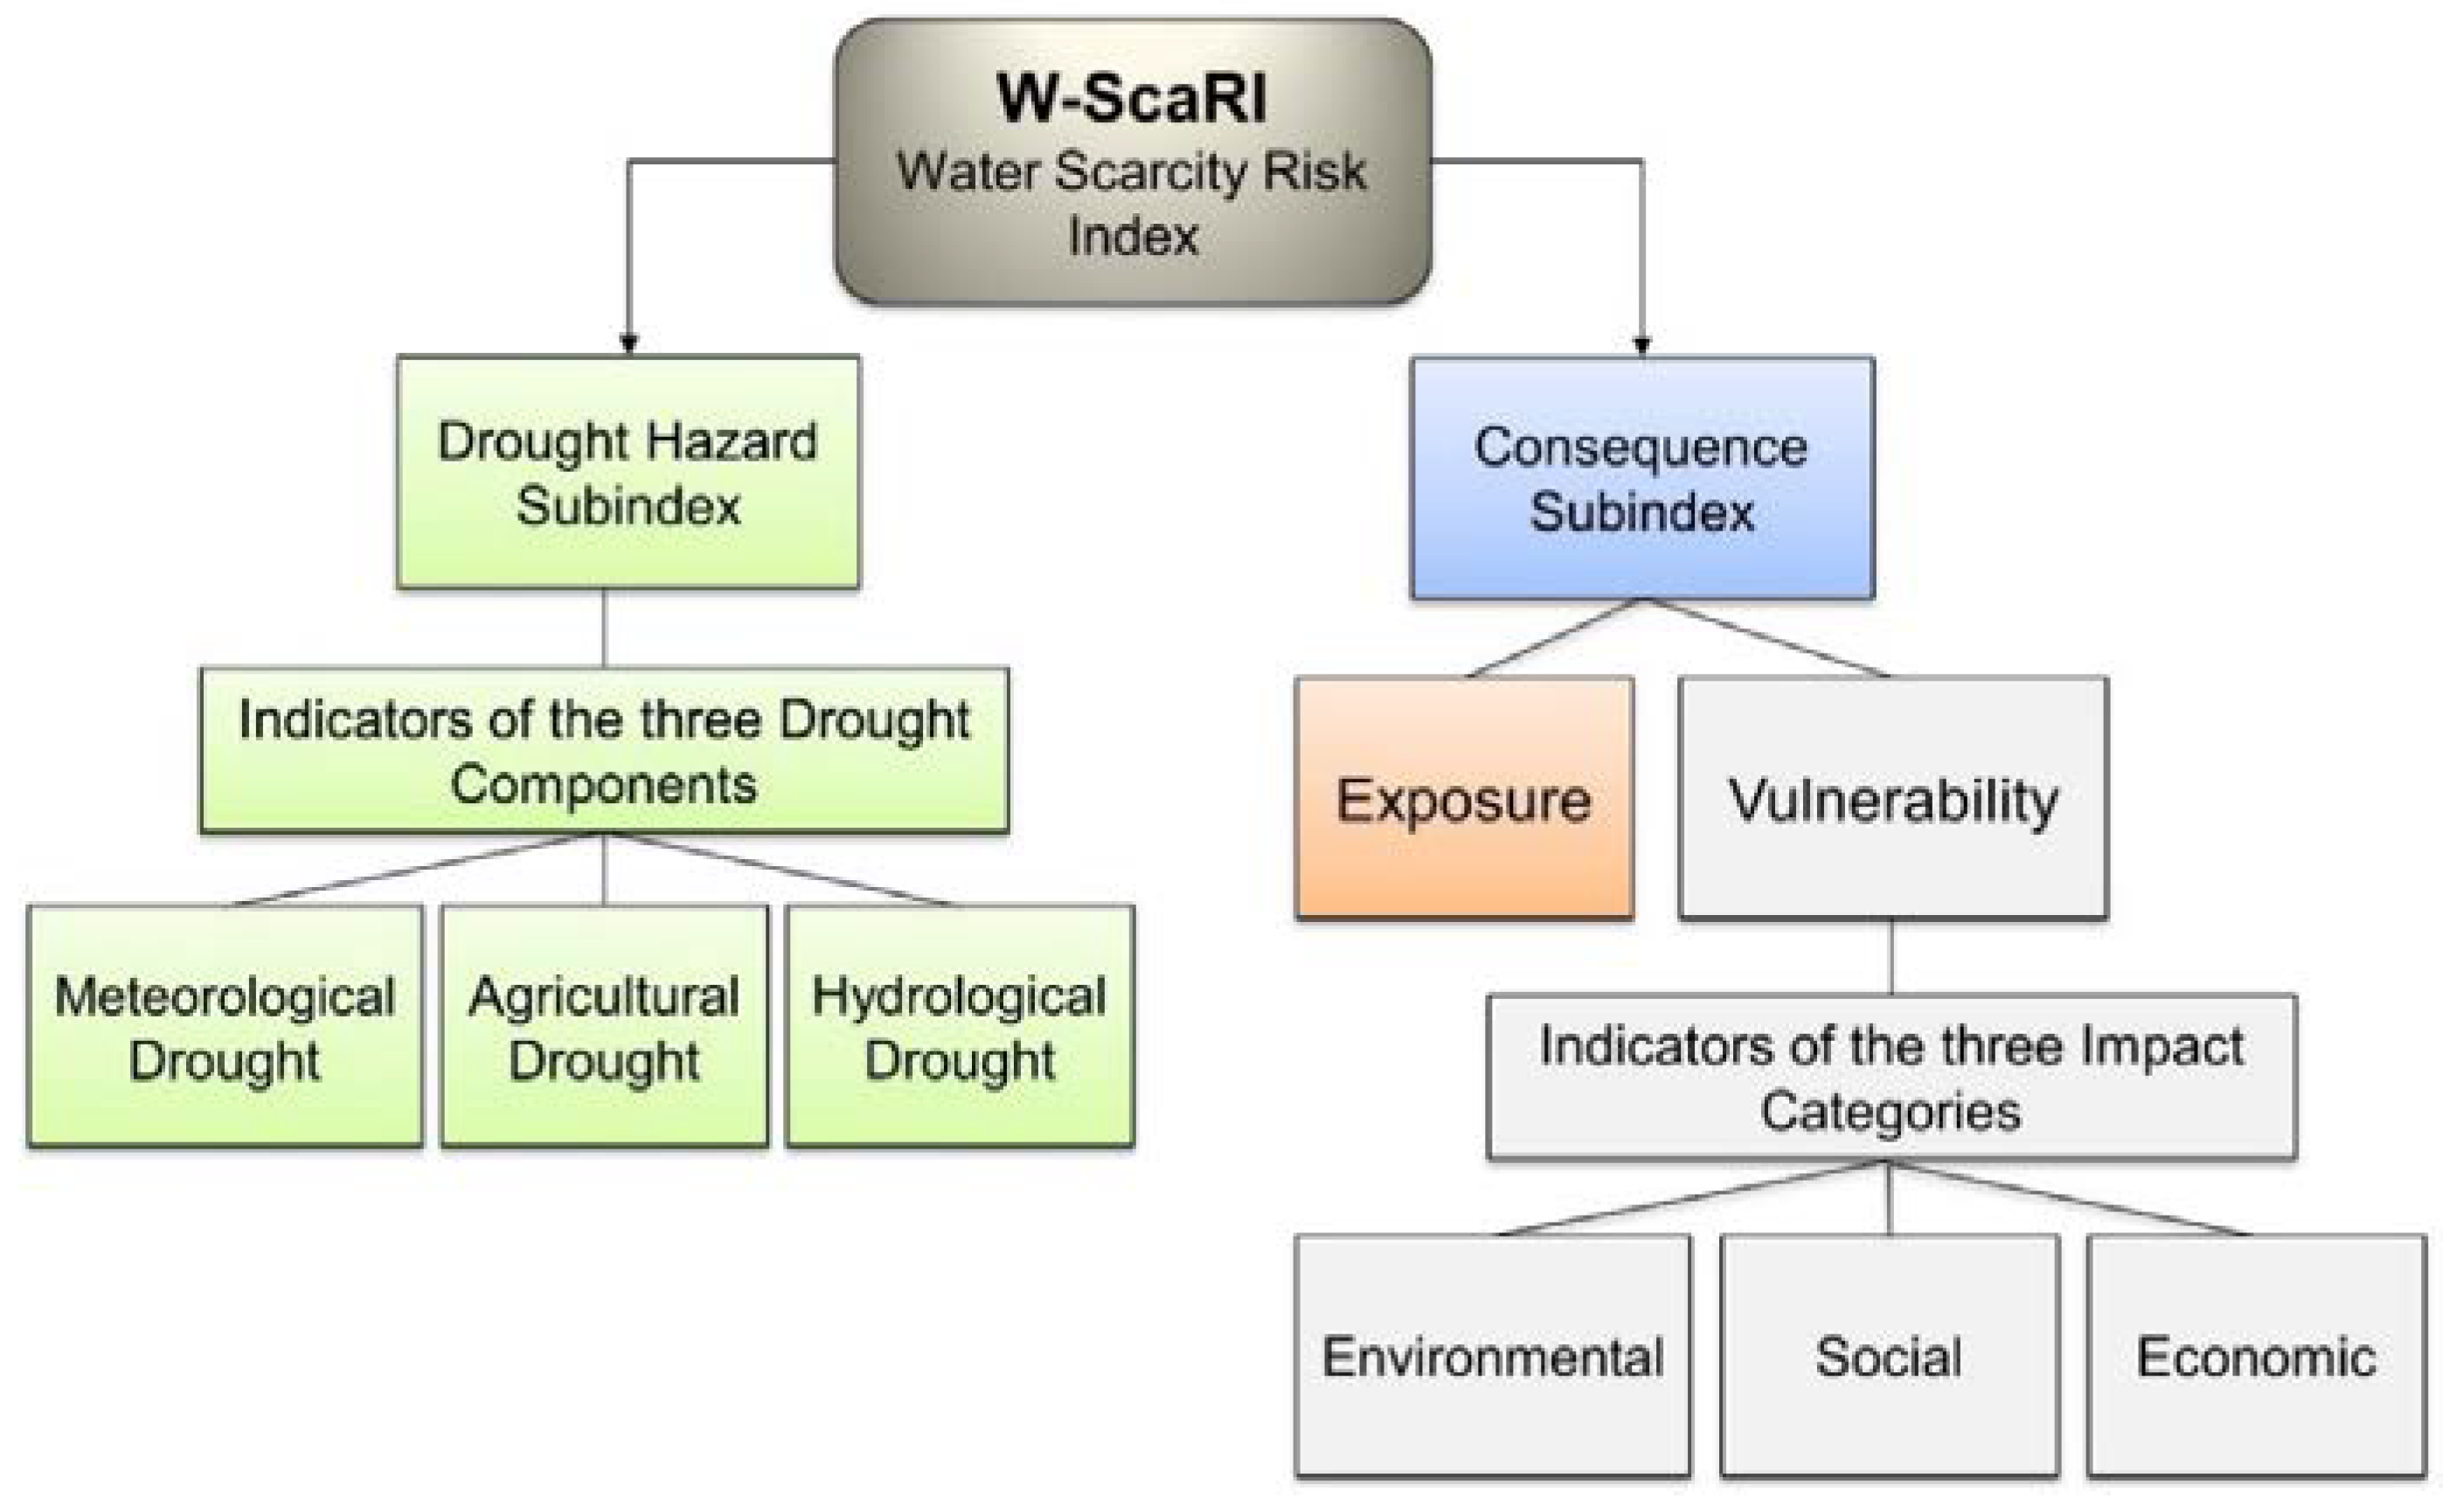
The W-ScaRI index proposed in this paper is built based on the risk formulation described by [3], where the drought risk is determined through two main components: a hazard and its consequences. A hazard is a potentially threatening situation that causes damage, and it is composed of a combination of atmospheric processes and hydrological responses, reducing the available water in lakes, rivers, reservoirs and/or soil. The consequences reflect the exposure and vulnerability of a system to the environmental, social and economic impacts of droughts. The vulnerability component also includes resilience, which is a system’s ability to adapt to or recover from damage. Thus, the risk caused by water scarcity comes from the drought itself, as well as from the aspects of water and land management.
The “hazard” and “consequence” subindices are constructed by combining the indicators or indices selected from the existing technical literature but also by using indicators originally proposed and developed in the current study. The W-ScaRI is based on a mixed formulation consisting of a weighted product of two weighted sums. Thus, each subindex is composed of weighted summations, and, subsequently, these subindices are weighted and multiplied to compose the W-ScaRI. The W-ScaRI is illustrated in Figure 1 and is represented by Equation (1):
where HI is the drought hazard subindex; CI is the consequence subindex; and wh and wc are the weights associated with the hazard (HI) and consequence (CI) subindexes, respectively.
Note that this formulation is chosen to represent the risk process conceptually. The product indicates that risk only exists if the hazard and possible negative consequences are both non-zero elements. However, the hazard and its consequences are subindices composed of a sum of a set of possible components that contribute to each one of these risk elements. Regarding the scale of the W-ScaRI, to clarify communication and maintain simplicity, its subindices and indicators are normalized within the range of 0 to 1, where the value “0” corresponds to the minimum risk (or the absence of risk, to be precise) and “1” corresponds to the maximum risk.
The drought hazard subindex consists of indicators representing the three components that characterize different aspects of droughts: meteorological, agricultural/green water and hydrological/blue water (Figure 1). The hazard subindex formulation is presented in Equation (2):
where MDI, ADI and HDI are the hazard indicators of meteorological, agricultural/green water and hydrological/blue water droughts, respectively, and wm, wa and wh are the weights associated with each indicator.
The Standardized Precipitation Index (SPI) developed by McKee et al. [36] is used to represent the meteorological drought indicator (MDI). The SPI consists of the difference between the measured precipitation and the historic average rainfall (over a given period of time) divided by the standard deviation. Since precipitation does not typically follow a normal distribution, the gamma distribution is adjusted, and gamma transformation is applied to the normal distribution. To facilitate analyses, we propose a color scale for the drought classes and the SPI values, as shown in Table 1.
To normalize the indicators, three equations are adjusted considering the typical probability values of the normal distribution and the SPI values between “0” and “−3”. To normalize the indicator between 0 and 1, the cumulative probability values of a normal curve are adopted, assuming that the SPI values equal to −1, −2 and −3 are associated with the cumulative probabilities up to 1, 2 and 3 standard deviations at the right side of the curve, as shown in Table 2.
The Reconnaissance Drought Index (RDI) developed by Tsakiris and Vangelis [38] is used to represent the agricultural drought indicator (ADI), which addresses water deficits as a kind of balance between the entry and exit of a water system. The RDI is calculated based on information about the accumulated rainfall (observed) and the potential evapotranspiration (calculated). The initial RDI values satisfactorily follow both the gamma and lognormal distributions [39,40].
The hydrological drought indicator (HDI) used to represent the hydrological drought hazard is the Streamflow Drought Index (SDI) [41], as shown in Equation (3):
where Vi,k is the cumulative flow volume of the hydrological year i in the reference period k, and and Sk are the mean and standard deviation of the accumulated flow volumes, respectively.
The SDI is calculated by adjusting a two-parameter log-normal distribution [41].
For both RDI and HDI, the drought classification (Table 1) and the indicator normalization (Table 2) are the same as those used for the SPI index.
The consequence subindex (CI) is characterized by indicators that represent the system exposure and by three groups of vulnerability indicators that comprise the main drought impacts: environmental, social and economic impacts. The formulation of the consequence subindex is presented in Equations (4)–(6):
where ExI is the exposure indicator; VI is the vulnerability indicator; EnVI is the environmental vulnerability indicator; SVI is the social vulnerability indicator; EVI is the economic vulnerability indicator; and wex, wen, ws and we are the weights of these indicators, respectively.
To represent the exposure (ExI), two indicators are used. The first indicator (ExI1) is the water stress indicator, which is used in order to link the consumption demands of the various water uses in the basin to the water availability. Values close to zero indicate that there is a water surplus in the basin. Values close or equal to 1 denote that almost all the available water is used to supply the various water uses. The second exposure indicator (ExI2) is the percentage of the reservoir equivalent storage (VEqR), which is used by the Brazilian National Water Agency (ANA) to monitor the evolution of reservoir useful storage in the main Brazilian basins [42]. This is calculated by dividing the sum of the accumulated storages of the existing reservoirs in the basin, at a given moment, by the sum of the total useful storages of these reservoirs. It is a strategic method to consider the joint effect of several in-line reservoirs. To apply this method to other places, the same logic can be used when one or more reservoirs are upstream of the interest catchment.
Equation (7) shows how to calculate ExI2 from the VEqR results:
Table 3 shows the drought classifications based on the VEqR and ExI2 value ranges and the color scales proposed in this study.
The ExI2 indicator cannot be used if the basin does not have reservoirs. In this situation, the weight of the indicator is zero, and the weight of the ExI1 indicator is 1.
For the environmental vulnerability indicator (EnVI), the qualitative water balance indicator, Bqual (%), is used according to [43] and as shown in Equation (8):
where Wcons is the discharge representing the consumed water (m3/s); Wavail is the water availability (m3/s); and Wdil is the necessary flow to dilute a given effluent (m3/s), which is calculated according to Equation (9):
where BODL is the sum of the biochemical oxygen demand (BOD) load of the domestic sewage discharged in the basin (mg/s), and BODC is the maximum allowable BOD concentration in the water course (mg/L) that enables the following water uses: human consumption after conventional treatment; the protection of aquatic communities; primary contact recreation; and irrigation.
EnVI is calculated by dividing Bqual by 100. For values of Bqual greater than 100, EnVI is equal to 1.
Population density (PD) is used to represent the social vulnerability indicator (SVI). Thus, the higher the density, the greater the expected social impacts of water scarcity. The indicator is calculated for each municipality in the study area based on a linear equation that normalizes the population density. To adjust this equation, the country’s average population density is associated with a vulnerability equal to 0.5, while the value of the city with the highest population density in the country is associated with a vulnerability of 1 (Table 4), creating a local scale (that can be adapted to other regions or countries) that can help with risk comparisons. This procedure allows the for the application and comparisons of the indicator in different urban or metropolitan regions of the reference country. The final integrated indicator for the study area is calculated using the weighted average of the population of each considered municipality.
The following indicators are used to represent economic vulnerability: gross domestic product (GDP) per capita (EVI1) and the level of competition with human supply (EVI2). The use of GDP per capita aims to characterize the exposure of economic activities to the risk of water scarcity (considering that water is an important input to most significant economic activities). Thus, the higher the GDP per capita of a region, the greater the impact in a situation of water scarcity. This indicator is calculated for each municipality in the study area based on a linear equation that normalizes the GDP per capita. To adjust this equation, the country’s average GDP per capita is associated with a vulnerability equal to 0.5, and that of the city with the highest GDP per capita in the country is associated with a vulnerability of 1 (Table 5). This procedure allows for the application and relative comparisons of the indicator in different regions of the country. The final integrated indicator for the study area is calculated using the weighted average of each municipality’s GDP.
Usually, when water scarcity occurs, the use of water is prioritized for human consumption and animal watering. This principle is also stated in the Brazilian “water law” (Federal Act 9433/97). Therefore, any other type of water use can be firstly impacted in water scarcity cases. The second indicator of economic vulnerability (EVI2) is the level of competition for the general use of human water supplies; this indicator is built with the purpose of characterizing the impacts on industrial activities located in basins where water is used for human supplies. Thus, in a basin where there are both industrial and human water supply abstractions, the lower the flows abstracted for industry supply compared to those abstracted for human supply, the greater the vulnerability. EVI2 is expressed by Equation (10):
where Qi is the flow abstracted by the industrial sector (m3/s); Qa is the flow abstracted by the human supply sector (m3/s); and Qcap is the total flow abstracted (m3/s).
In the final assessment of each subindex, weights are applied to each group of hazard and vulnerability indicators. Similarly, weights are also used for the subindices in the W-ScaRI’s final calculation. The weight sensitivity study, as well as the insertion of the resilience component in the W-ScaRI, which led to development of the proposed index, is carried out at a later stage of the research project.
It is important to highlight that the present work develops the structure of the index and evaluates its potential application. Thus, the definition of weights, although essential in practical applications to effectively use the index as a management tool, is of secondary relevance until the final index formulation proposal is achieved. Table 6 shows the weights used in this study, which were equally divided among the indicators.
The sum of the weights of the meteorological (MDI), agricultural (ADI) and hydrological (HDI) drought indicators are considered equal to 1 in the hazard subindex calculation. The weights of the exposure indicators, water stress and % VEqR are considered equal to 0.50.
3. Study Area
The area where the W-ScaRI is tested is the Rio de Janeiro Metropolitan Region (RJMR) (Figure 2), the largest urban agglomeration of the Brazilian coastal zone, with a population of about 12.4 million in 2017 [44].
A large part of the RJMR population, around 82%, representing almost 10 million inhabitants, is supplied water by the Guandu/Lajes/Acari system. This system currently produces a total discharge of 52.4 m3/s, of which 45 m3/s comes from the Guandu System, 5.5 m3/s comes from the Lajes Reservoir (Lajes System) and 1.9 m3/s comes from the Acari system [45].
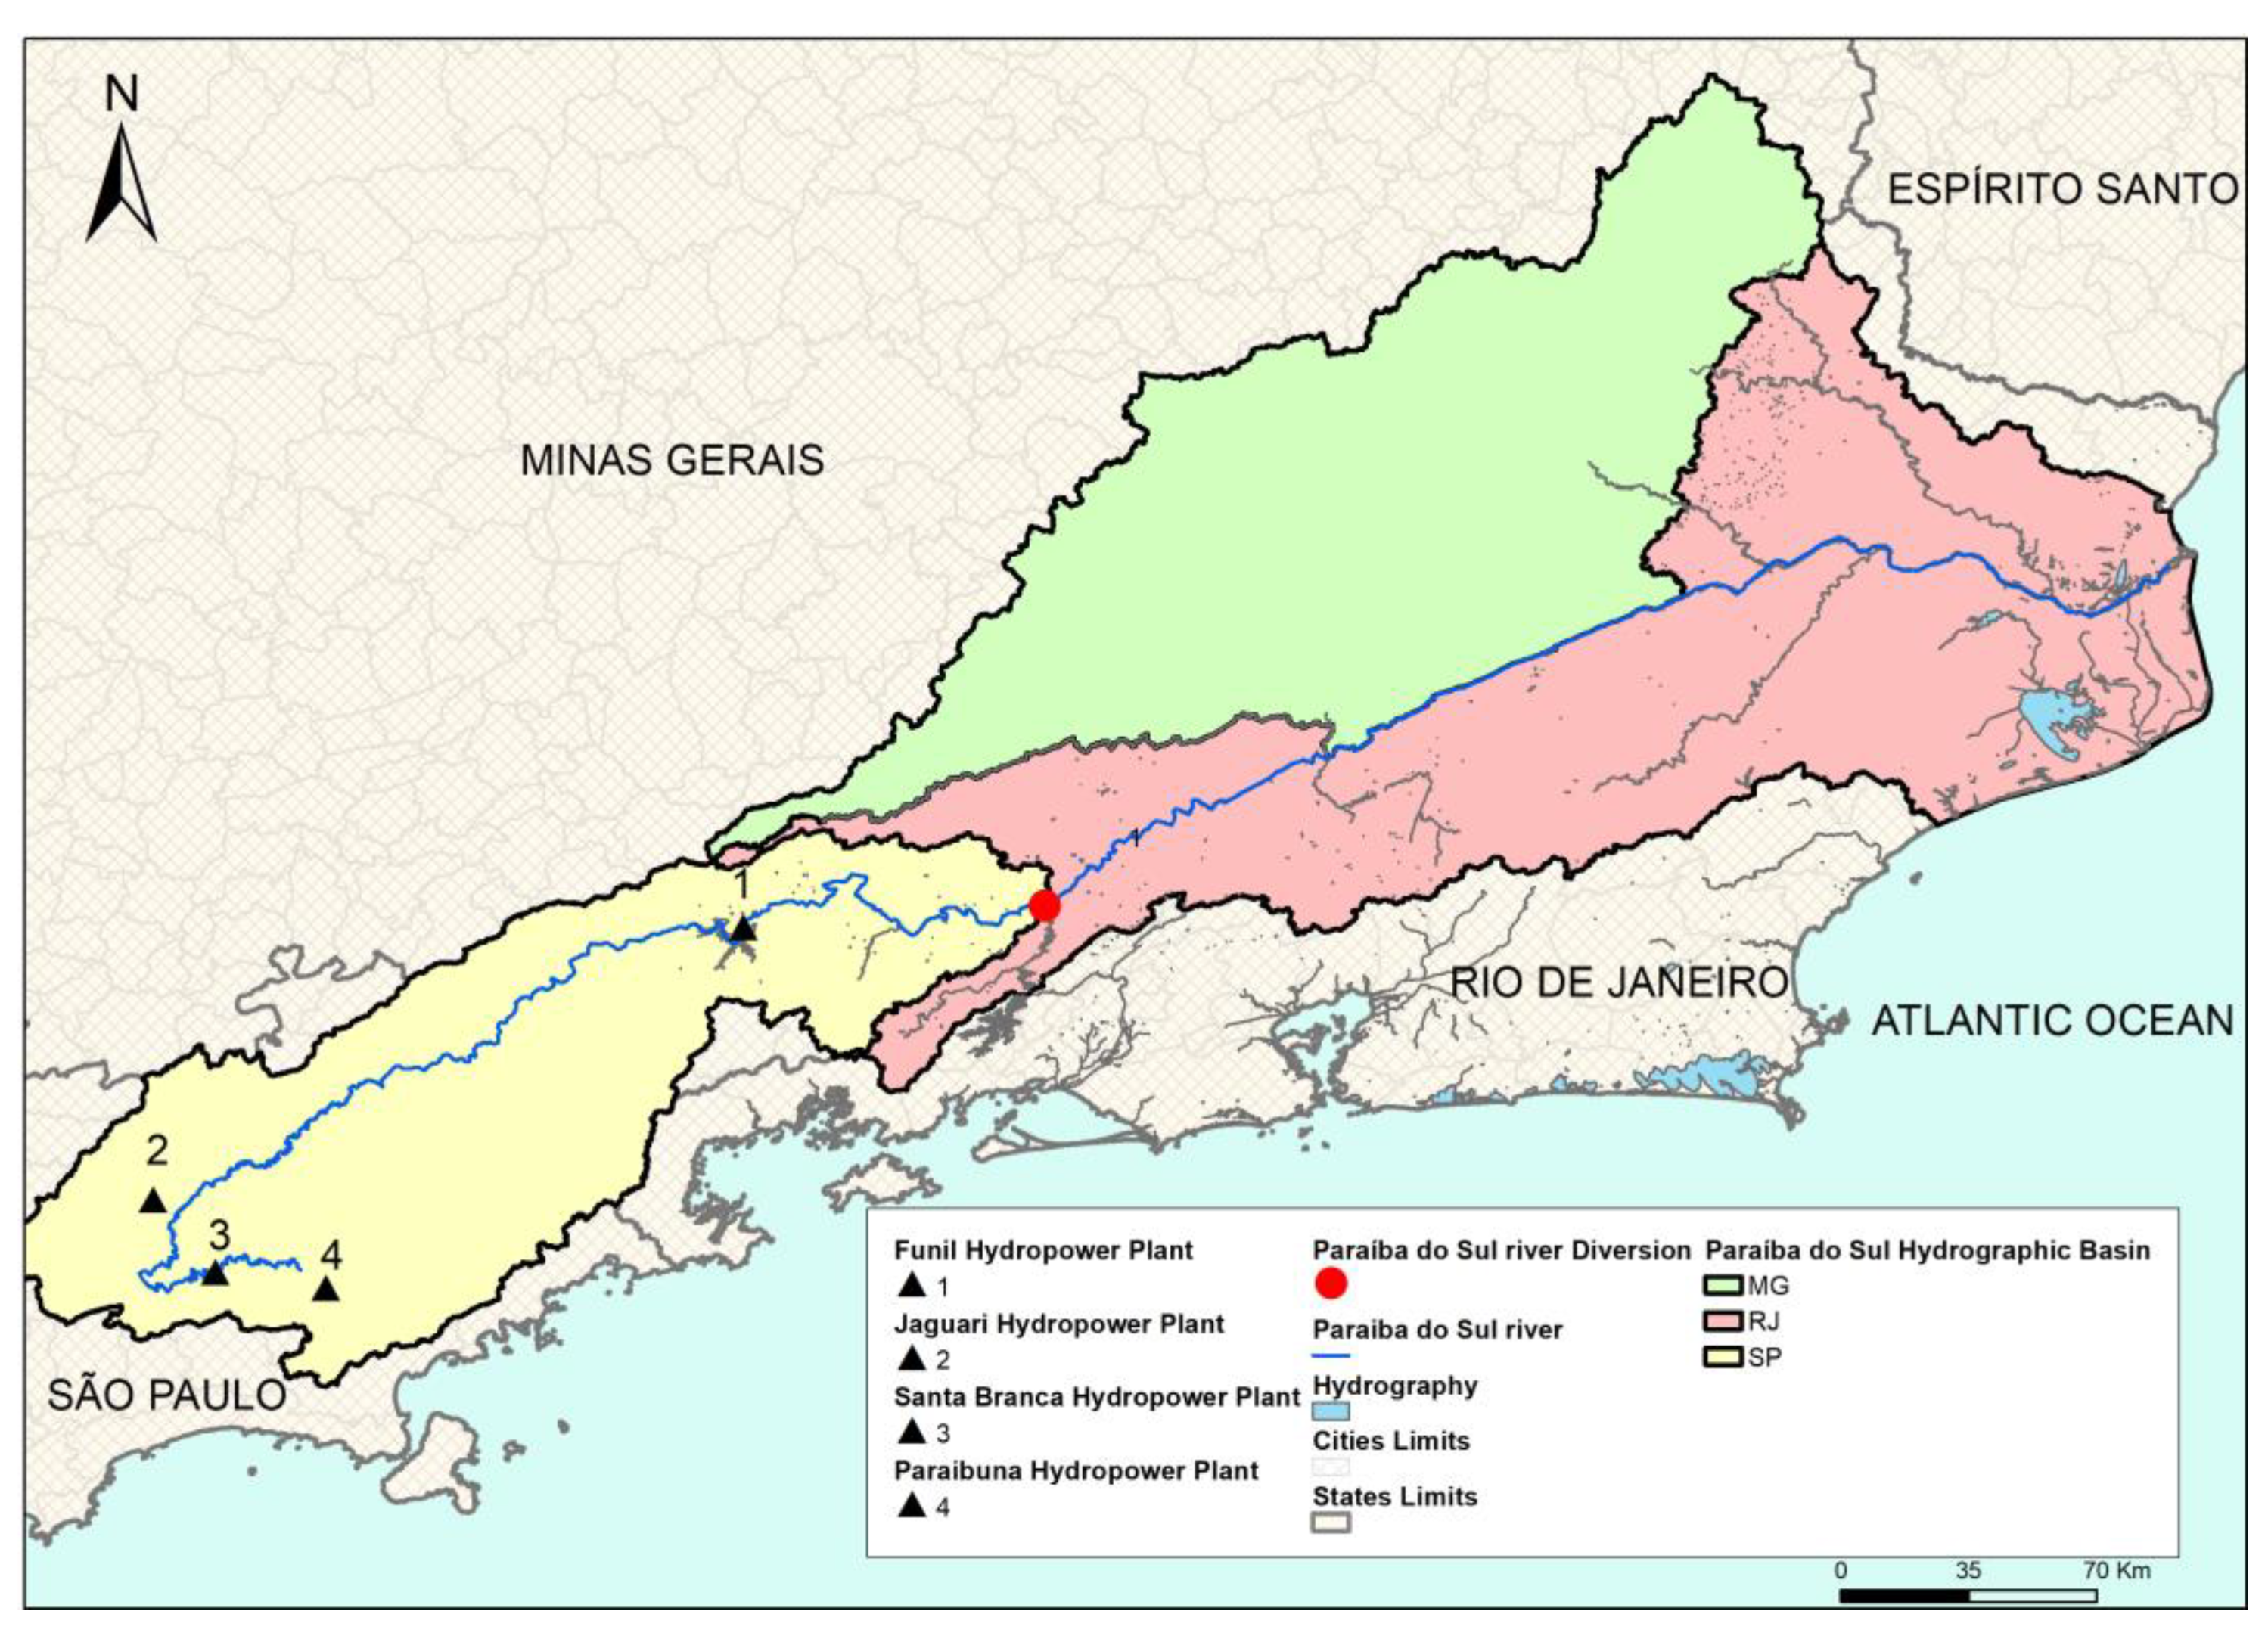
The main source of water for this supply system is the Paraíba do Sul River Basin (Figure 3), which covers an area of 61,307 km², involving three of the most developed states in the country—São Paulo (13,934 km²), Minas Gerais (20,699 km²) and Rio de Janeiro (26,674 km²) [46]. The Paraíba do Sul River is formed by the union of the Paraibuna and Paraitinga Rivers in the Bocaina Mountains, in the State of São Paulo, at an altitude of 1800 m.
The basin has a complex system, which includes accumulation reservoirs, power plants and pumping stations, as well as a water transposition system with the original purpose of generating electricity in the Lajes Hydroelectric Complex (RJ). However, today, this system supplies water to most of the RJMR.
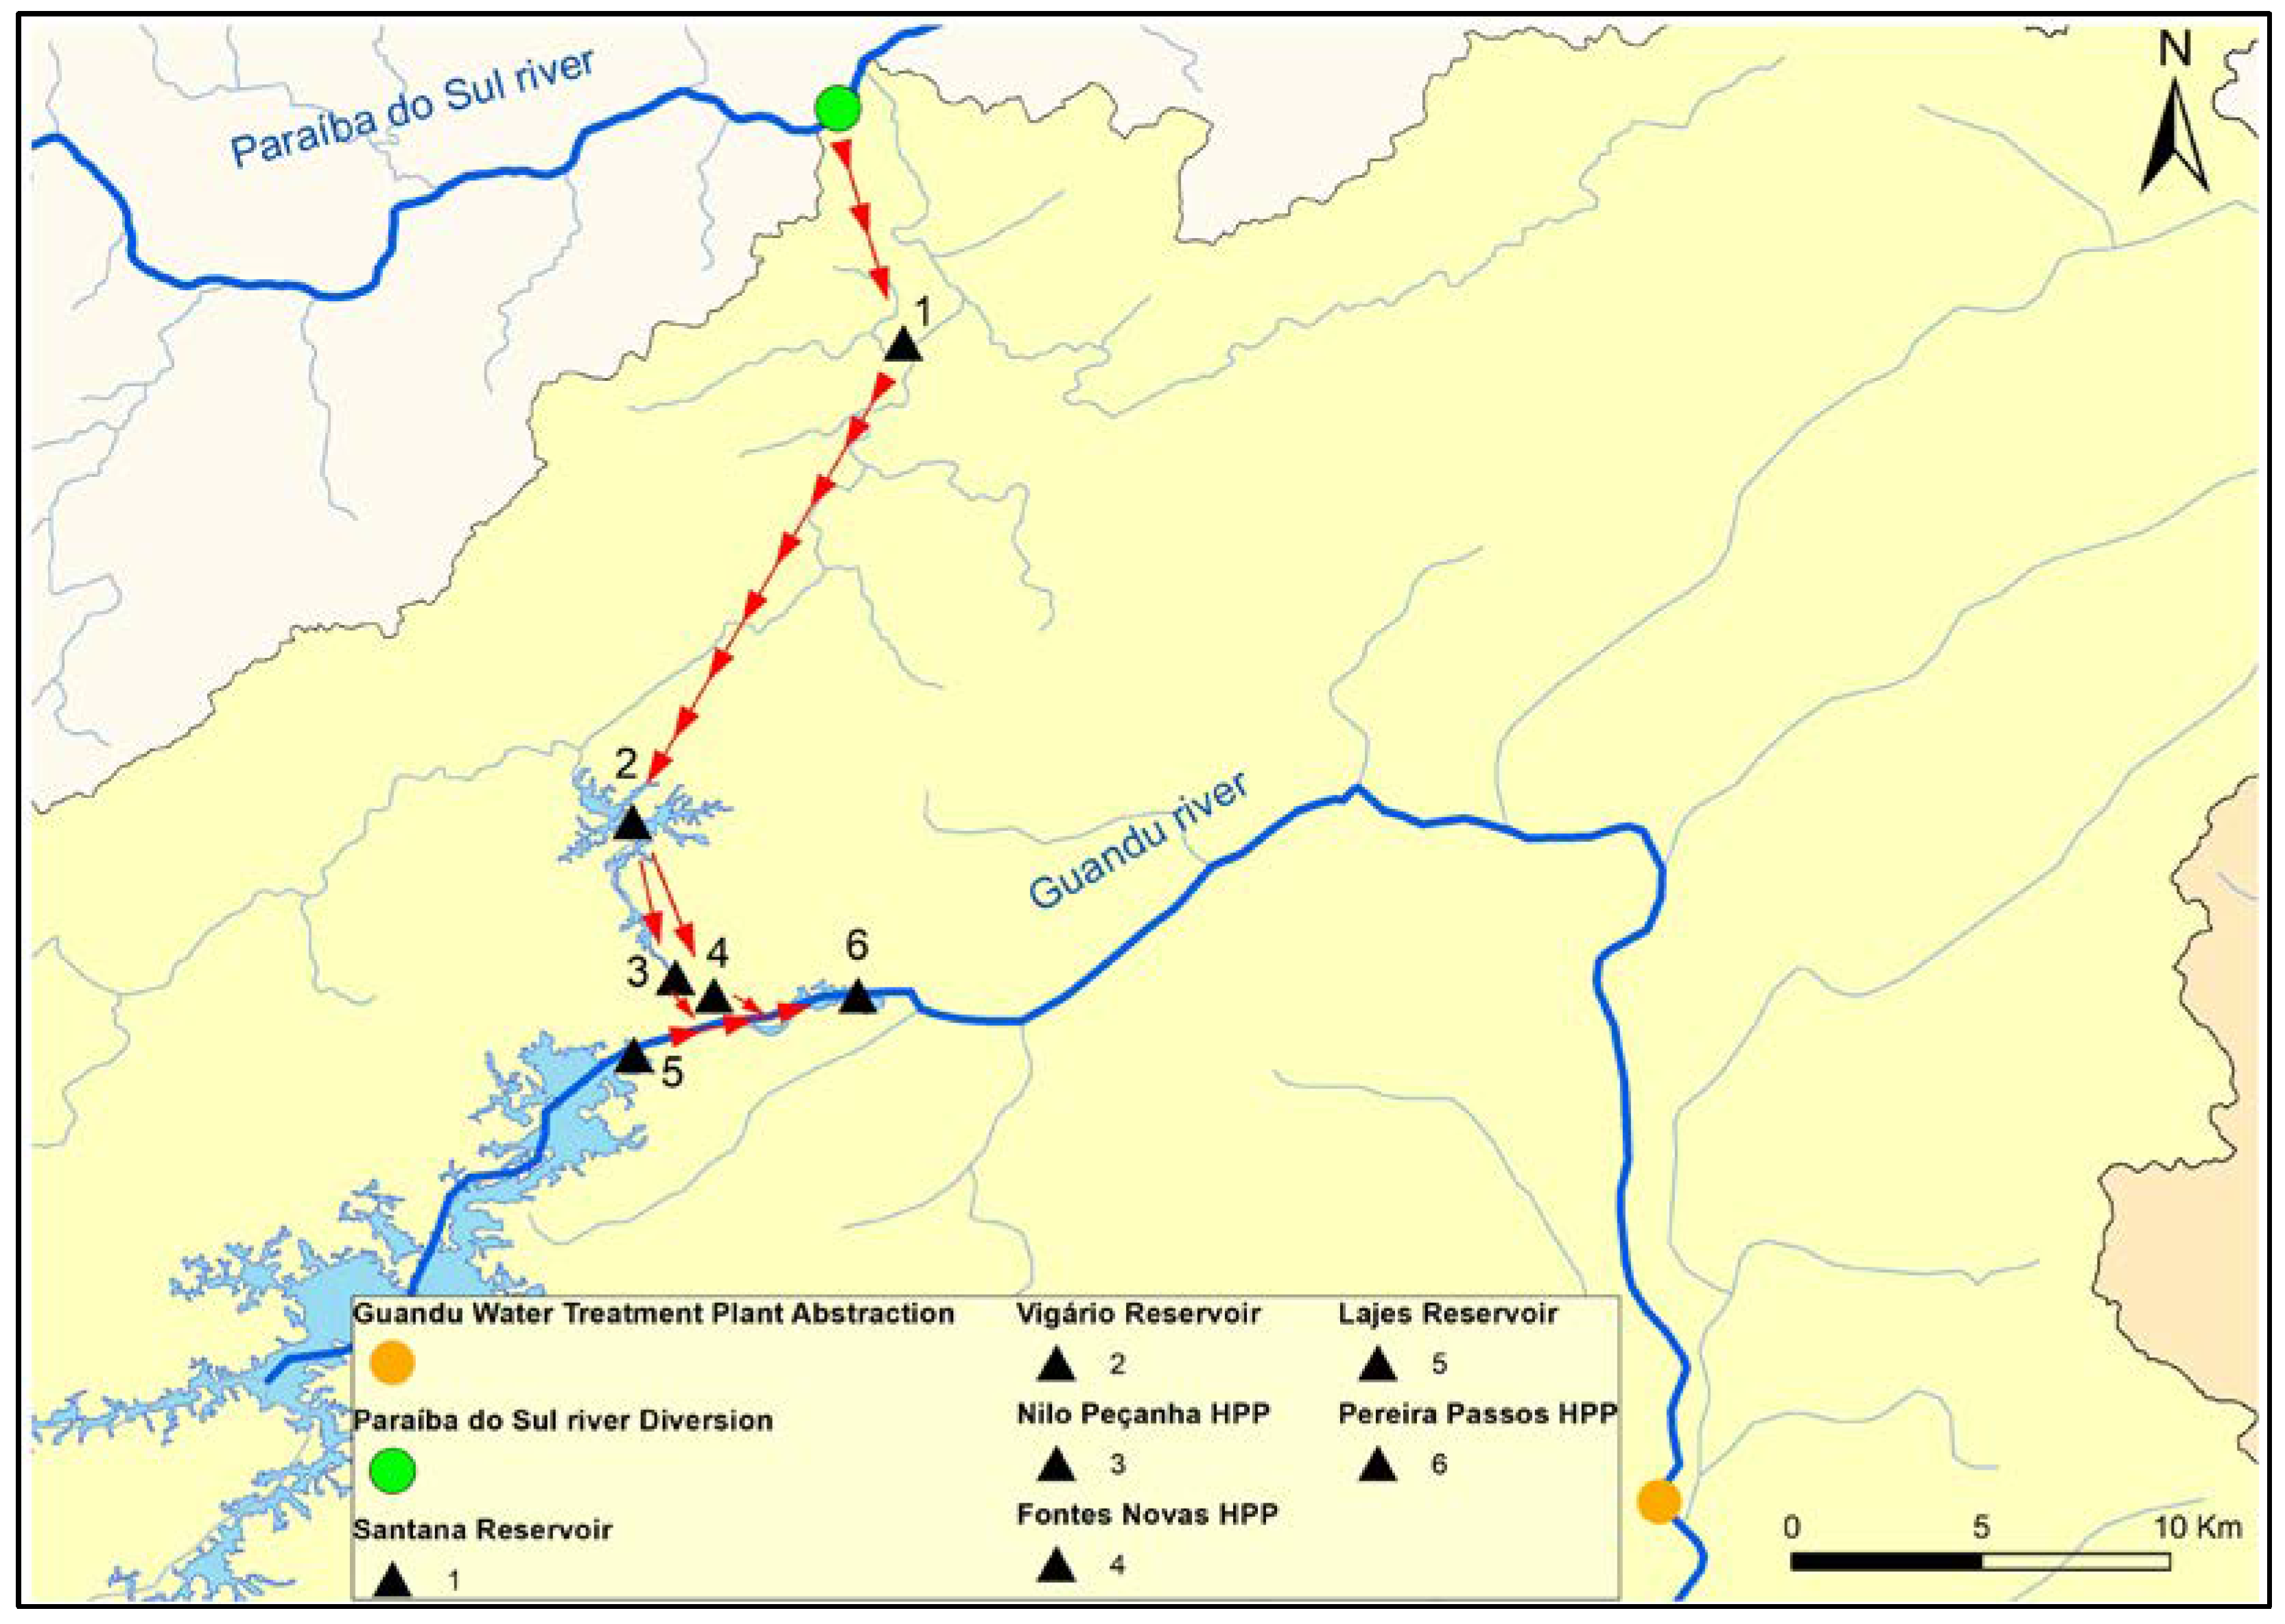
The Paraíbuna, Santa Branca, Jaguari and Funil Hydroelectric Plants, located along the headwaters of the Paraíba do Sul River, regulate its flow, allowing water diversion from the main transposition of the basin. This diversion is accomplished by the Santa Cecília Dam, in the city of Barra do Piraí, offering a maximum pumping capacity of 160 m3/s. The water is carried to the Santana Reservoir, and it is pumped from there to the Vigário Reservoir. The accumulated water in the Vigário Reservoir is then diverted by gravity to the Serra do Mar Atlantic hill, and it is sent to the Nilo Peçanha and Fontes Nova Power Plants. The outflows from these plants and the Lajes Reservoir are sent to the Ponte Coberta Reservoir (Pereira Passos Power Plant), located on the Lajes Stream, which is the Guandu River’s main source. The operation of the Pereira Passos Hydropower Plant (HPP) must ensure the continuity of the supply to the Guandu water treatment plant and other users of the Guandu River Basin [47]. Figure 4 illustrates the steps of this complex water transfer system from the Paraíba do Sul River to the Guandu River.
In the last 25 years, two critical droughts have occurred in the Paraíba do Sul Basin. In the first one, from 2003 to the beginning of 2004, the storage level of the flow regulating the reservoirs of the Paraíba do Sul River indicated the possibility of rationing, including for the RJMR. Faced with the possibility of a water crisis, the ANA issued resolutions that resulted in a flow reduction downstream of the Santa Cecília Dam, in the derivation to the Lajes Complex in Santa Cecília, and downstream of the Pereira Passos HPP on the Guandu River [43].
In the 2014–2015 period, the severe water scarcity in the Southeast region of Brazil affected the two most important metropolitan regions of the country: Rio de Janeiro (RJMR) and São Paulo (SPMR). Regarding the RJMR, the storage volume of the reservoirs of the Paraíba do Sul River Basin showed the need to use the dead volume of some reservoirs, which actually started to happen at the end of January 2015. In order to preserve reservoir stocks and, at the same time, ensure water uses, reductions in the minimum inflows to the Santa Cecilia Reservoir were gradually allowed, together with periodic assessments of the impacts on water uses downstream [48]. In addition, the flow reduction downstream of the Pereira Passos HPP was also authorized.
4. Results and Discussion
Since the Paraíba do Sul River is the main water supply source for the RJMR, the indicators of the hazard subindex were applied to this river basin, upstream of the Santa Cecília Dam, as follows:
- Meteorological and agricultural droughts: Several precipitation and temperature monitoring gauges.
- Hydrological drought: The SDI indicator was applied to the series of natural flows to the Santa Cecília Reservoir (transposition site), and for analysis purposes, it was applied to the series of other reservoirs in the basin.
The consequence subindex indicators were applied as follows:
- Exposure: The water stress indicator (ExI1) was applied to the Guandu Basin between Pereira Passos HPP and the mouth. The equivalent reservoir volume percentage indicator (ExI2) was applied to the reservoirs in the Paraíba do Sul River Basin, upstream of the Santa Cecília Dam (transposition site).
- Environmental vulnerability: The qualitative water balance indicator (IVA1) was applied to the Guandu Basin and the rivers located in the municipalities supplied by the Guandu/Lajes/Acari system.
- Social vulnerability: The population density of the municipalities supplied by the Guandu/Lajes/Acari system.
- Economic vulnerability: The economic activities of the municipalities supplied by the Guandu/Lajes/Acari system and industries in the Guandu Basin.
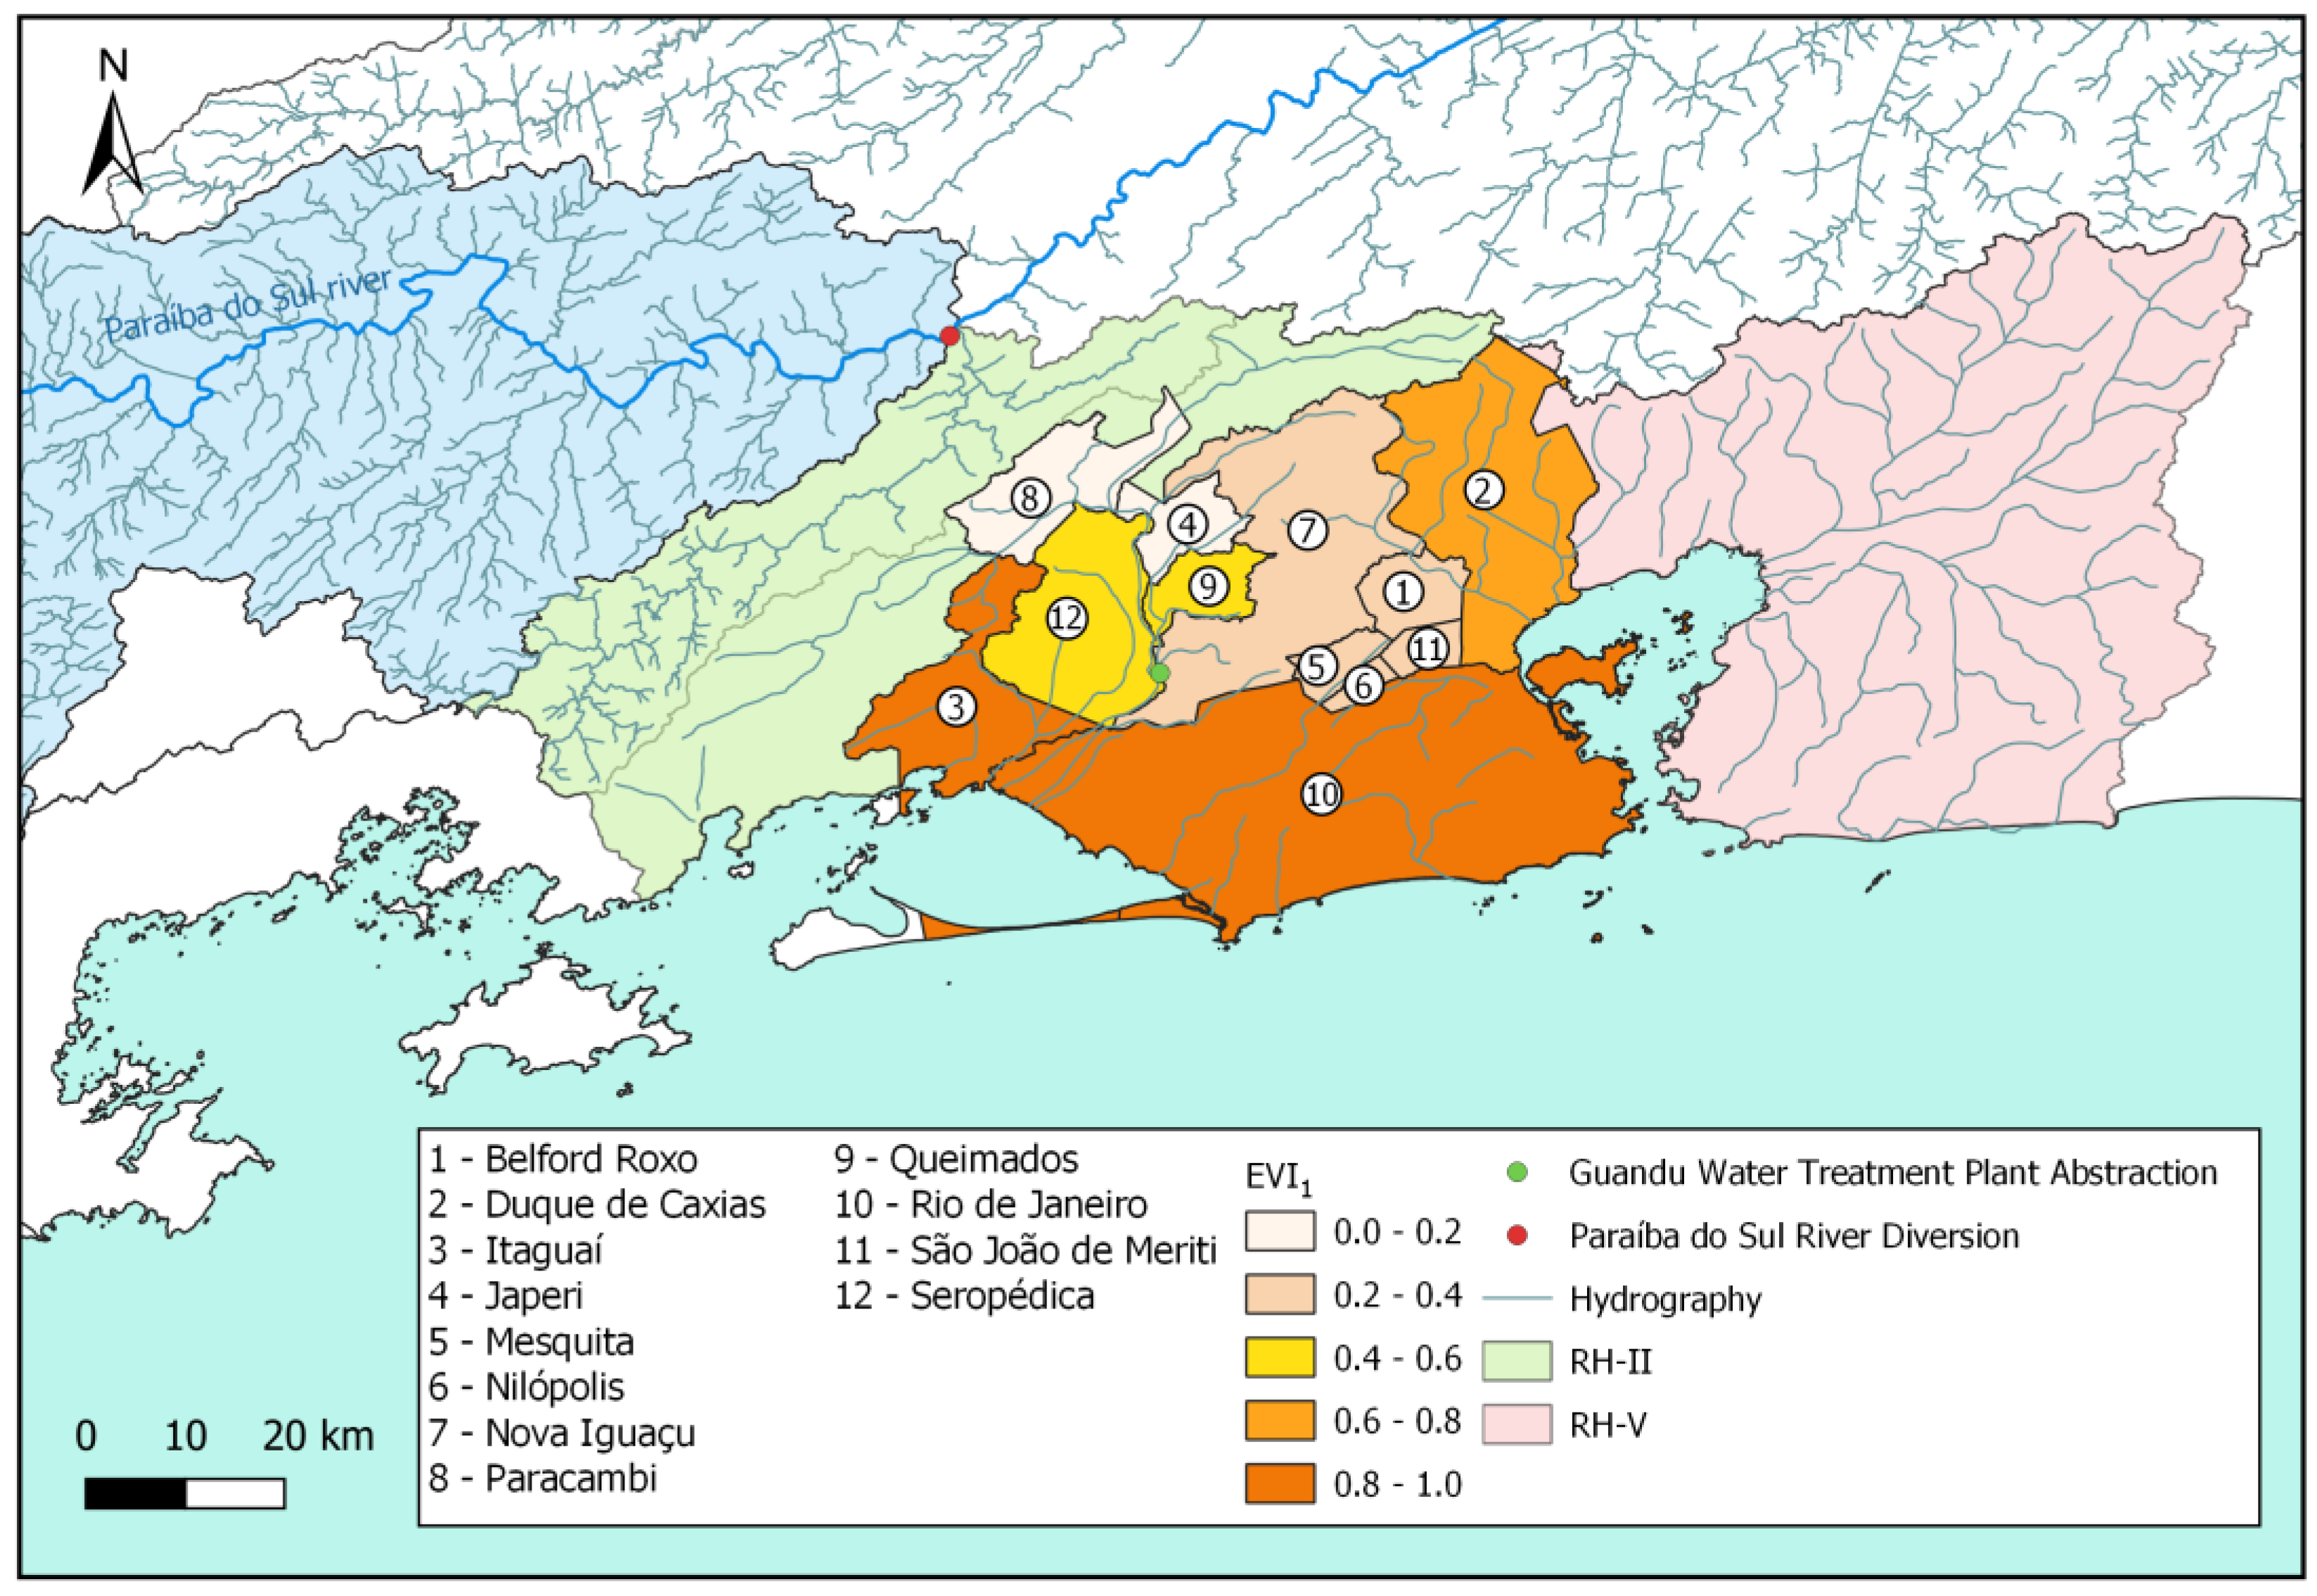
Figure 5 shows the region where the W-ScaRI was applied. The W-ScaRI was applied to January 2015, when the equivalent reservoir of the Paraíba do Sul Basin reached one of its lowest values, and to October 2015, at the end of the water crisis. To apply the SPI, RDI and SDI indices, the DrinC computer program was used [37].
4.1. Data Collection and Analysis
The data used to calculate the W-ScaRI indicators/indices are presented in Table 7.
4.2. Hazard Subindex
4.2.1. Meteorological Drought Indicator (MDI)
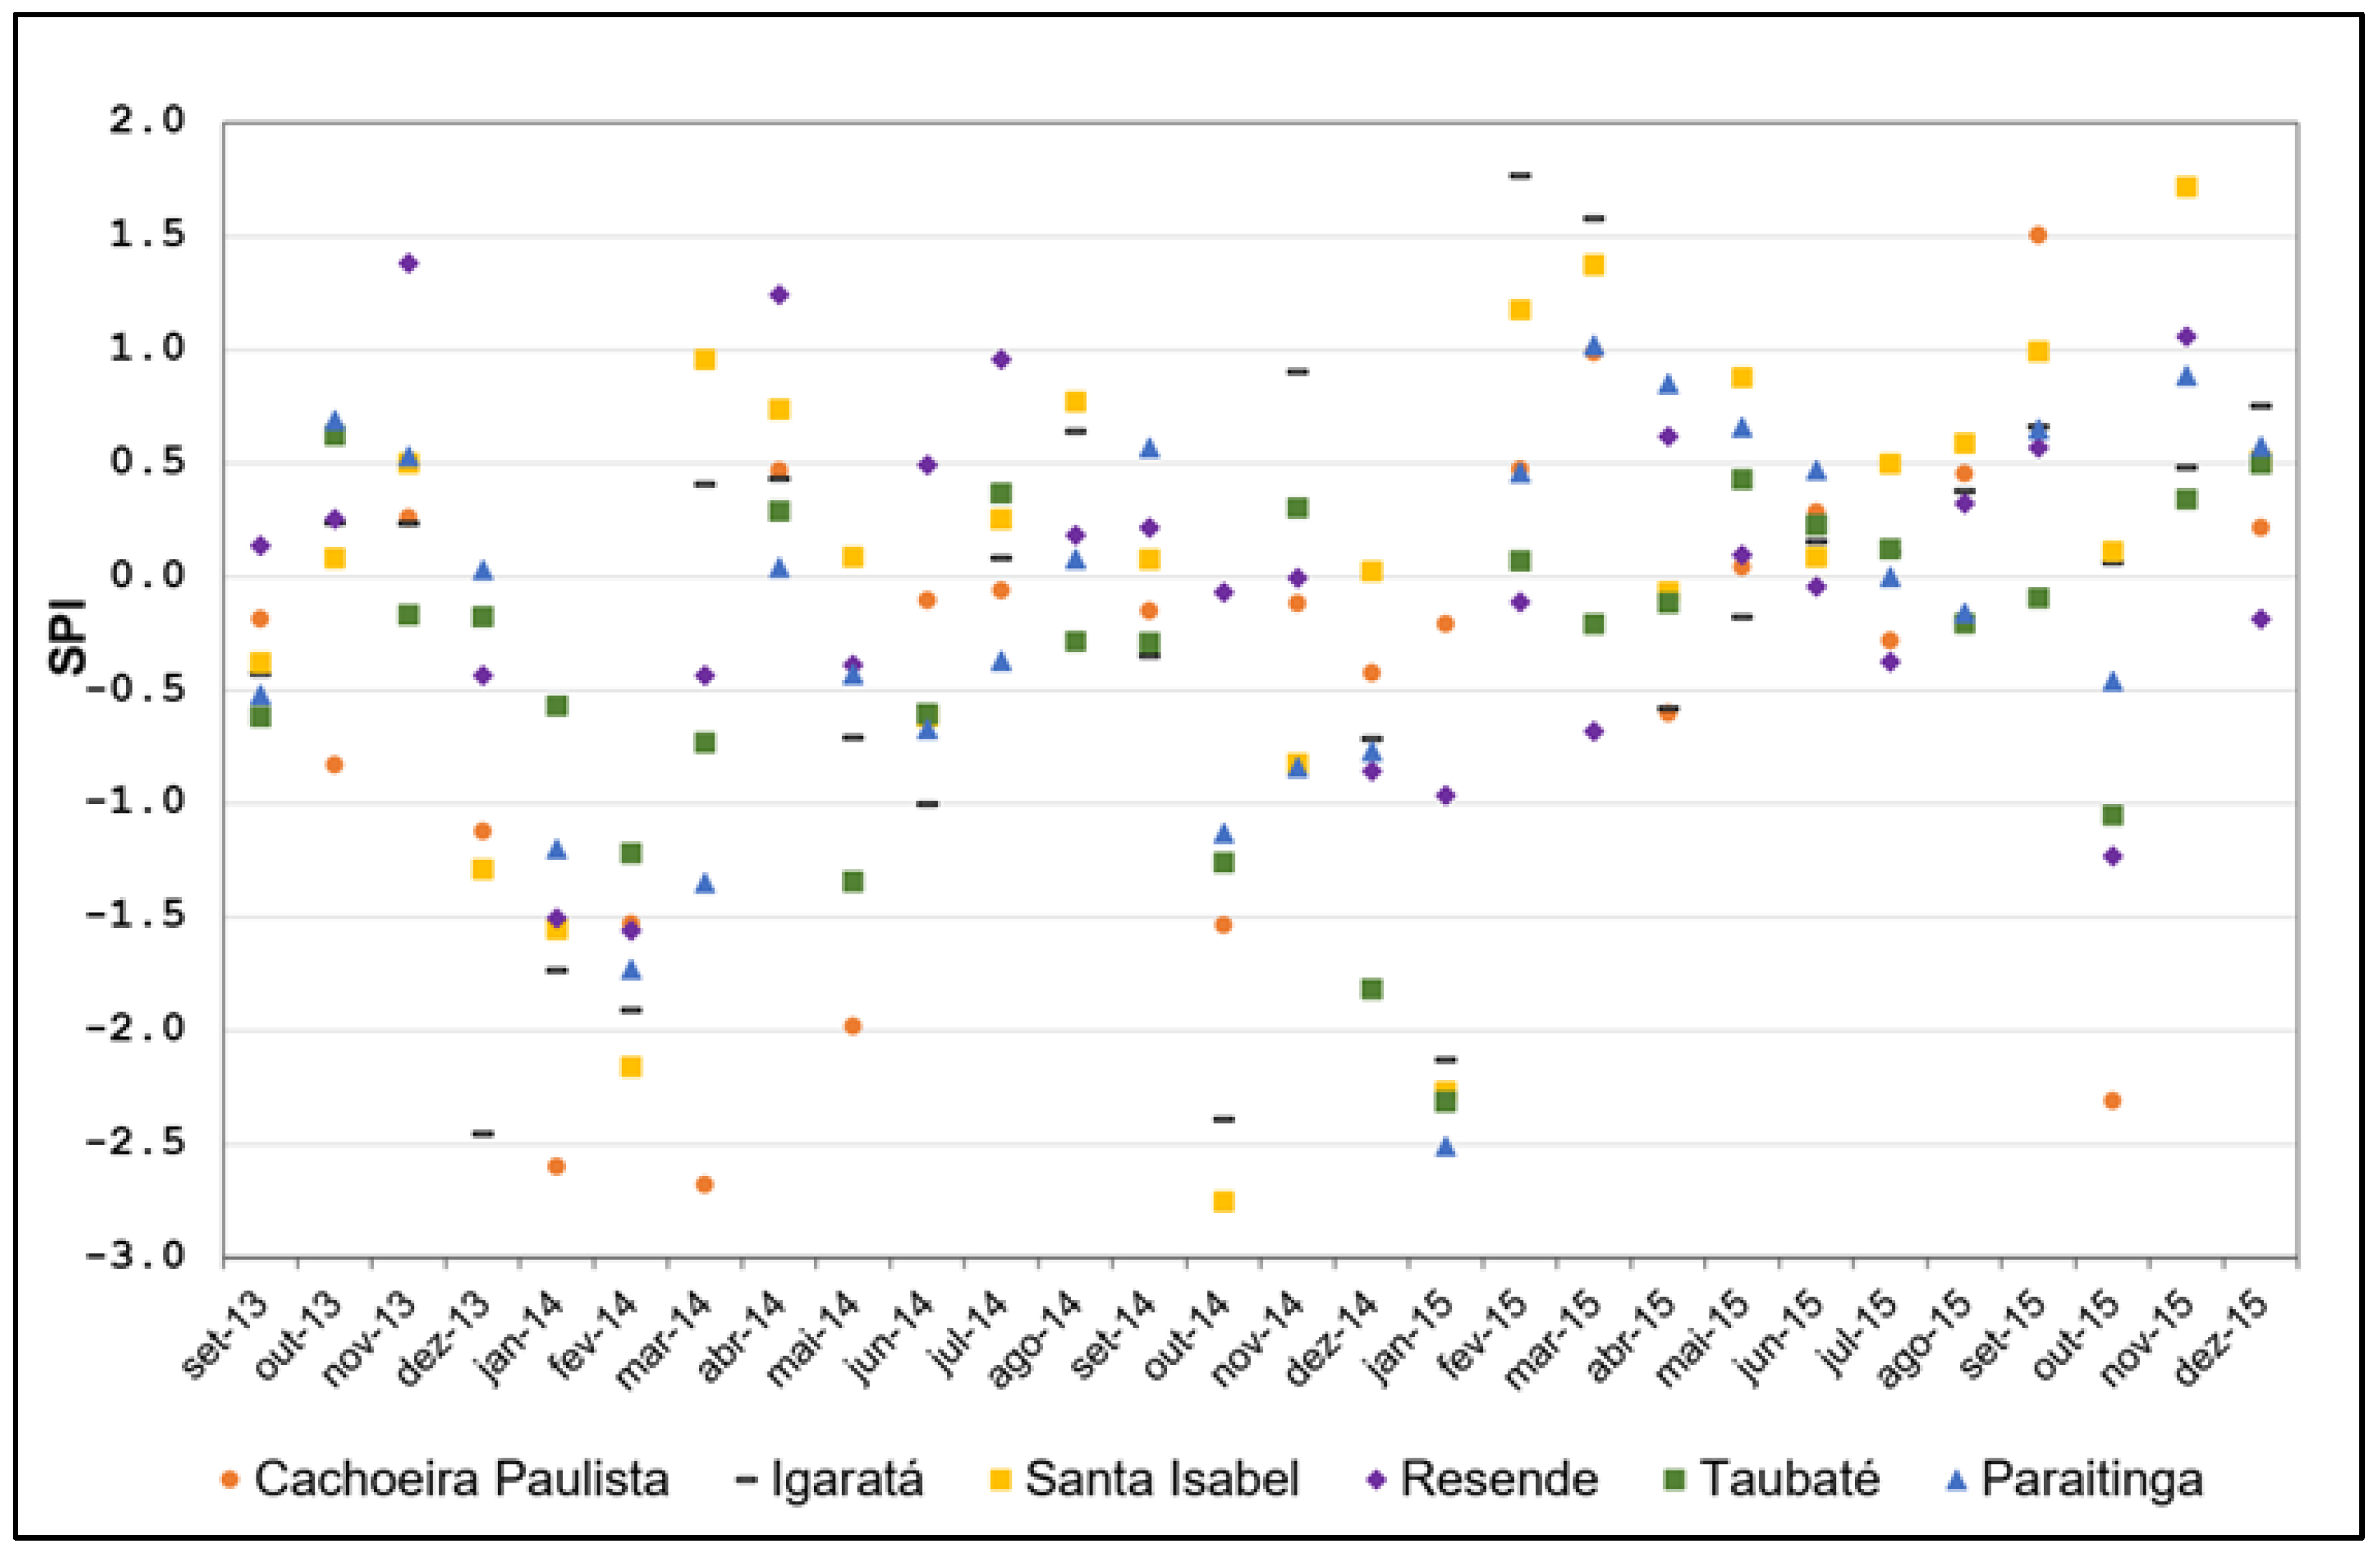
The SPI index at each rainfall gauge was calculated for monthly durations (Figure 6) for a period of severe drought in the basin (2013–2015). Figure 6 shows that drought began to occur at the end of 2013, extending practically throughout 2014 until January 2015. Starting in February 2015, there was an increase in rainfall at all measuring gauges, reflecting the increase in SPI. However, even with a few wetter months, the water stress situation in the basin lasted for most of 2015. In November, the rainfall returned to normal at all gauges, and the basin’s reservoirs began to recover.
It is important to highlight that drought is more severe in the Paraíba do Sul Basin when critical SPI values occur in summer (rainy season). In this situation, the reservoir levels may not recover before the dry season begins.
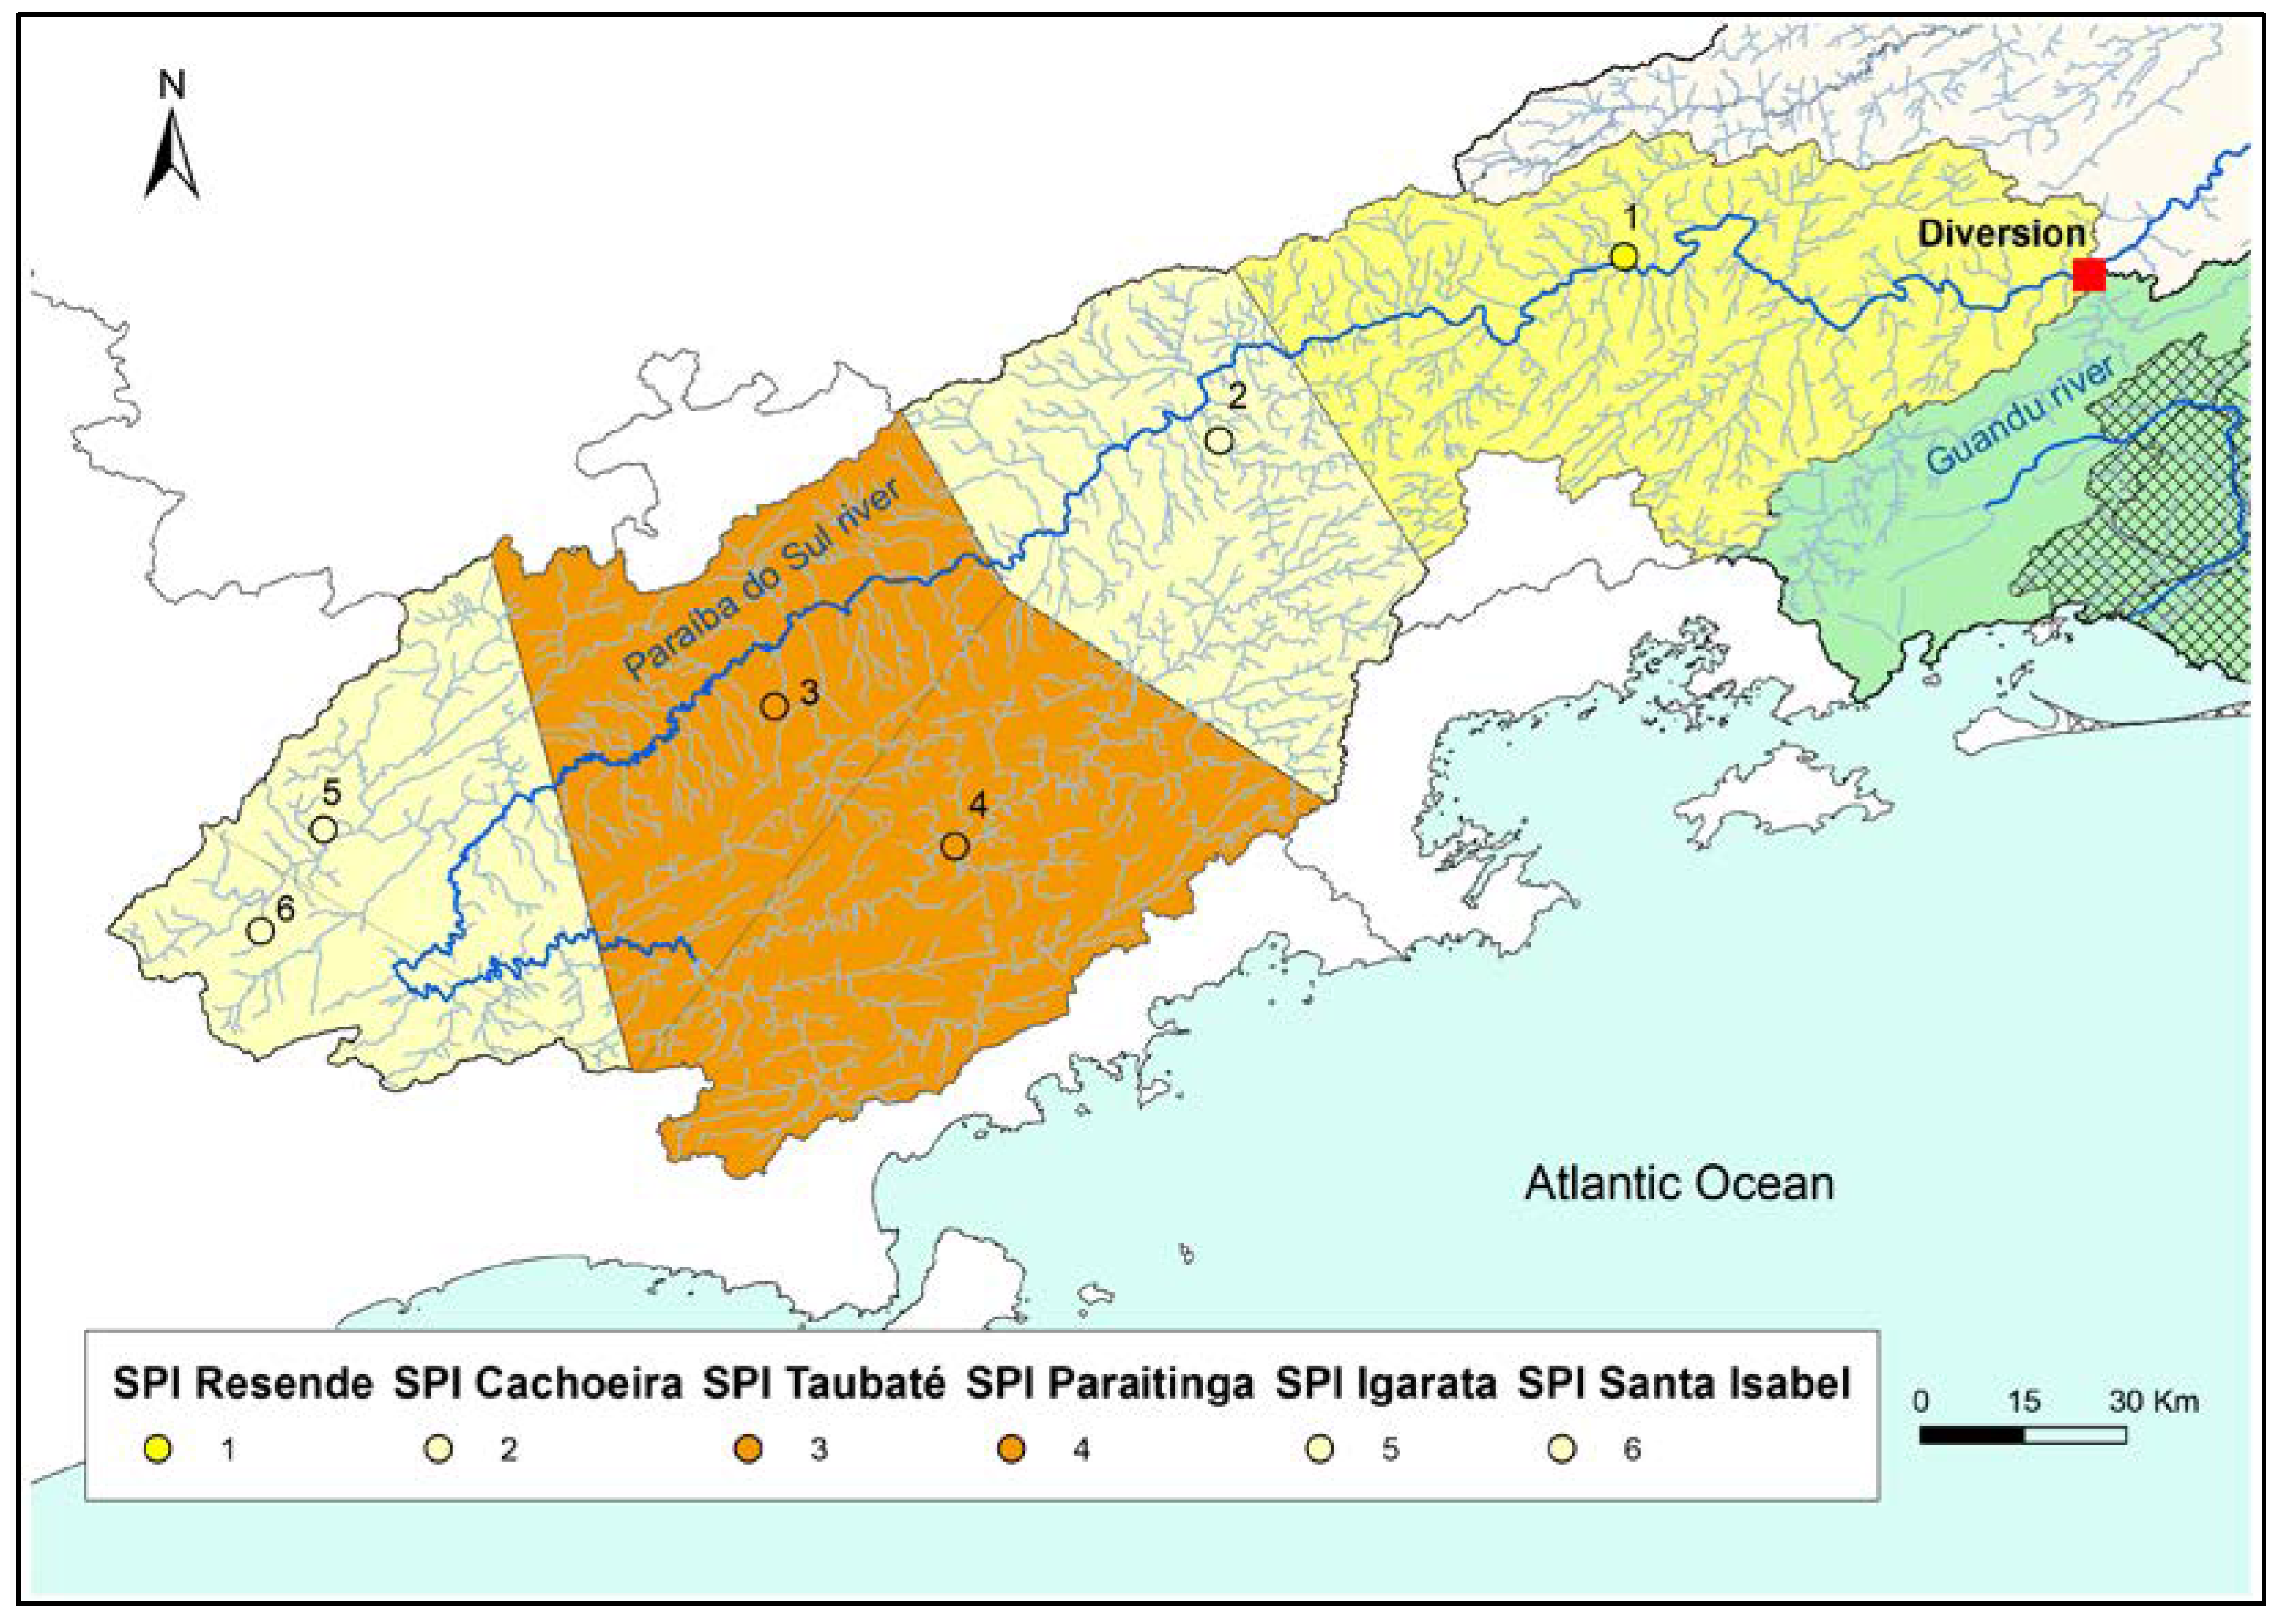
Figure 7 shows the SPI calculated for January 2015 at all gauges used in the study, considering the color scale presented in Table 1. This figure also shows the area of influence of each gauge, as defined using the Thiessen method.
A duration of 12 months, comprising the reference month and the previous 11 months, was considered in the final calculation of the meteorological drought indicator (MDI), which integrates the hazard subindex. For example, for January 2015, the SPI was calculated from February 2014 to January 2015. The SPI of each rainfall gauge was normalized using the procedure shown in Table 2. The MDI (Table 8) was calculated by using the weighted summation of SPI, where the weight of each gauge was determined using the Thiessen method.
4.2.2. Agricultural Drought Indicator (ADI)
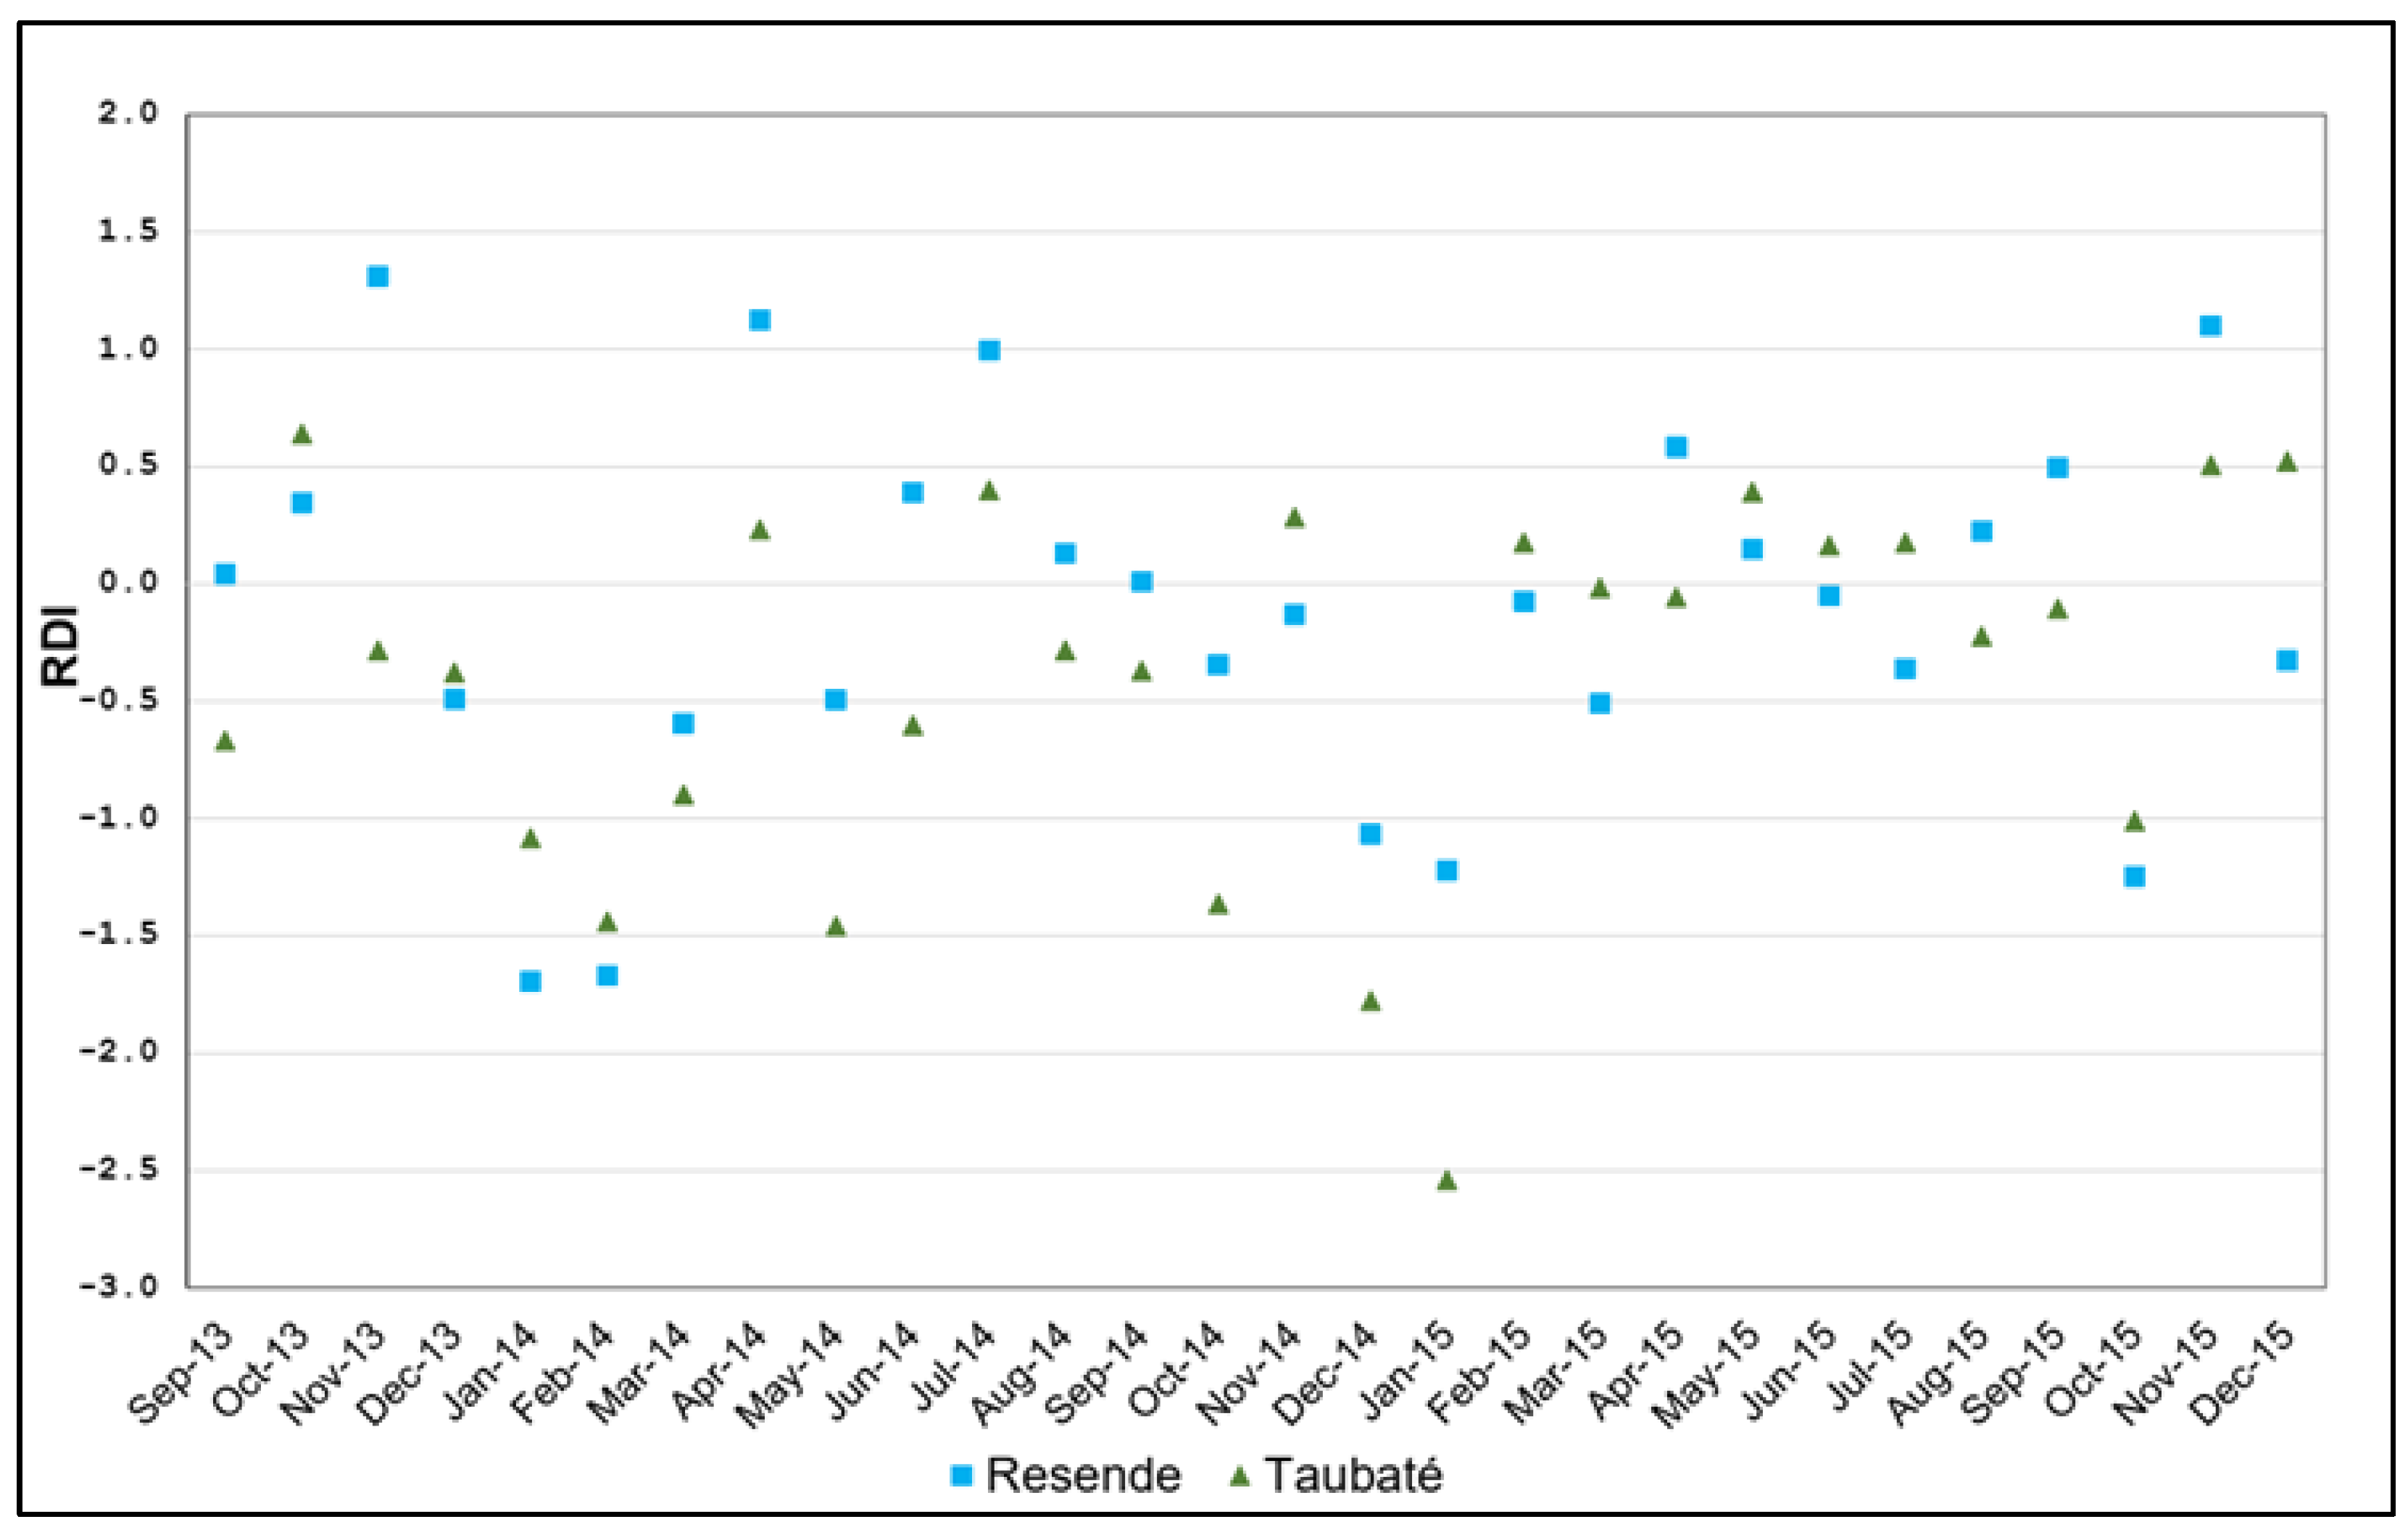
Figure 8 presents the RDI monthly duration results from September 2013 to December 2015.
Figure 8 shows that 2014 was drier than 2015. When a drought occurs in the rainy months, as mentioned earlier, it is negatively reflected in the available discharges.
4.2.3. Hydrological Drought Indicator (HDI)
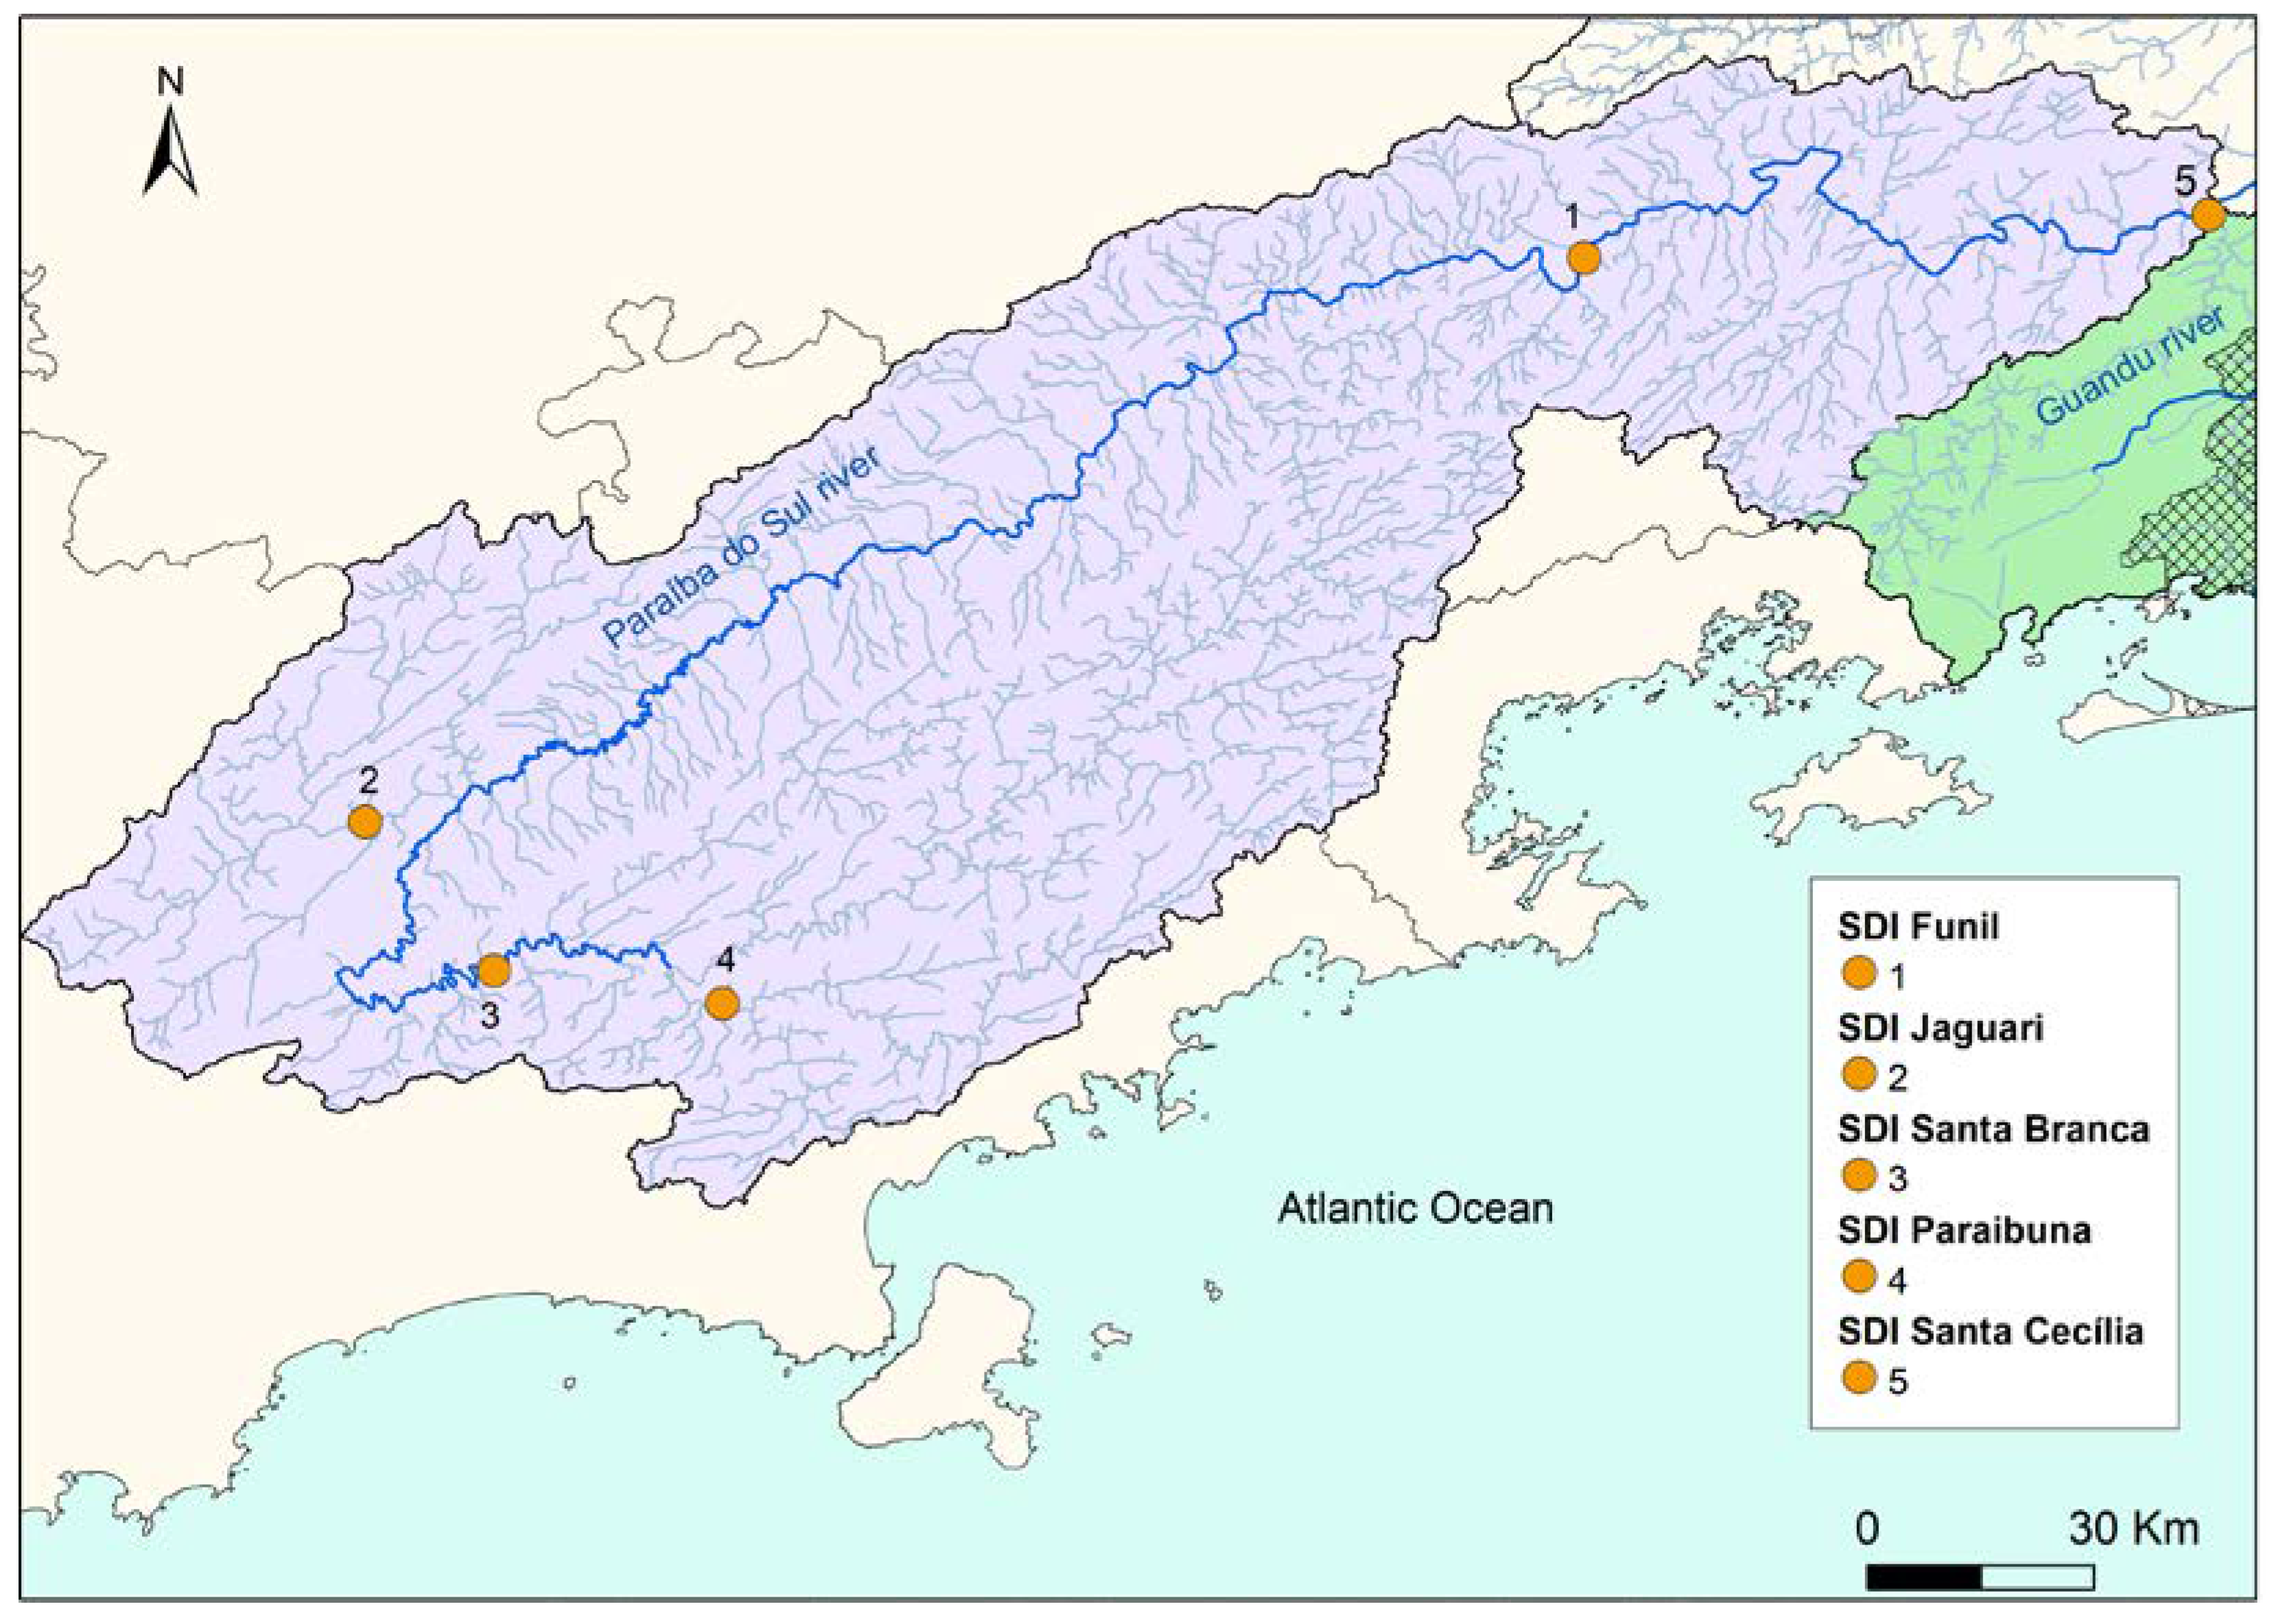
To apply the SDI index, the color scale classification presented in Table 1 is used, along with the series of natural discharges inflowing to Santa Cecília (diversion place) and the series of HPP reservoirs located in the basin, namely, Paraibuna, Santa Branca, Jaguari and Funil.
Figure 9 presents the SDI results for a monthly duration during a severe drought in the basin (2013–2015). This figure shows that there was an extremely dry period between January 2014 and October 2015, especially in February 2014 and January 2015, usually wet months, as observed in the SPI values. However, the SDI values over the period analyzed are more severe than the SPI values. This is probably due to the duration of the drought event, which extended over a long period of time. It is therefore important to analyze the SPI for longer durations.
Figure 10 shows the application results for January 2015 at the Santa Cecília, Paraibuna, Santa Branca, Jaguari and Funil Reservoirs. The Paraibuna HPP Reservoir (Figure 10) has the largest useful volume among the reservoirs under discussion, and it is the most relevant due to its storage capacity. This reservoir presented very low SDI values throughout the period, indicating an extremely severe drought. In fact, the Paraibuna Reservoir reached a zero useful volume in January and February 2015.
To calculate the hydrological drought indicator (HDI) in order to compose the hazard subindex, the SDI index was only calculated for the Santa Cecília Dam, which reflects the flows from the entire upstream basin. The calculation used the monthly duration, and the normalization followed the procedure used for the meteorological drought indicator. Table 10 presents the final application results of the HDI, where an extremely severe drought situation is observed in January 2015.
4.3. Consequence Subindex
The consequence subindex was determined using the method presented in the Section 2 and the data presented in Table 7.
4.3.1. Exposure Indicators (ExI)
For the application of the water stress indicator (ExI1), the series of the monthly minimum outflows of the Pereira Passos HPP was used, plus an additional value of the 95% permanence flow of the incremental area between the Pereira Passos HPP and the mouth of the Guandu River.
Water consumption data from the various uses in the Guandu Basin were also employed: human supply, industrial use and environmental flow. From the total of 95.1 m³/s, the 25 m³/s portion corresponds to the environmental flow, 42.0 m3/s corresponds to human supply, 29.1 m³/s corresponds to industrial use and 0.95 m3/s corresponds to the portion of returned sewage [43].
Table 11 shows that, in October 2015, the available flow was lower than the water uses in the basin, which means that the environmental flow was used to meet the needs of human and industrial supplies and, indeed, had a lower value than the established expected minimum. This could be observed for several days in 2015, probably as a way of avoiding impacts on human supply, as well as helping to preserve the reservoir stocks of the Paraíba do Sul Basin.
The reservoir equivalent volume percentage indicator—VEqR—was calculated using the daily series of accumulated volumes of the reservoirs of the Paraibuna, Santa Branca, Jaguari and Funil HPPs, all located in the Paraíba do Sul Basin (Figure 7), upstream of the transposition, and the sum of the total useful volumes of each reservoir. Table 12 presents the minimum monthly values of VEqR for the period between 2013 and 2015. The ExI2 indicator is determined using Equation 7 and the lowest value of the equivalent volume percentage of the reference month (Table 13).
4.3.2. Environmental Vulnerability Indicator (EnVI)
The environmental vulnerability was determined for each RJMR sub-basin supplied by the Guandu/Lajes/Acari system, using Equation (3). The final indicator was calculated using the weighted average of the discharge values needed for dilution purposes in each sub-basin, as shown in Table 14.
4.3.3. Social Vulnerability Indicator (SVI)
The social vulnerability indicator was determined for each RJMR municipality supplied by the Guandu/Lajes/Acari system, using the methodology described in Section 2. To normalize the population density, the linear equation shown in Table 4 was adjusted using the Brazilian average population density associated with a vulnerability equal to 0.5, while the density of the city of São Paulo (the city with the highest density in Brazil) was associated with 1, as shown in Table 15.
The final social vulnerability indicator was calculated using the weighted average of the population of each municipality (Table 16).
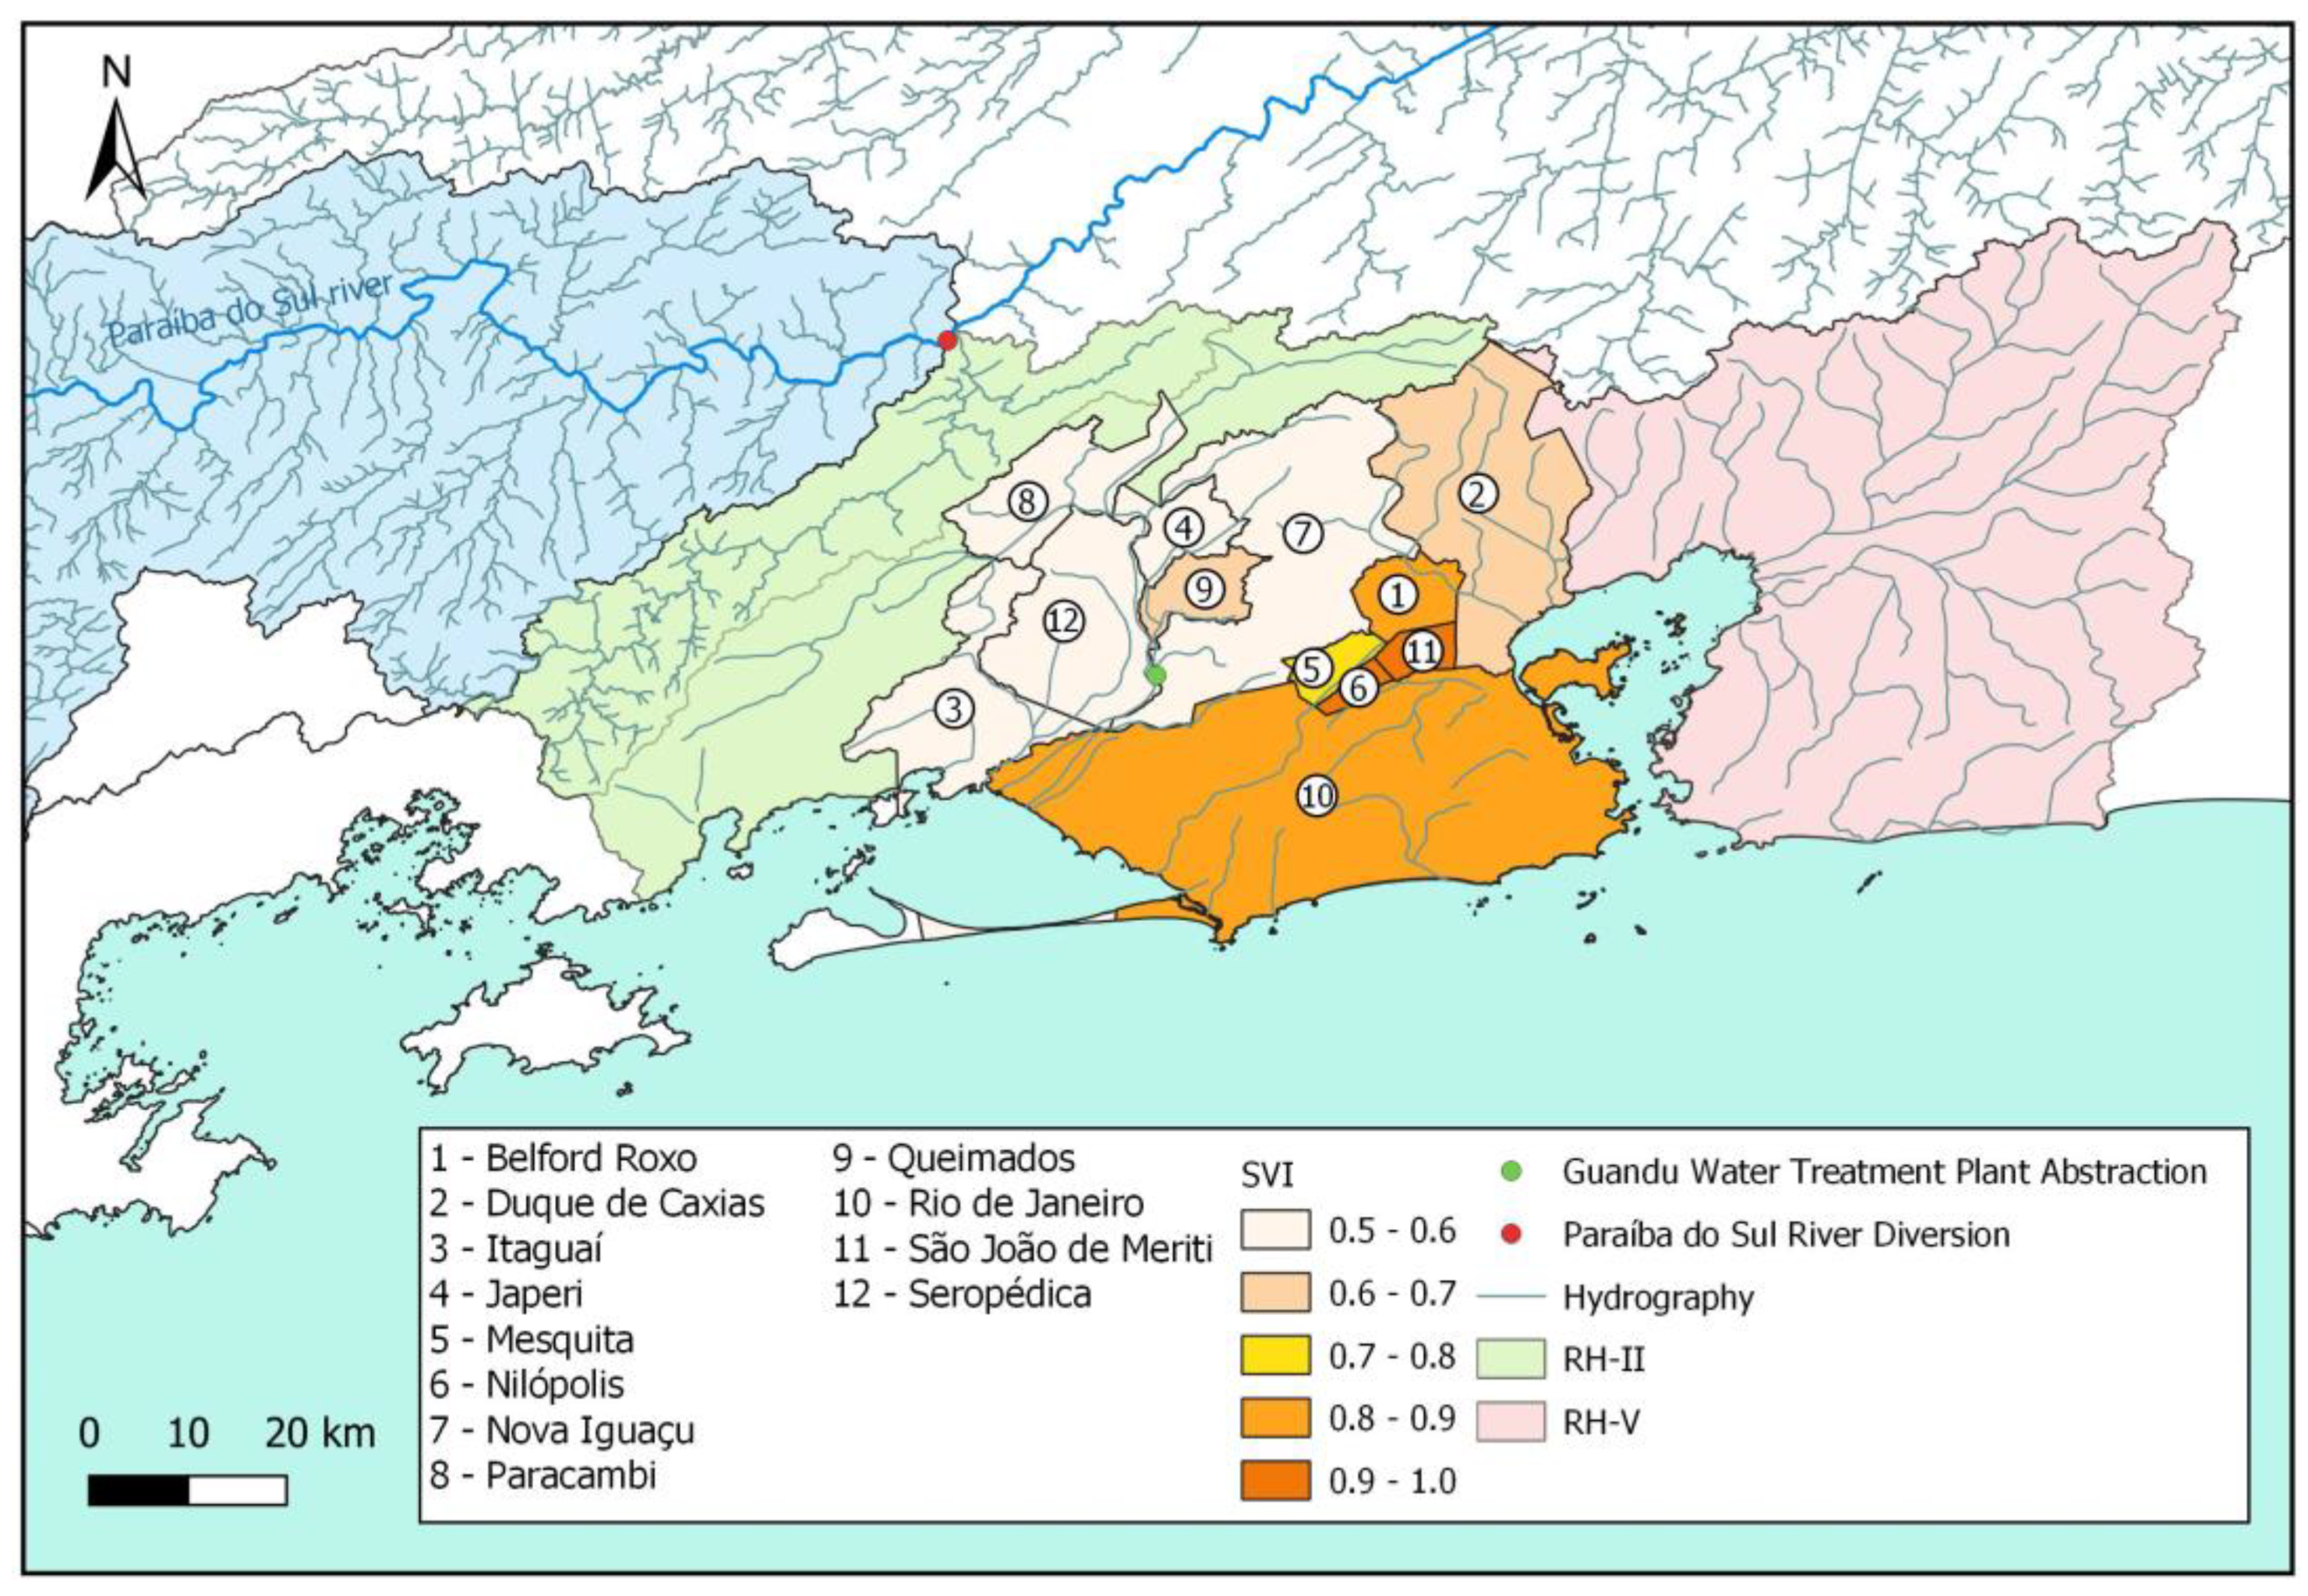
Figure 11 shows the results of the social vulnerability indicator application for each municipality. The vulnerability of Rio de Janeiro has a major influence on the final SVI value due to the significant amount of the population potentially affected in the municipality.
4.3.4. Economic Vulnerability Indicators (EVI1 and EVI2)
The economic vulnerability indicator (EVE1) was calculated for each RJMR municipality supplied by the Guandu/Lajes/Acari system, according to the procedure previously discussed in the Section 2. To normalize the GDP per capita, the linear equation shown in Table 5 was adjusted considering, in our test case, the data of Brazil’s GDP per capita, associated with a vulnerability equal to 0.5, and the data of the city of São Paulo’s GDP per capita (the city with the highest GDP per capita in Brazil), associated with 1, as shown in Table 17.
The final EVI1 value was calculated using the weighted average of each municipality’s GDP (Table 18). Figure 12 shows the results of the economic vulnerability indicator (EVI1) application for each municipality. The vulnerability of the Rio de Janeiro municipality has a major influence on the final EVI1 value due to the significant value of the GDP per capita. Thus, this region could experience considerable impacts in situations of water scarcity.
The indicator of competition between industrial uses and human supply needs (EVI2) was calculated for the Guandu Basin, where the Guandu water treatment system is located, and which also serves significant industrial uses. The results of the application are presented in Table 19, where it can be observed that the vulnerability is the maximum possible for this indicator. In the Guandu Basin, industrial abstractions are lower than abstractions for human supply, which can have a great impact on the industrial sector in situations of water scarcity. According to the Brazilian “water law” (Federal Act 9433/97), in these situations, the use of water is prioritized for human consumption and animal watering.
4.4. W-ScaRI Calculation
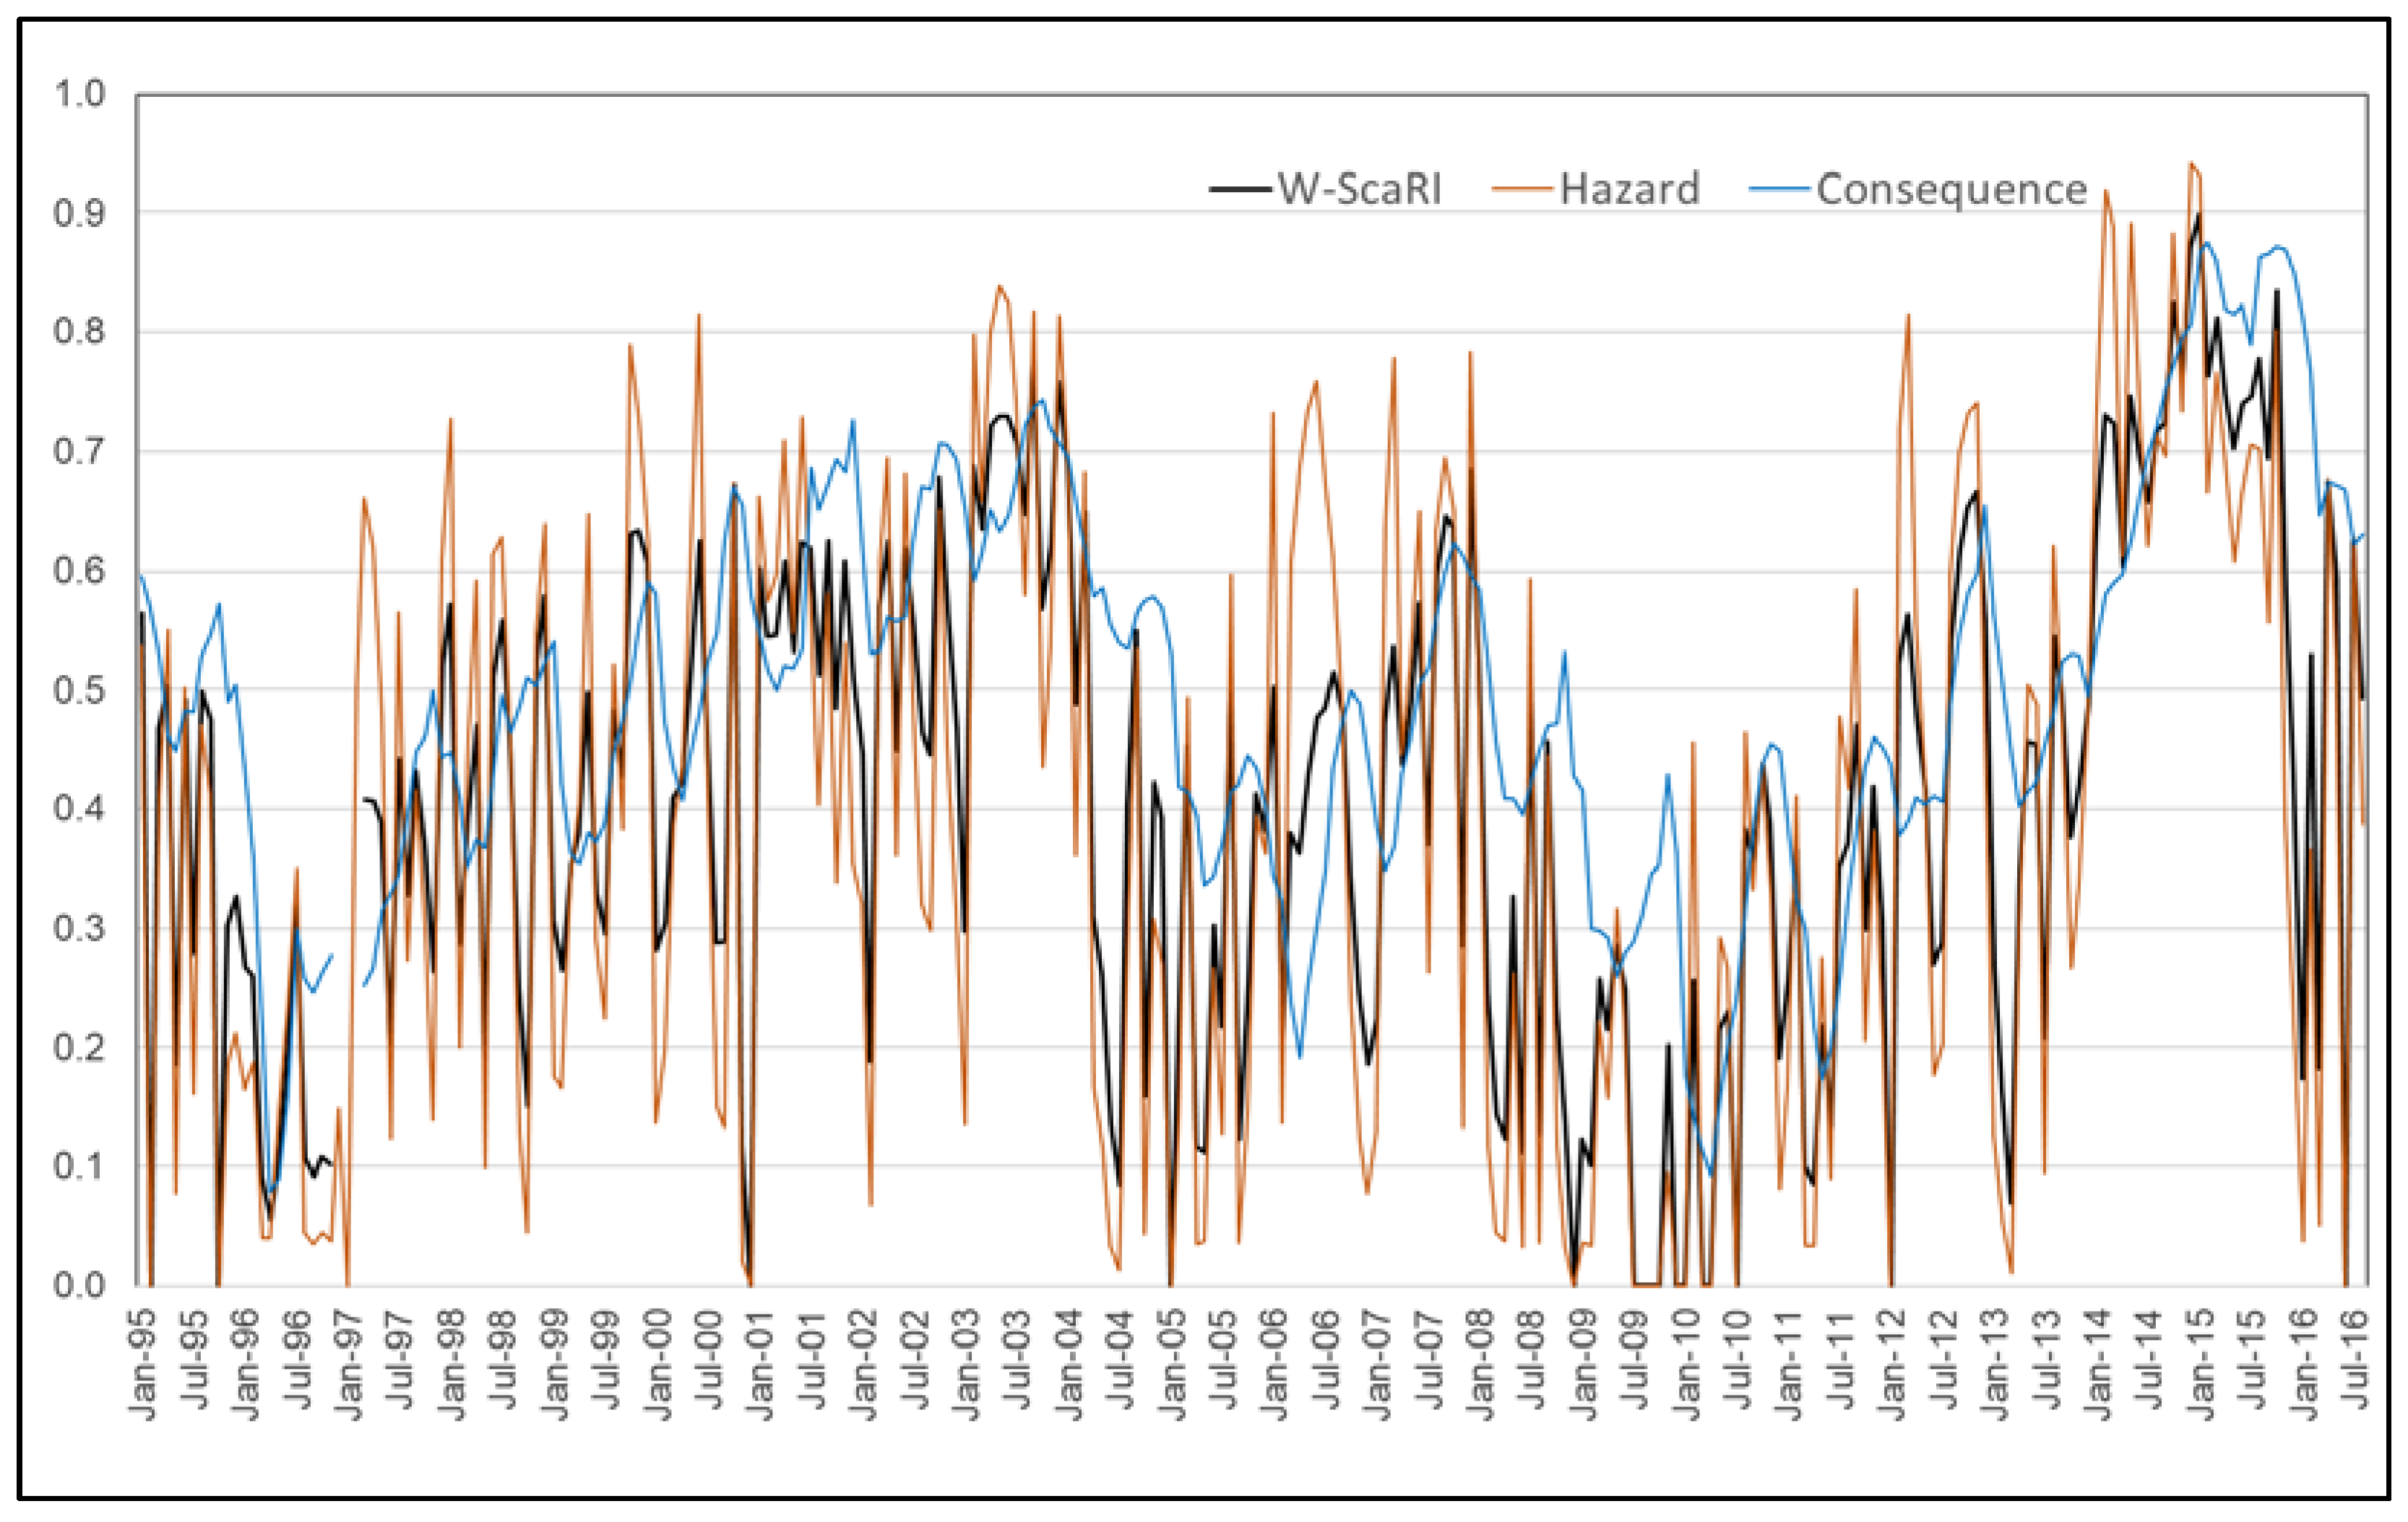
The Water Scarcity Risk Index (W-ScaRI) was calculated for the entire available data series. Figure 13 shows a complete representation of the drought periods in the Paraíba do Sul River Basin (2003–2004 and 2014–2015) using the W-ScaRI, and it shows that the scarcity water was worse in the 2014–2015 period than in the previous one (which, in fact, is recognized as being true), with higher W-ScaRI values. It is interesting to note the importance of evaluating the risk index by combining hazards and consequences. For instance, for March 2012, the hazard subindex was 0.82, but the W-ScaRI was lower, with a value of about 0.60. In this case, if the planner uses an index that only represents the hazard, it could lead to the employment of unnecessary actions.
Table 20 and Table 21 show the results of the W-ScaRI application for the RJMR in January and October 2015, where high index values can be observed in both months. In January, the basin reservoirs, represented by the equivalent volume indicator, had the lowest volume in all observed history, resulting in a maximum risk value (equal to 1). High values were also found for the HDI indicator, which, together with the MDI and ADI, increased the drought hazard subindex.
In October 2015, the hydrological drought indicators and the meteorological and agricultural indicators were lower than those in January, with the hazard subindex value being equal to 0.80, which is still high. However, the consequence subindex in October was higher than that obtained in January due to the exposure indicator. The results show that, in water stress situations, the RJMR is very vulnerable to environmental, social and economic impacts.
To summarize, in January 2015, all the drought hazard indicators increased the hazard subindex, and, thus, the W-ScaRI also increased, while in October 2015, the exposure (water stress) and volume equivalent percentage indicators of the reservoirs (% VEqR) caused the W-ScaRI to assume high values, practically the same as those observed in January 2015.
5. Conclusions
This study proposes a new index called the “Water Scarcity Risk Index (W-ScaRI), which aims to assess the risk of water scarcity in a given region, relating the drought hazard to the environmental, social and economic consequences of the event. Differently from other available indices, the W-ScaRI tries to maintain the simplicity of the consequence subindex, combining exposure with a set of few and representative vulnerability indicators. It also sheds light on urban/metropolitan issues and mainly focuses on human and industry supplies. To validate the index and test its representativeness, the W-ScaRI was applied to the Rio de Janeiro Metropolitan Region (RJMR) for the period of 2014–2015, when a serious water crisis occurred in the Paraíba do Sul River Basin, the main water supply source for the region.
The methods used to assess the drought hazard produced consistent results for the three components considered to be part of this representation: the meteorological drought, the agricultural drought and the hydrological drought. All indices used in the composition of the hazard subindex—SPI, RDI and SDI—clearly identified the periods of drought occurring in the case study proposed for the Paraíba do Sul Basin to validate the potential of the W-ScaRI. Although these three indices (used as indicators of the hazard subindex in the proposed formulation) are well-known, they are not usually integrated into the same formulation.
The procedures adopted to represent the consequence subindex were also considered adequate when applied to the RJMR supplied by the Guandu/Lajes/Acari system. All vulnerability indicators—environmental, social and economic—were found to be high, as expected based on the knowledge of the local reality. The value of 0.90 obtained for this component shows how vulnerable the region is and suggests that it may suffer severe impacts in the future during drought events. The “water stress” and “reservoir equivalent volume percentage” indicators also adequately represented the exposure of the system to possible impacts. These indicators directly access and affect the environmental, social and economic consequences in the risk assessment.
The results of this study also show the importance of evaluating the risk index by combining the hazard and its consequences. For instance, in some periods, the hazard subindex was high, but the W-ScaRI had a lower value. Only using the hazard subindex may lead to the employment of unnecessary actions, although we recognize that it is an important step in any case and that it can serve as a warning.
Therefore, the final formulation of the W-ScaRI represents the water scarcity risk in a relatively simple way, especially when considering the complexity of the real situation, and, at the same time, with adequate conceptual and methodological consistency. It is important to highlight that this study does not intend to present a complete representation of the physical process but rather to indicate the risks of drought in a region. This is one of the great challenges of building indices, since a rigorous representation of the physical process is not sought but rather indications of a given situation from the available information, accepting the limitations of its representation and preferably keeping its meaning simple. The results of the index’s application were consistent and representative of the case studied. In this sense, W-ScaRI identified all periods of water scarcity risk in the basin, and it also identified periods when the hazard was high but the consequences were still low.
The W-ScaRI index showed to be a methodological tool capable of assessing the tendencies of water scarcity risks, and this is a significant feature to support the water resources management system of any basin. The system manager can define rules to effectively use this index according to each system’s particularities. For example, a threshold could be defined to represent a safe operational range limit—in this sense, a given basin, for instance, could be considered safe if the W-ScaRI values are below 0.70. This arbitrary threshold can be defined in a different way depending on the system failure consequences or the absolute water availability. However, if the index is greater than the defined value, alerts can be provided so that actions can be proposed to control consumption, reduce distribution losses or reduce water abstractions. These measures may be introduced using a planned escalation logic, intending to prevent the index from achieving higher values and eventually approaching its maximum (which would indicate no available water reserves). In this way, the index can be used in a continuous manner to evaluate the current system safety status and to also map new trends after making management decisions, helping the water resources management systems to quantitatively assess the responses proposed to save water (depending on the physical interpretation of each basin, its consumption and its users).
6. Limitations and Recommendations
The W-ScaRI was developed mainly to assess the risk of water supply in urban/metropolitan areas. For this reason, some vulnerability indicators may be missing in a broad sense. For example, indicators such as farmland lost or sold due to droughts, as well as livestock lost or sold due to droughts, were not directly considered, although the GDP indicator does indirectly represent losses in agriculture and livestock. Future revisions of the index should assess the possibility of including these or other indicators, as well as indicators of environmental vulnerability, such as land fragmentation near water resources. However, the idea of maintaining the simplicity of the index should be preserved.
During the development of this study, we verified the need to apply the method to other regions in order to validate the obtained results in different situations. A sensitivity analysis of the weights used for the indicators and subindices will also be provided in a future study to guide their choice by managers and stakeholders. Another possible evolution is the inclusion of a resilience component in the formulation of the W-ScaRI, combining it in the consequence subindex or introducing a third component in the calculation. All these actions will make the W-ScaRI a more robust and reliable instrument for use by managers when facing possible water crises in the future.
Author Contributions
Conceptualization, F.R.T. and M.G.M.; Data curation, F.R.T., J.G.d.S.R.d.S., G.W.d.M.A. and J.P.M.F.; Formal analysis, F.R.T., J.G.d.S.R.d.S., G.W.d.M.A. and J.P.M.F.; Investigation, F.R.T., J.G.d.S.R.d.S., G.W.d.M.A. and J.P.M.F.; Methodology, F.R.T. and M.G.M.; Supervision, M.G.M.; Validation, F.R.T. and M.G.M.; Visualization, J.G.d.S.R.d.S., G.W.d.M.A. and J.P.M.F.; Writing—original draft, F.R.T.; Writing—review and editing, F.R.T. and M.G.M. All authors have read and agreed to the published version of the manuscript.
Funding
This research was funded by Coordenação de Aperfeiçoamento de Pessoal de Nível Superior (CAPES) (Finance Code 001); National Council for Scientific and Technological Development: edital GM/GD–Post-Graduation Programs share; Conselho Nacional de Desenvolvimento Científico e Tecnológico (CNPq) under Grant [303862/2020-3].
Data Availability Statement
Publicly available datasets were analyzed in this study. This data can be found here: Operation Data of the Paraíba Do Sul and Guandu River Basin Reservoirs (https://www.ana.gov.br/sar0/MedicaoSin, accessed on 17 November 2022); Monthly Rainfall Series (http://www.snirh.gov.br/hidroweb/publico/medicoes_historicas_abas.jsf, accessed on 17 November 2022); Population Estimates in 2017 (https://www.ibge.gov.br/estatisticas/sociais/populacao/9103-estimativas-de-populacao.html?=&t=downloads, accessed on 17 November 2022); Municipalities GDP—2015 (https://www.ibge.gov.br/estatisticas/economicas/contas-nacionais/9088-produto-interno-bruto-dos-municipios.html?=&t=resultados, accessed on 17 November 2022); Monthly Rainfall Series (http://www.hidrologia.daee.sp.gov.br/, accessed on 17 November 2022); Monthly Average Maximum and Minimum Temperature Series (https://bdmep.inmet.gov.br/, accessed on 17 November 2022).
Acknowledgments
The authors wish to acknowledge the administrative support provided by the Programa de Engenharia Civil of UFRJ (PEC-COPPE/UFRJ); the Coordenação de Aperfeiçoamento de Pessoal de Nível Superior—Brasil (CAPES); and the Conselho Nacional de Desenvolvimento Científico e Tecnológico—Brasil (CNPq) for supporting this research.
Conflicts of Interest
The authors declare no conflict of interest.
References
- Tannehill Ray, I. Drought Its Causes and Effects, 1st ed.; Princeton University Press: Princeton, NJ, USA, 1947. [Google Scholar]
- Gillette, H.P. A Creeping Drought Underway. Water Sew. Work. 1950, 104–105. Available online: https://www.scirp.org/%28S%28czeh2tfqyw2orz553k1w0r45%29%29/reference/referencespapers.aspx?referenceid=2950033 (accessed on 17 November 2022).
- Sayers, P.B.; Li, Y.; Moncrieff, C.; Li, J.; Tickner, D.; Xu, X.; Speed, R.; Li, A.; Lei, G.; Qiu, B.; et al. Drought Risk Management; UNESCO: Paris, France, 2016; ISBN 9789231000942. [Google Scholar]
- Tsakiris, G. Drought Risk Assessment and Management. Water Resour. Manag. 2017, 31, 3083–3095. [Google Scholar] [CrossRef]
- Wilhite, D.A. Drought as a Natural Hazard: Concepts and Definitions. In Drought: A Global Assessment; Routledge: London, UK, 2000; pp. 3–18. [Google Scholar]
- De Stefano, L.; Tánago, I.G.; Ballesteros, M. Methodological Approach Considering Different Factors Influencing Vulnerability–Pan-European Scale. Technical Report. 2015. Available online: https://www.academia.edu/14388306/METHODOLOGICAL_APPROACH_CONSIDERING_DIFFERENT_FACTORS_INFLUENCING_VULNERABILITY_PAN_EUROPEAN_SCALE (accessed on 17 November 2022).
- Mishra, A.K.; Singh, V.P. A Review of Drought Concepts. J. Hydrol. 2010, 391, 202–216. [Google Scholar] [CrossRef]
- Xu, Y.; Zhang, X.; Wang, X.; Hao, Z.; Singh, V.P.; Hao, F. Propagation from Meteorological Drought to Hydrological Drought under the Impact of Human Activities: A Case Study in Northern China. J. Hydrol. 2019, 579, 124147. [Google Scholar] [CrossRef]
- Howitt, R.; Macewan, D.; Medellín-Azuara, J. Economic Analysis of the 2015 Drought for California Agriculture; Center for Watershed Sciences, University of California—Davis: Davis, CA, USA, 2015; p. 16. [Google Scholar]
- Peng, C.; Ma, Z.; Lei, X.; Zhu, Q.; Chen, H.; Wang, W.; Liu, S.; Li, W.; Fang, X.; Zhou, X. A Drought-Induced Pervasive Increase in Tree Mortality across Canada’s Boreal Forests. Nat. Clim. Chang. 2011, 1, 467–471. [Google Scholar] [CrossRef]
- Maia, R.; Costa, M.; Mendes, J. Improving Transboundary Drought and Scarcity Management in the Iberian Peninsula through the Definition of Common Indicators: The Case of the Minho-Lima River Basin District. Water 2022, 14, 425. [Google Scholar] [CrossRef]
- Van Loon, A.F.; Van Lanen, H.A.J. Making the Distinction between Water Scarcity and Drought Using an Observation-Modeling Framework. Water Resour. Res. 2013, 49, 1483–1502. [Google Scholar] [CrossRef]
- Dolan, F.; Lamontagne, J.; Link, R.; Hejazi, M.; Reed, P.; Edmonds, J. Evaluating the Economic Impact of Water Scarcity in a Changing World. Nat. Commun. 2021, 12, 1915. [Google Scholar] [CrossRef]
- Joseph, N.; Ryu, D.; Malano, H.M.; George, B.; Sudheer, K.P. A Review of the Assessment of Sustainable Water Use at Continental-to-Global Scale. Sustain. Water Resour. Manag. 2020, 6, 18. [Google Scholar] [CrossRef]
- Tzanakakis, V.A.; Paranychianakis, N.V.; Angelakis, A.N. Water Supply and Water Scarcity. Water 2020, 12, 2347. [Google Scholar] [CrossRef]
- UN Water. Water Scarcity. Available online: http://www.unwater.org/water-facts/scarcity (accessed on 6 August 2022).
- Procházka, P.; Hönig, V.; Maitah, M.; Pljučarská, I.; Kleindienst, J. Evaluation of Water Scarcity in Selected Countries of the Middle East. Water 2018, 10, 1482. [Google Scholar] [CrossRef]
- Zonensein, J. Flood Risk Index as a Flood Management Tool. Master’s Thesis, Universidade Federal do Rio de Janeiro—UFRJ, Rio de Janeiro, Brazil, 2007. [Google Scholar]
- Miguez, M.G.; Gregório, L.T.; Veról, A.P. Risk and Hydrological Disaster Management, 1st ed.; Elsevier: Rio de Janeiro, Brasil, 2018. [Google Scholar]
- Bellen, H.M. Van Sustainability Indicators: A Comparative Analysis. Ph.D. Thesis, Universidade Federal de Santa Catarina—UFSC, Florianópolis, Brazil, 2002. [Google Scholar]
- Wang, L.; Yu, H.; Yang, M.; Yang, R.; Gao, R.; Wang, Y. A Drought Index: The Standardized Precipitation Evapotranspiration Runoff Index. J. Hydrol. 2019, 571, 651–668. [Google Scholar] [CrossRef]
- Wu, J.; Liu, Z.; Yao, H.; Chen, X.; Chen, X.; Zheng, Y.; He, Y. Impacts of Reservoir Operations on Multi-Scale Correlations between Hydrological Drought and Meteorological Drought. J. Hydrol. 2018, 563, 726–736. [Google Scholar] [CrossRef]
- Cuartas, L.A.; Cunha, A.P.M.; Alves, J.A.; Parra, L.M.P.; Deusdará-Leal, K.; Costa, L.C.O.; Molina, R.D.; Amore, D.; Broedel, E.; Seluchi, M.E.; et al. Recent Hydrological Droughts in Brazil and Their Impact on Hydropower Generation. Water 2022, 14, 601. [Google Scholar] [CrossRef]
- NDMC—National Drought Mitigation Center Us Drought Monitor. Available online: https://droughtmonitor.unl.edu/data/docs/what_is_usdm.pdf (accessed on 30 September 2019).
- Svoboda, M.D.; Fuchs, B.A.; Poulsen, C.C.; Nothwehr, J.R. The Drought Risk Atlas: Enhancing Decision Support for Drought Risk Management in the United States. J. Hydrol. 2015, 526, 274–286. [Google Scholar] [CrossRef] [Green Version]
- Martins, E.S.Q.R.; From Nys, E.; Molejón, C.; Biazeto, B.; Silva, R.F.V.; Engle, N. Northeast Drought Monitor, Looking for a New Paradigm for Drought Management. In Água Brasil Séries Nº 10; W.B.G.: Washington, DC, USA, 2015; ISBN 9788588192164. [Google Scholar]
- Bachmair, S.; Svensson, C.; Prosdocimi, I.; Hannaford, J.; Stahl, K. Developing Drought Impact Functions for Drought Risk Management. Nat. Hazards Earth Syst. Sci. Discuss. 2017, 17, 1947–1960. [Google Scholar] [CrossRef] [Green Version]
- Liu, J.; Yang, H.; Gosling, S.N.; Kummu, M.; Flörke, M.; Pfister, S.; Hanasaki, N.; Wada, Y.; Zhang, X.; Zheng, C.; et al. Water Scarcity Assessments in the Past, Present, and Future. Earth’s Future 2017, 5, 545–559. [Google Scholar] [CrossRef]
- González Tánago, I.; Urquijo, J.; Blauhut, V.; Villarroya, F.; De Stefano, L. Learning from Experience: A Systematic Review of Assessments of Vulnerability to Drought. Nat. Hazards 2016, 80, 951–973. [Google Scholar] [CrossRef]
- Tsakiris, G. A Paradigm for Applying Risk and Hazard Concepts in Proactive Planning. In Coping with Drought Risk in Agriculture and Water Supply Systems; Iglesias, A., Garrote, L., Antonino, C., Francisco, C., Donals, W., Eds.; Springer: Berlin/Heidelberg, Germany, 2009; p. 320. ISBN 978-1-4020-9044-8. [Google Scholar]
- Dabanli, I. Drought Risk Assessment by Using Drought Hazard and Vulnerability Indexes. Nat. Hazards Earth Syst. Sci. Discuss. 2018, 1–15, preprint. [Google Scholar] [CrossRef]
- Meza, I.; Eyshi Rezaei, E.; Siebert, S.; Ghazaryan, G.; Nouri, H.; Dubovyk, O.; Gerdener, H.; Herbert, C.; Kusche, J.; Popat, E.; et al. Drought Risk for Agricultural Systems in South Africa: Drivers, Spatial Patterns, and Implications for Drought Risk Management. Sci. Total Environ. 2021, 799, 149505. [Google Scholar] [CrossRef]
- Le, T.; Sun, C.; Choy, S.; Kuleshov, Y. Regional Drought Risk Assessment in the Central Highlands and the South of Vietnam. Geomatics Nat. Hazards Risk 2021, 12, 3140–3159. [Google Scholar] [CrossRef]
- Carrão, H.; Naumann, G.; Barbosa, P. Mapping Global Patterns of Drought Risk: An Empirical Framework Based on Sub-National Estimates of Hazard, Exposure and Vulnerability. Glob. Environ. Chang. 2016, 39, 108–124. [Google Scholar] [CrossRef]
- Dunne, A.; Kuleshov, Y. Drought Risk Assessment and Mapping for the Murray–Darling Basin, Australia. Nat. Hazards 2022, 1–25. [Google Scholar] [CrossRef]
- Mckee, T.B.; Doesken, N.J.; Kleist, J. The Relationship of Drought Frequency and Duration to Time Scales. In Proceedings of the 8th Conference on Applied Climatology, Anaheim, CA, USA, 17–22 January 1993; pp. 17–22. [Google Scholar]
- Tigkas, D.; Vangelis, H.; Tsakiris, G. DrinC: A Software for Drought Analysis Based on Drought Indices. Earth Sci. Inform. 2015, 8, 697–709. [Google Scholar] [CrossRef]
- Tsakiris, G.; Vangelis, A. Establishing a Drought Index Incorporating Evapotranspiration. Eur. Water 2005, 9, 3–11. [Google Scholar]
- Tigkas, D. Drought Characterisation and Monitoring in Regions of Greece. Eur. Water 2008, 23, 29–39. [Google Scholar]
- Tsakiris, G.; Nalbantis, I.; Pangalou, D.; Tigkas, D.; Vangelis, H. Drought Meteorological Monitoring Network Design for the Reconnaissance Drought Index (RDI). In Proceedings of the 1st International Conference “Drought Management: Scientific and Technological Innovations”, Zaragoza, Spain, 12–14 June 2008; Option Méditerranéennes, Series A. pp. 57–62. [Google Scholar]
- Nalbantis, I.; Tsakiris, G. Assessment of Hydrological Drought Revisited. Water Resour. Manag. 2009, 23, 881–897. [Google Scholar] [CrossRef]
- Agência Nacional de Águas—ANA. Situation Room of Paraíba Do Sul River Basin. Available online: http://www3.ana.gov.br/portal/ANA/sala-de-situacao/paraiba-do-sul/paraiba-do-sul-saiba-mais (accessed on 27 August 2018).
- Fundação Coordenação de Projetos, Pesquisas e Estudos Tecnológicos—COPPETEC; Instituto Estadual do Ambiente—INEA. Rio de Janeiro State Water Resources Plan, Diagnostic Report; Rio de Janeiro, Brasil, 2014; Available online: https://www.worldbank.org/content/dam/Worldbank/Feature%20Story/SDN/Water/events/Rosa_Formiga_Johnson_Presentacion_Ingles-3.pdf (accessed on 17 November 2022).
- Instituto Brasileiro de Geografia e Estatística—IBGE. Population Estimates in 2017. Available online: https://www.ibge.gov.br/estatisticas/sociais/populacao/9103-estimativas-de-populacao.html?=&t=downloads (accessed on 30 May 2018).
- Integral Engenharia and FIRJAN. Water Security Assessment of the Rio de Janeiro Metropolitan Region: Final Report; FIRJAN: Rio de Janeiro, Brazil, 2015. [Google Scholar]
- COHIDRO and Associação Pró-Gestão das Águas da Bacia Hidrográfica do Rio Paraíba do Sul—AGEVAP. Paraíba Do Sul River Basin Integrated Water Resources Plan and Affluent Basins Water Resources Action Plans: Diagnostic Report, Tome 1; COHIDRO/AGEVAP: Resende, Brazil, 2014. [Google Scholar]
- Campos, J.D. Charging for Water Use in Transpositions of the Paraíba Do Sul River Basin Involving the Electric Sector. Master’s Thesis, Universidade Federal do Rio de Janeiro, Rio de Janeiro, Brazil, 2001. [Google Scholar]
- Agência Nacional de Águas—ANA. Water Resources Conjuncture Report; ANA: Brasília, Brazil, 2017. [Google Scholar]
- Instituto Nacional de Meteorologia—INMET. Monthly Average Maximum and Minimum Temperature Series. BDMEP-Teach. Res. Weather Database; 2018. Available online: https://bdmep.inmet.gov.br/ (accessed on 20 March 2018).
- Agência Nacional de Águas—ANA. Monthly Rainfall Series. Available online: http://www.snirh.gov.br/hidroweb/publico/medicoes_historicas_abas.jsf (accessed on 8 March 2018).
- Departamento de Águas e Energia Elétrica—DAEE. Monthly Rainfall Series. Available online: http://www.hidrologia.daee.sp.gov.br/ (accessed on 8 March 2018).
- Agência Nacional de Águas—ANA. Operation Data of the Paraíba Do Sul and Guandu River Basin Reservoirs. Available online: https://www.ana.gov.br/sar0/MedicaoSin (accessed on 3 April 2018).
- Instituto Brasileiro de Geografia e Estatística—IBGE. Municipalities GDP—2015. Available online: https://www.ibge.gov.br/estatisticas/economicas/contas-nacionais/9088-produto-interno-bruto-dos-municipios.html?=&t=resultados (accessed on 30 May 2018).
Figure 1.
Water Scarcity Risk Index (W-ScaRI) representation.

Figure 2.
Rio de Janeiro State and Rio de Janeiro Metropolitan Region (RJMR).

Figure 3.
Paraíba do Sul River Basin.

Figure 4.
Schematic drawing of the water transfer from Paraíba do Sul to Guandu Rivers.

Figure 5.
The W-ScaRI application area.

Figure 6.
Monthly SPI of rainfall gauges in the region under study.

Figure 7.
SPI index of rainfall gauges in the region (January 2015).

Figure 8.
Monthly RDI of rainfall gauges in the region under study.

Figure 9.
Monthly SDI in the basin’s reservoirs and Santa Cecília Dam.

Figure 10.
Monthly SDI in the basin’s reservoirs and Santa Cecília Dam (January 2015).

Figure 11.
Social vulnerability indicator (SVI) application for each municipality supplied by the Guandu/Lajes/Acari system.
Figure 11.
Social vulnerability indicator (SVI) application for each municipality supplied by the Guandu/Lajes/Acari system.

Figure 12.
Economic vulnerability indicator (EVI1) application for each municipality supplied by the Guandu/Lajes/Acari system.
Figure 12.
Economic vulnerability indicator (EVI1) application for each municipality supplied by the Guandu/Lajes/Acari system.

Figure 13.
W-ScaRI application (1995–2015).


| Color Scale | SPI | Classification |
|---|---|---|
| SPI > 0 | Wet period | |
| 0 to −0.99 | Mild Drought | |
| −1.00 to −1.49 | Moderate Drought | |
| −1.50 to −1.99 | Severe Drought | |
| SPI ≤ −2.00 | Extreme Drought |
Table 2.
SPI indicator normalization.
| SPI Values | Cumulative Probability—Normal Distribution | Adjusted Equation |
|---|---|---|
| 0 −1 | 0.50 0.841 | y = −0.341x + 0.5 |
| −1 −2 | 0.841 0.977 | y = −0.136x + 0.705 |
| −2 −3 | 0.977 0.999 | y = −0.022x + 0.933 |
Table 3.
Drought classifications based on VEqR and ExI2 ranges.
| Color Scale | VEqR (%) | ExI2 | Classification |
|---|---|---|---|
| VEqR > 40 | ExI2 < 0.6 | Wet period | |
| 30 < VEqR ≤ 40 | 0.70 > ExI2 ≥ 0.6 | Mild Drought | |
| 20 < VEqR ≤ 30 | 0.80 > ExI2 ≥ 0.7 | Moderate Drought | |
| 10 < VEqR ≤ 20 | 0.90 > ExI2 ≥ 0.8 | Severe Drought | |
| 0 ≤ VEqR ≤10 | 1 ≥ ExI2 ≥ 0.9 | Extreme Drought |
Table 4.
Social vulnerability indicator determination.
| Population Density—PD (People/km2) | Social Vulnerability Indicator—SVI (0–1) | Adjusted Equation |
|---|---|---|
| City with the highest population density | 1 | SVI = a × PD + b, where PD is the population density; a and b are the adjusted parameters of the SVI equation. |
| Country’s average population density | 0.5 |
Table 5.
Economic vulnerability indicator determination.
| GDP per Capita | Economic Vulnerability Indicator—EVI1 (0–1) | Adjusted Equation |
|---|---|---|
| City with the highest GDP per capita | 1 | EVI1 = c × GDP per capita + d where c and d are the adjusted parameters of the IVE1 equation. |
| Country’s average GDP per capita | 0.5 |
Table 6.
Weights used for W-ScaRI calculation.
| Drought Hazard Subindex | Consequence Subindex | ||||||
|---|---|---|---|---|---|---|---|
| Indicators | Weight | Exposure | Vulnerability | ||||
| Indicators | Weight | Indicators | Weight | ||||
| Meteorological Drought (MDI) | SPI | 0.333 | Water stress | 0.5 | Environmental vulnerability (EnVI) | Bqual | 0.333 |
| Agricultural Drought (ADI) | RDI | 0.333 | % VEqR | 0.5 | Social vulnerability (SVI) | PD | 0.333 |
| Hydrological Drought (HDI) | SDI | 0.333 | Economic vulnerability (EVI) | GDP per capita | 0.1665 | ||
| % Competition with human supply | 0.1665 | ||||||
| Weight = 0.5 | Weight = 0.5 | ||||||
Table 7.
Data used for W-ScaRI application.
| Indicator | Type of Information | Period | Reference |
|---|---|---|---|
| MDI (SPI) | Monthly rainfall series. Gauges: Resende, Taubaté, Fazenda Santa Clara, S. Luiz do Paraitinga, Igaratá and Santa Isabel | 1991–2016 | [49,50,51] |
| ADI (RDI) | Monthly rainfall and monthly average and maximum and minimum temperature series. Gauges: Resende and Taubaté | 1991–2016 | [49,50] |
| HDI (SDI) | Average monthly natural flows at Paraibuna HPP, Santa Branca HPP, Funil HPP and Santa Cecília Dam | 1931–2017 | [52] |
| ExI1 Water stress | Pereira Passos HPP outflows series, incremental 95% flow (Guandu mouth—Pereira Passos HPP), water consumption data (Guandu River users) | 1994–2016 2014 | [52,43] |
| ExI2 % Equivalent volume of reservoirs | Daily series of accumulated useful volumes of Paraibuna, Santa Branca, Jaguari and Funil Reservoirs, and useful volume of reservoirs | 1993–2017 | [52] |
| EnVI Qualitative water balance | Consumed flows by the users of RJMR basins, dilution flows of RJMR basins and water availability in RJMR basins | 2014 | [43] |
| SVI Population density | Municipal population and area | 2017 estimate | [44] |
| EVI1 GDP per capita | GDP and population | 2015 | [53] |
| EVI2 % Competition human supply | Industrial abstraction flows Human supply abstraction flows | 2014 | [43] |
Table 8.
Meteorological drought indicator (MDI) application.
| Rainfall Gauges | Weight | January 2015 | October 2015 | ||
|---|---|---|---|---|---|
| SPI | SPI (0–1) | SPI | SPI (0–1) | ||
| Paraitinga | 0.20 | −2.74 | 0.99 | −0.78 | 0.77 |
| Taubaté | 0.18 | −2.36 | 0.98 | −1.72 | 0.94 |
| Resende | 0.27 | −1.35 | 0.89 | −1.34 | 0.89 |
| Cachoeira Paulista | 0.18 | −0.55 | 0.69 | −0.08 | 0.53 |
| Igaratá | 0.11 | −0.55 | 0.69 | 0.36 | 0.00 |
| Santa Isabel | 0.06 | −0.94 | 0.82 | 0.37 | 0.00 |
| Meteorological drought indicator—MDI | 0.87 | 0.66 | |||
Table 9.
Agricultural drought indicator (ADI) application.
| Gauges | Weight | January 2015 | October 2015 | ||
|---|---|---|---|---|---|
| RDI | RDI (0–1) | RDI | RDI (0–1) | ||
| Resende | 0.50 | −1.22 | 0.99 | −1.25 | 0.84 |
| Taubaté | 0.50 | −2.54 | 0.87 | −1.01 | 0.87 |
| Agricultural drought indicator—ADI | 0.93 | 0.86 | |||
Table 10.
Hydrological drought indicator (HDI) application.
| Place | January 2015 | October 2015 | ||
|---|---|---|---|---|
| SDI | SDI (0–1) | SDI | SDI (0–1) | |
| Paraíba do Sul River in Santa Cecília | −2.96 | 1.0 | −1.35 | 0.89 |
| Hydrological Drought Indicator—HDI | 1.0 | 0.89 | ||
Table 11.
Water stress indicator (ExI1) application.
| Local | Basin Water Uses (m3/s) | Available Flow (m3/s) | |
|---|---|---|---|
| January 2015 | October 2015 | ||
| Guandu River Basin between mouth and Pereira Passos HPP | 95.1 | 101.3 | 79.3 |
| Water stress Indicator—ExI1 | 0.94 | 1.0 | |
Table 12.
Minimum monthly values of the indicator VEqR (%).
| Year | Jan | Feb | Mar | Apr | May | June | July | Aug | Sept | Oct | Nov | Dec |
|---|---|---|---|---|---|---|---|---|---|---|---|---|
| 2013 | 42 | 54 | 60 | 68 | 69 | 65 | 62 | 57 | 51 | 48 | 45 | 48 |
| 2014 | 48 | 42 | 41 | 39 | 34 | 28 | 23 | 18 | 13 | 7 | 4 | 2 |
| 2015 | 0.4 | 0.3 | 8 | 16.3 | 17.1 | 15.3 | 11.6 | 7.1 | 6.6 | 5.4 | 5.8 | 9.9 |
| 2016 | 18 | 27 | 34 | 43 | 44 | 44 | 52 | 50 | 48 | 46 | 45 | 49 |
Table 13.
Exposure indicator (ExI2) application.
| Year | Jan | Feb | Mar | Apr | May | June | July | Aug | Sept | Oct | Nov | Dec |
|---|---|---|---|---|---|---|---|---|---|---|---|---|
| 2013 | 0.58 | 0.46 | 0.40 | 0.32 | 0.31 | 0.35 | 0.38 | 0.43 | 0.49 | 0.52 | 0.55 | 0.52 |
| 2014 | 0.52 | 0.58 | 0.59 | 0.61 | 0.66 | 0.72 | 0.77 | 0.82 | 0.87 | 0.93 | 0.96 | 0.98 |
| 2015 | 1.00 | 1.00 | 0.92 | 0.84 | 0.83 | 0.85 | 0.88 | 0.93 | 0.93 | 0.95 | 0.94 | 0.90 |
| 2016 | 0.82 | 0.73 | 0.66 | 0.57 | 0.56 | 0.56 | 0.48 | 0.50 | 0.52 | 0.54 | 0.55 | 0.51 |
Table 14.
Environmental vulnerability indicator (EnVI) application.
| Sub-Basin | Dilution Flow—Wdil (m3/s) | Bqual (%) | Vulnerability (0–1) |
|---|---|---|---|
| Piraí River | 3.3 | 50.3 | 0.5 |
| Lajes Reservoir | - | 33.4 | 0.33 |
| Guandu River | 7.3 | 81.9 | 0.82 |
| da Guarda River | 16.9 | 478.3 | 1 |
| Guandu-Mirim and Litorâneos Rivers | 105.6 | 1195.1 | 1 |
| Iguaçu and Saracuruna Rivers | 226.6 | 1305.4 | 1 |
| Jacarepaguá and Marapendi Lake Rivers | 156.0 | 1184.8 | 1 |
| Pavuna-Meriti, Faria-Timbó and Maracanã Rivers; Governador and Fundão Island Rivers; Rodrigo de Freitas Lake Rivers | 171.3 | 1248.7 | 1 |
| Environmental Vulnerability Indicator—EnVI | =0.99 | ||
Table 15.
Social vulnerability indicator determination.
| City/Country | Population Density—PD (People/km2) | Social Vulnerability Indicator—SVI (0–1) | Adjusted Equation |
|---|---|---|---|
| São Paulo | 7959.27 | 1 | SVI = 6 × 10⁻⁵ × PD + 0.4985 |
| Brazil | 24.40 | 0.5 |
Table 16.
Social vulnerability indicator (SVI) application.
| Municipality | Population Density (Inhabitants/km2) | Population (Inhabitants) | SVI (0–1) |
|---|---|---|---|
| Belford Roxo | 6277 | 495,783 | 0.88 |
| Duque de Caxias | 1905 | 890,997 | 0.61 |
| Itaguaí | 446 | 122,369 | 0.53 |
| Japeri | 1237 | 101,237 | 0.57 |
| Nilópolis | 8164 | 158,329 | 0.99 |
| Nova Iguaçu | 1542 | 798,647 | 0.59 |
| Mesquita | 4130 | 171,280 | 0.75 |
| Paracambi | 264 | 50,447 | 0.51 |
| Queimados | 1921 | 145,386 | 0.61 |
| Rio de Janeiro | 5433 | 6,520,266 | 0.82 |
| São João de Meriti | 13,075 | 460,461 | 1.00 |
| Seropédica | 297 | 84,416 | 0.52 |
| Social Vulnerability Indicator—SVI | =0.79 | ||
Table 17.
Economic vulnerability indicator (EVI1) determination.
| City/Country | GDP per Capita | Economic Vulnerability Indicator—EVE1 (0–1) | Adjusted Equation |
|---|---|---|---|
| São Paulo | 54.4 | 1 | EVI1 = 0.02 × GDP per capita—0.0856 |
| Brazil | 29.3 | 0.5 |
Table 18.
Economic vulnerability indicator (EVI1) application.
| Municipality | GDP (103 BRL) | GDP per Capita | IVE1 |
|---|---|---|---|
| Belford Roxo | 7,479,539 | 16 | 0.23 |
| Duque de Caxias | 35,114,426 | 40 | 0.71 |
| Itaguaí | 7,404,493 | 62 | 1.00 |
| Japeri | 1,342,219 | 13 | 0.18 |
| Nilópolis | 2,525,559 | 16 | 0.23 |
| Nova Iguaçu | 15,948,718 | 20 | 0.31 |
| Paracambi | 2,084,163 | 12 | 0.16 |
| Mesquita | 843,386 | 17 | 0.26 |
| Queimados | 4,851,828 | 34 | 0.59 |
| Rio de Janeiro | 320,774,459 | 50 | 0.90 |
| São João de Meriti | 7,931,134 | 17 | 0.26 |
| Seropédica | 2,306,345 | 28 | 0.47 |
| Economic Vulnerability Indicator—EVI1 | =0.82 | ||
Table 19.
Economic vulnerability indicator (EVI2) application.
| Water Use | Abstraction Flow (m³/s) | Percentage (%) |
|---|---|---|
| Industrial sector | 29.1 | 41% |
| Human supply | 42 | 59 % |
| Economic Vulnerability Indicator | EVI2 = 1.00 | |
Table 20.
W-ScaRI calculation for RJMR—January 2015.
| Drought Hazard Subindex | Consequence Subindex | |||||||||
|---|---|---|---|---|---|---|---|---|---|---|
| Indicators | Weight | Value | Exposure | Indicators | Weight | Value | ||||
| Indicator | Weight | Value | ||||||||
| Meteorological drought indicator (MDI) | SPI | 0.333 | 0.87 | Water stress | 0.5 | 0.94 | Environmental vulnerability (EnVI) | Bqual | 0.333 | 0.99 |
| Agricultural drought indicator (ADI) | RDI | 0.333 | 0.93 | % VEqR | 0.5 | 1.00 | Social vulnerability (SVI) | PD | 0.333 | 0.79 |
| Hydrological drought indicator (HDI) | SDI | 0.333 | 1.00 | Economic vulnerability (EVI) | GDP per capita | 0.167 | 0.82 | |||
| % Human supply competition | 0.167 | 1.00 | ||||||||
| Final Exposure | 0.97 | Final Vulnerability | 0.90 | |||||||
| Hazard Subindex | 0.93 | Consequence Subindex | 0.87 | |||||||
| Weight | 0.50 | Weight | 0.50 | |||||||
| Water Scarcity Risk Index—W-ScaRI | 0.90 | |||||||||
Table 21.
W-ScaRI calculation for RJMR—October 2015.
| Drought Hazard Subindex | Consequence Subindex | |||||||||
|---|---|---|---|---|---|---|---|---|---|---|
| Indicators | Weight | Value | Exposure | Indicators | Weight | Value | ||||
| Indicator | Weight | Value | ||||||||
| Meteorological drought indicator (MDI) | SPI | 0.333 | 0.66 | Water stress | 0.5 | 1.00 | Environmental vulnerability (EnVI) | Bqual | 0.333 | 0.99 |
| Agricultural drought indicator (ADI) | RDI | 0.333 | 0.86 | % VEqR | 0.5 | 0.95 | Social vulnerability (SVI) | PD | 0.333 | 0.79 |
| Hydrological drought indicator (HDI) | SDI | 0.333 | 0.89 | Economic vulnerability (EVI) | GDP per capita | 0.167 | 0.82 | |||
| % Human supply competition | 0.167 | 1.00 | ||||||||
| Final Exposure | 0.97 | Final Vulnerability | 0.90 | |||||||
| Hazard Subindex | 0.80 | Consequence Subindex | 0.87 | |||||||
| Weight | 0.50 | Weight | 0.50 | |||||||
| Water Scarcity Risk Index—W-ScaRI | 0.84 | |||||||||
Disclaimer/Publisher’s Note: The statements, opinions and data contained in all publications are solely those of the individual author(s) and contributor(s) and not of MDPI and/or the editor(s). MDPI and/or the editor(s) disclaim responsibility for any injury to people or property resulting from any ideas, methods, instructions or products referred to in the content. |
© 2023 by the authors. Licensee MDPI, Basel, Switzerland. This article is an open access article distributed under the terms and conditions of the Creative Commons Attribution (CC BY) license (https://creativecommons.org/licenses/by/4.0/).
Share and Cite
MDPI and ACS Style
Thomaz, F.R.; Miguez, M.G.; de Souza Ribeiro de Sá, J.G.; de Moura Alberto, G.W.; Fontes, J.P.M. Water Scarcity Risk Index: A Tool for Strategic Drought Risk Management. Water 2023, 15, 255. https://doi.org/10.3390/w15020255
AMA Style
Thomaz FR, Miguez MG, de Souza Ribeiro de Sá JG, de Moura Alberto GW, Fontes JPM. Water Scarcity Risk Index: A Tool for Strategic Drought Risk Management. Water. 2023; 15(2):255. https://doi.org/10.3390/w15020255
Chicago/Turabian StyleThomaz, Fernanda Rocha, Marcelo Gomes Miguez, João Gabriel de Souza Ribeiro de Sá, Gabriel Windsor de Moura Alberto, and João Pedro Moreira Fontes. 2023. "Water Scarcity Risk Index: A Tool for Strategic Drought Risk Management" Water 15, no. 2: 255. https://doi.org/10.3390/w15020255
Note that from the first issue of 2016, this journal uses article numbers instead of page numbers. See further details here.