Article

A Data-Driven Framework for Spatiotemporal Analysis and Prediction of River Water Quality: A Case Study in Pearl River, China

1
School of Environment and Energy, South China University of Technology, Guangzhou 510006, China
2
School of Environmental Science and Engineering, Guangdong University of Petrochemical Technology, Maoming 525000, China
3
Guangdong Provincial Key Laboratory of Atmospheric Environment and Pollution Control, South China University of Technology, Guangzhou Higher Education Mega Centre, Guangzhou 510006, China
4
College of Resources and Environmental Engineering, Guizhou University, Guiyang 550025, China
*
Authors to whom correspondence should be addressed.
Water 2023, 15(2), 257; https://doi.org/10.3390/w15020257
Submission received: 17 December 2022 / Revised: 3 January 2023 / Accepted: 4 January 2023 / Published: 7 January 2023
(This article belongs to the Section Urban Water Management)

Abstract

:
Characterization of the spatiotemporal water quality variation is of utmost importance for water resource management. Changes in water quality have been shown to be significantly affected by uncertain factors such as environmental conditions and anthropogenic activities. However, few studies consider the impact of these variables on water quality prediction while developing statistical methods or machine learning algorithms. To solve the problem, a data-driven framework for the analysis and prediction of water quality in the Guangzhou reach of the Pearl River, China, was constructed in this study. The results provided evidence of a discrepancy in the spatiotemporal dynamics of water quality, with the average water quality index (WQI) values ranging from 52.47 to 83.06, implying “moderate” to “excellent” water quality at different stations. Environmental conditions and anthropogenic activities exerted great influence on the alteration of water quality, with correlation coefficients of 0.6473–0.7903. The relevant environmental factors and anthropogenic drivers combined with water quality variables were taken into account to establish the attention-based long short-term memory (LSTM-attention) model. The proposed LSTM-attention model achieved reliable real-time water quality prediction with up to a 3-day lead-time and a determination coefficient (R2) of 0.6. The proposed hybrid framework sheds light on the development of a decision system for comprehensive water resource management and early control of water pollution.

1. Introduction

Rivers, representing the sustained transportation corridors from land to lakes and oceans, are essential for not only the ecosystem services but also economic wealth [1]. However, as the main water resources for drinking and agricultural purposes, China’s rivers have experienced serious water quality impairments over the past several decades due to rapid urbanization and energy-intensive industrial development [2,3,4]. According to a nationwide survey in 2017 (based on 1940 sampling sites), 32.1% and 8.3% of China’s surface water, including rivers, lakes and reservoirs, has been characterized as having poor and extremely poor water quality, resulting from extensive anthropogenic activities (industrial and agricultural production) and natural processes (precipitation and soil erosion) [5]. As a consequence, the elevated risks associated with the biodiversity and functionality of the Chinese river ecosystems have exerted potentially deleterious impacts on human health, posing distinct challenges to the water resource management and hindering sustainable economic development in the long run [6,7].
To address the healthy, robust and sustainable watershed development, numerous studies have been conducted for water quality assessment and prediction associated with spatiotemporal variation, from a single river basin to the whole Chinese river network [8,9,10]. Certain factors, such as hydrological conditions [7], landscape features [11] and anthropogenic activities [1] have been proven to significantly impact changes in water quality. However, previous studies on developing the evaluative mathematical models have been mainly focused on water quality parameters without considering other factors. Moreover, due to limited sampling conditions and an incomplete monitoring network, data analysis and subsequent interpretation may exhibit discrepancies in different studies, and a comprehensive analysis framework is lacking [12]. Within this context, establishing a data-driven framework for spatiotemporal analysis and prediction of river water quality whilst incorporating environmental factors and human activities into the framework represents a critical step in advancing effective water quality risk prevention and control.
The water quality index (WQI) has been considered a popular criterion for the classification and evaluation of surface water quality [13]. It provides a comprehensive picture of water quality based on aggregation techniques to transform large quantities of water quality characterization data (e.g., physical, chemical and biological indices) into a single value or index presenting the level of water quality [14]. Compared with conventional evaluation methods, WQI can make the results of water quality assessment easy to understand and eliminate the variations between different parameters used individually [15]. To date, WQI has been extensively employed for surface water quality assessment, including rivers, lakes and reservoirs [16].
Additionally, the time series of water quality is crucial for water environment research. More recently, nonparametric statistical techniques and machine learning methods based on water quality time series have shown great potential in analyzing the fundamental laws and forecasting trends of river water quality [17]. With great ability for data interpretation and spatiotemporal pattern recognition, nonparametric statistical techniques can explore the relationship among water quality variables and external influencing factors from a massive amount of raw data [18], thereby facilitating water quality assessment and the identification of possible pollution sources. Similarly, with the rapid development of the artificial intelligence, data-driven machine learning models demonstrate promising performance in time series prediction [19,20,21]. Particularly, long short-term memory (LSTM), addressing the problem of gradient explosion in traditional networks, has the capacity for learning and remembering both short and long-term information [22]. The LSTM model is an enhancement of the recurrent neural networks (RNNs) structure with stronger and better memory performance; it is well suited to processing and predicting important events with long sampling intervals and time series [23]. To date, LSTM has been widely applied to water pollution prediction and early warning, providing a reliable way to prevent and control water pollution [24,25].
This study aimed to reveal the evolution process and spatiotemporal patterns of the river water environment and predict water quality, taking environmental and anthropogenic activities variables into overall consideration by applying both nonparametric statistical and machine learning methods. More specifically, the main objective of this study is to (1) investigate hydro-chemical characteristics and spatiotemporal variations in river water quality as well as conduct a comprehensive assessment of river status using the WQI method; (2) evaluate the impacts of environmental change and anthropogenic activities on river water quality and identify key factors affecting water quality; (3) predict water quality by integrating key factors into the predictive model; and (4) explore a framework for spatiotemporal analysis and prediction of water quality based on high-frequency time series data.

2. Methodology

2.1. Study Area

Guangzhou (22°26′–23°56′ N, 112°57′–114°03′ E), the capital of Guangdong Province, is located in southern China and the north-central Pearl River Delta. Guangzhou is characterized by a typical south subtropical marine climate, with an annual average temperature of 22.5 °C. The mean annual rainfall is nearly 1720 mm, 80% of which occurs in the wet season from April to September. Most rivers in Guangzhou belong to the Pearl River system, with mountain rivers in the northeast, and a river network formed by Guangzhou reach of the Pearl River and its tributaries in the south. Based on the hydrological characteristics and geographical conditions, the Guangzhou river system can be divided into three major river basins, including the northern, central and southern basin. To monitor the changes in river water quality, 11 national automatic stations were built in Guangzhou to collect water samples for quantitative real-time analysis. More information about these stations for monitoring surface water quality is shown in Figure 1.

2.2. Datasets

In this work, a water quality dataset during the period between August 2018 and December 2021 was obtained from the China National Environmental Monitoring Centre (http://www.cnemc.cn/, accessed on 16 December 2022). According to the Fourteenth Five-Year Plan for National Surface Water Monitoring and Evaluation [26], five typical water quality parameters, i.e., pH, dissolved oxygen (DO), total phosphorus (TP), ammonia-nitrogen (NH3-N) and permanganate index (CODMn) were selected for water quality evaluation in the present study; they were measured every 4 h from 11 sampling sites. The potential environmental factors affecting the water quality included precipitation, water temperature (WT) and air quality index (AQI). Based on the basin where the water quality monitoring station is located, the corresponding precipitation and AQI data were obtained from ZC, GZ, PY weather stations and 1353A, 1348A, 1350A air quality monitoring stations, respectively (Figure 1). WT was automatically measured by each water quality monitoring station.
In addition, anthropogenic activities are also considered as the key factors influencing water quality. Electricity consumption, water supply and industrial output were used as surrogate variables to reflect the intensity of anthropogenic activities in the present study. The electricity consumption data used in our study were provided by the State Grid Guangzhou Electric Power Company. The water supply data were provided by water supply service stations in Guangzhou. The industrial output data were obtained from the Guangzhou Statistical Yearbook. Before conducting further research, the anthropogenic activities data of Guangzhou were assigned to the control range of three basins according to the area weight, in order to ensure the spatial compatibilities between anthropogenic activities and water quality [27].
The percentage of invalid data was very small, exerting subtle influence on the overall data structure. The obvious outliers and continuous missing data were eliminated, and other missing data were filled by linear interpolation. Data preprocessing was performed using the built-in Numpy, Pandas and Scikit-Learn packages in Python 3.9.7.

2.3. Water Quality Index (WQI)

The WQI calculation was as follows:
WQI = i = 1 n ( C i P i ) i = 1 n P i
where n is the number of parameters included in the study, and C i   and   P i are the normalized value and weight of the i-th parameter, respectively. The P i value ranged from 1 to 4 (Table S1).
C i in Equation (1) was calculated according to the China’s Environmental Quality Standards for Surface Waters (GB3838-2002) [28,29], described as below:
C i = { 100 [ ( T i S i , k ) ( S i , k + n S i , k ) × 20 n + I i , k ] , T i [ S i , k , S i , k + n ) 100 T i S i , k + n × 20 n , T i [ 0 , S i , k )
where T i is the measured value of the i-th parameter; S i , k and S i , k + n are the standard values of the i-th parameter at level k and ( k + n ), respectively; I i , k denotes the standard normalized value of the parameter classification; n is the number of the equal standard value, and if there is no equal standard value then n = 1 .
The WQI value ranged from 0 to 100, numerically representing a broad range of five levels: extremely poor (0–20), poor (21–40), moderate (41–60), good (61–80) and excellent (81–100).

2.4. Nonparametric Statistical Approaches

In this study, a variety of nonparametric statistical methods were employed for spatiotemporal diagnosis and analysis of river water quality. Seasonal and trend decomposition using Loess (STL) was applied to decompose low-frequency components from original data, and combined with a Mann–Kendall (M-K) statistical test to comprehensively analyze the evolution trends in river water quality [30,31]. The one-way analysis of variance (ANOVA) was used to determine the spatial variation in river water quality [29]. Pearson’s correlation coefficient (R) was employed to verify the spatial correlation of river water quality among 11 sampling sites. Additionally, a grey correlation analysis was conducted to quantify the relative contribution of environmental change and anthropogenic activities to the alteration in river water quality. The software SPSS 26.0 and Python 3.9.7 were used as the calculation platforms.

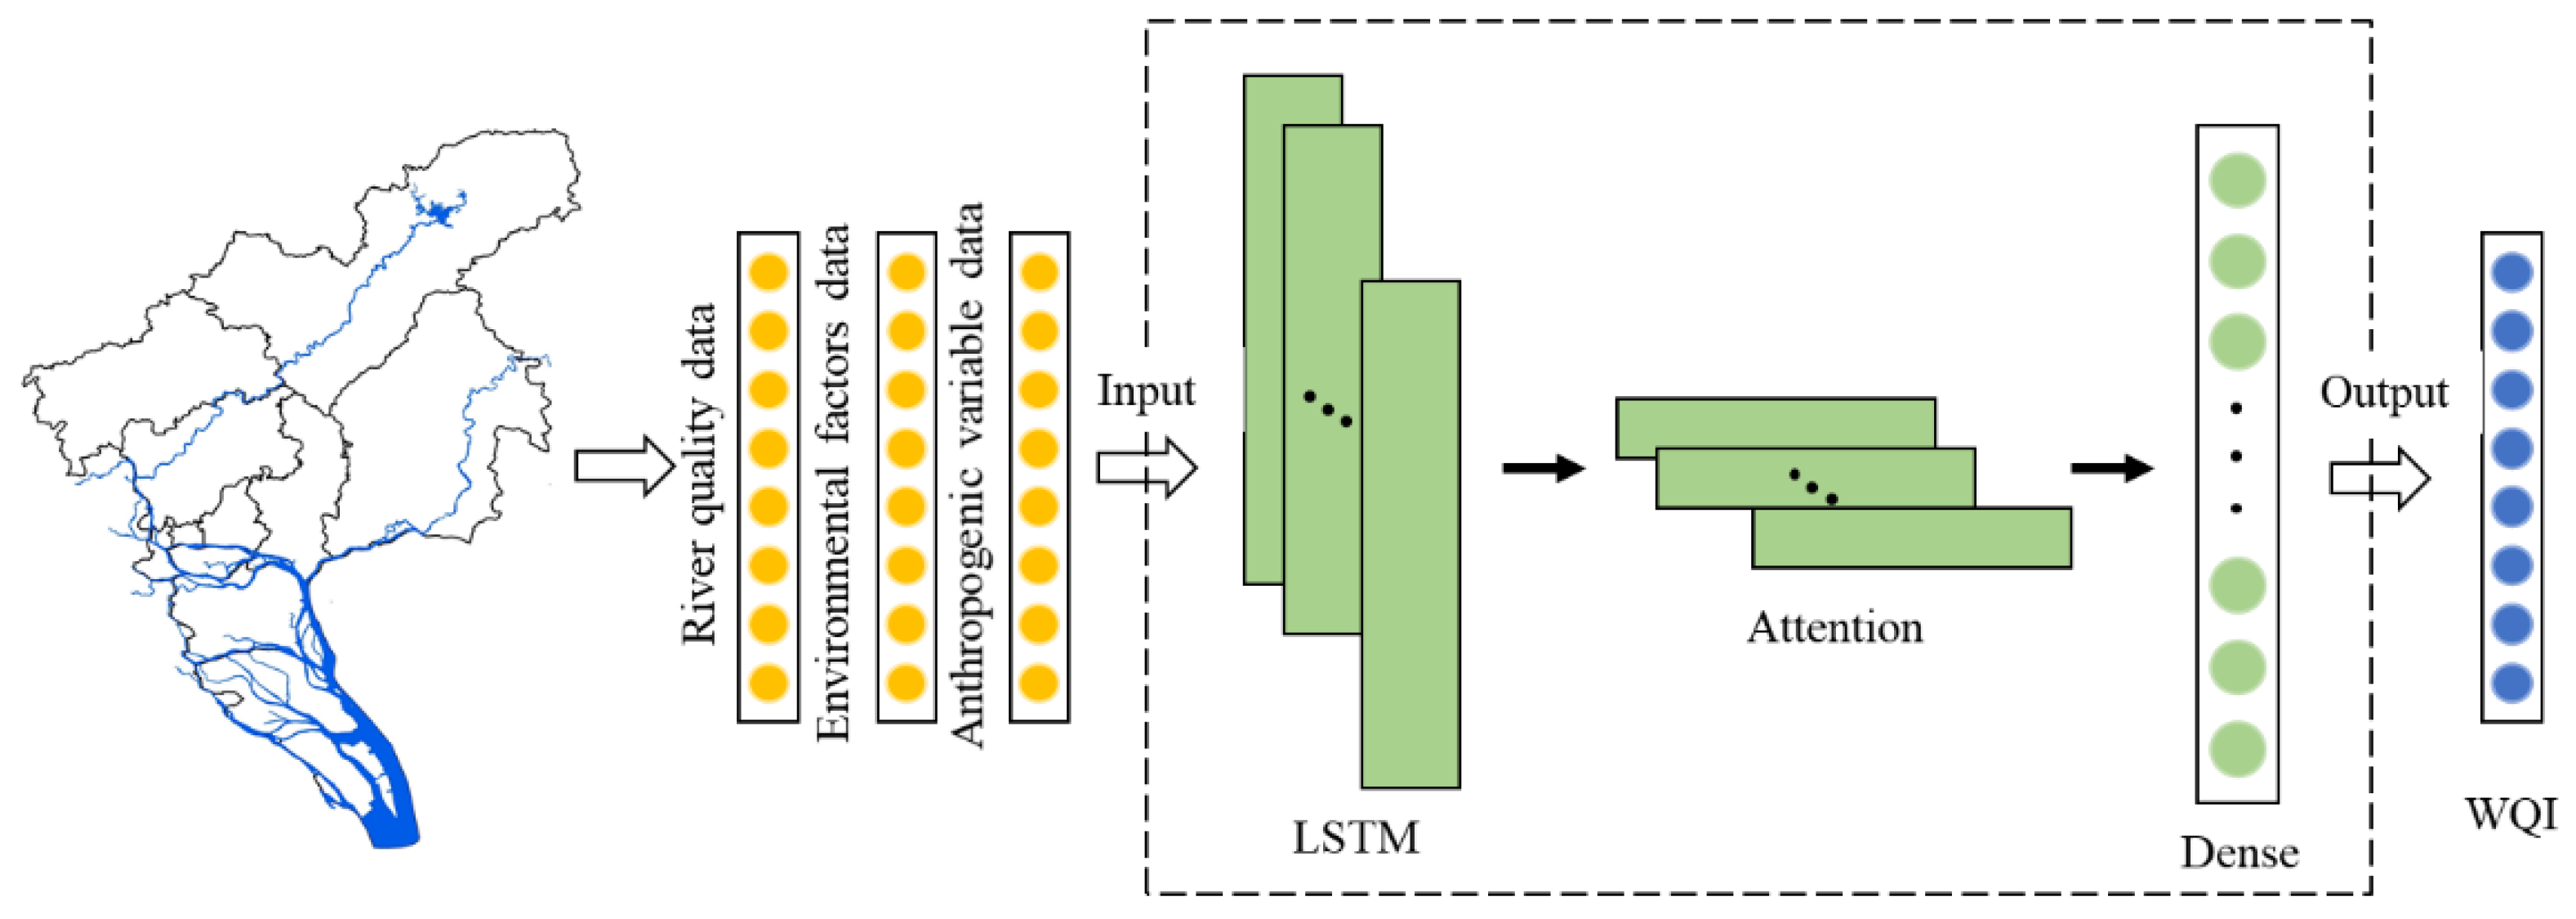
2.5. LSTM-Attention for Water Quality Prediction

LSTM, a deep learning algorithm dedicated to sequential data was used for water quality prediction, consisting of a group of circularly connected memory cells for storing and transmitting sequence information. The structure and forward pass of the LSTM model is described in Text S1 of the Supplementary Materials. The attention mechanism enables a neural network to focus on the most important parts of input data, which can further improve performance of LSTM in dealing with long term input data [32]. As such, the attention mechanism based on LSTM was implemented to accurately predict river water quality.
Three statistical metrics, i.e., root mean-square error (RMSE), coefficient of determination (R2), and mean absolute error (MAE), were applied to evaluate the performance of the models. RMSE and MAE represent the error between measured and predicted values, and the lower value of them indicates an overall better model performance. The R2 was applied to assess the fitting degree of LSTM-attention. A large value of R2 implies that the predicted values can match the measured values better, with R2 = 1 representing the best model performance. These metrics are calculated as follows:
RMSE = 1 n i = 1 n ( WQI predicted WQI measured ) 2
R 2 = 1 i = 1 n ( WQI measured WQI predicted ) 2 i = 1 n ( WQI measured WQI ¯ measured ) 2
MAE = 1 n i = 1 n | WQI measured WQI predicted |
where WQI predicted and WQI measured present values of predicted and measured WQI, respectively, and   WQI ¯ measured denotes the mean value of measured WQI.

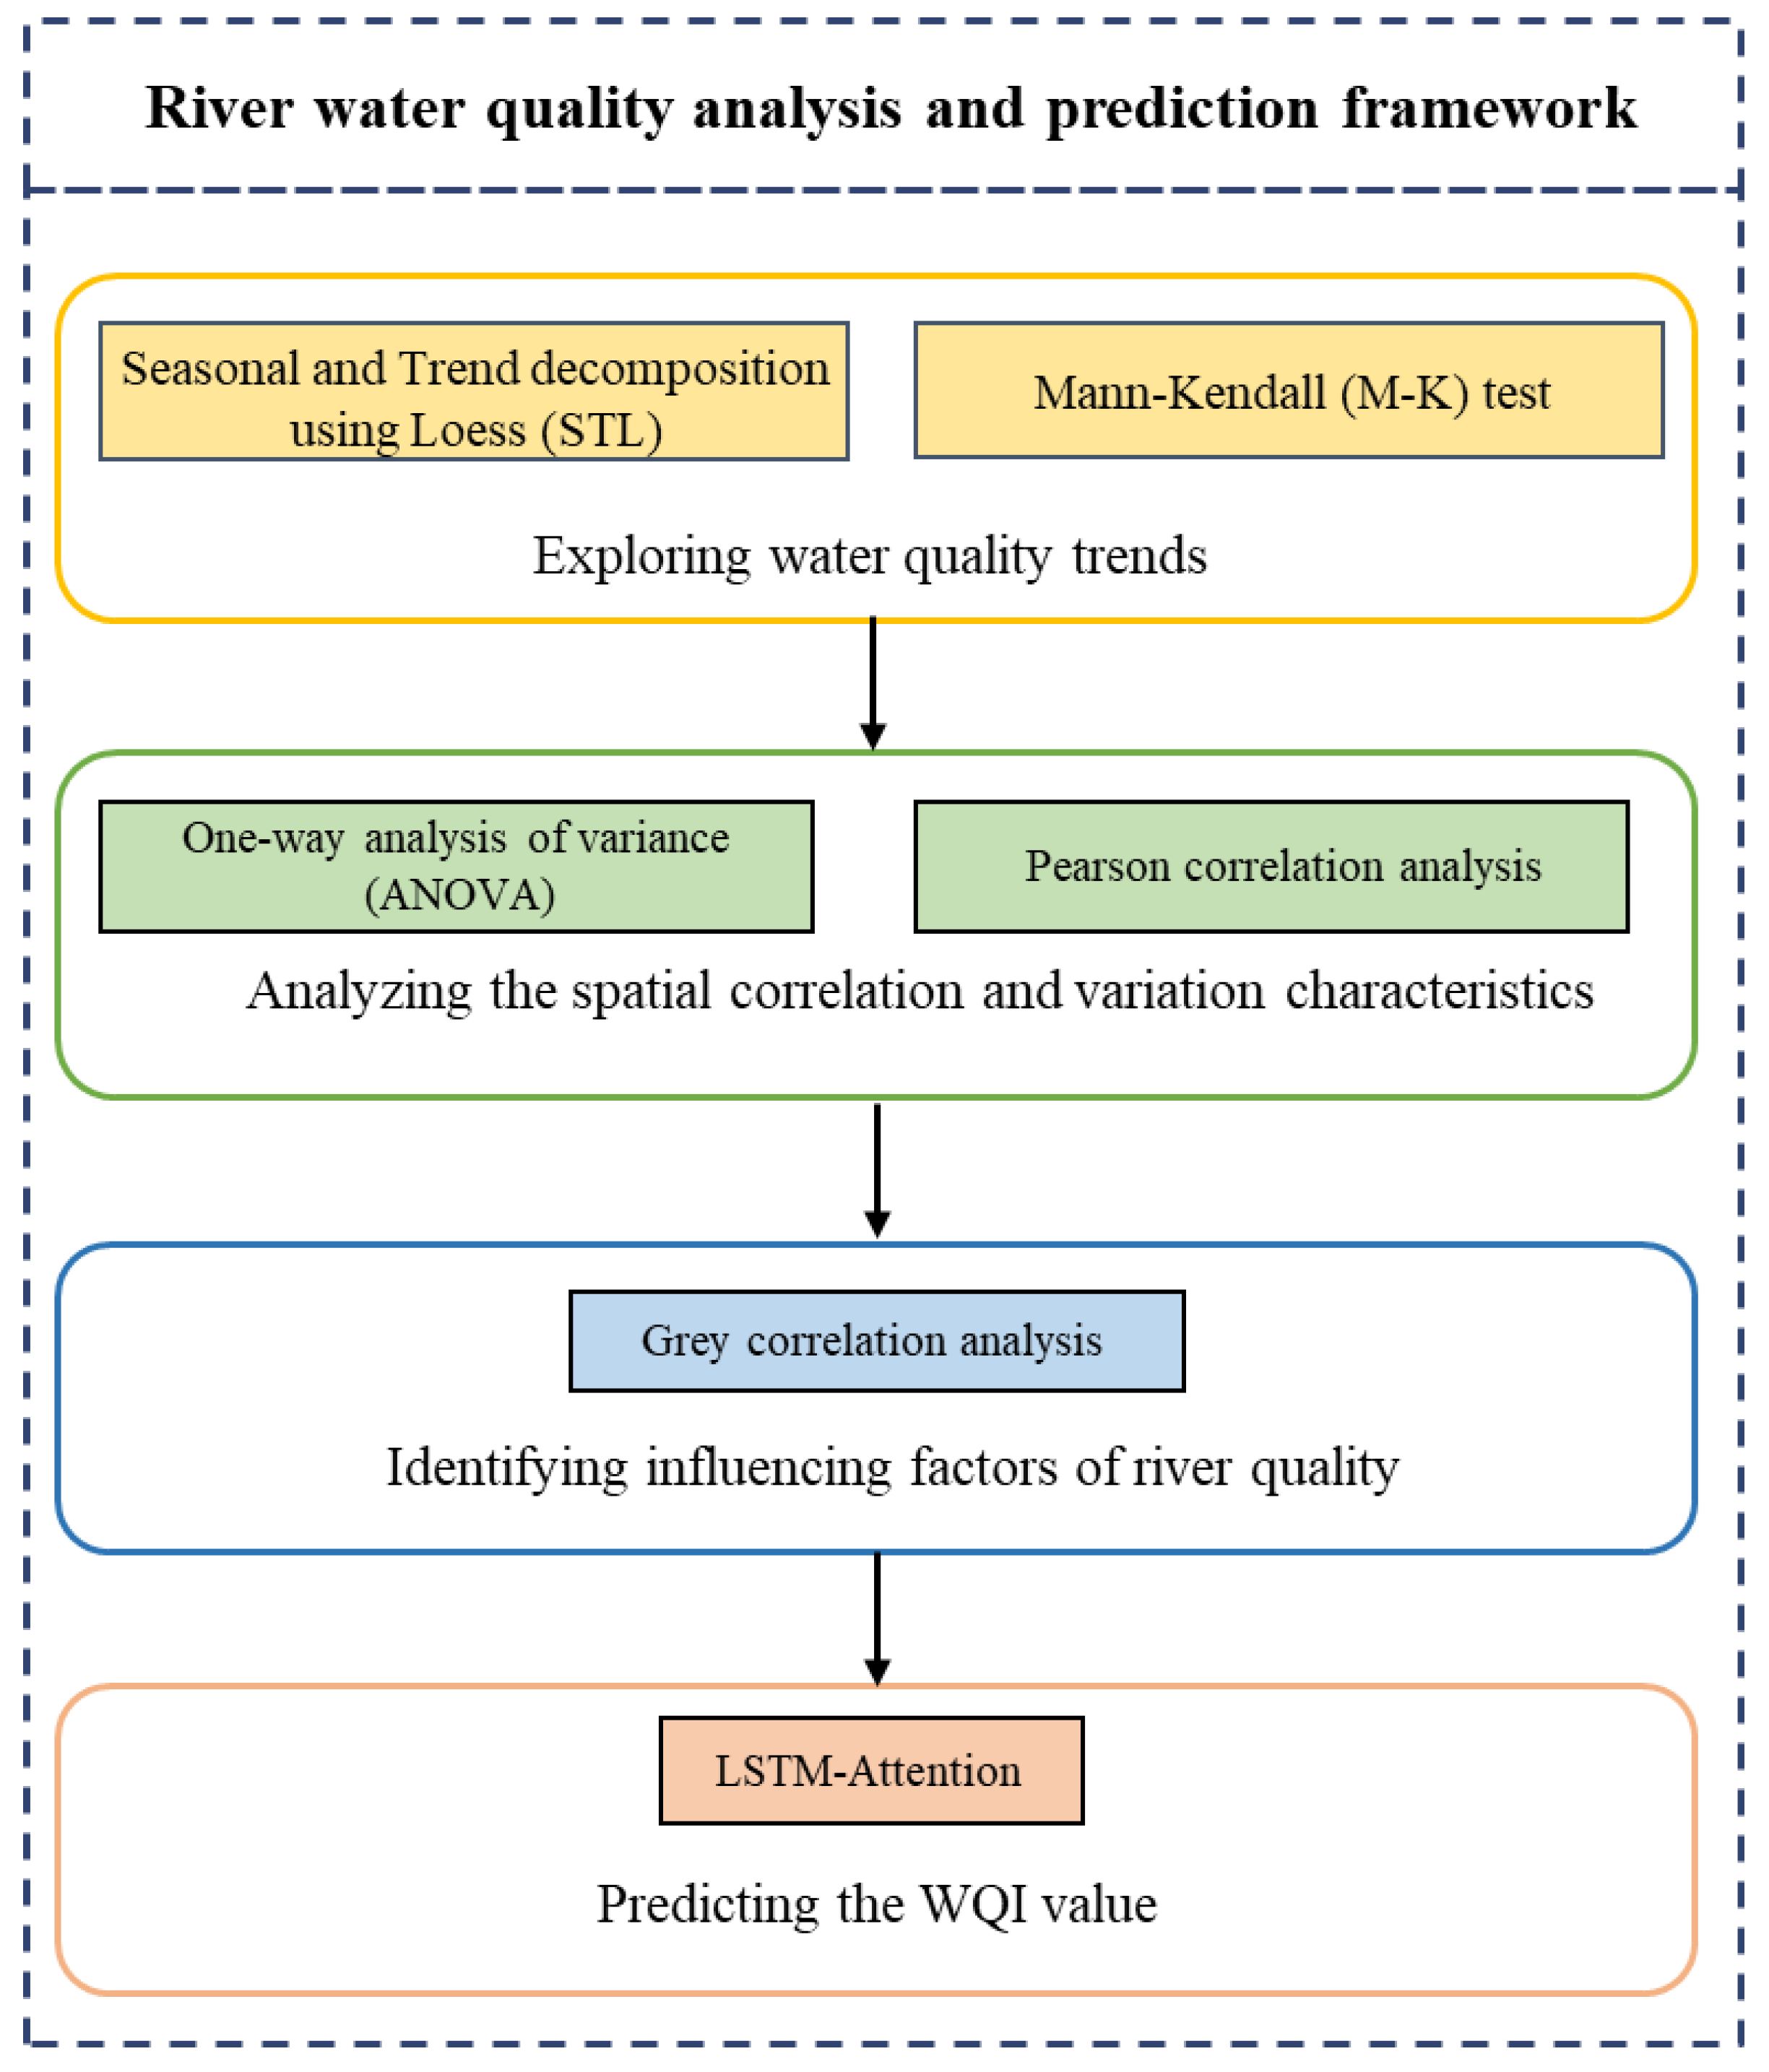
2.6. Analysis and Prediction Framework for Water Quality

In the present study, a novel spatiotemporal analysis and prediction framework was proposed based on nonparametric statistical methods and a deep learning algorithm for an accurate and reliable assessment of water quality (Figure 2). The STL and MK methods were used to characterize temporal variation of river water quality and identify water quality tendency. The ANOVA and Pearson correlation analysis methods were employed for the analysis of spatial correlation and variation characteristics. The grey correlation analysis was applied to assess the factors influencing water quality at different basins. Finally, the ensemble of an LSTM-attention model was introduced to predict water quality.

3. Results and Discussion

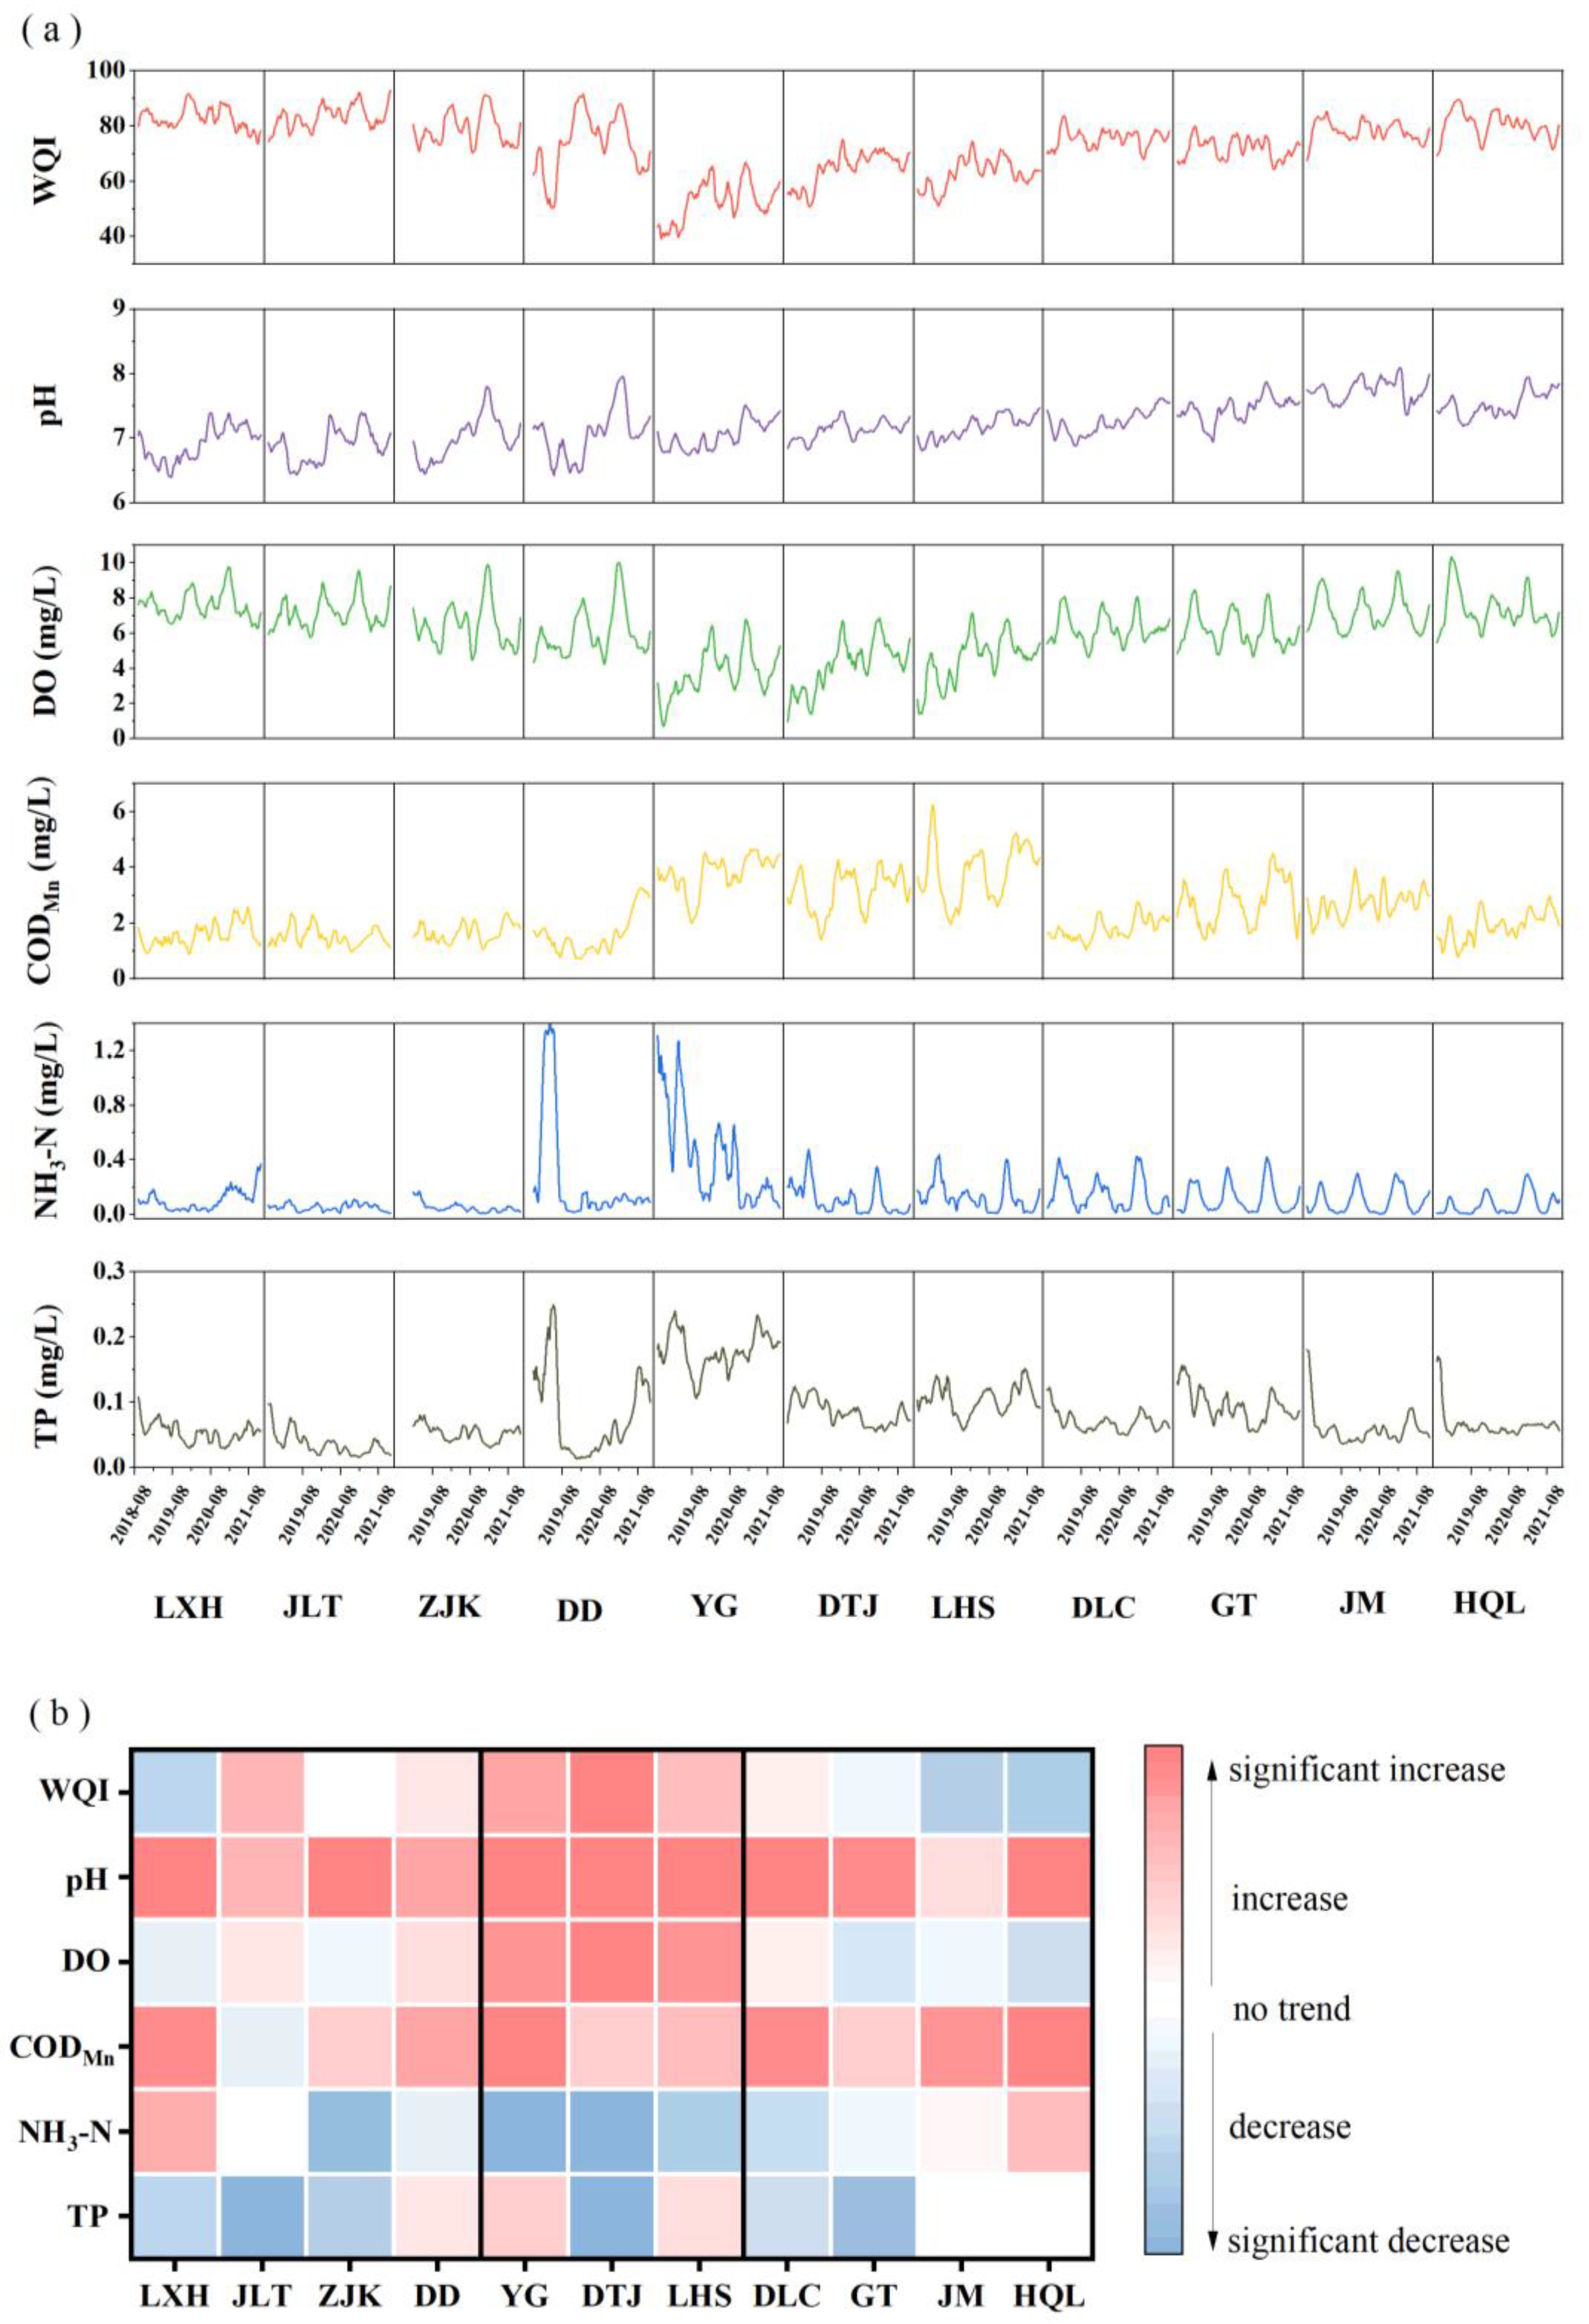
3.1. Temporal Variation and Trend Analysis of Water Quality

The temporal variation in water quality of each monitoring station from 2018 to 2021 was investigated. As shown in Figure 3a, the water quality parameters at 11 monitoring stations fluctuated significantly over time, and three periods of noticeable changes were observed during 2018~2021. In October 2018, the TP concentrations of four monitoring stations in the southern basin were unexpectedly decreased. Particularly, the average TP concentrations were decreased from 0.153 and 0.154 mg/L to 0.054 and 0.061 mg/L, respectively, at JM and HQL stations. From March to July 2019, the TP and NH3-N levels at DD, YG, DTJ, and LHS station were also decreased sharply, while the corresponding WQI values were increased significantly. In addition, the maximum WQI values of all monitoring stations were observed from January to March 2020, with the average WQI values of 87.67, 67.09, and 78.78 at the northern, central and southern basins, respectively. A discernible decline was observed from April to May 2020.
The monitoring stations in the southern basin were surrounded by farmlands and fishponds. Therefore, TP can be unavoidably released into rivers from agricultural sources through surface runoff, subsurface flow, farm drainage and seepage [33]. The substantial decrease in the TP levels in October 2018 might be attributable to a series of remedial measures implemented by the Chinese central and local governments aimed at controlling both agricultural and aquaculture pollution from non-point sources at large scale. Similarly, during the period of March to July 2019, the improvement of water quality at DD, YG, DTJ and LHS monitoring stations was also ascribed to the formulation of strict local policies and the implementation of various pollution control measures, such as accelerating the construction progress of sewage plants, improving sewage interception in urban villages and launching the “river washing” campaign in a comprehensive way. Moreover, in early 2020, when the maximum WQI values were observed at all monitoring stations, the corresponding concentrations of CODMn, TP and NH3-N showed significant downward tendencies. The reason behind this phenomenon might be the fact that the COVID-19 epidemic was rapidly sweeping across China during this period, and Guangzhou implemented stay-at-home/lockdown orders. As such, production, economic and social activities were restricted, which greatly reduced anthropogenic sewage discharge [34]. From April 2020, anthropogenic activities gradually resumed with time, and a slight deterioration in water quality was therefore observed.
Furthermore, seasonal variation in water quality was also observed in the Guangzhou reach of the Pearl River. The seasonal variation in DO concentration was affected by the temperature change, which decreased from spring to summer and increased from summer to winter. The seasonal change in pH was similar to that of DO, with minimum values of 6.38–7.66 observed in summer and maximum values of 7.30–8.05 observed in winter at different stations. This finding indicated that the biological processes that control the seasonal DO cycle may also affect pH in river [35]. As for CODMn, the average concentration ranging from 1.40 to 3.77 mg/L in the wet season was lower than that in the dry season, ranging from 1.57 to 3.97 mg/L and mainly due to the dilution effect of stormwater. In the wet season, heavy storms bring a large amount of freshwater into the river, resulting in lower CODMn concentration [36]. Similarly, the average concentration of NH3-N was also lower in the rainy season compared to that in dry season, especially at monitoring stations located in estuaries, such as GT, JM and HQL. This phenomenon was mainly caused by two reasons. On the one hand, the NH3-N biodegradation was closely associated with nitrification and denitrification processes in river, and the high temperature and a low in DO level in summer facilitated the denitrification process, promoting NH3-N decomposition [37]. On the other hand, in estuaries, the inland riverine water was usually mixed with seawater from the surrounding bay through the flood during rainy seasons, resulting in the dilution of the river water and low level of NH3-N. With respect to the variation in TP, a prominent seasonal pattern was not observed. However, the maximum TP concentration, ranging from 0.07 to 0.24 mg/L, was often found in spring at different stations, indicating that the nutrients accumulated in winter may enter the river with rainfall runoff in spring [38].
According to the Mann–Kendall test results (Figure 3b), from 2018 to 2021, the WQI evolution of monitoring stations JLT, YG, DTJ and LHS exhibited an upward trend, while for stations LXH, JM and HQL, a downward tendency of WQI was observed. As for stations ZJK, DD, DLC and GT, no significant change in WQI was found. Furthermore, it was evidenced that the increase in WQI value was accompanied by an increase in DO level and a decrease in NH3-N concentration. As for TP evolutions, a downward tendency was observed among all the monitoring stations, except for YG and LHS stations with an upward trend and DD, JM and HQL stations with no significant variation. With respect to the variation in pH and CODMn, all the stations exhibited an upward trend, except for the CODMn at JLT station which showed no significant variation, probably due to natural processes such as photosynthesis and metabolism of algae and aquatic plants [39]. Although there was a deteriorating tendency of river water quality observed in some stations, such as LXH, JM and HQL stations, the water quality was still categorized as good, based on the WQI value of > 60, see Figure 3a. The WQI value and MK results indicated that during the period of 2018 to 2021, the water quality in the Guangzhou reach of the Pearl River improved over time; this can be attributed to a series of protection and restoration measures taken by the government, such as controlling pollution from agricultural non-point sources and improving sewage treatment facilities. Moreover, the implementation of the Chinese River Chief Policy also played a vital role in improving river water quality; this was an innovative and effective strategy for encouraging local officials at county and district level to be actively involved in water resource management [40]. Since the full implementation of Chinese River Chief Policy in Guangzhou in 2016, the inner rivers’ water quality has been significantly improved, and limination rate of black and smelly rivers in Guangzhou reached 100% by the end of 2019. In general, although water quality in the Guangzhou reach of the Pearl River has achieved remarkable improvements due to a series of related policies, long-term planning is still needed to control pollutants to prevent the water from turning black and odorous again after governance [41].

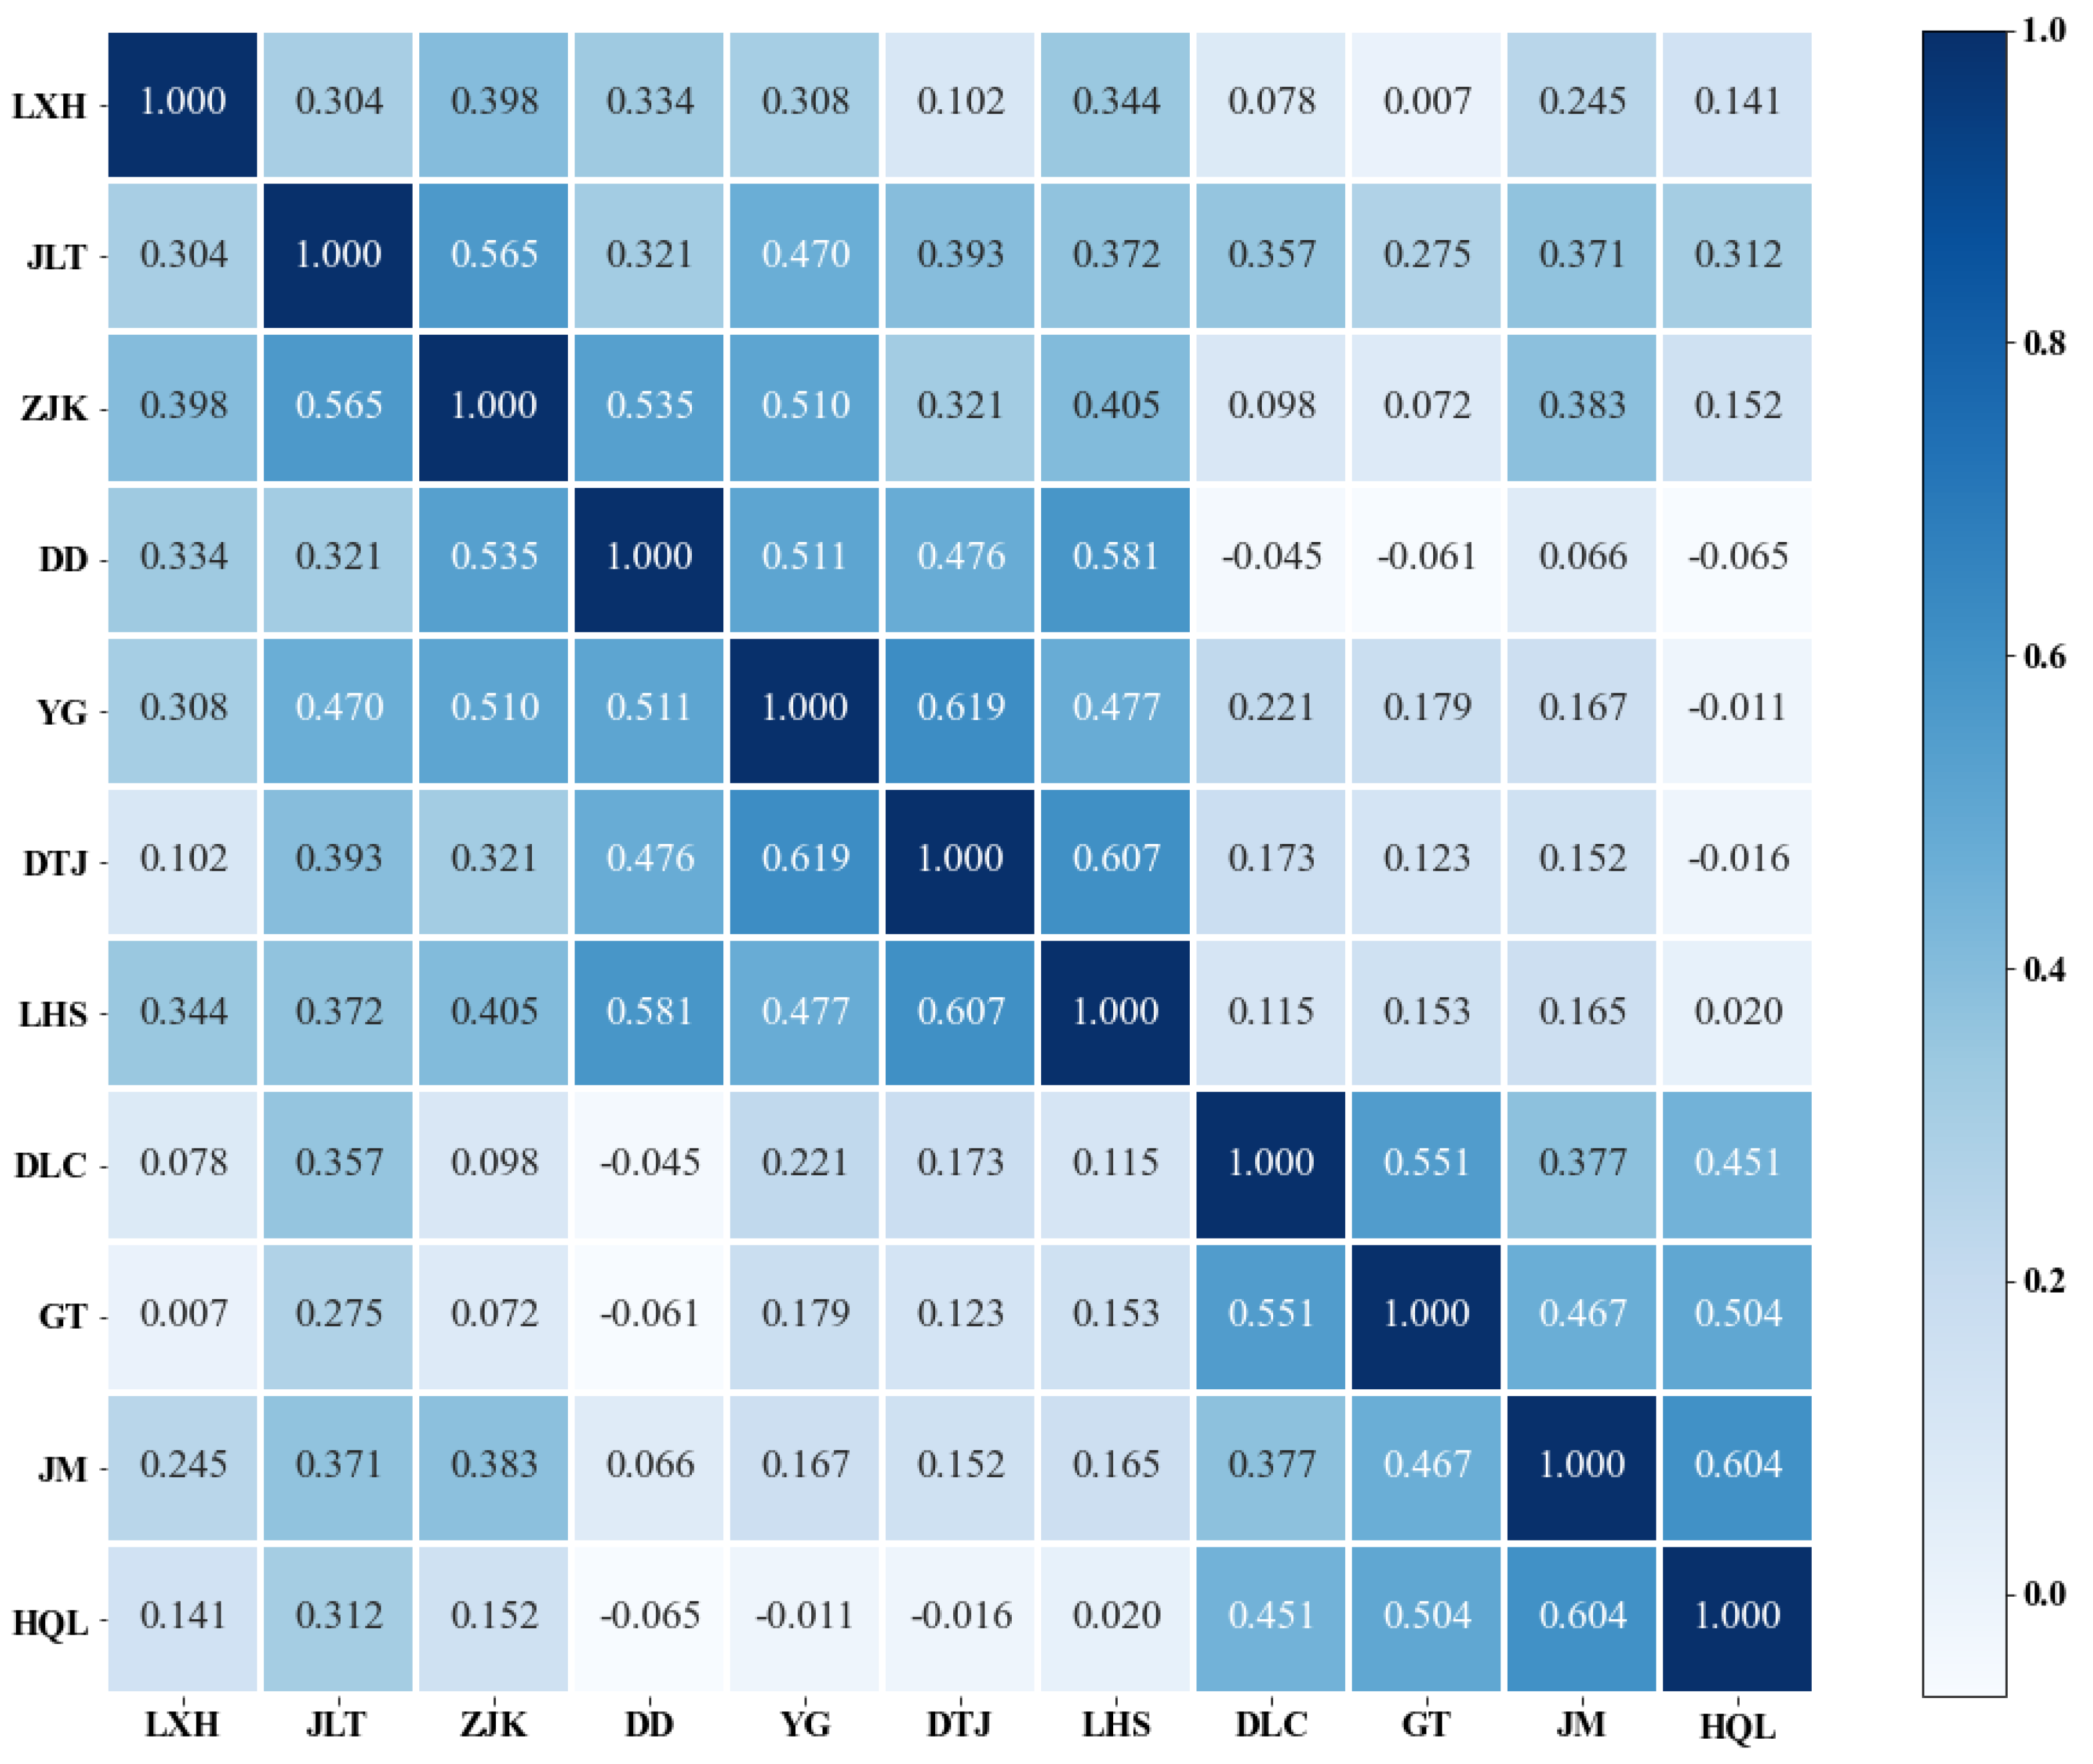
3.2. Spatial Variation Analysis

According to the analysis results of one-way ANOVA (Figure 4), a significant difference in water quality among the three river basins in Guangzhou was observed. Notably, the WQI values at the central basin (i.e., YG, DTJ, LHS) (with an average value of 60.03) were significantly lower than those of the northern basin (LXH, JLT, ZJK, DD) (with an average value of 79.60) and those of the southern basin (DLC, GT, JM, HQL) (with an average value of 76.28). The variation in WQI values among the monitoring stations were consistent with individual water quality parameters, suggesting that the highest concentrations of CODMn, NH3-N and TP were observed, while the lowest levels of DO were found at the central basin in the present study.
The differences in in socio-economic development and environmental conditions are considered the main reasons for regional discrepancy in water quality [8]. The northern basin was located in hilly area, mainly covered by forest, especially for stations LXH and JLT, where the level of disturbance from anthropogenic activities was relatively low and forest ecosystems played a positive role in maintaining surface water quality [13]. By contrast, the central basin was located in the center of the city, where numerous industrial complex and dense populations were predominant, resulting in continuous discharge of industrial and domestic wastewater with abundant organic pollutants and nutrients [42]. The lower concentrations of various pollutants were observed at the southern basin close to the estuary, where the frequently occurrence of tide may enhance the mixing of salt and fresh water, promoting the dilution of surface water [43]. However, it is worth noting that the concentrations of CODMn and NH3-N were higher than expected at the GT and JM station. This was primarily attributed to the aquaculture-related industry near GT and JM station, resulting in the elevated CODMn and NH3-N concentrations through the continuous discharge of aquatic animal wastes into the surface water. In addition, it was observed that the pH value of monitoring stations was gradually increased from the north to the south of Guangzhou. The relatively high pH values observed near the estuary may be caused by the movement of saltwater from the estuary to the inland river during the dry season [44]. Therefore, reducing nutrient inputs remains a challenge for watersheds in Guangzhou, which are widely affected by human activities. In this context, the local departments should strictly control the amount of sewage and wastewater discharged from various industries, and improve management plans required for water and fertilizers in farmlands.
In addition, the direction of river flow may exert significant spatial influence on water quality [45]. In general, the water quality at upper/lower stations of the same stream exhibits similar variation patterns. To assess the degree of spatial dependence in water quality, Pearson’s correlation coefficient (R) was employed to analyze the correlation of WQI among 11 stations. Our findings indicated that there were moderately positive spatial correlations among monitoring stations in the same basin, with Pearson’s R value ranging from 0.304 to 0.619 (Figure 5). This finding suggested that stations adjacent to each other exhibited similar WQI values, presumably due to their similar anthropogenic pressures, landscape usage and topography [46]. By contrast, weak spatial autocorrelations were observed among monitoring stations at different river basins, with Pearson’s R values ranging from −0.065 to 0.581. This finding might have been associated with landscape variability, local river management and the relative location of monitoring stations in rivers [45]. The presence of spatial autocorrelation was regarded as a possible diffusion process, suggesting that water quality in an upstream station could be used to predict water quality at a downstream station [47]. Therefore, in order to better understand the variations in water quality when establishing a predictive model, the spatial correlation among the sampling sites should be fully considered.

3.3. Correlation Analysis of Environmental Factors, Anthropogenic Activities and Water Quality

The relationship between environmental factors, anthropogenic activities and water quality was determined using a grey relational analysis method for identifying potential drivers of water quality impairment. The result showed that the selected environmental and anthropogenic activities factors were significantly correlated with water quality of the three basins, with correlation coefficients of greater than 0.6 (Table 1). With respect to environmental parameters (i.e., precipitation, WT and AQI), AQI exhibited the highest correlation with water quality. On the one hand, the atmospheric and aquatic environments were jointly affected by stressful conditions, such as anthropogenic pollutants emissions and natural disasters, resulting in similar change trends and high correlation coefficients. On the other hand, atmospheric wet/dry deposition directly transported air pollutants into surface water, and the nutrients such as N in atmospheric deposition were closely associated with water quality deterioration [48]. In general, precipitation has dual impacts on water quality; it can either increase (e.g., via soil percolation or surface runoff) or decrease (e.g., via dilution) the total quantity of pollutants in surface water depending on its magnitude and variability [7]. Moreover, WT may also affect water quality by altering the physical processes (e.g., thermal stratification), biological processes (e.g., growth and respiration of the aquatic organisms) and biochemical transformations of nutrients (e.g., mineralization, denitrification) [49]. Regarding the selected anthropogenic drivers, our analysis showed that power consumption, water supply and industrial output were the critical covariates responsible for the alteration of river water quality (Table 1), implying that the water quality in Guangzhou reach of the Pearl River has been seriously affected by anthropogenic activities in recent years. In addition, it is worth noting that there were regional differences in the correlation between anthropogenic drivers and the water quality among the three basins. For instance, the water supply exhibited a greater correlation with the water quality of the central and southern basins, while the industrial output showed the highest correlation with the water quality in the north basin, presumably due to the differences in watershed landscape features and usage patterns.

3.4. The Prediction of Water Quality

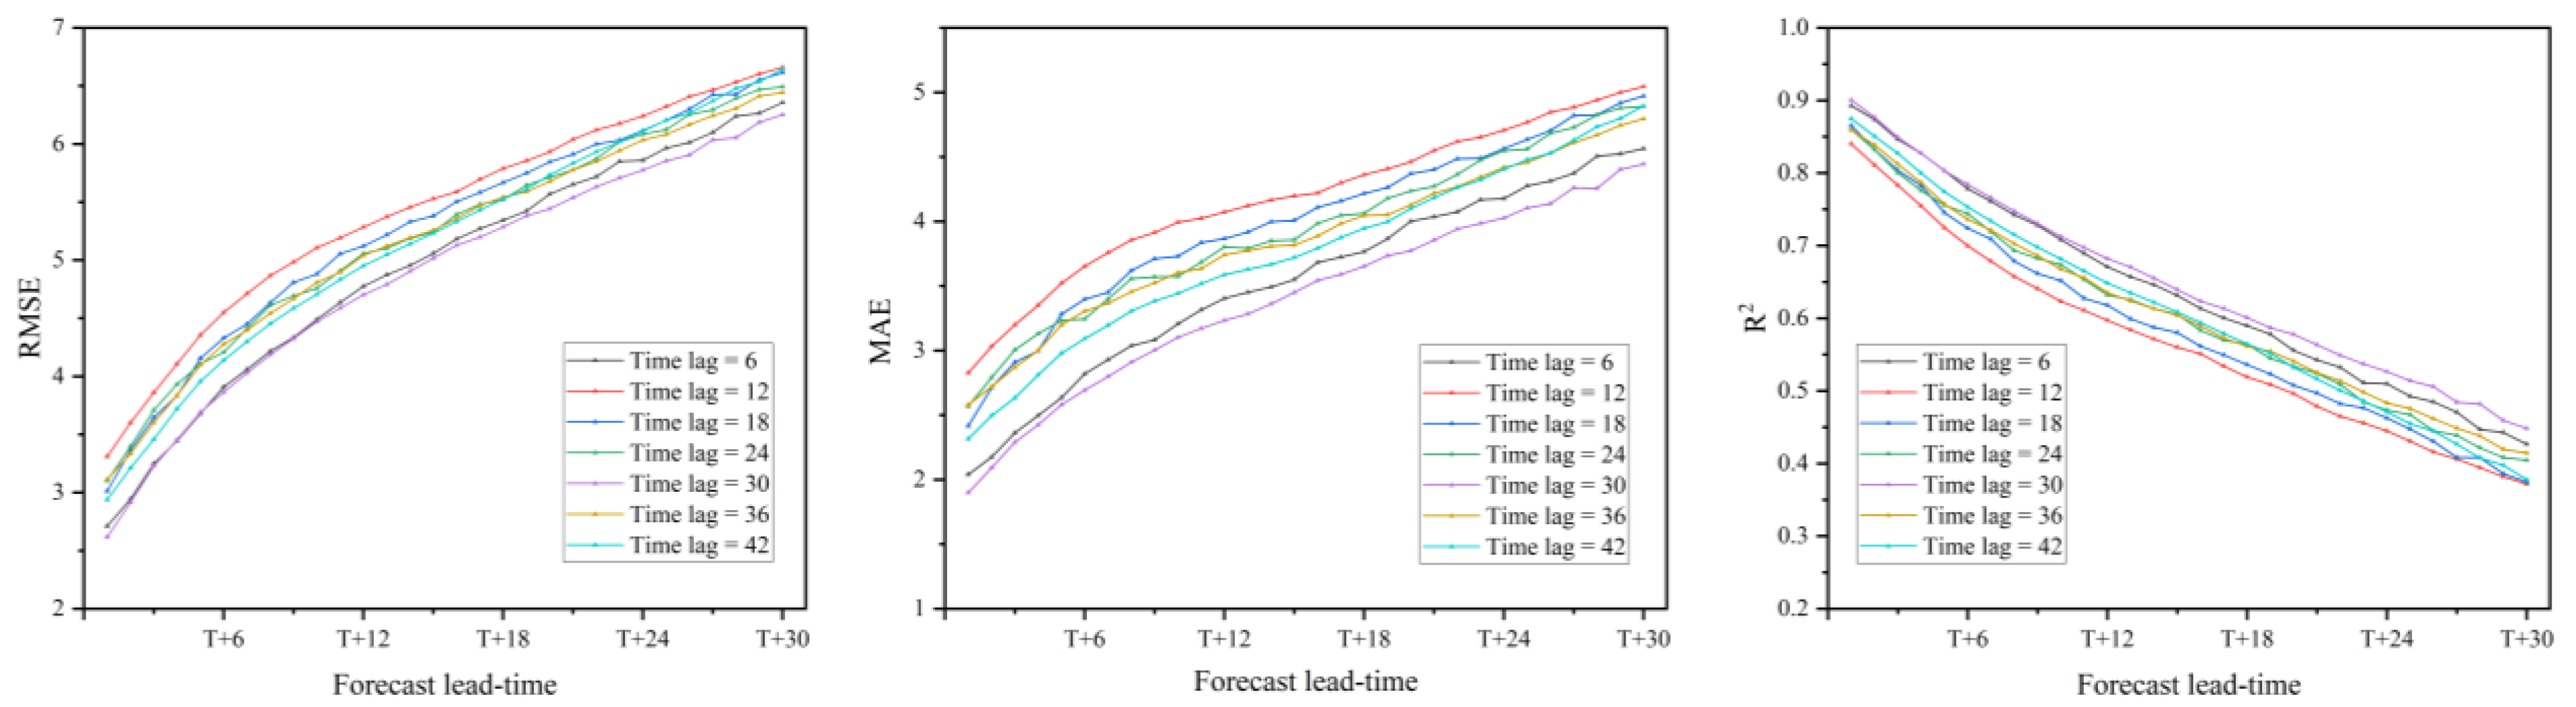
3.4.1. LSTM-Attention Training and Hyperparameter Settings

The original dataset was further reconstructed into a structure suitable for the input and output of LSTM-attention. Specifically, the water quality, environmental factors and anthropogenic variables data were all considered as the multi-source input of LSTM-attention to predict the future water quality. The river quality data for each station included the measured water quality parameters of that station and the WQI values of the upstream station. Precipitation, WT and AQI were employed as environmental distinct predictors to reflect the impact of environmental conditions on river water quality. Compared with other variables representing anthropogenic activities (e.g., water supply and industrial output), electricity consumption was deemed to be more suitable for the predictive model establishment as an anthropogenic predictor variable, owing to its finer temporal granularity. Furthermore, it is necessary to ensure that the input data have the same scale prior to the model establishment, so the daily electricity consumption was converted into data every 4 h. Since the electricity consumption was not evenly distributed throughout the day, it was calculated every four hours by referring to the distribution coefficient determined by the “power load curve of China’s provincial power grid” [50]. The dataset was divided into two parts; the first 70% (August 2018 ~ December 2020) was the training set, and the last 30% (January 2021~December 2021) was the verification set, which were used to fit and evaluate the model, respectively.
After determining the best input variables, optimum hyperparameters for the predictive model were assessed by trial and error. The predictive model contained two layers of LSTM with 128 neurons in each layer. The attention mechanism layer followed LSTM layer and the output layer was a fully connected layer in which the number of neurons was determined by the forecast lead-time (Figure 6). The dropout was also added between layers to solve the problem of overfitting. More information about hyperparameter settings is shown in Table S2.

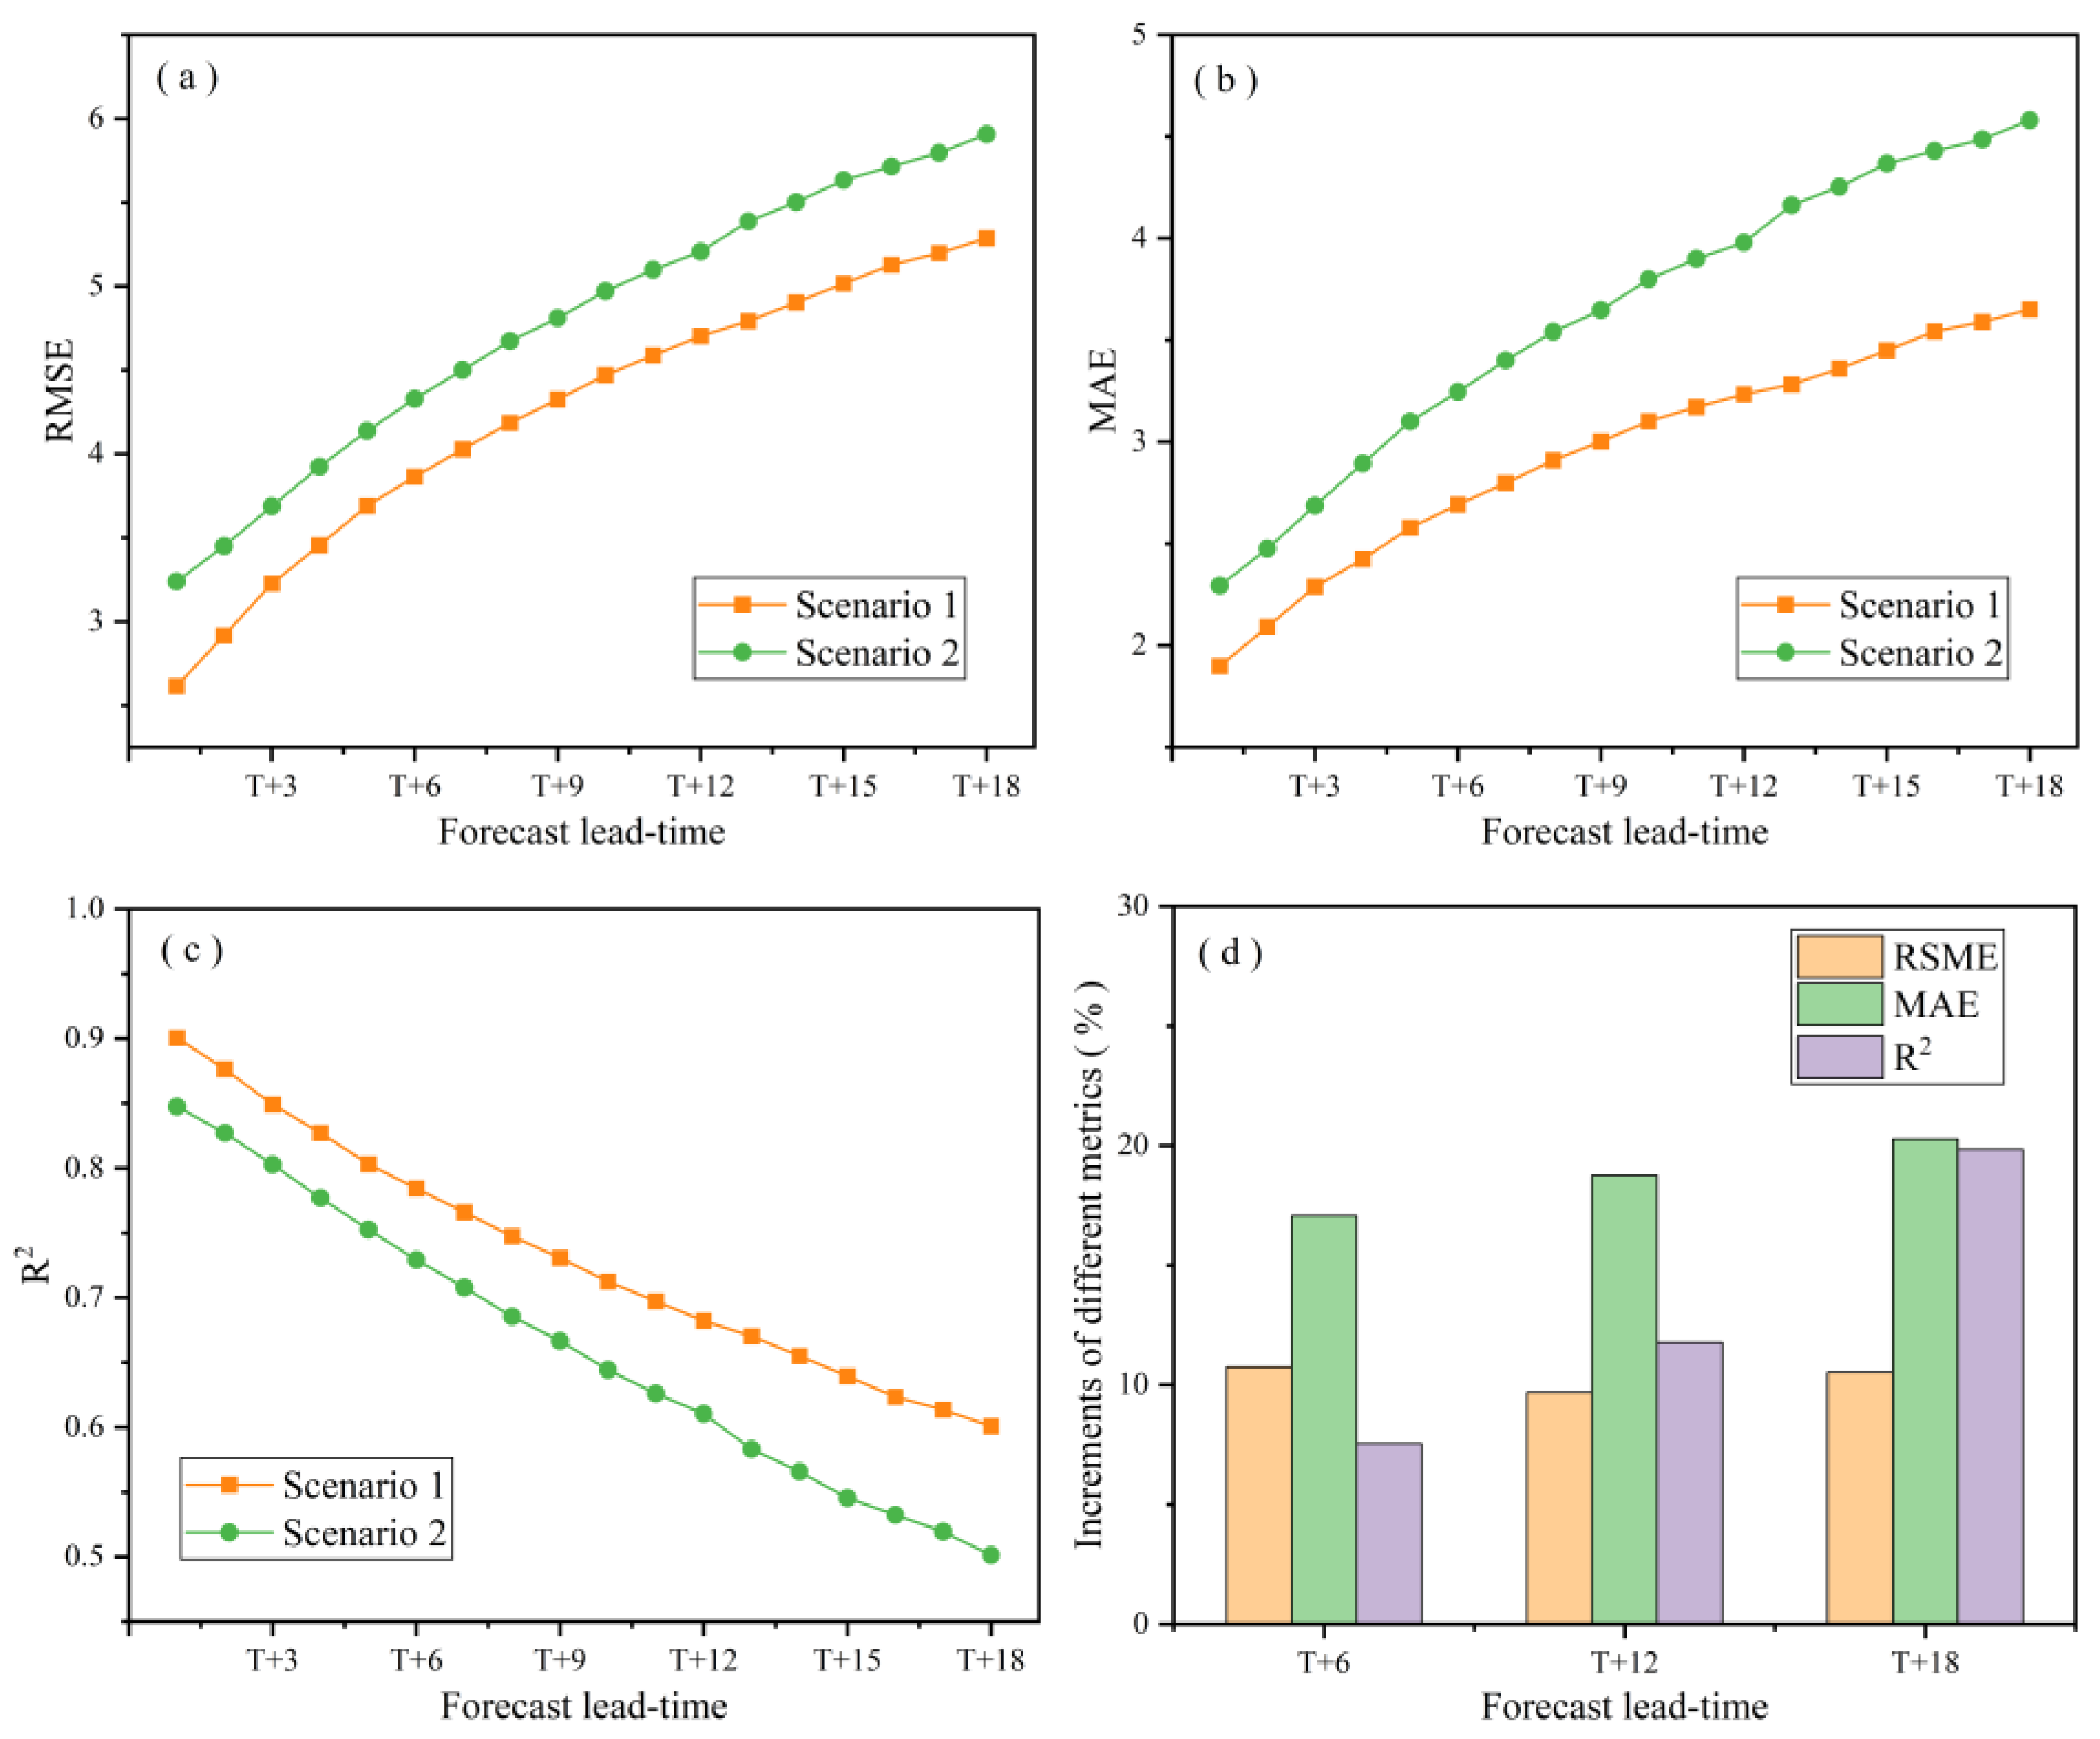
3.4.2. LSTM-Attention Performance Evaluation

In order to avoid redundancy, water quality prediction at DD station was further explored for LSTM-attention evaluation. In particular, the influence of time lag on the model performance was analyzed for ensuring the prediction accuracy. Several time lag parameters (i.e., 6, 12, 18, 24, 30, 36, 42), ranging from 1 day to 7 days, were set up in the LSTM-attention model to predict the water quality from 4 h to 5 days in the future (i.e., forecast lead-time from T + 1 to T + 30, where T denoted the current moment). This finding indicated that the optimal time lag was determined to be 30, at which the model achieved the best prediction performance with the lowest values for RMSE and MAE as well as the highest R2 values (Figure 7). It is worth noting that under this optimal parameter setting, the prediction accuracy gradually decreased as the forecast lead-time increased. For instance, when the forecast lead-time increased from T + 1 to T + 30, the R2 value was reduced from 0.90 to 0.45. When the forecast lead-time was increased, the imperfect descriptions of input features and the internal uncertainty in LSTM-attention exerted influence on model training, resulting in a decrease in the prediction accuracy [51]. Alexander et al. [52] investigated the suitable values of R2 as model fitting statistics and indicated that high R2 values over 0.6 could ensure the model fitting the data well, demonstrating the robustness of our LSTM-attention model for water quality prediction with lead-time up to T + 18 (R2 = 0.6) (Figure 7). Additionally, it was noted that the data collection frequency of this study was a 4 h interval. In practical engineering application, the water quality data can be extrapolated at daily or longer intervals to accomplish short-term pollution warnings or long-term trend prediction of water quality.
LSTM-attention models were further explored at a time lag of 30 in order to assess the influence of environmental conditions and anthropogenic activities on the predictive accuracy of the model in different forecast lead-times. During these processes, two scenarios were introduced: Scenario 1 constructed a prediction model with water quality, environmental factors and human variable data as multi-source inputs for WQI prediction, while Scenario 2 developed a prediction model that only used water quality data as the input for WQI prediction. It was evidenced that taking environmental conditions and anthropogenic activity into account, Scenario 1 yielded a comparatively better performance for water quality prediction, with a higher R2 value as well as lower RMSE and MAE values (Figure 8a–c). To present the comparison results more straightforwardly, the increments of the RMSE, MAE and R2 were calculated (Figure 8d). It was found that the R2 increased by 7.55%, 11.76% and 19.83% for T + 6, T + 12 and T + 18 cases, respectively, with RMSE values of 10.74%, 9.68% and 10.52%, as well as MAE values of 17.06%, 18.76% and 20.27%, respectively. Therefore, it can be concluded that it would be of great significance to incorporate environmental conditions and human activity covariates into the prediction model for accurate prediction of water quality.
It can be seen from the above analysis that the proposed model prediction framework was appropriate for the DD water quality monitoring station. As such, the extension of the model application to the overall investigated stations was further explored (Table 2). The subtle discrepancies in the prediction performance of the LSTM-attention model were observed among different monitoring stations. This finding indicated that the influence of specific factors on water quality prediction among different monitoring stations may not be consistent, which was caused by the spatial complexity of the catchment process and the variety of point and non-point sources of pollution [53]. For YG, DTJ, DLC and JM monitoring stations, the accuracy of the prediction results was inferior to those of the other stations, especially when the forecast lead-time was T + 18 (R2 < 0.6). The reason behind this phenomenon was that these stations were greatly influenced by anthropogenic activities, and electricity consumption alone was not enough to reflect the influence of anthropogenic activities on surface water quality. More data mining that can reflect the intensity of anthropogenic activities, such as population migration and density, and framework construction based on refined feature extraction, would be conducive to further enhancing the model’s performance. In addition, the model structure is also a crucial factor affecting the prediction performance, and the optimal model structure may differ for each monitoring site. Since the primary objective of this study was to preliminarily explore the capability of LSTM-attention model, the in-depth optimization of the model structure was not further carried out at different monitoring stations. However, in practical engineering application, the optimal model structure and hyperparameter should be considered with the specific historical data of the stations.

4. Conclusions

In this study, a data-driven framework was established for the assessment and prediction of water quality in the Guangzhou reach of the Pearl River, China. Statistical methods such as STL, MK, ANOVA, grey correlation analysis and the LSTM-attention model were employed. The WQI value and MK results indicated that during the period of 2018 to 2021, the river water quality in Guangzhou improved over time. A discrepancy in the water quality at different stations was observed, and the water quality of the central basin (with an average WQI value of 60.03) was inferior to that of the northern and southern basins (with average WQI values of 79.60 and 76.28, respectively). The enormous differences in anthropogenic activity intensity and natural environmental conditions were the primary reasons for regional variations in water quality. With respect to water quality prediction, the proposed LSTM-attention model exhibited a superior performance with the RMSE, MAE and R2 values of 5.29, 3.65, and 0.60, respectively, at the forecast lead-time of T + 18. The findings of this study indicated that the water quality analysis and prediction framework can be used for river health assessment and early pollution warning, as well as effective evaluation of water remediation strategy. In future works, this framework could be continually expanded and applied to other rivers with different geologies, ecosystems, weather patterns and sources of pollution by constantly mining more factors affecting water quality—such as land use, water resource utilization and pollution source emissions—and constructing more refined feature extraction frameworks.

Supplementary Materials

The following supporting information can be downloaded at: https://www.mdpi.com/article/10.3390/w15020257/s1, Text S1: The structure of the Long Short-Term Memory network (LSTM) [54,55]; Figure S1. Structure of the LSTM module. Adapted from; Table S1. The normalization values and weights of water quality parameters used in the WQI calculation based on the Environmental Quality Standards for Surface Water of China (GB 3838-2002) in this study [28,29,56]; Table S2. Hyperparameters of LSTM-Attention model; Figure S2. Prediction of the LSTM-Attention model at the forecast lead-time of T+1, T+6, T+12, T+18 (Scenario 1).

Author Contributions

Conceptualization, Investigation, Writing—original draft, M.L.; Project administration, Funding acquisition, X.N.; Writing - Review & Editing, D.Z.; Investigation, Data curation, H.D.; Resources, Z.L. amd S.Z.; Writing—review & editing, Funding acquisition, Y.Z. All authors have read and agreed to the published version of the manuscript.

Funding

This work was supported by the National Natural Science Foundation of China (No. 42177369), National Key Research and Development Program of China (No. 2019YFA0210400), and the Science and Technology Planning Project of Maoming, China (No. 2019S002) and the Fundamental Research Funds for the Central Universities, SCUT (No. 2020ZYGXZR105)..

Data Availability Statement

Not applicable.

Conflicts of Interest

The authors declare no conflict of interest.

References

  1. Huang, J.; Zhang, Y.; Bing, H.; Peng, J.; Dong, F.; Gao, J.; Arhonditsis, G.B. Characterizing the river water quality in China: Recent progress and on-going challenges. Water Res. 2021, 201, 117309. [Google Scholar] [CrossRef] [PubMed]
  2. Chen, X.; Strokal, M.; Van Vliet, M.T.; Stuiver, J.; Wang, M.; Bai, Z.; Ma, L.; Kroeze, C. Multi-scale Modeling of Nutrient Pollution in the Rivers of China. Environ. Sci. Technol. 2019, 53, 9614–9625. [Google Scholar] [CrossRef] [PubMed] [Green Version]
  3. Deng, T.; Chau, K.-W.; Duan, H.-F. Machine learning based marine water quality prediction for coastal hydro-environment management. J. Environ. Manag. 2021, 284, 112051. [Google Scholar] [CrossRef] [PubMed]
  4. Abdalrahman, G.; Lai, S.H.; Kumar, P.; Ahmed, A.N.; Sherif, M.; Sefelnasr, A.; Chau, K.W.; Elshafie, A. Modeling the infiltration rate of wastewater infiltration basins considering water quality parameters using different artificial neural network techniques. Eng. Appl. Comput. Fluid Mech. 2022, 16, 397–421. [Google Scholar] [CrossRef]
  5. The Ministry of Ecology and Environment, PRC. Report on The State of The Ecology and Environment in China. 2020. Available online: http://english.mee.gov.cn/Resources/Reports/ (accessed on 16 November 2022).
  6. Hasan, M.K.; Shahriar, A.; Jim, K.U. Water pollution in Bangladesh and its impact on public health. Heliyon 2019, 5, e02145. [Google Scholar] [CrossRef] [Green Version]
  7. Xu, H.; Gao, Q.; Yuan, B. Analysis and identification of pollution sources of comprehensive river water quality: Evidence from two river basins in China. Ecol. Indic. 2022, 135, 108561. [Google Scholar] [CrossRef]
  8. Deng, C.; Liu, L.; Li, H.; Peng, D.; Wu, Y.; Xia, H.; Zhang, Z.; Zhu, Q. A data-driven framework for spatiotemporal characteristics, complexity dynamics, and environmental risk evaluation of river water quality. Sci. Total. Environ. 2021, 785, 147134. [Google Scholar] [CrossRef]
  9. Liu, J.; Wang, P.; Jiang, D.; Nan, J.; Zhu, W. An integrated data-driven framework for surface water quality anomaly detection and early warning. J. Clean. Prod. 2020, 251, 119145. [Google Scholar] [CrossRef]
  10. Wang, B.; Wang, Y.; Wang, S. Improved water pollution index for determining spatiotemporal water quality dynamics: Case study in the Erdao Songhua River Basin, China. Ecol. Indic. 2021, 129, 107931. [Google Scholar] [CrossRef]
  11. Stets, E.G.; Sprague, L.A.; Oelsner, G.P.; Johnson, H.M.; Murphy, J.C.; Ryberg, K.; Vecchia, A.V.; Zuellig, R.E.; Falcone, J.A.; Riskin, M.L. Landscape Drivers of Dynamic Change in Water Quality of U.S. Rivers. Environ. Sci. Technol. 2020, 54, 4336–4343. [Google Scholar] [CrossRef]
  12. Piniewski, M.; Marcinkowski, P.; Koskiaho, J.; Tattari, S. The effect of sampling frequency and strategy on water quality modelling driven by high-frequency monitoring data in a boreal catchment. J. Hydrol. 2019, 579, 124186. [Google Scholar] [CrossRef]
  13. Tian, Y.; Jiang, Y.; Liu, Q.; Dong, M.; Xu, D.; Liu, Y.; Xu, X. Using a water quality index to assess the water quality of the upper and middle streams of the Luanhe River, northern China. Sci. Total. Environ. 2019, 667, 142–151. [Google Scholar] [CrossRef] [PubMed]
  14. Uddin, M.G.; Nash, S.; Olbert, A.I. A review of water quality index models and their use for assessing surface water quality. Ecol. Indic. 2020, 122, 107218. [Google Scholar] [CrossRef]
  15. Noori, R.; Berndtsson, R.; Hosseinzadeh, M.; Adamowski, J.F.; Abyaneh, M.R. A critical review on the application of the National Sanitation Foundation Water Quality Index. Environ. Pollut. 2019, 244, 575–587. [Google Scholar] [CrossRef] [PubMed]
  16. Qu, X.; Chen, Y.; Liu, H.; Xia, W.; Lu, Y.; Gang, D.-D.; Lin, L.-S. A holistic assessment of water quality condition and spatiotemporal patterns in impounded lakes along the eastern route of China’s South-to-North water diversion project. Water Res. 2020, 185, 116275. [Google Scholar] [CrossRef]
  17. Li, M.; Liu, Z.; Zhang, M.; Chen, Y. A workflow for spatio-seasonal hydro-chemical analysis using multivariate statistical techniques. Water Res. 2021, 188, 116550. [Google Scholar] [CrossRef] [PubMed]
  18. Geng, M.; Wang, K.; Yang, N.; Li, F.; Zou, Y.; Chen, X.; Deng, Z.; Xie, Y. Spatiotemporal water quality variations and their relationship with hydrological conditions in Dongting Lake after the operation of the Three Gorges Dam, China. J. Clean. Prod. 2021, 283, 124644. [Google Scholar] [CrossRef]
  19. Visser, H.; Evers, N.; Bontsema, A.; Rost, J.; de Niet, A.; Vethman, P.; Mylius, S.; van der Linden, A.; Roovaart, J.V.D.; van Gaalen, F.; et al. What drives the ecological quality of surface waters? A review of 11 predictive modeling tools. Water Res. 2022, 208, 117851. [Google Scholar] [CrossRef]
  20. Sun, K.; Rajabtabar, M.; Samadi, S.; Rezaie-Balf, M.; Ghaemi, A.; Band, S.S.; Mosavi, A. An integrated machine learning, noise suppression, and population-based algorithm to improve total dissolved solids prediction. Eng. Appl. Comput. Fluid Mech. 2021, 15, 251–271. [Google Scholar] [CrossRef]
  21. Deng, T.; Duan, H.-F.; Keramat, A. Spatiotemporal characterization and forecasting of coastal water quality in the semi-enclosed Tolo Harbour based on machine learning and EKC analysis. Eng. Appl. Comput. Fluid Mech. 2022, 16, 694–712. [Google Scholar] [CrossRef]
  22. Shen, C.; Laloy, E.; Elshorbagy, A.; Albert, A.; Bales, J.; Chang, F.-J.; Ganguly, S.; Hsu, K.-L.; Kifer, D.; Fang, Z.; et al. HESS Opinions: Incubating deep-learning-powered hydrologic science advances as a community. Hydrol. Earth Syst. Sci. 2018, 22, 5639–5656. [Google Scholar] [CrossRef] [Green Version]
  23. Liu, X.; Lu, D.; Zhang, A.; Liu, Q.; Jiang, G. Data-Driven Machine Learning in Environmental Pollution: Gains and Problems. Environ. Sci. Technol. 2022, 56, 2124–2133. [Google Scholar] [CrossRef] [PubMed]
  24. Jang, J.; Abbas, A.; Kim, M.; Shin, J.; Kim, Y.M.; Cho, K.H. Prediction of antibiotic-resistance genes occurrence at a recreational beach with deep learning models. Water Res. 2021, 196, 117001. [Google Scholar] [CrossRef] [PubMed]
  25. Liang, Z.; Zou, R.; Chen, X.; Ren, T.; Su, H.; Liu, Y. Simulate the forecast capacity of a complicated water quality model using the long short-term memory approach. J. Hydrol. 2020, 581, 124432. [Google Scholar] [CrossRef]
  26. Fourteenth Five-Year Plan for National Surface Water Monitoring and Evaluation; China Environmental Science Press: Beijing, China, 2020.
  27. de Lange, W.; Wise, R.; Forsyth, G.; Nahman, A. Integrating socio-economic and biophysical data to support water allocations within river basins: An example from the Inkomati Water Management Area in South Africa. Environ. Model. Softw. 2010, 25, 43–50. [Google Scholar] [CrossRef]
  28. Ministry of Ecology and Environment, PRC. Environmental Quality Standards for Surface Water. 2002. Available online: https://english.mee.gov.cn/Resources/standards/water_environment/quality_standard/200710/t20071024_111792.shtml (accessed on 16 November 2022).
  29. Nong, X.; Shao, D.; Zhong, H.; Liang, J. Evaluation of water quality in the South-to-North Water Diversion Project of China using the water quality index (WQI) method. Water Res. 2020, 178, 115781. [Google Scholar] [CrossRef]
  30. Wan, Y.; Wan, L.; Li, Y.; Doering, P. Decadal and seasonal trends of nutrient concentration and export from highly managed coastal catchments. Water Res. 2017, 115, 180–194. [Google Scholar] [CrossRef]
  31. Güçlü, Y.S. Multiple Şen-innovative trend analyses and partial Mann-Kendall test. J. Hydrol. 2018, 566, 685–704. [Google Scholar] [CrossRef]
  32. Heidari, A.; Khovalyg, D. Short-term energy use prediction of solar-assisted water heating system: Application case of combined attention-based LSTM and time-series decomposition. Sol. Energy 2020, 207, 626–639. [Google Scholar] [CrossRef]
  33. Gao, Q.; Li, Y.; Cheng, Q.; Yu, M.; Hu, B.; Wang, Z.; Yu, Z. Analysis and assessment of the nutrients, biochemical indexes and heavy metals in the Three Gorges Reservoir, China, from 2008 to 2013. Water Res. 2016, 92, 262–274. [Google Scholar] [CrossRef]
  34. Muduli, P.R.; Kumar, A.; Kanuri, V.V.; Mishra, D.R.; Acharya, P.; Saha, R.; Biswas, M.K.; Vidyarthi, A.K.; Sudhakar, A. Water quality assessment of the Ganges River during COVID-19 lockdown. Int. J. Environ. Sci. Technol. 2021, 18, 1645–1652. [Google Scholar] [CrossRef] [PubMed]
  35. Viswanathan, V.C.; Molson, J.; Schirmer, M. Does river restoration affect diurnal and seasonal changes to surface water quality? A study along the Thur River, Switzerland. Sci. Total. Environ. 2015, 532, 91–102. [Google Scholar] [CrossRef] [PubMed]
  36. Ryberg, K.R.; Chanat, J.G. Climate extremes as drivers of surface-water-quality trends in the United States. Sci. Total. Environ. 2022, 809, 152165. [Google Scholar] [CrossRef]
  37. Bu, H.; Meng, W.; Zhang, Y. Spatial and seasonal characteristics of river water chemistry in the Taizi River in Northeast China. Environ. Monit. Assess. 2014, 186, 3619–3632. [Google Scholar] [CrossRef]
  38. Chang, W.K.; Ryu, J.; Yi, Y.; Lee, W.-C.; Lee, C.-W.; Kang, D.; Lee, C.-H.; Hong, S.; Nam, J.; Khim, J.S. Improved water quality in response to pollution control measures at Masan Bay, Korea. Mar. Pollut. Bull. 2012, 64, 427–435. [Google Scholar] [CrossRef] [PubMed]
  39. Yang, J.; Wang, F.; Lv, J.; Liu, Q.; Nan, F.; Xie, S.; Feng, J. Responses of freshwater algal cell density to hydrochemical variables in an urban aquatic ecosystem, northern China. Environ. Monit. Assess. 2018, 191, 29. [Google Scholar] [CrossRef]
  40. Xu, X.; Wu, F.; Zhang, L.; Gao, X. Assessing the Effect of the Chinese River Chief Policy for Water Pollution Control under Uncertainty—Using Chaohu Lake as a Case. Int. J. Environ. Res. Public Health 2020, 17, 3103. [Google Scholar] [CrossRef] [PubMed]
  41. Wang, L.; Yu, L.; Xiong, Y.; Li, Z.; Geng, J. Study on the governance of black-odor water in Chinese cities. J. Clean. Prod. 2021, 308, 127290. [Google Scholar] [CrossRef]
  42. Xiang, R.; Wang, L.; Li, H.; Tian, Z.; Zheng, B. Water quality variation in tributaries of the Three Gorges Reservoir from 2000 to 2015. Water Res. 2021, 195, 116993. [Google Scholar] [CrossRef]
  43. Li, W.; Li, H.; Zhang, D.; Tong, Y.; Li, F.; Cheng, F.; Huang, Z.; You, J. Legacy and Emerging Per- and Polyfluoroalkyl Substances Behave Distinctly in Spatial Distribution and Multimedia Partitioning: A Case Study in the Pearl River, China. Environ. Sci. Technol. 2022, 56, 3492–3502. [Google Scholar] [CrossRef]
  44. Akshitha, V.; Balakrishna, K.; Udayashankar, H.N. Assessment of hydrogeochemical characteristics and saltwater intrusion in selected coastal aquifers of southwestern India. Mar. Pollut. Bull. 2021, 173, 112989. [Google Scholar] [CrossRef] [PubMed]
  45. Zhang, Y.; Rashid, A.; Guo, S.; Jing, Y.; Zeng, Q.; Li, Y.; Adyari, B.; Yang, J.; Tang, L.; Yu, C.-P.; et al. Spatial autocorrelation and temporal variation of contaminants of emerging concern in a typical urbanizing river. Water Res. 2022, 212, 118120. [Google Scholar] [CrossRef] [PubMed]
  46. Chang, H. Spatial analysis of water quality trends in the Han River basin, South Korea. Water Res. 2008, 42, 3285–3304. [Google Scholar] [CrossRef] [PubMed]
  47. Ahmed, A.N.; Othman, F.B.; Afan, H.A.; Ibrahim, R.K.; Fai, C.M.; Hossain, S.; Ehteram, M.; Elshafie, A. Machine learning methods for better water quality prediction. J. Hydrol. 2019, 578, 124084. [Google Scholar] [CrossRef]
  48. Wetherbee, G.; Wieczorek, M.; Robertson, D.; Saad, D.; Novick, J.; Mast, M.A. Estimating urban air pollution contribution to South Platte River nitrogen loads with National Atmospheric Deposition Program data and SPARROW model. J. Environ. Manag. 2022, 301, 113861. [Google Scholar] [CrossRef]
  49. Yindong, T.; Xiwen, X.; Miao, Q.; Jingjing, S.; Yiyan, Z.; Wei, Z.; Mengzhu, W.; Xuejun, W.; Yang, Z. Lake warming intensifies the seasonal pattern of internal nutrient cycling in the eutrophic lake and potential impacts on algal blooms. Water Res. 2021, 188, 116570. [Google Scholar] [CrossRef]
  50. National Development and Reform Commission, PRC. Power Load Curve of China’s Provincial Power Grid. 2020. Available online: https://en.ndrc.gov.cn/ (accessed on 16 November 2022).
  51. Pyo, J.; Park, L.J.; Pachepsky, Y.; Baek, S.-S.; Kim, K.; Cho, K.H. Using convolutional neural network for predicting cyanobacteria concentrations in river water. Water Res. 2020, 186, 116349. [Google Scholar] [CrossRef]
  52. Alexander, D.L.J.; Tropsha, A.; Winkler, D.A. Beware of R2: Simple, Unambiguous Assessment of the Prediction Accuracy of QSAR and QSPR Models. J. Chem. Inf. Model. 2015, 55, 1316–1322. [Google Scholar] [CrossRef] [Green Version]
  53. Bui, D.T.; Khosravi, K.; Tiefenbacher, J.; Nguyen, H.; Kazakis, N. Improving prediction of water quality indices using novel hybrid machine-learning algorithms. Sci. Total. Environ. 2020, 721, 137612. [Google Scholar] [CrossRef]
  54. Zhang, K.; Thé, J.; Xie, G.; Yu, H. Air quality using spatial-temporal deep neural networks: A case study of Huaihai Economic Zone. J. Clean. Prod. 2020, 277, 123231. [Google Scholar] [CrossRef]
  55. Wu, C.; Zhang, X.; Wang, W.; Lu, C.; Zhang, Y.; Qin, W.; Tick, G.R.; Liu, B.; Shu, L. Groundwater level modeling framework by combining the wavelet transform with a long short-term memory data-driven model. Sci. Total Environ. 2021, 783, 146948. [Google Scholar] [CrossRef] [PubMed]
  56. Koçer, M.A.T.; Sevgili, H. Parameters selection for water quality index in the assessment of the environmental impacts of land-based trout farms. Ecol. Indic. 2014, 36, 672–681. [Google Scholar] [CrossRef]
Figure 1. Distribution of river basins and monitoring stations in the Guangzhou reach of the Pearl River.
Water 15 00257 g001
Figure 2. River water quality analysis and prediction framework.
Water 15 00257 g002
Figure 3. (a): Long-term trend for river water quality in Guangzhou reach of the Pearl River from 2018 to 2021; (b): Mann–Kendall test results for water quality parameters at each sampling site.
Water 15 00257 g003
Figure 4. Spatial patterns of WQI and water quality parameters at different stations for monitoring water quality in the Guangzhou reach of the Pearl River from 2018 to 2021. Note: bars with different lowercase letters indicate statistically significant differences among stations (significance level = 0.05).
Water 15 00257 g004
Figure 5. Pearson’s correlation coefficient of WQI among the monitoring stations.
Water 15 00257 g005
Figure 6. WQI prediction modeling methodology structure.
Water 15 00257 g006
Figure 7. Effect of time lag for different forecast lead-times.
Water 15 00257 g007
Figure 8. (ac) Comparison of the results of Scenario 1 and Scenario 2 based on different metrics. (d) Increment of different metrics for Scenario 1 relative to Scenario 2. Scenario 1: with consideration of environmental and anthropogenic factors; Scenario 2: without consideration of environmental and anthropogenic factors.
Water 15 00257 g008
Table 1. Grey correlation between WQI and selected environmental or anthropogenic activity factors in Guangzhou reach of the Pearl River.
Northern BasinCentral BasinSouthern Basin
Environmental factors
Precipitation0.67300.64730.7078
WT0.72000.78380.7456
AQI0.77170.79030.7600
Anthropogenic activities factors
Electricity consumption0.65400.72920.7087
Water supply0.71480.74000.7512
Industrial output0.72850.73850.7167
Table 2. Prediction performance of LSTM-attention model at each monitoring station.
Forecast Lead-TimeMetricNorthern BasinCentral BasinSouthern Basin
LXHJLTZJKDDYGDTJLHSDLCGTHQLJM
T + 1RMSE2.872.281.742.611.891.161.631.681.550.991.09
MAE2.151.841.441.901.511.151.261.341.180.970.83
R20.860.860.940.900.930.900.880.880.920.890.92
T + 6RMSE3.152.982.683.863.211.601.692.361.911.391.81
MAE2.952.292.102.692.381.511.581.811.771.281.29
R20.760.770.860.780.820.810.790.770.820.810.79
T + 12RMSE3.663.603.554.704.082.042.002.782.411.862.28
MAE3.362.732.703.232.951.861.832.162.161.641.64
R20.670.660.750.680.710.690.700.680.730.690.67
T + 18RMSE4.013.964.155.294.942.412.283.192.781.902.58
MAE3.623.023.073.653.572.182.062.482.461.771.88
R20.600.600.660.600.580.570.630.580.660.610.58
Disclaimer/Publisher’s Note: The statements, opinions and data contained in all publications are solely those of the individual author(s) and contributor(s) and not of MDPI and/or the editor(s). MDPI and/or the editor(s) disclaim responsibility for any injury to people or property resulting from any ideas, methods, instructions or products referred to in the content.

