
Pollution Characteristics and Risk Assessment of Typical Antibiotics and Persistent Organic Pollutants in Reservoir Water Sources

1
Powerchina Eco-Environmental Group Co., Ltd., Shenzhen 518101, China
2
National Engineering Research Center of Water Resources Efficient Utilization and Engineering Safety, Hohai University, Nanjing 210098, China
3
Institute of Water Science and Technology, Hohai University, Nanjing 210098, China
*
Author to whom correspondence should be addressed.
Water 2023, 15(2), 259; https://doi.org/10.3390/w15020259
Submission received: 9 December 2022
/
Revised: 1 January 2023
/
Accepted: 4 January 2023
/
Published: 8 January 2023
(This article belongs to the Special Issue Antibiotics and Antibiotic Resistant Genes in Aquatic Environments: Occurrence, Toxicity, and Fate)
Abstract
:The major task of Chinese water governance has gradually shifted away from water environment protection to water ecology remediation, and the governance of trace organic pollutants, including persistent organic pollutants and antibiotics, has attracted growing concern. The present study examined the seasonal distribution and sources of typical persistent organic pollutants and antibiotics in six representative water sources in the lower reaches of the Yangtze River, as well as their ecological risk to the environment. Six representative surface water and surface sediment samples were collected at different time intervals, i.e., December 2018, March 2019, and June 2019, and the concentrations of nineteen organochlorine pesticides (OCPs), seventeen polychlorinated biphenyls (PCBs), and eight polybrominated diphenyl ethers (PBDEs) were analyzed by GC-MS. The major findings are listed below: ① Endosulfan sulfate, Beta-endosulfan, and methoxychlor were the major persistent organic pollutants (POPs) detected in the sediments from Gaoyou Lake, Gonghu Lake, and Gehu Lake, with concentrations ranging from 9.0 to 10.6 ng/g. ② The target antibiotics in water sources were at relatively low levels. Occurrences of sulfonamide antibiotics in water and surface sediments were NF~37.4 ng·L−1 and NF~47.3 ng·g−1. Concentrations of quinolone antibiotics in the two media were NF~5.3 ng·L−1, 0.4~32.5 ng·g−1. ③ The combined toxicity of antibiotics (risk quotient, RQ) in Lake Gehu was 0.18, which was at a moderate risk level. There was no obvious ecological risk in most water sources affected by POPs. However, there were certain ecological risks in the water sources of Gaoyou Lake, Gonghu Lake, and Sanjiangying, induced by OCPs and PCBs. This study provides a scientific basis for the treatment of antibiotics and organic pollutants in reservoir water sources.
1. Introduction
Since the discovery of penicillin by British scientist Alexander Fleming in 1929, the production of antibiotics has been rapidly implemented in human medicine, livestock, and aquaculture for a long time, with an ever-increasing annual usage [1]. In 2013, the consumption of antibiotics in China reached 160,000 tons, accounting for about half of the world’s total consumption [2]. Only 15% of antibiotics used for medical treatment and breeding can be absorbed and utilized by the body, and the remaining drugs are excreted in the form of original drugs or metabolites and transported to the natural environment [3,4]. The water environment is an important source of and sink for antibiotics [5]. More than 160 pharmaceutical and personal care products (PPCPs) have been detected in environmental media, such as rivers, seawater, groundwater, and sewage treatment plant sludge [6]. Antibiotic residues exert environmental pressure on the background microbial community, leading to the enforcement of drug resistances [7]. Some antibiotics have strong adsorption properties on sediments, resulting in their high accumulation in sediments [8]. Low concentrations of antibiotics in the environment can act as a signaling molecule to regulate the selective adaptation of microbial communities to antibiotics, and accelerate the generation of drug-resistant bacteria [9]. Due to high transmissibility and environmental persistence, the ecological health risks caused by the residue and spread of antibiotics in the environment have attracted widespread attention [10].
Ensuring the quality of drinking water is the focus of water ecological civilization [11,12]. Researches on the occurrences of antibiotics in drinking water sources have increased. Voigt et al. detected residual clarithromycin, sulfamethoxazole, and trimethoprim in German drinking water reservoirs, with concentrations up to 0.60, 0.40, and 0.39 μg·L−1 [13]. Based on a systematic review of more than 600 documents from 1999 to 2021, Li established a global dataset containing more than 90,000 records, covering 169 antibiotics and their metabolites in surface water and sediments in 76 countries [14]. Rivers with high concentrations of antibiotics are mainly located in less developed countries, or countries with emerging economies, such as Africa, South America, and Asia. Antibiotics have been detected in important river basins in China, such as the Yangtze River, Pearl River, Haihe River, and Huangpu River, etc. [15,16,17,18]. Nineteen common antibiotics were detected in the water and sediment of the Yangtze Estuary, with the highest content reaching several hundred nanograms per liter [19]. Sulfonamides were detected in a water source in the lower reaches of the Yangtze River, with a concentration of up to 238.5 ng·L−1 [20]. Concentrations of fluoroquinolones and sulfonamide antibiotics in the Pearl River Basin ranged from 0.7 to 127 ng·L−1 [21]. In the surface water and sediments of the Haihe River Basin, sulfonamide antibiotics dominated, with a detection rate of 76–100%, and a detection concentration range of 24–385 ng·g−1 [22]. Liu measured antibiotics such as ofloxacin, ciprofloxacin, and norfloxacin in the sediments of the Yellow River and Liaohe River, with the highest concentrations of 1290, 652, and 5770 ng·g−1, respectively [23]. Feng detected eight antibiotics of sulfonamides, macrolides, and chloramphenicol in nine centralized drinking water sources in the Three Gorges Reservoir area, with concentrations ranging from 0.4 to 140.0 ng·L−1 [24]. Sulfamethoxazole (SMX) and trimethoprim (TMP) are well known for their high persistence and long history of use. All five continents and four representative countries (China, the United States, Spain, and Brazil) are included in the list of priority control antibiotics.
POPs refer to the synthetic chemicals that persist in the environment, accumulate through the biological food chain, and cause harmful effects on human health. They have long-term persistence, bioaccumulation, semi-volatility, and high toxicity, and have strong carcinogenic, teratogenic, and mutagenic effects [25]. POPs have strong lipophilicity and are easy to accumulate in various organs of organisms. The content of POPs in organisms can be eight to ten million times higher than that in environmental media, causing damage to the central and peripheral nervous systems, and causing diseases such as cancer [26]. In May 2001, the international community signed the “Stockholm Convention”, which strictly prohibits the use of 12 chemical substances, including aldrin, dieldrin, endrin, dichlorodiphenyltrichloroethane (DDT), chlordane, mirex, heptachlor, toxaphen, hexachlorobenzene, polychlorinated biphenyls (PCBs, a total of 209 species), polychlorinated dibenzo-p-dioxins, and polychlorinated dibenzofurans [27].
OCPs, PCBs, and polybrominated diphenyl ethers (PBDEs) are three typical types of POPs [28]. OCPs were widely used in agricultural production activities in the 1960s in China. OCPs can be detected in various scenes and natural media, such as plateaus, polar regions, tropics, deep seas, and snow mountains [29,30,31]. Since the 1980s, hexachlorocyclohexane (HCH) and DDT have been banned, but, due to their long-term residue, they can still be detected in water, soil, air, and other media [32]. PCBs are one of the most carcinogenic substances among detected environmental pollutants [33,34]. China began to produce PBDEs in 1965, among which trichlorobiphenyls and pentachlorinated biphenyls are predominant constituents [35,36]. Studies have found that PBDEs can cause hyperplasia of the thyroid gland, and also have certain carcinogenic properties [37]. The safety of water sources is closely related to human health and subsequent social development [38]. In recent years, researchers have gradually carried out research on the occurrence of POPs in water sources. For example, Yang evaluated the occurrences of POPs in some important water sources in Shanghai and found that around 20 kinds of OCPs and polycyclic aromatic hydrocarbons (PAHs) could be detected in the surface sediments at the Yangtze River Estuary [39]. Chen detected sixteen kinds of OCPs in seven water sources in the Guangdong-Guangxi region of China [40].
The Yangtze River Delta has a well-developed water system, numerous lakes, and abundant water resources, and is also one of the most agriculturally developed areas in China. Pesticides were widely used in the 1960s, and the residual pesticides posed a potential threat to drinking water [41]. At the same time, anthropic activities in the region have led to the increasing utilization of water resources and increasingly serious water pollution. There are still certain safety risks in the water quality of water sources. Micro-pollution of drinking water sources has gradually become a key public health concern [42]. Wang et al. monitored and analyzed PAHs and PCBs in the water sources of the Taihu Lake Basin, and found that there was a variable concentration of PAHs monomers in the water sources [43]. There were significant temporal differences in the concentration of PCBs, and the concentration of pollutants in summer was higher than in spring.
This study aimed at evaluating the potential safety problems caused by representative water-soluble antibiotics and POPs in representative reservoir water sources in the lower reaches of the Yangtze River. The representative pollutants included nineteen OCPs, seventeen PCBs, and eight PBDEs, as well as ten water-soluble antibiotics. On the basis of clarifying the distribution characteristics of POPs and antibiotics within selected water bodies and sediments, traceability analysis and risk assessment of common pollutants in water sources were also carried out. The study is of significance in providing a scientific basis and technical support for the prevention and control of persistent and trace organic pollution and subsequent environmental governance in representative water sources of the Yangtze River Basin.
2. Materials and Methods
2.1. Standard Reagents
Reagents: Standard substances of a series of OPCs, including aldrin, ALPHA-666, BETA-666, lindane (R-666), D-666, cis-A-chlordane, trans-chlordane, 2,2-bis(4-chlorophenyl)-1,1-dichloroethylene, 2,2-bis(p-chlorophenyl)-1,1,1-trichloroethane, dieldrin, ALPHA-endosulfan, BETA-endosulfan, endosulfan sulfate, endrin, heptachlor, methoxychlor, p,p’-DDD, p,p’-DDE, and p,p’-DDD, were purchased (Acstandard Company, USA, catalog number: M-8081-SC). Standard substances of a series of PCBs, including PCB-28, PCB-52, PCB-77, PCB-81, PCB-126, PCB-114, PCB-101, PCB-105, PCB-118, PCB-123, PCB-167, PCB- 138, PCB-157, PCB-156, PCB-169, PCB-180, and PCB-189, were purchased (Acstandard Inc. New Haven, CT, USA, Cat. No.: S-19605-T). Standard substances of a series of PBDEs, including BDE-28, BDE-47, BDE-99, BDE-100, BDE-153, BDE-154, and BDE-183, were purchased (Accustomard Inc. New Haven, CT, USA, Cat. No.: BDE-CM). Methanol, n-hexane, and methylene chloride were all chromatographic grade and purchased from Sinopharm Chemical Reagent Co., Ltd., Shanghai, China. Acetone was of analytical grade and purchased from Sinopharm Chemical Reagent Co., Ltd. Ethyl acetate was chromatographic grade and was purchased from China Jiangsu Qiangsheng Functional Chemicals Co., Ltd. Standard substances (purity higher than 98%) of sulfonamide antibiotics (sulfamethoxazole, sulfamonomethoxin, sulphaquinoxaline, sulfadimethoxine), quinolone antibiotics (norfloxacin, ciprofloxacin, lomefloxacin, enrofloxacin and ofloxacin), as well as trimethoprim, were purchased from Dr. Ehrenstorfer GmbH (Augsburg, Germany).
2.2. Sample Collection
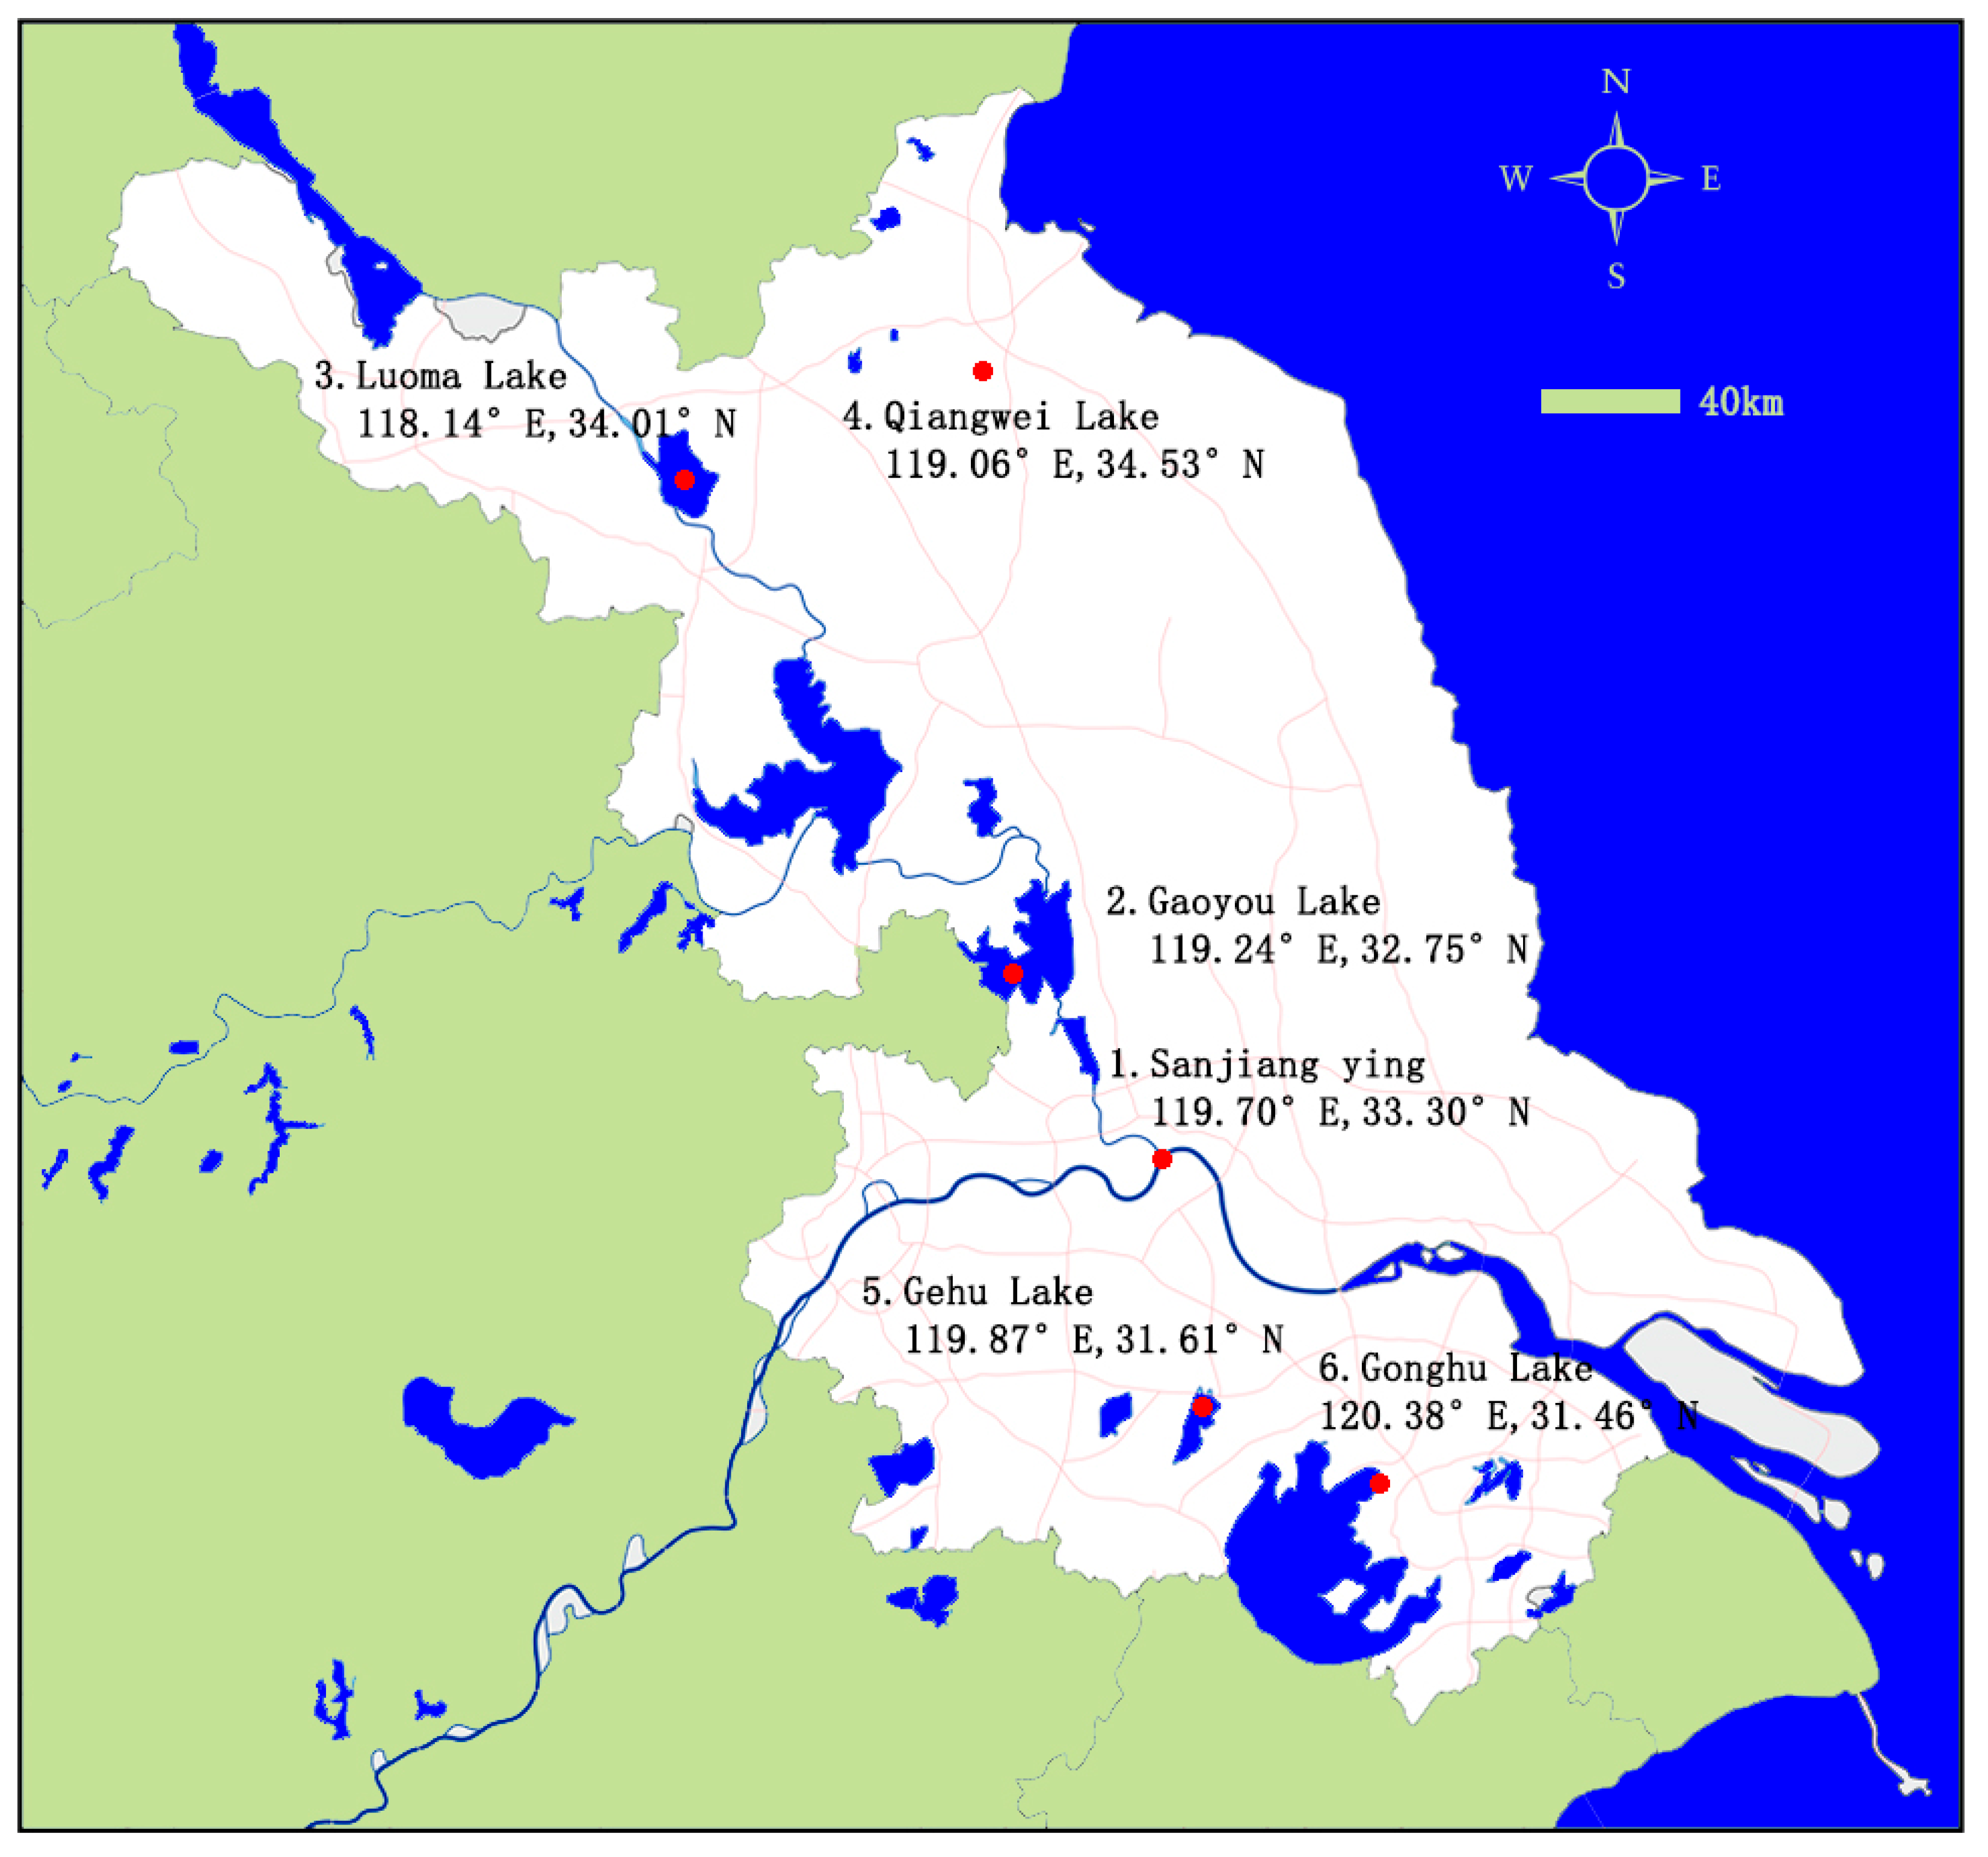
Six representative centralized water sources in the lower reaches of the Yangtze River Basin were selected as research objects (Figure 1), including Qiangwei Lake (34.53° N, 119.06° E), Luoma Lake (34.01° N, 118.14° E), Gaoyou Lake (32.75° N, 119.24° E), Ge Lake (31.61° N, 119.87° E), and Gong Lake (31.46° N, 120.38° E). Sampling was carried out at the water intakes of each centralized water source in December 2018 (winter), March 2019 (spring), and June 2019 (summer). A 5 L water sample was collected at 0.5 m below the water surface with a water collector. The sample was then put into a glass bottle, and sulfuric acid was added to adjust the pH to 2 to inhibit bacterial growth. A grab bucket was used to take about 500 g of surface sediment samples at water source inlets. During the sampling process, the physical and chemical properties of the water samples were detected in situ (water quality analyzer EXO2, Yellow Springs Instruments Inc., Yellow Springs, OH, USA), and the detection parameters included water temperature, pH, dissolved oxygen, conductivity, redox potential, turbidity, chlorophyll, etc. Then, concentrated sulfuric acid was added to adjust the sample pH to below 2. The surface sediments were not completely sealed, and they were frozen at −18 °C after being brought back to the laboratory.
2.3. Pretreatment and Pollutant Detection
2.3.1. Pretreatment and Detection Protocols for Antibiotics
The overlying water sample was filtered through a 0.45 μm glass fiber membrane. An amount of 1000 mL of filtered water was passed through a HLB cartridge (6 mL, 500 mg, Oa-sis HLB, Waters, USA) system at a flow rate of 5 mL/min. The cartridges were preconditioned with 10 mL methanol, followed by 5 mL Milli-Q water and 5 mL formic acid (0.1%) at a flow rate of 3.0 mL/min. For elution, the target antibiotics retained in the cartridges were eluted with 6 mL methanol and 6 mL formic acid (0.1%). The procedure was repeated twice. The final eluates were dried under a gentle stream of nitrogen at 40 °C. Finally, the dried extracts were dissolved again with 1 mL of methanol (containing 0.1% formic acid). The final aliquots were transferred into 2 mL amber vials and stored at 20 °C until LC-MS analysis.
Sediment samples were freeze-dried, ground, and screened through a 100-mesh sieve. An amount of 5.0 g of the sample was added into a 50-mL centrifugal tube by adding 10 mL mixture (PBS buffer/acetonitrile, 50:50, pH = 3). The suspension was shaken in a rotator at a speed of 200 r min−1 for 20 min. Afterwards, the suspension was sonicated for another 10 min and centrifuged for 10 min at 4000 r min−1. The procedure was performed twice and the supernatant was collected. Milli-Q water was added to the supernatant to a volume of 300 mL. Then, the mixture was passed through a series of cartridges including LC-SAX (3 mL, 500 mg, Supelclean LC-SAX, Waters Corporation, Milford, MA, USA) and HLB cartridge (6 mL, 500 mg, Oasis HLB, Waters Corporation, Milford, MA, USA) at a flow rate of 5 mL/min. The elution and concentration process were used following the protocol for extracting antibiotics from overlying water sources.
Antibiotics were identified and quantified using a liquid chromatography-triple quadrupole mass spectrometer (with an electrospray ionization source, Waters Xevo TQ) equipped with a ACQUITY BEH C18 column, (2.1 mm × 100 mm, 1.7 μm, Waters, USA) with a constant flow (0.3 mL min−1). The ion source, ionization mode, and capillary voltage were ESI source, positive ion mode, and 3.0 kV, respectively. The mass spectrometry conditions of the tested antibiotics are shown in Table 1. The analysis used followed the protocols in USEPA to ensure data quality. The relative recoveries for target antibiotics from water sources are 42.2~70.8%, while the recoveries from sediments are 62.5~70.2%.
2.3.2. Pretreatment and Detection Protocols for POPs
An amount of 1.5 L of the overlying water sample was filtered through a 0.45 μm glass fiber membrane for use. Then, 500 mL of filtered water was passed through a C18 solid-phase extraction cartridge (SOPELCLEAN ENVI-18, Supelco Inc., Bellefonte, PA, USA) system at a flow rate of 5 mL/min. Notably, before loading water samples onto the cartridge system, SPE cartridges were preconditioned with 10 mL methanol, followed by 10 mL Milli-Q water at a flow rate of 3.0 mL/min. C18 cartridges were dried under vacuum for 30 min. For elution, the target POPs possibly retained in the cartridges were eluted by 15 mL ethyl acetate. The final eluates were dried under a gentle stream of nitrogen at 35 °C. Finally, the dried extracts were dissolved again with 1 mL of a mixture of n-hexane/acetone (90:10, v/v). The final aliquots were transferred into 2 mL amber vials and stored at 20 °C until GC-MS analysis.
Sediment samples were freeze-dried and ground. After screening through a 60-mesh sieve, 2.0 g of the sample and 1.5 g copper powder were uniformly mixed and put into an extraction cell with a volume of 22 mL. An accelerated solvent extractor (ASE350, Thermo Fisher Scientific, Waltham, MA, USA) was used for the extraction of POPs. Eluents were concentrated to about 5 mL (n-hexane/acetone (90:10, v/v)) using a rotary evaporator and then evaporated to a final volume of about 0.5 mL using a gentle stream of nitrogen. The eluent fractions containing a suite of POPs were analyzed using high-resolution capillary gas chromatography (GC) and mass spectrometry (MS).
POPs compounds were identified and quantified using a gas chromatography-triple quadrupole tandem mass spectrometer (TSQ Quantum XLA, Thermo Fisher Scientific, Waltham, MA, USA) equipped with a 30 cm DB-5M column (0.25 mm i. d., 0.25 mL film thickness) with a constant flow (2 mL min−1) of carrier gas (helium). One μL of sample extract was injected in splitless mode with an AS 8400 autosampler.
Analysis followed the protocols of USEPA to ensure data quality. The relative recoveries for target OCPs, PCBs, and PBDEs varied from 6~25%, 8~30%, 7~14%, respectively. Method quantification limits (MQL) of target OCPs, PCBs, and PBDEs ranged from 0.004~0.326 ng/g, 0.043~0.12 ng/g, and 0.021~0.223 ng/g, respectively, depending on the compound.
3. Results and Discussion
3.1. Water Quality Analysis of Water Sources
Table 2 shows the water quality indicators of the water sources. Each collected sample was a composite sample. The water quality of each water source could all reach the Class II water standard of the “Environmental Quality Standards for Surface Water” (GB3838-2002). Highest concentrations of nitrogen nutrients were observed in Qiangwei Lake water source, indicating that the site might be more susceptible to the impact of ammonia nitrogen and nitrate. The relatively high pH of the water source could probably be related to the extensive absorption of carbon dioxide by aquatic plants and discharge of alkaline pollutants. Temperature, pH, DO, and Chlorophyll a (Chla) were all measured in situ. Generally speaking, the water quality of each water source was in a safe state, meeting the requirements for the construction of centralized drinking water sources.
3.2. Distribution Characteristics of Target Antibiotics
The occurrence of antibiotics in five representative reservoir water sources is shown in Table 3. Among them, the content of sulfonamide antibiotics is relatively high, and the concentrations of sulfamethoxazole and sulfamethoxine in the water body were 1.0–83.6 ng·L−1 and NF-56.7 ng·L−1, respectively. The rates and concentrations of sulfonamides were higher than those of quinolone antibiotics. Sulfonamide antibiotics serve as an important class of widely used antibiotics, showing relatively high persistence. Sulfonamides are highly hydrophilic and easily enter the water environment through surface runoff [44]. This may be the main reason for their high detection concentration and detection rate. The detection rate of sulfamethoxazole in the study area was 100%, which is similar to the research results surveyed in the Pearl River [45], Bohai Bay [46], Huangpu River [47], Jinze Reservoir [48], and other surface waters. The concentration of sulfamethoxazole was far lower than that in the Huangpu River Basin (2.05~623.27 ng·L−1) and the Pearl River Basin (NF~1080 ng·L−1). In contrast, quinolone antibiotics are more unstable and prone to photolysis under light conditions [49,50]. The detected concentrations and detection rates of antibiotics in the water intakes of Gehu Lake were higher than the average detected concentrations of other sampling points, which were 16.5 ng·g−1 and 17.4 ng·g−1, respectively. The relatively more densely populated condition could explain the higher detection rate and detection concentrations.
The detection rate of sulfonamide antibiotics in the surface sediments of water sources was 100%. The concentrations of sulfamethoxazole, sulfamethoxine, trimethoprim, sulfaquinoxaline, and sulfadimethoxine were NF~15.4 ng·g−1, 1.7~25.3 ng·g−1, 2.6~87.0 ng·g−1, NF~7.9 ng·g−1, and NF~10.7 ng·g−1, respectively. The relatively low Henry constants suggest that sulfonamide antibiotics are difficult to be adsorbed by soil and sediment. Nonetheless, the high occurrence in surface sediments probably indicates relatively large amounts of usage and discharge. Trimethoprim is an antibiotic synergist, which is often mixed with a variety of antibiotics to enhance drug efficacy. Around 87.5% of trimethoprim will be excreted into the environment in the form of the original drug through animal feces [51]. The detected concentrations of norfloxacin, ciprofloxacin, and ofloxacin were NF~0.6 ng·g−1, NF~2.7 ng·g−1, and 0.02~0.2 ng·g−1, respectively. The concentrations of lomefloxacin and enrofloxacin were NF~32.5 ng·g−1 and 0.07~20.8 ng·g−1, respectively.
The concentration of sulfonamides in the overlying water bodies in the study area (NF~37.46 ng L−1) was lower than that reported in the Yangtze Estuary (NF~71.8 ng L−1) and Huangpu River (NF~89.1 ng L−1). The detected concentrations were comparable with the reported data in Tiegang Water Supply Reservoir (6.1~47 ng·L−1), a drinking water source in Shenzhen, China [52], as well as a surface drinking water source in Lisbon, Portugal (8~25 ng·L−1) [53]. The total amount of quinolone antibiotics detected in the study was equivalent to the concentrations in the Yangtze Estuary (NF~2.27 ng·L−1) and Huangpu River (NF~34.2 ng·L−1), while it was lower than in the Pearl River (14~74 ng·L−1) basin. The concentration of detected pollutants in the Cache La Poudre River in the United States (NF~13.7 ng·g−1) is comparable to the present study. The concentration of quinolone antibiotics was similar to the reported values in Liaohe (NFC: NF~3.3 ng·g−1), Swiss Griffin Lake (NFC: 2.4 ng·g−1, CFC: 2.5 ng·g−1), and Hailing Island (CFC: 0.4 ng·g−1); while concentrations were lower than the values in the Yellow River (NF~123 ng·g−1), Haihe River (10.3~5770 ng·g−1) and the Pearl River Basin (21.8~1560 ng·g−1). Compared with the above studies, antibiotics in these water sources were at a relatively low level. The detection rate of sulfamethoxazole antibiotics was higher than that of other antibiotics in all parts of the world (for which the authors collected data), which is consistent with this study. The concentration range of antibiotics in different regions is quite different, and the concentration in the north and south of China is generally higher than that in this study.
3.3. POPs Distribution Characteristics and Source Analysis
3.3.1. OCPs Distribution Characteristics and Sources
The concentrations of 19 OCPs in surface water and surface sediments are shown in Table 4. No OCPs were detected in the surface water of the water sources. DDTs were mainly detected in surface sediments from December 2018 and March 2019. DDTs are mainly composed of six isomers: p,p’-DDD, p,p’-DDE, p,p’-DDT and o,p’-DDD, o,p’-DDE, o,p’-DDT composition. In this study, p,p’-DDE and p,p’-DDT were mainly detected. Among them, the detection rate of p,p’-DDT was 70%, and that of p,p’-DDE was 92%. In the three sampling tests, the concentrations of p,p’-DDE were between NF~23.7 ng/g, and the concentrations of p,p’-DDT were between NF~69.6 ng/g. In June 2019, in addition to p,p’-DDE and p,p’-DDT, three kinds of OCPs including endosulfan sulfate, Beta-endosulfan, and methoxychlor were detected in the surface sediments. Three kinds of OCPs concentrations were between 9.0~10.6 ng/g.
Except for the water source of Gonghu Lake, the total amount of DDTs detected in December was higher than that in March at five other sampling sites. In December, with lower temperatures, the degradation, migration, and volatilization of pollutants are probably slower than in March. Compared with the results in December and March, more types of pollutants were detected in June. The reason could be summarized as follows. First, precipitation of particles from the air into sediments occurred more frequently. The accelerated soil erosion caused by surface runoff in wet seasons was also responsible for the more severe DDTs pollution in June. The increased influx of exogenous substances might probably result in an increase in the types and contents of pollutants.
A relatively high amount and diverse types of pollutants have been reported to be used in the Sanjiangying water source, Gaoyou Lake water source, and Gonghu Lake water source, which could be another reason for the higher contents of POPs in these regions. Zhao found that the content of DDTs detected near the water source of Gonghu Lake in the Taihu Lake Basin accounted for 0.5% to 65.9% of the total OCPs content detected. The main detected DDTs are defined as p,p’-DDE, p,p’-DDT, and p,p’-DDD, suggesting that DDTs pollutants are the main OCPs pollutants in the water source of Gonghu Lake [54]. The OCPs in this study are all within the global range, but are significantly smaller than the upper limit of other water sources. The concentration of OCPS in northern China is significantly higher than that in the lower reaches of the Yangtze River.
DDT is metabolized to DDD under anaerobic conditions, while it is metabolized to DDE under aerobic conditions. The ratio of (DDE + DDD)/∑DDT is often used to judge whether there is new DDT input. If there is continuous DDT input in a certain area, the level of DDT will be maintained at a relatively high state. If there is no DDT input, the DDTs will be degraded, the content will continue to decrease, and the content of the corresponding products will continue to increase [55]. When the ratio of (DDE + DDD)/∑DDT < 1, it means that there is DDT input. When the ratio is greater than 1, it means that most of the DDT parent has been degraded, and the existing ones in the environment belong to the early residues [56]. The calculation suggested that the (DDE + DDD)/DDT ratio of Sanjiangying, Gaoyou Lake, Qiangwei Lake, and Gehu Lake was higher than 1. The results indicated that most of the DDT precursors in the studying area had been degraded, and the existing pollutants in the environment mainly came from historical residues. In March, the ratio of (DDE + DDD)/DDT in Gonghu Lake was less than 1, suggesting that there may be new DDT input, which was also consistent with the result that the highest DDT content was detected in March in the water source of Gonghu Lake. It is most likely to come from farmland soil residuals. The ratio of DDD/DDE in each water source is less than 1, indicating that the water body is dominated in aerobic conditions, which could be ascribed to the relatively strong fluidity and oxic conditions of the water body in the water source.
3.3.2. PCBs Distribution Characteristics and Source Analysis
The distribution behaviors of detected PCBs are shown in Table 5. The sampling location was near the water intake of the water source, and near-surface water (0.5m) was harvested as samples. No PCBs were detected in the surface water samples of each water source, and the main pollutant detected in the surface sediments was PCB-52. The detection rate was 100%. The concentration of PCB-52 in December was between 0.8 and 21.7 ng/g, and the concentration in March was between 18.4 and 47.4 ng/g. In June, PCB-52 was detected in all water sources.
The content of PCB-52 in water sources in March was higher than that in December, and the concentration of PCB-52 in Luoma Lake and Gonghu Lake significantly increased in March, probably due to the impact of anthropogenic activities. PCB-52 has been previously reported to originate from the migration of PCBs and paint additives in the disassembly of imported and domestic capacitors, and may also come from transformer oil pollutants [57]. Extensive anthropogenic activities have been found near Luoma Lake and Gonghu Lake, where developed fish farming industries are widely distributed. Due to the nature of lipophilicity, PCBs are more likely to be adsorbed on suspended particles and settle into surface sediments, resulting in an increase in the concentration of PCB-52 at these two sampling points. Previous research on Gonghu Lake also reported the highest detection rate of PCB-52 among PCBs, probably due to the impacts of insulating oil or impregnated oil in power equipment [58].
3.3.3. PBDEs Distribution Characteristics and Sources
The concentration of PBDEs in this study was below the detection limit, and, therefore, will not be discussed in the following sections. PBDEs in water sources all over the world (for which the authors collected data) are higher than in this study.
3.4. Ecological Risk Assessment of Antibiotics
Risk quotient (RQ) is commonly used to evaluate the ecological risk of antibiotics in water [59]. According to the European commission technical guidance document (TGD), the RQ is used to evaluate the ecological risk of antibiotics [60]. Due to the different toxic effects of the same antibiotic on different species, PENC values of the most sensitive species were selected for evaluation in this study (Table 6). Studies have shown that when multiple antibiotics coexist in the water body, the synergistic effect will be generated and the toxic effect will be enhanced [61]. Therefore, joint risk quotient (RQcum) was used to characterize the ecological risk of antibiotics to aquatic ecosystems. To convert the pollutant content (Cs) in the sediment to the pollutant content (Cp) in the pore water, the formula is shown as follows:
where Cp is in μg/L; Cs is in ng/g (dw); Koc is the organic carbon partition coefficient, in L/kg; foc is the percentage of sediment organic carbon. After obtaining Cp, the risk quotient (RQ) is used to characterize the degree of ecological risk. Predicted No Effect Concentration (PNEC) is the predicted invisible effect content of aquatic organisms in the water body. The PNEC value for each antibiotic can be estimated from the ECOSAR toxicity database. EC50 is the maximum half-effect concentration (mg/L); LC50 is the half-lethal concentration (mg/L). Due to the different toxic effects of antibiotics on different species, the PNEC value of the most sensitive species was selected for evaluation. The specific calculation method referred to the publications by Hernando et al. and Papageorgiou et al. [62,63]. The classification standard of antibiotic ecological RQ is as follows: when RQ < 0.01, there is no risk; When 0.01 ≤ RQ < 0.1, it belongs to low risk; when 0.1 ≤ RQ < 1, it belongs to medium risk. When RQ ≥ 1, it is high risk [64].
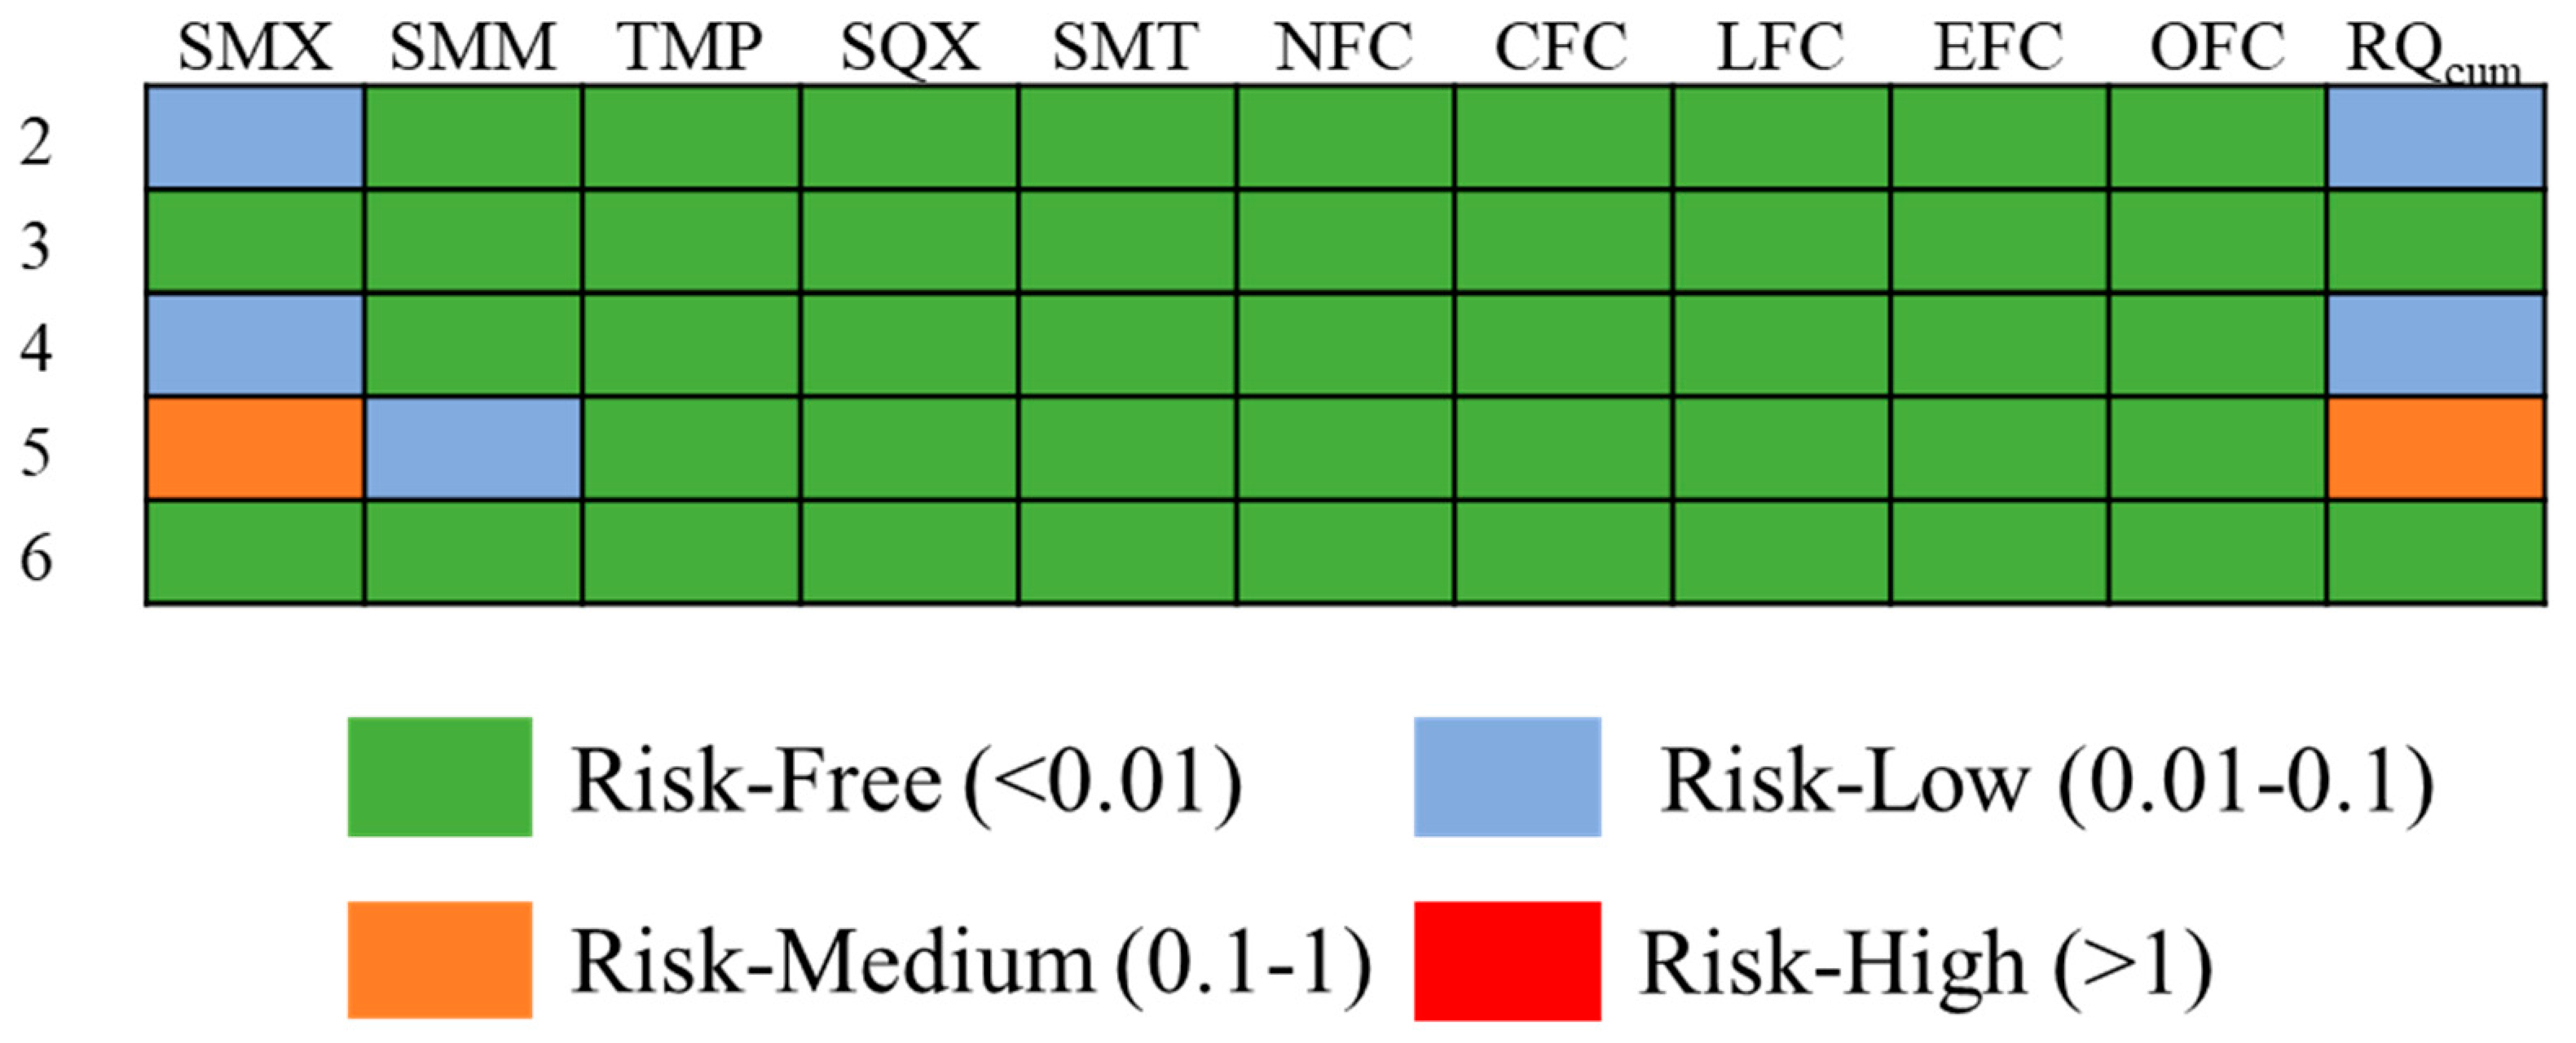
Ecological risk assessment was conducted to reveal the toxicity induced by single and the combination of 10 antibiotics based on RQ (Figure 2). In terms of antibiotic types, the RQ of 9 antibiotics (SMM, TMP, SQX, SMT, NFC, CFC, LFC, EFC, OFC) were all below 0.1, demonstrating a low risk or no risk. The RQ value of SMX in Gehu Lake is greater than 0.1, implying a moderate risk in the area. For toxicity induced by combined antibiotics, all the antibiotics in Luoma Lake, Qiangwei Lake, Gaoyou Lake and Gong Lake are at a risk-free or low level. The combined toxicity of antibiotics in Lake Gehu is 0.18, which is at a moderate risk level. The above results suggested that greater attention should be paid for ensuring the safety and water quality in the residential area of Gehu Lake. Comprehensive management measurement in controlling the inputs of antibiotics from various sources are also suggested to be employed to for the protection of water sources.
3.5. Ecological Risk Assessment of POPs in Representative Water Sources
3.5.1. OCPs Ecological Risk Assessment in Sediments
In the present study, the environmental quality standard of sediments was applied for the ecological risk assessment of OCPs. The standard has long been used by environmental protection agencies in the United States, Canada, and other countries, and has been designated as an American national standard by USEPA (Table 7). The method is used to estimate the probability of biological toxicity effects based on the concentration of the target pollutant in the sediment. Parameters associated with each pollutant, namely Effects Range Low (ERL), Effects Range Median (ERM), a critical level for effect (TEL), and a critical level for effect (PEL), are proposed in the standard. When the concentration of the target pollutant is less than the ERL, the probability of its biological toxicity effect is less than 10%. When the concentration of the target pollutant exceeds the ERM, the probability of its biological toxicity effect is greater than 50%. For a concentration within the two concentrations, it indicates that the probability of its biological toxicity effect is 10~50%.
By comparing the detected values and parameters in Table 7, the following results could be generated. A total of 70% of the detected concentrations of p,p’-DDT were higher than the ERL value and TEL value. All of the detected concentrations of p,p’-DDT did not exceed ERM, while 80% of the detected p,p’-DDT were higher than the PEL value. In terms of the DDTs, 80% of the detected concentrations of DDTs were higher than ERL and TEL. The results probably suggest that DDTs might show occasional negative ecological effects. Notably, the p,p’-DDT content in Sanjiangying, Gaoyou Lake, and Gonghu Lake was higher than the ERM and PEL values, probably posing a high risk effect to the water sources. The results suggested that the DDTs in Sanjiangying, Gaoyou Lake, and Gonghu Lake might pose a negative ecological effect, and attention should be paid to DDT pesticides usage in this area.
3.5.2. PCBs Ecological Risk Assessment in Sediments
In this study, the risk assessment of PCBs in the sediment samples was carried out based on the risk assessment value in the environmental quality standard reported by USEPA, as shown in Table 8. Comparing the PCB-52 concentrations detected in each sample with the results in Table 8, it can be seen that the detected PCB-52 concentrations in Luoma Lake and Gonghu Lake are much higher than the ERM value, probably implying a certain ecological risk in both water sources. However, the detected PCB-52 concentration in other water sources was much lower than the ERM value, demonstrating limited ecological risks.
4. Conclusions
The study showed seasonal distribution, possible sources, and ecological risks of typical POPs and antibiotics in six representative water sources in the lower reaches of the Yangtze River. The results showed that the target OCPs, PCBs, and PBDEs were not detected in the water sources. In terms of the distribution of POPs in the sediments, the southern and central regions of the Yangtze River were more polluted by POPs than the northern regions, and the pollutants detected in summer were more diverse and larger in total than in winter. Endosulfan sulfate, Beta-endosulfan, and methoxychlor were the major antibiotics detected in the sediments from Gaoyou Lake, Gonghu Lake, and Gehu Lake. There are no obvious ecological risks in most water sources affected by POPs. However, OCPs presented potential ecological risk in the Gaoyou Lake and Sanjiangying water sources, where the probability of OCPs biotoxic effects was higher than 50%, reaching a medium risk level. Certain ecological risks of DDT pesticides in Gaoyou Lake, Gonghu Lake, and Sanjiangying, as well as PCBs in Gonghu Lake and Luoma Lake, were detected. The concentration of antibiotics in water sources was generally at a low level. The concentration of sulfonamide antibiotics in the intake water and surface sediments of water sources was higher than those of quinolone antibiotics. The combined toxicity of antibiotics in Lake Gehu was 0.18, which is at a moderate risk level. In the regional water sources of Jiangsu Province in the lower reaches of the Yangtze River Basin, the concentration of pollutants gradually increased from south to north, which may be closely related to the degree of economic development and industrial distribution. The study is of significance in guiding the implementation of trace organic contaminant pollution control approaches in reservoir water resources, as well as in providing a scientific basis for trace organic pollutant governance in water sources in highly-developed areas, such as South China.
Author Contributions
Conceptualization, C.L.; methodology, Y.X.; writing—original draft preparation, W.S. All authors have read and agreed to the published version of the manuscript.
Funding
This research was funded by National Natural Science Foundation of China, grant number 52100175; China Postdoctoral Science Foundation, grant number 2021M701046; Tiegang-Shiyan Reservoir Water Quality Assurance Project (Phase II) and Research and Application of Key technologies for Reservoir Water Quality Assurance Project in high-density built-up area.
Institutional Review Board Statement
Not applicable.
Informed Consent Statement
Not applicable.
Data Availability Statement
Not applicable.
Conflicts of Interest
The authors declare no conflict of interest.
References
- Jose, P.A.; Jebakumar, S.R.D. Non-streptomycete actinomycetes nourish the current microbial antibiotic drug discovery. Front. Microbiol. 2013, 4, 240. [Google Scholar] [CrossRef] [Green Version]
- Chandan, R.C.; Gandhi, A.; Shah, N.P. Yogurt: Historical background, health benefits, and global trade. In Yogurt in Health and Disease Prevention; Academic Press: Cambridge, MA, USA, 2017; pp. 3–29. [Google Scholar]
- Horrigan, L.; Lawrence, R.S.; Walker, P. How sustainable agriculture can address the environmental and human health harms of industrial agriculture. Environ. Health Perspect. 2002, 110, 445–456. [Google Scholar] [CrossRef] [Green Version]
- Serwecińska, L. Antimicrobials and antibiotic-resistant bacteria: A risk to the environment and to public health. Water 2020, 12, 3313. [Google Scholar] [CrossRef]
- Kümmerer, K. Antibiotics in the aquatic environment—A review—Part I. Chemosphere 2009, 75, 417–434. [Google Scholar] [CrossRef]
- Chaturvedi, P.; Shukla, P.; Giri, B.S.; Chowdhary, P.; Chandra, R.; Gupta, P.; Pandey, A. Prevalence and hazardous impact of pharmaceutical and personal care products and antibiotics in environment: A review on emerging contaminants. Environ. Res. 2021, 194, 110664. [Google Scholar] [CrossRef]
- Almakki, A.; Jumas-Bilak, E.; Marchandin, H.; Licznar-Fajardo, P. Antibiotic resistance in urban runoff. Sci. Total Environ. 2019, 667, 64–76. [Google Scholar] [CrossRef] [PubMed]
- Sanganyado, E.; Gwenzi, W. Antibiotic resistance in drinking water systems: Occurrence, removal, and human health risks. Sci. Total Environ. 2019, 669, 785–797. [Google Scholar] [CrossRef]
- Paritala, H.; Carroll, K.S. New targets and inhibitors of mycobacterial sulfur metabolism. Infect. Disord.-Drug Targets. 2013, 13, 85–115. [Google Scholar] [CrossRef] [PubMed]
- Liu, C.; Chen, L.; Vanderbeck, R.M.; Valentine, G.; Zhang, M.; Diprose, K.; McQuaid, K.A. Chinese route to sustainability: Postsocialist transitions and the construction of ecological civilization. Sustain. Dev. 2018, 26, 741–748. [Google Scholar] [CrossRef]
- Yurui, L.; Xuanchang, Z.; Zhi, C.; Zhengjia, L.; Zhi, L.; Yansui, L. Towards the progress of ecological restoration and economic development in China’s Loess Plateau and strategy for more sustainable development. Sci. Total Environ. 2021, 756, 143676. [Google Scholar] [CrossRef]
- Ding, X.; Chong, X.; Bao, Z.; Xue, Y.; Zhang, S. Fuzzy comprehensive assessment method based on the entropy weight method and its application in the water environmental safety evaluation of the Heshangshan drinking water source area, three gorges reservoir area, China. Water 2017, 9, 329. [Google Scholar] [CrossRef] [Green Version]
- Voigt, A.M.; Ciorba, P.; Döhla, M.; Exner, M.; Felder, C.; Lenz-Plet, F.; Sib, E.; Skutlarek, D.; Schmithausen, R.M.; Faerber, H.A. The investigation of antibiotic residues, antibiotic resistance genes and antibiotic-resistant organisms in a drinking water reservoir system in Germany. Int. J. Hyg. Environ. Health 2020, 224, 113449. [Google Scholar] [CrossRef] [PubMed]
- Li, S.; Liu, Y.; Wu, Y.; Hu, J.; Zhang, Y.; Sun, Q.; Sun, W.; Geng, J.; Liu, X.; Jia, D.; et al. Antibiotics in global rivers. Natl. Sci. Open 2022, 1, 20220029. [Google Scholar] [CrossRef]
- Guo, F.; Wang, Y.; Peng, J.; Huang, H.; Tu, X.; Zhao, H.; Zhan, N.; Rao, Z.; Zhao, G.; Yang, H. Occurrence, Distribution, and Risk Assessment of Antibiotics in the Aquatic Environment of the Karst Plateau Wetland of Yangtze River Basin, Southwestern China. Int. J. Environ. Res. Public Health 2022, 19, 7211. [Google Scholar] [CrossRef] [PubMed]
- Zhou, L.J.; Li, J.; Zhang, Y.; Kong, L.; Jin, M.; Yang, X.; Wu, Q.L. Trends in the occurrence and risk assessment of antibiotics in shallow lakes in the lower-middle reaches of the Yangtze River basin, China. Ecotoxicol. Environ. Saf. 2019, 183, 109511. [Google Scholar] [CrossRef]
- Li, S.; Shi, W.; Liu, W.; Li, H.; Zhang, W.; Hu, J.; Ke, Y.; Sun, W.; Ni, J. A duodecennial national synthesis of antibiotics in China’s major rivers and seas (2005–2016). Sci. Total Environ. 2018, 615, 906–917. [Google Scholar] [CrossRef] [PubMed]
- Chen, K.; Zhou, J.L. Occurrence and behavior of antibiotics in water and sediments from the Huangpu River, Shanghai, China. Chemosphere 2014, 95, 604–612. [Google Scholar] [CrossRef]
- Huang, F.; An, Z.; Moran, M.J.; Liu, F. Recognition of typical antibiotic residues in environmental media related to groundwater in China (2009–2019). J. Hazard. Mater. 2020, 399, 122813. [Google Scholar] [CrossRef]
- Xu, W.; Yan, W.; Li, X.; Zou, Y.; Chen, X.; Huang, W.; Miao, L.; Zhang, R.; Zhang, G.; Zou, S. Antibiotics in riverine runoff of the Pearl River Delta and Pearl River Estuary, China: Concentrations, mass loading and ecological risks. Environ. Pollut. 2013, 182, 402–407. [Google Scholar] [CrossRef]
- Guo, X.; Feng, C.; Gu, E.; Tian, C.; Shen, Z. Spatial distribution, source apportionment and risk assessment of antibiotics in the surface water and sediments of the Yangtze Estuary. Sci. Total Environ. 2019, 671, 548–557. [Google Scholar] [CrossRef]
- Tian, S.; Zhang, C.; Huang, D.; Wang, R.; Zeng, G.; Yan, M.; Xiong, W.; Zhou, C.; Cheng, M.; Xue, W.; et al. Recent progress in sustainable technologies for adsorptive and reactive removal of sulfonamides. Chem. Eng. J. 2020, 389, 123423. [Google Scholar] [CrossRef]
- Liu, X.; Zhang, H.; Li, L.; Fu, C.; Tu, C.; Huang, Y.; Wu, L.; Tang, J.; Luo, Y.; Christie, P. Levels, distributions and sources of veterinary antibiotics in the sediments of the Bohai Sea in China and surrounding estuaries. Mar. Pollut. Bull. 2016, 109, 597–602. [Google Scholar] [CrossRef] [PubMed]
- Feng, L.; Cheng, Y.; Zhang, Y.; Li, Z.; Yu, Y.; Feng, L.; Zhang, S.; Xu, L. Distribution and human health risk assessment of antibiotic residues in large-scale drinking water sources in Chongqing area of the Yangtze River. Environ. Res. 2020, 185, 109386. [Google Scholar] [CrossRef]
- Zhang, Z.L.; Hong, H.S.; Zhou, J.L.; Huang, J.; Yu, G. Fate and assessment of persistent organic pollutants in water and sediment from Minjiang River Estuary, Southeast China. Chemosphere 2003, 52, 1423–1430. [Google Scholar] [CrossRef] [PubMed]
- Ashraf, M.A. Persistent organic pollutants (POPs): A global issue, a global challenge. Environ. Sci. Pollut. Res. 2017, 24, 4223–4227. [Google Scholar] [CrossRef]
- Jaikanlaya, C.; Settachan, D.; Denison, M.S.; Ruchirawat, M.; van den Berg, M. PCBs contamination in seafood species at the Eastern Coast of Thailand. Chemosphere 2009, 76, 239–249. [Google Scholar] [CrossRef] [Green Version]
- Zhou, R.; Zhu, L.; Kong, Q. Persistent chlorinated pesticides in fish species from Qiantang River in East China. Chemosphere 2007, 68, 838–847. [Google Scholar] [CrossRef]
- Humphries, M.S.; Myburgh, J.G.; Campbell, R.; Buah-Kwofie, A.; Combrink, X. Organochlorine pesticide bioaccumulation in wild Nile crocodile (Crocodylus niloticus) fat tissues: Environmental influences on changing residue levelsand contaminant profiles. Sci. Total Environ. 2021, 753, 142068. [Google Scholar] [CrossRef]
- Guo, L.L.; Qiu, Y.W.; Zhang, G.; Zheng, G.J.; Lam, P.K.; Li, X. Levels and bioaccumulation of organochlorine pesticides (OCPs) and polyb-rominated diphenyl ethers (PBDEs) in fishes from the Pearl River estuary and Daya Bay, South China. Environ. Pollut. 2008, 152, 604–611. [Google Scholar] [CrossRef]
- Liao, L.N.; Zhang, Z.F.; Liu, L.L.; Song, W.W.; Ma, W.L.; Zhu, N.Z.; Li, Y.F. Measurement and modeling the gas/particle partitioning oforganochlorine pesticides (OCPs) in atmosphere at low temperatures. Sci. Total Environ. 2019, 667, 318–324. [Google Scholar]
- Ma, Y.; Yun, X.; Ruan, Z.; Lu, C.; Shi, Y.; Qin, Q.; Men, Z.; Zou, D.; Du, X.; Xing, B.; et al. Review of hexachlorocyclohexane (HCH) and dichlorodiphenyltrichloroethane (DDT) contamination in Chinese soils. Sci. Total Environ. 2020, 749, 141212. [Google Scholar] [CrossRef]
- Nadal, M.; Rovira, J.; Díaz-Ferrero, J.; Schuhmacher, M.; Domingo, J.L. Human exposure to environmental pollutants after a tire landfill fire in Spain: Health risks. Environ. Int. 2016, 97, 37–44. [Google Scholar] [CrossRef]
- Li, Y.; Zhang, Q.; Ji, D.; Wang, T.; Wang, Y.; Wang, P.; Ding, L.; Jiang, G. Levels and Vertical Distributions of PCBs, PBDEs, and OCPs in the Atmospheric Boundary Layer: Observation from the Beijing 325-m Meteorological Tower. Environ. Sci. Technol. 2009, 43, 1030. [Google Scholar] [CrossRef] [PubMed]
- Zhao, S.; Breivik, K.; Liu, G.; Zheng, M.; Jones, K.C.; Sweetman, A.J. Long-term temporal trends of polychlorinated biphenyls and their controlling sources in China. Environ. Sci. Technol. 2017, 51, 2838–2845. [Google Scholar] [CrossRef] [PubMed] [Green Version]
- Yang, J.; Zhao, Y.; Li, M.; Du, M.; Li, X.; Li, Y. A review of a class of emerging contaminants: The classification, distribution, intensity of consumption, synthesis routes, environmental effects and expectation of pollution abatement to organophosphate flame retardants (OPFRs). Int. J. Mol. Sci. 2019, 20, 2874. [Google Scholar] [CrossRef] [PubMed] [Green Version]
- Peterson, M. Hyperthyroidism in cats: What’s causing this epidemic of thyroid disease and can we prevent it? J. Feline Med. Surg. 2012, 14, 804–818. [Google Scholar] [CrossRef]
- Wee, S.Y.; Aris, A.Z. Endocrine disrupting compounds in drinking water supply system and human health risk implication. Environ. Int. 2017, 106, 207–233. [Google Scholar] [CrossRef]
- Yang, J.; Qadeer, A.; Liu, M.; Zhu, J.M.; Huang, Y.P.; Du, W.N.; Wei, X.Y. Occurrence, source, and partition of PAHs, PCBs, and OCPs in the multiphase system of an urban lake, Shanghai. Appl. Geochem. 2019, 106, 17–25. [Google Scholar] [CrossRef]
- Chen, K.; Cai, M.; Wang, Y.; Chen, B.; Li, X.; Qiu, C.; Huang, S.; Sun, J.; Liu, X.; Qian, B.; et al. Organochlorine Pesticides in Sediment of Zhang River Estuary Mangrove National Natural Reserve: The Implication of Its Source Change in China’s Mangroves. Sustainability 2020, 12, 3016. [Google Scholar] [CrossRef] [Green Version]
- Tsai, W.T. A review on environmental exposure and health risks of herbicide paraquat. Toxicol. Environ. Chem. 2013, 95, 197–206. [Google Scholar] [CrossRef]
- Gao, H.; Ji, H.; Yu, R.; Zhu, G. Effects of ozonation on disinfection by-product formation potentials and biostability in a pilot-scale drinking water treatment plant with micro-polluted water. Environ. Technol. 2021, 42, 3254–3265. [Google Scholar] [CrossRef] [PubMed]
- Wang, D.; Wang, Y.; Singh, V.P.; Zhu, J.; Jiang, L.; Zeng, D.; Liu, D.; Zeng, X.; Wu, J.; Wang, L.; et al. Ecological and health risk assessment of PAHs, OCPs, and PCBs in Taihu Lake basin. Ecol. Indic. 2018, 92, 171–180. [Google Scholar] [CrossRef]
- Sun, P.; Li, Y.; Meng, T.; Zhang, R.; Song, M.; Ren, J. Removal of sulfonamide antibiotics and human metabolite by biochar and biochar/H2O2 in synthetic urine. Water Res. 2018, 147, 91–100. [Google Scholar] [CrossRef] [PubMed]
- Cui, J.; Fu, L.; Tang, B.; Bin, L.; Li, P.; Huang, S.; Fu, F. Occurrence, ecotoxicological risks of sulfonamides and their acetylated metabolites in the typical wastewater treatment plants and receiving rivers at the Pearl River Delta. Sci. Total Environ. 2020, 709, 136192. [Google Scholar] [CrossRef]
- Niu, Z.G.; Zhang, K.; Zhang, Y. Occurrence and distribution of antibiotic resistance genes in the coastal area of the Bohai Bay, China. Mar. Pollut. Bull. 2016, 107, 245–250. [Google Scholar] [CrossRef]
- Yan, M.; Xu, C.; Huang, Y.; Nie, H.; Wang, J. Tetracyclines, sulfonamides and quinolones and their corresponding resistance genes in the Three Gorges Reservoir, China. Sci. Total Environ. 2018, 631, 840–848. [Google Scholar] [CrossRef] [PubMed]
- Li, P.; Wu, Y.; He, Y.; Zhang, B.; Huang, Y.; Yuan, Q.; Chen, Y. Occurrence and fate of antibiotic residues and antibiotic resistance genes in a reservoir with ecological purification facilities for drinking water sources. Sci. Total Environ. 2020, 707, 135276. [Google Scholar] [CrossRef]
- Ayankojo, A.G.; Reut, J.; Nguyen, V.B.C.; Boroznjak, R.; Syritski, V. Advances in Detection of Antibiotic Pollutants in Aqueous Media Using Molecular Imprinting Technique—A Review. Biosensors 2022, 12, 441. [Google Scholar] [CrossRef]
- Lu, J.; Ji, Y.; Chovelon, J.M.; Lu, J. Fluoroquinolone antibiotics sensitized photodegradation of isoproturon. Water Res. 2021, 198, 117136. [Google Scholar] [CrossRef]
- Tasho, R.P.; Cho, J.Y. Veterinary antibiotics in animal waste, its distribution in soil and uptake by plants: A review. Sci. Total Environ. 2016, 563, 366–376. [Google Scholar] [CrossRef]
- Jiang, Z.; Wang, C.; Liu, Y.; Feng, Z.; Ji, C.; Zhang, H. Study on the raw water allocation and optimization in Shenzhen city, China. Water 2019, 11, 1426. [Google Scholar] [CrossRef]
- Silva, H.F.; Silva, N.F.; Oliveira, C.M.; Matos, M.J. Heavy metals contamination of urban soils—A decade study in the city of lisbon, portugal. Soil Syst. 2021, 5, 27. [Google Scholar] [CrossRef]
- Zhao, Z.; Jiang, Y.; Li, Q.; Cai, Y.; Yin, H.; Zhang, L.; Zhang, J. Spatial correlation analysis of polycyclic aromatic hydrocarbons (PAHs) and organochlorine pesticides (OCPs) in sediments between Taihu Lake and its tributary rivers. Ecotoxicol. Environ. Saf. 2017, 142, 117–128. [Google Scholar] [CrossRef] [Green Version]
- Ma, J.; Pan, L.; Yang, X.Y.; Liu, X.L.; Tao, S.Y.; Zhao, L.; Qin, X.P.; Sun, Z.J.; Hou, H.; Zhou, Y.Z. DDT, DDD, and DDE in soil of Xiangfen County, China: Residues, sources, spatial distribution, and health risks. Chemosphere 2016, 163, 578–583. [Google Scholar] [CrossRef]
- Li, J.; Zhang, G.; Qi, S.; Li, X.; Peng, X. Concentrations, enantiomeric compositions, and sources of HCH, DDT and chlordane in soils from the Pearl River Delta, South China. Sci. Total Environ. 2006, 372, 215–224. [Google Scholar] [CrossRef]
- Wu, C.; Zhu, H.; Luo, Y.; Teng, Y.; Song, J.; Chen, M. Levels and potential health hazards of PCBs in shallow groundwater of an e-waste recycling area, China. Environ. Earth Sci. 2015, 74, 4431–4438. [Google Scholar] [CrossRef]
- Besis, A.; Botsaropoulou, E.; Balla, D.; Voutsa, D.; Samara, C. Toxic organic pollutants in Greek house dust: Implications for human exposure and health risk. Chemosphere 2021, 284, 131318. [Google Scholar] [CrossRef]
- Verlicchi, P.; Al, A.M.; Galletti, A.; Petrovic, M.; Barceló, D. Hospital effluent: Investigation of the concentrations and distribution of pharmaceuticals and environmental risk assessment. Sci. Total Environ. 2012, 430, 109–118. [Google Scholar] [CrossRef]
- EC (European Commission). Technical Guidance Docu Ment in Support of Commission Directive 93/7677EECon Risk Assessment for New Notified Substances Andcommission Regulation (EC) No.1488/94 on Risk Assessment for Existing Substances; Office for Official Publications of the European Communities: Luxembourg, 2003. [Google Scholar]
- Cleuvers, M. Aquatic ecotoxicity of pharmaceuticals including the assessment of combination effects. Toxicol. Lett. 2003, 142, 185–194. [Google Scholar] [CrossRef]
- Papageorgiou, M.; Zioris, I.; Danis, T.; Bikiaris, D.; Lambropoulou, D. Comprehensive investigation of a wide range of pharmaceuticals and personal care products in urban and hospital wastewaters in Greece. Sci. Total Environ. 2019, 694, 133565. [Google Scholar] [CrossRef]
- Hernando, M.D.; Mezcua, M.; Fernández-Alba, A.R.; Barceló, D. Environmental risk assessment of pharmaceutical residues in wastewater effluents, surface waters and sediments. Talanta 2006, 69, 334–342. [Google Scholar] [CrossRef] [PubMed]
- Song, W.; Liao, Z.; Wang, L.; Li, Y.; Zhang, W.; Ji, Y.; Chen, J. The distribution and ecological risks of antibiotics in the sediments from a diverging area of the bifurcated river: Effects of hydrological properties. J. Environ. Manag. 2022, 320, 115787. [Google Scholar] [CrossRef]
Figure 1.
Research area and sampling sites in the study. Numbers 1 to 6 refer to the sampling site at Sanjiang ying, Gaoyou Lake, Luoma Lake, Qiangwei Lake, Gehu Lake, and Gonghu lake, respectively.
Figure 1.
Research area and sampling sites in the study. Numbers 1 to 6 refer to the sampling site at Sanjiang ying, Gaoyou Lake, Luoma Lake, Qiangwei Lake, Gehu Lake, and Gonghu lake, respectively.

Figure 2.
RQ and RQcum of antibiotics in representative water sources.


Table 1.
MS parameters used in the determination of the ten antibiotics.
| Compound | Retention Tim e/min | Parention (m/z) | Daughterion (m/z) | Residence Time/s | Cone/V | Collision/V |
|---|---|---|---|---|---|---|
| Sulfamethoxazole | 2.98 | 254.0 | 92.0 156.0 | 0.050 | 25 | 26 16 |
| Sulfamonomethoxine | 2.69 | 281.0 | 92.0 156.0 | 0.078 | 27 | 35 22 |
| Trimethoprim | 2.06 | 291.0 | 123.0 230.0 | 0.022 | 35 | 27 25 |
| Sulphaquinoxaline | 3.44 | 301.1 | 92.2 156.1 | 0.050 | 23 | 30 16 |
| Sulfadimethoxine | 3.43 | 311.1 | 92.0 156.0 | 0.050 | 28 | 32 20 |
| Norfloxacin | 2.08 | 320.1 | 233.0 276.1 | 0.022 | 32 | 25 20 |
| Ciprofloxacin | 2.12 | 332.1 | 288.1 314.1 | 0.022 | 32 | 18 22 |
| Lomefloxacin | 2.22 | 352.1 | 265.1 308.1 | 0.022 | 31 | 22 16 |
| Enrofloxacin | 2.29 | 360.2 | 245.0 316.1 | 0.022 | 32 | 20 22 |
| Ofloxacin | 2.08 | 362.1 | 261.1 368.1 | 0.022 | 31 | 25 20 |
Table 2.
Water source water quality of sampling sites.
| Sites | Longitude | Latitude | Sampling Time | Water Quality Testing Indicators | |||||||
|---|---|---|---|---|---|---|---|---|---|---|---|
| T °C | pH | DO mg/L | Conductivity μs/cm | TDS mg/L | Turbidity NTU | Chla μg/L | NH3-N mg/L | ||||
| 1 | 119.70° | 33.30° | Dec 2018 | 19.1 ± 0.57 | 9.0 ± 0.27 | 11.49 ± 0.34 | 271.50 ± 8.15 | 55.7 ± 1.67 | 16.1 ± 0.48 | 1.0 ± 0.03 | 0.55 ± 0.02 |
| Mar 2019 | 15.7 ± 0.63 | 8.8 ± 0.35 | 11.26 ± 0.45 | 287.30 ± 11.49 | — | 66.0 ± 2.64 | 18.6 ± 0.74 | 0.24 ± 0.01 | |||
| June 2019 | 28.5 ± 1.43 | 8.6 ± 0.43 | 9.42 ± 0.47 | 345.20 ± 17.26 | 257.9 ± 12.90 | 13.8 ± 0.69 | 8.1 ± 0.41 | 0.4 ± 0.02 | |||
| 2 | 119.24° | 32.75° | Dec 2018 | 14.8 ± 0.89 | 9.3 ± 0.56 | 14.54 ± 0.87 | 310.00 ± 18.60 | 43.0 ± 2.58 | 26.6 ± 1.60 | 7.1 ± 0.43 | 0.61 ± 0.04 |
| Mar 2019 | 13.5 ± 0.95 | 9.3 ± 0.65 | 12.78 ± 0.89 | 320.00 ± 22.40 | — | 31.8 ± 2.23 | 19.6 ± 1.37 | 0.23 ± 0.02 | |||
| June 2019 | 28.7 ± 0.86 | 9.2 ± 0.28 | 8.98 ± 0.27 | 596.20 ± 17.89 | 219.6 ± 6.59 | 45.8 ± 1.37 | 5.3 ± 0.16 | 0.33 ± 0.01 | |||
| 3 | 118.14° | 34.01° | Dec 2018 | 13.0 ± 0.52 | 8.6 ± 0.34 | 10.73 ± 0.43 | 484.40 ± 19.38 | 60.4 ± 2.42 | 6.3 ± 0.25 | 5.8 ± 0.23 | 0.47 ± 0.02 |
| Mar 2019 | 12.3 ± 0.62 | 8.42 ± 0.42 | 12.31 ± 0.62 | 493.00 ± 24.65 | — | 19.0 ± 0.95 | 3.6 ± 0.18 | 0.04 ± 0.00 | |||
| June 2019 | 29.8 ± 1.79 | 8.79 ± 0.53 | 10.63 ± 0.64 | 777.30 ± 46.64 | 241.5 ± 14.49 | 9.0 ± 0.54 | 7.6 ± 0.46 | 0.24 ± 0.01 | |||
| 4 | 119.06° | 34.53° | Dec 2018 | 13.9 ± 0.97 | 8.23 ± 0.58 | 9.91 ± 0.69 | 518.30 ± 36.28 | 34.4 ± 2.41 | 13.8 ± 0.97 | 46.4 ± 3.25 | 0.42 ± 0.03 |
| Mar 2019 | 10.9 ± 0.33 | 8.74 ± 0.26 | 10.29 ± 0.31 | 34.88 ± 1.05 | — | 22.0 ± 0.66 | 16.6 ± 0.50 | 0.59 ± 0.02 | |||
| June 2019 | 25.5 ± 1.02 | 7.81 ± 0.31 | 6.72 ± 0.27 | 71.75 ± 2.87 | 316.8 ± 12.67 | 16.9 ± 0.68 | 10.8 ± 0.43 | 0.16 ± 0.01 | |||
| 5 | 119.87° | 31.61° | Dec 2018 | 13.4 ± 0.67 | 8.67 ± 0.43 | 9.78 ± 0.49 | 415.8 ± 20.79 | 133.5 ± 6.68 | 76. ±3.80 | 45.7 ± 2.29 | 0.48 ± 0.02 |
| Mar 2019 | 9.7 ± 0.58 | 8.74 ± 0.52 | 10.29 ± 0.62 | 34.9 ± 2.09 | — | 22.0 ± 1.32 | 16.6 ± 1.00 | 0.15 ± 0.01 | |||
| June 2019 | 29.4 ± 2.06 | 8.09 ± 0.57 | 7.97 ± 0.56 | 512.1 ± 35.85 | 257.2 ± 18.00 | 82.6 ± 5.78 | 22.0 ± 1.54 | 0.32 ± 0.02 | |||
| 6 | 120.38 | 31.46° | Dec 2018 | 15.0 ± 0.45 | 8.47 ± 0.25 | 9.27 ± 0.28 | 386 ± 11.58 | 84.3 ± 2.53 | 15.7 ± 0.47 | 29.6 ± 0.89 | 0.53 ± 0.02 |
| Mar 2019 | 10.4 ± 0.42 | 8.95 ± 0.36 | 10.71 ± 0.43 | 362.8 ± 14.51 | — | 12.8 ± 0.51 | 15.5 ± 0.62 | 0.10 ± 0.00 | |||
| June 2019 | 25.6 ± 1.28 | 7.96 ± 0.40 | 6.96 ± 0.35 | 617.6 ± 30.88 | 210.2 ± 10.51 | 18.6 ± 0.93 | 14.8 ± 0.74 | 0.48 ± 0.02 | |||
Table 3.
Concentrations of antibiotics at the water intakes of representative water sources.
| Samples | Sites | SMX | SMM | TMP | SQX | SMT | NFC | CFC | LFC | EFC | OFC |
|---|---|---|---|---|---|---|---|---|---|---|---|
| Water (ng/L) | 2 | 9.8 ± 0.29 ~15.5 ± 0.47 | 4.0 ± 0.12 ~12.6 ± 0.38 | NF | NF | NF | NF | NF | NF | NF | NF ~1.1 ± 0.03 |
| 3 | 1.7 ± 0.07 ~1.9 ± 0.08 | NF ~6.0 ± 0.24 | NF | NF | NF | NF | NF | NF | NF ~0.4 ± 0.02 | NF ~3.4 ± 0.14 | |
| 4 | 11.2 ± 0.56 ~21.2 ± 1.06 | 10.0 ± 0.50 ~13.3 ± 0.67 | NF | NF | NF | NF ~5.7 ± 0.29 | NF | NF | NF | NF ~1.7 ± 0.09 | |
| 5 | 5.7 ± 0.34 ~78.1 ± 4.69 | 8.8 ± 0.53 ~56.7 ± 3.40 | 13.3 ± 0.80 ~21.4 ± 1.28 | NF ~8.1 ± 0.49 | NF ~3.1 ± 0.19 | NF | NF ~3.5 ± 0.25 | NF ~2.3 ± 0.14 | NF ~2.6 ± 0.16 | NF ~3.1 ± 0.19 | |
| 6 | 1.0 ± 0.07 ~2.6 ± 0.18 | NF | NF | NF | NF | NF ~3.8 ± 0.27 | NF | NF | 0.7 ± 0.05 ~1.6 ± 0.11 | 2.8 ± 0.20 ~6.9 ± 0.48 | |
| Sediment (ng/g) | 2 | NF ~15.4 ± 0.46 | 5.9 ± 0.1 8~25.3 ± 0.76 | 14.0 ± 0.42 ~87.0 ± 2.61 | NF ~1.9 ± 0.06 | NF ~3.8 ± 0.11 | NF | NF ~0.7 ± 0.02 | 9.0 ± 0.27 ~31.0 ± 0.93 | NF ~0.3 ± 0.01 | 0.1 ± 0.01 ~0.3 ± 0.01 |
| 3 | 1.4 ± 0.06 ~4.2 ± 0.17 | 3.4 ± 0.14 ~8.1 ± 0.32 | 8.2 ± 0.33 ~32.6 ± 1.30 | 0.7 ± 0.03 ~1.1 ± 0.04 | 0.7 ± 0.03 ~3.8 ± 0.15 | NF | NF | 2.2 ± 0.09 ~4.6 ± 0.18 | 0.1 ± 0.02 ~0.4 ± 0.04 | NF ~0.1 ± 0.01 | |
| 4 | 1.7 ± 0.09 ~6.0 ± 0.30 | 5.9 ± 0.30 ~9.4 ± 0.47 | 2.6 ± 0.13 ~12.4 ± 0.62 | 0.6 ± 0.03 ~1.2 ± 0.06 | NF ~0.8 ± 0.04 | NF | 0.1 ± 0.01 ~0.2 ± 0.01 | NF ~3.0 ± 0.15 | 0.7 ± 0.0 8~1.6 ± 0.13 | NF ~0.1 ± 0.01 | |
| 5 | 1.4 ± 0.0 8~13.9 ± 0.83 | 1.7 ± 0.10 ~15.4 ± 0.92 | 8.0 ± 0.4 8~41.4 ± 2.48 | NF ~7.9 ± 0.47 | NF ~10.7 ± 0.64 | 0.2 ± 0.01 ~0.7 ± 0.04 | 2.1 ± 0.13 ~3.8 ± 0.23 | 2.0 ± 0.12 ~93.2 ± 5.59 | 2.1 ± 2.33 ~38.8 ± | 0.1 ± 0.01 ~0.8 ± 0.05 | |
| 6 | 1.1 ± 0.0 8~2.4 ± 0.17 | 4.7 ± 0.33 ~6.2 ± 0.43 | 3.6 ± 0.25 ~97.8 ± 6.85 | 1.2 ± 0.0 8~1.6 ± 0.11 | 0.3 ± 0.02 ~1.1 ± 0.08 | NF | NF ~0.1 ± 0.01 | NF | NF ~0.1 ± 0.01 | NF ~0.1 ± 0.01 |
Notes: Sulfamethoxazole (SMX); sulfamonomethoxine (SMM); trimethoprim (TMP); sulfaquinoxaline (SQX); sulfamethazine (SMT); norfloxacin (NFC); cefonicid (CFC); lomefloxacin (LFC); enrofloxacin (EFC); ofloxacin (OFC).
Table 4.
Distribution characteristics of OCPs in surface sediments of water sources.
| Sites No. | Sampling Time | p,p’-DDT ng/g | p,p’-DDE ng/g | Endosulfan Sulfate ng/g | Beta-Endosulfan ng/g | Methoxychlor ng/g |
|---|---|---|---|---|---|---|
| 1 | Dec 2018 | 12.6 ± 0.38 | 21.8 ± 0.65 | NF | NF | NF |
| Mar 2019 | 3.9 ± 0.16 | 21.1 ± 0.84 | NF | NF | NF | |
| June 2019 | — | — | — | — | — | |
| 2 | Dec 2018 | 13.2 ± 0.66 | 22.4 ± 1.12 | NF | NF | NF |
| Mar 2019 | — | — | — | — | — | |
| June 2019 | 9.7 ± 0.68 | 23.7 ± 1.66 | 10.6 ± 0.74 | NF | 9.2 ± 0.64 | |
| 3 | Dec 2018 | NF | 0.4 ± 0.01 | NF | NF | NF |
| Mar 2019 | 1.9 ± 0.08 | 11.6 ± 0.46 | NF | NF | NF | |
| June 2019 | — | — | — | — | — | |
| 4 | Dec 2018 | NF | 0.9 ± 0.03 | NF | NF | NF |
| Mar 2019 | 1.8 ± 0.13 | 10.2 ± 0.71 | NF | NF | NF | |
| June 2019 | — | — | — | — | — | |
| 5 | Dec 2018 | NF | 9.5 ± 0.29 | NF | NF | NF |
| Mar 2019 | — | — | — | — | — | |
| June 2019 | NF | 25 ± 0.75 | 9.0 ± 0.27 | NF | NF | |
| 6 | Dec 2018 | 2.0 ± 0.14 | 14.8 ± 1.04 | NF | NF | NF |
| Mar 2019 | 69.6 ± 2.09 | 19.6 ± 0.59 | NF | NF | NF | |
| June 2019 | 8.6 ± 0.34 | NF | NF | 14.1 ± 0.56 | NF |
Notes: —means missing data, NF means Not Found.
Table 5.
Distribution characteristics of PCBs in surface sediments in water sources.
| Sites No. | Sampling Time | PCB-52 ng/g |
|---|---|---|
| 1 | Dec 2018 | 0.9 ± 0.03 |
| Mar 2019 | 18.4 ± 0.74 | |
| June 2019 | — | |
| 2 | Dec 2018 | 0.8 ± 0.05 |
| Mar 2019 | — | |
| June 2019 | NF | |
| 3 | Dec 2018 | 1.1 ± 0.04 |
| Mar 2019 | 47.4 ± 2.37 | |
| June 2019 | — | |
| 4 | Dec 2018 | 0.9 ± 0.06 |
| Mar 2019 | 10.9 ± 0.33 | |
| June 2019 | — | |
| 5 | Dec 2018 | 9.7 ± 0.49 |
| Mar 2019 | — | |
| June 2019 | NF | |
| 6 | Dec 2018 | 21.7 ± 0.65 |
| Mar 2019 | 36.0 ± 1.44 | |
| June 2019 | NF |
| Antibiotics | Toxicity | Assessment Factors | LC50 or EC50 (mg·L−1) | PNEC (ng·L−1) |
|---|---|---|---|---|
| SMX | acute | 1000 | 0.27 | 270 |
| SMM | acute | 1000 | 1.277 | 1277 |
| TMP | acute | 1000 | 16 | 16,000 |
| SQX | acute | 1000 | 84.46 | 84,500 |
| SMT | acute | 1000 | 1.74 | 17,400 |
| NFC | acute | 1000 | 22 | 22,000 |
| CFC | acute | 1000 | 5 | 5000 |
| LFC | acute | 1000 | 4.137 | 4137 |
| EFC | acute | 1000 | 49 | 49,000 |
| OFC | acute | 1000 | 11.3 | 11,300 |
Table 7.
USEPA Environmental Quality Standards for OCPs in sediments (ng/g).
| OCPs | ERL | ERM | TEL | PEL |
|---|---|---|---|---|
| p,p’-DDE | 2.2 | 27 | 2.07 | 3.74 |
| p,p’-DDT | 1 | 7 | 1.19 | 4.77 |
| DDTs | 3.0 | 46.1 | 3.89 | 51.7 |
Table 8.
USEPA Environmental Quality Standards for PCBs in sediments (ng/g).
| PCB | ERL ng/g | ERM ng/g |
|---|---|---|
| PCB52 | 2.2 | 27 |
Disclaimer/Publisher’s Note: The statements, opinions and data contained in all publications are solely those of the individual author(s) and contributor(s) and not of MDPI and/or the editor(s). MDPI and/or the editor(s) disclaim responsibility for any injury to people or property resulting from any ideas, methods, instructions or products referred to in the content. |
© 2023 by the authors. Licensee MDPI, Basel, Switzerland. This article is an open access article distributed under the terms and conditions of the Creative Commons Attribution (CC BY) license (https://creativecommons.org/licenses/by/4.0/).
Share and Cite
MDPI and ACS Style
Li, C.; Xu, Y.; Song, W. Pollution Characteristics and Risk Assessment of Typical Antibiotics and Persistent Organic Pollutants in Reservoir Water Sources. Water 2023, 15, 259. https://doi.org/10.3390/w15020259
AMA Style
Li C, Xu Y, Song W. Pollution Characteristics and Risk Assessment of Typical Antibiotics and Persistent Organic Pollutants in Reservoir Water Sources. Water. 2023; 15(2):259. https://doi.org/10.3390/w15020259
Chicago/Turabian StyleLi, Chunwei, Yuan Xu, and Weiwei Song. 2023. "Pollution Characteristics and Risk Assessment of Typical Antibiotics and Persistent Organic Pollutants in Reservoir Water Sources" Water 15, no. 2: 259. https://doi.org/10.3390/w15020259
Note that from the first issue of 2016, this journal uses article numbers instead of page numbers. See further details here.