
Temperature Modeling with the Group Method of Data Handling to Inform Projected Rainfall Depth Changes for Extreme Events in Central West, New South Wales, Australia

Abstract
:1. Introduction and Background
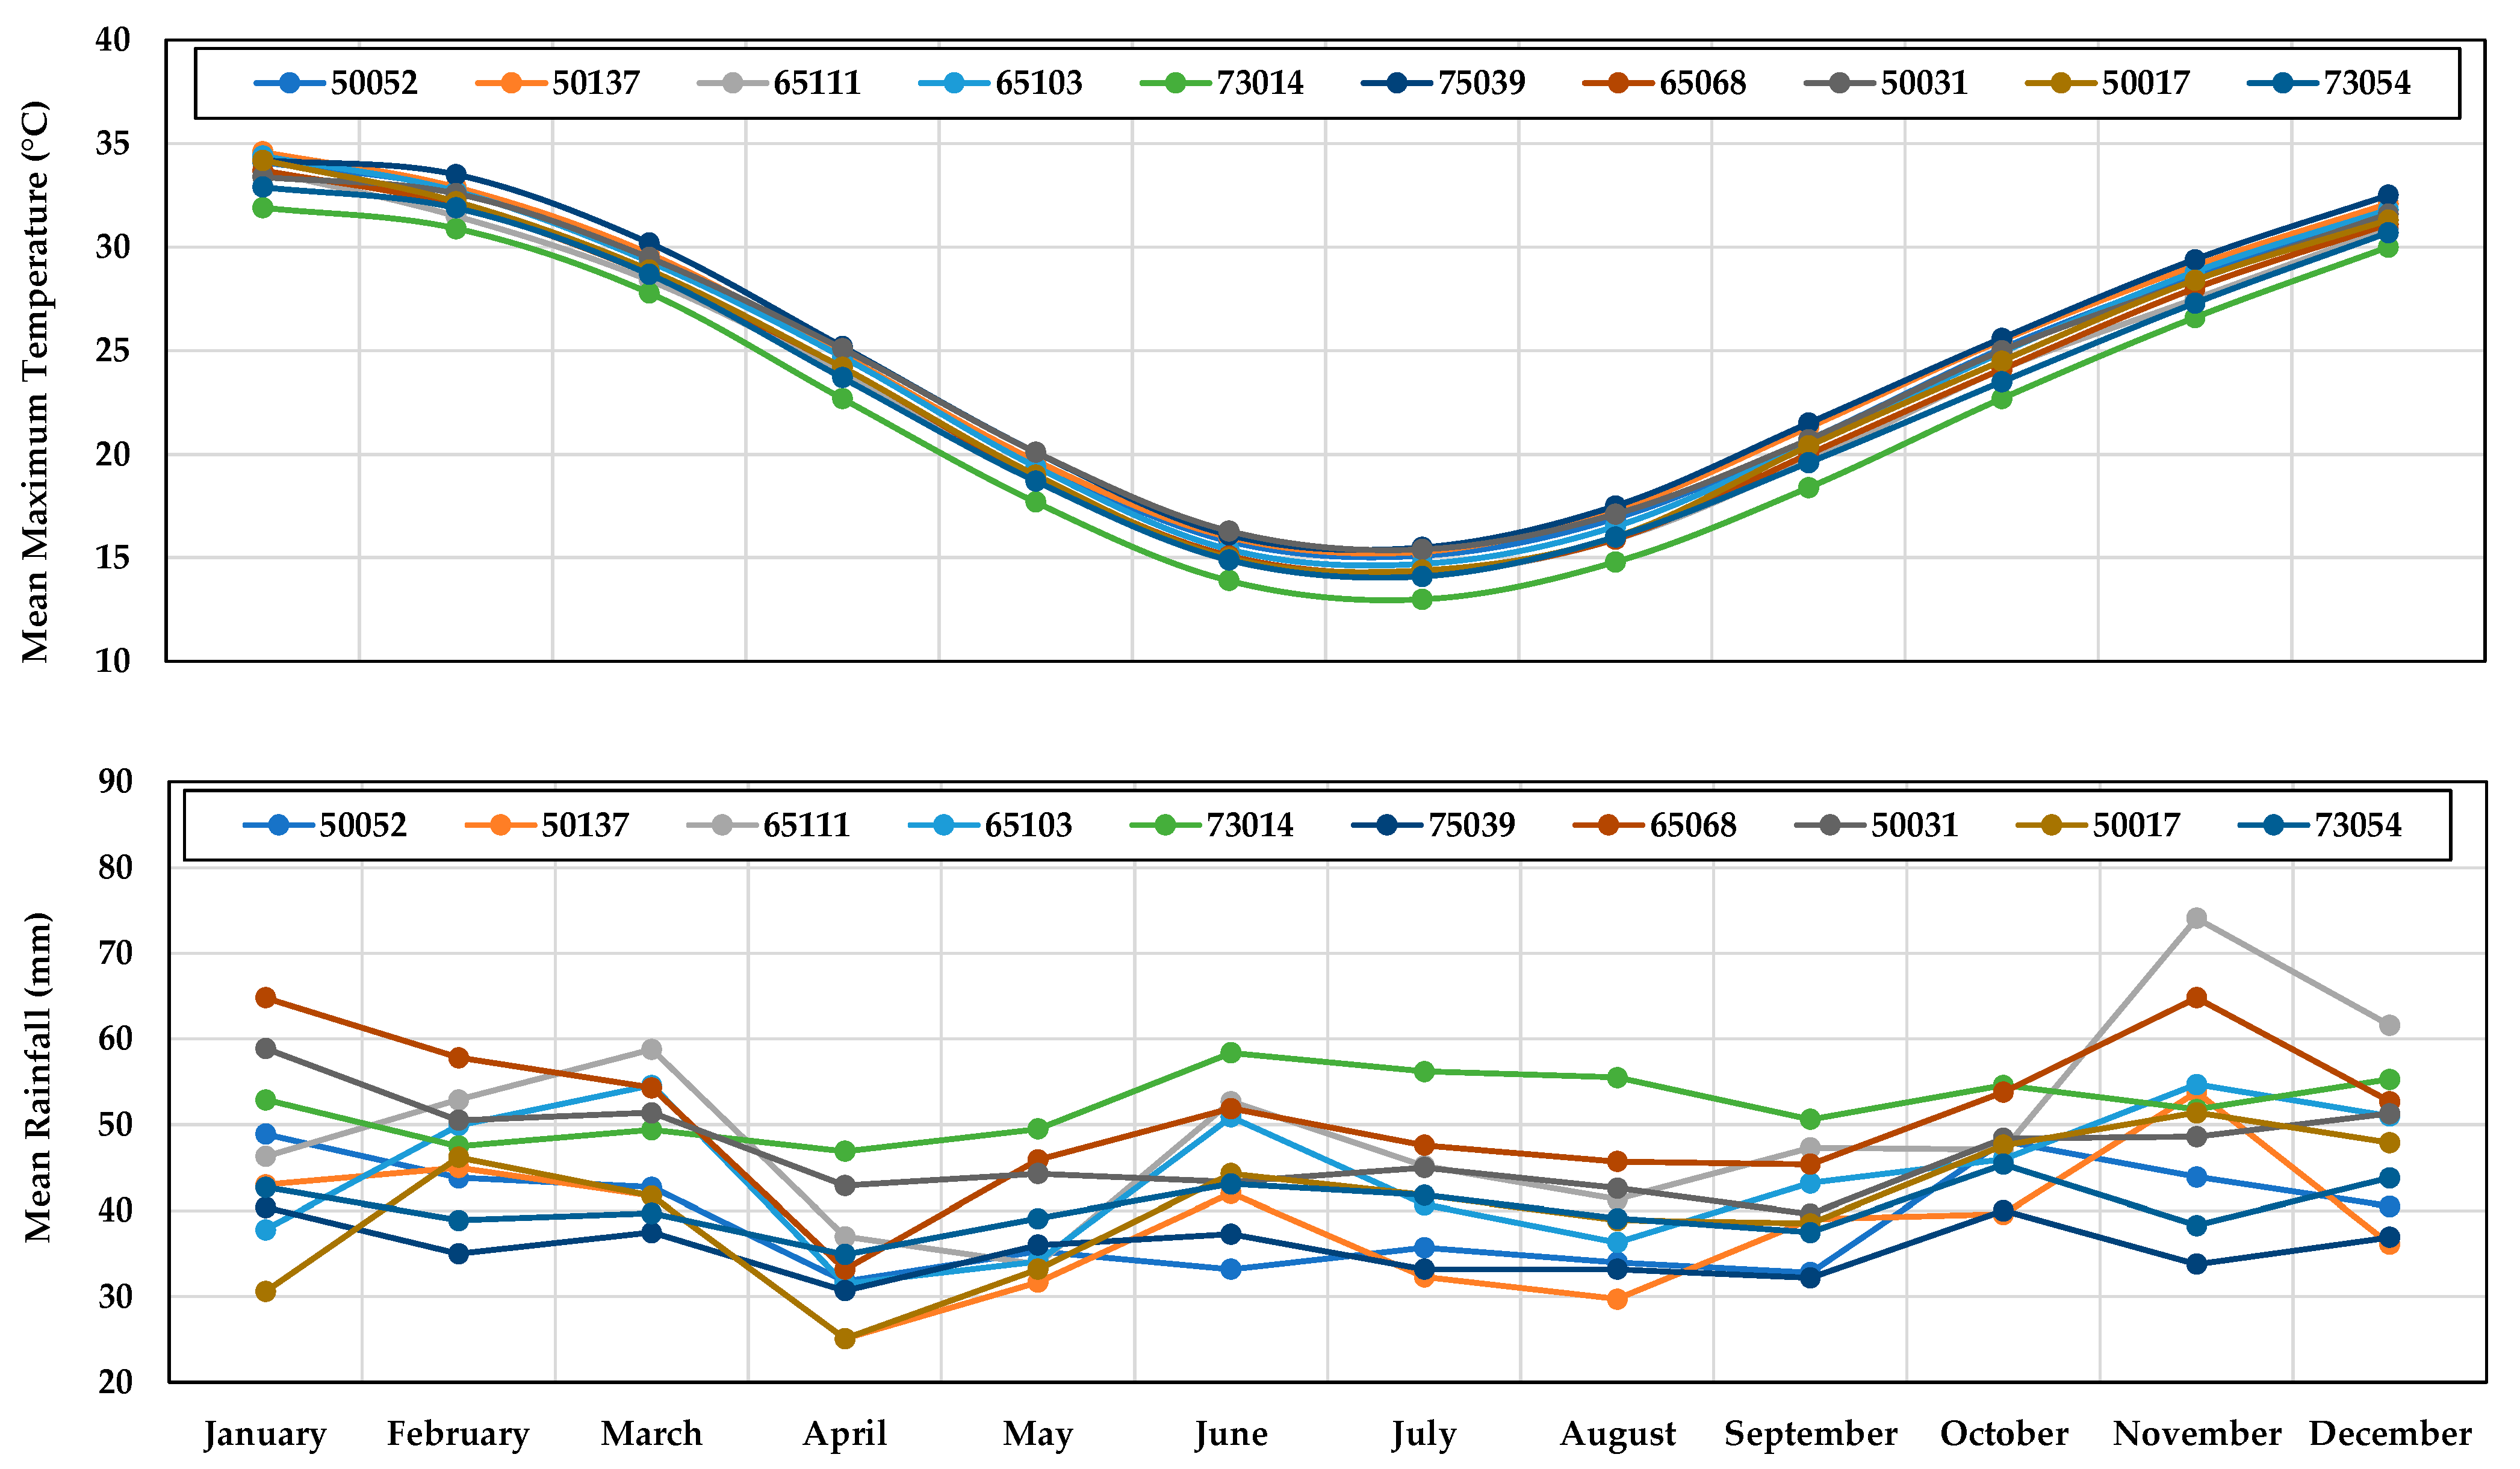
2. Study Area
3. Materials and Methods
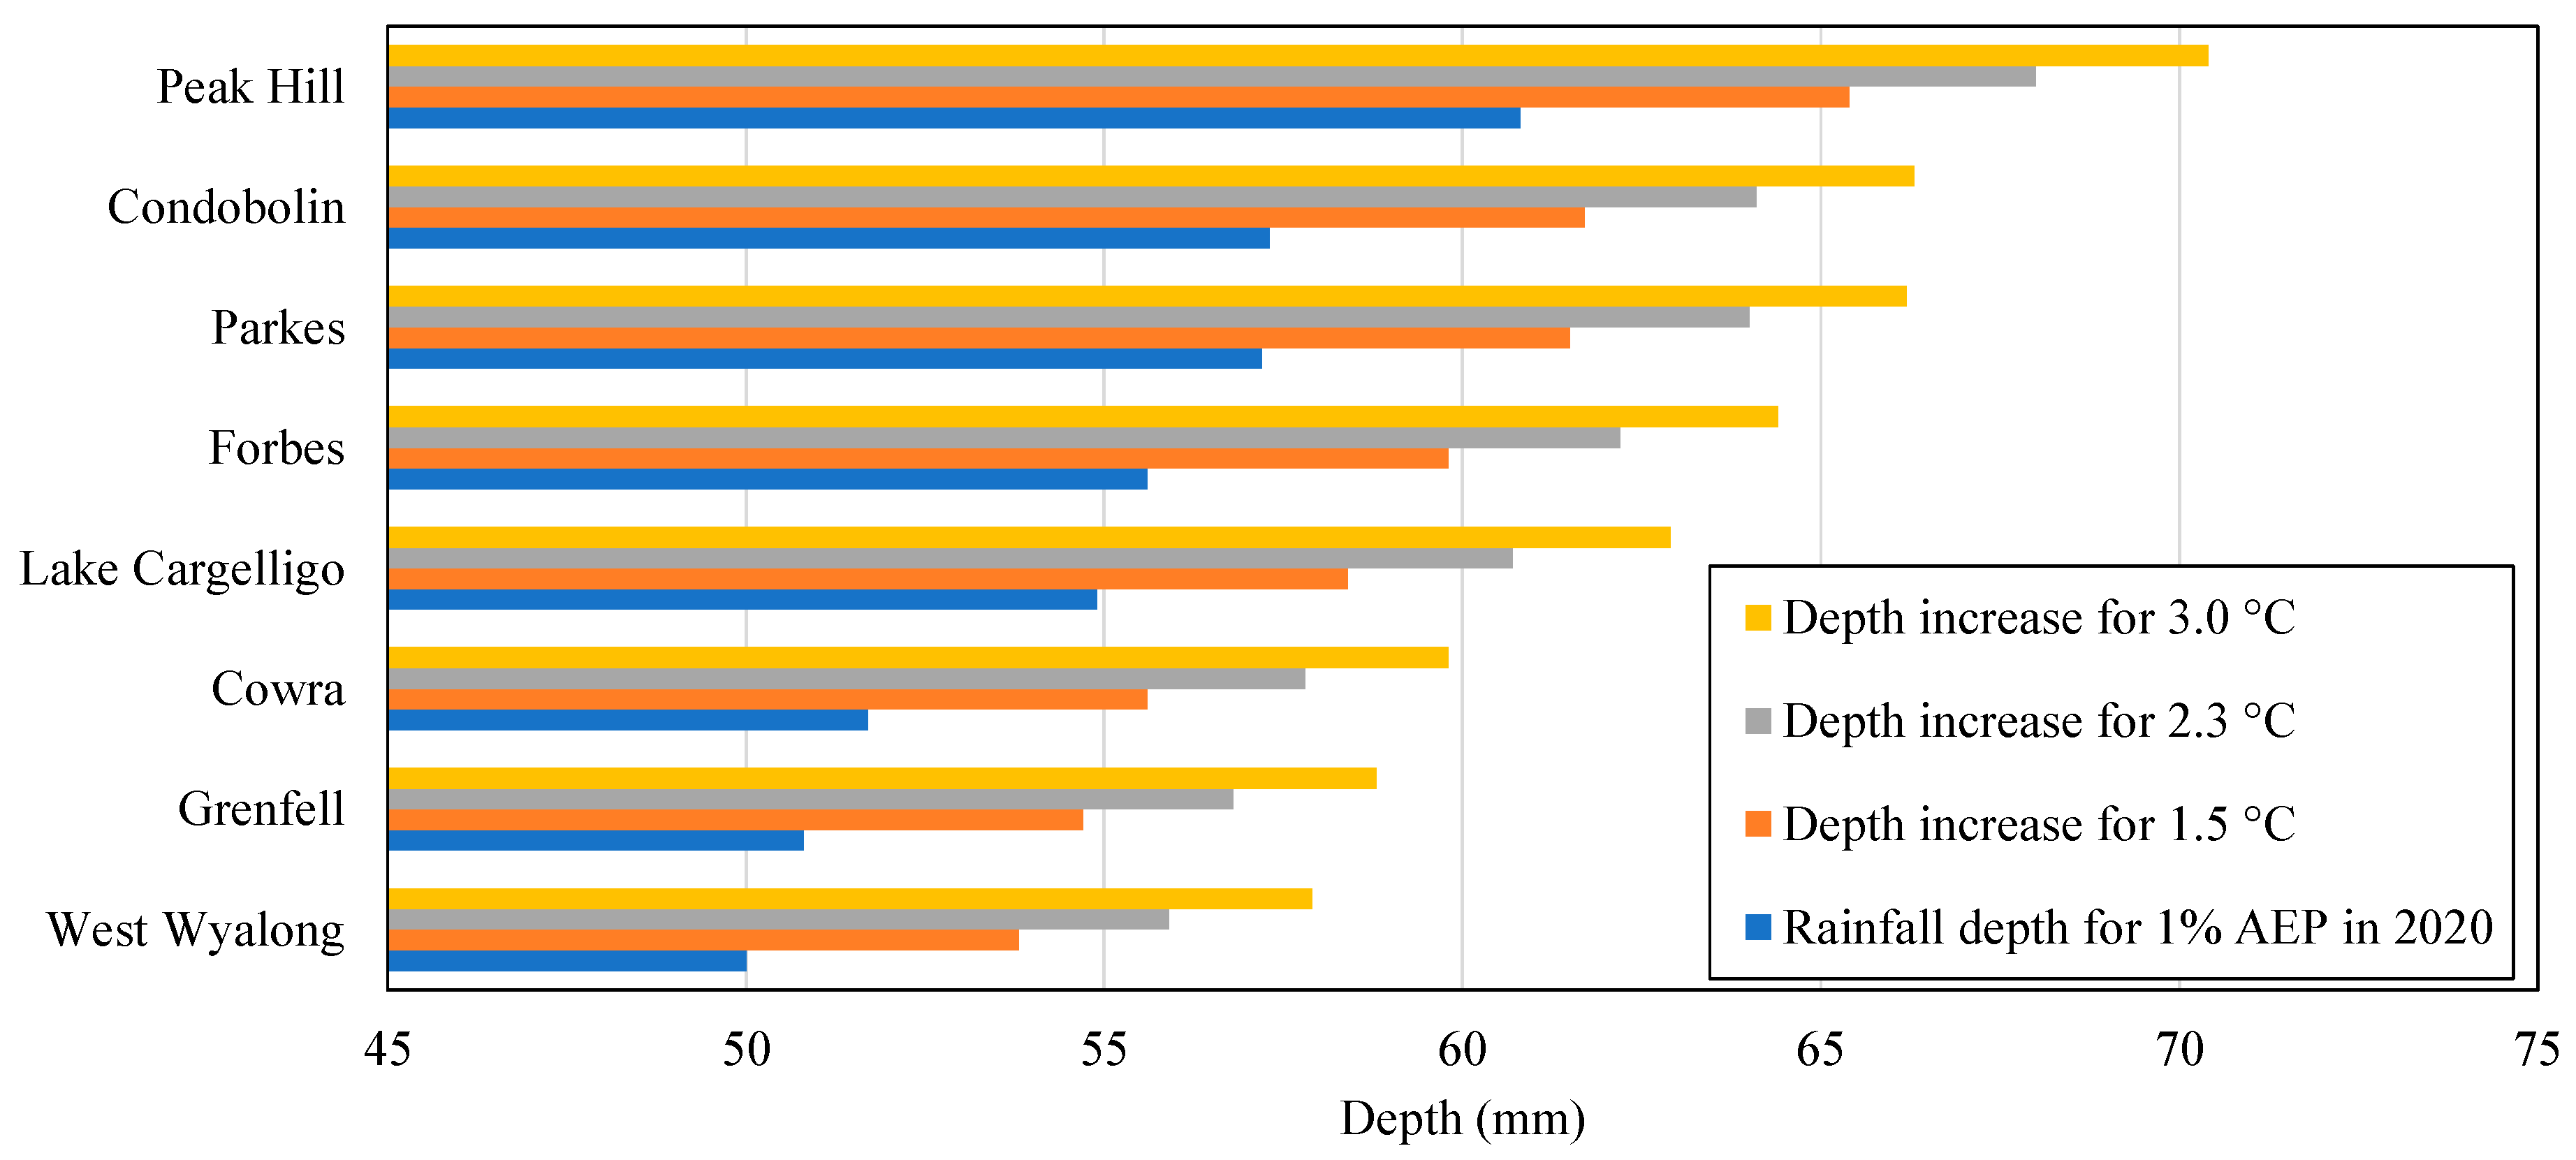
4. Results
5. Discussion
6. Conclusions
Author Contributions
Funding
Data Availability Statement
Acknowledgments
Conflicts of Interest
References
- Cleugh, H.; Smith, M.S.; Battaglia, M.; Graham, P. Climate Change: Science and Solutions for Australia; CSIRO Publishing: Clayton, Australia, 2011. [Google Scholar]
- Rana, A.; Moradkhani, H.; Qin, Y. Understanding the joint behaviour of temperature and precipitation for climate change impact studies. Theor. Appl. Climatol. 2017, 129, 321–339. [Google Scholar] [CrossRef]
- Quenum, G.M.; Nkrumah, F.; Klutse, N.A.; Sylla, M.B. Spatiotemporal Changes in Temperature and Precipitation in West Africa. Part I: Analysis with the CMIP6 Historical Dataset. Water 2021, 13, 3506. [Google Scholar] [CrossRef]
- Shikwambana, S.; Malaza, N.; Shale, K. Impacts of Rainfall and Temperature Changes on Smallholder Agriculture in the Limpopo Province, South Africa. Water 2021, 13, 2872. [Google Scholar] [CrossRef]
- Zerouali, B.; Al-Ansari, N.; Chettih, M.; Mohamed, M.; Abda, Z.; Santos, C.A.; Zerouali, B.; Elbeltagi, A. An Enhanced Innovative Triangular Trend Analysis of Rainfall Based on a Spectral Approach. Water 2021, 13, 727. [Google Scholar] [CrossRef]
- Espinosa, L.A.; Portela, M.M.; Matos, J.P.; Gharbia, S. Climate Change Trends in a European Coastal Metropolitan Area: Rainfall, Temperature, and Extreme Events (1864–2021). Atmosphere 2022, 13, 1995. [Google Scholar] [CrossRef]
- Jamali, M.; Gohari, A.; Motamedi, A.; Haghighi, A.T. Spatiotemporal Changes in Air Temperature and Precipitation Extremes over Iran. Water 2022, 14, 3465. [Google Scholar] [CrossRef]
- Todaro, V.; D’Oria, M.; Secci, D.; Zanini, A.; Tanda, M.G. Climate Change over the Mediterranean Region: Local Temperature and Precipitation Variations at Five Pilot Sites. Water 2022, 14, 2499. [Google Scholar] [CrossRef]
- Toni, A.T.; Malcherek, A.; Kassa, A.K. Agroclimatic Zone-Based Analysis of Rainfall Variability and Trends in the Wabi Shebele River Basin, Ethiopia. Water 2022, 14, 3699. [Google Scholar] [CrossRef]
- Wu, S.; Fu, F.; Wang, L.; Yang, M.; Dong, S.; He, Y.; Zhang, Q.; Guo, R. Short-Term Regional Temperature Prediction Based on Deep Spatial and Temporal Networks. Atmosphere 2022, 13, 1948. [Google Scholar] [CrossRef]
- Ahmad, K.; Banerjee, A.; Rashid, W.; Xia, Z.; Karim, S.; Asif, M. Assessment of Long-Term Rainfall Variability and Trends Using Observed and Satellite Data in Central Punjab, Pakistan. Atmosphere 2023, 14, 60. [Google Scholar] [CrossRef]
- Roozbahani, A.; Behzadi, P.; Bavani, A.M. Analysis of performance criteria and sustainability index in urban stormwater systems under the impacts of climate change. J. Clean. Prod. 2020, 271, 122727. [Google Scholar] [CrossRef]
- Karl, T.R.; Melillo, J.M.; Peterson, T.C. Global Climate Change Impacts in the United States; Cambridge University Press: Cambridge, MA, USA, 2009. [Google Scholar]
- Semadeni-Davies, A.; Hernebring, C.; Svensson, G.; Gustafsson, L.-G. The impacts of climate change and urbanisation on drainage in Helsingborg, Sweden: Suburban stormwater. J. Hydrol. 2008, 350, 114–125. [Google Scholar] [CrossRef]
- Cook, L.M.; McGuinnis, S.; Samaras, C. The effect of modelling choices on updating intensity-duration-frequency curves and stormwater infrastructure designs for climate change. Clim. Chang. 2020, 159, 289–308. [Google Scholar] [CrossRef] [Green Version]
- Safavi, H.R.; Sajjadi, S.M.; Raghibi, V. Assessment of climate change impacts on climate variables using probabilistic ensemble modelling and trend analysis. Theor. Appl. Climatol. 2017, 130, 635–653. [Google Scholar] [CrossRef]
- Wang, F.; Shao, W.; Yu, H.; Kan, G.; He, X.; Zhang, D.; Ren, M.; Wang, G. Re-evaluation of the power of the Mann-Kendall test for detecting monotonic trends in hydrometeorological time series. Front. Earth Sci. 2020, 8, 14. [Google Scholar] [CrossRef]
- Önöz, B.; Bayazit, M. Block Bootstrap for Mann-Kendall Trend Test of Serially Dependent Data. Hydrol. Process. 2012, 26, 3552–3560. [Google Scholar] [CrossRef]
- Mavromatis, T.; Stathis, D. Response of the water balance in Greece to temperature and precipitation trends. Theor. Appl. Climatol. 2011, 104, 13–24. [Google Scholar] [CrossRef]
- Westra, S.; Fowler, H.J.; Evans, J.P.; Alexander, L.V.; Berg, P.; Johnson, F.; Kendon, E.J.; Lenderink, G.; Roberts, N.M. Future changes to the intensity and frequency of short-duration extreme rainfall. Rev. Geophys. 2014, 52, 522–555. [Google Scholar] [CrossRef] [Green Version]
- Huang, J.; Fatichi, S.; Mascaro, G.; Manoli, G.; Peleg, N. Intensification of sub-daily rainfall extremes in a low-rise urban area. Urban Clim. 2022, 42, 101124. [Google Scholar] [CrossRef]
- IPCC. Climate Change 2022: Impacts, Adaption, and Vulnerability. Intergovernmental Panel on Climate Change—Technical Summary; IPCC: Geneva, Switzerland, 2022. [Google Scholar]
- ARR. Australian Rainfall and Runoff: A Guide to Flood Estimation—Book 1: Scope and Philosophy. Available online: http://www.arr-software.org/pdfs/ARR_190514_Book1.pdf (accessed on 6 May 2020).
- BoM. Bureau of Meteorology: 2016 IFDs (New). Available online: http://www.bom.gov.au/water/designRainfalls/revised-ifd/ (accessed on 6 May 2020).
- Dag, O.; Yozgatligil, C. GMDH: An R package for short term forecasting via GMDH-type neural network algorithms. R J. 2016, 8, 379–386. [Google Scholar] [CrossRef]
- Lake, R.W.; Shaeri, S.; Senevirathna, S.T.M.L.D. Review of the Limitations and Potential Empirical Improvements of the Parametric Group Method of Data Handling for Rainfall Modelling. J. Environ. Sci. Pollut. Res. 2022, 1–15. [Google Scholar] [CrossRef] [PubMed]
- Mann, H.B. Non-parametric tests against trend. Econometrica 1945, 13, 245–259. [Google Scholar] [CrossRef]
- Kendall, M.G. Rank Correlation Methods, 4th ed.; Charles Griffin: London, UK, 1975. [Google Scholar]
- Gocic, M.; Trajkovic, S. Analysis of changes in meteorological variables using Mann-Kendall and Sen’s slope estimator statistical tests in Serbia. Glob. Planet. Chang. 2013, 100, 172–182. [Google Scholar] [CrossRef]
- Sen, P.K. Estimates of the Regression Coefficient based on Kendall’s Tau. J. Am. Stat. Assoc. 1968, 63, 1379–1389. [Google Scholar] [CrossRef]
- Costa, A.C.; Soares, A. Homogenization of climate data: Review and new perspectives using geostatistics. Math. Geosci. 2009, 41, 291–305. [Google Scholar] [CrossRef]
- Kang, H.M.; Yusof, F. Homogeneity Tests on Daily Rainfall Series in Peninsular Malaysia. Int. J. Contemp. Math. Sci. 2012, 7, 9–22. [Google Scholar]
- Javari, M. Trend and Homogeneity Analysis of Precipitation in Iran. Climate 2016, 4, 44. [Google Scholar] [CrossRef] [Green Version]
- Mahmood Agha, O.M.A.; Çağatay Bağçacı, S.; Şarlak, N. Homogeneity Analysis of Precipitation Series in North Iraq. IOSR J. Appl. Geol. Geophys. 2017, 5, 57–63. [Google Scholar] [CrossRef]
- RDA. Our Region: Central West; Regional Development Australia: Canberra, Australia, 2020.
- MacFarlane, J.; Blackwell, B.D.; Mounter, S.W. Good gardening for a perennial economy: What’s the optimal growth for a regional economy? In Proceedings of the Asia Pacific Conference on Business and Social Sciences 2015, Kuala Lumpur, Malaysia, 23–24 November 2015. [Google Scholar]
- BoM. Bureau of Meteorology: Climate Data Online. Available online: http://www.bom.gov.au/climate/data/ (accessed on 6 May 2020).
- GMDH. The Best Time Series Analysis Solution in 2021. GMDH Shell Version 3.0. Available online: https://gmdhsoftware.com/time-series-analysis-software (accessed on 10 October 2021).
- Addinsoft. XLSTAT BASIC: Explore, Visualise and Model Your Data in One Interface. Available online: https://www.xlstat.com/en/solutions/basic/ (accessed on 20 January 2021).
- Wang, B.; Liu, D.E.; Asseng, S.; Macadam, I.; Yu, Q. Impact of climate change on wheat flowering time in eastern Australia. Agric. For. Meteorol. 2015, 209–210, 11–21. [Google Scholar] [CrossRef]
- OEH. Western Enabling Regional Adaptation—Central West and Orana Region Report; NSW Office of the Environment and Heritage: Sydney, Australia, 2017.
- Jain, S.K.; Kumar, V.; Saharia, M. Analysis of rainfall and temperature trends in northeast India. Int. J. Climatol. 2013, 33, 968–978. [Google Scholar] [CrossRef]


| Station Location | LGA | Commenced Recording Data | Site Number | Latitude (°S) | Longitude (°E) | Elevation (m) |
|---|---|---|---|---|---|---|
| Condobolin Ag Research St | Lachlan | 1954 | 50052 | 33.07 | 147.23 | 195 |
| Condobolin Airport | Lachlan | 1993 | 50137 | 33.07 | 147.21 | 193 |
| Cowra Airport | Cowra | 2004 | 65111 | 33.84 | 148.65 | 300 |
| Forbes Airport | Forbes | 1966 | 65103 | 33.36 | 147.92 | 230 |
| Grenfell Manganese Road | Weddin | 1995 | 73014 | 33.89 | 148.15 | 390 |
| Lake Cargelligo Airport | Lachlan | 1885 | 75039 | 33.28 | 146.37 | 169 |
| Parkes Airport | Parkes | 1881 | 65068 | 33.13 | 148.24 | 323 |
| Peak Hill Post Office | Parkes | 1941 | 50031 | 32.72 | 148.19 | 285 |
| West Wyalong Airport | Bland | 1890 | 50017 | 33.94 | 147.20 | 257 |
| Wyalong Post Office | Bland | 1999 | 73054 | 33.93 | 147.24 | 245 |
| Station Location | Site Number | SSE | GMDH | R2 |
|---|---|---|---|---|
| Condobolin Ag Research St | 50052 | 0.036 | 0.026 | 0.921 |
| Condobolin Airport | 50137 | 0.076 | 0.084 | 0.916 |
| Cowra Airport | 65111 | 0.050 | 0.059 | 0.951 |
| Forbes Airport | 65103 | 0.050 | 0.042 | 0.941 |
| Grenfell Manganese Road | 73014 | 0.031 | 0.025 | 0.928 |
| Lake Cargelligo Airport | 75039 | 0.055 | 0.053 | 0.923 |
| Parkes Airport | 65068 | 0.046 | 0.040 | 0.917 |
| Peak Hill Post Office | 50031 | 0.046 | 0.038 | 0.919 |
| West Wyalong Airport | 50017 | 0.069 | 0.068 | 0.930 |
| Wyalong Post Office | 73054 | 0.042 | 0.024 | 0.957 |
Disclaimer/Publisher’s Note: The statements, opinions and data contained in all publications are solely those of the individual author(s) and contributor(s) and not of MDPI and/or the editor(s). MDPI and/or the editor(s) disclaim responsibility for any injury to people or property resulting from any ideas, methods, instructions or products referred to in the content. |
© 2023 by the authors. Licensee MDPI, Basel, Switzerland. This article is an open access article distributed under the terms and conditions of the Creative Commons Attribution (CC BY) license (https://creativecommons.org/licenses/by/4.0/).
Share and Cite
Lake, R.W.; Shaeri, S.; Senevirathna, S.T.M.L.D. Temperature Modeling with the Group Method of Data Handling to Inform Projected Rainfall Depth Changes for Extreme Events in Central West, New South Wales, Australia. Water 2023, 15, 268. https://doi.org/10.3390/w15020268
Lake RW, Shaeri S, Senevirathna STMLD. Temperature Modeling with the Group Method of Data Handling to Inform Projected Rainfall Depth Changes for Extreme Events in Central West, New South Wales, Australia. Water. 2023; 15(2):268. https://doi.org/10.3390/w15020268
Chicago/Turabian StyleLake, Ronald William, Saeed Shaeri, and S. T. M. L. D. Senevirathna. 2023. "Temperature Modeling with the Group Method of Data Handling to Inform Projected Rainfall Depth Changes for Extreme Events in Central West, New South Wales, Australia" Water 15, no. 2: 268. https://doi.org/10.3390/w15020268