Article

Comparative Analysis of Metagenomic (Amplicon and Shotgun) DNA Sequencing to Characterize Microbial Communities in Household On-Site Wastewater Treatment Systems

Department of Biology, McMaster University, Hamilton, ON L8S 4L8, Canada
*
Author to whom correspondence should be addressed.
Water 2023, 15(2), 271; https://doi.org/10.3390/w15020271
Submission received: 1 November 2022 / Revised: 26 December 2022 / Accepted: 31 December 2022 / Published: 9 January 2023

Abstract

:
The performance of on-site wastewater treatment systems (OWTSs) can be improved by altering digester design and by manipulating environmental variables that affect microbial community composition. Community composition can potentially be assessed using high-throughput DNA sequencing, but the two most common methods of community DNA sequencing (16S and shotgun sequencing) generally yield different taxonomic identification profiles and can perform differently according to the sampled environment. To evaluate the use of these two approaches in monitoring OWTS operation, we conducted a comparative parallel analysis using both 16S rDNA and shotgun sequencing in a controlled field study. Results indicate that when examining microorganisms above 0.1% relative abundance, 16S and shotgun sequencing produced similar results in terms of individual sample species richness and between-sample community similarity. However, shotgun sequencing provided comparatively higher taxonomic richness for the bacterial communities with lower abundance in the OWTSs. In addition, 16S sequencing resolved only 48 out of 188 bacterial communities identified by shotgun sequencing (using a 0.1% abundance cutoff). Three key bacterial genera (Desulfomicrobium, Simplicispira, and Phenylobacterium) in anaerobic digestion processes were differentially abundant for both sequencing methods. These data indicate that both sequencing methods provide similar overall profiles for bacterial communities in anaerobic digestor systems. However, shotgun sequencing provides significantly (p-value < 0.01) higher taxonomic richness overall. Thus, shotgun sequencing provides a more robust taxonomic and functional profile that can be used for the optimization of anaerobic digestor systems.

1. Introduction

The release of improperly-treated wastewater into the environment poses a risk to human health and local ecosystems [1,2]. Wastewater from underperforming or failing wastewater treatment systems can contribute to the spread of waterborne pathogens through contamination of recreational or drinking water [3,4]. In addition to harmful microorganisms, poorly treated wastewater contains nitrogenous and phosphorous compounds [5] that can promote the growth of harmful algal blooms [6]. When access to large-scale sewage systems is unavailable, on-site septic tanks are the most common wastewater treatment method [7]. However, if the anaerobic digestion process within these tanks is too slow, sediment accumulation can cause wastewater to bypass the system entirely [7].
Research to improve the digestion rate of these systems can involve experimental comparison of designs and treatment strategies [8], isolation and study of key species in the anaerobic digestion process [9], and predictive modelling of anaerobic digestion systems based on known biological responses to physical and chemical variables such as temperature and pH [10]. However, the biochemical steps that make up the anaerobic digestion process (hydrolysis, acidogenesis, acetogenesis, and methanogenesis) are distributed across complex syntrophic interactions [11], which need to be taken into consideration when studying individual species and conditions [12] or when trying to predict the functions of the whole microbial ecosystem [10]. Therefore, improving the function and design of household OWTSs and larger anaerobic digestion systems depends on an improved understanding of the ongoing syntrophic processes within those systems.
The two most commonly used DNA-based methods for examining microbial ecological processes such as anaerobic digestion are whole-metagenome sequencing (commonly referred to as shotgun sequencing) and 16S amplicon sequencing [13]. The results of these two methods are usually consistent in terms of community similarity [14,15,16]. However, shotgun and 16S sequencing typically differ in terms of alpha diversity measurements and relative abundance measurements due to the identification of more low-abundance taxa by shotgun sequencing [15,17]. Low-abundance identifications using shotgun sequencing can provide a more comprehensive view of the microbiome than 16s sequencing, but they rely on databases that may lack reference sequences from infrequently sequenced environments [18]. For example, a 2017 analysis of Brazilian river basins using 16S and shotgun sequencing revealed that insufficient reference sequence availability contributed to more taxa being identified by 16S sequencing than shotgun sequencing, making 16S sequencing a more suitable method at that time in that environment [16].
The 16S reference databases are easier to develop than shotgun sequencing databases and have had more time to do so [16,19]. However, the analysis of specific amplicons creates limitations that are not present when using shotgun sequencing. These limitations include identical 16S rDNA sequences preventing species-level identification [20], variations in observed community composition based on which the 16S hypervariable region was sequenced [14], and a reliance on known microbial functions to assess biochemical processes within a microbiome [21]. For example, a 2019 analysis of wastewater effluent pathogens found that taxonomic identification based on sequencing of the 16S V4 hypervariable region was unable to identify key pathogens within the Enterobacteriaceae family, making 16S sequencing an unsuitable tool for assessing pathogens in this environment [22]. Additionally, the taxonomic results produced by these two sequencing methods can differ according to errors that are unique to their library preparation processes [23] or errors specific to the tools available for processing 16 S and shotgun data [24].
Therefore, the potential discrepancies between 16S and shotgun sequencing must be examined in relation to specific environments to identify the research goals that can be reliably met using those methods. These potential sources of error have not been assessed in the context of OWTS wastewater microbiomes, nor have the analytical steps taken in comparing the effects of OWTS designs on those microbiomes. In this study, wastewater samples from septic tank OWTSs were sequenced using both 16S and shotgun sequencing to assess the differences between OWTS microbial communities according to tank design variables and to assess the differences in the results of these analyses between the two sequencing methods.

2. Materials and Methods

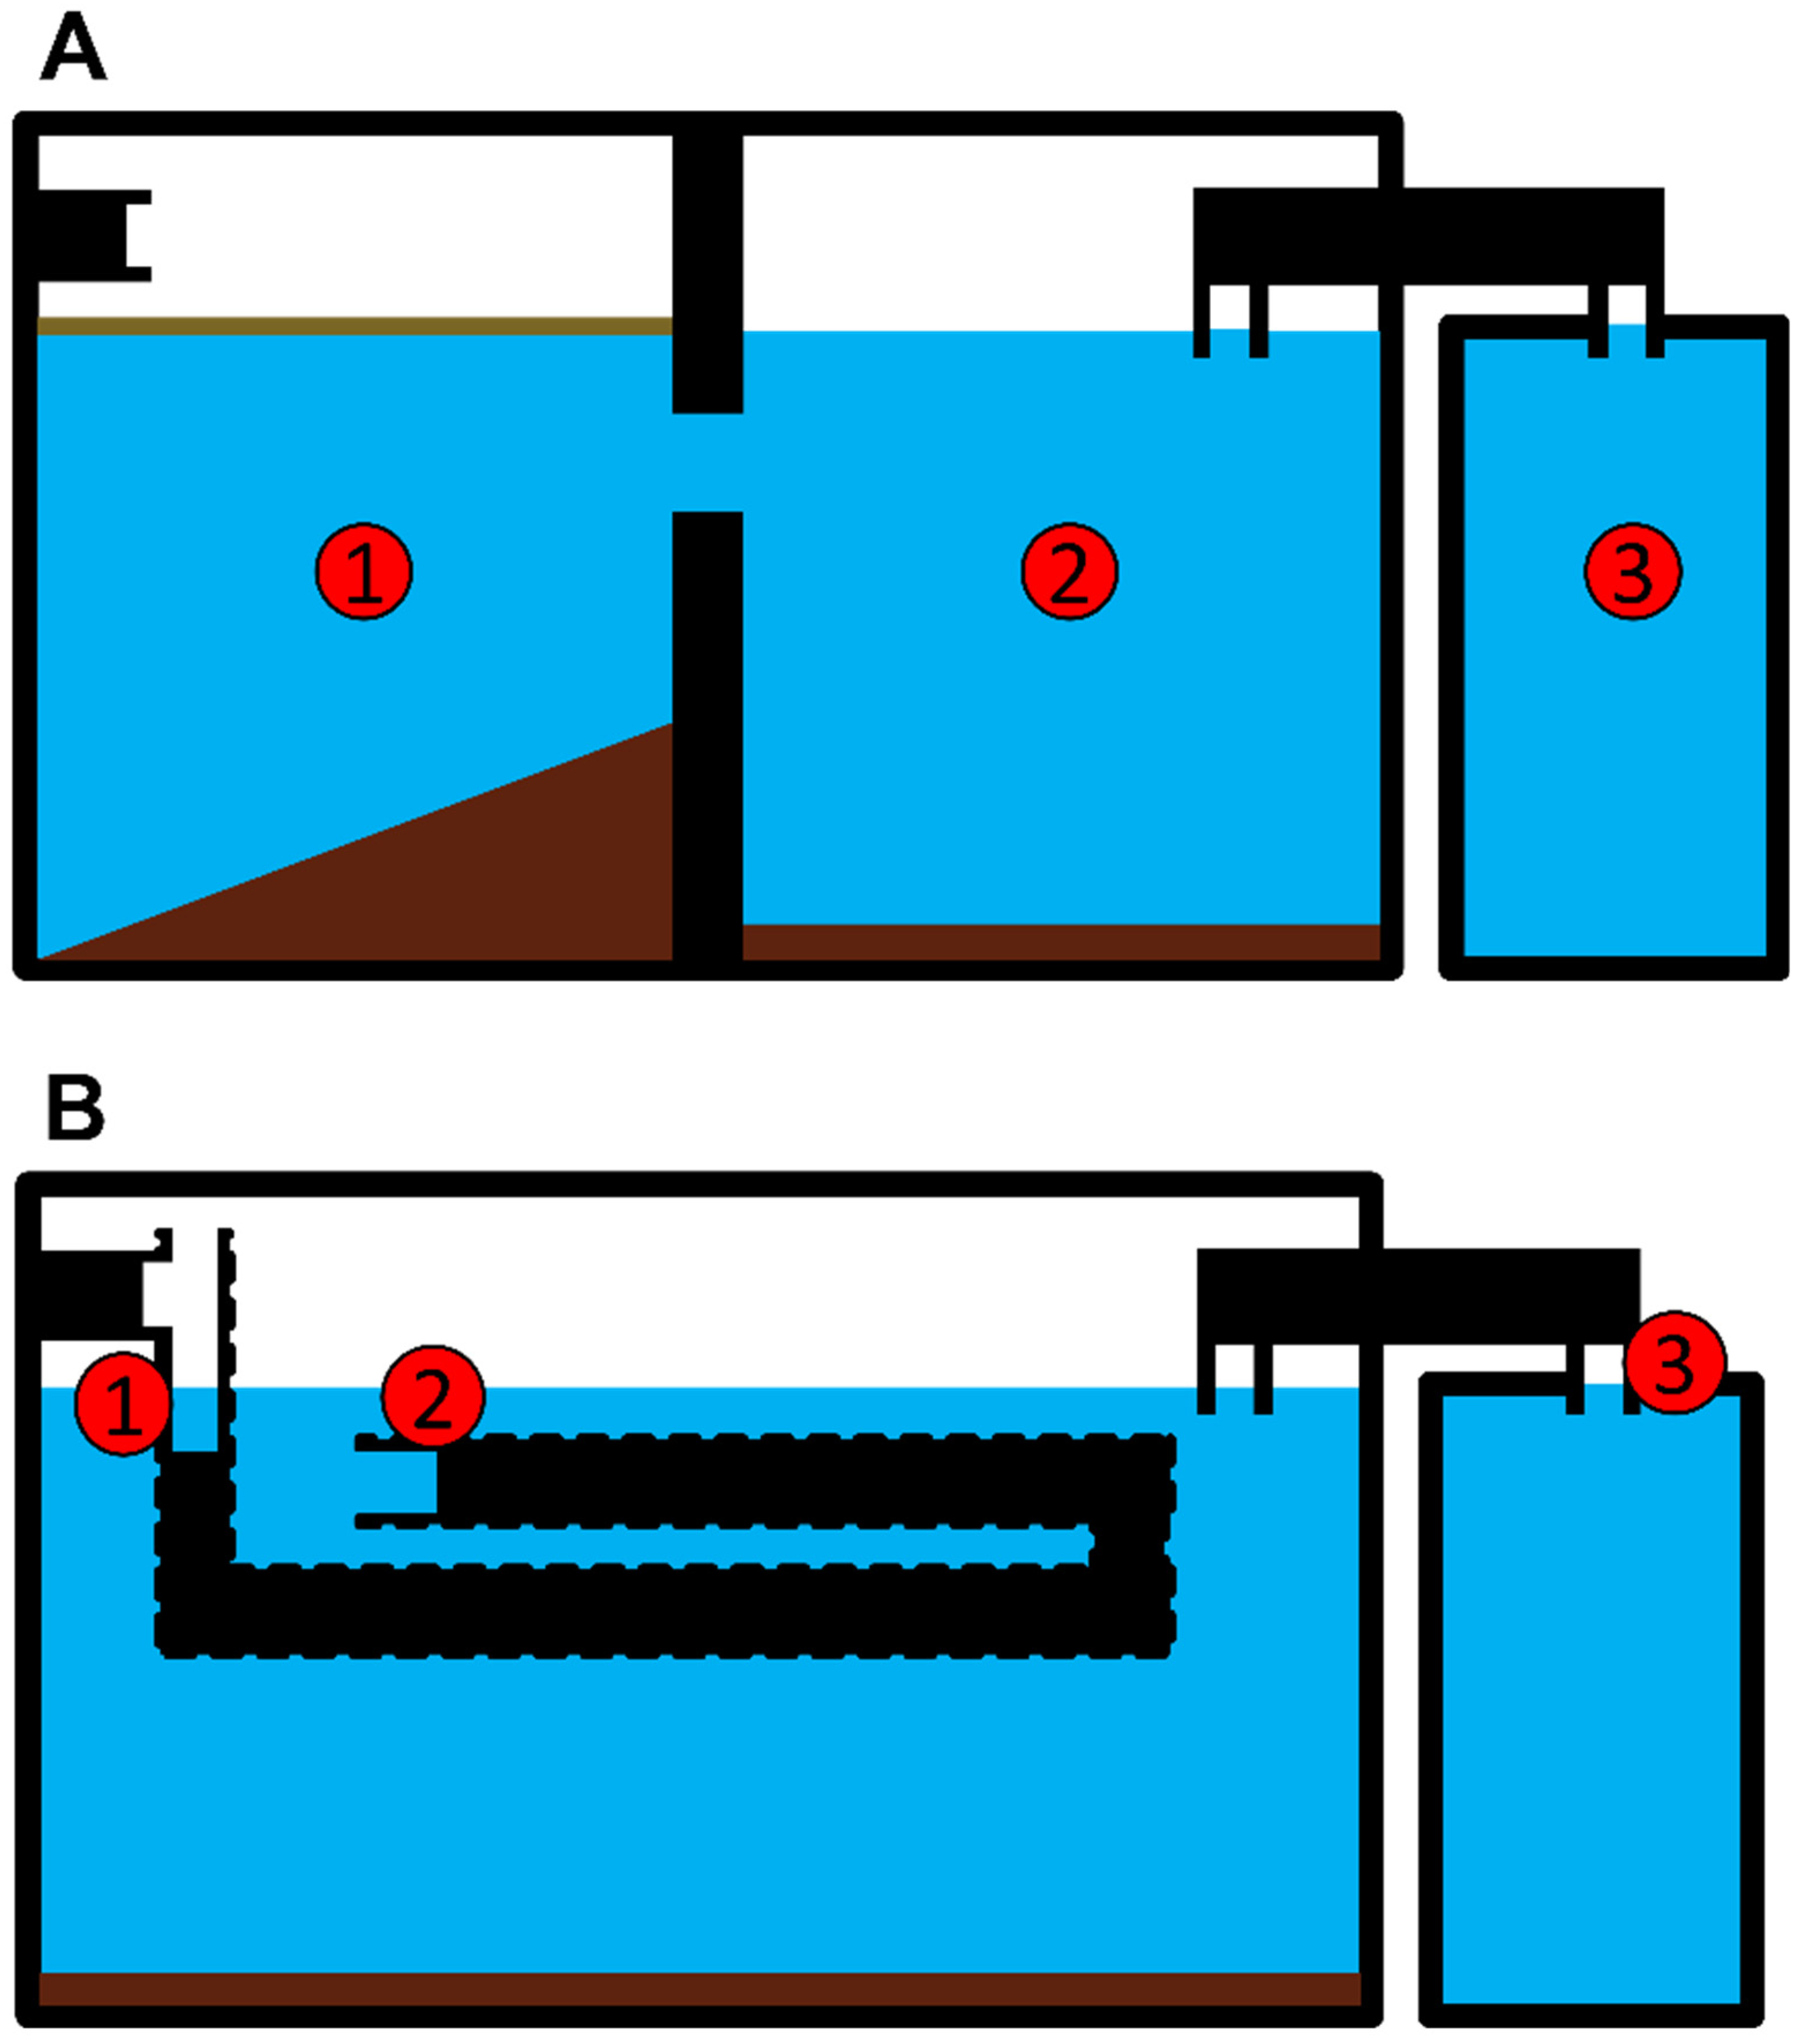
2.1. Sampling Site Description

The examined OWTSs were all residential installations serving single households. Four distinct system types were tested, each consisting of either a single-pass or recirculating flow type and a conventional two-chambered design or a plug-flow-like design in which waste first passed through an inner tube [11] (see Figure 1). These four system types were labelled single-pass plug flow (S.P.), single-pass conventional (S.C.), recirculating plug flow (R.P.), and recirculating conventional (R.C.). Conventional OWTSs include a holding tank after the two-chambered main tank. All sampled OWTSs also included an aerobic biofilter unit after the initial anaerobic unit. However, this secondary aerobic system was not examined, as the focus of this study was the anaerobic digestion process. The detailed procedure pertaining to sampling can be accessed through our previous publication [11].
OWTSs with recirculating designs contained an inline valve to direct a portion of the effluent from the aerobic biofilter back to the influent point of the anaerobic OWTS. The degree to which each valve was open is listed as a percentage in the Supplementary Data. The recirculating valves were set by our industrial partner (Waterloo Biofilter Systems Inc., Waterloo, ON, Canada) and could not be controlled as part of this study. The hydraulic retention time of each tank was calculated using the system volume (L) divided by the flow rate (L/day).

2.2. Sampling Procedure

Samples (50 mL each) were collected between September 2018 and January 2019 from OWTSs located across Southern and Central Ontario. Six OWTSs were sampled for each design and flow combination, with the exception of the S.P. systems, for which five systems were sampled. Each system was sampled at three points (Figure 1). Temperature measurements were also taken during sampling.
Wastewater samples were placed on ice and transported in coolers to McMaster University. The location, temperature, and design variables of each wastewater sample are listed in Supplementary Data.

2.3. DNA Extraction

After samples were received at McMaster University, they were vacuum-filtered through 0.22 um sterile nitrocellulose filters (Milipore, Burlington, MA, USA) [25,26]. The filters were then transferred to microcentrifuge tubes preloaded with 0.25 g mL of 0.1 mm zirconium beads [27] (BioSpec Products, Bartlesville, OK, USA) and stored at −20 °C. DNA was extracted from the filters using a Norgen Soil DNA Isolation Plus Kit (Norgen Biotek, Thorold, ON, Canada). The manufacturer’s extraction procedure was followed unless otherwise specified. After extraction and purification, the DNA was stored at −20 °C. DNA was quantified using a NanoDro2000 (Thermo Fischer Scientific, Waltham, MA, USA) and a Qubit 2.0 fluorometer (Thermo Fisher Scientific, Waltham, MA, USA).

2.4. Shotgun Sequencing, Quality Control, and Classification

DNA was sequenced at the Farncombe Sequencing Institute at McMaster University using an Illumina HiSeq 2500 platform. Paired-end libraries were prepared using an NEBNext® Ultra™ II DNA library preparation kit for Illumina (New England Biolabs, Ipswich, MA, USA) and TruSeq3 paired-end adapters. The read length was 150 bp, and the fragment size was 500 bp. Read quality was assessed using the R package fastqcr [28]. FASTQ files were trimmed using Trimmomatic (version 0.39) (Bolger et al., 2014). The Phred score cutoff for Trimmomatic was set to 33, and sequences were trimmed using a sliding window with three leading and trailing base pairs, a width of 4 bases, and a minimum quality score of 20. Trimmomatic also removed the TruSeq3 paired-end adapters.
All reverse reads were removed from the dataset due to the tendency for Illumina sequencing to produce low-quality reverse reads [29], a lack of overlapping reads, and the inability of DIAMOND-BLASTx to process paired-end reads [30]. After trimming, the mean count of high-quality forward reads was 5.3 million (SD ± 1.6 million).
DNA reads were aligned against the NCBI non-redundant (nr) protein database using DIAMOND-BLASTx [30]. The e-value cutoff was set at 1 × 10⁻⁵, and the maximum number of target sequences to alignment reports was 25 per query. All other options for DIAMOND-BLASTx were left as the default. The diamond alignment archive (.daa) output was inputted into MEGAN6 (version 6.18.4) [31] for binning and classification. Sequences were binned according to the MEGAN6 weighted lowest common ancestor algorithm. The minimum quality threshold to assign sequences was 50, and the e-value threshold was 0.01.

2.5. 16S Amplification, Sequencing, Quality Control, and Classification

The 16S V4 hypervariable region was amplified using a two-stage PCR protocol [32]. The 1st PCR stage amplified the V4 hypervariable region, and the 2nd stage attached the adapters for Illumina sequencing and indices for dual-index sample multiplexing [33]. Indices were taken from the Nextera XT Index Kit v2 (Illumina, San Diego, CA, USA). A T100 Thermocycler (Bio-Rad Laboratories, Mississauga, ON, Canada) was used to perform PCR reactions. The PCR template was diluted to 15 ng/uL using double-distilled water and a NanoDrop 2000 (ThermoFisher Scientific, Waltham, MA, USA).
The resulting PCR products were separated by gel electrophoresis to confirm that the correct size of amplicon was produced. Five uL of each product was pooled for gel extraction. Target bands were extracted. Extraction and cleanup were performed in triplicate. Pooled PCR products were run on 1.8% agarose gel for each extraction. The gels were examined under 302 nm UV light to identify target bands. Target bands were removed, immersed in a guanidinium thiocyanate solution, and dissolved at 50 °C.
A NucleoSpin Gel and PCR cleanup kit (Macherey-Nagel GmbH) was used for PCR cleanup. Spin columns were washed with ethanol solution three times and dried using a heat block for 1 min at 70 °C. NucleoSpin buffer solution was used to elute DNA from each column. Triplicate extractions were then pooled for sequencing. The quality of DNA isolation was verified using a NanoDrop 2000 (Thermo Fisher Scientific, Waltham, MA, USA).
DNA amplicon samples were sequenced on an Illumina MiSeq platform (Illumina, San Diego, CA, USA). Sequencing was performed using a paired-end 300 bp sequencing configuration (REF). Adapters were trimmed using cutadapt (version 1.2.1) [34]. Sequence quality trimming and filtering, error modelling, and sequence variant assignment were performed using the DADA2 R package and the SILVA 132 SSU reference dataset [35].

2.6. Statistical Analysis

Shotgun sequencing identification with taxonomic levels labelled as “not ranked” by the NCBI database were removed using the taxonomizr R package (version 0.8.0). The DADA2 and MEGAN6 taxonomic labels were reformatted to match the standard taxonomic ranks from kingdom to species to be compatible downstream with the phyloseq (version 1.32.0) R package [36]. From this step onward, the taxonomic identifications produced by 16S and shotgun sequencing were treated identically.
A total of 12 OWTSs were sequenced using shotgun sequencing, and 23 systems were sequenced using 16S amplicon sequencing. Samples were matched between the available 16S and shotgun sequencing data. The final dataset included 36 metagenomes, representing 12 systems sampled at the influent, tank, and effluent points. These 12 systems represented three systems from each OWTS type (S.P., S.C., R.P., and R.C.).
The community composition datasets produced by 16S and shotgun sequencing were compared using only samples taken from the central portion of the system (see Figure 1) and not the influent or effluent points. The effluent point was not examined because of the inclusion of a holding tank in the conventional systems, which may have altered the microbial community composition.
Species identifications produced by shotgun sequencing were binned into their respective genera to facilitate comparison to the 16S dataset. After genera binning, both datasets were filtered to remove taxa representing less than 0.1% of the total microbial abundance. This abundance filtering step was included to examine differences in low-abundance taxa identified by 16S and shogun sequencing. This step was repeated using thresholds of 0.05% and 0.2% relative abundance to examine the consistency with which taxonomic identifications responded to abundance filtering.
The observed species richness of 16S and shotgun sequencing taxonomic identifications were calculated at multiple stages of data treatment (raw, filtered, genera-binned, and genera-binned then filtered) using the iNEXT R package [37] to examine differences in microbial diversity according to the sequencing method and data treatment. The iNEXT package also extrapolated true taxonomic richness from rarefaction curves.
To examine patterns of community differentiation, filtered and genera-binned taxonomic data were normalized using DESeq2 (version 1.28.1) [38]. Phyloseq was then used to create Bray–Curtis dissimilarity matrices [39]. These Bray–Curtis dissimilarity matrices were used in PERMANOVA testing [40], which was performed using the VEGAN adonis2 function to determine the significance of sample clustering according to system design (conventional or plug flow), flow type (single-pass or recirculating), tank volume, flow rate, and temperature. The adonis2 function assessed variables non-sequentially. The results of PERMANOVA analysis produced using 16S and shotgun sequencing data were compared to identify discrepancies in the environmental and design variables that were found to be significant.
The microbiomes observed using 16S and shotgun sequencing were also compared for overlap in total identified taxa and differences in the core microbiome present across samples.
The same Bray–Curtis dissimilarity matrices used in the PERMANOVA testing were used to create non-metric dimensional scaling (NMDS) ordinations [41,42] using the phyloseq ordinate function to visualize potential clustering patterns created by OWTS design and flow type. The overall pattern of community dissimilarity produced using 16S and shotgun sequencing was compared using Procrustes analysis to quantify the difference between the microbial communities depicted by each sequencing method.
Raw taxonomic identifications produced using shotgun sequencing and 16S sequencing that were significantly differentially abundant (p > 0.05) according to the DESeq2 Wald test were examined to determine the effect of OWTS design and flow type on specific taxa. The results of differential abundance analysis produced using 16S and shotgun sequencing were compared to assess the consistency with which taxa displayed differential abundance according to system design and flow type. The formula used in DEseq2 to assess the effect of flow type while controlling for design was (~ Design + Flow), and the DEseq2 formula to assess the effect of design while controlling for flow type was (~ Flow + Design). The functional significance of differentially abundant taxa was also compared between 16S and shotgun sequencing results.

3. Results and Discussion

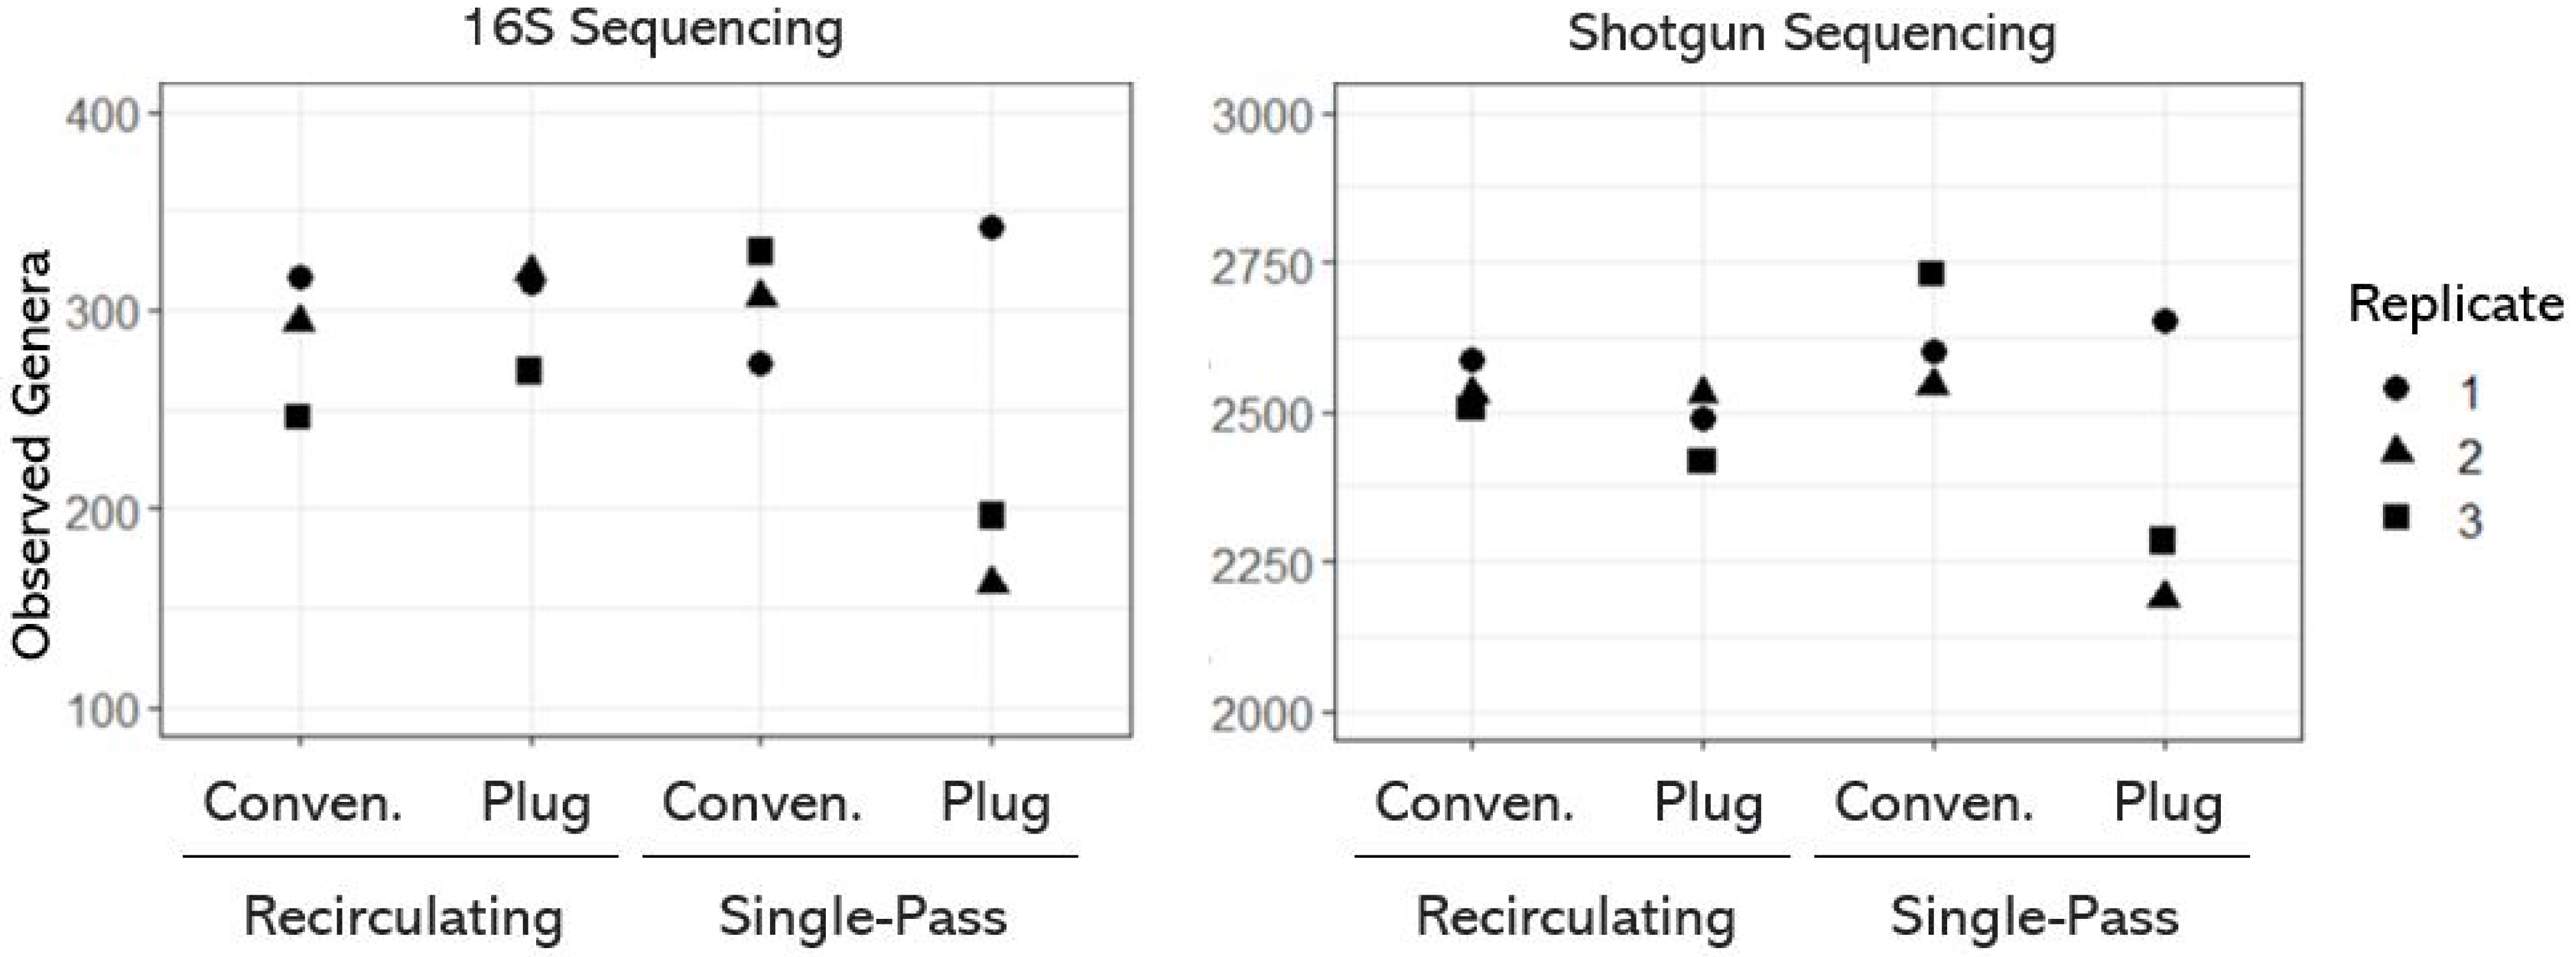
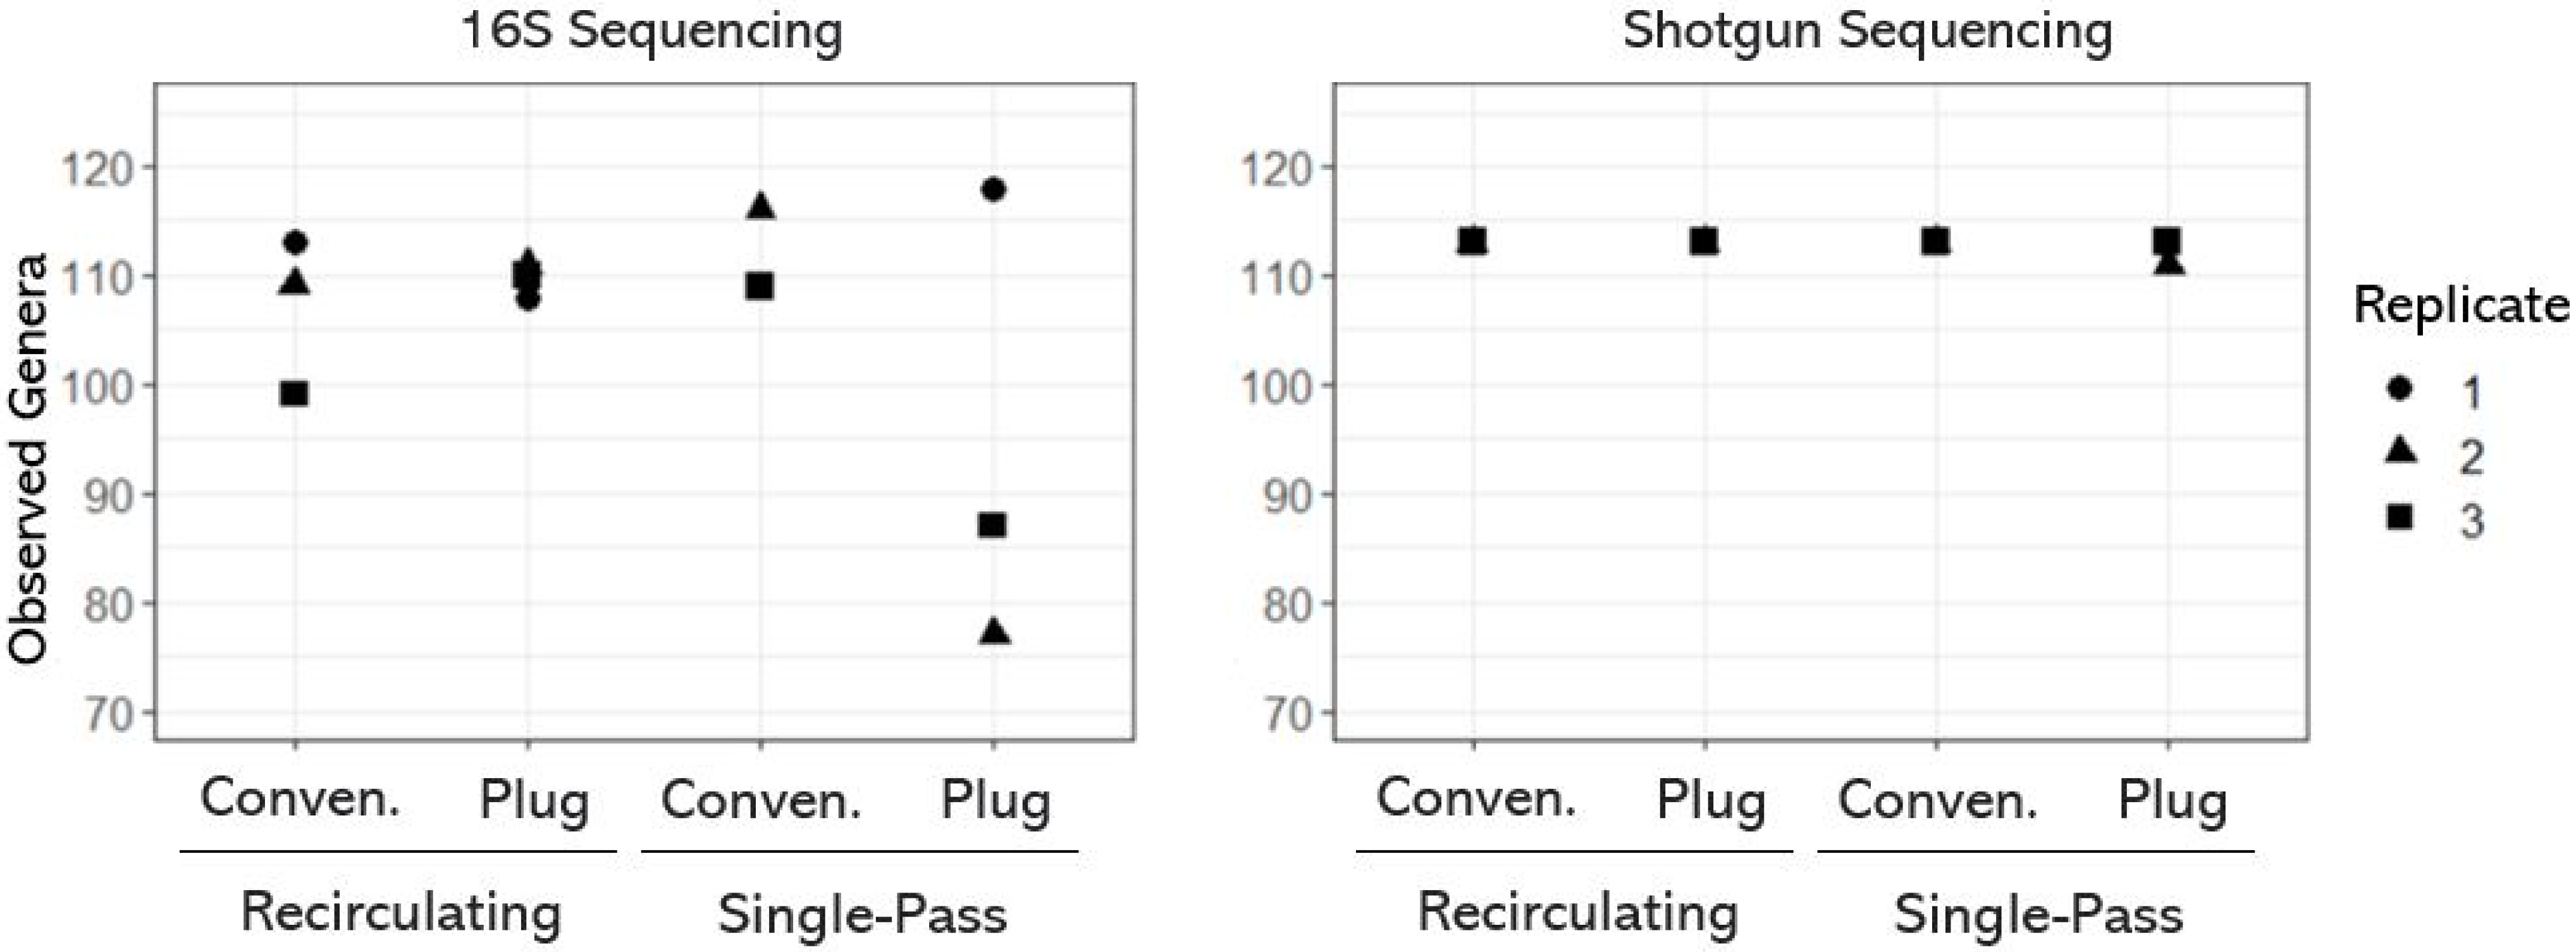
3.1. Taxonomic Diversity (or Richness) of OWTS Microbial Communities

Shotgun sequencing can detect more low-abundance taxa than 16S sequencing [15]. However, the differences between 16S and shotgun sequencing taxonomic identification results also depend on DNA extraction efficiency and reference genome availability [16]. To assess differences in the total identifications made by 16S and shotgun sequencing of OWTS microbiomes, we compared the taxonomic richness depicted by each sequencing method. We repeated this comparison to determine how the differences between 16S and shotgun sequencing identifications are affected by data treatment steps such as binning species-level taxonomic assignments into their respective genera and filtering out low-abundance (0.1%) taxa. The number of identified taxa in each type of OWTS was also compared to identify differences in the trends between system types depicted by 16S and shotgun sequencing. When comparing the numbers of total observed taxa in each OWTS, single-pass plug-flow-type reactors displayed the most variation in taxonomic richness between each system (see Figure 2). The 16S and shotgun sequencing datasets included different identification counts but identified similar patterns of relative abundance between each OWTS (see Figure 2). Once the taxa were filtered to remove identifications below 0.1% relative abundance, the overall numbers of taxa identified were similar. However, the pattern of relative taxonomic richness between OWTS sequenced by shotgun sequencing was lost in the filtering step (see Figure 3).
The total and average species and total taxa count using taxonomic relative abundance cutoffs of 0.05%, 0.1%, and 0.2% are listed in Supplementary Data.
The shotgun sequencing taxonomic identification results from 12 OWTSs initially included 23,819 distinct identifications with an average of 12,837 identifications per system. There was a 22.6% increase between the average observed species richness and the average true species richness predicted by the iNEXT package. After genera binning, the shotgun sequencing data included 3045 distinct identifications with an average of 2505 identified taxa per sample. After abundance filtering, the shotgun sequencing data included 121 distinct identifications with an average of 120 identifications per sample. After abundance filtering followed by genera binning, the shotgun sequencing data included 113 distinct identifications with an average of 113 identifications per sample.
The 16S sequencing taxonomic identification results initially included 3365 distinct ASVs, with an average of 550 distinct ASVs per sample. There was a 1.4% increase between the average observed taxonomic richness and the average true taxonomic richness predicted by the iNEXT package.
After genera binning, the 16S sequencing data included 809 distinct ASVs with an average of 277 distinct ASVs per sample. After abundance filtering, 16S sequencing included 149 distinct ASVs with an average of 88 distinct ASVs per sample. After genera-binning followed by abundance filtering (0.1%), the 16S sequencing data included 123 distinct ASVs with an average of 96 distinct ASVs per sample.
The numbers of taxa that we identified using 16S and shotgun sequencing were different (shotgun total = 23,819; 16S total = 3365). However, when examining taxa with relative abundances higher than 0.1%, the taxonomic richness measured by 16S sequencing was close to the taxonomic richness measured by shotgun sequencing (shotgun total = 113; 16S total = 123). Between 16S and shotgun sequencing, were 188 taxa above 0.1% relative abundance

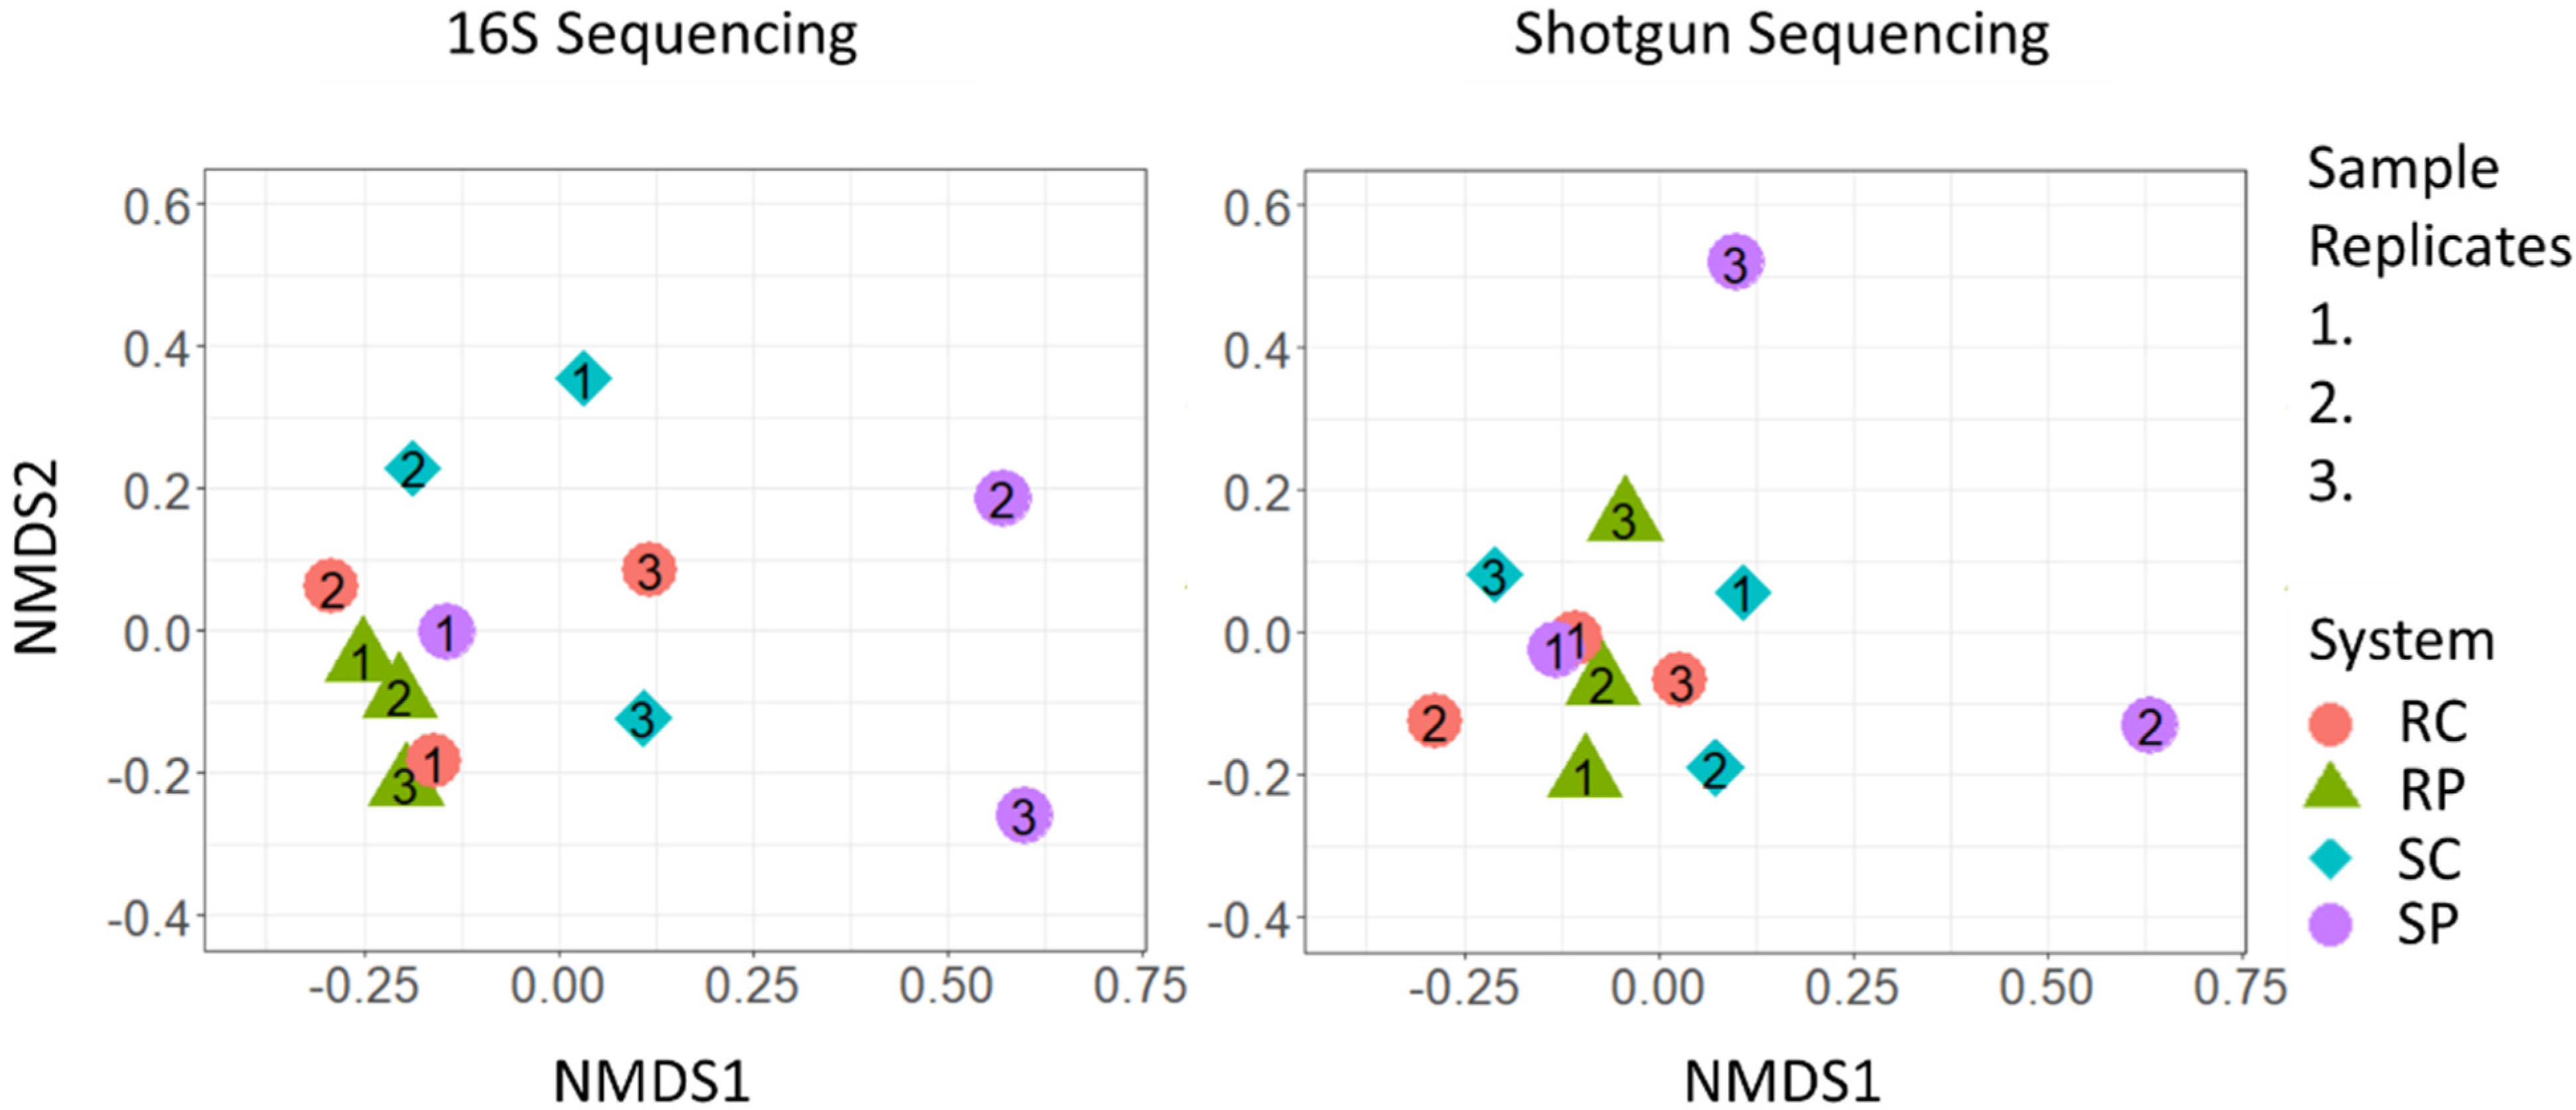
3.2. Community Differentiation and Core Microbiome

Physiochemical variables such as system design and temperature can alter the microbial community composition within OWTSs [43]. We used PERMANOVA testing to assess the effects of these physicochemical parameters on community similarity between OWTSs.
When examining the effects of physiochemical variables on OWTS community composition, we did not identify any variables as being significant. However, future analysis of this kind using a larger sample size may identify significant effects of environment and tank design on community composition.
When examining the patterns of community differentiation between OWTSs, non-metric dimensional scaling determined that single-pass plug-flow systems displayed the most intergroup and intragroup variation of genus-level community dissimilarity (see Figure 4). The second most variable system type was the single-pass conventional system (see Figure 1). Compared to other systems, the large variation of plug flow single-pass systems indicates that the plug flow design without recirculated waste may significantly affect the anaerobic digestion microbial community. Future ordination-based research on the effect of OWTS design and flow type would probably benefit from a larger sample size to supplement quantitative PERMANOVA testing.
When comparing the patterns of community differentiation between 16S and shotgun sequencing, Procrustes analysis indicates that the NMDS ordinations using 16S and shotgun sequencing yielded very similar patterns of community differentiation (sum of squares = 0.0982; Procrustes correlation = 0.950). Therefore, either 16S or shotgun sequencing can be used when the goal of sequencing is to examine the whole community between sites with similar OSWT designs.
Whereas 16S and shotgun sequencing indicated similar patterns of community differentiation, there was little overlap in the specific identifications. Among the 188 taxa with greater than 0.1% relative abundance, only 48 were shared between the 16S and shotgun sequencing datasets. The OWTS core microbiome observed using shotgun sequencing contained 111 taxa, while the core microbiome observed using 16S sequencing contained 24 taxa, all of which were also included in the core microbiome observed using shotgun sequencing. Both core microbiomes included genera such as Trichococcus, Bacteroides, Acinetobacter, and Pseudomonas [44], which have been previously reported as being in high abundance within sewage systems, although their relative abundances were inconsistent (see Supplementary Data for full core microbiomes with relative abundances).
The genera binning of low-abundance shotgun sequencing identifications may have led to taxa in the shotgun sequencing dataset increasing in relative abundance compared to 16S sequencing. Future analysis of the differences between 16S and shotgun sequencing taxonomic identifications may benefit from a more detailed breakdown of how individual taxa respond to genera binning and abundance filtering.

3.3. Differential Abundance

There are likely many unknown biochemical interactions that influence the performance of anaerobic digestion systems [45]. However, taxa with known effects on the hydrolytic, acidogenic, acetogenic, or methanogenic stages of anaerobic digestion can consistently impact the rate of waste removal [46]. Taxa that consistently correlate with changes in any aspect of the anaerobic digestion process represent a potential tool for altering the digestor microbial community [47,48].
To examine the response of specific taxa to tank design and flow type, we used DESeq2 to identify taxa with average relative abundances that were significantly different between tank designs and flow types.
When comparing plug flow to conventional system designs, we identified two significantly differentially abundant taxa using shotgun sequencing and five significantly differentially abundant taxa using 16S amplicon sequencing (see Supplementary Data for complete list). We only identified one genus (Desulfomicrobium, which was enriched in conventional systems) as significantly (shotgun p = 2.2 × 10⁻⁴; 16S p = 5.05 × 10⁻¹⁸) differentially abundant according to both 16S and shotgun sequencing comparing plug flow to conventional system designs. The genus Desulfomicrobium (enriched in conventional systems) contains sulfur-reducing bacteria, which use oxidized sulfur compounds and elemental sulfur as electron acceptors [49,50].
When comparing single-pass systems to recirculating systems, we identified seven significantly differentially abundant taxa using shotgun sequencing, and we identified 13 significantly differentially abundant taxa using 16S sequencing (see Supplementary Data for complete list). When comparing single-pass and recirculating flow types, we identified two taxa as significantly differentially abundant according to both 16S and shotgun sequencing, namely Phenylobacterium (shotgun p = 1.15 × 10⁻⁴; 16S p = 2.47 × 10⁻⁴) and Simplicispira (shotgun p = 1.15 × 10⁻⁴; 16S p = 6.97 × 10⁻⁴).
Bacteria in the Phenylobacterium genus (enriched in single-pass systems) can utilize heterocyclic phenyl compounds such as those found in artificial herbicides and surfactants as carbon sources [51]. The Phenylobacterium genus is also associated with cellulose metabolism [52,53]. Bacteria in the Simplicispira genus (enriched in single-pass systems) can perform denitrification [54]. Phenylobacterium, Desulfomicrobium, and Simplicispira improve the function of anaerobic digestion systems [50,52,54,55].
Given the lack of overlapping differential abundance results between 16S and shotgun sequencing, verification of the taxonomic differential abundances indicating that Desulfomicrobium, Phenylobacterium, and Simplicispira responded to tank design and flow type is necessary to determine whether OWTS design can reliably influence the relative abundance of these potentially useful taxa. Further analysis is needed to assess whether other key taxa in the anaerobic digestion process can be reliably examined for differential abundance.

4. Conclusions

In conclusion, the findings of this project provide insight into the effects of OWTS design on community variation and information on the research objectives that can be met using both 16S and shotgun sequencing. The results of this wastewater metagenomic analysis are consistent with previous research that compared 16S and shotgun sequencing [14,15,56,57,58,59]. Consistency with previous results in well-studied environments such as the human gut microbiome indicates that the research goals of assessing taxonomic richness, community differentiation, core metagenome content, and differential abundance were not impeded by factors specific to OWTSs. With potential complications ruled out, the increased taxonomic and functional information available through whole-metagenome shotgun sequencing makes it an optimal tool for wastewater metagenomic analysis.
Results produced consistently using 16S and shotgun sequencing indicate that:
  • The OWTSs designed with a recirculating flow system and plug-flow-type design contained the most variable taxonomic richness.
  • Single-pass plug-flow-type OWTSs contained the most variable microbial communities between OWTSs.
  • Desulfomicrobium was enriched in conventional OWTSs, whereas Simplicispira and Phenylobacterium were both enriched in single-pass OWTSs.

Supplementary Materials

The following supporting information can be downloaded at: https://www.mdpi.com/article/10.3390/w15020271/s1, Table S1: Septic System Design Variables; Table S2: Alpha Diversity; Table S3: DEseq2 Differential Abundance; Table S4: Shotgun Core Microbiome; Table S5: 16S Core Microbiome; Table S6: Both Methods Core Microbiome.

Author Contributions

Conceptualization, H.E.S.; methodology H.E.S., J.d.V., J.N., P.N., A.P. and A.W.Y.C.; validation, H.E.S., A.W.Y.C., E.L., F.S. and J.N.; formal analysis, J.d.V.; writing—original draft preparation, J.d.V.; writing—review and editing H.E.S., E.L. and F.S.; supervision, H.E.S. All authors have read and agreed to the published version of the manuscript.

Funding

This study was supported with funding from an NSERC Alliance Award (554507-20), the Ontario Water Consortium (SUB02625), and the Ontario Research Excellence fund (RE09-77). We thank Craig and Chris Jowett of Waterloo Biofilters Systems for technical advice. We also thank Waterloo Biofilters for their in-kind support of this project.

Data Availability Statement

Data will be made available upon request.

Acknowledgments

We would like to thank all members of the Schellhorn lab for their contributions to this research.

Conflicts of Interest

The authors declare no conflict of interest.

References

  1. Richards, S.; Withers, P.J.A.; Paterson, E.; McRoberts, C.W.; Stutter, M. Potential Tracers for Tracking Septic Tank Effluent Discharges in Watercourses. Environ. Pollut. 2017, 228, 245–255. [Google Scholar] [CrossRef] [PubMed]
  2. Li, E.; Saleem, F.; Edge, T.A.; Schellhorn, H.E. Biological indicators for fecal pollution detection and source tracking: A review. Processes 2021, 9, 2058. [Google Scholar] [CrossRef]
  3. Appling, D.; Habteselassie, M.Y.; Radcliffe, D.; Bradshaw, J.K. Preliminary Study on the Effect of Wastewater Storage in Septic Tank on E. coli Concentration in Summer. Water 2013, 5, 1141–1151. [Google Scholar] [CrossRef]
  4. Schaider, L.A.; Rodgers, K.M.; Rudel, R.A. Review of Organic Wastewater Compound Concentrations and Removal in Onsite Wastewater Treatment Systems. Environ. Sci. Technol. 2017, 51, 7304–7317. [Google Scholar] [CrossRef] [Green Version]
  5. Lapointe, B.E.; Herren, L.W.; Paule, A.L. Septic Systems Contribute to Nutrient Pollution and Harmful Algal Blooms in the St. Lucie Estuary, Southeast Florida, USA. Harmful Algae 2017, 70, 1–22. [Google Scholar] [CrossRef]
  6. Grattan, L.M.; Holobaugh, S.; Morris, J.G. Harmful Algal Blooms and Public Health. Harmful Algae 2016, 57, 2–8. [Google Scholar] [CrossRef] [Green Version]
  7. Withers, P.J.A.; Jordan, P.; May, L.; Jarvie, H.P.; Deal, N.E. Do Septic Tank Systems Pose a Hidden Threat to Water Quality? Front. Ecol. Environ. 2014, 12, 123–130. [Google Scholar] [CrossRef]
  8. Li, Y.; Zhao, J.; Krooneman, J.; Euverink, G.J.W. Strategies to boost anaerobic digestion performance of cow manure: Laboratory achievements and their full-scale application potential. Sci. Total Environ. 2021, 755, 142940. [Google Scholar] [CrossRef]
  9. Yang, Z.; Wang, W.; Liu, C.; Zhang, R.; Liu, G. Mitigation of ammonia inhibition through bioaugmentation with different microorganisms during anaerobic digestion: Selection of strains and reactor performance evaluation. Water Res. 2019, 155, 214–224. [Google Scholar] [CrossRef]
  10. Fekih-Salem, R.; Daoud, Y.; Abdellatif, N.; Sari, T. A mathematical model of anaerobic digestion with syntrophic relationship, substrate inhibition, and distinct removal rates. SIAM J. Appl. Dyn. Syst. 2021, 20, 1621–1654. [Google Scholar] [CrossRef]
  11. Naphtali, J.; Chan, A.W.Y.Y.; Saleem, F.; Li, E.; Devries, J.; Schellhorn, H.E. Comparative Metagenomics of Anaerobic Digester Communities Reveals Sulfidogenic and Methanogenic Microbial Subgroups in Conventional and Plug Flow Residential Septic Tank Systems. Processes 2022, 10, 436. [Google Scholar] [CrossRef]
  12. Chen, J.; Wade, M.J.; Dolfing, J.; Soyer, O.S. Increasing Sulfate Levels Show a Differential Impact on Synthetic Communities Comprising Different Methanogens and a Sulfate Reducer. J. R. Soc. Interface 2019, 16, 20190129. [Google Scholar] [CrossRef] [PubMed] [Green Version]
  13. Escobar-Zepeda, A.; Godoy-Lozano, E.E.; Raggi, L.; Segovia, L.; Merino, E.; Gutiérrez-Rios, R.M.; Juarez, K.; Licea-Navarro, A.F.; Pardo-Lopez, L.; Sanchez-Flores, A. Analysis of Sequencing Strategies and Tools for Taxonomic Annotation: Defining Standards for Progressive Metagenomics. Sci. Rep. 2018, 8, 12034. [Google Scholar] [CrossRef] [PubMed] [Green Version]
  14. Mas-Lloret, J.; Obón-Santacana, M.; Ibáñez-Sanz, G.; Guinó, E.; Pato, M.L.; Rodriguez-Moranta, F.; Mata, A.; García-Rodríguez, A.; Moreno, V.; Pimenoff, V.N. Gut Microbiome Diversity Detected by High-Coverage 16S and Shotgun Sequencing of Paired Stool and Solon Sample. Sci. Data 2020, 7, 1–13. [Google Scholar] [CrossRef] [Green Version]
  15. Durazzi, F.; Sala, C.; Castellani, G.; Manfreda, G.; Remondini, D.; De Cesare, A. Comparison Between 16s rRNA and Shotgun Sequencing Data for the Taxonomic Characterization of the Gut Microbiota. Sci. Rep. 2021, 11, 3030. [Google Scholar] [CrossRef]
  16. Tessler, M.; Neumann, J.S.; Afshinnekoo, E.; Pineda, M.; Hersch, R.; Velho, L.F.M.; Segovia, B.T.; Lansac-Toha, F.A.; Lemke, M.; Desalle, R.; et al. Large-Scale Differences in Microbial Biodiversity Discovery between 16s Amplicon and Shotgun Sequencing. Sci. Rep. 2017, 7, 6589. [Google Scholar] [CrossRef] [PubMed] [Green Version]
  17. Allali, I.; Arnold, J.W.; Roach, J.; Cadenas, M.B.; Butz, N.; Hassan, H.M.; Koci, M.; Ballou, A.; Mendoza, M.; Ali, R.; et al. A Comparison of Sequencing Platforms and Bioinformatics Pipelines for Compositional Analysis of the Gut Microbiome. BMC Microbiol. 2017, 17, 194. [Google Scholar] [CrossRef]
  18. Breitwieser, F.P.; Lu, J.; Salzberg, S.L. A Review of Methods and Databases for Metagenomic Classification and Assembly. Brief. Bioinform. 2018, 20, 1125–1139. [Google Scholar] [CrossRef] [PubMed]
  19. Huang, X.; Fan, X.; Ying, J.; Chen, S. Emerging Trends and Research Foci in Gastrointestinal Microbiome. J. Transl. Med. 2019, 17, 67. [Google Scholar] [CrossRef]
  20. Antony-Babu, S.; Stien, D.; Eparvier, V.; Parrot, D.; Tomasi, S.; Suzuki, M.T. Multiple Streptomyces Species with Distinct Secondary Metabolomes have Identical 16S rRNA Gene Sequences. Sci. Rep. 2017, 7, 11089. [Google Scholar] [CrossRef]
  21. Aßhauer, K.P.; Wemheuer, B.; Daniel, R.; Meinicke, P. Tax4fun: Predicting Functional Profiles From Metagenomic 16S rRNA Data. Bioinformatics 2015, 31, 2882–2884. [Google Scholar] [CrossRef] [PubMed] [Green Version]
  22. Greay, T.T.L.; Gofton, A.W.; Zahedi, A.; Paparini, A.; Joll, C.A.; Ryan, U.M.; Linge, K.L.; Joll, C.A.; Ryan, U.M. Evaluation of 16S next-Generation Sequencing of Hypervariable Region 4 in Wastewater Samples: An Unsuitable Approach for Bacterial Enteric Pathogen Identification. Sci. Total Environ. 2019, 670, 1111–1124. [Google Scholar] [CrossRef] [PubMed]
  23. Sze, M.A.; Schloss, P.D. The Impact of DNA Polymerase and Number of Rounds of Amplification in PCR on 16S rRNA Gene Sequence Data. mSphere 2019, 4, e00163-19. [Google Scholar] [CrossRef] [PubMed] [Green Version]
  24. Edgar, R.C. Updating the 97% Identity Threshold for 16S Ribosomal RNA OTUs. Bioinformatics 2018, 34, 2371–2375. [Google Scholar] [CrossRef] [Green Version]
  25. Brown, C.T.; Hug, L.A.; Thomas, B.C.; Sharon, I.; Castelle, C.J.; Singh, A.; Wilkins, M.J.; Wrighton, K.C.; Williams, K.H.; Banfield, J.F. Unusual Biology Across a Group Comprising More Than 15% Of Domain Bacteria. Nature 2015, 523, 208–211. [Google Scholar] [CrossRef] [Green Version]
  26. Mohiuddin, M.M.; Botts, S.R.; Paschos, A.; Schellhorn, H.E. Temporal and Spatial Changes in Bacterial Diversity in Mixed Use Watersheds of the Great Lakes Region. J. Great Lakes Res. 2019, 45, 109–118. [Google Scholar] [CrossRef]
  27. Bag, S.; Saha, B.; Mehta, O.; Anbumani, D.; Kumar, N.; Dayal, M.; Pant, A.; Kumar, P.; Saxena, S.; Allin, K.H.; et al. An Improved Method for High Quality Metagenomics Dna Extraction From Human and Environmental Samples. Sci. Rep. 2016, 6, 26775. [Google Scholar] [CrossRef] [Green Version]
  28. Kassambara, A. FASTQC: Quality Control of Sequencing Data (Version 0.1.2). Available online: https://cran.r-project.org/web/packages/fastqcr/index.html (accessed on 24 November 2020).
  29. Gajer, P.; He, X.; Mccomb, E.; Gravitt, P.E.; Ghanem, K.G.; Brotman, R.M. Ultrahigh-Throughput Multiplexing and Sequencing of >500- Base-Pair Amplicon Regions on the Illumina HiSeq 2500 Platform. Appl. Environ. Sci. 2021, 4, e00029-19. [Google Scholar] [CrossRef] [Green Version]
  30. Buchfink, B.; Xie, C.; Huson, D.H. Fast and Sensitive Protein Alignment Using Diamond. Nat. Methods 2014, 12, 59–60. [Google Scholar] [CrossRef]
  31. Huson, D.H.; Beier, S.; Flade, I.; Górska, A.; El-Hadidi, M.; Mitra, S.; Ruscheweyh, H.J.; Tappu, R. Megan Community Edition—Interactive Exploration and Analysis of Large-Scale Microbiome Sequencing Data. PLoS Comput. Biol. 2016, 12, e1004957. [Google Scholar] [CrossRef]
  32. Herbold, C.W.; Pelikan, C.; Kuzyk, O.; Hausmann, B.; Angel, R.; Berry, D.; Loy, A. A Flexible and Economical Barcoding Approach for Highly Multiplexed Amplicon Sequencing of Diverse Target Genes. Front. Microbiol. 2015, 6, 731. [Google Scholar] [CrossRef] [Green Version]
  33. Kozich, J.J.; Westcott, S.L.; Baxter, N.T.; Highlander, S.K.; Schloss, P.D. Development of a Dual-Index Sequencing Strategy and Curation Pipeline for Analyzing Amplicon Sequence Data on the Miseq Illumina Sequencing Platform. Appl. Environ. Microbiol. 2013, 79, 5112–5120. [Google Scholar] [CrossRef] [PubMed] [Green Version]
  34. Martin, M. Cutadapt Removes Adapter Sequences From High-Throughput Sequencing Reads. EMBnet 2011, 17, 10–12. [Google Scholar] [CrossRef]
  35. Callahan, B.J.; Mcmurdie, P.J.; Rosen, M.J.; Han, A.W.; Johnson, A.J.A.; Holmes, S.P. DADA2: High Resolution Sample Inference From Illumina Amplicon Data. Nat. Methods 2016, 13, 581–583. [Google Scholar] [CrossRef] [Green Version]
  36. McMurdie, P.J.; Holmes, S. Phyloseq: An R Package for Reproducible Interactive Analysis and Graphics of Microbiome Census Data. PLoS ONE 2013, 8, e61217. [Google Scholar] [CrossRef] [PubMed] [Green Version]
  37. Hsieh, T.C.; Ma, K.H.; Chao, A. iNEXT: An R Package for Rarefaction and Extrapolation of Species Diversity (Hill numbers). Methods Ecol. Evol. 2016, 7, 1451–1456. [Google Scholar] [CrossRef]
  38. Love, M.I.; Huber, W.; Anders, S. Moderated Estimation of Fold Change and Dispersion for RNA-Seq Data With Deseq2. Genome Biol. 2014, 15, 550. [Google Scholar] [CrossRef] [PubMed] [Green Version]
  39. Bray, J.R.; Curtis, J.T. An Ordination of the Upland Forest Communities of Southern Wisconsin. Ecol. Soc. Am. 1957, 27, 325–349. [Google Scholar] [CrossRef]
  40. Anderson, M.J. Permutational Multivariate Analysis of Variance (PERMANOVA). Wiley StatsRef Stat. Ref. Online 2017, 557–574. [Google Scholar] [CrossRef]
  41. Jakaitiene, A.; Sangiovanni, M.; Guarracino, M.R.; Pardalos, P.M. Multidimensional Scaling for Genomic Data. In Advances in Stochastic and Deterministic Global Optimization; Springer International Publishing: Cham, Switzerland, 2016; Volume 107, pp. 229–242. ISBN 978-3-319-29973-0. [Google Scholar]
  42. Tzeng, J.; Lu, H.; Li, W.H. Multidimensional Scaling for Large Genomic Data Sets. BMC Bioinform. 2008, 9, 179. [Google Scholar] [CrossRef]
  43. Zhu, X.; Campanaro, S.; Treu, L.; Seshadri, R.; Ivanova, N.; Kougias, P.G.; Kyrpides, N.; Angelidaki, I. Metabolic Dependencies Govern Microbial Syntrophies During Methanogenesis in an Anaerobic Digestion Ecosystem. Microbiome 2020, 8, 22. [Google Scholar] [CrossRef]
  44. Roguet, A.; Newton, R.J.; Eren, A.M.; McLellan, S.L. Guts of the Urban Ecosystem: Microbial Ecology of Sewer Infrastructure. mSystems 2022, 7, e00118-22. [Google Scholar] [CrossRef] [PubMed]
  45. Batstone, D.J.; Puyol, D.; Flores-Alsina, X.; Rodríguez, J. Mathematical Modelling of Anaerobic Digestion Processes: Applications and Future Needs. Rev. Environ. Sci. Biotechnol. 2015, 14, 595–613. [Google Scholar] [CrossRef]
  46. Zhang, Q.; Wang, M.; Ma, X.; Gao, Q.; Wang, T.; Shi, X.; Zhou, J.; Zuo, J.; Yang, Y. High Variations of Methanogenic Microorganisms Drive Full-Scale Anaerobic Digestion Process. Environ. Int. 2019, 126, 543–551. [Google Scholar] [CrossRef]
  47. Yin, Q.; Zhu, X.; Zhan, G.; Bo, T.; Yang, Y.; Tao, Y.; He, X.; Li, D.; Yan, Z. Enhanced Methane Production in an Anaerobic Digestion and Microbial Electrolysis Cell Coupled System with Co-Cultivation of Geobacter and Methanosarcina. J. Environ. Sci. 2016, 42, 210–214. [Google Scholar] [CrossRef]
  48. Zhang, S.; Chang, J.; Liu, W.; Pan, Y.; Cui, K.; Chen, X.; Liang, P.; Zhang, X.; Wu, Q.; Qiu, Y.; et al. A Novel Bioaugmentation Strategy to Accelerate Methanogenesis Via Adding Geobacter Sulfurreducens PCA in Anaerobic Digestion System. Sci. Total Environ. 2018, 642, 322–326. [Google Scholar] [CrossRef] [PubMed]
  49. Kushkevych, I.V. Identification of Sulfate-Reducing Bacteria Strains of Human Large Intestine. Stud. Biol. 2013, 7, 115–132. [Google Scholar] [CrossRef]
  50. Sun, R.; Zhang, L.; Zhang, Z.; Chen, G.-H.; Jiang, F. Realizing High-Rate Sulfur Reduction Under Sulfate-Rich Conditions in a Biological Sulfide Production System to Treat Metal-Laden Wastewater Deficient in Organic Matter. Water Res. 2017, 131, 239–245. [Google Scholar] [CrossRef] [PubMed]
  51. Oh, Y.S.; Roh, D.H. Phenylobacterium Muchangponense sp. nov., Isolated from Beach Soil, and Emended Description of the Genus Phenylobacterium. Int. J. Syst. Evol. Microbiol. 2012, 62, 977–983. [Google Scholar] [CrossRef]
  52. Verastigui, Y.; Cheng, J.; Engel, K.; Kolczynski, D.; Mortimer, S.; Lavigne, J.; Montalibet, J.; Romantsov, T.; Hall, M.; McConkey, B.; et al. Multisubstrate Isotope Labeling and Metagenomic Analysis of Active. mBio 2021, 5, e01157-14. [Google Scholar] [CrossRef]
  53. Puentes-Téllez, P.E.; Salles, J.F. Dynamics of Abundant and Rare Bacteria During Degradation of Lignocellulose from Sugarcane Biomass. Microb. Ecol. 2020, 79, 312–325. [Google Scholar] [CrossRef] [PubMed] [Green Version]
  54. Siddiqi, M.Z.; Sok, W.; Choi, G.; Kim, S.Y.; Wee, J.H.; Im, W.T. Simplicispira hankyongi sp. nov., a Novel Denitrifying Bacterium Isolated Grom Sludge. Antonie Van Leeuwenhoek Int. J. Gen. Mol. Microbiol. 2020, 113, 331–338. [Google Scholar] [CrossRef] [PubMed]
  55. Wilhelm, R.C.; Singh, R.; Eltis, L.D.; Mohn, W.W. Bacterial Contributions to Delignification and Lignocellulose Degradation in Forest Soils with Metagenomic and Quantitative Stable Isotope Probing. ISME J. 2019, 13, 413–429. [Google Scholar] [CrossRef] [Green Version]
  56. Ranjan, R.; Rani, A.; Metwally, A.; McGee, H.S.; Perkins, D.L. Analysis of the Microbiome: Advantages of Whole Genome Shotgun Versus 16S Amplicon Sequencing. Biochem. Biophys. Res. Commun. 2016, 469, 967–977. [Google Scholar] [CrossRef] [PubMed] [Green Version]
  57. Hillmann, B.; Al-ghalith, G.A.; Shields-cutler, R.R.; Zhu, Q.; Gohl, D.M.; Beckman, K.B.; Knight, R.; Knights, D. Evaluating the Information Content of Shallow Shotgun Metagenomics. mSystems 2018, 3, e00069-18. [Google Scholar] [CrossRef] [Green Version]
  58. Laudadio, I.; Fulci, V.; Palone, F.; Stronati, L.; Cucchiara, S.; Carissimi, C. Quantitative Assessment of Shotgun Metagenomics and 16S rDNA Amplicon Sequencing in the Study of Human Gut Microbiome. OMICS A J. Integr. Biol. 2018, 22, 248–254. [Google Scholar] [CrossRef] [PubMed]
  59. Zuo, W.; Wang, B.; Bai, X.; Luan, Y.; Fan, Y.; Michail, S.; Sun, F. 16S rRNA and Metagenomic Shotgun Sequencing Data Revealed Consistent Patterns of Gut Microbiome Signature in Pediatric Ulcerative Colitis. Sci. Rep. 2022, 12, 6421. [Google Scholar] [CrossRef]
Figure 1. The location of sampling points and internal layouts of OWTSs sampled for metagenomic analysis. (A) Conventional two-chambered OWTS design with the influent sampling site located within the first chamber beneath the influent pipe (1), the tank site located within the second chamber (2), and the effluent site (3) located within the effluent holding tank. (B) Plug flow type (InnerTube™) OWTS design with the influent sampling site located at the opening of the inner tube (1), the tank site located at the end of the flow tube (2), and the effluent site located at the effluent spray nozzle (3).
Water 15 00271 g001
Figure 2. Total taxa in each OWTS identified by 16S and shotgun sequencing. Conventional and plug-flow systems are labelled Coven and Plug, respectively.
Water 15 00271 g002
Figure 3. Total taxa above 0.1% relative abundance in each OWTS identified by 16S and shotgun sequencing. Conventional and plug-flow systems are labelled Conven and Plug, respectively.
Water 15 00271 g003
Figure 4. Non-metric dimensional scaling ordination plots of Bray–Curtis dissimilarity matrices of on-site wastewater treatment system microbial communities that were examined using 16S and shotgun sequencing. Procrustes analysis of the ordination points produced a sum of squares of 0.0982 and a Procrustes correlation of 0.950.
Water 15 00271 g004
Disclaimer/Publisher’s Note: The statements, opinions and data contained in all publications are solely those of the individual author(s) and contributor(s) and not of MDPI and/or the editor(s). MDPI and/or the editor(s) disclaim responsibility for any injury to people or property resulting from any ideas, methods, instructions or products referred to in the content.

