
Cool- and Warm-Season Turfgrass Irrigation with Subsurface Drip and Sprinkler Methods Using Different Water Management Strategies and Tools

1
Department of Biosystems Engineering, Faculty of Agriculture, University of Tekirdag Namik Kemal, Tekirdag 59030, Türkiye
2
CIHEAM-Mediterranean Agronomic Institute of Bari, Via Ceglie, 9, 70010 Valenzano, Italy
3
Water Management Institute, Ankara University, Ankara 06135, Türkiye
*
Author to whom correspondence should be addressed.
Water 2023, 15(2), 272; https://doi.org/10.3390/w15020272
Submission received: 5 December 2022
/
Revised: 29 December 2022
/
Accepted: 5 January 2023
/
Published: 9 January 2023
(This article belongs to the Special Issue Climate Smart Irrigation Management for Sustainable Agricultural Cultivation)
Abstract
:This study compared the performances of subsurface drip irrigation (SDI) to sprinkler irrigation (SI) of cool-season turf mix (CS) and warm-season (WS) turfgrass species while investigating their response to different irrigation scheduling strategies. Moreover, the suitability of crop water stress index (CWSI) for monitoring water stress and scheduling irrigation was tested. Irrigation was applied up to the field capacity when 30%, 50% and 70% of total available water was consumed. All parameters, including color, quality, fresh yield, dry matter yield, irrigation water productivity, water productivity, vegetation height and mowing, differed significantly for different irrigation methods and water supply strategies for both species. The best visual turf was maintained under non-limiting soil moisture conditions (30%) in all main and sub-treatments. At this irrigation threshold, maximum and minimum amounts of irrigation water were applied in SI CS treatment (523.5 mm) and SDI WS treatment (298.6 mm), respectively. Warm-season turf required up to 40% less water than cool-season turf mix. In the water-scarce regions, 50% treatment for cool-season and 70% treatment for warm-season can be suggested for acceptable visual quality, lower water consumption and less frequent clipping. The mean CWSI before irrigation, representing irrigation threshold, ranged between 0.22–0.70.
1. Introduction
Having witnessed the effects of water shortages in many regions of the world during the past decade, water conservation strategies have become extremely important. Moreover, scientists forecast extensive droughts occurrences throughout the next decades, so there is a need for increased conscience on water use [1]. This might be particularly relevant for turfgrass irrigation, mostly popular for its recreational uses, unlike other commonly irrigated crops.
Although water use for turf irrigation may seem insignificant, it can become essential part of domestic water supplies, especially during the summer months [2]. Efficient water supply for turfgrass growing is becoming an important component of water management strategies, particularly in water-scarce regions. Hence, in the context of climate change, one of the major challenges is to evaluate the response of various turfgrass genotypes to different irrigation practices and abiotic stresses [3].
Water saving in landscape irrigation starts from the identification of the most suitable irrigation method for local conditions, the selection of the drought-tolerant turf species, and, finally, the setting of the most appropriate and effective irrigation scheduling. Water productivity and a healthy appearance of the plant are among the priority criteria in turfgrass irrigation. The subsurface drip irrigation method is especially used in turfgrass irrigation since it increases water, fertilizer, energy and in-field service efficiency against the increasing drought effects. However, it remains necessary to search different turfgrass varieties that can grow under different SDI and SI conditions [4]. Subsurface drip irrigation has other advantages over the sprinkler irrigation method as there are no evaporation losses, treated wastewater applications, or energy savings due to low operating pressure, strong weeding, high fertilizer efficiency [5].
In terms of the sustainability of landscape areas, the selection of turfgrass varieties with high ability to adapt to climate and abiotic effects is important [6]. Turfgrasses can be divided into two groups: cool-season and warm-season grasses. Cool-season grasses (Kentucky bluegrass, perennial ryegrass, tall fescue, Poa pratensis, Festuca rubra, Lolium perenne, Festuca arundinacea, etc.) are more cold-tolerant and exhibit a longer growing season than warm-season grasses (Bermudagrass, blue grama, buffalograss, zoysiagrass, etc.). Cold tolerance is usually the first desirable characteristic when selecting perennial plants, whether it is turfgrasses or bushes and trees. Warm-season grasses have a lower irrigation requirement because they use water more efficiently and have a shorter growing season. When selecting plants for water conservation, a decision must be made about the importance of aesthetics and function [7]. So, many performance criteria must be considered, including water requirements and consumption, acceptable level of stress and visual quality of turfgrasses.
In determining the water requirements of the turfgrass, crop evapotranspiration (ETc) should be known as a priority. The latest studies pointed out that ETc rates of cool-season grasses range from 4.0 to 12.7 mm day−1 [8], while ETc of bermudagrass rates are generally lower (2.0–8.6 mm day−1) [6,9,10,11,12]. Tall fescue ETc rates were measured to be on average 35–41% greater than those of bermudagrass. Furthermore, Carrow [10] found that tall fescue ETc rates were 15% greater than bermudagrass during a two-year study in Griffin, GA. ETc rates have been varied, depending on environmental conditions and measurement methods. Haghverdi et al. [13] recommended 70–80% ETo as a minimum irrigation practice to maintain the acceptable hybrid Bermuda grass quality in California, especially during high water demand months. Burgin [14] compared a warm-season turf cultivar (hybrid Bermudagrass) and a cold-season turf cultivar (Kentucky bluegrass) in terms of water use and canopy quality using different irrigation strategies (deficit, moderate and high irrigation). They explained that the water requirements of warm-season grass will be less than that of cool-season grass and that it constitutes a great alternative in semi-arid regions where water scarcity increases.
Maintaining an adequate soil water level within the root zone is essential in order to sustain turfgrass regular growth and quality. Hence, besides regular irrigation and fertilization, the application of agronomic practices that reduce risk of biotic stresses (insects, weeds, and diseases) should be well planned.
Irrigation planning is usually based on monitoring the soil water content or the crop parameters such as leaf water potential and canopy temperature. Moreover, the water balance models can be applied using weather, soil and crop parameters. Most approaches are based on direct contact with the crop. Instead, devices such as infrared thermometers rely on remote sensing to detect crop water status. When the crop goes under water stress, the stomata close, transpiration decreases and leaf/canopy temperature increases. The crop water stress index (CWSI) method, developed by Idso et al. [15], requires periodical monitoring of leaf/canopy temperatures using handheld infrared thermometers under maximum and minimum stress conditions. The CWSI is calculated by determining the lower and upper baselines. The threshold stress index for starting irrigation of Bermuda grass was found to be 0.16 in Tucson, AZ city [16], 0.15 in Shiraz [17] and 0.10 in Antalya [18]. Therefore, various thresholds were reported for different pedo-climatic conditions and management practices.
The primary objectives of this study were: (1) to investigate the water usage and visual quality of warm-season (Bermuda grass) and cool-season turfgrass mix (10% Poa pratensis, 25% Festuca rubra var. rubra, 30% Lolium perenne, 35% Festuca arundinacea) under sprinkler and sub-drip irrigation methods in semi-arid climates in the western part of Turkiye; (2) to examine the subsurface drip irrigation method as an alternative water saving method to sprinkler irrigation for different turfgrass types in semi-arid climates; (3) to explore the optimum irrigation scheduling of cool-season and warm-season turf under different irrigation methods based on soil and plant.
2. Materials and Methods
The study was conducted during the summer periods of 2017 and 2018 in the Agricultural Production and Research Centre (TURAM) of Silivri Municipality, Istanbul, Turkiye (41°03ʹ N; 28°00ʹ E; 46 m a.s.l.). The climate of this region is classified as semi-arid and the averages of annual temperature, relative humidity, wind speed, sunshine duration per day and total annual precipitation are 14.8 °C, 74.0%, 2.4 m s−1, 6.5 h and 643.8 mm, respectively. The slope of the experimental area was between 2% and 7% from east to west. Soil had a deep clay loam profile with no shallow underground water table. The available water holding capacity within 0.60 m of soil depth was about 80 mm. The electrical conductivity (EC) of irrigation water was 0.56 dS m−1 and the sodium absorption rate was 1.7, which was classified as C2S1 according to the U.S Salinity Lab. [19].
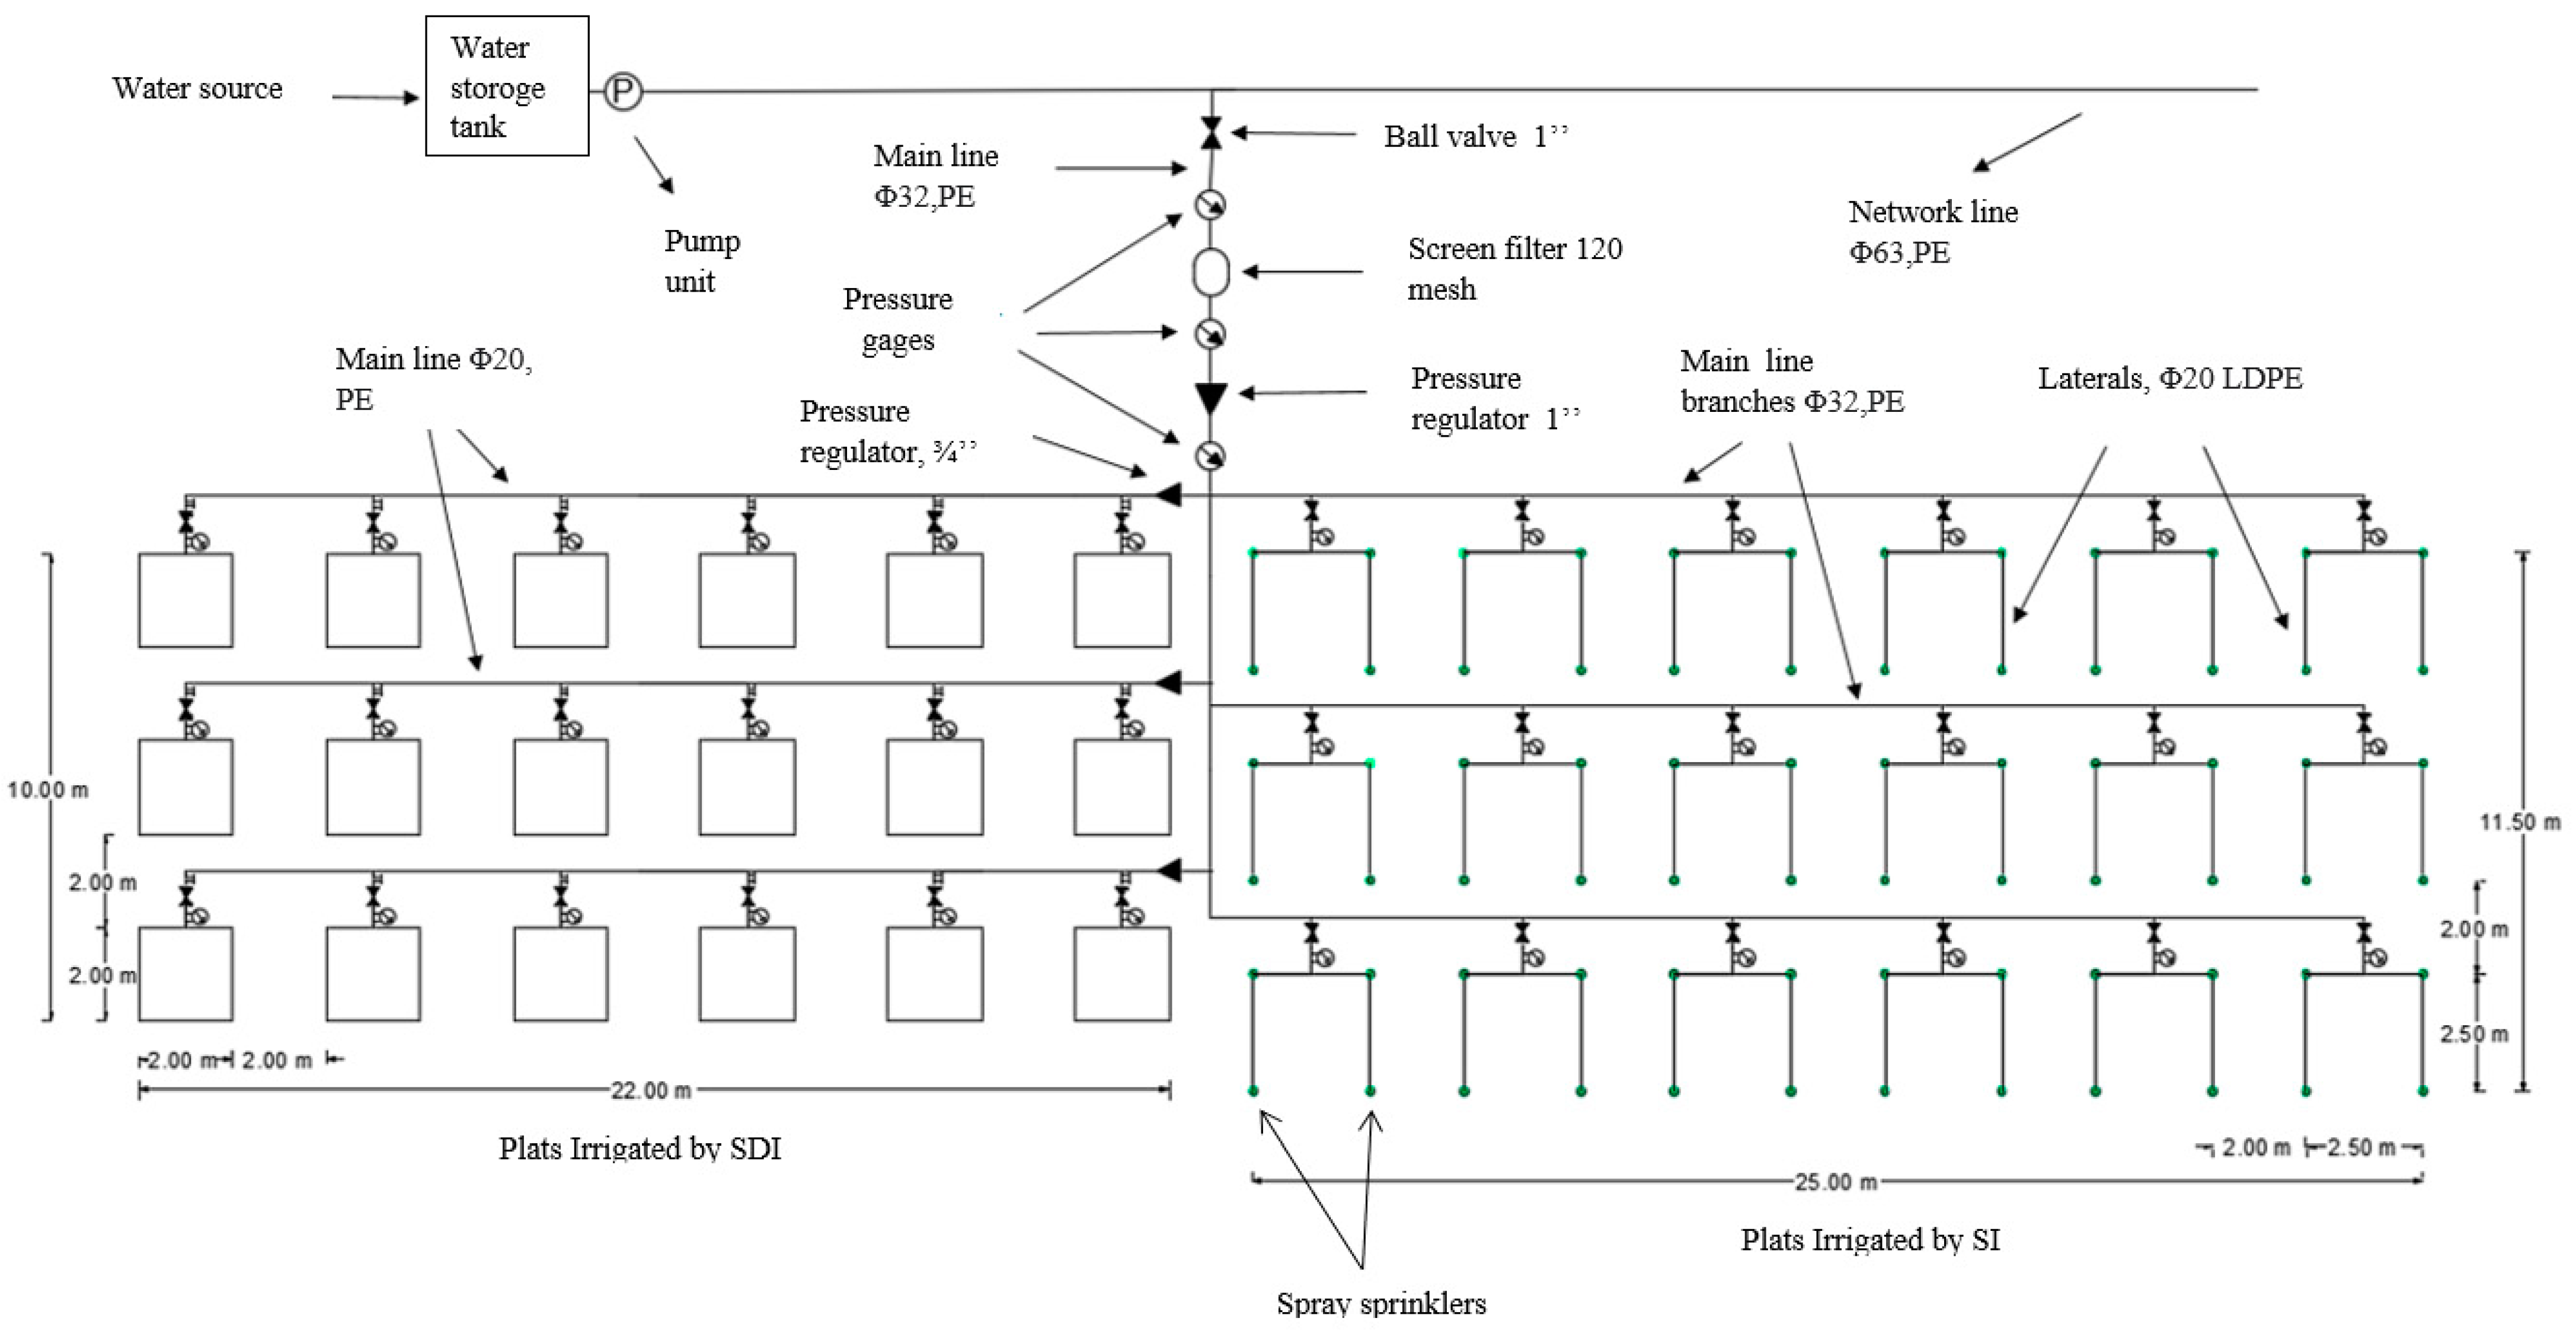
The experimental layout was a split–split plot design with three replications (Figure 1). The main treatments were the two different irrigation methods (Sprinkler Irrigation, SI and Subsurface Drip Irrigation, SDI), whereas the sub-treatments were two turfgrass type (cool-season turfgrass mix of 10% Poa pratensis, 25% Festuca rubra var. rubra, 30% Lolium perenne, 35% Festuca arundinacea and warm-season turfgrass of Cynodon dactylon L. Pers. cv Tifway), and the sub-sub treatments were three different irrigation thresholds (I30, I50, and I70). Irrigation thresholds represented the management allowable depletion (MAD) of 30%, 50% and 70% in the top 30 cm of the soil, respectively, while irrigation was applied to the field capacity level. In the beginning of May 2017, eighteen plots for sprinkler irrigation and eighteen plots for subsurface drip irrigation were prepared and cool-season turf seeds were sowed by hand spreading as 50 g m−2 and Bermudagrass seedling was planted as of 0.30 m * 0.30 m.
Each sprinkler plot was 6.25 m2 (2.5 m ∗ 2.5 m), and there was a space of 2 m within blocks and plots in order to avoid the side effects of seepage. Spray popup heads, which have a 87.25 L h−1 flow rate and 2.5 m irrigation radius with a 210 kPa working pressure, were used in each plot. Each SDI plot was 4.00 m2 (2.0 m ∗ 2.0 m), with a space of 2 m between blocks and plots to avoid the side effects of seepage. Polyethylene laterals were 10–15 cm deep with inline and self-regulated emitters spaced at 40 cm. Emitter and lateral spacing were determined as 40 cm according to the emitter discharge and soil infiltration rate to ensure that the percentage of wetted area is 100%. A flow rate of 2.3 L h−1 per emitter at an operating pressure of more than 100 kPa was selected. A flush valve and an air–vacuum relief valve were placed at their lateral ends for periodic flushing.
A weather station, “METOS” (Pessl Instruments GmbH-Austria), was located within the TURAM. METOS includes the sensors for measurement of air temperature, relative humidity, solar radiation, wind speed, wind direction, soil water content, and vapor pressure in hourly and daily formats. Besides, evaporation was measured via Class A Pan, established in the experimental area. Weather data were used for estimation of the reference evapotranspiration (ETo) using the FAO Penman–Monteith approach [20] and determination of lower and upper limit baselines for CWSI. Monthly variation of principal agro-meteorological parameters (air temperature, sunshine duration, relative humidity, wind speed, precipitation, evaporation and reference ET) during the experimental period is presented in Table 1.
A soil moisture meter HH2 (Delta-T Devices, UK) and soil moisture profile probe PR2/6 were used to determine the moisture values of the first 60 cm of soil profile in each plot. For this purpose, the calibration curve of PR2 has been prepared via a gravimetric method for current soil conditions before the experiments. Then, three moisture readings from different angles for 0.10, 0.20, 0.30, 0.40, and 0.60 m depths in each plot were taken every day during the whole growing period. Although soil moisture measurements at the top 0.30 m were used to initiate irrigation, moisture changes at 0.30–0.60 m depth were monitored to evaluate percolation losses.
The evapotranspiration for 10-day periods at 60 cm soil depth was calculated based on the water budget equation [21]. No runoff was observed during the irrigation period.
The CWSI was determined using empirical approach of Idso et al. [15] based on canopy–air temperature (Tc–Ta) and upper–lower (minimum–maximum stress) baseline temperature difference. Turf temperatures were measured with a handheld IRT (Model 574 precision, Fluke Corporation, Washington, WA, USA) with a 3° field view, equipped with an 8–14 µm spectral band-pass filter, and a 0.98 emissivity coefficient. In parallel, net radiation, air temperature, and vapor pressure deficit were taken hourly from METOS weather station.
The infrared thermometer (IRT) data collection was initiated on 1 July (Day of year, DOY 182) and ended on 15 August (DOY 227) for each plot, per hour of solar noon time (11:00 a.m. to 02:00 p.m.) at four cardinal directions (North, East, South, and West) under clear sky conditions. Then, the average of sixteen IRT measurements for each plot was used as daily CWSI for each treatment. The lower baseline (non-stress) was determined based on the well-irrigated plots (I30) for both species. Moreover, two small plots (0.50 ∗ 0.50 m) were established separately on 30 June (DOY 181) for both species to determinine the upper baseline (fully stressed) under rainfed conditions. The canopy temperature was measured hourly in each day per hour of extended time (10.00 a.m. to 04.00 p.m.) up to 9 July (DOY 190) for upper baseline determination.
Turfgrass visual status was taken into account as a physiological quality parameter. For this purpose, vegetation height before clipping, percentage of green groundcover, color and quality were monitored and evaluated. Color was determined via FieldScout TCM 500 NDVI Turf Color Meter (Spectrum Technologies, Inc.). Turf quality was evaluated according to the criteria described by Brede and Duich [22] and Avcıoğlu [23] as 9.0 = excellent, 6.0 = minimum acceptable quality for a good lawn, and 1.0 = poor. A rating of 6.0 is an indication of adequate color, density and homogeneity.
Turfgrass was mowed at a level of 5 cm above ground when it was 9–11 cm tall for WS and 14–16 cm tall for CS [24]. Clippings were weighed before and after being oven-dried at 78 °C for 24 h for fresh and dry mass, respectively. Fresh and dry mass per unit area was calculated as clipping weight/total plot area (g m–2). Water productivity (WP) and irrigation water productivity (IWP) are key factors for comparing irrigation methods or evaluating an irrigation program. Water productivity (WP) is the ratio of dry yield (Y, g m−2) to water use (ETc, mm) during the growing season, while irrigation water productivity (IWP) is explained as the ratio of dry yield of irrigated turfgrass (Y, g m−2) and seasonal irrigation water amount (I, mm) [25].
Significant interactions were identified and subjected to Fisher’s Protected LSD test at a 0.05 probability level via JMP software (SAS Institute Inc., Cary, NC, USA).
3. Results and Discussion
The total number of irrigations, the total amount of irrigation water applied and the seasonal ETc for different treatments in the summer periods of 2017 and 2018 are presented in Table 2. In 2017, the soil moisture monitoring started in the middle of July due to low groundcover and rainy period. So, the values presented in Table 2 are for 2.5 months in 2017, but for 5 months in 2018. Hence, all the data for the first year were lower than that of the second year. According to the values presented in Table 2, it is very clear that the minimum irrigation requirement and seasonal ETc were for treatment of SDI WS I70.and the maximum water irrigation requirement and seasonal ETc were for treatment of SI CS I30 in both years. In other words, irrigation method, turf type and irrigation threshold affected irrigation interval, irrigation water amount and seasonal ETc. Water consumption was lower for both WS turf and SDI method, as observed when comparing CS and SI method. Additionally, low MAD raised ETc because of no water limitation in an effective root zone of 30 cm. Similar results are reported by Kim and Beard [9], Carrow [10], Wherley et al. [11], Amgain et al. [12], Pinnix and Miller [6], Synder and Burt [26], Suarez-Ray et al. [5]. In addition, reference ET estimated by FAO Penman–Monteith was quite consistent with the average ETc values obtained from all treatments.
Vegetation height before clipping, surface coverage, color, quality, fresh yield, Dry matter yield (DMY), IWP and WP are given in Table 3 and Table 4. In the first year of the study, SI CS I30 treatment had the highest vegetation height, while in the second year, WS turf under all thresholds of SDI method was ranked in the first three of LSD groups for vegetation height. The main reason for highest vegetation height in SI CS I30 treatment in the first year was frequent irrigation by spraying. The SI method and I30 threshold provided an advantage to cool-season grasses in the establishment year compared to other treatments. Generally, cool-season grasses grew taller compared to warm-season grass in the establishment year mainly due to horizontal growth of warm-season grass to fill the spaces in the plots since they were space planted as mentioned in materials and methods. However, in the second year of the study, the warm-season grasses grew taller than the cool-season grasses. In addition, low MAD provided taller grooving for both turf types. However, taller growth means more frequent clipping and therefore it is an undesirable characteristic in landscape management.
Surface coverage for WS was the highest for all treatments in both years. Irrigation method and threshold did not create any statistical difference. However, surface coverage for CS was affected by both irrigation threshold and irrigation method as minimum surface coverage values observed in SI I70 treatment for both years. The low MAD and SDI method resulted in higher surface coverage for CS in both years. Based on those results, WS turfs are more tolerant to water stress compared to CS turfs.
CS turf had darker green color compared to WS turf in both years. The green quality is affected by irrigation interval as it is reduced gradually when interval increases. At the same time, irrigation methods affected color quality and SDI method provided a darker green. In the establishment year, only SI I70 treatment had a lower green quality than the acceptable level (level 6) for both turf types. In the second year, I70 threshold for both irrigation methods had a lower green quality than the acceptable level for both turf types. However, all thresholds of the SI WS showed inadequate green color. Based on these results, wider irrigation intervals are not suitable for reaching the acceptable color of the turf. Therefore, I30 or I50 thresholds should be applied for proper irrigation scheduling in both turf types.
Unacceptable quality was observed in cool-season turf in only SI I70 and SI I50 treatments, while all the other treatments provided acceptable quality in both turf types. In general, the higher quality was observed in WS turf under the SDI method and low MAD supported quality. This can be explained with higher density and homogeneous structure of WS turf due to its rhizomatous nature consequently also not allowing weeds. As is well known, high humidity is one of the important factors for the development of fungal disease. Therefore, the SDI method prevented this risk and consequently contributed to the quality of turf.
Data on dry matter yield and fresh yield were not collected in the establishment year of the study since there was not enough growth. So, IWP and WP could not be determined for this year. Additionally, canopy temperature for CWSI calculation was not measured in the first year due to the same reason mentioned above. WS grass under SDI produced much more fresh yield and ranked first amongst tree LSD groups, I30, I50, I70, respectively. The lowest fresh yield and dry matter yield were obtained in CS grass under SI applications, which ranked last in the LSD group. In other words, WS SDI I30 plots produced the highest fresh yield and dry matter yield, whereas all thresholds for CS SI I70 gave the lowest fresh yield. However, higher fresh yield also means higher maintenance cost due to the frequent clipping requirement.
Many studies, in which different turf cultivars were studied against water deficit, determined that fresh yield, dry matter yield, plant height, other vegetative indicators and visual quality were decreased in water shortages above 30%, compared to full irrigation [6,13,14,27,28]. In addition, they have supported the superiority of warm-season turf over cold-season turf in terms of water saving and all vegetative properties. The study conducted by Sandor [29] also showed similar results of 75% ETo irrigation to 100% ETo irrigation.
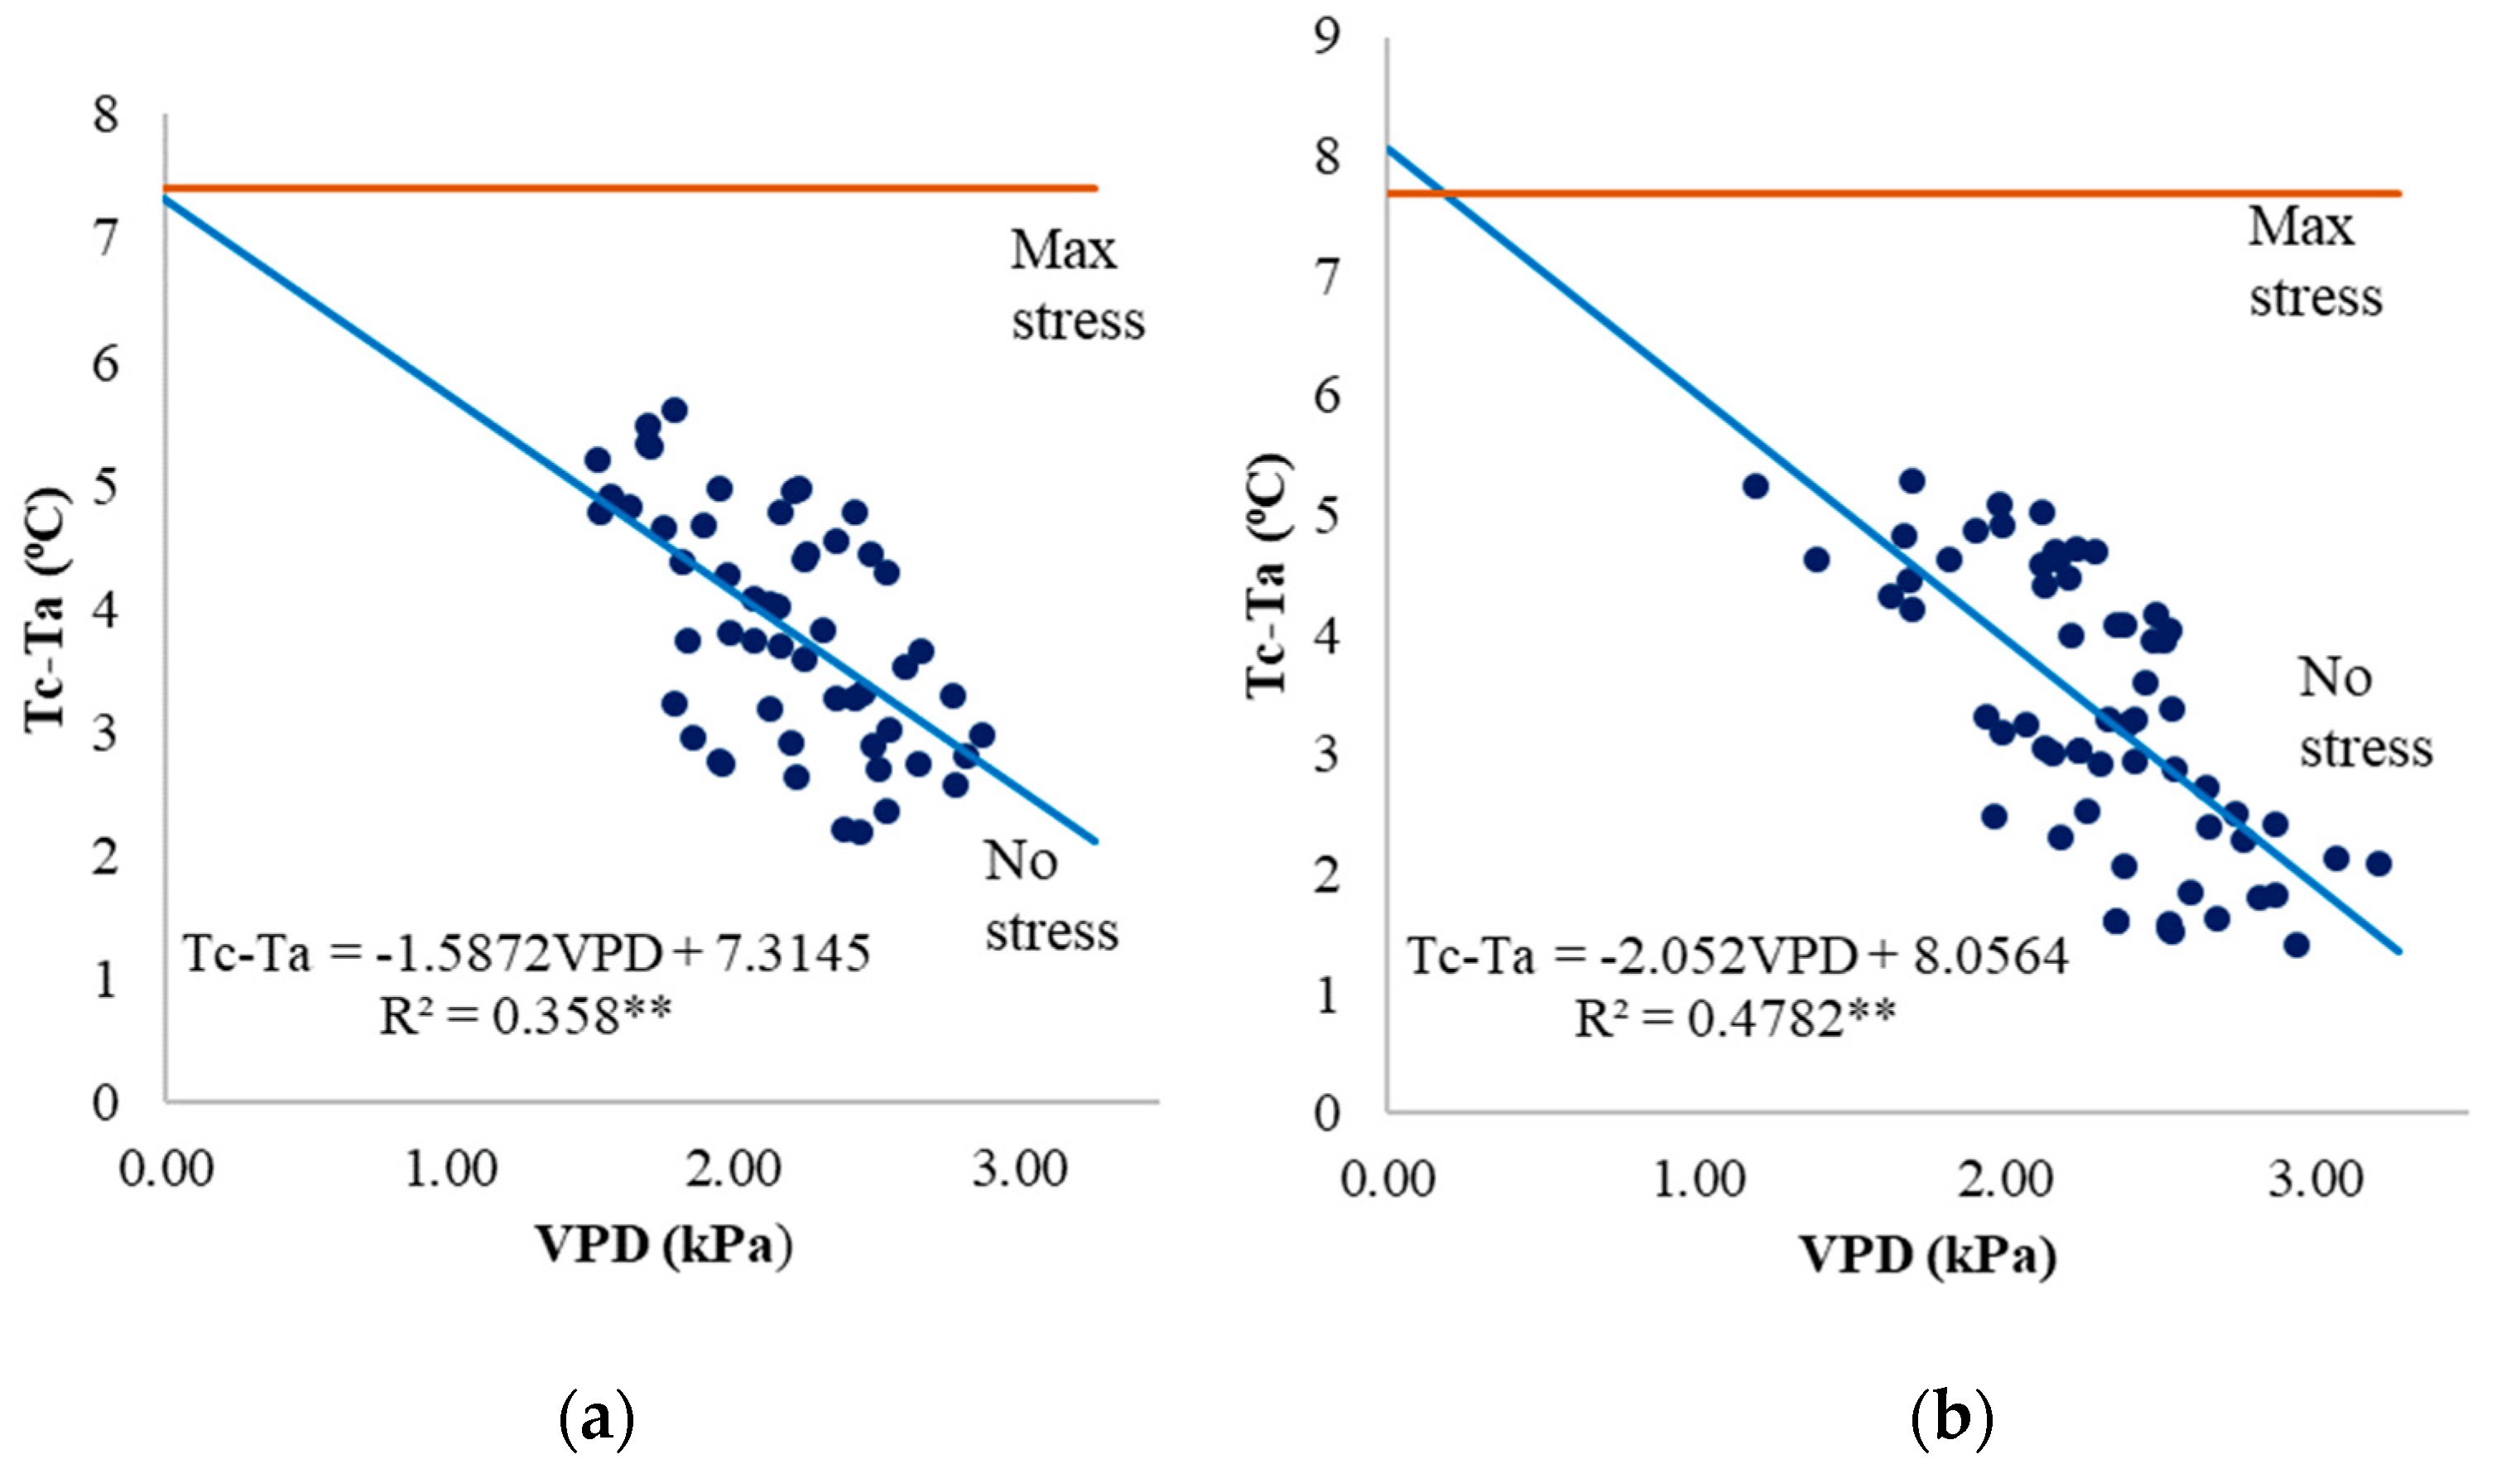
All treatments had statistically significant effects on IWP and WP values. The greatest IWP (0.61 g m−2 mm−1) was obtained from SDI WS I70 treatment and the lowest IWP (0.06 g m−2 mm−1) was obtained from SI CS I50 treatment (Table 4). According to the values of IWP, it is clear that WS turf as the turf type, SDI method as the irrigation method and a high irrigation threshold (I70) used irrigation water more effectively in respect to other options. The upper and lower baselines required to compute CWSI are depicted separately for both turf types in Figure 2. The upper limit, (Tc–Ta)ul, was 7.41 and 7.68 for CS turf and WS turf, respectively, when the air temperature at solar noon was 30 °C. In similar studies, Throssell et al. [30] determined that the upper limit for Kentucky bluegrass, cool-season grass was 12.71 °C, and Emekli et al. [18] reported that the upper limit for Bermudagrass was 11.22 °C at the solar noon temperature of 40 °C. The equation of lower limit was found to be (Tc–Ta)ll = −1.5872 VPD + 7.3145 for CS and (Tc–Ta)ll = −2.052 VPD + 8.0564 for WS (Figure 2). Idso [31] and Jalali-Farahani et al. [32] reported similar relations to those found in this study.
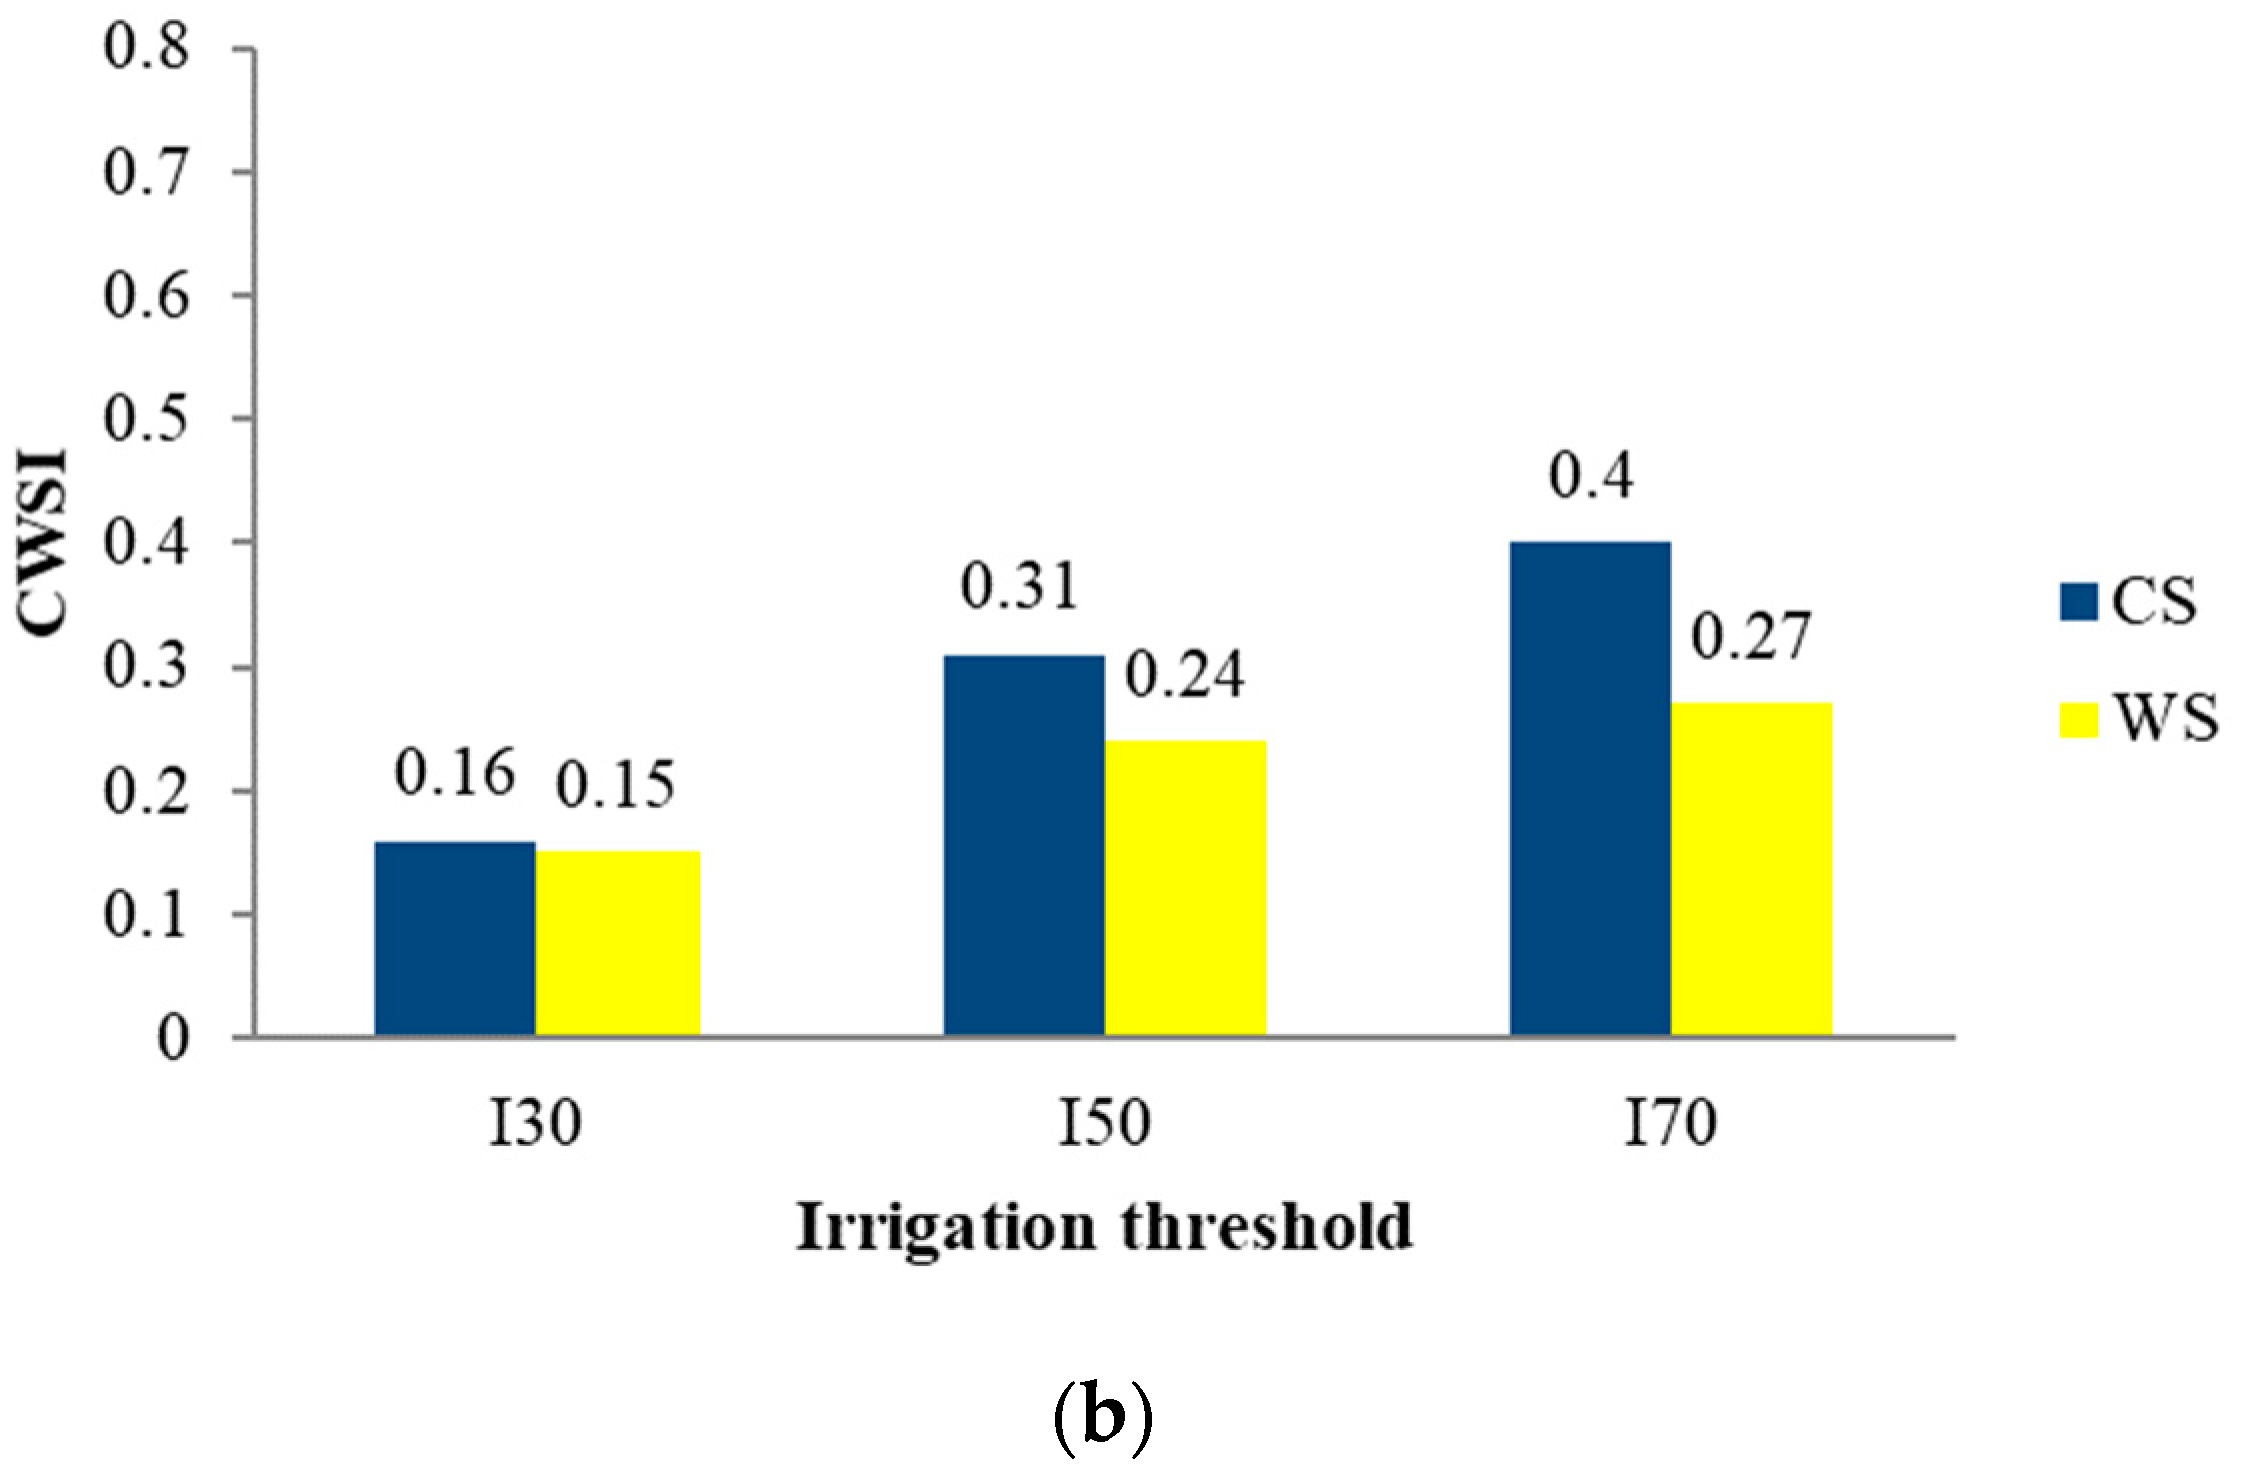
However, many researchers pointed out that crop and local conditions could impact on the baseline relation, causing differentiation [15,31,33,34]. Seasonal CWSI values and average CWSI values just before irrigation are presented in Figure 3. All CWSI values in CS turf are a little bit higher than those of WS turf. According to these results, it can be said that CS turf is more sensitive to drought in respect to WS turf. Besides, the lowest value of CWSI was observed in I30 treatments and the highest one was reached in I70 treatments for both turf species. The seasonal mean values of the CWSI for the full irrigated treatments were found as 0.16 and 0.15 for the I30 of CS and WS, while the mean CWSI values for the stressful treatments were 0.40 and 0.27 for the I70 subjects, respectively.
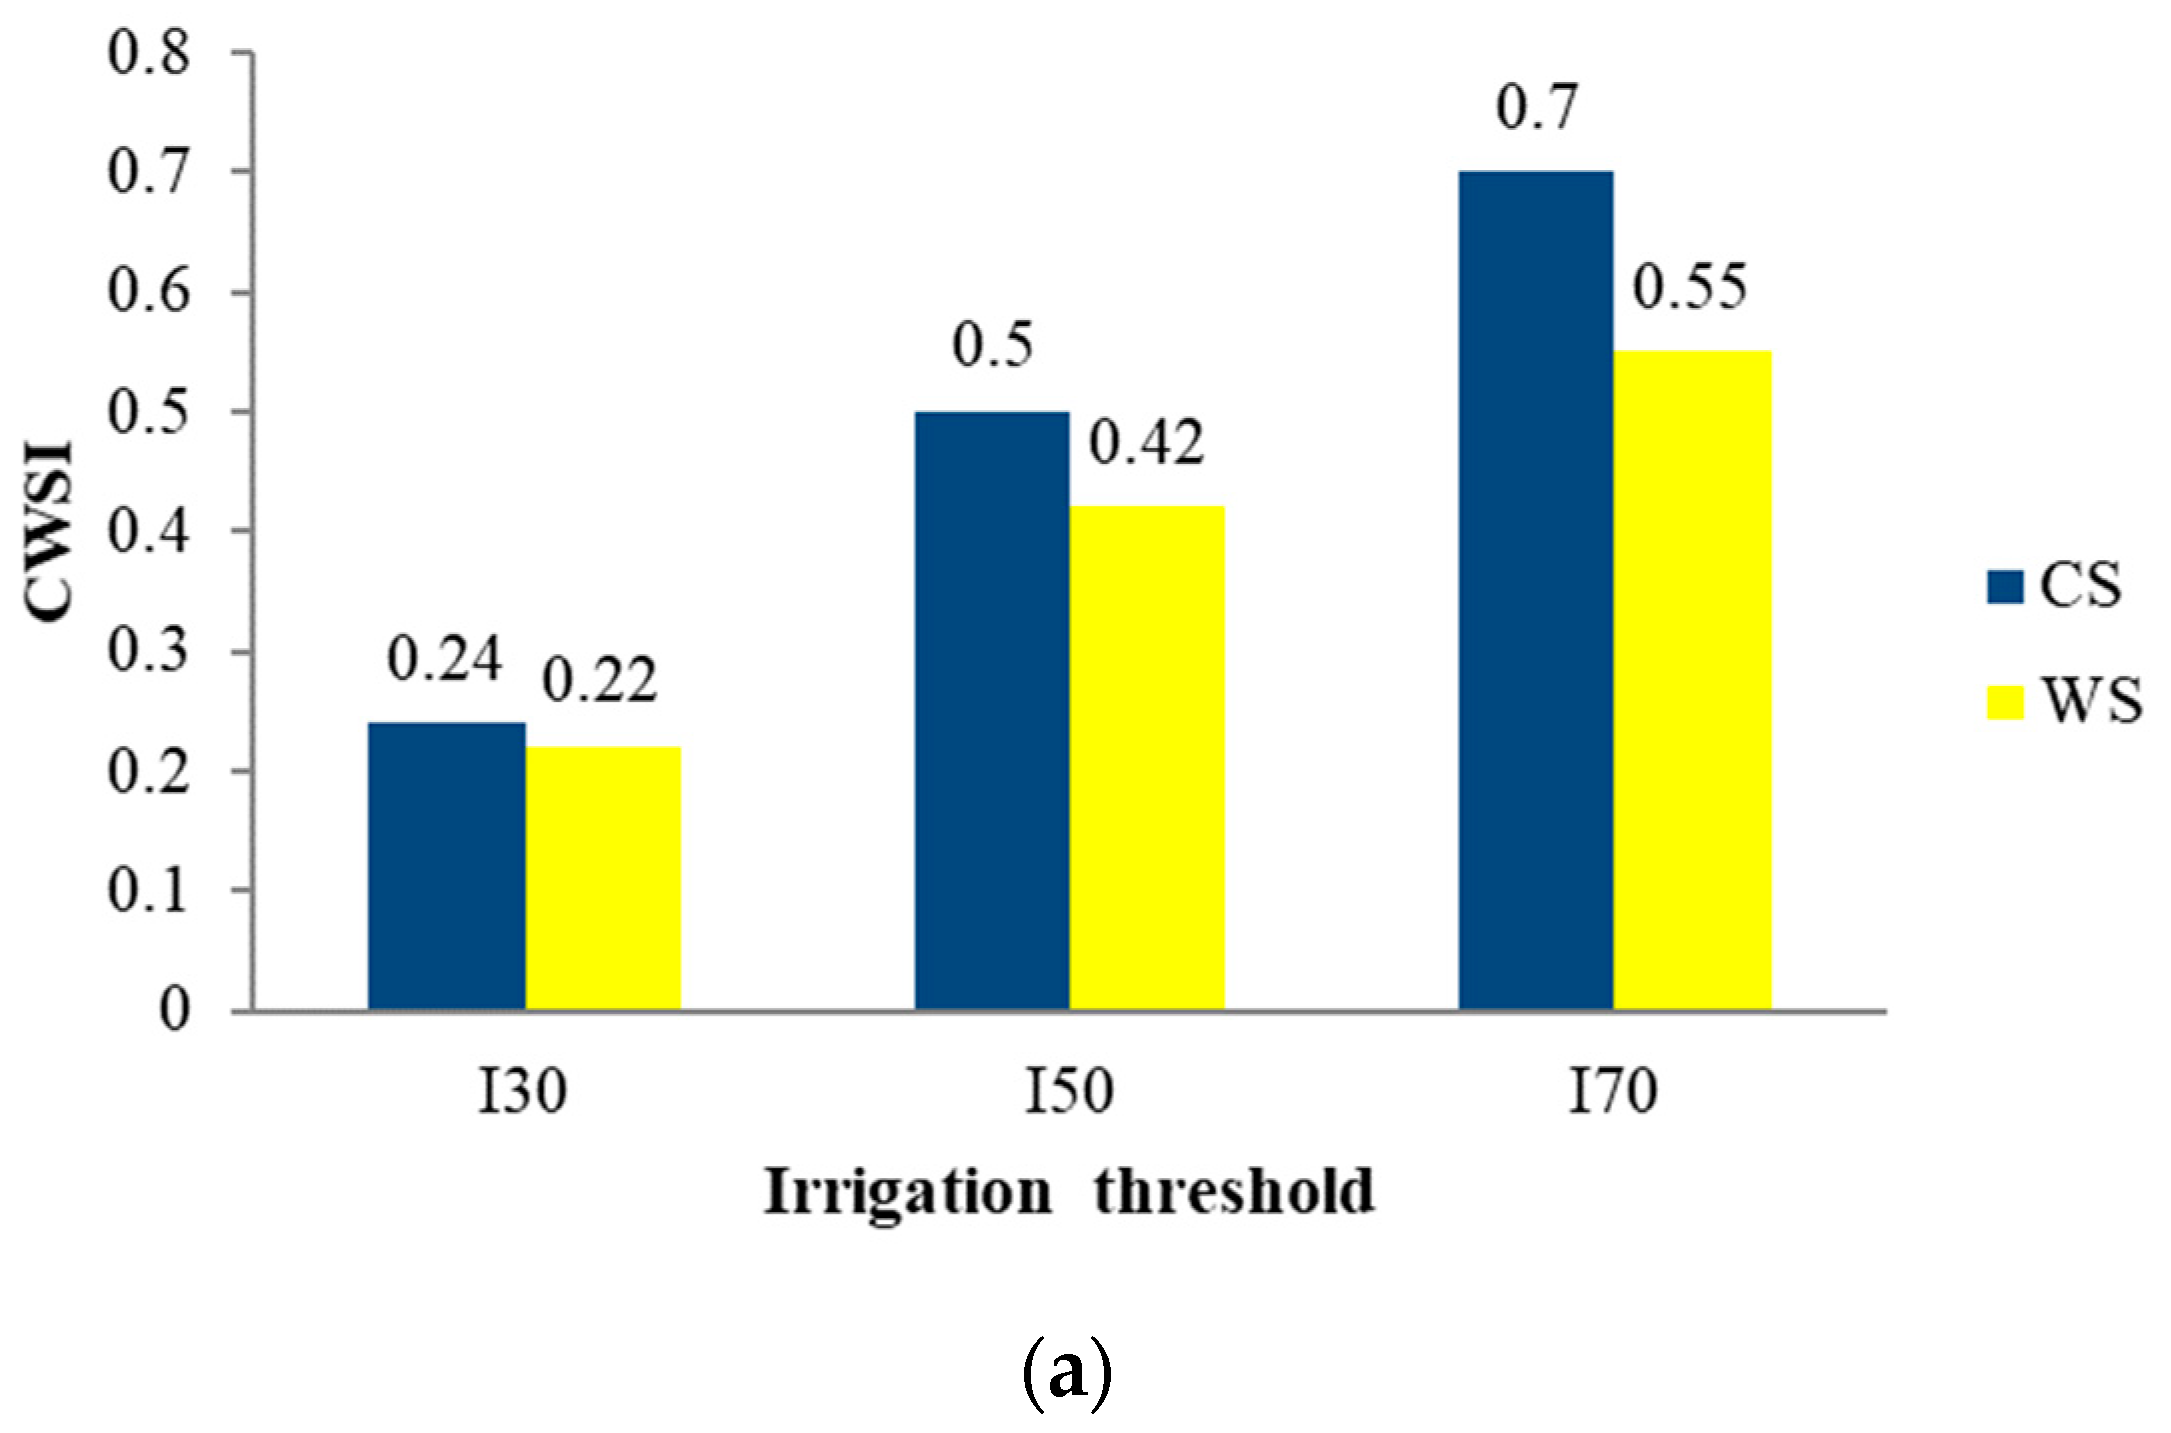
In all treatments, CWSI values increased with soil moisture deficit and reached peak values just before irrigation. The mean CWSI before irrigation, i.e., irrigation threshold, ranged between 0.22 and 0.70 depending on turf type and irrigation scheduling. The obtained values in Figure 3 are in line with the data previously explained in different studies [18,35,36,37,38,39] for different regional and climatic conditions. Depending on these results, current CWSI values might be used as a crop water stress index for grasses.
4. Conclusions
A comparison of subsurface drip irrigation versus sprinkler irrigation on both cool-season turfgrass mix (10% Poa pratensis, 25% Festuca rubra var. rubra, 30% Lolium perenne, 35% Festuca arundinacea) and warm-season (Bermuda) grass was made in Thrace, a semi-arid region of Turkiye. The study focused on the water use requirements of different turf types, optimum irrigation scheduling via soil and plant-based methods, and advantages of subsurface drip irrigation relative to sprinkler irrigation. At the end of two-year field study, it was found that:
- The healthiest and the best visually appealing turf was maintained at optimum soil moisture levels (I30) in all main and sub-treatments. At this irrigation threshold, max and min amounts of irrigation water was applied in SI CS I30 treatment (523.5 mm) and SDI WS I30 treatment (298.6 mm), respectively. In other words, CS turf under SI method required 75% more water than WS turf under SDI method.
- The target of sustainable water saving has been proven and irrigation water conservation of about 30% was achieved with SDI. The main reasons of water saving in SDI were low evaporation from soil surface and no wind effect.
- Not only the irrigation method selected, but also the turf type, affected the seasonal amount of irrigation water. WS turf required up to 40% less water than CS turf mix. In addition, the clipping range is much higher than CS turf mix. However, WS turf cannot maintain its green appearance all year round, provided that the ambient temperature drops to 15–18 °C and below. Therefore, the use CS turf may be recommended for landscaping with I50 treatment where 12 months green is targeted. If the green visual characteristics are desired only in the summer months, it can be recommended to use WS turf and apply the I70 treatment.
- I30 treatment provided the best visual quality with the highest water consumption. However, in the regions with limited water resources, I50 treatment for CS and I70 treatment for WS can be suggested for acceptable visual quality, with lower water consumption and less frequently clipping, if some sacrifice is considered for color and quality.
- When evaporation from Class A Pan was used in irrigation scheduling, the irrigation interval could be 5 days and 10 days for CS and WS, respectively. Totals of 60% and 30% of evaporated water from class A pan can be applied as irrigation water amount via SI method for CS and WS, respectively. Under the SDI method, only 0.50 Epan and 0.25 Epan are enough as the amount of irrigation water for CS and WS, respectively.
- The average CWSI values just before irrigation for I30, I50, I70 treatments in CS plots were found to be 0.24, 0.50 and 0.70, respectively. The same values for WS plots were 0.22, 0.42 and 0.55 in I30, I50, I70 treatments, respectively. According to these results, it can be said that CWSI is a valuable tool for monitoring and quantifying water stress and scheduling irrigations.
Author Contributions
Conceptualization, A.H.O., M.T. and Y.A.; Writing—original draft preparation, A.H.O. and Y.A.; Writing—review and editing, M.T. and Y.A. All authors have read and agreed to the published version of the manuscript.
Funding
The authors declare that no funds, grants, or other support were received during the preparation of this manuscript. The authors have no relevant financial or non-financial interests to disclose.
Institutional Review Board Statement
Not applicable.
Informed Consent Statement
Not applicable.
Data Availability Statement
Not applicable.
Conflicts of Interest
The authors declare no conflict of interest.
References
- Fader, M.; Giupponi, C.; Burak, S.; Dakhlaoui, H.; Koutroulis, A.; Lange, M.A.; Llasat, M.C.; Pulido-Velazquez, D.; Sanz-Cobeña, A.; Grillakis, M.; et al. Climate and Environmental Change in the Mediterranean Basin—Current Situation and Risks for the Future; First Mediterranean Assessment Report; Cramer, W., Guiot, J., Marini, K., Eds.; UNEP/MAP: Marseille, France, 2020; pp. 184–236. [Google Scholar]
- Serena, M.; Velasco-Cruz, C.; Friell, J.; Schiavon, M.; Sevostianova, M.; Beck, L.; Sallenave, R.; Leinauer, B. Irrigation scheduling technologies reduce water use and maintain turfgrass quality. J. Agron. 2020, 112, 3456–3469. [Google Scholar] [CrossRef]
- Hatfield, J. Turfgrass and climate change. J. Agron. 2017, 109, 1708–1718. [Google Scholar] [CrossRef] [Green Version]
- Camp, C.R. Subsurface drip irrigation: A review. ASAE Pap. 1998, 41, 1353–1367. [Google Scholar] [CrossRef]
- Suarez-Rey, E.; Choi, C.Y.; Waller, P.M.; Kopec, D.M. Comparison of subsurface drip irrigation and sprinkler irrigation for Bermuda grass turf in Arizona. Trans. ASAE 2000, 43, 631–640. [Google Scholar] [CrossRef]
- Pinnix, G.D.; Miller, G.L. Comparing evapotranspiration rates of tall fescue and bermudagrass in North Carolina. Agric. Water Manag. 2019, 223, 105725. [Google Scholar] [CrossRef]
- Milesi, C.; Running, S.W.; Elvidge, C.D.; Dietz, J.B.; Tuttle, B.T.; Nemani, R.R. Mapping and modeling the biogeochemical cycling of turfgrasses in the United States. Environ. Manag. 2005, 36, 426–438. [Google Scholar] [CrossRef]
- Leinauer, B.; Smeal, D. Turfgrass Irrigation; New Mexico State University Circular 660; College of Agricultural, Consumer and Environmental Sciences: Urbana, IL, USA, 2012; pp. 1–12. [Google Scholar]
- Kim, K.S.; Beard, J.B. Comparative turfgrass evapotranspiration rates and associated plant morphological characteristics. Crop Sci. 2010, 28, 328–331. [Google Scholar] [CrossRef]
- Carrow, R.N. Drought resistance aspects of turfgrasses in the southeast: Evapotranspiration and crop coefficients. Crop Sci. 1995, 35, 1685–1690. [Google Scholar] [CrossRef]
- Wherley, B.; Dukes, M.D.; Cathey, S.; Miller, G.; Sinclair, T. Consumptive water uses and crop coefficients for warm-season turfgrass species in the Southeastern United States. Agric. Water Manag. 2015, 156, 10–18. [Google Scholar] [CrossRef]
- Amgain, N.R.; Harris, D.K.; Thapa, S.B.; Martin, D.L.; Wu, Y.; Moss, J.Q. Evapotranspiration rates of turf bermudagrasses under non-limiting soil moisture conditions in Oklahoma. Crop Sci. 2018, 58, 1409–1415. [Google Scholar] [CrossRef]
- Haghverdi, A.; Reiter, M.; Sapkota, A.; Singh, A. Hybrid Bermudagrass and tall fescue turfgrass irrigation in Central California: I. Assessment of visual quality, soil moisture and performance of an ET-based smart controller. Agronomy 2021, 11, 1666. [Google Scholar] [CrossRef]
- Burgin, H.R. Hybrid Bermudagrass and Kentucky Bluegrass Response Under Deficit Irrigation in a Semi-Arid, Cool Season Climate. Master’s Thesis, Brigham Young University, Provo, UT, USA, 2021. [Google Scholar]
- Idso, S.B.; Jackson, R.D.; Pinter, P.J., Jr. Normalizing the stress- degree- day parameter for environmental variability. J. Agric. Meteorol. 1981, 24, 45–55. [Google Scholar] [CrossRef]
- Jalali-Farahani, H.R.; Slack, D.C.; Kopec, D.M.; Matthias, A.D.; Brown, P.W. Evaluation of resistances for bermudagrass turf crop water stress index models. J. Agron. 1994, 86, 574–581. [Google Scholar] [CrossRef]
- Bijanzadeh, E.; Naderi, R.; Emam, Y. Determination of crop water stress index for irrigation scheduling of turfgrass (Cynodon dactylon L. Pers.) under drought conditions. J. Plant Physiol. 2013, 3, 13–22. [Google Scholar]
- Emekli, Y.; Baştuğ, R.; Büyüktaş, D.; Emekli, N.Y. Evaluation of a crop water stress index for irrigation scheduling of bermudagrass. Agric. Water Manag. 2007, 90, 205–212. [Google Scholar] [CrossRef]
- U.S. Salinity Laboratory Staff. Diagnosis and Improvement of Saline and Alkali Soils; Handbook 60; U.S. Government Printing Office: Washington, DC, USA, 1954.
- Allen, R.G.; Pereira, L.S.; Raes, D.; Smith, M. Crop Evapotranspiration: Guidelines for Computing Crop Water Requirements; FAO Irrigation and Drainage Paper 56; FAO: Rome, Italy, 1998. [Google Scholar]
- Heerman, D.F. Evapotranspiration in Irrigation Management. In Proceedings of the National Conference on Advance in Evapotranspiration, Chicago, IL, USA, 16–17 December 1985. [Google Scholar]
- Brede, A.D.; Duich, J.M. Establishment characteristics of Kentucky bluegrass-perennial ryegrass turf mixtures affected by seeding rate and ratio. J. Agron. 1984, 76, 875–879. [Google Scholar] [CrossRef]
- Avcıoğlu, R. Çim Tekniği, Yeşil Alanların Ekimi, Dikimi ve Bakımı; Ege Üniversitesi Yayınları: Bornova, İzmir, 1997. (In Turkish) [Google Scholar]
- Kopec, D.M.; Umeda, K. Mowing Turfgrasses in the Desert. Available online: https://extension.arizona.edu/sites/extension.arizona.edu/files/pubs/az1681-2015.pdf (accessed on 22 October 2022).
- Zhang, H.; Owesis, T. Water–yield relations and optimal irrigation scheduling o wheat in the Mediterranean Region. Agric. Water Manag. 1999, 38, 195–211. [Google Scholar] [CrossRef]
- Synder, G.H.; Burt, E.O. The potential of subsurface irrigation for reducing water usage in turfgrass. Rasen Grünfl. Begrün. 1980, 11, 31–35. [Google Scholar]
- Esmailpourmoghadam, E.; Salehi, H. Tall fescue is a super turfgrass: Tolerance to shade conditions under deficit irrigation. J. Saudi Soc. Agric. Sci. 2021, 20, 290–301. [Google Scholar]
- Hejl, R.W.; Wherley, B.G.; Fontanier, C.H. Long-term performance of warm-season turfgrass species under municipal irrigation frequency restrictions. Hortscience 2021, 56, 1221–1225. [Google Scholar] [CrossRef]
- Sandor, D. Water Conservation Practices for Irrigation of Turfgrass Lawns. Doctoral Thesis, University of Arkansas, Fayetteville, NC, USA, 2019. [Google Scholar]
- Throssell, C.S.; Carrow, R.N.; Milliken, G.A. Canopy temperature based irrigation scheduling indices for Kentucky bluegrass turf. Crop Sci. 1987, 27, 126–131. [Google Scholar] [CrossRef]
- Idso, S.B. Non-water stressed baselines: A key to monitoring and interpreting plant water stress. J. Agric. Meteorol. 1982, 27, 59–77. [Google Scholar] [CrossRef]
- Jalali-Farahani, H.R.; Slack, D.C.; Kopec, D.M.; Matthias, A.D. Crop water stress index models for bermudagrass turf: A comparison. J. Agron. 1993, 85, 1210–1217. [Google Scholar] [CrossRef]
- Jackson, R.D. Canopy Temperature and Crop Water Stress. In Advances in Irrigation; Hillel, D., Ed.; Academic Press: New York, NY, USA, 1982; pp. 43–85. [Google Scholar]
- Alves, I.; Pereira, L.S. Non-water stressed baselines for irrigation scheduling with infrared thermometers, a new approach. Irrig. Sci. 2000, 19, 101–106. [Google Scholar] [CrossRef]
- Garrot, D.J.; Kilby, M.W.; Fangmeier, D.D.; Husman, S.H.; Ralowicz, A.E. Production, growth, and nut quality in pecans under water-stress based on the crop water-stress index. J. Am. Soc. Hortic. Sci. 1993, 118, 694–698. [Google Scholar] [CrossRef] [Green Version]
- Irmak, S.; Haman, D.Z.; Baştuğ, R. Determination of crop water stress index for irrigation timing and yield estimation of corn. J. Agron. 2000, 92, 1221–1227. [Google Scholar] [CrossRef]
- Alderfasi, A.A.; Nielsen, D. Use of water stress index for monitoring water status and scheduling irrigation in wheat. Agric. Water Manag. 2001, 47, 69–75. [Google Scholar] [CrossRef]
- Cremona, M.V.; Stützel, H.; Kage, H. Irrigation scheduling of kholrabi (Brassica oleracea var. Gongylodes) using crop water stress index. Hort. Sci. 2004, 39, 276–279. [Google Scholar]
- Orta, A.H.; Erdem, Y.; Erdem, T. Crop water stress index for watermelon. Sci. Hort. 2003, 98, 121–130. [Google Scholar] [CrossRef]
Figure 1.
Experimental plots design.

Figure 2.
Stressed and non-stressed baselines for Crop Water Stress Index (CWSI) calculations of (a) cool–season turf types and (b) warm-season turf type (** p < 0.01).
Figure 2.
Stressed and non-stressed baselines for Crop Water Stress Index (CWSI) calculations of (a) cool–season turf types and (b) warm-season turf type (** p < 0.01).

Figure 3.
Average CWSI values just before irrigation (a) and for the whole season (b) of warm-season (WS) and cool-season (CS) turfgrass and different irrigation thresholds.
Figure 3.
Average CWSI values just before irrigation (a) and for the whole season (b) of warm-season (WS) and cool-season (CS) turfgrass and different irrigation thresholds.


Table 1.
Monthly climatic parameters for long term (1997–2016) and experimental years.
| Climatic Parameters | Months | Annual Average | ||||||||||||
|---|---|---|---|---|---|---|---|---|---|---|---|---|---|---|
| January | February | March | April | May | June | July | August | September | October | November | December | |||
| Long term (1997–2016) | Mean temperature (°C) | 4.70 | 5.40 | 7.30 | 11.80 | 16.80 | 21.30 | 23.80 | 23.80 | 20.00 | 15.40 | 11.00 | 7.10 | 14.00 |
| Sunshine duration (h/day) | 2.40 | 3.20 | 4.10 | 5.40 | 7.40 | 9.60 | 9.50 | 9.00 | 7.20 | 4.50 | 3.20 | 2.30 | 67.68 | |
| Average precipitation days | 12.20 | 10.50 | 10.60 | 9.30 | 8.20 | 7.20 | 3.60 | 2.50 | 4.60 | 7.60 | 9.50 | 12.10 | 97.90 | |
| Monthly precipitation (mm) | 68.30 | 54.30 | 54.70 | 40.70 | 36.90 | 37.90 | 22.50 | 13.20 | 33.90 | 61.70 | 75.30 | 81.40 | 580.80 | |
| Mean relative humidity (%) | 84.00 | 81.60 | 80.80 | 77.80 | 75.00 | 72.50 | 69.00 | 70.10 | 74.60 | 80.40 | 83.90 | 83.10 | 77.70 | |
| Average wind speed (m/s) | 3.00 | 3.10 | 2.80 | 2.30 | 2.20 | 2.20 | 2.60 | 2.70 | 2.60 | 2.70 | 2.70 | 3.10 | 2.66 | |
| Evaporation (mm) | - | - | - | 62.40 | 112.40 | 138.10 | 176.80 | 170.20 | 113.20 | 67.80 | 22.60 | 9.20 | 872.70 | |
| Year of 2017 | Mean temperature (°C) | 1.71 | 5.86 | 8.70 | 10.75 | 16.20 | 21.14 | 23.36 | 23.86 | 21.01 | 14.34 | 10.21 | 6.14 | 13.60 |
| Mean monthly precipitation (mm) | 115.40 | 46.00 | 41.60 | 31.80 | 54.00 | 38.00 | 78.80 | 15.60 | 16.80 | 62.40 | 42.70 | 113.50 | 656.6 | |
| Mean relative humidity (%) | 83.48 | 79.08 | 79.65 | 72.07 | 74.18 | 75.20 | 66.73 | 67.61 | 65.58 | 76.51 | 80.11 | 79.20 | 75.00 | |
| Average wind speed (m/s) | 2.90 | 2.40 | 2.10 | 1.70 | 1.90 | 1.30 | 1.90 | 1.90 | 1.60 | 1.30 | 3.40 | 3.20 | 2.13 | |
| Evaporation (mm) a | - | - | - | - | - | - | 72.40 b | 220.60 | 157.70 | - | - | - | - | |
| Reference ET (mm) | - | - | - | - | - | - | 51.26 b | 144.46 | 108.00 | - | - | - | - | |
| Year of 2018 | Mean temperature (°C) | 5.69 | 6.04 | 8.60 | 14.16 | 18.59 | 21.69 | 24.36 | 25.20 | 20.60 | 15.92 | 11.45 | 5.43 | 14.81 |
| Mean monthly precipitation (mm) | 52.90 | 58.10 | 83.50 | 26.80 | 80.80 | 65.00 | 39.00 | 1.40 | 120.20 | 29.60 | 75.80 | 105.00 | 738.10 | |
| Mean relative humidity (%) | 84.93 | 91.62 | 86.15 | 63.65 | 79.61 | 75.97 | 72.60 | 68.96 | 75.64 | 80.99 | 84.72 | 89.77 | 79.56 | |
| Average wind speed (m/s) | 3.64 | 4.84 | 4.16 | 3.94 | 1.59 | 1.50 | 1.27 | 2.06 | 1.83 | 1.70 | 2.40 | 2.50 | 2.62 | |
| Evaporation (mm) a | - | - | - | - | 105.21 | 190.25 | 221.45 | 283.23 | 66.10 c | - | - | - | - | |
| Reference ET (mm) | - | - | - | - | 96.41 | 130.80 | 150.97 | 151.59 | 67.60 c | - | - | - | - | |
Note(s): a: obtained from Class A pan, b: refers to last 10 days of month, c: refers to first 20 days of month.
Table 2.
Total number of irrigations, total amount of irrigation water applied and seasonal ETc.
| Irrigation Method | Turf Type | Irrigation Threshold | Irrigation Number | Irrigation Water Amount (mm) | Rainfall (mm) | Evaporation (mm) | Seasonal ETc (mm) |
|---|---|---|---|---|---|---|---|
| 2017 | |||||||
| SI | CS | I30 | 30 | 501.6 | 53.3 | 457.8 | 510.5 |
| I50 | 11 | 295.8 | 384.9 | ||||
| I70 | 7 | 238.5 | 317.8 | ||||
| WS | I30 | 24 | 416.7 | 488.8 | |||
| I50 | 8 | 229.2 | 324.4 | ||||
| I70 | 4 | 140.7 | 211.0 | ||||
| SDI | CS | I30 | 24 | 324.2 | 53.3 | 457.8 | 382.7 |
| I50 | 12 | 267.1 | 343.9 | ||||
| I70 | 7 | 195.7 | 260.2 | ||||
| WS | I30 | 22 | 298.6 | 357.9 | |||
| I50 | 9 | 203.6 | 260.9 | ||||
| I70 | 4 | 117.1 | 188.4 | ||||
| 2018 | |||||||
| SI | CS | I30 | 36 | 523.5 | 290.0 | 874.8 | 754.8 |
| I50 | 23 | 506.0 | 636.0 | ||||
| I70 | 11 | 275.3 | 521.9 | ||||
| WS | I30 | 31 | 423.8 | 590.1 | |||
| I50 | 20 | 368.2 | 560.7 | ||||
| I70 | 8 | 186.2 | 521.5 | ||||
| SDI | CS | I30 | 26 | 371.2 | 290.0 | 874.8 | 695.2 |
| I50 | 17 | 349.3 | 609.3 | ||||
| I70 | 11 | 273.1 | 498.1 | ||||
| WS | I30 | 24 | 321.2 | 561.2 | |||
| I50 | 15 | 310.5 | 555.5 | ||||
| I70 | 8 | 165.8 | 441.1 | ||||
Table 3.
Some growth and quality parameters of turf for all treatments in the year of 2017.
| Irrigation Method | Turf Type | Irrigation Threshold | Vegetation Height (cm) | Surface Coverage | Color | Quality |
|---|---|---|---|---|---|---|
| SDI | CS | I30 | 13.49 b1 | 8.67 b | 9.00 a | 8.70 a |
| I50 | 13.18 c | 7.28 c | 8.06 b | 8.67 a | ||
| I70 | 12.68 d | 7.06 d | 7.22 c | 8.08 c | ||
| WS | I30 | 12.35 e | 9.00 a | 6.44 e | 8.26 bc | |
| I50 | 12.02 g | 9.00 a | 6.22 e | 8.59 a | ||
| I70 | 12.16 f | 9.00 a | 6.17 e | 8.26 bc | ||
| SI | CS | I30 | 15.32 a | 8.61 b | 9.00 a | 8.61 a |
| I50 | 12.00 g | 7.11 d | 6.61 d | 5.39 d | ||
| I70 | 9.17 ı | 6.00 e | 4.06 f | 4.61 e | ||
| WS | I30 | 12.77 d | 9.00 a | 6.22 e | 8.28 bc | |
| I50 | 10.94 h | 9.00 a | 6.00 e | 8.67 a | ||
| I70 | 10.84 h | 9.00 a | 5.94 e | 8.33 b | ||
| LSD | 0.11 ** | 0.11 ** | 0.32 ** | 0.21 ** | ||
| SDI | 12.65 a | 8.33 a | 7.19 a | 8.43 a | ||
| SI | 11.84 b | 8.12 b | 6.31 b | 7.32 b | ||
| LSD | 0.06 ** | 0.03 ** | 0.12 ** | 0.14 ** | ||
| CS | 12.64 a | 7.46 b | 7.33 a | 7.34 b | ||
| WS | 11.85 b | 9.00 a | 6.17 b | 8.40 a | ||
| LSD | 0.06 ** | 0.03 ** | 0.14 ** | 0.14 ** | ||
| I30 | 13.48 a | 8.82 a | 7.67 a | 8.46 a | ||
| I50 | 12.04 b | 8.10 b | 6.72 b | 7.83 b | ||
| I70 | 11.21 c | 7.76 c | 5.85 c | 7.32 c | ||
| LSD | 0.06 ** | 0.06 ** | 0.16 ** | 0.10 ** |
Note(s): 1: Mean values in the same column followed by the same letter do not differ significantly at the 0.05 level according to LSD test. ns: not significant, *: significant at p < 0.05, **: significant at p < 0.01.
Table 4.
Some growth and quality parameters of turf and water use efficiencies for all treatments in the year of 2018.
Table 4.
Some growth and quality parameters of turf and water use efficiencies for all treatments in the year of 2018.
| Irrigati-on Method | Turf Type | Irrigati- on Thresh-old | Vegetati-on Height (cm) | Surface Covera-ge | Color | Quality | Fresh Yield (gm−2) | Dry Matter Yield (gm−2) | IWP (gm−2 mm−1) | WP (gm−2 mm−1) |
|---|---|---|---|---|---|---|---|---|---|---|
| SDI | CS | I30 | 488.33 d1 | 8.49 c | 8.98 a | 8.30 c | 488.33 d | 52.40 ef | 0.14 e | 0.08 ef |
| I50 | 461.00 e | 7.19 d | 7.85 b | 7.10 d | 461.00 e | 39.37 g | 0.11 f | 0.06 fg | ||
| I70 | 428.00 f | 6.55 f | 5.98 d | 6.03 e | 428.00 f | 29.68 h | 0.11 f | 0.06 fgh | ||
| WS | I30 | 1200.00 a | 9.00 a | 6.03 d | 9.00 a | 1200.00a | 152.96 a | 0.48 b | 0.27 a | |
| I50 | 1161.00 b | 9.00 a | 6.03 d | 9.00 a | 1161.00b | 131.39 b | 0.42 c | 0.24 b | ||
| I70 | 1043.67 c | 8.93 a | 5.90de | 8.87ab | 1043.67c | 101.17 c | 0.61 a | 0.23 b | ||
| SI | CS | I30 | 160.13 g | 8.80 b | 8.03 b | 8.57 bc | 160.13 g | 40.50 g | 0.08 g | 0.05 gh |
| I50 | 79.77 h | 6.77 e | 7.63 c | 5.57 f | 79.77 h | 29.73 h | 0.06 h | 0.05 h | ||
| I70 | 65.57 h | 5.90 g | 5.70 f | 5.23 f | 65.57 h | 24.70 h | 0.09 g | 0.05 h | ||
| WS | I30 | 157.33 g | 9.00 a | 5.73 ef | 8.57 bc | 157.33 g | 55.70 de | 0.13 e | 0.09 d | |
| I50 | 150.57 g | 9.00 a | 5.60 f | 8.77 ab | 150.57 g | 47.40 f | 0.13 ef | 0.08 de | ||
| I70 | 154.37 g | 9.00 a | 5.77 ef | 8.53 bc | 154.37 g | 61.83 d | 0.33 d | 0.12 c | ||
| LSD | 24.06 ** | 0.17 ** | 0.20 ** | 0.35 ** | 24.06 ** | 6.41 ** | 0.02 * | 0.01 ** | ||
| SDI | 797.00 a | 8.20 a | 6.80 a | 8.05 a | 797.00 a | 84.49 a | 0.31 a | 0.16 a | ||
| SI | 127.96 b | 8.08 b | 6.39 b | 7.54 b | 127.96 b | 43.31 b | 0.14 b | 0.07 b | ||
| LSD | 13.80 ** | 0.07 ** | 0.08 ** | 0.15 ** | 13.80 ** | 6.15 ** | 0.01 ** | 0.01 ** | ||
| CS | 280.47 b | 7.28 b | 7.36 a | 6.80 b | 280.47 b | 36.06 b | 0.10 b | 0.06 b | ||
| WS | 644.49 a | 8.99 a | 5.82 b | 8.79 a | 644.49 a | 91.74 a | 0.35 a | 0.17 a | ||
| LSD | 11.00 ** | 0.07 ** | 0.08 ** | 0.11 ** | 11.00 ** | 4.44 ** | 0.01 ** | 0.01 ** | ||
| I30 | 501.45 a | 8.82 a | 7.16 a | 8.61 a | 501.45 a | 75.39 a | 0.21 b | 0.12 a | ||
| I50 | 463.08 b | 7.99 b | 6.78 b | 7.61 b | 463.08 b | 61.97 b | 0.18 c | 0.11 b | ||
| I70 | 422.90 c | 7.60 c | 5.84 c | 7.17 c | 422.90 c | 54.34 c | 0.29 a | 0.11 b | ||
| LSD | 12.03 ** | 0.09 ** | 0.10 ** | 0.18 ** | 12.03 ** | 3.2 ** | 0.01 ** | 0.01 ** |
Note(s): 1: Mean values in the same column followed by the same letter do not differ significantly at the 0.05 level according to LSD test. ns: not significant, *: significant at p < 0.05, **: significant at p < 0.01.
Disclaimer/Publisher’s Note: The statements, opinions and data contained in all publications are solely those of the individual author(s) and contributor(s) and not of MDPI and/or the editor(s). MDPI and/or the editor(s) disclaim responsibility for any injury to people or property resulting from any ideas, methods, instructions or products referred to in the content. |
© 2023 by the authors. Licensee MDPI, Basel, Switzerland. This article is an open access article distributed under the terms and conditions of the Creative Commons Attribution (CC BY) license (https://creativecommons.org/licenses/by/4.0/).
Share and Cite
MDPI and ACS Style
Orta, A.H.; Todorovic, M.; Ahi, Y. Cool- and Warm-Season Turfgrass Irrigation with Subsurface Drip and Sprinkler Methods Using Different Water Management Strategies and Tools. Water 2023, 15, 272. https://doi.org/10.3390/w15020272
AMA Style
Orta AH, Todorovic M, Ahi Y. Cool- and Warm-Season Turfgrass Irrigation with Subsurface Drip and Sprinkler Methods Using Different Water Management Strategies and Tools. Water. 2023; 15(2):272. https://doi.org/10.3390/w15020272
Chicago/Turabian StyleOrta, Abdül Halim, Mladen Todorovic, and Yeşim Ahi. 2023. "Cool- and Warm-Season Turfgrass Irrigation with Subsurface Drip and Sprinkler Methods Using Different Water Management Strategies and Tools" Water 15, no. 2: 272. https://doi.org/10.3390/w15020272
Note that from the first issue of 2016, this journal uses article numbers instead of page numbers. See further details here.