Article

Net Anthropogenic Nitrogen Input and Its Relationship with Riverine Nitrogen Flux in a Typical Irrigated Area of China Based on an Improved NANI Budgeting Model

1
Technical Centre for Soil, Agriculture and Rural Ecology and Environment, Ministry of Ecology and Environment, Beijing 100012, China
2
Key Laboratory of Nonpoint Source Pollution Control, Ministry of Agriculture and Rural Affairs, Institute of Agricultural Resources and Regional Planning, Chinese Academy of Agricultural Sciences, Beijing 100081, China
3
College of Environmental Science and Engineering, Jinlin Normal University, Siping 136000, China
4
Agricultural and Animal Husbandry Ecology and Resources Conservation Center of Inner Mongolia, Hohhot 010000, China
*
Authors to whom correspondence should be addressed.
Water 2023, 15(2), 276; https://doi.org/10.3390/w15020276
Submission received: 12 November 2022 / Revised: 18 December 2022 / Accepted: 24 December 2022 / Published: 9 January 2023
(This article belongs to the Section Water, Agriculture and Aquaculture)

Abstract

:
Excessive nitrogen (N) inputs from human activities in the watershed have resulted in water quality deterioration and other biological hazards. It is therefore critical to fully understand the anthropogenic N inputs and their potential impacts on regional water quality. In this study, a modified net anthropogenic nitrogen input (NANI) budgeting model considering the irrigation N input was developed and applied to investigate spatial–temporal variations of anthropogenic N inputs and their relationship with riverine N flux from 2005 to 2019 in a semi-arid irrigated watershed, Ulansuhai Nur watershed (UNW), China. The results showed that the annual average anthropogenic N inputs reached 14,048.0 kg N km−2 yr−1 without a significant temporal change trend. Chemical N fertilizer was the major contributor for watershed NANI and accounted for 75.3% of total NANI. Hotspots for N inputs were located in the central part of the watershed. In this study, watershed NANI does not have a significant regression relationship with riverine N export during the study period. Riverine N export showed an obvious decreased trend, which mainly was attributed to human activities. In addition, approximately 1.92% of NANI was delivered into the water body. Additionally, the N inputs into the watershed by the irrigation water accounted for 9.9% of total NANI. This study not only expands the application range of the NANI model in irrigated watersheds, but also provides useful information for watershed N management strategies.

1. Introduction

Nitrogen (N) is the basic element for all creatures on the earth, but the environmental issues of N-related water pollution have been of important concern [1,2]. Anthropogenic N inputs have altered the global fundamental dynamics of the N cycle in natural systems through fossil fuel combustion, chemical N fertilizer application, and so on [3]. Excessive biological reactive N is delivered into water bodies via hydrological processes, consequently causing adverse environmental impacts including the degradation of aquatic ecosystem health and water quality impairments such as eutrophication and hypoxia in aquatic ecosystems worldwide [4,5]. To formulate the specific watershed N management strategy, it is critical to quantitatively understand and characterize anthropogenic-induced N inputs and their impacts on riverine N flux at the watershed scale [6].
Nowadays, various model methods such as statistical models (e.g., SPARROW) and mechanistic models (e.g., SWAT, HSPF) have been widely used to investigate N dynamics and riverine N export at the watershed scale [7,8]. However, these models have limitations for application because they need enormous data and are too complex for model calibration and validation [7]. Comparatively, the construction of the nutrient budgeting model could give effective information for watershed nutrient management [9]. Among these budgeting models, net anthropogenic nitrogen input (NANI) budgeting model has the characteristics of simple calculation, clear meaning, and easy understanding. It generally includes N sources from chemical N fertilizer, atmospheric N deposition, biological N fixation, and net food/feed import. The quantitative identification of the anthropogenic N inputs and their variations in spatial–temporal patterns by the NANI budgeting model has been reported in the U.S., [10,11,12], Europe [13,14], and Asia [15,16,17]. The significant relationship between NANI and the corresponding riverine N fluxes has been reported in many studies [9,14,18,19]. The proportion of NANI export varied widely across different watersheds, which was attributed to hydrological variables (precipitation, temperature, and discharge) and human activities, which could influence the amount of N retained in or delivered from the watershed [9,20]. Approximately 15–30% of NANI was eventually delivered as riverine N fluxes into the rivers [9], and lower values have been reported in some watersheds with low surface runoff [6,21]. For example, about 2.15–2.89% of NANI was exported into rivers in the Baiyangdian watershed, a semi-arid plain watershed in China [22]. Nowadays, the NANI budgeting approach has been mainly applied in precipitation-driven watersheds [9]. Precipitation and irrigation are the dominant water sources for hydrological processes in the watershed and are also major driving forces for the migration of N at the watershed scales [23]. Irrigation is important for regional economic development, especially agricultural production, and ecological environment in semi-arid or arid areas [24,25]. However, there is limited literature related to the impacts of anthropogenic N inputs on riverine N export in the arid and semi-arid irrigation-driven watersheds.
Ulansuhai Nur watershed (UNW), as a typical irrigation watershed, is in the semi-arid climatic zone with strong evaporation and little precipitation [24]. Hetao Irrigation Area, one of the important agriculture and animal husbandry bases in China, is in this watershed and occupies 43.1% of the UNW. Ulansuhai Nur Lake (UNL), the largest freshwater lake in the Yellow River Basin and the largest natural wetland in the same latitude on the earth, receives most of the agricultural drainage water, industrial wastewater, and domestic sewage produced in the UNW (Figure 1). The lake outflows of the UNL finally enter into the Yellow River. At present, the UNL is suffering from the eutrophication, and its water quality is National Environmental Standard V grade. Excessive nitrogen input is one of the critical pollution factors. The UNL plays an important role in regional ecological stability and water use safety for the downstream of the Yellow River. With the rapid development of social economy, eutrophication became more serious, which not only accelerated the process of planification, but also directly threatened ecological function of the UNL [26]. Therefore, the analysis of anthropogenic nitrogen input in the UNW is of great importance for regional recovery of water quality and environmental protection for the UNL [27].
In this study, a modified NANI budgeting model was developed including a new input item of irrigation N input and adopted to evaluate N input and export and analyze its dynamics in the UNW, a typical semi-arid irrigation watershed in China. The main objectives of this paper were: (1) to investigate the temporal and spatial variations in anthropogenic N inputs; (2) to identify main sources and drivers of N inputs; (3) to explore the relationship between watershed NANI and riverine N flux at the watershed outlet. This study not only expands the application scope of NANI budgeting model, but also provides basic information for N management strategy for the UNW, which is useful for the eutrophication control of the UNL.

2. Materials and Methods

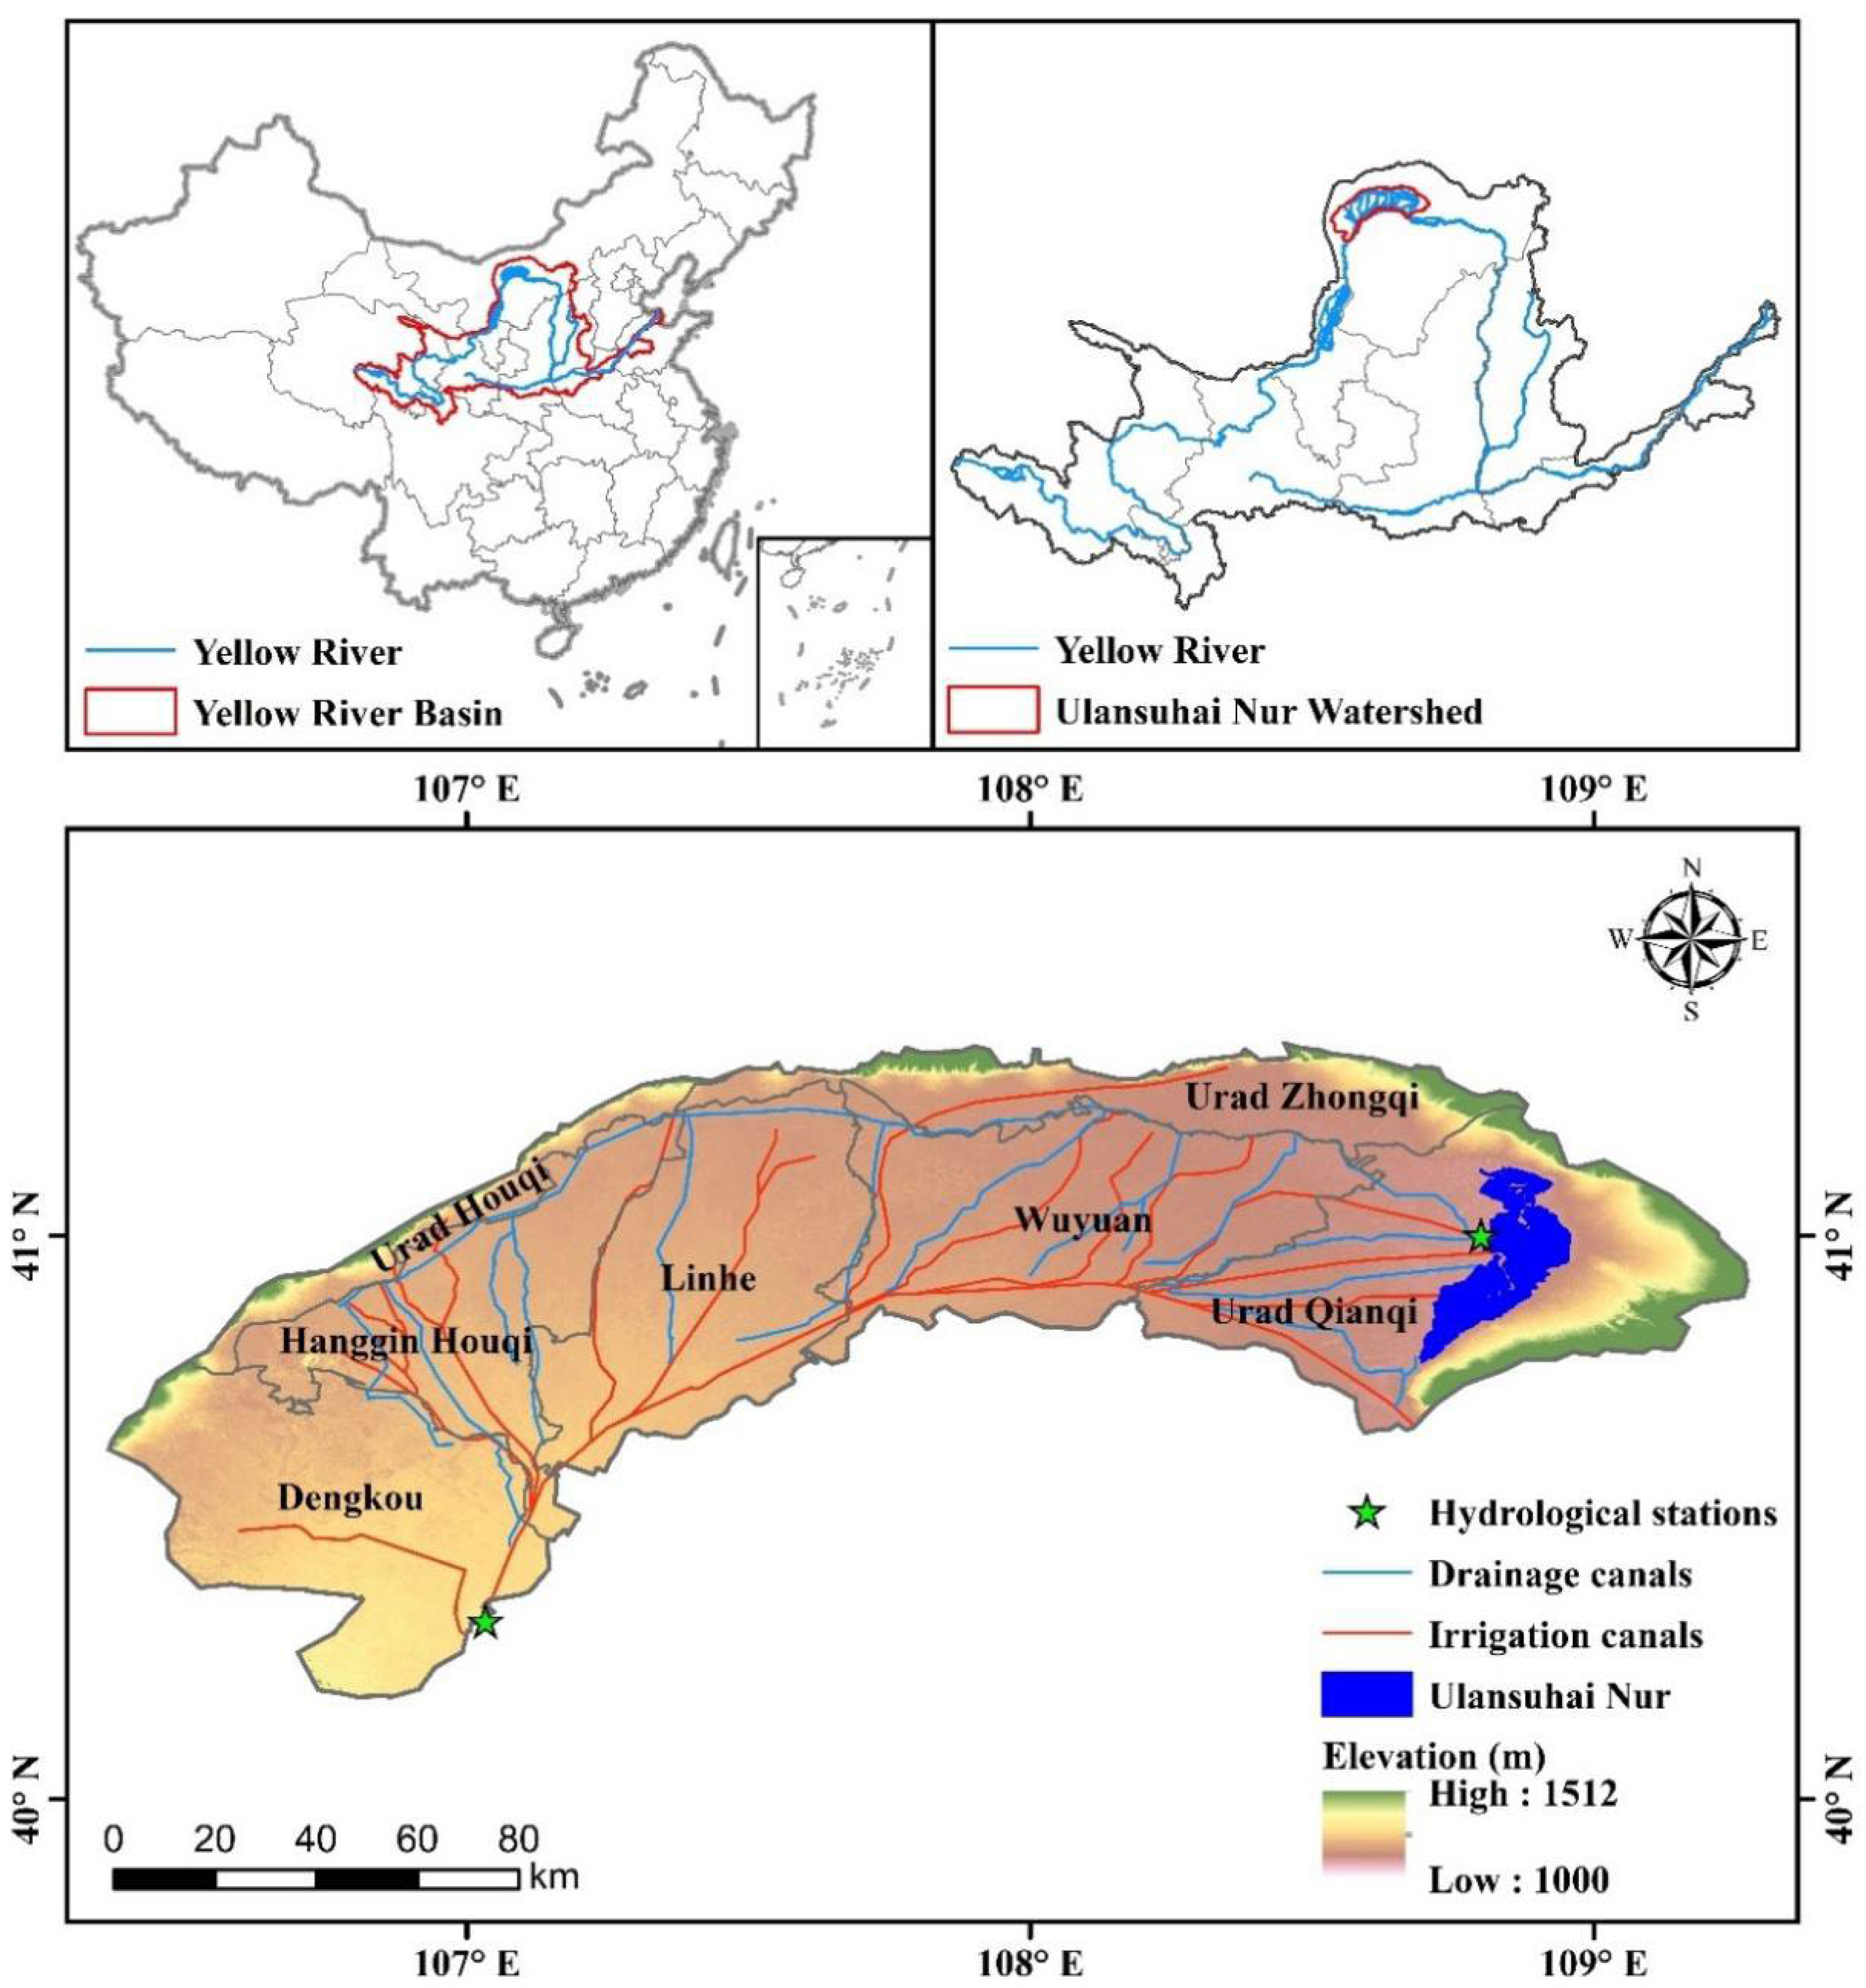
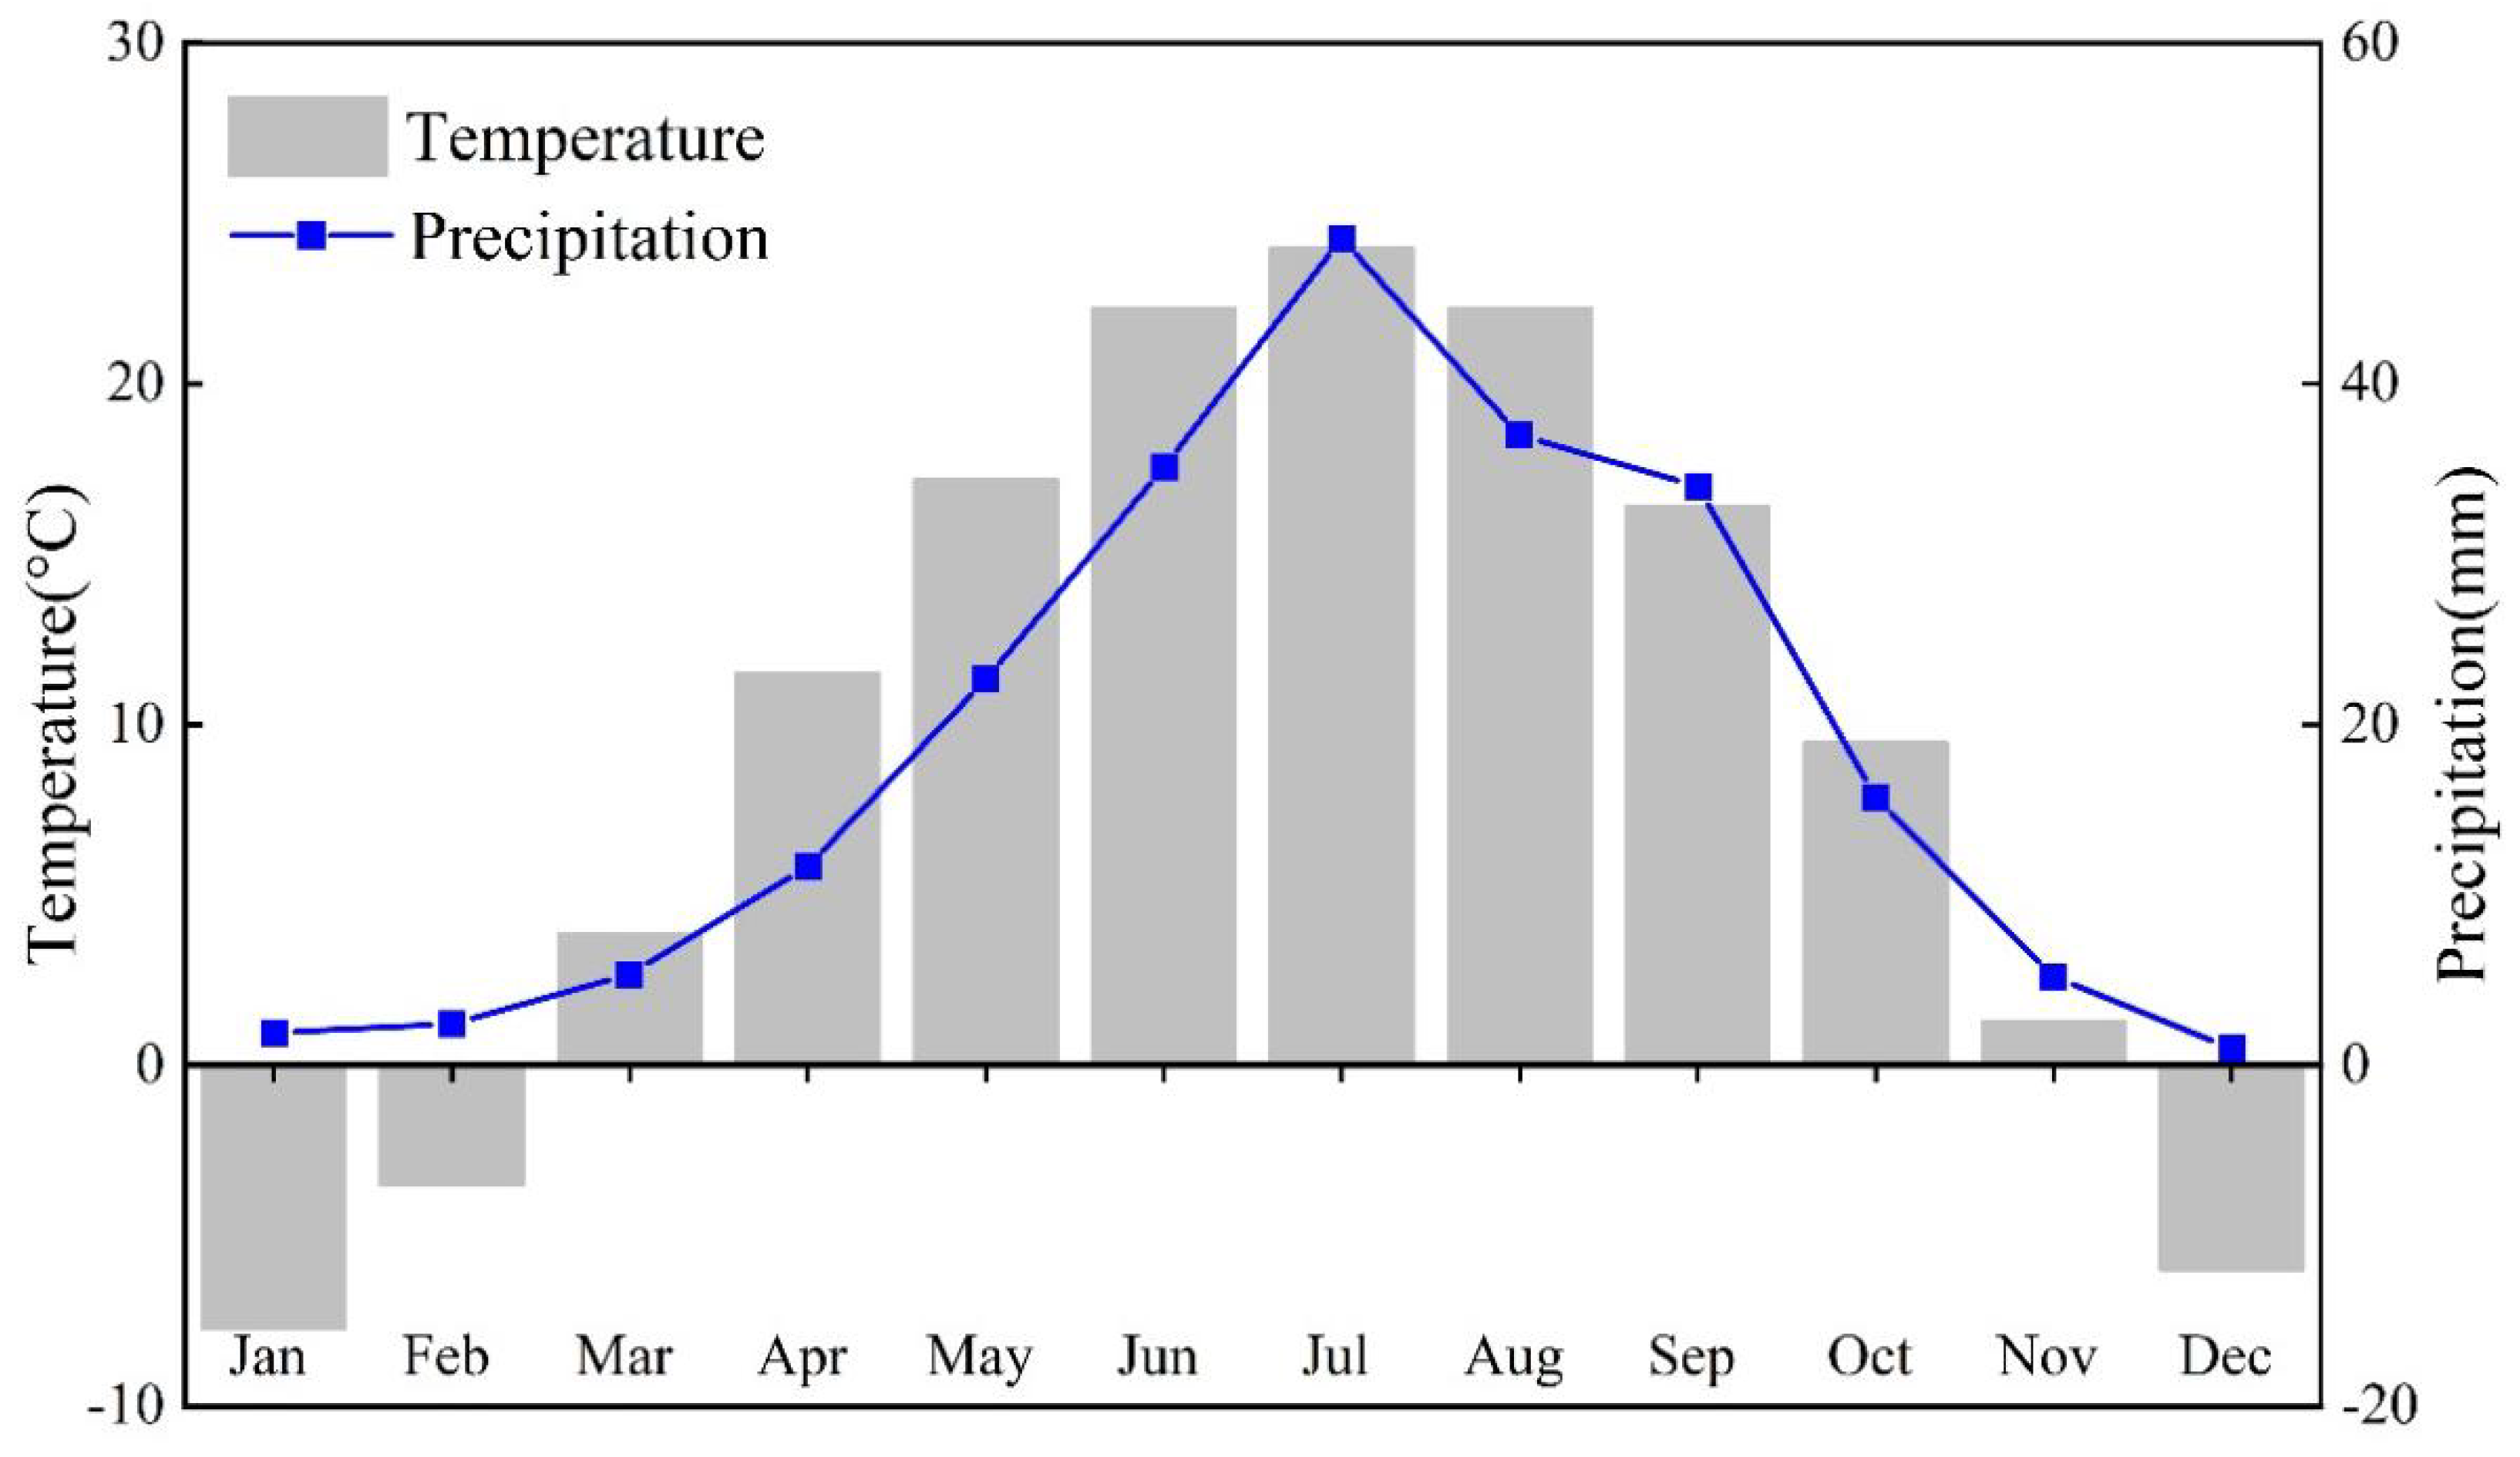
2.1. Study Area Description

The Ulansuhai Nur watershed (UNW), extending from 105°12′ E to 109°53′ E longitude and from 40°13′ N to 42°28′ N latitude, is entirely in the administrative region of Bayannur City, Inner Mongolia Autonomous Region and is located in the middle reach of the Yellow River (Figure 1). The watershed mainly includes seven counties of Wuyuan (WY), Dengkou (DK), Linhe (LH), Hangjin Houqi (HH), Urad Zhongqi (UZ), Urad Houqi (UH), and Urad Qianqi (UQ), among which three counties of LH, HH, and WY are entirely located in the watershed. The Hetao Irrigation District, as the third largest irrigation district in China, is located in this watershed. The irrigated farmland area is approximately 5.74 × 10³ km2, which occupies 41.3% of the watershed area. The main crops are spring wheat, corn, and sunflower. Approximately 5 × 10⁹ m3 irrigation water (approximately 1.8 times of local precipitation amounts) was pumped annually from the Yellow River into irrigation canals at the DK county for regional social and economic development. The irrigation channel network is composed of drainage canals (red lines) and irrigation canals (blue lines) (Figure 1).
The watershed covers an area of 13,947 km2 and has a typical semi-arid continental climate that features a cold and dry climate, strong evaporation, and little precipitation. The annual mean temperature is 9.3 °C, and annual precipitation is 220.6 mm with 70.1% of rainfall occurring from June to September during the period of 2005–2019 (Figure 2). Annual evaporation is 2100–2300 mm, which is more than 10 times the precipitation [24]. The industrial wastewater, domestic sewage, and farmland drainage water travel through the watershed from west to east by means of the drainage canals, flow into the Ulansuhai Nur Lake (UNL), and eventually enter into the Yellow River [28]. The UNL, as the largest freshwater lake in the Yellow River basin, performs an important ecological function for the regional ecological environment. In recent decades, the gradual deterioration of water quality in the UNL poses a great threat to water resources security for downstream cities of the Yellow River [29].

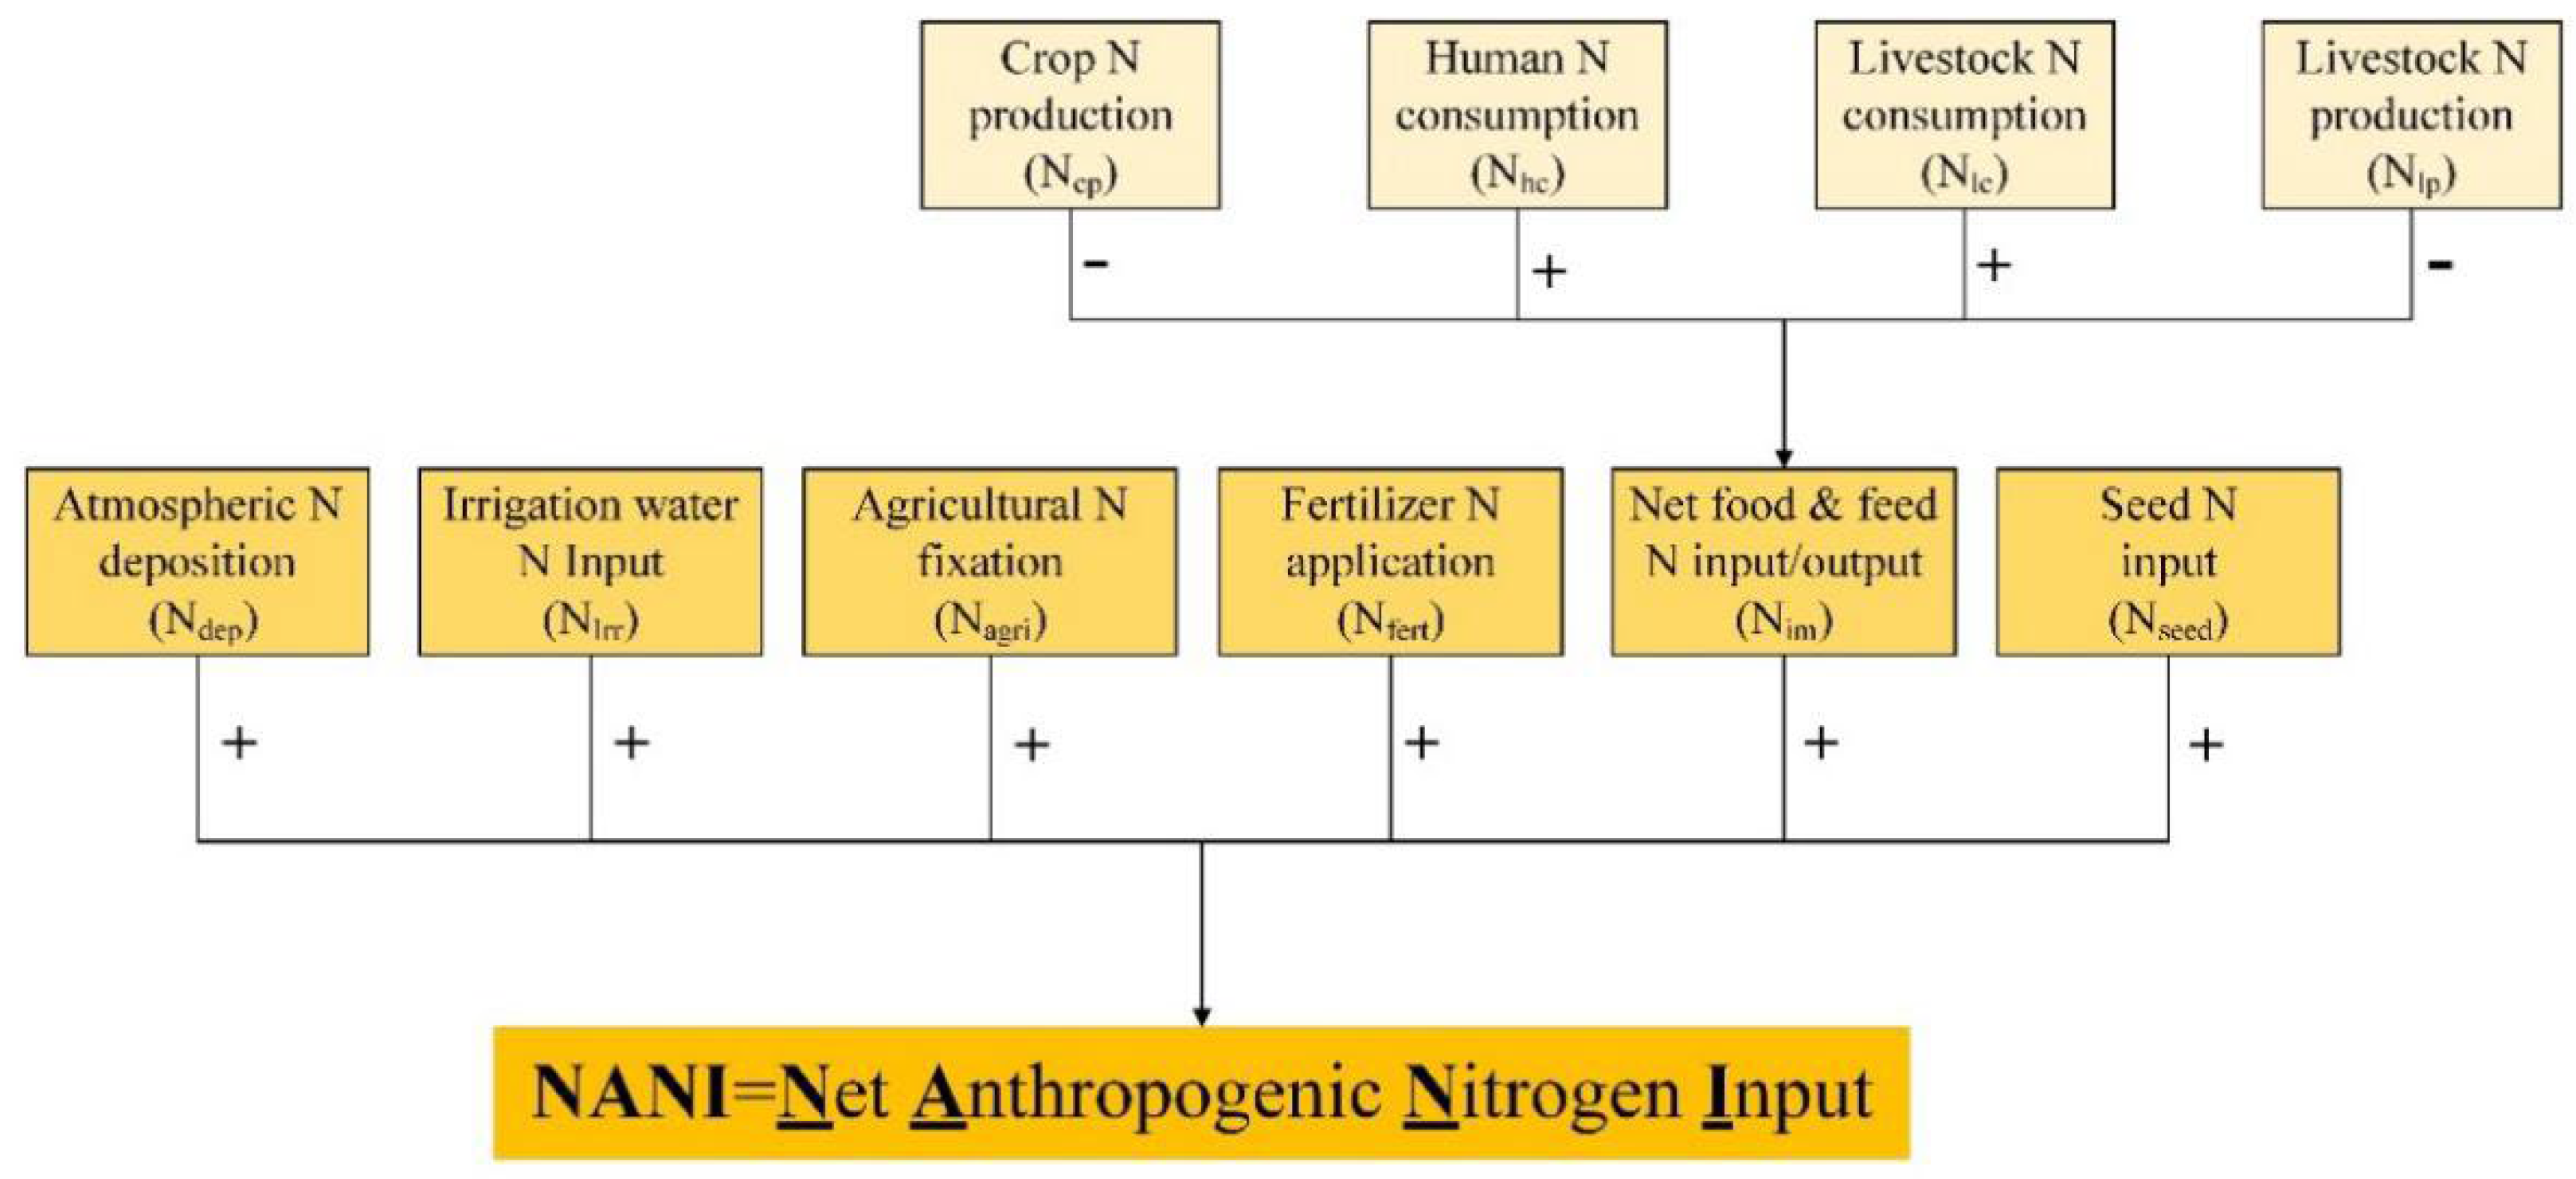
2.2. Description of the NANI Budgeting Approach

The NANI value of a watershed is determined based on the method proposed by Howarth [30] and further improved by Han [31]. In previous studies, the NANI budgeting model generally includes the following five major components: atmospheric N deposition (Ndep), N fertilizer input (Nfert), crop N fixation (Ncrop), net food/feed N imports (Nim), and seed N input (Nseed) [14,31,32,33]. Due to the semi-arid climate condition in the UNW, Yellow River irrigation is essential for regional sustainable development, especially for agriculture production. Considering that the N could be introduced along with the irrigation water from the Yellow River into the watershed, the irrigation N input (Nirri) as the calculation item should be incorporated into the NANI budgeting model in this study. Therefore, the modified NANI budgeting model, including six major components, was established to quantify anthropogenic N inputs in the watershed during the period of 2005–2019 in this study. The N budget was divided into N inputs through land phase (Nland) and N input through the irrigation water (Nirri) due to the differences in their input modes. The framework of NANI estimation is shown in Figure 3, and the formula is shown as follows:
NANI = NANIland + NANIirri
NANIirri = Nirri
NANIland = Ndep + Nfert + Ncro + Nim + Nseed
where NANI is the total net anthropogenic nitrogen input, NANIirri is the nitrogen input through the irrigation water, NANIland is N input through land phase, the Ndep refers to atmospheric N deposition, Nfert means chemical N fertilizer application, Ncrop represents crop N fixation, Nim is net food/feed N import, Nseed refers to seed N input, and Nirri means irrigation N input. The Nim was determined by the difference between the sum of N consumption from human and livestock and the sum of the N content in livestock and crop products as follows [34].
N im = N hc + N lc N cp N lp .
where Nhc and Nlc represent human and livestock N consumption, respectively. Ncp and Nlp refer to the N content in crops and livestock products, respectively.
Necessary data, such as the sown area, human and livestock populations, crop yields, chemical fertilizer application amount, atmospheric nitrogen deposition, irrigation water amount and total nitrogen concentration at the Sanshenggong hydrological station, were adopted for the calculation of watershed NANI (Figures S1–S4). The raster data of atmospheric nitrogen deposition during 2005–2015 were obtained from Regional Emission inventory in Asia version 3 (REASv3) with a spatial resolution of 0.25° [35] and could be download at https://www.nies.go.jp/REAS/index.html (accessed on 1 October 2022). The remaining data sources were acquired at the county scale from regional Statistical Yearbooks. Watershed NANI budget was equal to the sum of NANI budgets in each county of the study area, which was quantified by summing up the values of different NANI components in the specific county. During the calculation process, the land use weighting method was used to convert NANI values at the county level to the watershed level [36]. The land cover data in 2000 and 2010 with a 30 m resolution (http://www.globeland30.com accessed on 1 October 2022) were adopted in this study [37].
The parameters related to nitrogen contents for different fertilizer types, seeding nitrogen per unit area for different crop type, nitrogen contents for different livestock, Biological nitrogen fixation coefficients for soybean, peanut, rice and other non-symbiotic crops, nitrogen consumption rate per livestock, human protein consumptions for urban and rural population, and seeding nitrogen per unit area for each crop type were from the published literatures [16,22,31,36,38,39,40,41,42,43]. Nitrogen contents for different crop products were obtained from China Food Composition Tables [44]. Detailed information of the calculation methods for each NANI component, the involved parameter values, and their sources are available in the Supplementary Materials (SM).

2.3. Estimation of Riverine N Input and Export

In this study, the measurements of streamflow at the Sanshenggong and Shagaibulong hydrologic stations represented the irrigation water by irrigation canals into the UNW and drainage water by drainage canals into the UNL, respectively. The annual riverine TN flux was calculated as the product of the monthly average river discharge and TN concentration (the sum of particulate N and dissolved N) and expressed as follows [45,46,47]:
F TN = i = 1 12 C i × Q i × 100
where FTN represents annual riverine TN flux (ton N yr−1); Qi is monthly average river discharge (108 m3), in which i = 1, 2, 3, …,12; Ci refers to monthly average TN concentration (mg L−1); and 100 is the unit conversion factor. Monthly streamflow and total nitrogen concentration measurements at these two hydrological stations were obtained from the local hydrological department and ecological environment department, respectively.

2.4. Data Analysis

One-way ANOVA with a multiple comparison test (Tukey–Kramer test) was adopted to identify the variations in NANI across the UNW [45,48]. Pearson correlation analysis was conducted between social–economic influencing factors (Table 1) and NANI to identify the main driving factor for watershed NANI [47]. Linear regression was used to detect the trend change of NANI during the period of 2005–2019 [49].

3. Results

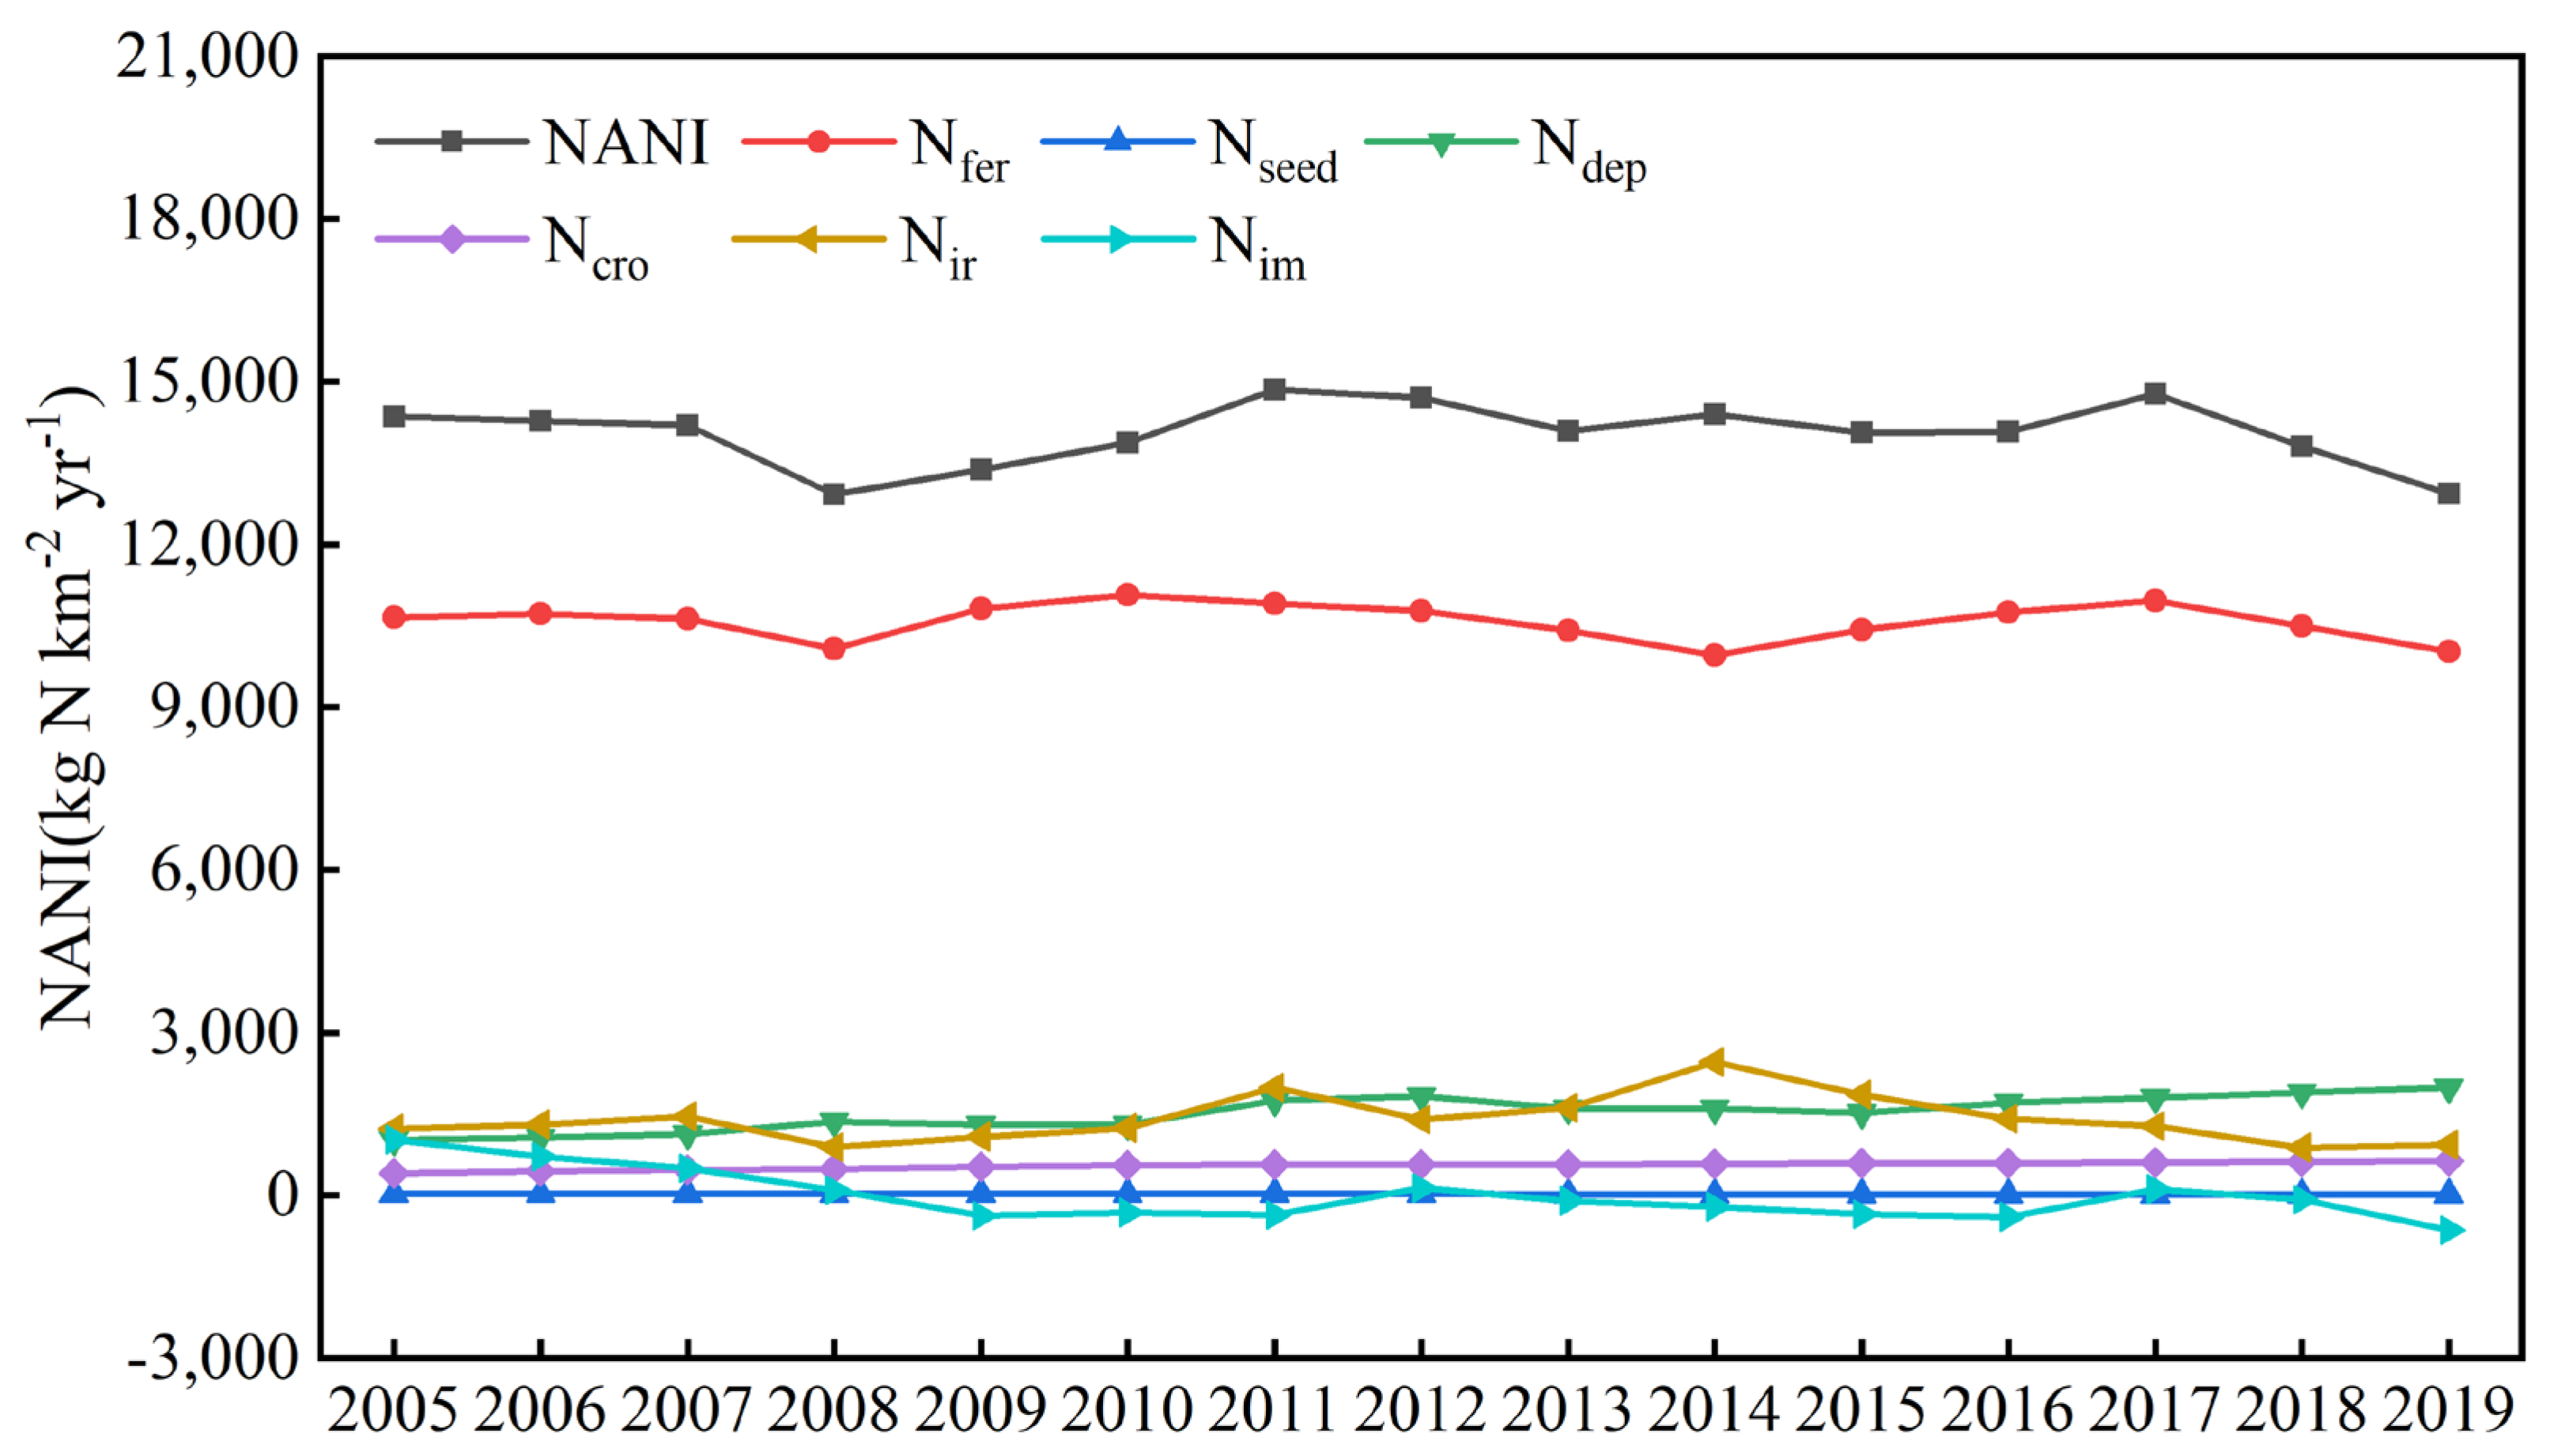
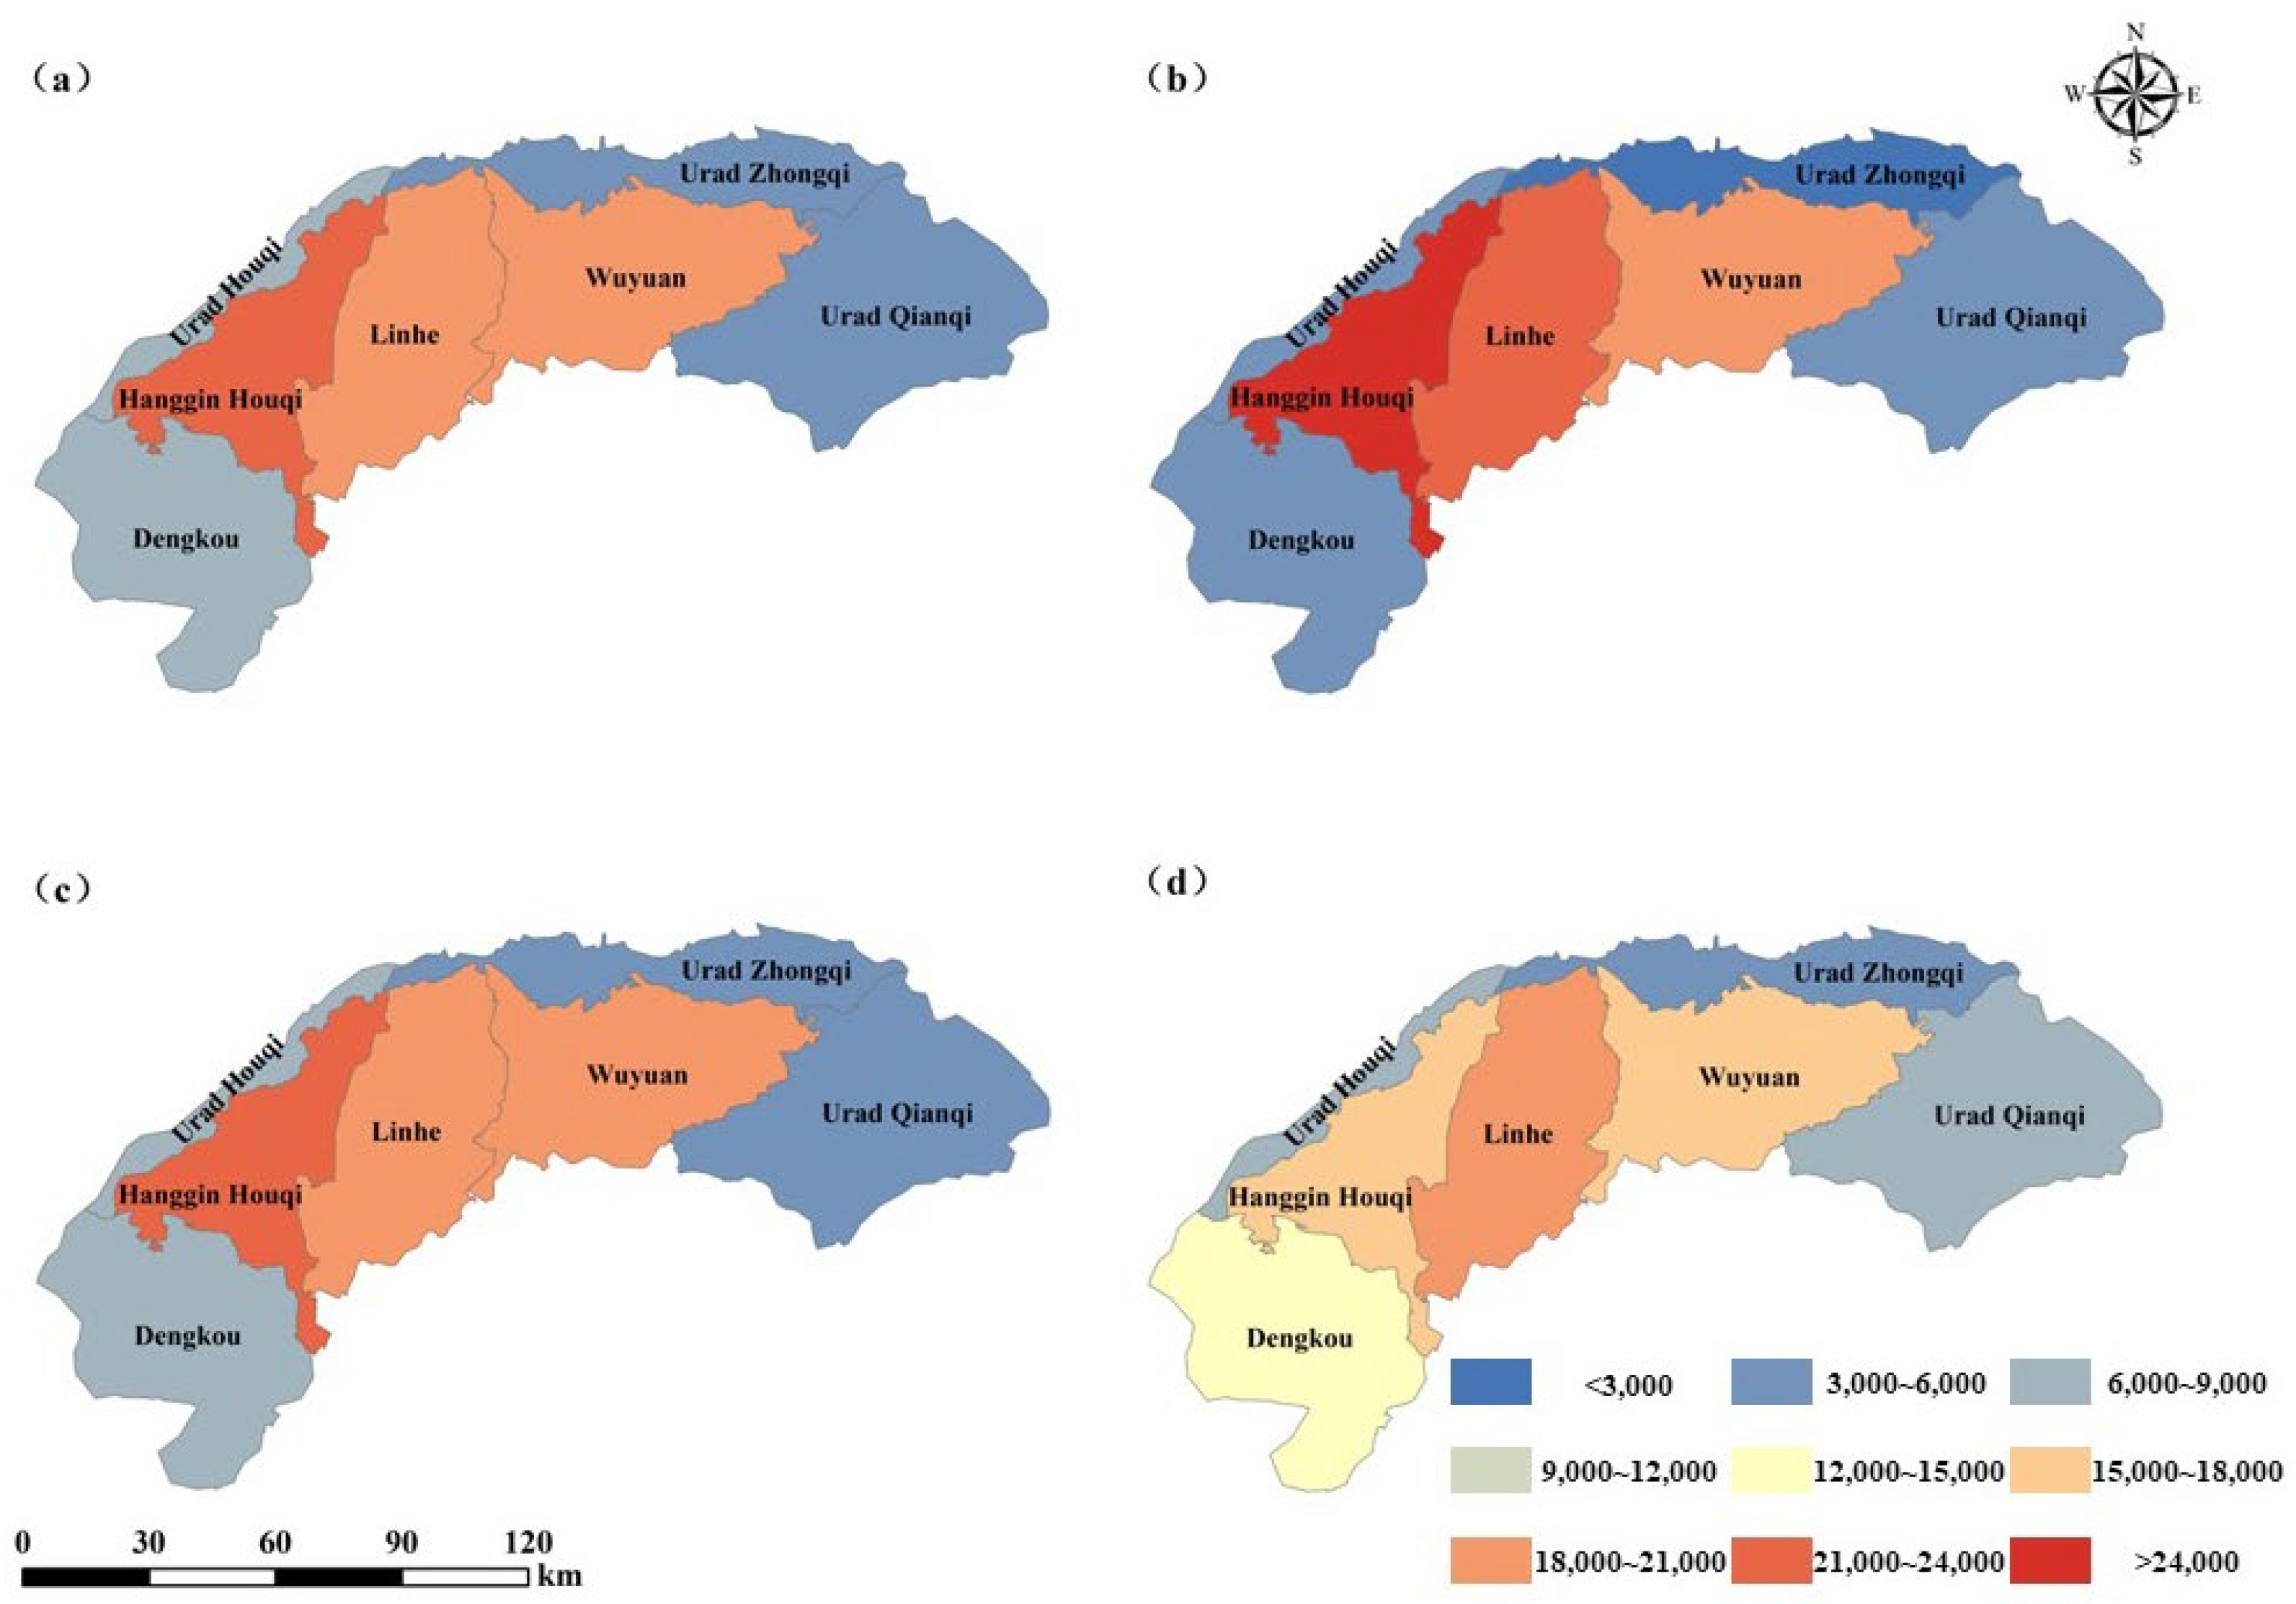
3.1. Spatial and Temporal Variations of NANI in the Watershed

The temporal variations of NANI and its components in the UNW during the period of 2005–2019 is shown in Figure 4. The watershed NANI values did not show a significant change trend, and the annual average value of watershed NANI was 14,048.0 ± 574.4 kg N km−2 yr−1. For NANI components, chemical N fertilizer application and irrigation N input did not show significant change trends with an average of 10,577.3 ± 332.2 kg N km−2 yr−1 and 1397.6 ± 420.9 kg N km−2 yr−1, respectively. Significantly increasing trends were determined with an average value of 1522.3 ± 300.5 kg N km−2 yr−1 from 1019.8 kg N km−2 yr−1 in 2005 to 1987, 6 kg N km−2 yr−1 in 2019 for atmospheric N deposition (p < 0.01), and with an average value of 546.4 ± 65.0 kg N km−2 yr−1 from 405.2 kg N km−2 yr−1 in 2005 to 633.6 kg N km−2 yr−1 in 2019 for biological N fixation (p < 0.01), respectively. On the contrary, the net food/feed N import and seed N input showed significant decreased trends (at the level of 0.01 and 0.05, respectively) and varied from 1025.9 kg N km−2 yr−1 in 2005 to −645.7 kg N km−2 yr−1 in 2019 with an average of −18.0 ± 444.8 kg N km−2 yr−1 and from 25.7 kg N km−2 yr−1 in 2005 to 19.3 kg N km−2 yr−1 in 2019 with an average of −21.9 ± 3.4 kg N km−2 yr−1, respectively.
The spatial distribution of average NANI from 2005 to 2019 in the UNW showed a gradual decrease pattern from midstream to upstream and downstream, indicating stronger influences of anthropogenic activities in the midstream (Figure 5a). The greatest NANI value was recorded in HJH county (21,016.7 ± 4827.4 kg N km−2 yr−1), followed by LH (20,450.9 ± 2492.4 kg N km−2 yr−1) and WY (18,887.9 ± 1409.2 kg N km−2 yr−1) counties, while the lowest NANI value was observed in UZ county (3474.9 ± 1144.3 kg N km−2 yr−1). The HJH, LH, and WY counties covered 47.1% of the watershed area and accounted for 62.1% of total NANI on average during the period of 2005–2019. Therefore, these three counties were considered to be the hotspots of NANI. The temporal changes of spatial distribution of NANI every five years in the watershed are shown in Figure 5b–d and had similar patterns to that during 2005–2019. The LH, WY, and HJH counties all showed significant decreased trends (p < 0.05), and the decreased magnitude varied from 15.1% to 49.9%. The largest decreased magnitude occurred in the HJH county, which decreased by 49.9% from 27,105.0 kg N km−2 yr−1 to 13,583 kg N km−2 yr−1 during the period of 2015–2019. The other four counties showed significant increase trends (p < 0.05), and the increase magnitude varied from 28.9% to 255.7%. DK County had the highest increase magnitude, and the NANI value increased by 2.55 times from 3767.6 kg N km−2 yr−1 in 2005 to 13,401.6 kg N km−2 yr−1 in 2019.

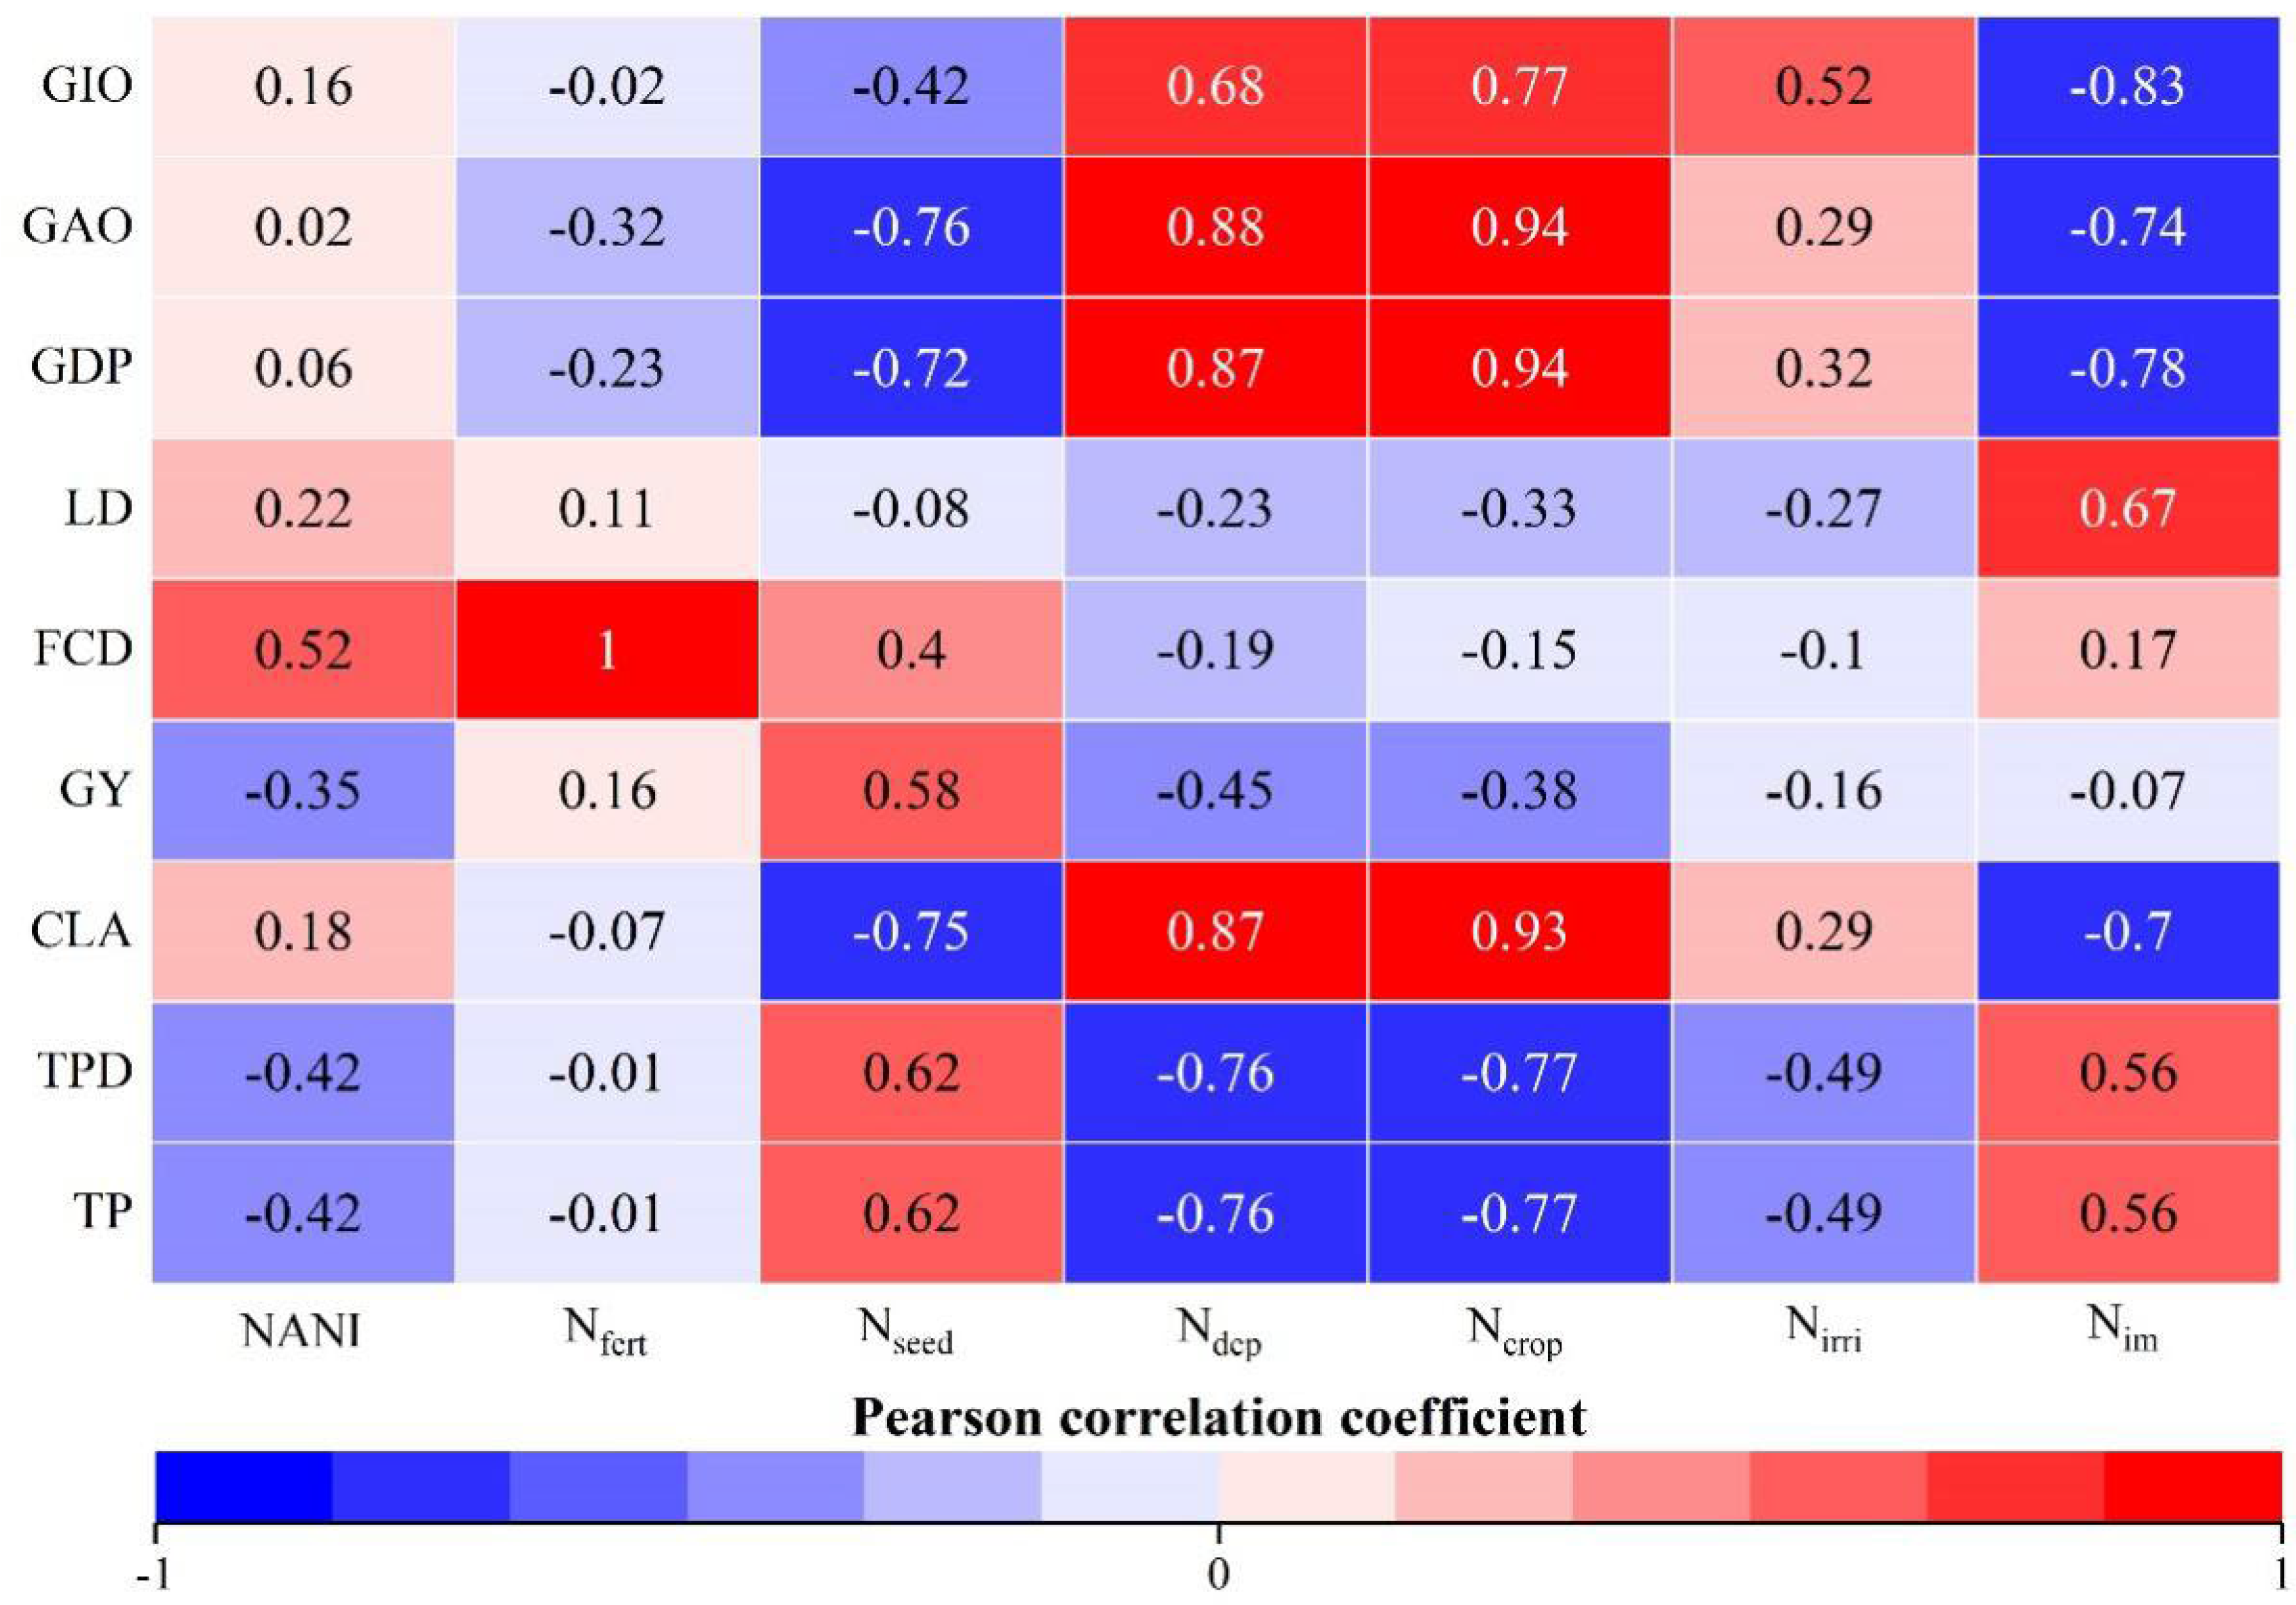
3.2. Nitrogen Sources and Driving Factors of NANI

The variations in NANI components during the period of 2005–2019 is shown in Figure 4. In terms of NANI components, chemical N fertilizer as the dominant source of NANI contributed to 69.2–80.8% (average value of 75.3%) of watershed NANI over the period of 2005–2019. It indicated that watershed NANI in UNW mainly originated from the application of chemical N fertilizers. The atmospheric N deposition and irrigation N inputs accounted for 10.9% and 9.9% of watershed NANI, respectively. The contribution of atmospheric N deposition to NANI increased from 7.1% to 15.4% from 2005 to 2019. The net N in food and feed, as another important source of NANI, varied from 531.0 kg N km−2 yr−1 in 2005 to 266.8 kg N km−2 yr−1 in 2019 and accounted for 26.7–8.9% of NANI over the study period. The negative values of net N in food and feed showed that food and feed were exported out of the watershed. The contribution of seed N to NANI was relatively small, only accounting for less than 2%. The total contribution of biological N fixation and seed N input to watershed NANI was less than 5%.
In this study, Pearson correlation analysis between NANI and social–economic factors was conducted to identify the main driving factors for NANI in the watershed (Figure 6). As a major industry in UNW, agriculture production had an important impact on NANI. In this study, cultivated land area per unit area (CLA), grain yield per unit area (GY), fertilizer consumption density (FCD), and livestock density (LD) were chosen as agricultural factors, and their correlation coefficients with NANI were 0.18, −0.35, 0.52, and 0.22, respectively. Fertilizer application showed the highest correlation among agricultural factors, i.e., 0.52, indicating that it was the dominant contributor to NANI changes in the watershed. Gross domestic product per unit area (GDP), gross agricultural output value per unit area (GAO), and gross industrial output value per unit area (GIO) are main economic factors. NANI was positively correlated with economic factors. The correlation coefficient between NANI and GIO is 0.16, followed by GDP (r = 0.06) and GAO (r = 0.02). Contrary to economic and agricultural factors, social factors represented by total population (TP) and total population density (TPD) were negatively correlated with NANI, with correlation coefficients of −0.42 and −0.42, respectively.

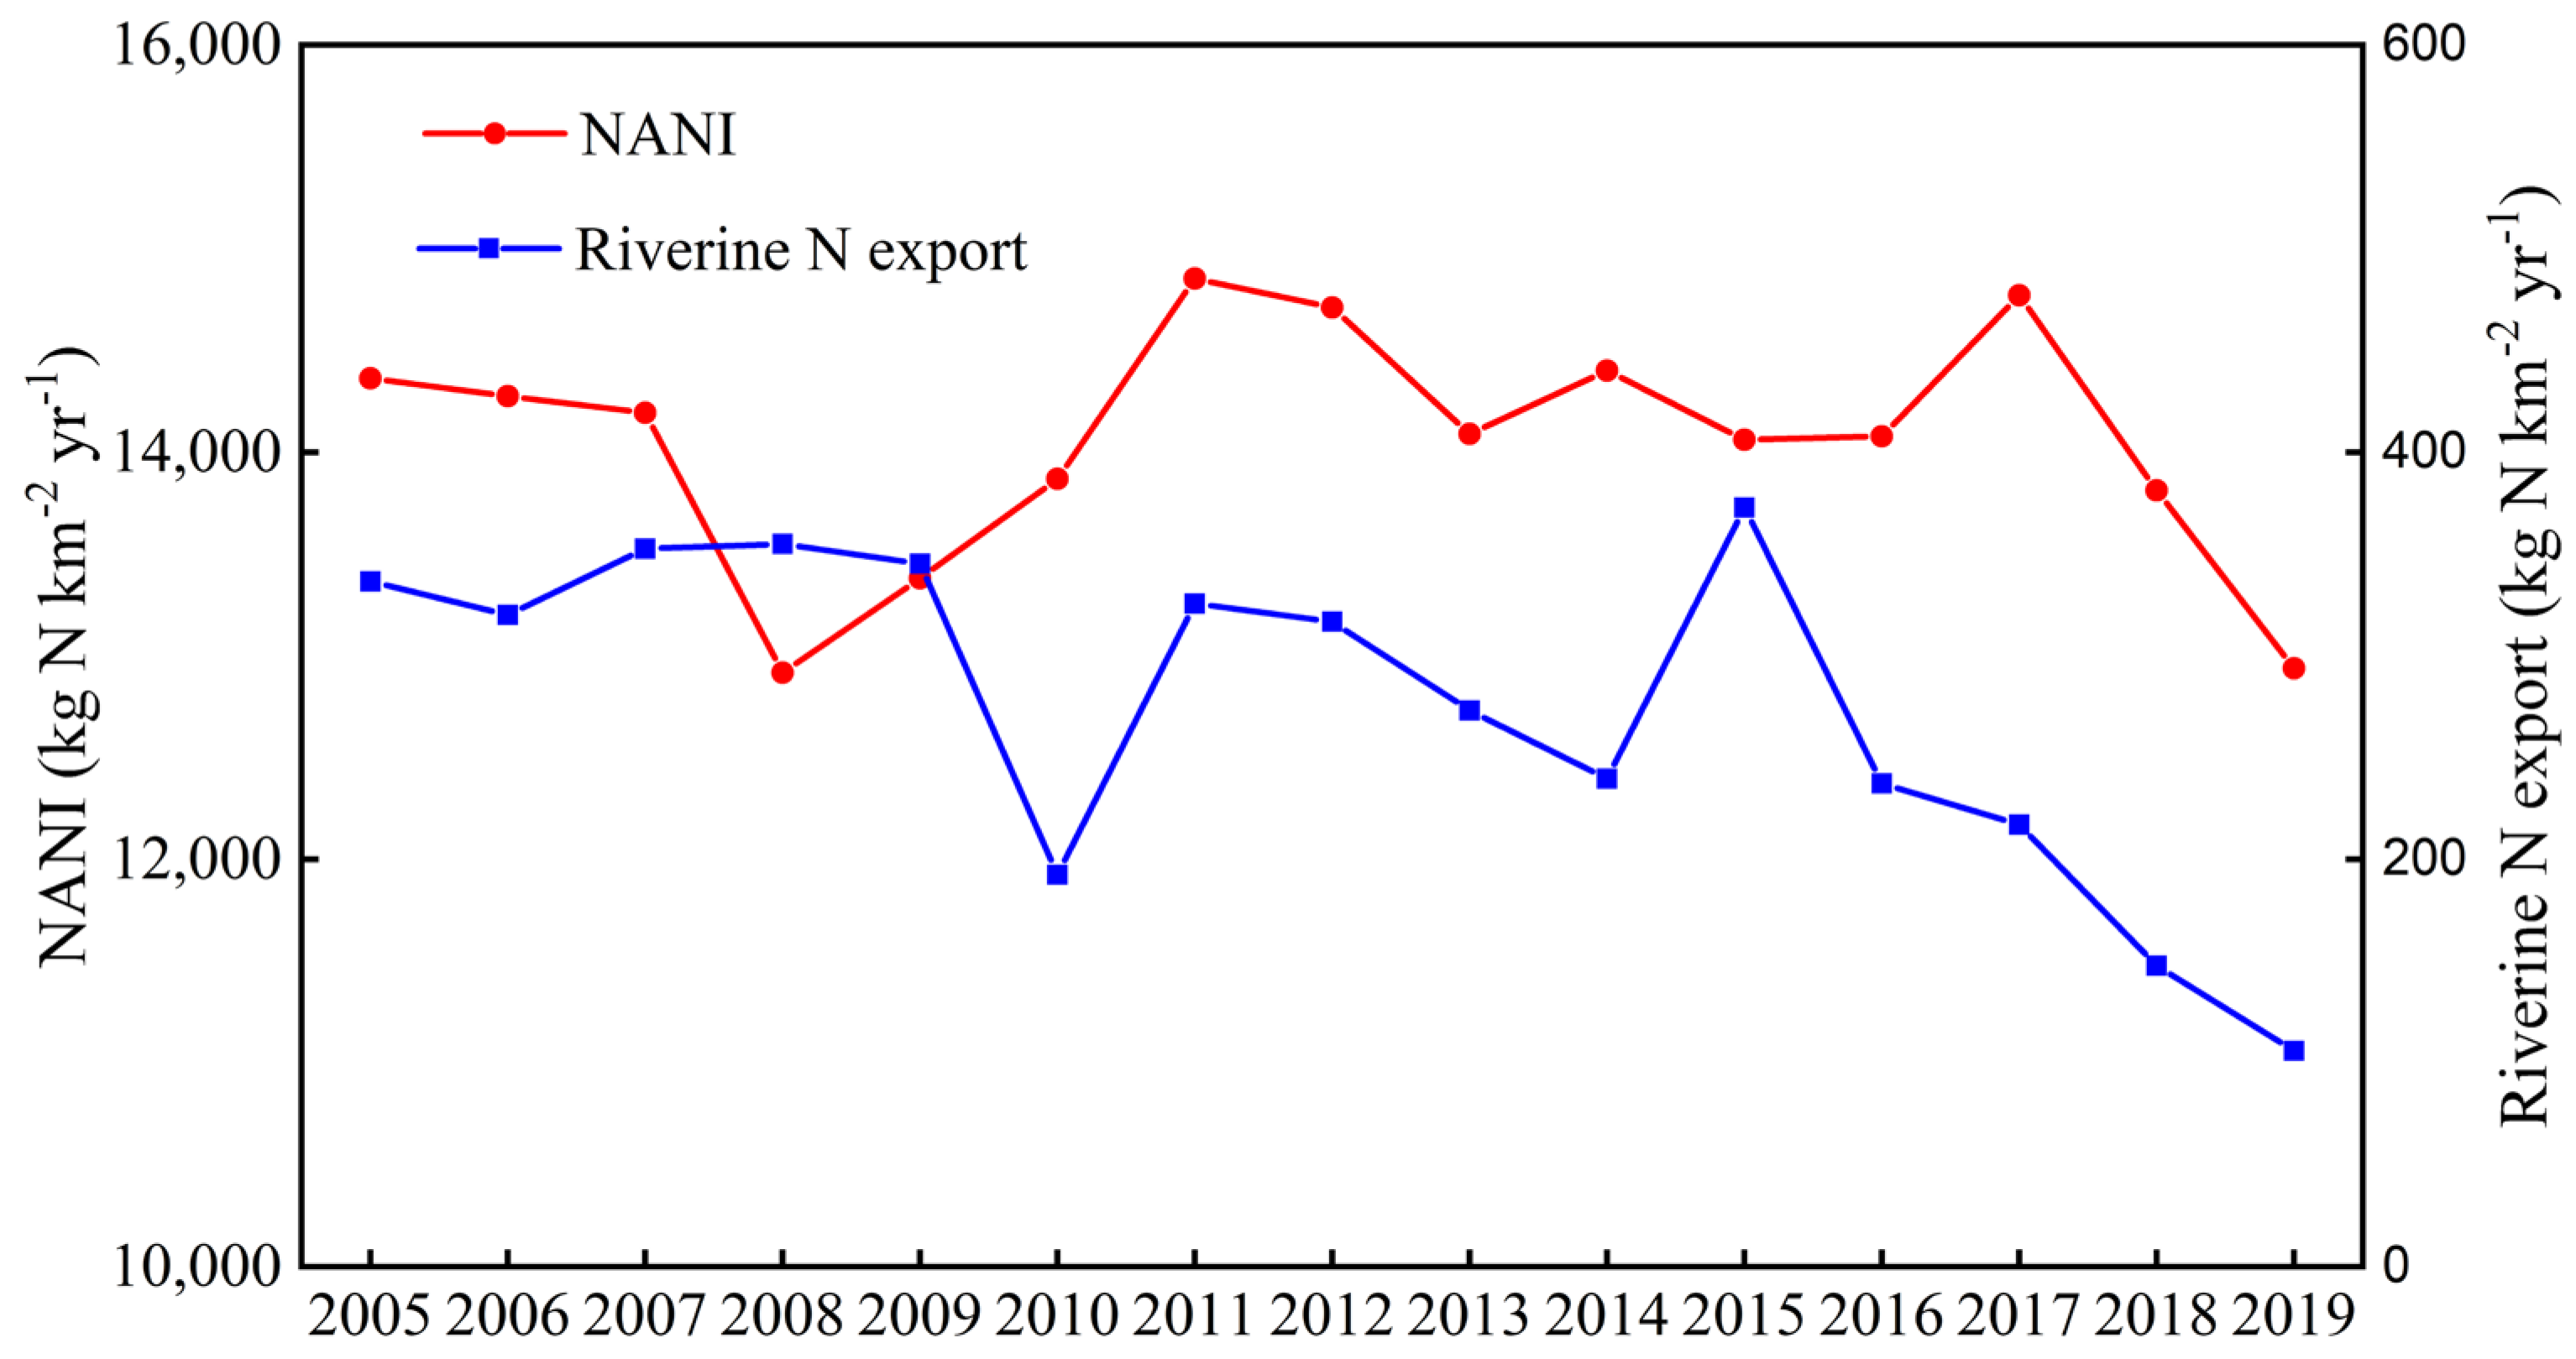
3.3. Quantitative Response of Riverine N Export Load to Watershed NANI

The characteristics of annual riverine N export load at the watershed outlet during the period of 2005–2019 are shown in Figure 7. Annual riverine N export showed a significant decreased trend (p < 0.01) with a net decrease of 68.5% from 336.6 kg N km2 yr−1 ton in 2005 to 106.0 kg N km2 yr−1 in 2019. Meanwhile, the riverine N export ratio also had a significant declined trend, with an average value of 1.92% during the period of 2005–2019 and decreased from 2.34% in 2005 to 0.82% in 2019. The riverine N export was not closely correlated with watershed NANI value and annual precipitation whenever the linear or exponential regression was conducted (Table 2).

4. Discussion

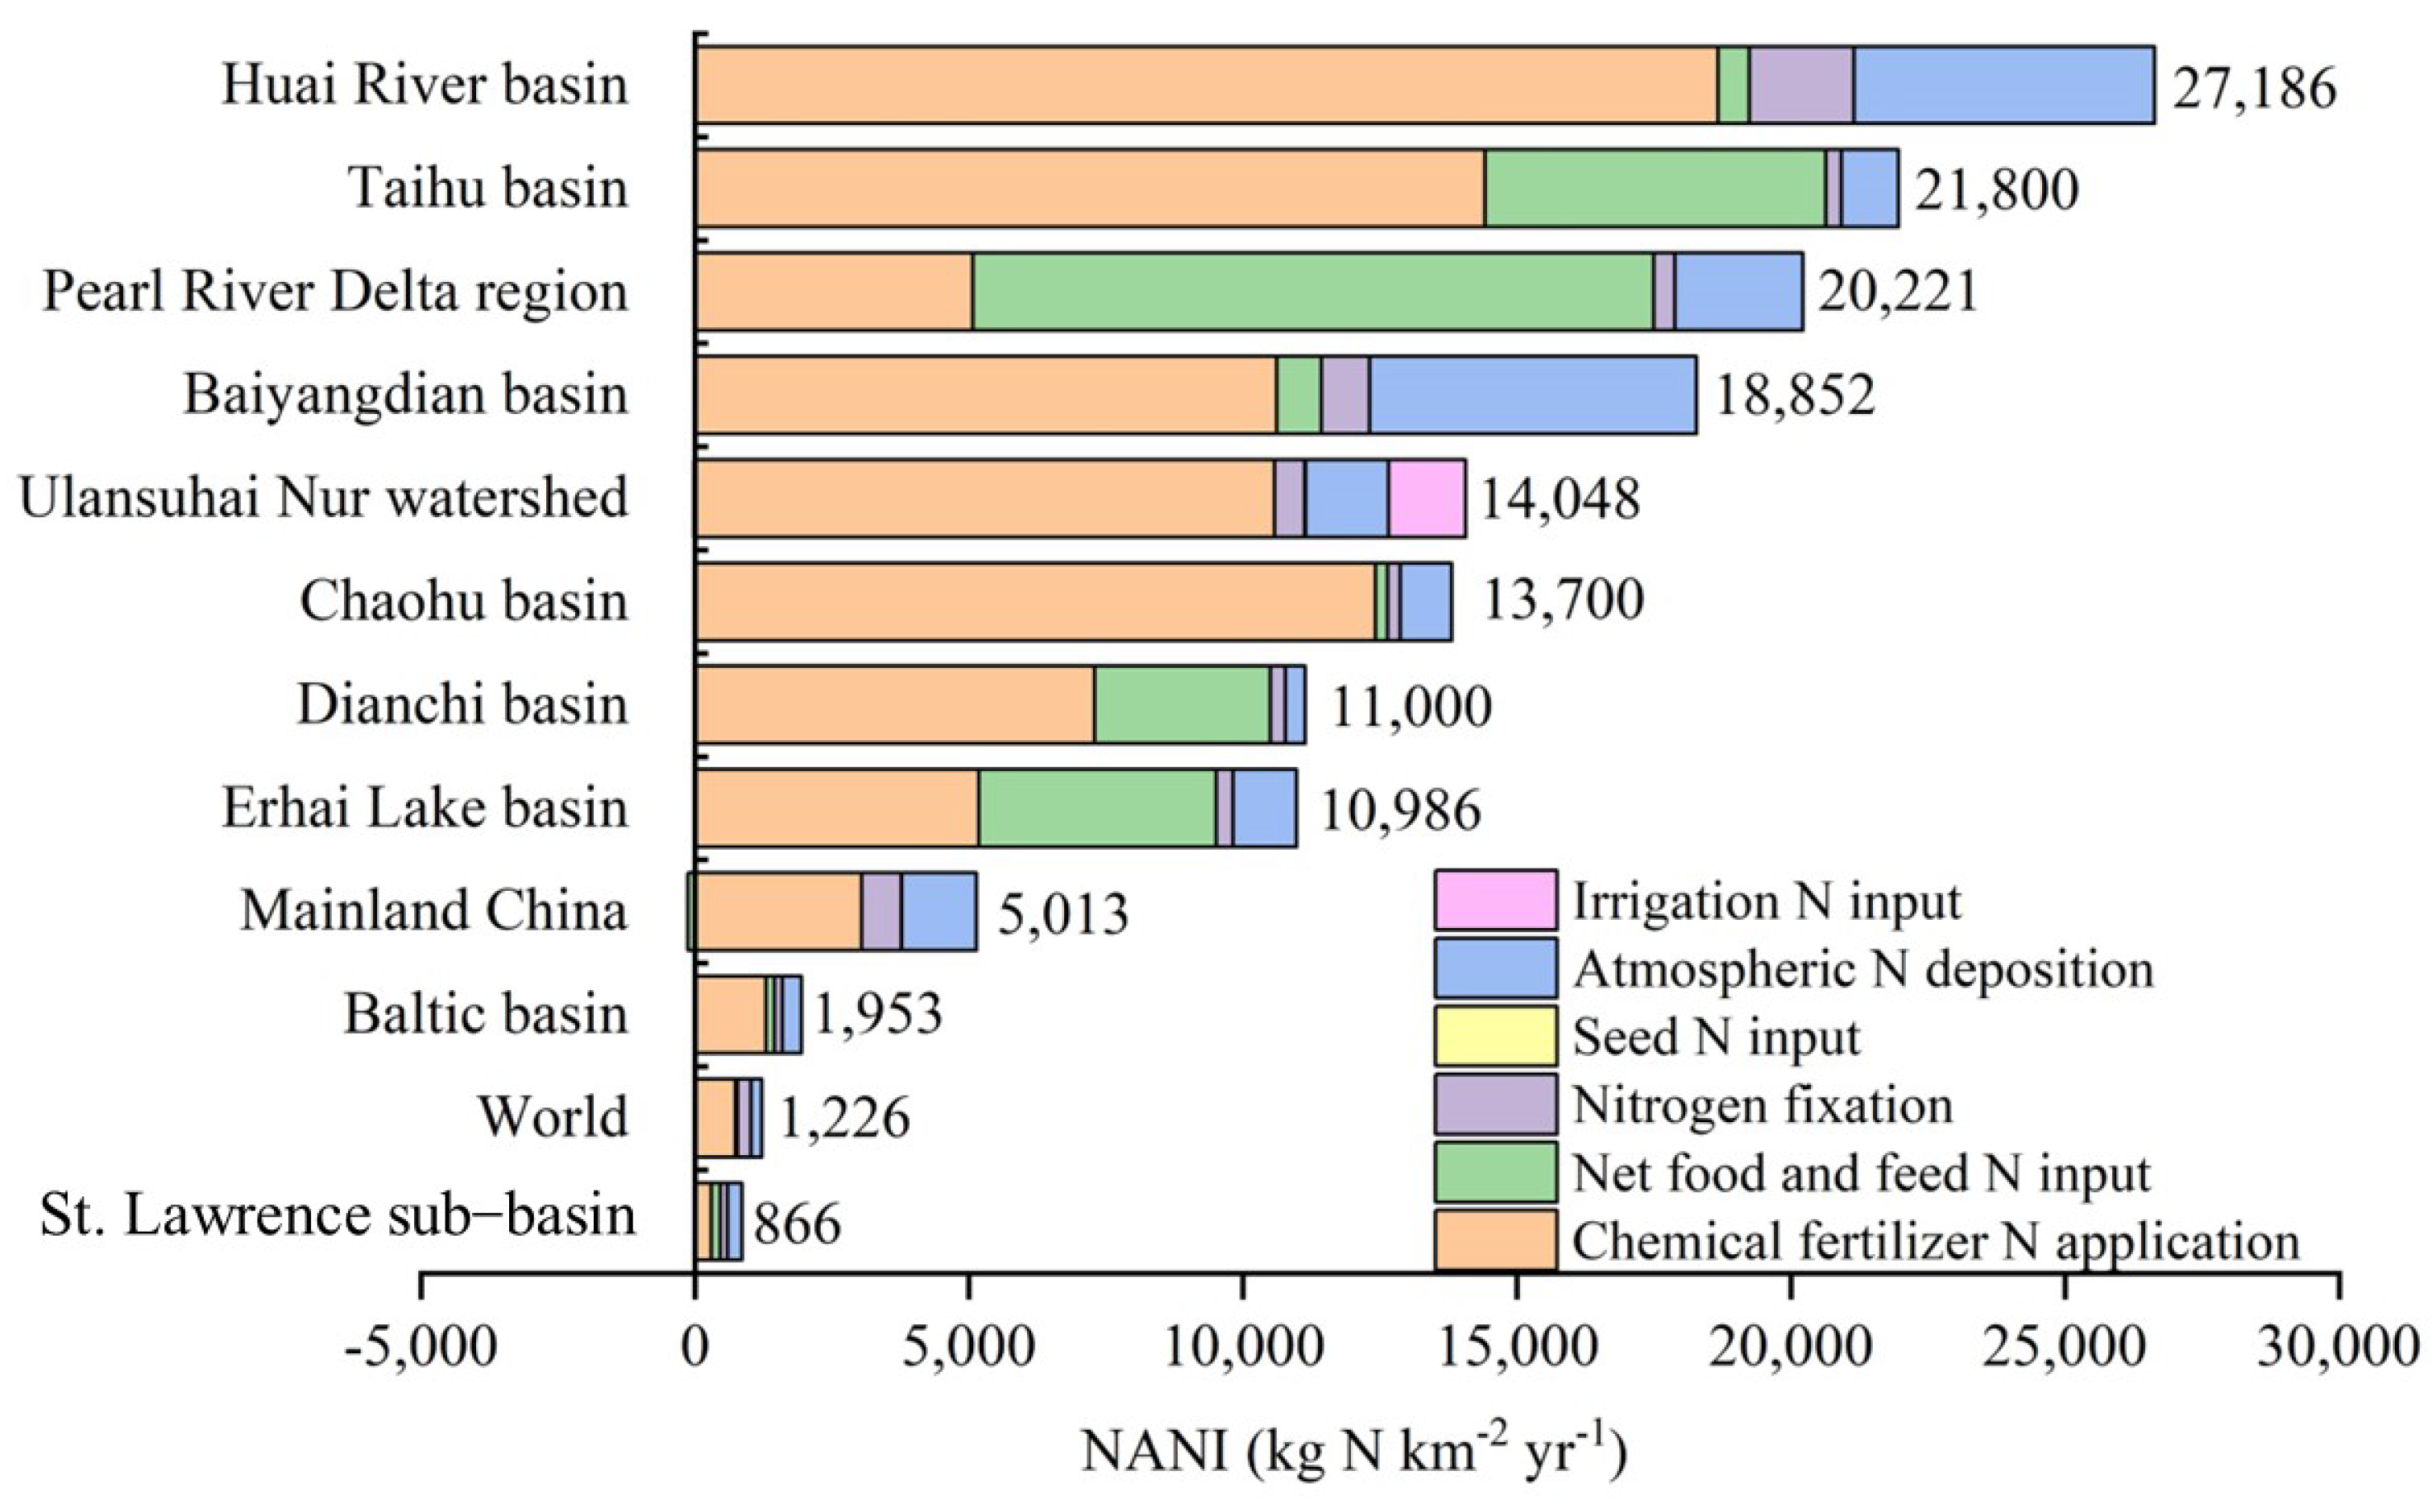
4.1. Contrasting Contribution from NANI Components in Different Watersheds

Quantitative assessment of anthropogenic N inputs and identification of the dominant component are critical for watershed N pollution control [6]. It has been documented that anthropogenic N inputs vary widely at different watersheds or regions influenced by anthropogenic activities [9]. As indicated in Figure 8, annual average NANI value in the UNW during the period of 2005–2019 was 14,048.0 kg N km−2 yr−1, which was significantly higher than the average values of 1226.0 kg N km−2 yr−1 in the world [50] and of 5013.0 kg N km−2 yr−1 in mainland China [31]. At the watershed scale, the NANI value in the UNW was lower than in some watersheds, such as 27,186.0 kg N km−2 yr−1 from 2003 to 2010 in the Huai River watershed of central China, 21,800.0 kg N km−2 yr−1 from 2000 to 2010 in the Taihu basin [51], 20,221.0 kg N km−2 yr−1 from 2008 to 2016 in the Pearl River Delta region [16], and 18,852.0 kg N km−2 yr−1 in 2015 in the Baiyangdian basin in northern China [22]. However, the NANI value in the UNW was far higher than other basins worldwide [11,13,19,40,51,52]. For example, the NANI value in the UNW is far higher than that of 1953 kg N km−2 yr−1 in 2010 in the St. Lawrence sub-basin in Canada [11] and 7736 kg N km−2 yr−1 in 2013 in the Poyang Lake basin in China [53]. The dominant sources of N in different areas are different (Figure 8). Numerous studies have found that chemical N fertilizer, and net import of food and feed are two major components of the NANI. According to whether the agroecosystem in the watershed is heterotrophic or autotrophic, the watershed types are divided into the agricultural watershed and urban watershed [9]. Agricultural watersheds represent the net export of N in crop products, which are supported by large inputs of chemical N fertilizer, such as the Baltic basin [14], the Mississippi basin [54], and the Huai River basin [6]. Urban watersheds need imported food and feed, which are supplied for large urban populations, such as Pearl River Delta region [16]. As for the NUW, the chemical N fertilizer in the UNW was the major contributor to watershed NANI and accounted for 75.4% of watershed NANI, which was higher than that of other watersheds worldwide except for the Chaohu basin (Figure 8). The UNW is the important agricultural and animal husbandry base in China, and the agriculture and animal husbandry in the watershed was the main industry, accounting for 35.2% of local GDP.

4.2. Necessity of Irrigation N Input Incorporated in the NANI Budgeting Model

Although inter-basin water transfer projects could meet the water demands for agricultural and domestic purposes in arid and semi-arid areas, nutrients are also carried into the watershed and might lead to adverse impacts on the regional environment [55,56]. The annual average N flux carried by the irrigation water into the UNW during the period of 2005–2019 was 1397 kg N km−2 yr−1, accounting for approximately 9.9% of watershed NANI. Meanwhile, nutrients are easily transported into rivers by flood-irrigation along with agricultural return water through the drainage system [57]. Additionally, different from other irrigation watersheds, an ecologic water compensation project was conducted since 2013 in order to restore the ecological function of the UNL, and river water diverted from the Yellow River increased from about 2 × 10⁸ m3 in 2013 to 5.6 × 10⁸ m3 in 2019. Because the water from the Yellow River directly flows into the UNL by the drainage system, the N input by the diversion varied from 970.5 ton in 2013 to 1347.5 ton in 2019, on average accounting for 23.35% of the riverine N export from 2013 to 2019 with the consideration of the N retention ratio of irrigation channel [58]. Therefore, the irrigation N input was considered as an anthropogenic N input source and as the calculation item for the NANI budget model in this study in order to reduce the uncertainties for the NANI result in the UNW. Furthermore, the modified NANI model proposed in this study could provide useful reference for formulating watershed N management strategies for improving regional water quality.

4.3. Responses of Riverine N Export to Anthropogenic Activities

After entering into the watershed, the anthropogenic N would be accumulated in the landscape and increase riverine N fluxes through surface runoff and leaching loss, further leading to a series of environmental problems [49,59,60]. Some studies have demonstrated that riverine N fluxes are significantly correlated with anthropogenic N inputs in various watersheds, and the N export ratio reflects the potential risk of N pollution and the retention ability for N in the watershed [14,49]. For the NUW, there was no significant relationship between watershed NANI value and riverine N exports in this study. Meanwhile, the riverine N export ratio (an average value of 1.92% during the period of 2005–2019) was lower than other watersheds worldwide [9,22,45], which could be generally attributed to two aspects: natural condition and human activities. Firstly, the N transport is driven by hydrological processes, which are mediated by hydroclimatic condition (precipitation and temperature) and watershed characteristics [9,20]. The mechanism of runoff generation was mainly driven by irrigation water other than natural precipitation due to less precipitation, high evaporation, and flat topography in the watershed. Meanwhile, farmland drainage water accounted for approximately 8.0% of the total water amount, which was equal to the sum of the irrigation water and precipitation amount in a typical irrigation area of the UNW [61]. Secondly, external factors, such as the human activity factor, further increased the N retention ability of the UNW. Many different measures were conducted to recover the water quality of the UNL. For example, the annual wastewater treatment ability in the UNW increased from 2.2 × 10⁷ m3 yr−1 in 2009 to 7.8 × 10⁷ m3 yr−1 in 2019. The agricultural nonpoint pollution control program was formally launched by China’s government in 2015. Many management measures have been implemented mainly for the improvement of N fertilizer use efficiency and the control of livestock and poultry manure pollution. In the above context, the anthropogenic intervention strengthened watershed N retention ability in the landscape.

4.4. Implications for Watershed N Management

This study was very useful for the UNW since the reduction of nutrient export in the UNW was vital for eutrophication mitigation as an indicator of the ecological restoration of the UNL [26]. The positive NANI value implies the N surplus in the watershed. Based on the results in this study, targeted watershed N management strategies could be implemented to reduce riverine N fluxes and improve the ecological function of the UNL. Firstly, more attention should be paid to improve fertilizer usage efficiency and reduce the application amount of N fertilizer by soil testing for formulated fertilization technology [62]; partial organic substitutes for chemical N fertilizers should be explored given the high contribution (>75%) of fertilizer N input to watershed NANI [63]. Secondly, irrigation efficiency improvement, such as replacing flood-irrigation with trickle irrigation and furrow irrigation, should be conducted to reduce nutrient loss and soil erosion [64]. Finally, NANI hotspot areas should be given more attention from the point of view of N pollution control due to its greater risk of N loss [65]. Riparian buffer strips and wetlands, as effective treatment techniques, could be constructed in the downstream of the hotspots to intercept riverine N pollutants [66,67,68].

5. Conclusions

The NANI budgeting model was modified by considering the irrigation N input and then applied to investigate spatial–temporal variations of anthropogenic N inputs and the relationship with riverine N flux during the period of 2005–2019 for a semi-arid irrigated watershed, Ulansuhai Nur watershed, China. The annual average anthropogenic N inputs reached 14,048.0 kg N km−2 yr−1 without an obvious trend change. The chemical N fertilizer accounted for 75.3% of total NANI. There was not a significant regression relationship between watershed NANI and riverine N export during the study period. Under intervention from human activities, riverine N export showed a significant decreased trend and accounted for approximately 1.92% of total NANI in the watershed. In irrigated watersheds, irrigation N input as an anthropogenic N input source should be incorporated into the NANI model. In addition to reducing the external N inputs into the watershed, particular attention should be given to the control of irrigation N input and the control of N in the hotspot areas of NANI in the watershed. This study could provide new insights into formulating strategies for the watershed N pollution control and expand the application of the NANI model in irrigation watersheds.

Supplementary Materials

The following supporting information can be downloaded at: https://www.mdpi.com/article/10.3390/w15020276/s1, Figure S1: Maps of land use types of 2010 and 2020 in the Ulansuhai Nur watershed (30 m resolution), Figure S2: Chemical nitrogen fertilizer application amount in the Ulansuhai Nur watershed from 2005 to 2019, Figure S3: Sown areas for major crops in the Ulansuhai Nur watershed from 2005 to 2019, Figure S4: Variations of irrigation water volume from Yellow River and the corresponding total nitrogen concentration in the Ulansuhai Nur watershed from 2005 to 2019.

Author Contributions

Conceptualization, T.Y. and X.D.; methodology, T.Y. and X.D.; validation, T.Y. and J.B.; formal analysis, T.Y. and J.B.; investigation, T.Y. and X.D.; resources, H.L. and H.B.; data curation, J.B. and H.B.; writing—original draft preparation, T.Y. and X.D.; writing—review and editing, X.D., Q.L. and L.Z.; visualization, T.Y. and J.B.; supervision, H.L.; project administration, T.Y.; funding acquisition, X.D. and L.Z. All authors have read and agreed to the published version of the manuscript.

Funding

This work was supported by the National Natural Science Foundation of China (Grant No. 42107076), Fundamental Research Funds for Central Non-profit Scientific Institution (No.1610132022008), National Natural Science Foundation of China (Grant No. U20A20114).

Data Availability Statement

The datasets used and or analyzed during the current study are available from the corresponding author on reasonable request.

Conflicts of Interest

The authors declare no conflict of interest.

References

  1. Vitousek, P.M.; Aber, J.D.; Howarth, R.W.; Likens, G.E.; Matson, P.A.; Schindler, D.W.; Schlesinger, W.H.; Tilman, D.G. Human alteration of the global nitrogen cycle: Sources and consequences. Ecol. Appl. 1997, 7, 737–750. [Google Scholar] [CrossRef] [Green Version]
  2. Yu, C.; Huang, X.; Chen, H.; Godfray, H.C.J.; Wright, J.S.; Hall, J.W.; Gong, P.; Ni, S.Q.; Qiao, S.C.; Huang, G.R.; et al. Managing nitrogen to restore water quality in China. Nature 2019, 567, 516–520. [Google Scholar] [CrossRef] [PubMed]
  3. Dong, Y.; Xu, L.; Yang, Z.; Zheng, H.; Chen, L. Aggravation of reactive nitrogen flow driven by human production and consumption in Guangzhou City China. Nat. Commun. 2020, 11, 1209. [Google Scholar] [CrossRef] [PubMed] [Green Version]
  4. Galloway, J.N.; Dentener, F.J.; Capone, D.G.; Boyer, E.W.; Howarth, R.W.; Seitzinger, S.P.; Asner, G.P.; Cleveland, C.C.; Green, P.A.; Holland, E.A.; et al. Nitrogen cycles: Past, present, and future. Biogeochemistry 2004, 70, 153–226. [Google Scholar] [CrossRef]
  5. Liu, X.; Duan, L.; Mo, J.; Du, E.; Shen, J.; Lu, X.; Zhang, Y.; Zhou, X.; He, C.; Zhang, F. Nitrogen deposition and its ecological impact in China: An overview. Environ. Pollut. 2011, 159, 2251–2264. [Google Scholar] [CrossRef]
  6. Zhang, W.; Li, H.; Li, Y. Spatio-temporal dynamics of nitrogen and phosphorus input budgets in a global hotspot of anthropogenic inputs. Sci. Total Environ. 2019, 656, 1108–1120. [Google Scholar] [CrossRef]
  7. Wellen, C.; Kamran-Disfani, A.R.; Arhonditsis, G.B. Evaluation of the Current State of Distributed Watershed Nutrient Water Quality Modeling. Environ. Sci. Technol. 2015, 49, 3278–3290. [Google Scholar] [CrossRef]
  8. Yan, T.; Bai, J.; Arsenio, T.; Liu, J.; Shen, Z. Future climate change impacts on streamflow and nitrogen exports based on CMIP5 projection in the Miyun Reservoir Basin, China. Ecohydrol. Hydrobiol. 2019, 19, 266–278. [Google Scholar] [CrossRef]
  9. Swaney, D.P.; Hong, B.; Ti, C.; Howarth, R.W.; Humborg, C. Net anthropogenic nitrogen inputs to watersheds and riverine N export to coastal waters: A brief overview. Curr. Opin. Environ. Sustain. 2012, 4, 203–211. [Google Scholar] [CrossRef]
  10. David, M.B.; Gentry, L.E. Anthropogenic inputs of nitrogen and phosphorus and riverine export for Illinois, USA. J. Environ. Qual. 2000, 29, 494–508. [Google Scholar] [CrossRef]
  11. Goyette, J.O.; Bennett, E.M.; Howarth, R.W.; Maranger, R. Changes in anthropogenic nitrogen and phosphorus inputs to the St. Lawrence sub-basin over 110 years and impacts on riverine export. Glob. Biogeochem. Cycles 2016, 30, 1000–1014. [Google Scholar] [CrossRef] [Green Version]
  12. Hong, B.; Swaney, D.P.; Howarth, R.W. Estimating Net Anthropogenic Nitrogen Inputs to U.S. Watersheds: Comparison of Methodologies. Environ. Sci. Technol. 2013, 47, 5199–5207. [Google Scholar] [CrossRef] [PubMed]
  13. Hong, B.; Swaney, D.P.; McCrackin, M.; Svanbäck, A.; Humborg, C.; Gustafsson, B.; Yershova, A.; Pakhomau, A. Advances in NANI and NAPI accounting for the Baltic drainage basin: Spatial and temporal trends and relationships to watershed TN and TP fluxes. Biogeochemistry 2017, 133, 245–261. [Google Scholar] [CrossRef] [Green Version]
  14. Hong, B.; Swaney, D.P.; Mörth, C.M.; Smedberg, E.; Hägg, H.E.; Humborg, C.; Howarth, R.W.; Bouraoui, F. Evaluating regional variation of net anthropogenic nitrogen and phosphorus inputs (NANI/NAPI), major drivers, nutrient retention pattern and management implications in the multinational areas of Baltic Sea basin. Ecol. Model. 2012, 227, 117–135. [Google Scholar] [CrossRef]
  15. Cui, M.; Guo, Q.J.; Wei, R.F.; Wei, Y.J. Anthropogenic nitrogen and phosphorus inputs in a new perspective: Environmental loads from the mega economic zone and city clusters. J. Clean. Prod. 2021, 283, 14. [Google Scholar] [CrossRef]
  16. Mao, Y.; Zhang, H.; Tang, W.; Zhao, J.; Wang, Z.; Fan, A. Net anthropogenic nitrogen and phosphorus inputs in Pearl River Delta region (2008–2016). J. Environ. Manag. 2021, 282, 111952. [Google Scholar] [CrossRef]
  17. Xu, W.; Luo, X.S.; Pan, Y.P.; Zhang, L.; Tang, A.H.; Shen, J.L.; Zhang, Y.; Li, K.H.; Wu, Q.H.; Yang, D.W.; et al. Quantifying atmospheric nitrogen deposition through a nationwide monitoring network across China. Atmos. Chem. Phys. 2015, 15, 12345–12360. [Google Scholar] [CrossRef] [Green Version]
  18. Cui, X.; Huang, C.Z.; Wu, J.P.; Liu, X.H.; Hong, Y.G. Temporal and spatial variations of net anthropogenic nitrogen inputs (NANI) in the Pearl River Basin of China from 1986 to 2015. PLoS ONE 2020, 15, e0228683. [Google Scholar] [CrossRef] [Green Version]
  19. Gao, W.; Howarth, R.W.; Hong, B.; Swaney, D.P.; Guo, H.C. Estimating net anthropogenic nitrogen inputs (NANI) in the Lake Dianchi basin of China. Biogeosciences 2014, 11, 4577–4586. [Google Scholar] [CrossRef] [Green Version]
  20. Sobota, D.J.; Harrison, J.A.; Dahlgren, R.A. Influences of climate, hydrology, and land use on input and export of nitrogen in California watersheds. Biogeochemistry 2009, 94, 43–62. [Google Scholar] [CrossRef]
  21. Howarth, R.; Swaney, D.; Billen, G.; Garnier, J.; Hong, B.; Humborg, C.; Johnes, P.; Mörth, C.-M.; Marino, R. Nitrogen fluxes from the landscape are controlled by net anthropogenic nitrogen inputs and by climate. Front. Ecol. Environ. 2012, 10, 37–43. [Google Scholar] [CrossRef] [PubMed] [Green Version]
  22. Zhang, X.; Yi, Y.; Yang, Z. Nitrogen and phosphorus retention budgets of a semiarid plain basin under different human activity intensity. Sci. Total Environ. 2020, 703, 134813. [Google Scholar] [CrossRef] [PubMed]
  23. Li, K.; Huang, G.; Wang, S.; Razavi, S. Development of a physics-informed data-driven model for gaining insights into hydrological processes in irrigated watersheds. J. Hydrol. 2022, 613, 128323. [Google Scholar] [CrossRef]
  24. Ren, D.; Xu, X.; Engel, B.; Huang, Q.; Xiong, Y.; Huo, Z.; Huang, G. Hydrological complexities in irrigated agro-ecosystems with fragmented land cover types and shallow groundwater: Insights from a distributed hydrological modeling method. Agric. Water Manag. 2019, 213, 868–881. [Google Scholar] [CrossRef]
  25. Smith, A.; Maheshwari, B.L. Options for alternative irrigation water supplies in the Murray-Darling Basin, Australia: A case study of the Shepparton Irrigation Region. Agric. Water Manag. 2002, 56, 41–55. [Google Scholar] [CrossRef]
  26. Wang, X.W.; Yang, H.; Cai, Y.P.; Yu, C.X.; Yue, W.C. Identification of optimal strategies for agricultural nonpoint source management in Ulansuhai Nur watershed of Inner Mongolia, China. Stoch. Environ. Res. Risk Assess. 2016, 30, 137–153. [Google Scholar] [CrossRef]
  27. Hobbie, S.E.; Finlay, J.C.; Janke, B.D.; Nidzgorski, D.A.; Millet, D.B.; Baker, L.A. Contrasting nitrogen and phosphorus budgets in urban watersheds and implications for managing urban water pollution. Proc. Natl. Acad. Sci. USA 2017, 114, 4177–4182. [Google Scholar] [CrossRef] [Green Version]
  28. Yang, Y.; Weng, B.; Bi, W.; Xu, T.; Yan, D.; Ma, J. Climate Change Impacts on Drought-Flood Abrupt Alternation and Water Quality in the Hetao Area, China. Water 2019, 11, 652. [Google Scholar] [CrossRef] [Green Version]
  29. Zhang, Q.; Yu, R.; Jin, Y.; Zhang, Z.; Liu, X.; Xue, H.; Hao, Y.; Wang, L. Temporal and Spatial Variation Trends in Water Quality Based on the WPI Index in the Shallow Lake of an Arid Area: A Case Study of Lake Ulansuhai, China. Water 2019, 11, 1410. [Google Scholar] [CrossRef] [Green Version]
  30. Howarth, R.; Billen, G.; Swaney, D.; Townsend, A.; Jaworski, N.; Lajtha, K.; Downing, J.A.; Elmgren, R.; Caraco, N.; Jordan, T.; et al. Regional nitrogen budgets and riverine N&P fluxes for the drainages to the North Atlantic Ocean: Natural and human influences. Biogeochemistry 1996, 35, 75–139. [Google Scholar]
  31. Han, Y.; Fan, Y.; Yang, P.; Wang, X.; Wang, Y.; Tian, J.; Xu, L.; Wang, C. Net anthropogenic nitrogen inputs (NANI) index application in Mainland China. Geoderma 2014, 213, 87–94. [Google Scholar] [CrossRef]
  32. Huang, H.; Chen, D.; Zhang, B.; Zeng, L.; Dahlgren, R.A. Modeling and forecasting riverine dissolved inorganic nitrogen export using anthropogenic nitrogen inputs, hydroclimate, and land-use change. J. Hydrol. 2014, 517, 95–104. [Google Scholar] [CrossRef] [Green Version]
  33. Xv, H.; Xing, W.; Yang, P.; Ao, C. Regional estimation of net anthropogenic nitrogen inputs (NANI) and the relationships with socioeconomic factors. Environ. Sci. Pollut. Res. 2020, 28, 11170–11182. [Google Scholar] [CrossRef] [PubMed]
  34. Jordan, T.E.; Weller, D.E. Human contributions to terrestrial nitrogen flux. Bioscience 1996, 46, 655–664. [Google Scholar] [CrossRef] [Green Version]
  35. Kurokawa, J.; Ohara, T. Long-term historical trends in air pollutant emissions in Asia: Regional Emission inventory in ASia (REAS) version 3. Atmos. Chem. Phys. 2020, 20, 12761–12793. [Google Scholar] [CrossRef]
  36. Zhang, W.; Swaney, D.P.; Hong, B.; Howarth, R.W.; Han, H.; Li, X. Net anthropogenic phosphorus inputs and riverine phosphorus fluxes in highly populated headwater watersheds in China. Biogeochemistry 2015, 126, 269–283. [Google Scholar] [CrossRef]
  37. Jun, C.; Ban, Y.; Li, S. Open access to Earth land-cover map. Nature 2014, 514, 434. [Google Scholar] [CrossRef] [Green Version]
  38. Cao, Y.; Zhang, X.; Jiao, W.; Liu, J.; Zhang, C.; Liu, K.; Jia, H. Effects of different NPK content compound fertilizers on flax yield. J. North. Agric. 2020, 48, 74–77. [Google Scholar]
  39. Boyer, E.W.; Goodale, C.L.; Jaworsk, N.A.; Howarth, R.W. Anthropogenic nitrogen sources and relationships to riverine nitrogen export in the northeastern USA. Biogeochemistry 2002, 57, 137–169. [Google Scholar] [CrossRef]
  40. Chen, F.; Hou, L.J.; Liu, M.; Zheng, Y.L.; Yin, G.Y.; Lin, X.B.; Li, X.F.; Zong, H.B.; Deng, F.Y.; Gao, J.; et al. Net anthropogenic nitrogen inputs (NANI) into the Yangtze River basin and the relationship with riverine nitrogen export. J. Geophys. Res.-Biogeosci 2016, 121, 451–465. [Google Scholar] [CrossRef] [Green Version]
  41. Zhang, W.S.; Swaney, D.P.; Li, X.Y.; Hong, B.; Howarth, R.W.; Ding, S.H. Anthropogenic point-source and non-point-source nitrogen inputs into Huai River basin and their impacts on riverine ammonia-nitrogen flux. Biogeosciences 2015, 12, 4275–4289. [Google Scholar] [CrossRef] [Green Version]
  42. Ju, L.; Yu, D.; Fang, H.; Guo, Q.; Xu, X.; Li, S.; Zhao, L. Trends and food sources composition of energy, protein and fat in Chinese residents, 1992–2012. J. Hyg. Res. 2018, 47, 689–704. [Google Scholar]
  43. Yu, D.; He, Y.n.; Guo, Q.; Fang, H.; Xu, X.; Fang, Y.; Li, J.; Zhao, L. Trends of energy and nutrients intake among Chinese population in 2002–2012. J. Hyg. Res. 2016, 45, 527–533. [Google Scholar]
  44. Yang, Y.X. China Food Composition Tables Standard Edition; Peking University Medical Press: Beijing, China, 2018. [Google Scholar]
  45. Hu, M.; Liu, Y.; Zhang, Y.; Shen, H.; Yao, M.; Dahlgren, R.A.; Chen, D. Long-term (1980–2015) changes in net anthropogenic phosphorus inputs and riverine phosphorus export in the Yangtze River basin. Water Res. 2020, 177, 11. [Google Scholar] [CrossRef]
  46. Li, C.; Li, S.-L.; Yue, F.-J.; Liu, J.; Zhong, J.; Yan, Z.-F.; Zhang, R.-C.; Wang, Z.-J.; Xu, S. Identification of sources and transformations of nitrate in the Xijiang River using nitrate isotopes and Bayesian model. Sci. Total Environ. 2019, 646, 801–810. [Google Scholar] [CrossRef]
  47. Wang, Y.S.; Xie, X.; Liu, C.; Wang, Y.Y.; Li, M. Variation of net anthropogenic phosphorus inputs (NAPI) and riverine phosphorus fluxes in seven major river basins in China. Sci. Total Environ. 2020, 742, 13. [Google Scholar] [CrossRef]
  48. Torres-Martínez, J.A.; Mora, A.; Mahlknecht, J.; Kaown, D.; Barceló, D. Determining nitrate and sulfate pollution sources and transformations in a coastal aquifer impacted by seawater intrusion—A multi-isotopic approach combined with Self-organizing maps and a Bayesian mixing model. J. Hazard. Mater. 2021, 417, 126103. [Google Scholar] [CrossRef]
  49. Russell, M.J.; Weller, D.E.; Jordan, T.E.; Sigwart, K.J.; Sullivan, K.J. Net anthropogenic phosphorus inputs: Spatial and temporal variability in the Chesapeake Bay region. Biogeochemistry 2008, 88, 285–304. [Google Scholar] [CrossRef]
  50. Han, Y.; Feng, G.; Swaney, D.P.; Dentener, F.; Koeble, R.; Ouyang, Y.; Gao, W. Global and regional estimation of net anthropogenic nitrogen inputs (NANI). Geoderma 2020, 361, 9. [Google Scholar] [CrossRef]
  51. Gao, W.; Swaney, D.P.; Hong, B.; Howarth, R.W.; Liu, Y.; Guo, H. Evaluating anthropogenic N inputs to diverse lake basins: A case study of three Chinese lakes. Ambio 2015, 44, 635–646. [Google Scholar] [CrossRef] [Green Version]
  52. Li, Y.; Liu, H.-B.; Lei, Q.-L.; Hu, W.-L.; Wang, H.-Y.; Zhai, L.-M.; Ren, T.-Z.; Lian, H.-S. Impact of Human Activities on Net Anthropogenic Nitrogen Inputs (NANI) at Township Scale in Erhai Lake Basin. Huan Jing Ke Xue Huanjing Kexue 2018, 39, 4189–4198. [Google Scholar]
  53. Gao, W.; Gao, B.; Yan, C.; Liu, Y. Evolution of anthropogenic nitrogen and phosphorus inputs to Lake Poyang Basin and its’ effect on water quality of lake. Acta Sci. Circumstantiae 2016, 36, 3137–3145. [Google Scholar]
  54. Alexander, R.B.; Smith, R.A.; Schwarz, G.E.; Boyer, E.W.; Nolan, J.V.; Brakebill, J.W. Differences in Phosphorus and Nitrogen Delivery to The Gulf of Mexico from the Mississippi River Basin. Environ. Sci. Technol. 2008, 42, 822–830. [Google Scholar] [CrossRef] [PubMed] [Green Version]
  55. De Lucena Barbosa, J.E.; dos Santos Severiano, J.; Cavalcante, H.; de Lucena-Silva, D.; Mendes, C.F.; Barbosa, V.V.; dos Santos Silva, R.D.; de Oliveira, D.A.; Molozzi, J. Impacts of inter-basin water transfer on the water quality of receiving reservoirs in a tropical semi-arid region. Hydrobiologia 2021, 848, 651–673. [Google Scholar] [CrossRef]
  56. Zhuang, W. Eco-environmental impact of inter-basin water transfer projects: A review. Environ. Sci. Pollut. Res. 2016, 23, 12867–12879. [Google Scholar] [CrossRef]
  57. Du, J.; Yang, P.; Li, Y.; Ren, S.; Wang, Y.; Li, X.; Su, Y. Effect of different irrigation seasons on the transport of N in different types farmlands and the agricultural non-point pollution production. Trans. Chin. Soc. Agric. Eng. 2011, 27, 66–74. [Google Scholar]
  58. Romero, E.; Garnier, J.; Billen, G.; Peters, F.; Lassaletta, L. Water management practices exacerbate nitrogen retention in Mediterranean catchments. Sci. Total Environ. 2016, 573, 420–432. [Google Scholar] [CrossRef]
  59. Billen, G.; Thieu, V.; Garnier, J.; Silvestre, M. Modelling the N cascade in regional watersheds: The case study of the Seine, Somme and Scheldt rivers. Agric. Ecosyst. Environ. 2009, 133, 234–246. [Google Scholar] [CrossRef]
  60. Chen, D.J.; Hu, M.P.; Wang, J.H.; Guo, Y.; Dahlgren, R.A. Factors controlling phosphorus export from agricultural/forest and residential systems to rivers in eastern China, 1980–2011. J. Hydrol. 2016, 533, 53–61. [Google Scholar] [CrossRef] [Green Version]
  61. Ren, D.; Xu, X.; Huang, Q.; Huo, Z.; Xiong, Y.; Huang, G. Analyzing the Role of Shallow Groundwater Systems in the Water Use of Different Land-Use Types in Arid Irrigated Regions. Water 2018, 10, 634. [Google Scholar] [CrossRef] [Green Version]
  62. Chen, C.; Pan, J.; Lam, S.K. A review of precision fertilization research. Environ. Earth Sci. 2014, 71, 4073–4080. [Google Scholar] [CrossRef]
  63. Tang, Q.; Cotton, A.; Wei, Z.J.; Xia, Y.Q.; Daniell, T.; Yan, X.Y. How does partial substitution of chemical fertiliser with organic forms increase sustainability of agricultural production? Sci. Total Environ. 2022, 803, 149933. [Google Scholar] [CrossRef] [PubMed]
  64. Zhou, L.; He, J.; Qi, Z.; Dyck, M.; Zou, Y.; Zhang, T.; Feng, H. Effects of lateral spacing for drip irrigation and mulching on the distributions of soil water and nitrate, maize yield, and water use efficiency. Agric. Water Manag. 2018, 199, 190–200. [Google Scholar] [CrossRef]
  65. Metson, G.S.; Lin, J.; Harrison, J.A.; Compton, J.E. Linking terrestrial phosphorus inputs to riverine export across the United States. Water Res. 2017, 124, 177–191. [Google Scholar] [CrossRef]
  66. Lyu, C.; Li, X.; Yuan, P.; Song, Y.; Gao, H.; Liu, X.; Liu, R.; Yu, H. Nitrogen retention effect of riparian zones in agricultural areas: A meta-analysis. J. Clean. Prod. 2021, 315, 128143. [Google Scholar] [CrossRef]
  67. Mayer, P.M.; Reynolds, S.K., Jr.; McCutchen, M.D.; Canfield, T.J. Meta-Analysis of Nitrogen Removal in Riparian Buffers. J. Environ. Qual. 2007, 36, 1172–1180. [Google Scholar] [CrossRef] [Green Version]
  68. Trepel, M.; Palmeri, L. Quantifying nitrogen retention in surface flow wetlands for environmental planning at the landscape-scale. Ecol. Eng. 2002, 19, 127–140. [Google Scholar] [CrossRef]
Figure 1. Geographical location of the UNW.
Water 15 00276 g001
Figure 2. Intra−annual distributions of mean temperature and precipitation from 2005 to 2019.
Water 15 00276 g002
Figure 3. Methodology of NANI estimation method.
Water 15 00276 g003
Figure 4. Temporal changes of NANI and NANI from fertilizer N input (Nfert), irrigation N input (Nir), atmosphere N deposition (Ndep), seed N input (Nseed), Nitrogen fixation (Ncro), and net food and feed N input (Nim) during 2005−2019 in the UNW.
Water 15 00276 g004
Figure 5. Spatial distribution of NANI in research units of the UNW in 2005–2019 (a), 2005–2009 (b), 2010–2014 (c) and 2015–2019 (d).
Water 15 00276 g005
Figure 6. Pearson correlation coefficients between NANI and its components and economic, agricultural, and social factors.
Water 15 00276 g006
Figure 7. Temporal variations in the riverine N export and NANI in the UNW from 2005 to 2019.
Water 15 00276 g007
Figure 8. NANI values and its components in major watersheds and countries worldwide.
Water 15 00276 g008
Table 1. Social–economic factors used for correlation analysis with NANI value and its components.
CategoryFactorSymbol
Social factorsTotal populationTP
Total population densityTPD
Agricultural factorsCultivated land area per unit areaCLA
Grain yield per unit areaGY
Fertilizer consumption densityFCD
Livestock densityLD
Economic factorsGross domestic product per unit areaGDP
Gross agricultural output value per unit areaGAO
Gross industrial output value per unit areaGIO
Table 2. Regression analysis between riverine N export (y) and independent variables (x) in the UNW from 2005 to 2019.
Independent Variables (x)FormulasR2p
NANI (kg N km−1 yr−1)y = −150.79 + 0.0304x0.0480.431
y = −80 exp(0.0249x)0.0310.53
Chemical fertilizer (kg N km−1 yr−1)y = 106.45 + 0.0361x0.0220.591
Annual streamflow (108 m3)y = −0.014x + 7.66620.3710.015
Annual precipitation (mm)y = −0.3174x + 308.130.1860.108
Disclaimer/Publisher’s Note: The statements, opinions and data contained in all publications are solely those of the individual author(s) and contributor(s) and not of MDPI and/or the editor(s). MDPI and/or the editor(s) disclaim responsibility for any injury to people or property resulting from any ideas, methods, instructions or products referred to in the content.

