Article

Water Disappearance and Manure Production at Growing–Finishing Commercial Pig Farms in Brazil—A Simplified Model Approach

by
Jorge Manuel Rodrigues Tavares
1,2,*,
Janice da Conceição Lopes
1,
Paulo Belli Filho
3,
Arlei Coldebella
4 and
Paulo Armando Victória de Oliveira
4
1
Department of Technologies and Applied Sciences, School of Agriculture, Polytechnic Institute of Beja, Apartado 6155, 7800-295 Beja, Portugal
2
Fiber Materials and Environmental Technologies (FibEnTech-UBI), Universidade da Beira Interior, R. Marquês de D’Ávila e Bolama, 6201-001 Covilhã, Portugal
3
Department of Sanitary and Environmental Engineering, Campus Universitário, Federal University of Santa Catarina, Trindade, Florianópolis 88040-970, Brazil
4
Brazilian Agricultural Research Corporation—Swine & Poultry Unit, BR 153, Km 110, Concórdia 89715-899, Brazil
*
Author to whom correspondence should be addressed.
Water 2023, 15(2), 278; https://doi.org/10.3390/w15020278
Submission received: 2 December 2022 / Revised: 29 December 2022 / Accepted: 4 January 2023 / Published: 9 January 2023

Abstract

:
The aim of this study was to fit water disappearance and manure production curves at growing–finishing commercial pig farms and compare the curve that best describes the evolution of parameters evaluated, according to three variables: age, body weight, and pigs’ housing period. Accordingly, 33 production cycles were evaluated considering a housing period of 105 days (13,276 pigs—nine weeks old and 24.5 kg average body weight) during 13 months in 15 commercial pig farms located in southern Brazil. The variables analyzed were used to adjust the water disappearance and manure production curves (Brody, Gompertz, Logistic, Richards, and Von Bertalanffy) and to estimate its biological parameters according to the NLMIXED SAS procedures. It was found that the Logistic model was the one that best described both the water disappearance and the manure production, displaying an asymptotic adjustment and estimated values measured in farms, e.g., pigs age (water: R² = 0.989, absolute error: 1.11 L/pig/day, and prediction error = 1.32%; manure: R² = 0.995, absolute error = 0.04 L/pig/day, and prediction error = 0.96%). It is emphasized that the models determined in this research are the basis of the development of an instantaneous measuring device that allows the producer to visualize both the water disappearance (plotting the daily measures) as well as manure production in the farm and compare the values with the estimated curves.

1. Introduction

The management of pig farming activities is one of the main pillars of the success of the activity. Through this, it is possible to systematically understand the aspects and processes associated with production and to define in a sustainable way, which are the fundamental procedures for carrying out the daily tasks on farms [1]. Since the 1950s, several mathematical models were developed for decision support tools [2], to significantly improve resource use efficiency [3], to organize, process and systematize the data collected [1]. Currently, these models were extended to different economical activities worldwide, including livestock production, resulting in relevant information for the daily decision-making of producers and/or other stakeholders associated with pig farming [1]. The fourth revolution of agricultural technology (Agriculture 4.0) exhibits topics for research to increase productivity, allocating, if possible, the same or less resources, adapting to global warming and climate change [4]. The application of mathematical models is a limitation for most of producers in developing countries, however, as a decision support tool [1,2,3,4], must be considered as an important part of the evolutive process in animal science and can be defined as “use of equations to describe or simulate processes inserted in a system” [5]. In pig production, modeling is considered an important tool for decision-making, being able to be used to estimate variables/parameters related to critical characteristics, considering various factors according to the physiological stage of production, such as: management, genetics, animal nutrition, health, reproduction, biosecurity, behavior, welfare, resource consumption and pollutant emissions, and environment [6,7]. In the era of big data collection on pig farms, the digitalization process will generate new knowledge in relevant topics of production. Additionally, these data can be further exploited using the knowledge of animal requirements and physiology to develop new phenotypes increasing the sustainability and efficiency of breeding. Technological tools based on daily data increase the opportunities to generate performance indicators for production based on the difference between both the observed and the individual’s potential data [8].
Many scientific processes are described by linear models; although, the biological processes associated to animal science are inherently explained by non-linear models [9,10]. Asymptotic models are included within the nonlinear models’ group in which the graphic representation shows a horizontal asymptotic, that is, when the independent variable tends to infinity, the function limit is a constant [10]. An example that describes the use of this model is the tissue growth in animals or plants that are, generally, faster in the initial phase of life, subsequently decreasing speed and tending to its stabilization in adulthood [9,10,11]. The adjustment of asymptotic non-linear models also allows the synthesis of information from animals in certain time periods (e.g., body weight according to age). Therefore, in this period, a set of parameters can be interpreted biologically, making it easy to understand the animal growth and development phenomenon [9,11,12,13,14].
The asymptotic non-linear models that are most frequently used to describe the studies about growth and animal development are the following: Brody [15], Gompertz [16], Logistic [17], Richards [18], and Von Bertalanffy [19]. It should be highlighted that although there is animal science research published in the literature using the asymptotic non-linear models, there are currently no references on the possibility of adopting this type of model to estimate water disappearance and manure production, according to age, body weight and animal housing period [1,14].
Considering the above, the present research aimed to fit water disappearance and manure production curves at growing–finishing commercial pig farms and compare the curve that best describes the evolution of parameters evaluated, according to three variables: age, body weight, and pigs’ housing period. The hypothesis tested was: “it is possible to estimate water disappearance and manure with a simplified model approach, in growing-finishing commercial pig farms, with body weight between 25 and 120 kg, using asymptotic non-linear models”.

2. Materials and Methods

The development of simplified models to estimate the water disappearance and manure production, in growing–finishing commercial pig farms, assumed that the profile of both parameters has similar behavior in the growth of animal tissues. Accordingly, it was assumed that water disappearance and manure production rates increase in the initial phase of pigs’ life, slowing down afterwards and stabilizing in adulthood. The models’ development to estimate both parameters, following a simplified approach, was designed in accordance with two steps: (1) the Gompertz non-linear model was adjusted to the weekly means of water disappearance and manure production, as a function of the pigs’ housing period (up to t = 15 weeks; 105 days) [14]; (2) Non-linear models (Brody, Gompertz, Logistic, Richards, and Von Bertalanffy) were compared to each other after adjustment to the weekly means of water disappearance and manure production in commercial pig farms according to three variables: age between 63 and 168 days; body weight (initial: 24.5 kg) and animal housing period (t = 15 weeks; 105 days).

2.1. Experimental Design

The research was undertaken in 15 commercial pig farms, located in the west of Santa Catarina state in southern Brazil, according to the methodology described in the literature [1,14]. To systematize and reduce possible causes of variation during the production cycles evaluated the 15 farms were identified and selected according to the following assumptions: (a) located in the same geographic region; (b) belong to the same agroindustry, with a specific production flow; (c) representative of growing–finishing physiological phase; (d) feasibility conditions at housing buildings to develop the research with minimal intervention.
Two groups of animals (13,276 pigs in total) were housed and monitored at the selected farms during the evaluation 33 cycles of production, considering two different seasons of the year, cold and warm. The animals were monitored with Large White × Landrace (maternal line) and Landrace × Large White or Pietrain (paternal line) and were distributed randomly by sex in both sides of the housing building, each with pens for 10 pigs (1.0 m2/pig), with a fully concrete floor, naturally ventilated through a system of a double-sided curtain, until the end of the production cycle.
The animal water intake was ad libitum and feed intake was manual with restricted daily intake (3 times per day), according to the specific recommendations of the agrobusiness. The pigs had access to nine different nutritionally balanced diets (corn and soybean; crude protein content ranging between 21% and 14%) produced by the agroindustry company [20,21].

2.2. Water Disappearance and Manure Production

The water disappearance (intake plus wastage) was measured by a total of 55 water meters (Unimag Cyble PN 10, ITRÓN Inc., Liberty Lake, WA, USA) installed in all water delivery lines (if necessary, cooling and cleaning facilities, but not considered) supplying each housing building at the selected farms. Each device installed was calibrated to verify accuracy at the start and end of the production cycle, and their levels were recorded daily by the producer (24 h). To reduce potential mistakes, on the first and last day of pigs’ housing, the readings were analyzed, and corrected according to the time of animals’ entrance and exit. The drinker’s management was not evaluated (e.g., water column pressure, water flow, height, and slope) despite their influence on pigs’ water disappearance [22,23].
The volume of manure produced was measured by installing 5 m3 volume fiberglass tanks (Fibratec and Fortlev, Araquari SC, Brazil) between the housing buildings and the storage system in each farm. The producer discharged on a daily basis (24 h) the manure stored in the external pit’s ditches into the fiberglass tanks; subsequently, the manure depth inside the tanks was determined with the aid of a graduated ruler, recording the values on a specific worksheet. During the manure discharge, it was observed that a certain quantity of solids remained settled/retained at the bottom of the fiberglass tank. To avoid an error by overestimation of the volume of manure produced, the height of the retained solids was measured, and a reference value was estimated per farm to remove from the total depth. The manure production data were transferred weekly to a specific worksheet and through specific equations, the daily volumes and weekly means were determined for each farm.
All potential data collection errors detected in relation to the pipes and drinkers (leaks), and to the pit’s ditches and fiberglass tanks, were analyzed, corrected and some were excluded (less than 1%) from the calculation of the total daily consumption and manure production of the farm [14].

2.3. Simplified Mathematic Model Approach

In the development steps of the model, the daily measures of water disappearance and manure production obtained in the physiological phase of growing–finishing (n = 33 cycles) were organized into weekly average data, without considering the effect of the producer, to estimate the parameters with biological meaning (a, b, c) of the asymptotic non-linear models selected in function of three variables: age (between 63 and 168 days), housing period (up to t = 15 weeks; 105 days), and pigs’ body weight (initial: 24.5 kg). It must be pointed out that the curve fitting as a function of body weight was performed after simple linear regression between the measured weight value and the age of the animals for each cycle evaluated. To determine the weekly weights of the animals, the body weight of the gilts and barrows was measured four times during the growing–finishing cycles: the first one when they left the nursery, which precedes pigs housing in the physiological phase of growth-to-finishing (63 days of age), two times during the production cycle (103–108 days and 143–148 days) and the last one when the animals were slaughtered (168 days of age).
The mathematical equations of the asymptotic non-linear models used during the research, among them, i.e., Brody—Equation (1) [15], Gompertz—Equation (2) [16], Logistic—Equation (3) [17], Richards—Equation (4) [18], and Von Bertalanffy—Equation (5) [19], for the estimation of water disappearance and manure production, were the following:
E x = a   1 - b   exp   - cx
E x = a   exp - b   exp   - cx
E x = a   /   1 + b   exp   - cx
E x = a   1 - b   exp   - cx v
E x = a   1 - b   exp   - cx 3
non-linear model with four parameters estimation (a, b, d, and v).
where: E(x)—water disappearance or pig manure production as a function of age (L/pig/day), housing period (L/pig/day), and pigs’ body weight (L/pig/kg); a: asymptotic value of water disappearance or manure production at maturity (L); b: constant relating water disappearance and manure production as a function of age, housing period, and pigs body weight; c: decay parameter at the inflection point of the curve; x: age, housing period, or body weight (day or kg); v: fixed parameter that determines the shape of the curve and, consequently, the inflection point in Richards’ non-linear model.

2.4. Statistical Analyses

Statistical descriptive analysis was done for all experimental data. Analyses of the weekly average data adjustment to mathematical non-linear models were performed using the NLMIXED procedure of Statistical Analysis System (SAS Inst. Inc., Cary, NC, USA) [24]. The best models to predict both water disappearance and manure production were selected based on the lowest value of the Akaike Information Criterion (AIC). For each non-linear model the determination coefficients (R2), and prediction errors (absolute (L/pig−1/d−1) and relative (%)) were calculated.

3. Results and Discussion

The asymptotic non-linear models developed to predict both the water disappearance and manure production of pigs in the growing–finishing physiological phase, were developed, as previously mentioned, in terms of two steps.

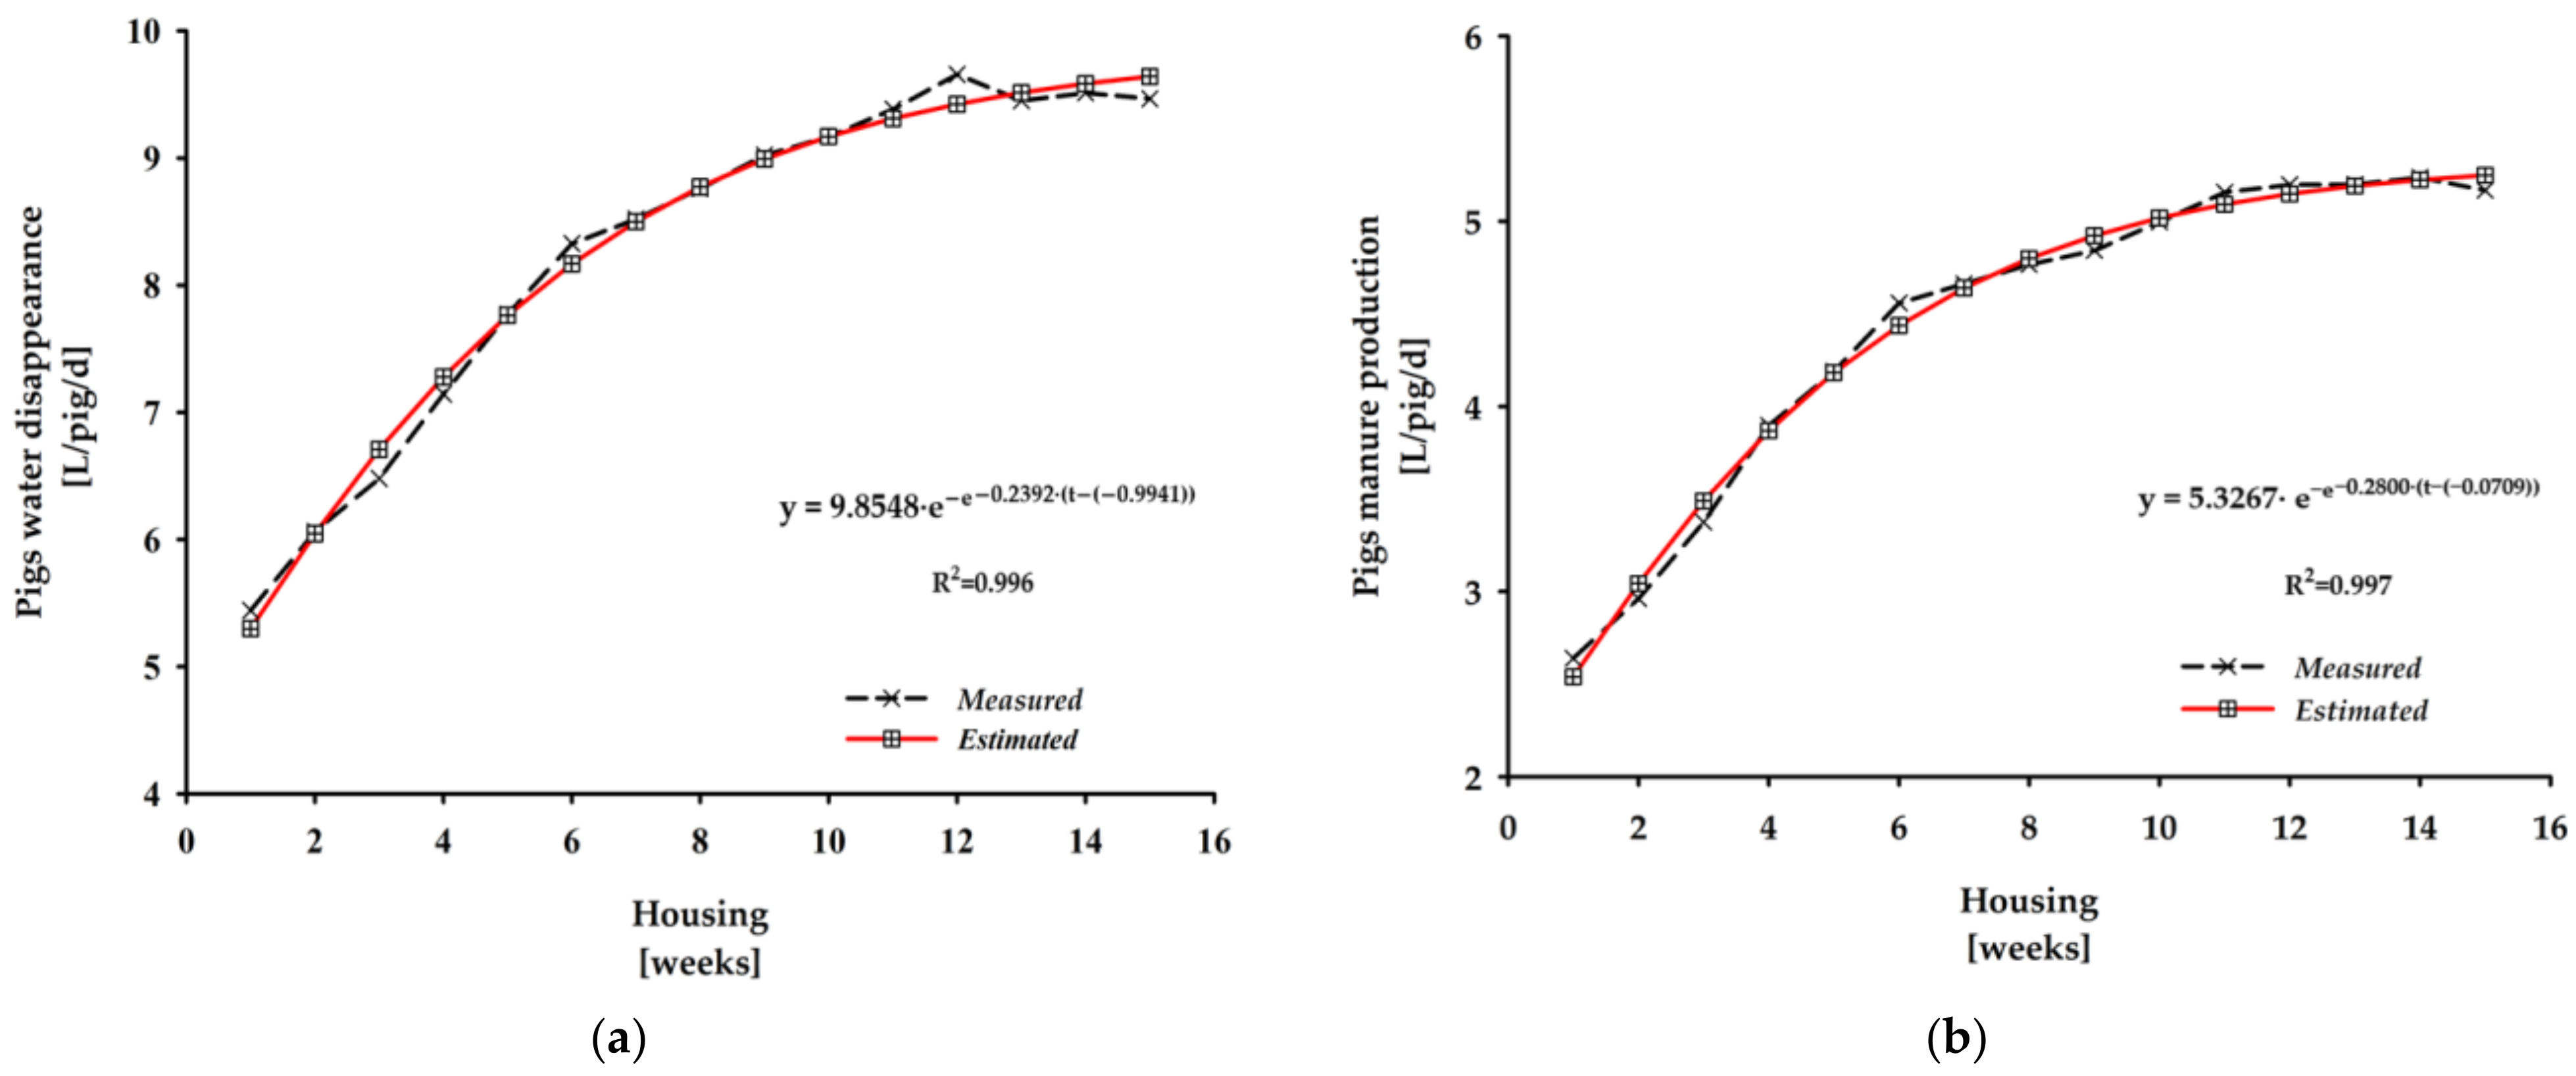
3.1. Gompertz Non-Linear Model Adjusted to the Weekly Means of Water Disappearance and Manure Production, as a Function of the pigs’ Housing Period

Figure 1 exhibits the results obtained for Step 1 regarding the adjustment of the non-linear Gompertz model to (a) the weekly means of water disappearance, and (b) manure production, considering the pigs’ housing period (up to t = 15 weeks; 105 days) for the growing–finishing physiological phase [14].
The results presented in Figure 1 allowed us to observe that the non-linear Gompertz model, using a simplified approach, fitted to the profile of the weekly means data of both water disappearance (n = 32 production cycles), and manure production (n = 33 production cycles), according to the pigs’ housing period. The coefficients determined (water: R2 = 0.996; manure: R2 = 0.997) allowed us to obtain an explanation of the profile of the water disappearance and manure production during the growing–finishing physiological phase with a high degree of confidence. In reference to the results obtained, in the first days of the pigs’ housing, both the water disappearance and manure production were exponential, and after the inflection point, remained asymptotic.

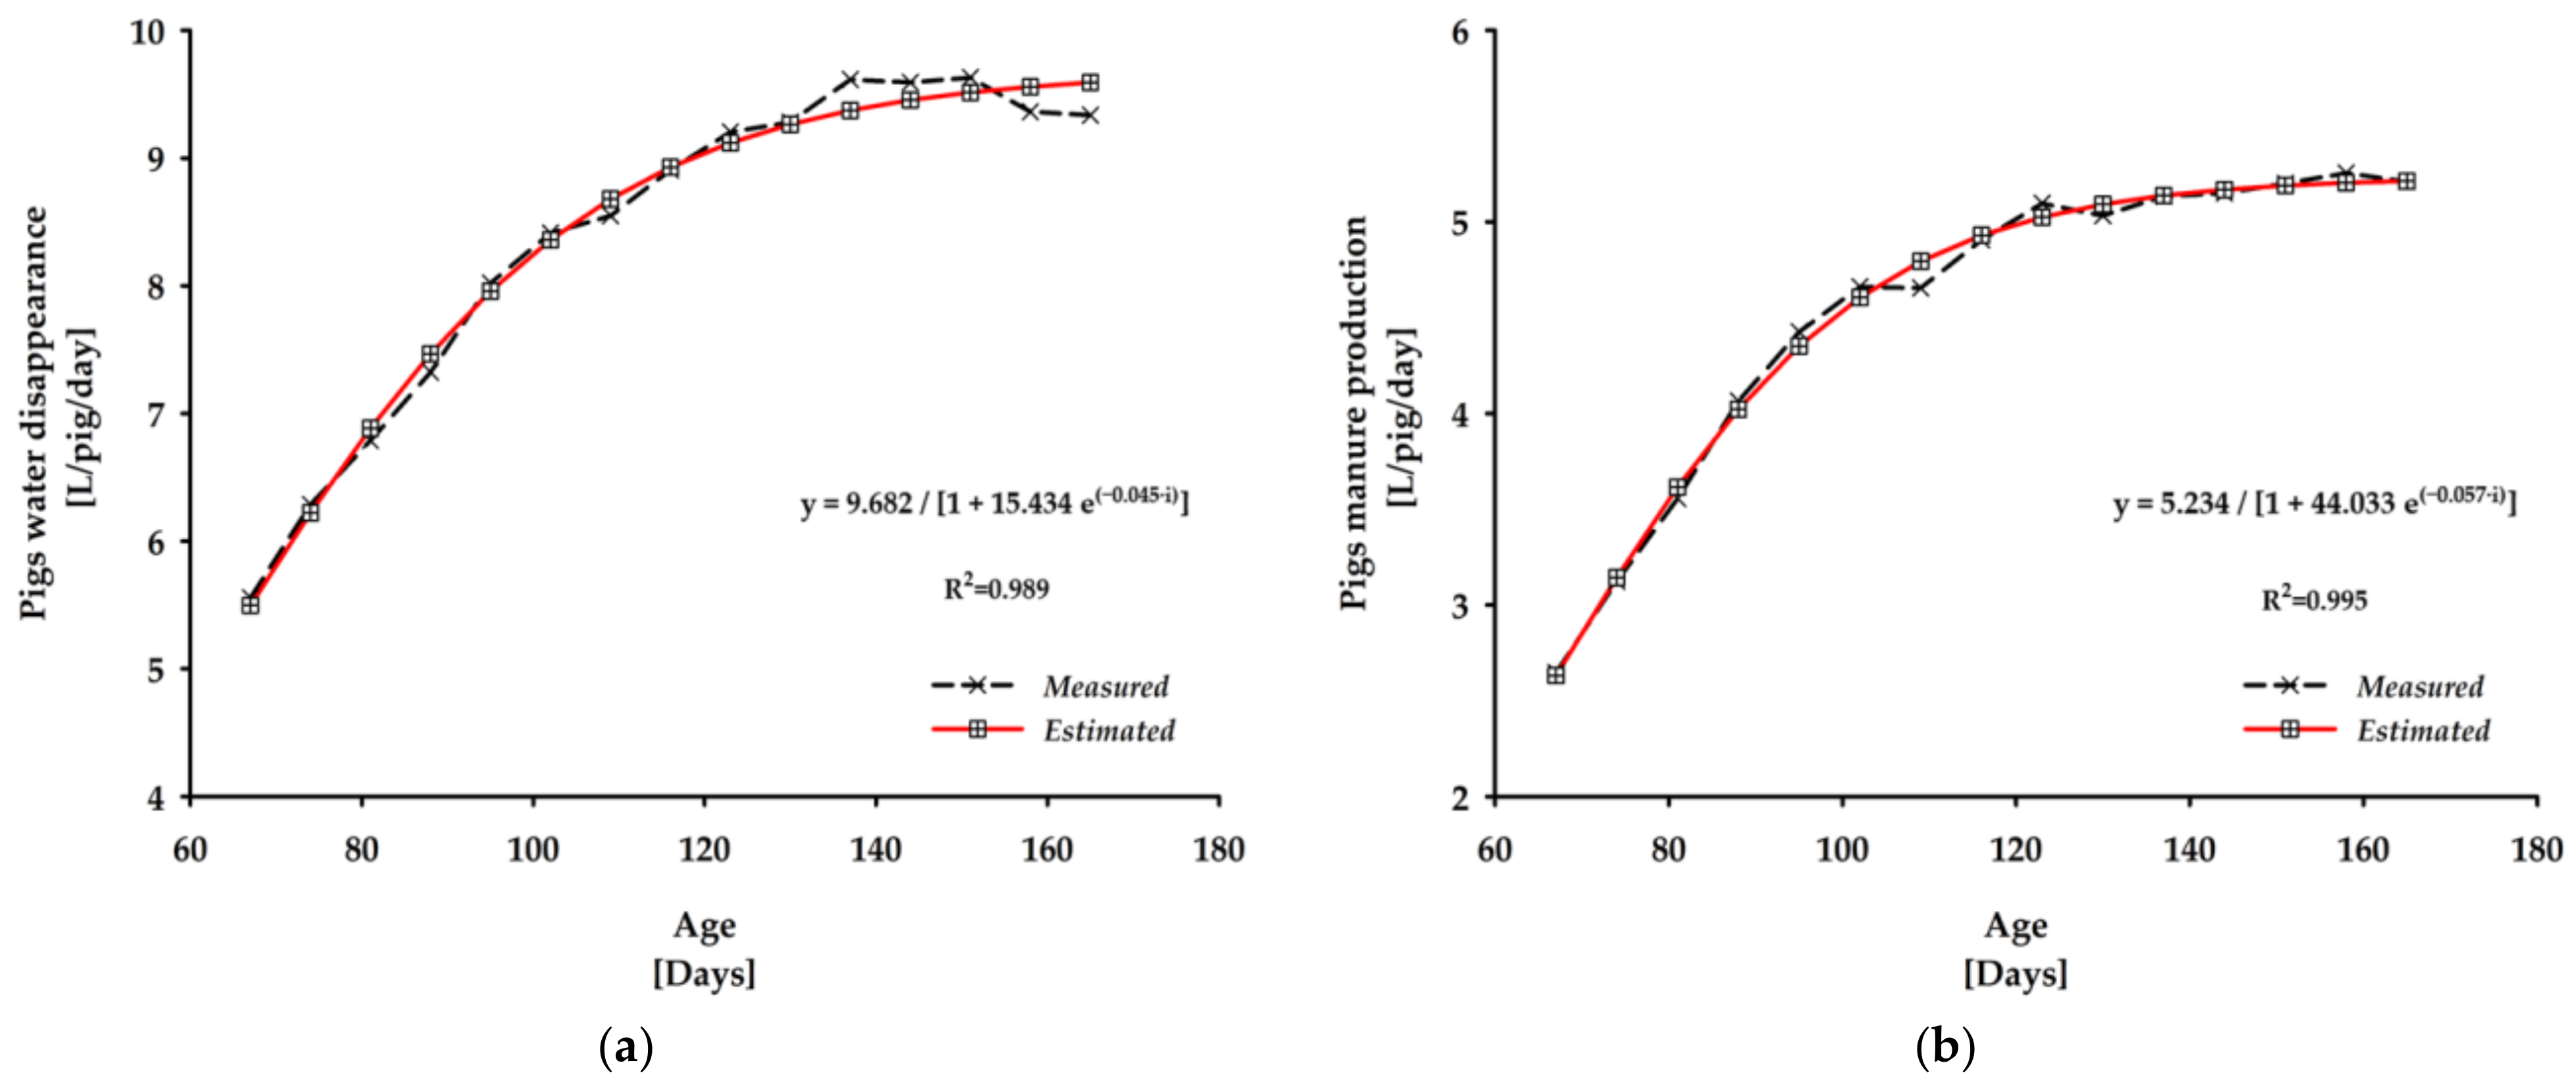
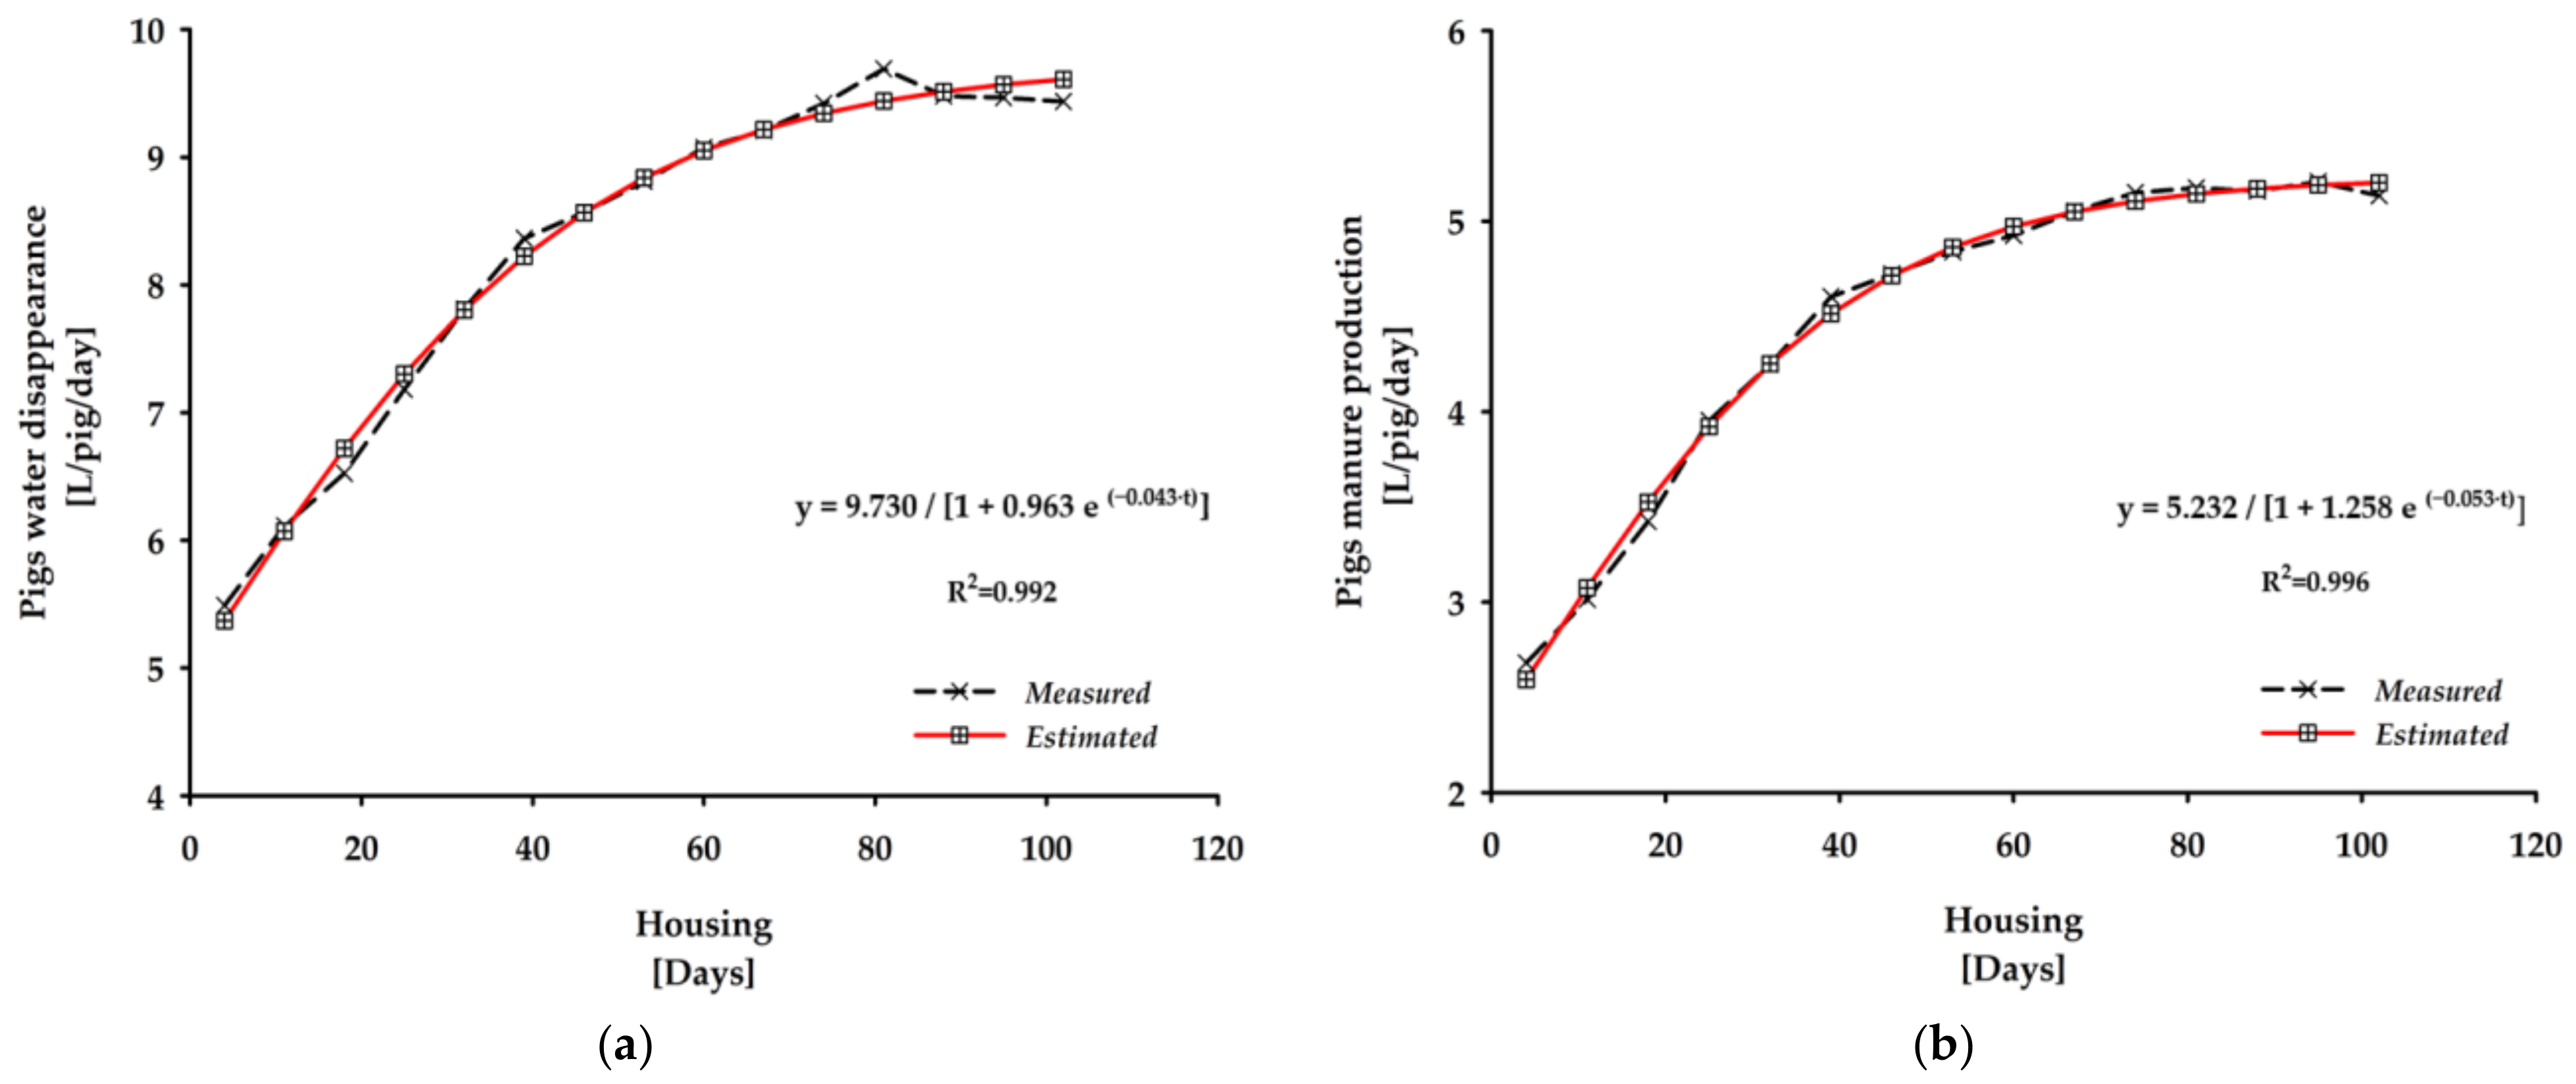
3.2. Different Non-Linear Models Adjusted to the Weekly Means of Water Disappearance and Manure Production in Commercial Pig Farms According to Pigs’ Age

The information obtained at the end of Step 1 proved to be promising given the aim proposed to this research (adjust the curves of water disappearance and manure production in commercial pig farms, in growing–finishing phase). This fact allowed us to move to Step 2, where the results of different nonlinear models (Brody, Gompertz, Logistic, Richards, and Von Bertalanffy) were adjusted and compared to the averages of both parameters under evaluation, according to the three variables: age, body weight, and pigs’ housing period. Given the similarity of the results obtained for the variables referred to in Step 2, the following tables (water disappearance: Table 1, Table 2 and Table 3; manure production: Table 4, Table 5 and Table 6) present the estimation of the biological parameters of the models applied (a, b, c, and v for Richard’s function), the values of Akaike’s information criterion (AIC), the coefficient of determination (R2), and the absolute error of each adjusted model, considering the age (i), body weight (m) and pigs’ housing period (t). It is important to refer that the adjustment of the asymptotic models was made by a simplified mathematical model approach once the data used corresponded to the daily measures of water disappearance and manure production organized into weekly average data.
The displayed values showed that for growing–finishing phase, the Logistic non-linear model was the one that best fitted the means of both variables evaluated, considering the age (i), body weight (m), and pigs’ housing period (manure disappearance: Table 1, Table 2, Table 3; manure production: Table 4, Table 5 and Table 6).
When compared to the other adjusted asymptotic models, by a simplified mathematical model approach, although the Logistic has exhibited a coefficient of determination very similar for each variable evaluated, this model systematically presented the lowest value for Akaike´s information criterion (AIC), as well as the lowest estimation errors (water disappearance: absolute error ranging between 0.09 to 0.11 L/pig/day and relative ranging between 1.11 to 1.32%; manure production: absolute error ranging between 0.04 to 0.09 L/pig/day and relative ranging between 1.04 to 1.26%). The results obtained in Step 2, when compared to the values determined in Step 1 [14], showed greater robustness and confidence in the adjustment of the curves that best describe the evolution of both water disappearance and manure production (increased accuracy of the fitted model with a consequent reduction in the estimation errors).
As mentioned previously, given the similarity of the results obtained, Figure 2, Figure 3 and Figure 4 exhibit, for a better understanding of the results, the Logistic model adjustments to the means, in terms of: (a) water disappearance and (b) manure production, respectively, considering the age (i), body weight (m), and housing period (t) at growing–finishing physiological phase of pig production chain.
According to the results presented the Logistic non-linear model was the one that best fitted the mean data of water disappearance and manure production on the cycles evaluated. The equations obtained for estimation of the parameters under evaluation, allow the producer to create mechanisms to monitor and review the progress with an instantaneous measurement device, to effectively control in real time what happens in commercial pig farms, for both parameters, by plotting daily measures and comparing them with the best-estimated curves. If any abnormality is detected either in the volume of water consumed or in the volume of manure produced, the device will release warnings indicating possible causes for the deviation from the values recorded (early warning systems).
The knowledge of the daily water disappearance and respective manure production by pigs, in each production cycle, according to physiological phase, is essential to develop drinking patterns, for example, since it can be used as an early indicator of diseases [25], unwanted events [26], or as a decision tool for managing groups of growing pigs [27]. Additionally, when poorly managed, both parameters can develop significant negative environmental impacts (water as a finite natural resource and the manure due to the impact that it has on the natural receptor environment, when incorrectly discharged) [1].

4. Conclusions

The Logistic non-linear model was found to be the one that best fitted the mean data of water disappearance and manure production in growing–finishing commercial pig farms with body weight between 25 and 120 kg, located in the west of Santa Catarina state in southern Brazil. The equations obtained for estimation of the parameters under evaluation, showed that it is possible to estimate water disappearance and manure production with a simplified model approach, using asymptotic non-linear models allowing for the development of instantaneous measurement devices to help the producer to visualize both water consumption and slurry production of pigs by plotting daily points and compare them with the best-estimated curves. The results for the logistic model showed greater robustness and confidence, always presenting the lowest value for Akaike´s Information Criterion (AIC), as well as the lowest estimation errors (water disappearance: absolute error ranging between 0.09 to 0.11 L/pig/day and relative ranging between 1.11 to 1.32%; manure production: absolute error ranging between 0.04 to 0.09 L/pig/day and relative ranging between 1.04 to 1.26%.

Author Contributions

Conceptualization: J.M.R.T., P.B.F., A.C. and P.A.V.d.O.; methodology, J.M.R.T., A.C. and P.A.V.d.O.; software, J.M.R.T. and A.C.; validation, J.M.R.T. and A.C.; formal analysis, J.M.R.T. and A.C.; investigation, J.M.R.T. and J.d.C.L.; resources, J.M.R.T., P.B.F. and P.A.V.d.O.; data curation, J.M.R.T. and A.C.; writing—original draft preparation, J.M.R.T.; writing—review and editing, J.M.R.T., J.d.C.L., P.B.F. and P.A.V.d.O.; visualization, J.M.R.T., P.B.F., A.C. and P.A.V.d.O.; supervision, P.B.F., A.C. and P.A.V.d.O.; project administration, P.A.V.d.O.; funding acquisition, J.M.R.T., P.B.F. and P.A.V.d.O. They warrant that the article is the authors’ original work, has not received prior publication (with exception to Step 1 presented) and is not under consideration for publication elsewhere. All authors have read and agreed to the published version of the manuscript.

Funding

This research was funded by the “Fundação de Amparo à Pesquisa e Inovação do Estado de Santa Catarina-FAPESC” (Project Ref.ª FAPESC nº 3706/2013 and Agreement nº 2013TR3968); “Coordenação de Aperfeiçoamento de Pessoal de Nível Superior-CAPES”; and “Conselho Nacional de Desenvolvimento Científico e Tecnológico—CNPq”.

Data Availability Statement

The data used in this article is openly accessible through the reference’s links, mainly: [1,14].

Acknowledgments

The authors are very grateful for the support of the following Brazilian entities: “Fundação de Amparo à Pesquisa e Inovação do Estado de Santa Catarina-FAPESC”; “Coordenação de Aperfeiçoamento de Pessoal de Nível Superior-CAPES”; “Conselho Nacional de Desenvolvimento Científico e Tecnológico-CNPq”; “Brasil Foods-BRF”; “Associação de Indústrias de Carne de Santa Catarina-AINCADESC/SINDICARNE_SC”; “Empresa Brasileira de Pesquisa Agropecuária-EMBRAPA”; “Programa de Pós-Graduação em Engenharia do Ambiente-Universidade Federal de Santa Catarina-PPGEA/UFSC; “Projeto Tecnologias Sociais Gestão da Água-TSGA”, and PETROBRAS. The authors are also grateful for the support given by research unit Fiber Materials and Environmental Technologies (FibEnTech-UBI).

Conflicts of Interest

The authors declare no conflict of interest and the funders had no role in the design of the study; in the collection, analyses, or interpretation of data; in the writing of the manuscript; or in the decision to publish the results.

References

  1. Tavares, J.M.R. Modelagem do Consumo de Água, Produção de Chorumes e Emissão de Gases de Efeito Estufa e Amônia na Suinocultura (in English: Modeling of Water Disappearance, Manure Production, Greenhouse Gases Emissions and Ammonia in Pig Farms). Ph.D. Thesis, Federal University of Santa Catarina, Florianópolis, Brazil, 2016. Available online: https://repositorio.ufsc.br/xmlui/bitstream/handle/123456789/175847/345551.pdf (accessed on 30 November 2022).
  2. Bjørndal, T.; Herrero, I.; Newman, A.; Romero, C.; Weintraub, A. Operations research in the natural resource industry. Int. Trans. Oper. Res. 2012, 19, 39–62. [Google Scholar] [CrossRef]
  3. Mellaku, M.T.; Sebsibe, A.S. Potential of mathematical model-based decision making to promote sustainable performance of agriculture in developing countries: A review article. Heliyon 2022, 8, e08968. [Google Scholar] [CrossRef] [PubMed]
  4. Zhai, Z.; Martínez, J.F.; Beltran, V.; Martínez, N.L. Decision support systems for agriculture 4.0: Survey and challenges. Comput. Electron Agric. 2020, 170, 105256. [Google Scholar] [CrossRef]
  5. Dumas, A.; Dijkstra, J.; France, J. Mathematical modelling in animal nutrition: A centenary review. J. Agr. Sci. 2008, 146, 123–142. [Google Scholar] [CrossRef] [Green Version]
  6. Van Milgen, J.; Valancogne, A.; Dubois, S.; Dourmad, J.-V.; Sève, B.; Noblet, J. InraPorc: A model and decision support tool for the nutrition of growing pigs. Anim. Feed Sci. Tech. 2008, 143, 387–405. [Google Scholar] [CrossRef]
  7. Pineiro, C.; Morales, J.; Rodriguez, M.; Aparicio, M.; Manzanilla, E.G.; Koketsu, Y. Big (pig) data and the internet of the swine things: A new paradigm in the industry. Anim. Front. 2019, 9, 6–15. [Google Scholar] [CrossRef]
  8. Revilla, M.; Guillaume, L.; Loic, F.-G.; Rafael, M.-T.; Friggens, N.C. Quantifying growth perturbations over the fattening period in swine via mathematical modelling. Peer Community J. 2020, 2, 16. [Google Scholar] [CrossRef]
  9. Whittemore, C.; Tullis, B.J.; Emmans, G. Protein growth in pigs. Anim. Prod. 1998, 46, 437–445. [Google Scholar] [CrossRef]
  10. Mischan, M.M.; Pinho, S.Z. Modelos Não Lineares: Funções Assintóticas de Crescimento (in english: Nonlinear Models: Asymptotic Growth Functions), 1st ed.; Cultura Acadêmica: São Paulo, Brazil, 2015. [Google Scholar]
  11. Fitzhugh, H.A., Jr. Analysis of growth curves and strategies for altering their shape. J. Anim. Sci. 1976, 42, 1036–1051. [Google Scholar] [CrossRef] [Green Version]
  12. Paro de Paz, C.C.; Packer, I.U.; Freitas, A.R.; Tambasco-Talhari, D.; Reginato, L.C.A.; Alencar, M.M.; Cruz, G.M. Ajuste de modelos não lineares em estudos de associação entre polimorfismos genéticos e crescimento em bovinos de corte (in English: Adjustment of nonlinear models in study of association between genetic polymorphisms and growth in beef cattle). Rev. Bras. Zootecn. 2004, 33, 1416–1425. [Google Scholar] [CrossRef]
  13. Oliveira, H.N.; Lôbo, R.B.; Pereira, C.S. Comparação de modelos não lineares para descrever o crescimento de fêmeas da raça Guzerá (in English: Comparison of non-linear models for describing growth of Guzerat beef cattle females). Pesqui Agropecu Bras. 2000, 35, 1843–1851. [Google Scholar] [CrossRef] [Green Version]
  14. Tavares, J.M.R.; Belli Filho, P.; Coldebella, A.; Oliveira, P.A.V. The water disappearance and manure production at commercial growing-finishing pig farms. Livest Sci. 2014, 169, 146–154. [Google Scholar] [CrossRef]
  15. Brody, S. Bioenergetics and Growth, 1st ed.; Reinhold Publishing Corporation: New York, NY, USA, 1945. [Google Scholar]
  16. Laird, A.K. Dynamics of relative growth. Growth 1965, 29, 249–263. [Google Scholar]
  17. Nelder, J.A. The fitting of a generalization of the logistic curve. Biometrics 1961, 17, 89–110. [Google Scholar] [CrossRef]
  18. Richards, F.J. A flexible growth function for empirical use. J. Exp. Bot. 1959, 10, 290–300. [Google Scholar] [CrossRef]
  19. Von Bertalanffy, L. Quantitative laws in metabolism and growth. Q. Rev. Biol. 1975, 32, 217–230. Available online: https://www.jstor.org/stable/2815257 (accessed on 30 November 2022). [CrossRef]
  20. National Research Council (NRC). Nutrient Requirements of Swine, 10th ed.; National Academy Press: Washington, DC, USA, 1998. [Google Scholar]
  21. Rostagno, H.S.; Albino, L.F.T.; Donzele, J.L.; Gomes, P.C.; Oliveira, R.F.; Lopes, D.C.; Ferreira, A.S.; Barreto, S.L.T.; Euclides, R.F. Tabelas Brasileiras Para Aves e Suínos: Composição de Alimentos e Exigências Nutricionais (In English: Brazilian Tables for Poultry and Swine: Feed Composition and Nutritional Requirements), 3rd ed.; Federal University of Viçosa: Viçosa, Brazil, 2011. [Google Scholar]
  22. Brumm, M.C.; Dahlquist, J.M.; Heemstra, J.M. Impact of feeders and drinker devices on pig performance, water use and manure volume. Swine Health Prod. 2000, 8, 51–57. [Google Scholar]
  23. Li, Y.Z.; Chénard, L.; Lemay, S.; Gonyou, H. Water intake and wastage at nipple drinkers by growing-finishing pigs. J. Anim. Sci. 2005, 83, 1413–1422. [Google Scholar] [CrossRef] [Green Version]
  24. Sas Institute Inc. System for Microsoft Windows, Release 9.4 M7; Sas Institute Inc.: Cary, NC, USA, 2020.
  25. Zhuang, X.; Bi, M.; Guo, J.; Wu, S.; Zhang, T. Development of an early warning algorithm to detect sick broilers. Comput. Electron Agri. 2018, 144, 102–113. [Google Scholar] [CrossRef]
  26. Oczak, M.; Ismayilova, G.; Costa, A.; Viazzi, S.; Sonoda, L.T.; Fels, M.; Bahr, C.; Hartung, J.; Guarino, M.; Berckmans, D.; et al. Analysis of aggressive behaviours of pigs by automatic video recordings. Comput. Electron. Agri. 2013, 99, 209–217. [Google Scholar] [CrossRef]
  27. Brown-Brandl, T.; Rohrer, G.; Eigenberg, R. Analysis of feeding behavior of group housed growing-finishing pigs. Comput. Electron Agri. 2013, 96, 246–252. [Google Scholar] [CrossRef]
Figure 1. Adjustment of the non-linear Gompertz model to the weekly means data considering the pigs’ housing period for the growing–finishing phase: (a) Water disappearance; (b) Manure production.
Water 15 00278 g001
Figure 2. Adjustment of the non-linear Logistic model to the weekly means data considering the pigs’ age for the growing–finishing phase: (a) Water disappearance; (b) Manure production.
Water 15 00278 g002
Figure 3. Adjustment of the non-linear Logistic model to the weekly means data considering the pigs’ body weight for the growing–finishing phase: (a) Water disappearance; (b) Manure production.
Water 15 00278 g003
Figure 4. Adjustment of the non-linear Logistic model to the weekly means data considering the pigs’ housing period for the growing–finishing phase: (a) Water disappearance; (b) Manure production.
Water 15 00278 g004
Table 1. Estimated biological parameters, values of Akaike’s information criterion (AIC), coefficient of determination, and absolute error of the adjusted models for the estimation of water disappearance in the growing–finishing phase, according to the pigs’ age.
Non-Linear Models ParametersAICR2Error
abc
19.8713.4870.031−4.330.9840.13
29.7560.03852.599−7.410.9870.12
39.68215.4340.045−10.000.9890.11
49.7590.0070.038−7.400.9870.12
59.7921.8880.035−6.420.9860.13
1: Brody; 2: Gompertz; 3: Logistic; 4: Richards (v = 1000); 5: Von Bertalanffy; Absolute error estimation (L/pig/day).
Table 2. Estimated biological parameters, values of Akaike’s information criterion (AIC), coefficient of determination, and absolute error of the adjusted models for the estimation of water disappearance in the growing–finishing phase, according to the pigs’ body weight.
Non-Linear Models ParametersAICR2Error
abc
19.8601.1580.035−4.870.9850.13
29.7510.04414.181−7.880.9880.12
39.6763.0310.052−10.380.9890.11
49.7510.0020.044−7.880.9880.12
59.7820.5270.041−6.920.9870.12
1: Brody; 2: Gompertz; 3: Logistic; 4: Richards (v = 1000); 5: Von Bertalanffy; Absolute error estimation (L/pig/day).
Table 3. Estimated biological parameters, values of Akaike’s information criterion (AIC), coefficient of determination, and absolute error of the adjusted models for the estimation of water disappearance in the growing–finishing phase, according to the pigs’ housing period.
Non-Linear Models ParametersAICR2Error
abc
19.9880.5240.028−6.040.9870.12
29.8340.035−10.01−10.240.9900.10
39.7300.9630.043−14.160.9920.09
49.8340.0010.035−10.240.8130.52
59.8780.2120.033−8.860.9890.11
1: Brody; 2: Gompertz; 3: Logistic; 4: Richards (v = 1000); 5: Von Bertalanffy; Absolute error estimation (L/pig/day).
Table 4. Estimated biological parameters, values of Akaike’s information criterion (AIC), coefficient of determination, and absolute error of the adjusted models for the estimation of manure production in the growing–finishing phase, according to the pigs’ age.
Non-Linear Models ParametersAICR2Error
abc
15.3396.1150.037−30.540.9930.05
25.2760.04759.611−35.260.9950.05
35.23444.0330.057−36.350.9950.04
45.2760.0160.047−35.260.9950.05
55.2943.8600.043−34.030.9940.05
1: Brody; 2: Gompertz; 3: Logistic; 4: Richards (v = 1000); 5: Von Bertalanffy; Absolute error estimation (L/pig/day).
Table 5. Estimated biological parameters, values of Akaike’s information criterion (AIC), coefficient of determination, and absolute error of the adjusted models for the estimation of manure production in the growing–finishing phase, according to the pigs’ body weight.
Non-Linear Models ParametersAICR2Error
abc
15.3321.6260.043−31.400.9930.05
25.2710.05420,279−35.810.9950.04
35.2305.6750.066−36.440.9950.04
45.2710.0030.054−35.810.9950,04
55.2880.8100.050−34.710.9950.05
1: Brody; 2: Gompertz; 3: Logistic; 4: Richards (v = 1000); 5: Von Bertalanffy; Absolute error estimation (L/pig/day).
Table 6. Estimated biological parameters, values of Akaike’s information criterion (AIC), coefficient of determination, and absolute error of the adjusted models for the estimation of manure production in the growing–finishing phase, according to the pigs’ housing period.
Non-Linear Models ParametersAICR2Error
abc
15.3610.6020.033−24.360.9900.06
25.2830.043−3.526−31.530.9940.05
35.2321.2580.053−37.830.9960.04
45.2830.0010.043−31.520.9940.05
55.3050.2540.040−29.150.9930.05
1: Brody; 2: Gompertz; 3: Logistic; 4: Richards (v = 1000); 5: Von Bertalanffy; Absolute error estimation (L/pig/day).
Disclaimer/Publisher’s Note: The statements, opinions and data contained in all publications are solely those of the individual author(s) and contributor(s) and not of MDPI and/or the editor(s). MDPI and/or the editor(s) disclaim responsibility for any injury to people or property resulting from any ideas, methods, instructions or products referred to in the content.

