Article

Variations in Polycyclic Aromatic Hydrocarbon Contamination Values in Subtidal Surface Sediment via Oil Fingerprinting after an Accidental Oil Spill: A Case Study of the Wu Yi San Oil Spill, Yeosu, Korea

1
College of Fisheries & Ocean Science, Chonnam National University, Yeosu 59626, Republic of Korea
2
Graduate School of Environmental Symbiotic Science, Prefectural University of Kumamoto, Kumamoto 862-8502, Japan
3
Best Environmental Technology Co., Ltd., Yeosu 59661, Republic of Korea
*
Author to whom correspondence should be addressed.
Water 2023, 15(2), 279; https://doi.org/10.3390/w15020279
Submission received: 28 November 2022 / Revised: 5 January 2023 / Accepted: 6 January 2023 / Published: 9 January 2023

Abstract

:
This study determined the PAH contamination variations in the subtidal surface sediment with oil fingerprinting in the Wu Yi San oil spill in Yeosu, Korea, in January 2014. The ∑16 PAHs and ∑alkyl PAHs were investigated in surface sediment and seawater 1 month after the oil spill for 1 year at 3-month intervals in the accident (St. A-F) and adjacent areas (St. 1-20). The averaged ∑16 PAHs and ∑alkyl PAH concentration in the five samplings were 42.2–171.7 ng/g and 211.5–221.8 ng/g, respectively. Comparing the PAH levels in St.E and St.17 indicated a decreased tendency, from 357.9 to 31.1 ng/g dw. in ∑16 PAHs, and from 1900.9 to 211.5 ng/g dw. in ∑alkyl PAHs. The PAHs were not statically correlated between surface sediment and seawater (p > 0.05), implying that the fate of PAHs was rapidly dispersed toward adjacent coasts and beaches. Pyrogenic origin was predominant in 16 PAHs, and petrogenic origin in alkylated PAHs. Notably, C2-D/C2-P and C3-D/C3-P ratios in the accident area during the first sampling were similar to accident oil, but the similarity was not shown in other samplings. Only the C2-naphthalene (St.A), C1-phenanthrene (St.A and St.B), and C2-phenanthrene (the entire accident area points) concentrations were higher than the ERL SQG.

1. Introduction

Polycyclic aromatic hydrocarbons (PAHs) are compounds in which at least two benzene rings consisting of carbon and hydrogen are formed where at least five carbon atoms are gathered [1]. The origins of the inflow of PAHs into the ocean can be largely divided into pyrogenic inflows and direct petrogenic inflows. Pyrogenic inflows occur due to the combustion of organic substances such as wood, coal, and fossil fuels, which flow into the marine environment and are mainly composed of those with high molecular weights exceeding 202 g/mol with 4–6 benzene rings [2]. Petrogenic inflows include direct inflows that occur during petroleum refining and transportation as well as oil spills on surface water [3,4]. These inflows mainly include low-molecular-weight and alkylated PAHs [5]. With alkylated PAHs, an alkyl group is substituted into the benzene ring of PAHs. These are thermodynamically unstable compared to PAHs and are generally known to be abundant in oil [6,7].
As such, when PAHs flow directly into the ocean, they superficially disperse, evaporate, dissolve, or are adsorbed by particles and sink to the sediment-accumulating sea floor [8]. PAHs accumulated over a long period are eluted again and adversely affect benthic and aquatic organisms [9]. In particular, PAHs with high molecular weights, such as benzo[a]pyrene, are known to cause mutations and carcinogenicity in organisms [10,11], and it has been reported that the toxicity of alkylated PAHs is suspected to affect fish embryo development [12,13]. Therefore, the United States Environmental Protection Agency (US EPA) and European Union have labelled 16 PAHs as pollutants that should be controlled on a priority basis [14,15,16]. On 31 January 2014, an accident occurred in which a 164,000-ton class tanker (Wu Yi San of Singapore) broke the oil pipeline while entering the crude oil pier in Nakpo-dong, Yeosu City, Jeollanam-do, leading to the spread of 483.9 kl of crude oil and 32–131 kl of oil mixture to the sea (Gwangju District Court Suncheon Branch, 2014 Godan 584). The naphtha in the oil pipeline quickly evaporated into the atmosphere because it was highly volatile, and the crude oil and oil mixture spread to the sea reaching the Namhae Bridge (approximately 13 km north of the spill site) and Dolsan Bridge (14 km to the south) [17]. Therefore, monitoring oil contamination variations is essential in the study area. The present study investigated the 16 PAHs and alkylated PAH levels in the surface sediment and seawater in Gwangyang Bay and Yeosu Channel five times 1 month after the accident in 3-month intervals. This study aims to determine the variations in PAH contamination in subtidal surface sediment using oil fingerprinting after the oil spill and assess the biological effects via sediment quality guidelines (SQGs). It is a preliminary study used as a cornerstone to assess the current contamination values of PAHs derived from the oil spill in the surface sediment 10 years after the accident. To the best of our knowledge, this is the first report to determine the Wu Yi San oil spill using oil fingerprinting in the subtidal surface sediment in the study area. This will provide insight into monitoring other oil spills and preventing and controlling the possibility of accidental ones.

2. Materials and Methods

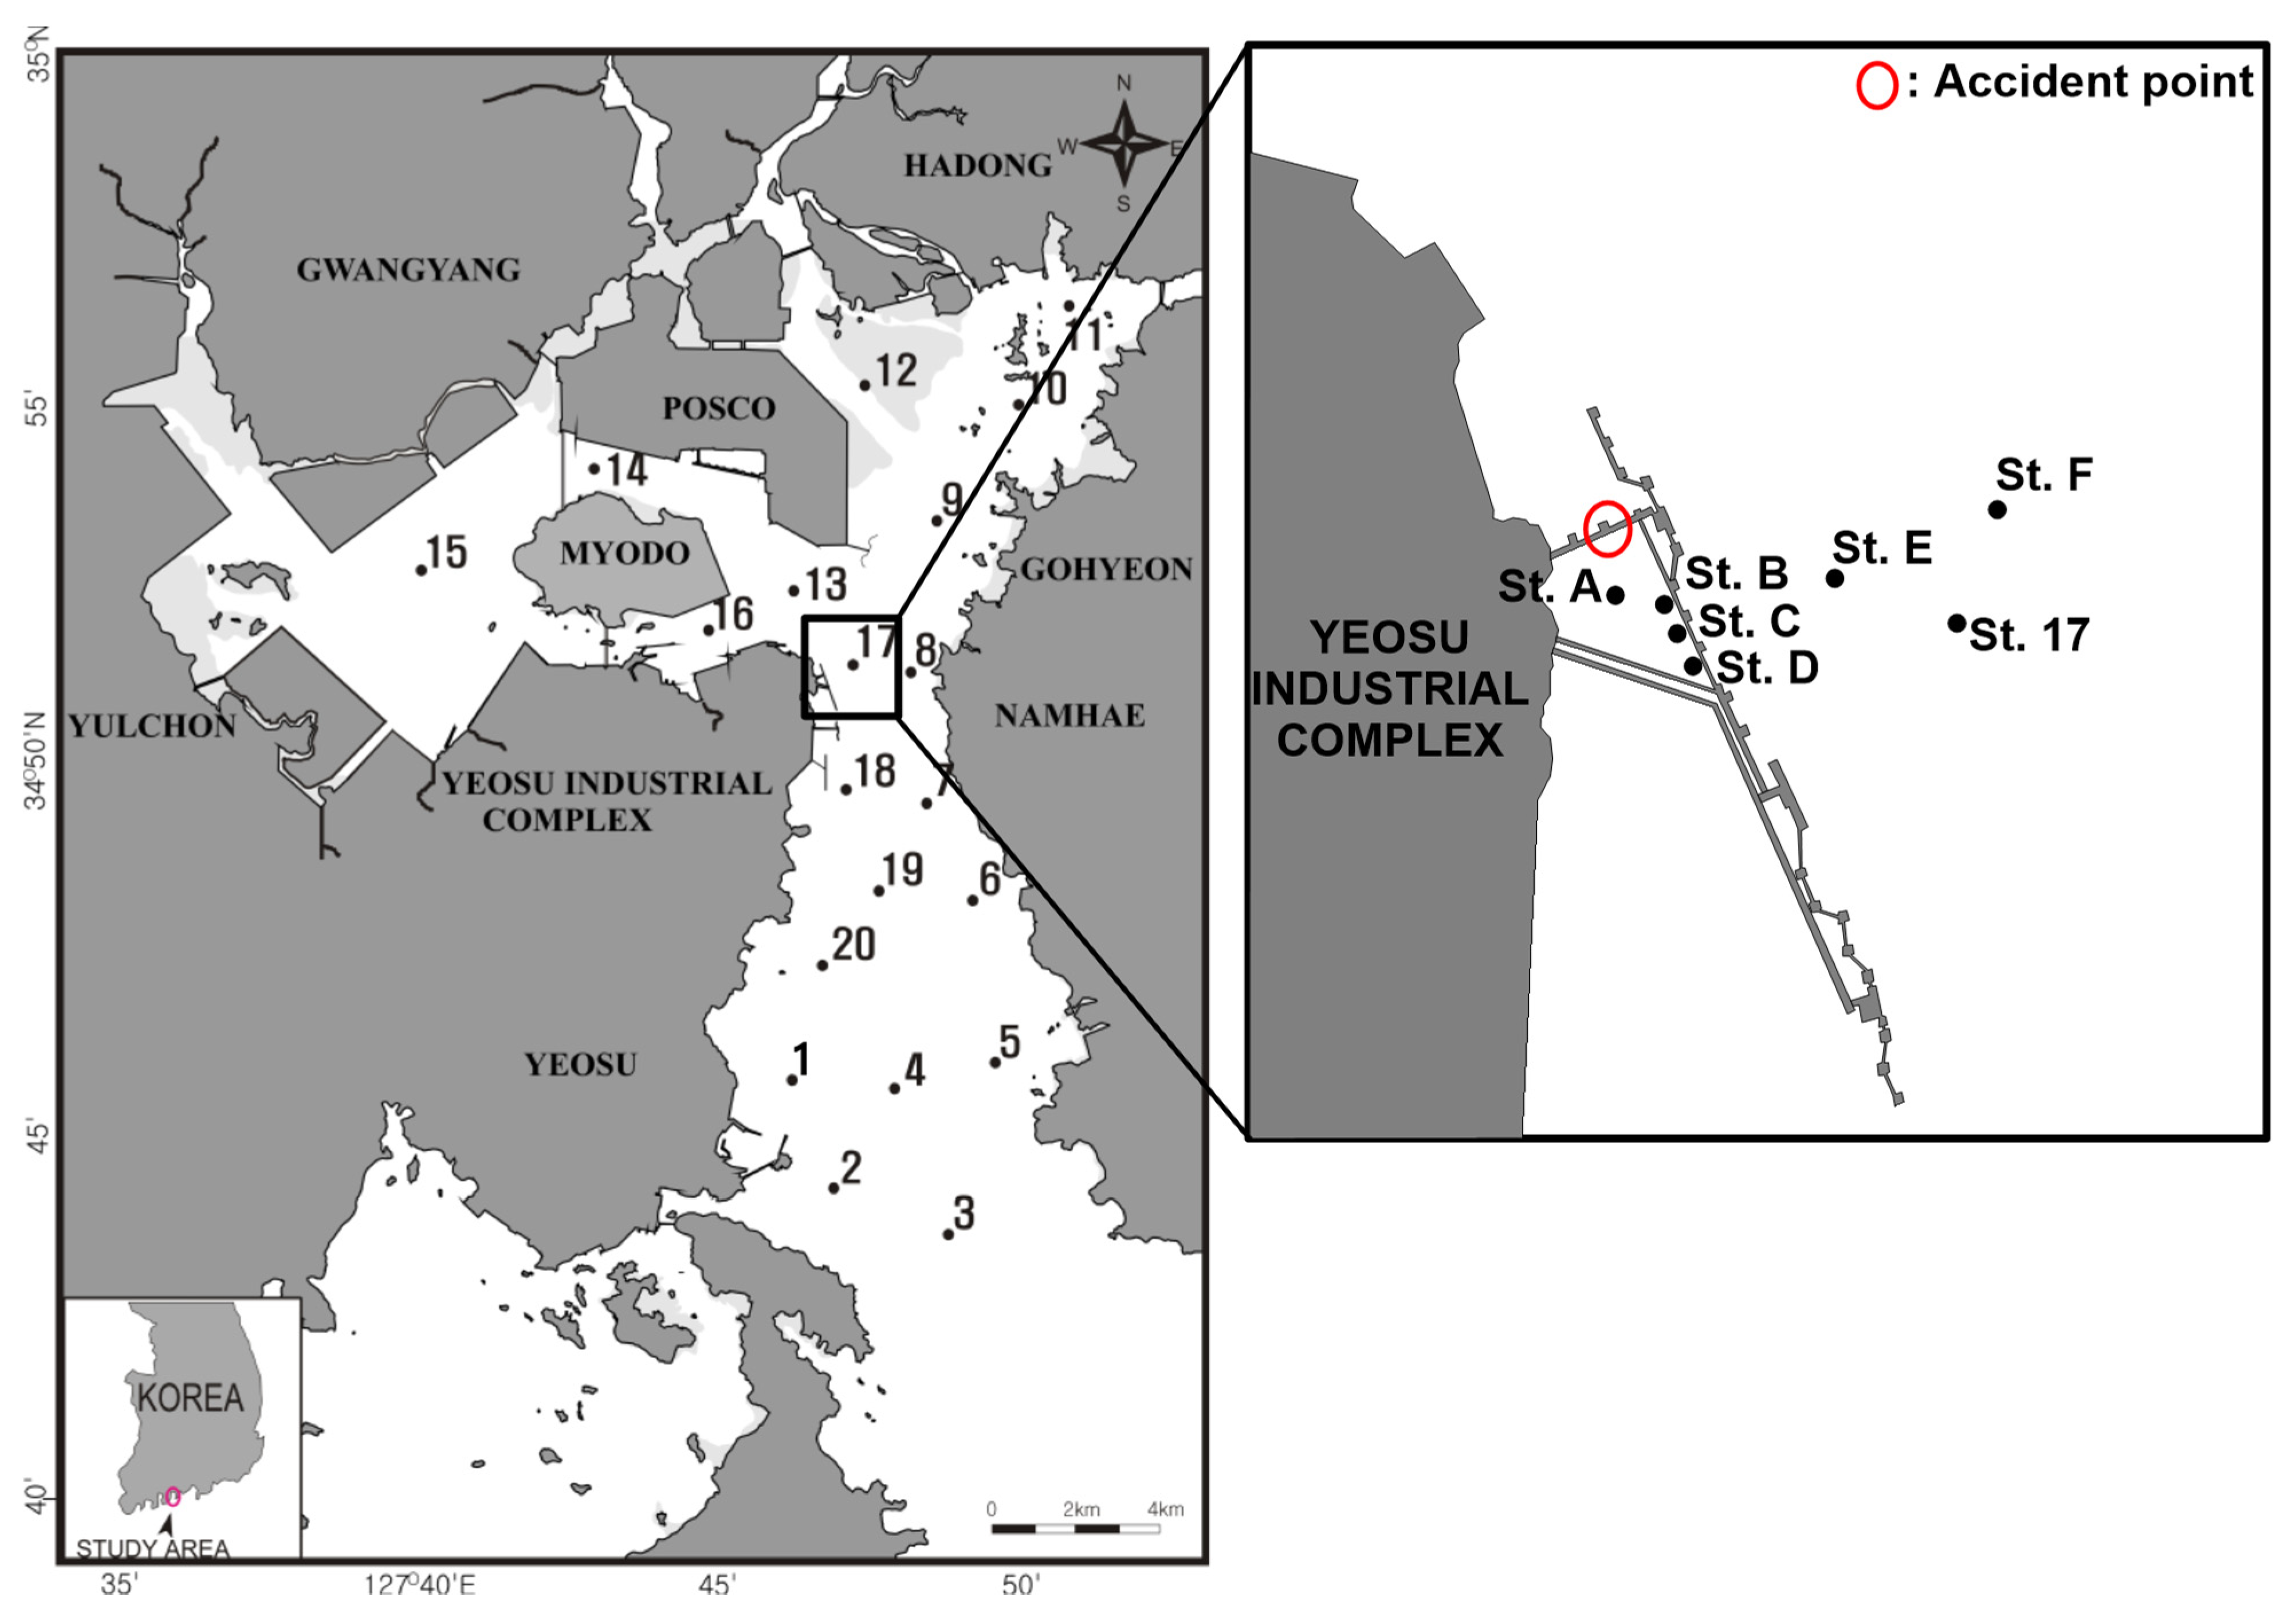
2.1. Study Area and Sampling Method

An investigation was conducted at five stations (St. A–F) on 5 March 2014, to determine the concentrations of 16 PAHs and alkylated PAHs and the presence of the spilled oil within the subtidal sediments in the Wu Yi San oil spill site. For further analysis, 20 stations (eight stations in Gwangyang Bay and 12 stations in the Yeosu Channel) centering on the waters near the accident site (St. 1–20) were used in five additional investigations. These were conducted in May, August, and November of 2014 and in February and May of 2015. The number of investigations and stations are shown in Table 1, and the investigation points are shown in Figure 1.
For the collection of submarine sediments, samples with a surface layer of 0–3 cm were collected using a van Veen grab and washed with distilled and pure ionized water. Thereafter, brown hard glass bottles were ignited for at least 4 hours at approximately 400 °C using an ignition brazier to prevent potential sample contamination. The collected samples were transported in an ice box and frozen at −20 °C or lower until analysis.

2.2. Analysis Method

The collected samples were analyzed using the EPA method (EPA:3540, 3611) to detect PAHs and alkylated PAHs. The grade of the entire organic solvents used for extraction was the pesticide residue analysis (PRA) grade. Furthermore, the whole laboratory glassware used in the pretreatment processes was burned at 400 °C for 4 h after washing to remove the organic matter residues. After ignition, it was rinsed with acetone and hexane to remove potential contamination.
The PAHs in the surface sediment were extracted using the Soxhlet extraction method. First, 5 g of freeze-dried submarine sediment was placed in cellulose cylindrical filter paper (thimble filter, ID25 mm OD28 mm L100 mm, ADVANTEC, Tokyo, Japan), 100 µL of the surrogate internal standard (naphthalene-d8, acenapthalene-d10, phenanthrene-d10, chrysene-d12, perylene-d8; internal standard mix, Supelco, Bellefonte, PA, USA) at a concentration of 2 mg/L was added to the sample, and the mixture was set in a Soxhlet extraction apparatus. For the extraction, 150 mL of acetone–hexane (1:1 v/v), a mixed solvent, was placed in a round-bottom flask, and the temperature was adjusted so that the solvent circulation rate was 4–6 min, and extraction was performed for at least 16 h. The solvent was substituted with the hexane using a rotary evaporator, and the filtered sample was concentrated to approximately 1–2 mL. The silica gel column was used to purify the concentrated solution. After injecting the solution, 25 mL of hexane was poured, and the flowed hexane through the column was discarded. The solution was eluted with 25 mL of dichloromethane–hexane (2:3 v/v), and the resultant solution of the final sample was transferred to 10 mL of a glass centrifuge tube, and 100 µL of the gas chromatograph internal standard (terphenyl-d14, Supelco, Bellefonte, PA, USA) was spiked. The sample was concentrated into 1.0 mL using nitrogen gas (99.99%) and used as a sample for gas chromatography (GC) analysis.
The liquid–liquid extraction method was employed to analyze PAHs in the surface seawater. Then, 2 mg/L of the surrogate internal standard (naphthalene-d8, acenapthalene-d10, phenanthrene-d10, chrysene-d12, perylene-d8; internal standard mix, Supelco, Bellefonte, PA, USA) was spiked in 2 L of seawater sample, and 100 mL of dichloromethane was added to the sample. The solution was shaken intensely for 1 h (RS-1, JEIO TECH, Korea) and left for 1 h. The extracted solution was filtered with the anhydrous sodium sulfate on the filter paper using a glass funnel to remove moisture. This extraction process was repeated twice. The solvent was substituted with the hexane using a rotary evaporator, and the filtered sample was concentrated to approximately 1–2 mL. The silica gel column was used to purify the concentrated solution. After injecting the solution, 25 mL of hexane was poured, and the flowed hexane through the column was discarded. After purification, 25 mL of dichloromethane–hexane (2:3 v/v) was poured to elute the target materials. The solvent in the extracted solution was substituted with the hexane and was concentrated to approximately 1–2 mL. This concentrated sample was transferred to 10 mL of a glass centrifuge tube, and 100 µL of the gas chromatograph internal standard (terphenyl-d14, Supelco, Bellefonte, PA, USA) was spiked. The sample was concentrated into 1.0 mL using nitrogen gas (99.99%) and used as a sample for GC analysis.

2.3. Substances Subject to Instrumental Analysis

In the case of PAHs, 16 (naphthalene, acenaphthylene, acenaphthene, fluorene, phenanthrene, anthracene, fluoranthene, pyrene, benzo[a]anthracene, chryene, benzo[b]fluoranthene, benzo[k]fluoranthene, benzo[a]pyrene, dibenzo[a,h]anthracene, indeno[1,2,3-cd]pyrene, benzo[ghi]perylene) out of 24 priority management substances designated by the United States Environmental Protection Agency (US EPA) were selected. For alkylated PAHs, C1–C4 naphthalene, C1–C3 fluorene, C1–C4 phenanthrene, C1–C4 dibenzothiophene, and C1–C3 chrysene were selected according to the presence of a methyl group. A list of the selected substances is presented in Table 2.

2.4. Instrument Analysis Conditions

Gas chromatography–mass spectrometry (Shimazu, Kyoto, Japan, Model GCMS QP-2010) was used for the qualitative and quantitative analysis of PAHs. Two microliters of the sample was injected using a splitless method, and the carrier gas was made to flow at 1.3 mL per minute using helium (99.9999%). A capillary column (DB-5MS, 30 m × 0.25 mm, 0.25 μm) was used for the separation of the substances.
For the column conditions, the sample was initially left for 1 min at 80 ℃. Thereafter, the temperature was increased at a rate of 10 °C to 275 °C and the sample was maintained for 25 min. The substances were detected via a mass spectrometer using the selected ion monitoring (SIM) mode and quantified by the internal standard method, and the on-mass table using the SIM mode is shown in Table 2.

2.5. Quality Assurance/Quality Control (QA/QC)

The recovery rate of the analyzed items is used to certify a consistent evaluation of contaminants that are widespread in the environment and reliable analytical procedures. To test the reproduction category and review the data for the contaminants to be detected from the samples in the environment, the recovery rates were obtained with the areas of the peaks using the internal standard material, and one blank was used for every 10 samples. The internal standard recovery rate was shown to be 50–125% for all the samples. The method detection limits (MDLs) according to the PAH analysis items were determined by analyzing seven blank solutions to obtain the standard deviation of the concentrations and multiplying the standard deviation by 3.14 [18]. The obtained MDLs were shown to be in the range of 0.20–1.92 ng/g.

3. Results and Discussions

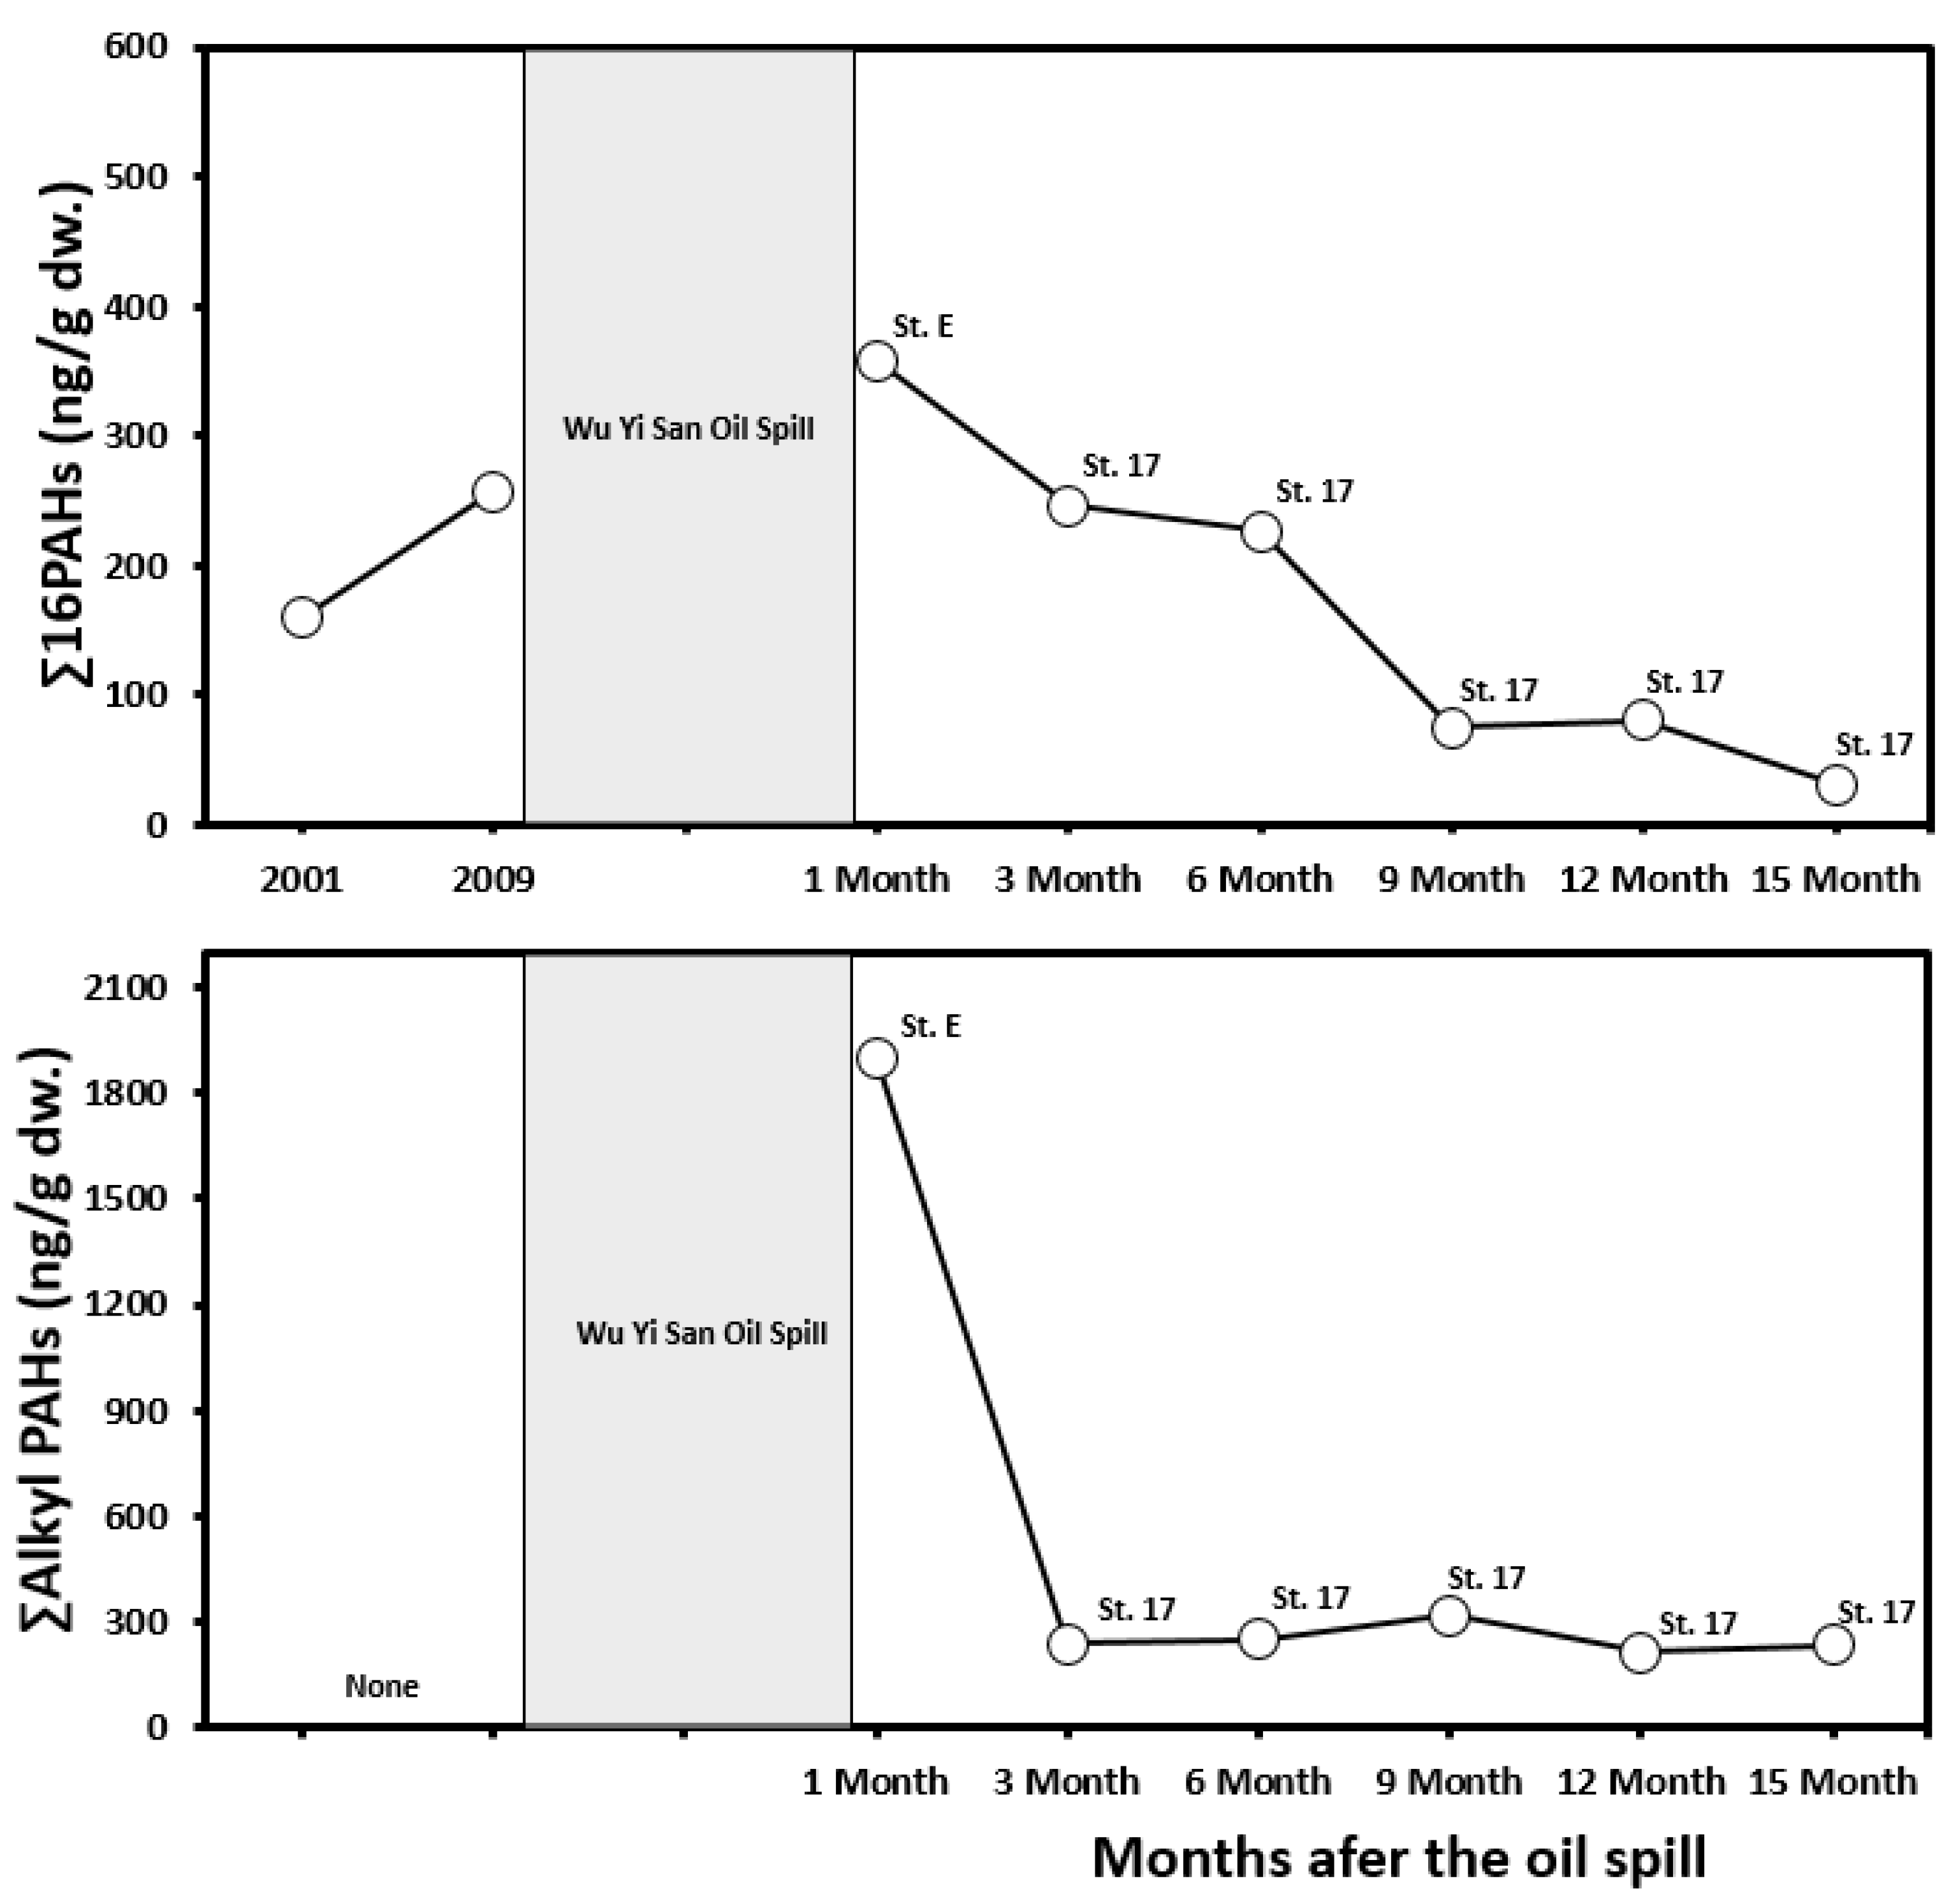
3.1. Distribution of the PAHs Concentrations in Surface Sediment

Table 3 shows the concentrations of total PAHs (∑16 PAHs) and total alkylated PAHs (∑ alkyl PAHs) substituted with alkyls of 16 types of priority management substances designated by the EPA in the submarine sediments at five stations at the accident site. The concentrations of ∑16 PAHs were shown to be 199.1–605.1 (mean 301.2; standard deviation 146.7; median 222.3) ng/g dw., and Station A, which was adjacent to the point of collision of the Wu Yi San, was measured as 605.1 ng/g dw., which was the highest concentration among the five stations. The concentrations of ∑alkyl PAHs were shown to be 1839.0–3071.9 (mean 2436.7; standard deviation 435.64; median 2578.4) ng/g dw. Similarly, the concentration level measured at Station A was 3071.9 ng/g dw., which was the highest concentration observed at all stations at the accident site and the 20 stations in the subtidal zone near the accident zone throughout the investigation.
Table 4 shows the concentrations of total PAHs (∑16 PAHs) and total alkylated PAHs (∑alkyl PAHs) of 16 priority management substances in the submarine sediments at 20 stations in the subtidal zone near the accident site. The levels of ∑16 PAHs were shown to be 39.6–883.2 (mean 171.7; standard deviation 176.0; median 143.9) ng/g dw. in the first sampling (May 2014), 83.9–397.2 (mean 175.1; standard deviation 72.3; median 157.0) ng/g dw. in the second sampling (August 2014), 38.2–171.3 (mean 73.3; standard deviation 31.4; median 65.5) ng/g dw. in the third sampling (November 2014), 27.4–215.2 (mean 77.4; standard deviation 40.7; median, 75.6) ng/g dw. in the fourth sampling (February 2015), and 22.2–133.9 (mean 42.2; standard deviation 24.3; median 33.8) ng/g dw. in the fifth sampling, showing a tendency to decrease as the investigation time passed. Station 2, which was relatively further away from the accident site, showed relatively higher mean concentrations than stations 17 and 18, located in the vicinity of the accident site.
According to the results of the initial spill oil diffusion distribution modeling in an investigative report on the impact of the Wu Yi San oil pollution accident on marine pollution [19], the spilled oil spread from the vicinity of the initial accident spot (post-accident day 0) to the center of the Yeosu coast (post-accident day 1 or 2) and then to the Yeosu coast and the Namhaedo coast (post-accident day 3) along the weak tidal currents that occur toward the coast of Yeosu. However, the distribution of spilled oil was low at the center of the Yeosu Channel and near the accident spot located at the entrance of Gwangyang Bay, where strong tidal currents are formed. Compared to the stations near the accident area affected by strong currents, stations 1 and 2 were affected by weaker tidal currents and showed somewhat higher concentrations compared to the other stations.
The ranges and mean values of the concentrations of ∑Alkyl PAHs were shown to be 85.1–402.5 (mean 221.8; standard deviation 82.8; median 207.1) ng/g dw. in the first sampling (May 2014), 95.4–692.6 (mean 243.9; standard deviation 127.4; median 227.0) ng/g dw. in the second sampling (August 2014), 100.0–484.8 (mean 216.6; standard deviation 92.7; median 199.2) ng/g dw. in the third sampling (November 2014), 74.2–524.4 (mean 266.4; standard deviation 136.4; median 234.5) ng/g dw. in the fourth sampling (February 2015), and 128.5–295.1 (mean 211.5; standard deviation 45.1; median 209.8) ng/g dw. in the fifth sampling (May 2015). These findings contradict those of the ∑16 PAH experiment, and the concentrations remained constant with an average of 232.03 ng/g dw. instead of decreasing or increasing with the number of samplings. The stations located on the Yeosu coast, centered on the Yeosu Channel, including the waters near the accident site, showed relatively higher mean concentration values compared to the stations located on the Namhaedo coast, and the trend was similar to that of the ∑16 PAHs, indicating that the influence of tidal currents was reflected.
Notably, the concentrations of ∑alkyl PAHs were shown to be higher than those of ∑16 PAHs. Consistent with the present study, the concentrations of alkyl-substituted PAHs in crude oil are generally higher than those of 16 PAHs [20,21], which can be largely attributed to the effect of crude oil in the study area where petrochemical plants are concentrated. However, the foregoing results are distinguished from previous results in Masan Bay, Haeam Bay, Unmun Bay, and Gohyeon Bay in South Korea [22], which are other waters (∑16 PAHs > ∑alkyl PAHs). It is expected that ∑16 PAHs are predominant in those previously studied areas because of anthropogenic characteristics, such as smoke and soot generated by vessel navigation and densely populated cities.
Since the distance between station E and station 17 in the subtidal zone is approximately 100 m, the temporal PAH levels 1 month after the oil spill are illustrated using those results (Figure 2). These results show that the concentration of ∑16 PAHs decreased slowly to 357.9 ng/g dw. 1 month after the spill, 246.9 ng/g dw. 3 months after the spill, and 227.0 ng/g dw. 6 months after the oil spill, and decreased drastically thereafter to 75.4 ng/g dw. 9 months following the spill. The concentration was then maintained at relatively constant levels until the 14th month. The concentration of ∑ alkyl PAHs drastically decreased from 1900.9 ng/g dw. 1 month after the accident and further to 238.4 ng/g dw. following the third month. The concentration was maintained at 251.6 ng/g dw. until the 14th month following the spill.
Notably, Jang et al. [23] determined the distributions of PAH contamination derived from the Wu Yi San oil spill in the forty-surface sediment on the intertidal zone in the vicinity of the accident area. They highlighted the possibility that the fast tidal velocity and 82,880 volunteers elected for purification purposes both made 16 PAH levels considerably decrease 4 months after the oil spill, i.e., a similar tendency shown in the present results. In the subtidal zone, the Ministry of Oceans and Fisheries in Korea and The Korean Coast Guard were devoted to preventing and controlling the spreading of the oil spill back then. The disaster prevention personnel included 122,363 volunteers, 7873 people, 5709 ships, 29 helicopters, 27,320 cm of the oil fences, 98,726 kg of the oil adsorbent, and 3651 pieces of disaster prevention equipment [24]. This tendency can be found in the ∑alkyl PAH levels following the Hebei Spirit oil spill accident in Taean in December 2007, which drastically decreased from 3800 ng/g on average immediately after the accident to the background level by September 2008 [24].
Figure 2. Variation in ∑ PAH concentrations and ∑ alkylated PAH concentrations in accident site (2001 ∑ PAHs Resi;ts [25], 2009 ∑ PAHs Resi;ts [26]).
Water 15 00279 g002
There were no secondary data for alkyl PAHs collected near stations E and 17 before the accident. However, the concentration of 16 PAHs before the accident was 160 ng/g dw. in 2001 [25] and 257.2 µg/kg dw. in 2009 (average of three results) [26]. The results of investigations carried out 1, 3, and 6 months after the accident showed higher concentrations than those in previous studies, but the results of the sampling carried out 9, 12, and 15 months after the accident, and thereafter, showed similar or lower levels.
As a result of study areas other than the oil spill accident area (Table 5), in the case of South Korea, the concentrations of 16 PAHs at the five stations in the accident area were higher than those in the coastal area of Incheon [27], Masan Bay, Haeam Bay, Unmun Bay, and Gohyeon Bay [22]. The 20 subtidal stations near the accident site showed similar levels to Haengam Bay and Masan Bay, but lower levels than Incheon Coast, Gohyeon Bay, and Unmun Bay. With regard to overseas areas, the concentrations of 16 PAHs in the study area were shown to be lower than those in Osaka Bay [28], the coast of Egypt [29], the vicinity of the Arctic Ocean [30], the port of Naples in Italy [31], and the Italian coast [32]. The concentrations of alkylated PAHs in the study area were higher than those in Masan Bay, Haeam Bay, Unmun Bay, and Gohyeon Bay [22] in South Korea. With regard to global cases, the levels in the study area were shown to be lower than those of the coast of Egypt [29], while being higher than those in Osaka Bay [28] and in the vicinity of the Arctic Ocean [30].

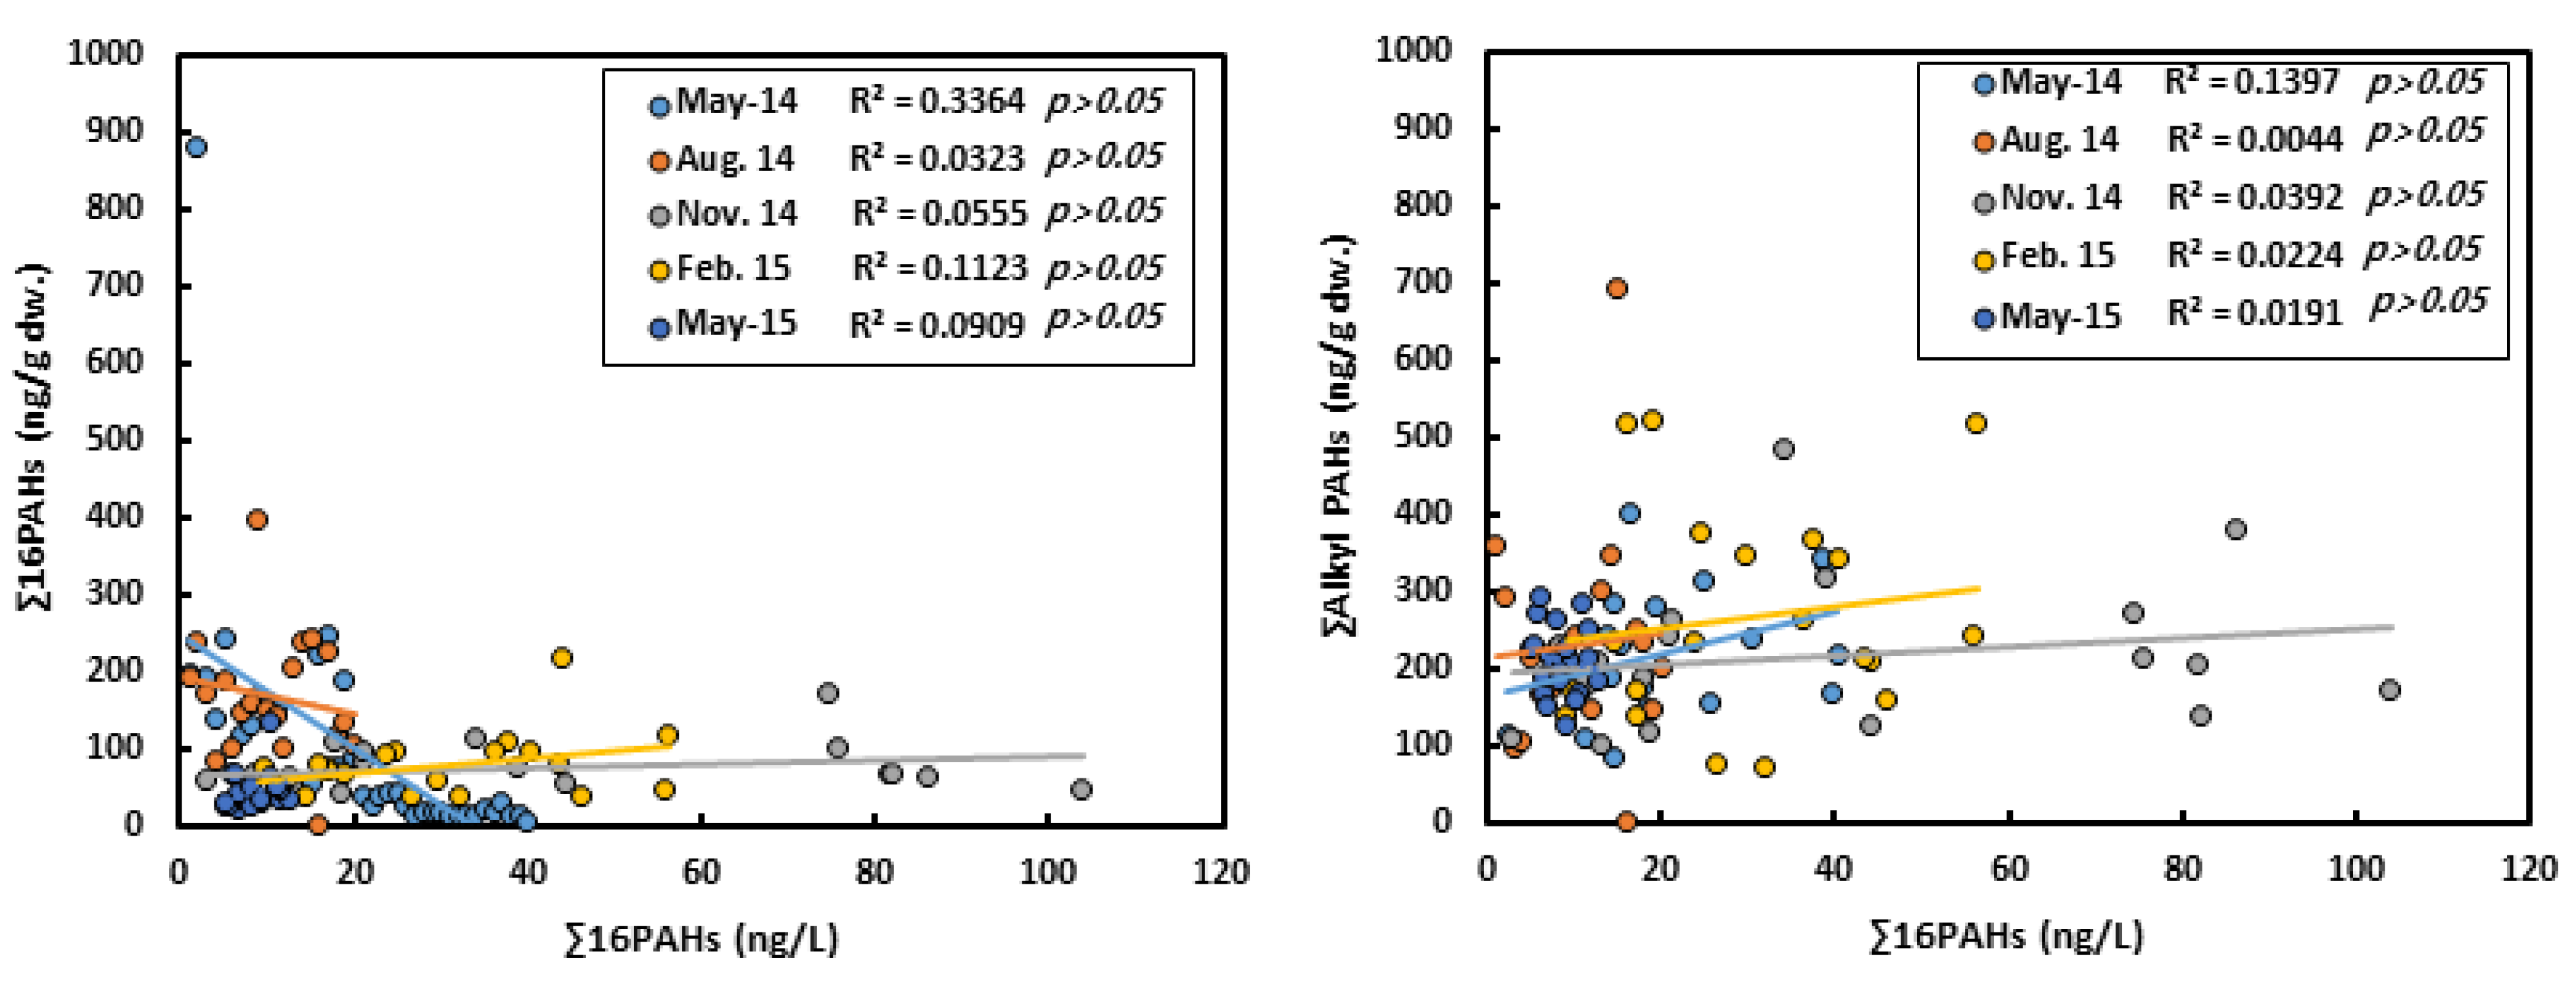
3.2. Distribution of the PAH Concentrations in Surface Seawater

Table 6 shows the results of 16 priority management PAHs (∑16 PAHs) in the surface seawater in the 20 sampling points. The concentration ranges of ∑16 PAHs were 2.2–40.3 ng/L (average 20.9 ± 10.9 ng/L), 18.8–167.9 ng/L (average 59.7 ± 46.0 ng/L), 2.9–103.9 ng/L (average 38.5 ± 31.8 ng/L), 9.0–56.3 ng/L (average 29.9 ± 14.2 ng/L), and 5.1–12.5 ng/L (average 8.4 ± 2.2 ng/L) in the first (May 2014), second (August 2014), third (November 2014), fourth (February 2015), and fifth samplings (May 2015), respectively. The concentration had a tendency to decrease over time.
In the previous study, higher PAH concentrations in surface seawater and suspended particulate matter (SPM) were reported than in sediment [33]. Contrary to this, ∑ 16 PAH levels in the surface seawater (average 31.5 ng/L) showed four orders of magnitude lower than the level in the surface sediment (average 107.9 ng/g dw.). The levels of seawater and sediment did not show a statistically significant correlation in each sampling time (p-value > 0.50, Pearson correlation analysis) (Figure 3).
The investigation in the present study was carried out 1 month after the oil spill on 31 January 2014. The spilled oil had a light density, resulting in a buoyant characteristic. This indicates that the oil was rapidly dispersed to the adjacent coasts rather than vertically deposited to the sediment via the fast velocity of tidal currents (the maximum velocity of 42.2 cm/s) because the accident area had a specific geographical characteristic in the form of a relatively narrow channel.
The modeling results stated above [19] reported that, within 3 days after the oil spill, the PAH distribution in the seawater was not found, but it accumulated on the adjacent coasts and beaches. Notably, ∑16 PAHs and ∑alkyl PAHs in 40 coasts and beaches in the previous study [23] were considerably higher than in the present study; the 16 PAHs ranged from 489 to 2089 ng/g and accounted for 67% of the total PAHs (727–3121 ng/g), implying that the previous modeling results [19] are persuasive. This sequence of results indicates that the spilled oil was not resident in the seawater and horizontally spread toward the adjacent coasts and beaches following the tidal current affected by the specific geographical and meteorological characteristics, resulting in no statistical significance in the PAH levels between the surface seawater and the sediment.
However, the present study analyzed the PAHs in the surface seawater regardless of the present types of PAHs. The SPM acts as the essential carrier for pollutants in the marine environment [34,35] because the hydrophobic property makes PAHs in surface seawater adsorb to the SPM in the water column. The SPM is therefore one of the primary factors in the transportation and weathering of PAHs [36]. Furthermore, the fugacity of PAHs in the seawater surface sediment is also the primary point on the fate of PAHs [37]. Since many researchers highlighted the significant roles of PAH contamination in sediment, suspended particulate matter, and dissolved phases [36,37], this perspective should be implemented in future work to understand the detailed current fate of PAHs.

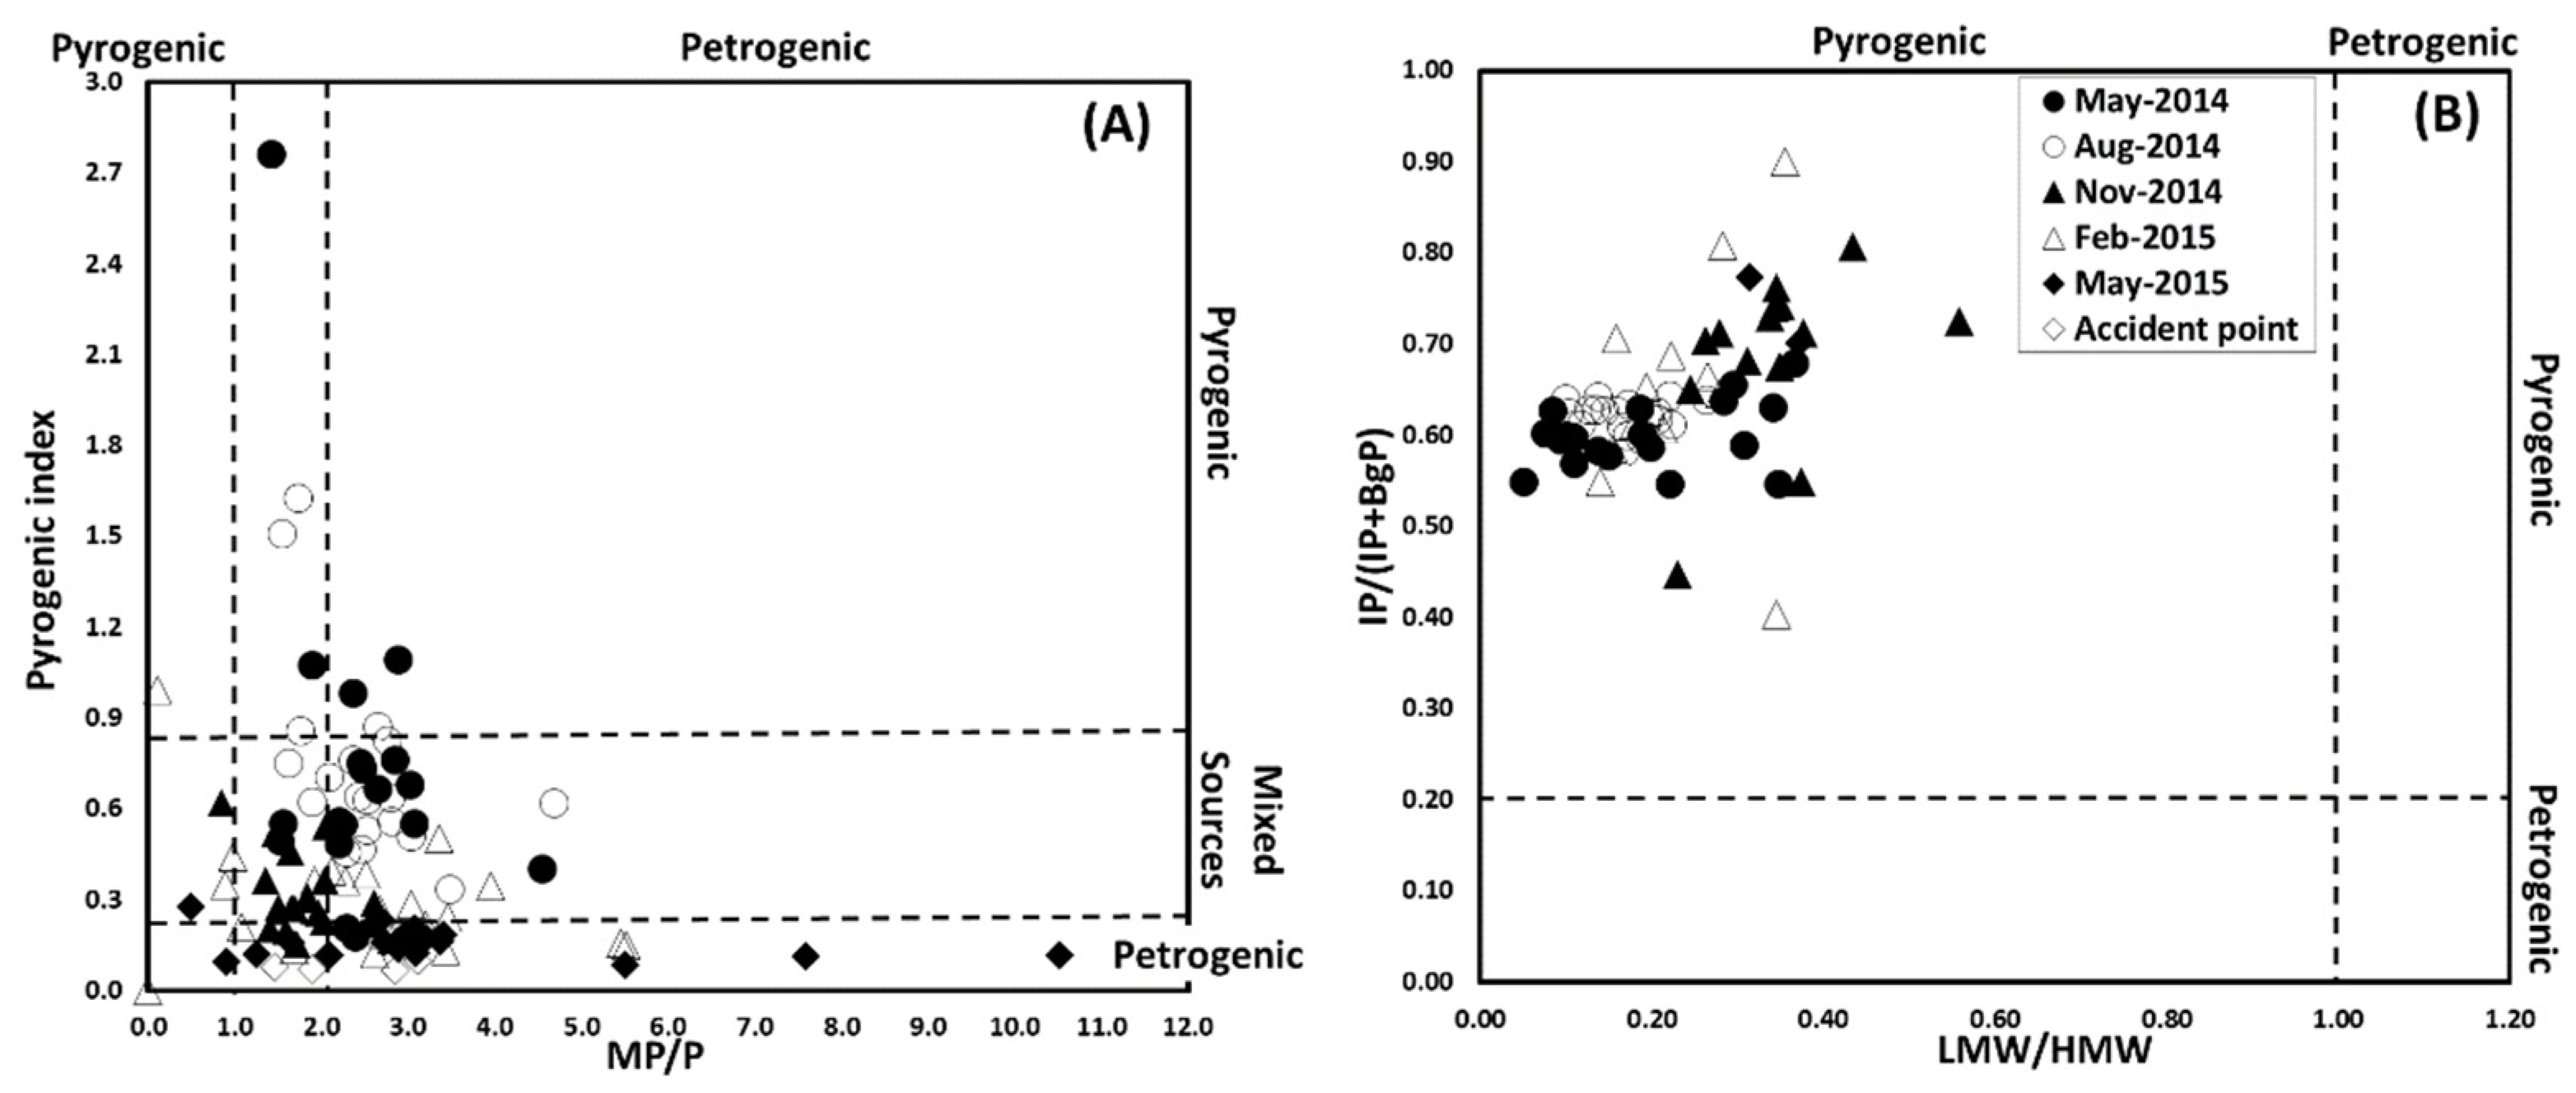
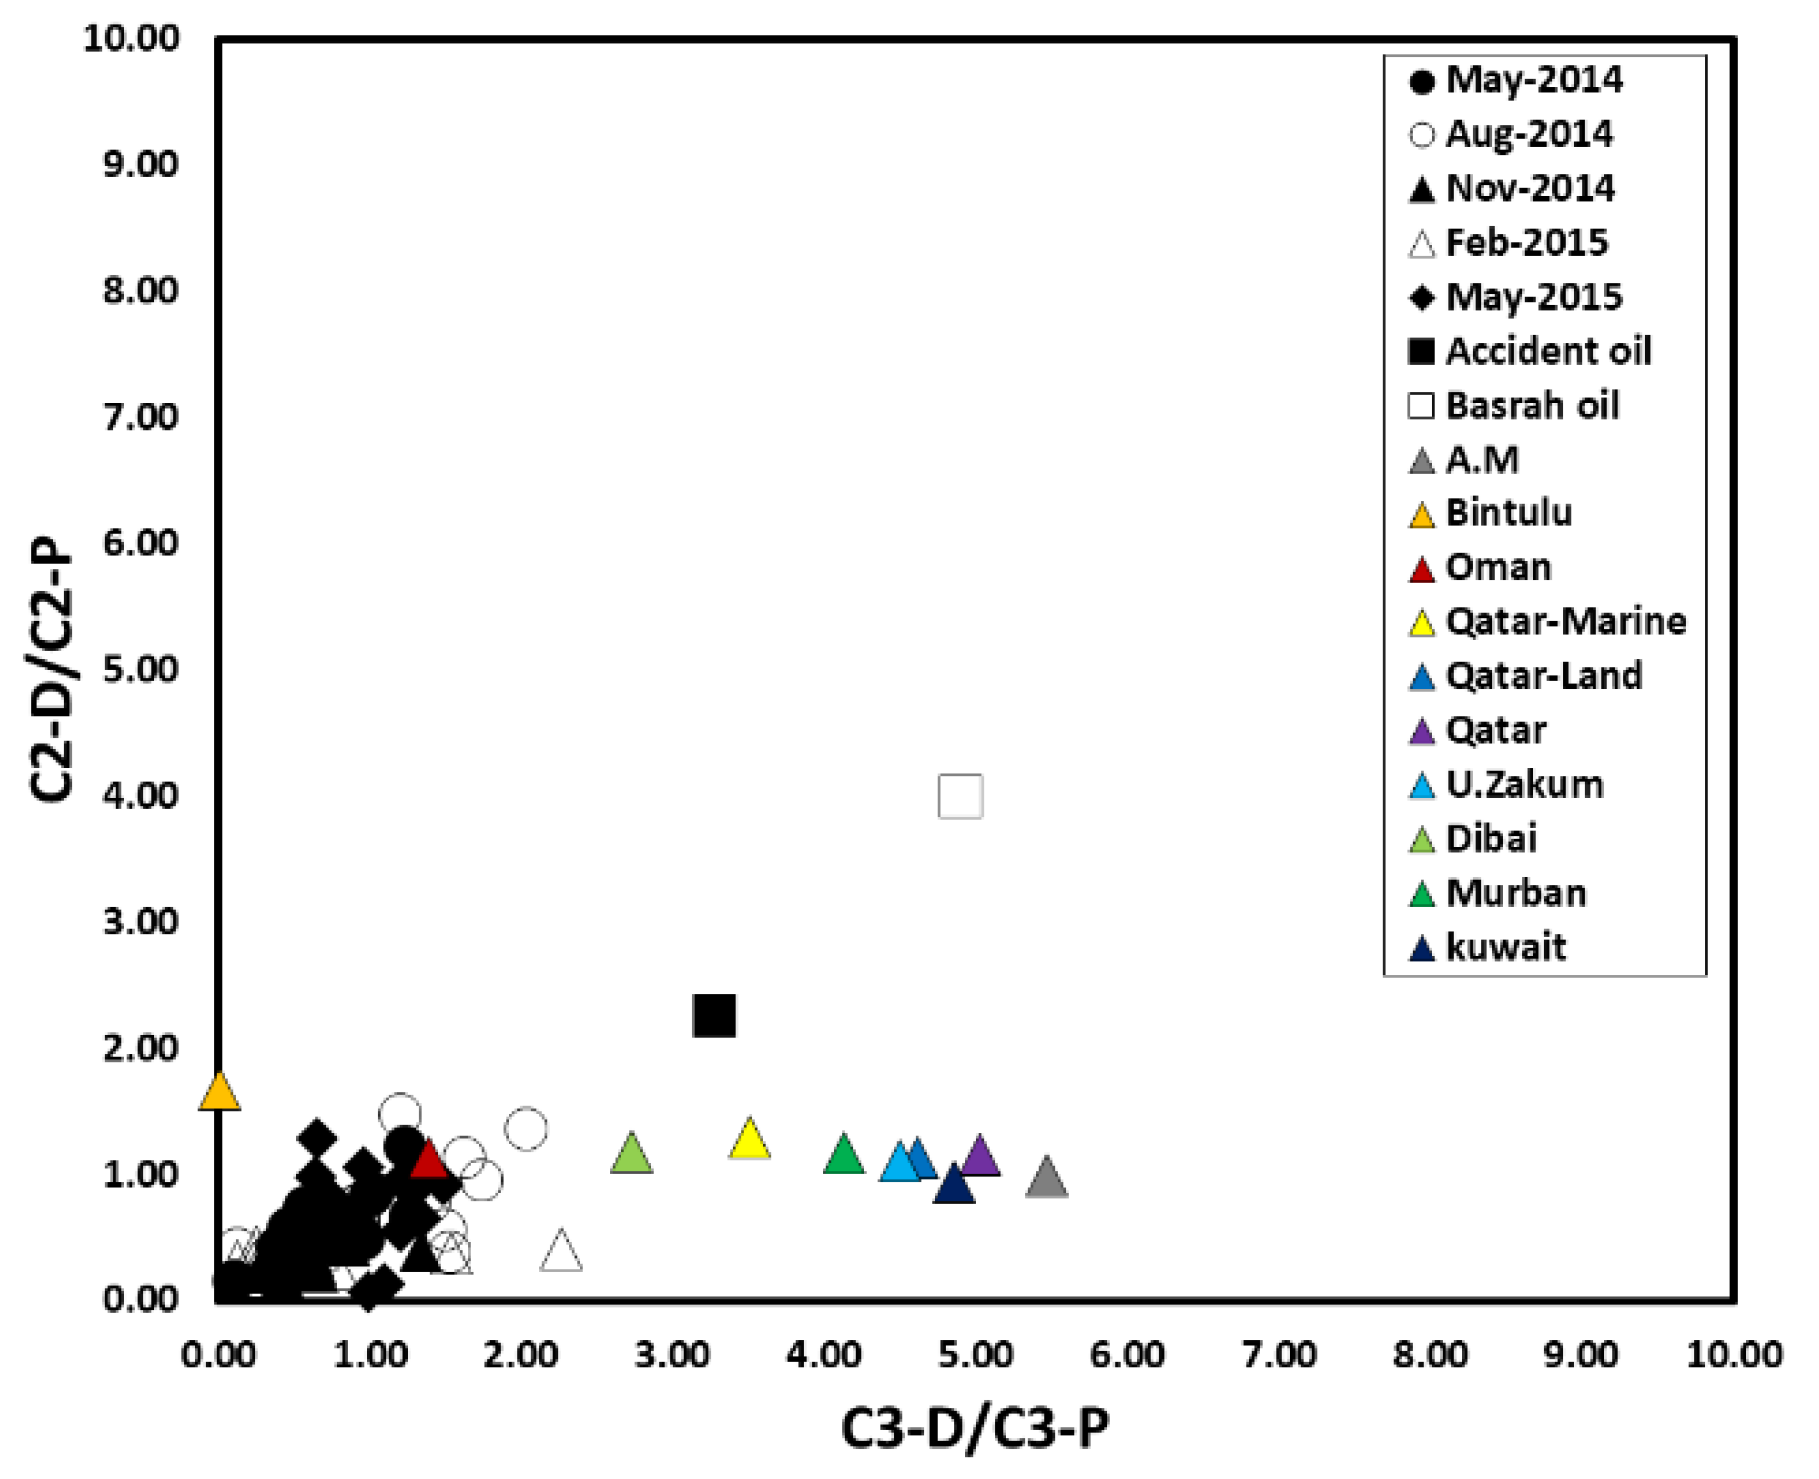
3.3. Estimation of Origins through the Isomeric Ratio of PAHs

The PAHs are divided based on their origins, the combustion origin is introduced into the ocean through the atmosphere, while PAHs originated from the oil is introduced directly through land or ship activities. Notably, those with biological origin introduced by living organisms were reported [38]. The inflow of these PAHs into the ocean can be traced using the isomers of each of the 16 PAHs to determine the origins and routes of the inflow of PAHs [27,39,40,41]. Therefore, many researchers have traced their origins using isomeric ratios, and studies to trace pollution sources have been conducted using the isomeric ratios of alkyl PAHs. Therefore, at the site of the Wu Yi San oil spill, the pollution source was traced using the isomeric ratios of 16 PAHs and four alkyl PAHs (Table 7).
Among the 16 isomeric ratios of PAHs, the MP/Phe and pyrogenic index (PI) ratios showed oil origins and complex origins rather than combustion origins at several stations (Figure 4a). Given that both LWM/HWM and IP/(IP + BgP) showed combustion origins (Figure 4b), it was determined that 16 PAHs and alkyl PAHs were introduced from different origins. In the case of the 16 PAHs, the isomeric ratios indicated combustion origins, namely the combustion emissions from petrochemical plants densely located near the accident site, oil combustion emissions from ship engines, and combustion emissions from surrounding cities.
There was a report that the ∑16 PAH levels in the atmosphere were 47.66 and 56.15 ng/m3 in the two local industrial facilities in the study area and 70.64 and 97.58 ng/m3 in two local residential areas surrounding the present study area (Yeosu and Gwangyang Cities, respectively) [33]. There are no studies on PAH contamination values derived from the shipping movement. Indirectly, the active movement of vessel entries/departures, 109,539 ships were reported from January 2014 to May 2015 [46]. These previous reports imply that the combustion origin from the industrial facilities, the residences, and the shipping movement played an essential role in PAH contamination in the study area.
In the case of alkyl PAHs, the isomeric ratios indicated composite origins, including the Wu Yi San oil spill and 56 other maritime accidents that occurred from 2008 to 2013 at Yeosu Port, Gwangyang Port, and access waterways (Ministry of Maritime Affairs and Fisheries Central Maritime Safety Tribunal Maritime Accident Statistical Yearbook [47]), and combustion origins due to industrial activities.
It has been reported that the double ratios of alkyl-substituted phenanthrene (C2-P, C3-P) and alkyl-substituted dibenzothiophene (C2-D, C3-D) in the suspected sediments can be used to trace oil origins and determine the contribution degrees of origin for the presence or absence of oil introduced by maritime accidents or vessel activities [48,49]. Double ratios have been used to identify oils after the Exxon Valdez, Hebei Spirit, and Wu Yi San oil spill accidents [2,22,23,48,49]. The double ratios of C2-D/C2-P and C3-D/C3-P among the submarine sediments in this study were employed to trace and identify the oil and explain the double ratios; these results are shown in Table 8 and Figure 5.
The double ratios of C2-D/C2-P were in the range of 0.11–2.26 and those of C3-D/C3-P were in the range of 0.08–1.48 in the water in and around the oil spill and were consistent throughout whole stations. These values were similar to the results of the analysis of double ratios for the intertidal sediment samples on the Yeosu and Namhaedo coasts after the Wu Yi San oil spill accident [23]. The double ratios of the oil collected from the water 5 days after the accident and those of the Iraqi Basrah spill present in the oil pipeline were expected to be identical with similar values, but they showed a different trend from the double ratios obtained in this study. As they were similar to the double ratios of samples from the stations near the oil spill, it is possible that the level before the accident was restored. In addition, data from existing literature [21] that analyzed the double ratios of C2-D/C2-P and C3-D/C3-P for 14 representative types of crude oil imported into South Korea were applied to the data in this study. According to the results (Figure 5), a station where the double ratios of C2-D/C2-P and C3-D/C3-P were similar to the double ratios of C2-D/C2-P and C3-D/C3-P in Oman Oil was found, but it should be further investigated as this station was not near the oil spill of interest.

3.4. Levels of Biological Contamination in Submarine Sediments Due to PAHs

Although no control standards for the biological effects of PAHs on submarine sediments have been established in South Korea or worldwide, the US National Oceanic and Atmospheric Administration (NOAA) has established the effect range low (ERL) and effect range median (ERM), which are standards used for assessing the biological effects of the PAH contamination of sediments in lakes [50]. The ERL standard is set as the concentration when the bioeffect content of pollutants is 10% and the ERM standard is set as the concentration when the bioeffect content of pollutants is 50% to manage sediments [50]. The ERL and ERM standards are applied to the results of this study, as shown in Table 9.
The 16 PAHs and alkyl PAH levels in the 20 adjacent surface sediments (St.1-St.20) from the accident area were considerably lower than the ERM and ERL. As stated above in the previous model [19], there were PAH levels in the intertidal zone [49], and the present study results indicate that the spilled oil was rapidly dispersed and accumulated in the adjacent coasts and beaches rather than in the accident area. This may result in the PAH level being below the ERL.
Contrary to this, the C2-naphthalene, C1-phenanthrene, and C2-phenanthrene concentrations in the accident area showed higher than the ERL. The three PAH levels in St A, where the distance was approximately 100 m from the accident point, were highlighted. Notably, C2-phenanthrenes in the entire accident area were higher than the ERL because these sediment samples were collected 1 month after the oil spill nearby the accident point.
In previous research studies, ERL and ERM values were validly employed to assess the biological effects of PAH contamination. However, the final sampling in the present study was implemented 7 years ago, and it is challenging to represent the current situation. It is necessary to comprehensively assess recent PAH contamination values using the sediment guideline and an additional environmental risk assessment, such as the risk quotient (RQ) [37,51,52,53]. Establishing a strategic future research plan in this study area in essential to overcome the limitations of the present study mentioned earlier.

4. Conclusions

The present study determined the variations in PAH contamination values in the subtidal surface sediment with oil fingerprinting and assessed its contamination values in the Wu Yi San oil spill in Yeosu City, Korea. The PAH levels in St.E and St.17, which have a short distance from the accident area, decreased considerably over time. Remarkably, the tendency was highlighted 4 months after the oil spill. This might be derived from the fast tidal current and effective prevention and control efforts by the Korean government. There were no statistically significant correlations between surface sediment and seawater in the PAH levels. This indicates that the fate of PAHs in the surface seawater rapidly spread toward the adjacent coasts and beaches rather than being retained on the water column. The isomeric ratios of the 16 PAHs showed that the pyrogenic origin was dominant. There was no correlation between the 16 PAHs and the alkylated PAHs, indicating that alkylated PAHs were derived from the complex origins accompanying the combustion and oil spill sources. Notably, the double ratios of PAHs in this study were distinguished from the accident oil. The present study is the first to determine the Wu Yi San oil spill using oil fingerprinting in the subtidal surface sediment in the study area. The strategic research plan should be established to comprehensively assess the current PAH contamination variations from the oil spill in the subtidal surface sediment based on this preliminary study as a cornerstone.

Author Contributions

Conceptualization, B.M., C.C., and H.C.; methodology, B.M., C.C., and H.C.; software, B.M., J.O., K.P., W.P., and J.L.; validation, B.M., J.O., K.P., W.P., and J.L.; formal analysis, B.M., H.J., J.O., K.P., W.P., and J.L.; investigation, B.M., H.J., J.O., K.P., W.P., and J.L.; resources, B.M., K.P., W.P., and J.L.; data curation, B.M., C.C., and H.C.; writing—original draft preparation, B.M. and C.C.; writing—review and editing, H.J., C.C., and H.C.; visualization, B.M.; supervision, H.C.; project administration, H.C.; funding acquisition, H.C. All authors have read and agreed to the published version of the manuscript.

Funding

This research was supported by Chonnam National University and Basic Science Research Program through the National Research Foundation of Korea (NRF) funded by the Ministry of Science and ICT (2020R1A2C21024421340982119420103).

Data Availability Statement

Not applicable.

Acknowledgments

This research was supported by Chonnam National University.

Conflicts of Interest

The authors declare no conflict of interest.

References

  1. Eisler, R. Polycyclic Aromatic Hydrocarbons Hazards to Fish, Wildlife, and Invertebrates; Fish and Wildlife Service, US Department of the Interior: Washington, DC, USA, 1987; p. 85. [Google Scholar]
  2. Wang, Z.D.; Fingas, M.; Shu, Y.Y.; Sigouin, L.; Landriault, M.; Lambert, P.; Turpin, R.; Campagna, P.; Mullin, J. Quantitative characterization of PAHs in burn residue and soot samples and differentiation of pyrogenic PAHs from petrogenic PAHs–the 1994 mobile burn study. Environ. Sci. Technol. 1999, 33, 3100–3109. [Google Scholar] [CrossRef]
  3. Hatch, A.C.; Burton, G.A. Photo-induced toxicity of PAHs to Hyalella azteca and Chironomus tentans: Effects of mixtures and behavior. Environ. Pollut. 1999, 106, 157–167. [Google Scholar] [CrossRef] [PubMed]
  4. Lima, A.L.; Farrington, J.W.; Reddy, C.M. Combustion-derived polycyclic aromatic hydrocarbons in the environment—A review. Environ. Forensics 2005, 6, 109–131. [Google Scholar] [CrossRef]
  5. Jiang, J.; Lee, C.; Fang, M.; Liu, J.T. Polycyclic aromatic hydrocarbons in coastal sediments of southwest Taiwan: An appraisal of diagnostic ratios in source recognition. Mar. Pollut. Bull. 2009, 58, 752–760. [Google Scholar] [CrossRef]
  6. Saha, M.; Togo, A.; Mizukawa, K.; Murakami, M.; Takada, H.; Zakaria, M.P.; Chiem, N.H.; Tuyen, B.C.; Prudente, M.; Boonyatumanond, R.; et al. Sources of sedimentary PAHs in tropical Asian waters: Differentiation between pyrogenic and petrogenic sources by alkyl homolog abundance. Mar. Pollut. Bull. 2009, 58, 189–200. [Google Scholar] [CrossRef]
  7. Harris, K.A.; Yunker, M.B.; Dangerfield, N.; Ross, P.S. Sediment-associated aliphatic and aromatic hydrocarbons in coastal British Columbia, Canada: Concentrations, composition, and associated risks to protected sea otters. Environ. Pollut. 2011, 159, 2665–5674. [Google Scholar] [CrossRef]
  8. Chiou, C.T.; McGroddy, S.E.; Kile, D.E. Partition characteristics of polycyclic aromatic hydrocarbons on soils and sediments. Environ. Sci. Technol. 1998, 32, 264–269. [Google Scholar] [CrossRef]
  9. Connel, D.W.; Hawker, D.W.; Warne, M.J.; Vowles, P.P.; McCombs, K.; Starkweather, A.W. Introduction into Environmental Chemistry. In Polycyclic Aromatic Hydrocarbons (PAHs); CRC: Boca Raton, FL, USA, 1997; pp. 205–217. [Google Scholar]
  10. Gravato, C.; Santos, M.A. Juvenile sea bass liver P450, EROD induction, and erythrocytic genotoxic responses to PAH and PAH-like compounds. Ecotoxicol. Environ. Safety 2002, 51, 115–127. [Google Scholar] [CrossRef]
  11. Cheikyula, J.O.; Koyama, J.; Uno, S. Micronuclei and other nuclear abnormalities formation in the red sea bream, Pagrus major, exposed to polycyclic aromatic hydrocarbons. Jpn. J. Environ. Toxicol. 2009, 12, 33–39. [Google Scholar]
  12. Heintz, R.A.; Rice, S.D.; Wertheimer, A.C.; Bradshaw, R.F.; Thrower, F.P.; Joyce, J.E.; Short, J.W. Delayed effects on growth and marine survival of pink salmon Oncorhynchus gorbuscha after exposure to crude oil during embryonic development. Mar. Ecol. Prog. Ser. 2000, 208, 205–216. [Google Scholar] [CrossRef]
  13. Rhodes, S.; Farwell, A.; Hewitt, L.M.; Mackinnon, M.; Dixon, D.G. The effects of dimethylated and alkylated polycyclic aromatic hydrocarbons on the embryonic development of the Japanese medaka. Ecotoxicol. Environ. Safety 2005, 60, 247–258. [Google Scholar] [CrossRef] [PubMed]
  14. Farrington, J.W.; Goldberg, E.D.; Risegrough, R.W.; Martin, J.H.; Bowen, V.T. US ‘Mussel Watch’ 1976-1978: An Overview of the Trace-metal, DDE, PCB, hydrocarbon, and artificial radionuclide data. Environ. Sci. Technol. 1983, 17, 490–496. [Google Scholar] [CrossRef] [PubMed]
  15. Henner, P.; Schiavon, M.; Morel, J.L.; Lichtfouse, E. Polycyclic Aromatic Hydrocarbon (PAH) Occurrence and Remediation Methods. Analysis 1997, 25, 56–59. [Google Scholar]
  16. Wild, S.R.; Jones, K.C. Polynuclear Aromatic Hydrocarbons in the United Kingdom Environment: A Preliminary Source Inventory and Budget. Environ. Pollut. 1995, 88, 91–108. [Google Scholar] [CrossRef] [PubMed]
  17. Korea Coast Guard (KCG). Statistics of Marine Pollution Accident in 2014; Korea Coast Guard (KCG): Incheon, Republic of Korea, 2015; pp. 1–7. (In Korean) [Google Scholar]
  18. Ministry of Oceans and Fisheries. The Official Experiment Standard of Marine Environment. 2013. Available online: https://law.go.kr/LSW/admRulLsInfoP.do?admRulSeq=2100000202962 (accessed on 20 March 2014). (In Korean).
  19. Report on the Investigation of the Impact of the Oil Pollution Accident of the Collision of Wu Yi San on Marine Pollution; Chonnam National University Fishery Science Research Institute: Gwangju, Republic of Korea, 2015; Volume 558–559, pp. 571–573. (In Korean)
  20. Yim, U.H.; Ha, S.Y.; An, J.G.; Won, J.H.; Han, G.M.; Hong, S.H.; Kim, M.; Jung, J.H.; Shim, W.J. Fingerprint and weathering characteristics of stranded oils after the Hebei Spirit oil spill. J. Hazard. Mater. 2011, 197, 60–69. [Google Scholar] [CrossRef]
  21. Kim, E.S.; An, J.G.; Kim, G.B.; Sim, W.J.; Joo, C.K.; Kim, M.K. Identification of Major Crude Oils Imported into Korea using Molecular and Stable Carbon Isotopic Compositions. J. Kor. Soc. Mar. Environ. Eng. 2012, 15, 247–256. (In Korean) [Google Scholar] [CrossRef]
  22. Yim, U.H.; Hong, S.H.; Ha, S.Y.; Han, G.M.; An, J.G.; Kim, N.S.; Lim, D.I.; Choi, H.W.; Shim, W.J. Source- and region-specific distribution of polycyclic aromatic hydrocarbons in sediments from Jinhae Bay. Kor. Sci. Total Environ. 2014, 470, 1485–1493. (In Korean) [Google Scholar] [CrossRef]
  23. Jang, Y.L.; Lee, H.J.; Jeong, H.J.; Park, S.Y.; Yang, W.H.; Kim, H.Y.; Kim, G.B. Restoration and source identification of polycyclic aromatic hydrocarbons after the Wu Yi San oil spill, Korea. Mar. Pollut. Bull. 2016, 111, 463–467. [Google Scholar] [CrossRef]
  24. Kim, M.K.; Jung, J.H.; Ha, S.Y.; An, J.G.; Shim, W.J.; Yim, U.H. Long-Term Monitoring of PAH Contamination in Sediment and Recovery After the Hebei Spirit Oil Spill, Arch. Environ. Contam. Toxicol. 2017, 73, 93–102. [Google Scholar] [CrossRef]
  25. Yim, U.H.; Hong, S.H.; Sim, W.J. Distribution and characteristics of PAHs in sediments from the marine environment of Korea. Chemosphere 2007, 68, 85–92. [Google Scholar] [CrossRef]
  26. Kim, H.J. A Study on the Spatial and Seasonal Variation of Polycyclic Aromatic Hydrocarbons (PAHs) and Heavy Metals in Sediments around Gwangyang Bay. Master’s Degree, Chonnam National University, Gwangju, Republic of Korea, 2010. (In Korean). [Google Scholar]
  27. Park, J.H.; Lee, C.D.; Kim, J.H. Distributions and Sources of Polycyclic Aromatic Hydrocarbons in the Tidal Flat Sediments from Incheon Coastal Area. Kor. J. Wetlands Res. 2013, 15, 441–451. (In Korean) [Google Scholar] [CrossRef] [Green Version]
  28. Miki, S.; Uno, S.; Ito, K.; Koyama, J.; Tanaka, H. Distributions of polycyclic aromatic hydrocarbons and alkylated polycyclic aromatic hydrocarbons in Osaka Bay. Japan. Mar. Pollut. Bull. 2014, 85, 558–565. [Google Scholar] [CrossRef]
  29. Barakat, A.O.; Mostafa, A.; Wade, T.L.; Sweet, S.T.; El Sayed, N.B. Distribution and characteristics of PAHs in sediments from the Mediterranean coastal environment of Egypt. Mar. Pollut. Bull. 2011, 62, 1969–1978. [Google Scholar] [CrossRef]
  30. Harvey, H.R.; Taylor, K.A.; Pie, H.V.; Mitchelmore, C.L. Polycyclic aromatic and aliphatic hydrocarbons in Chukchi Sea biota and sediments and their toxicological response in the Arctic cod. Boreogadus saida. Deep-Sea Res. II 2014, 102, 32–55. [Google Scholar] [CrossRef]
  31. Sprovieri, M.; Feo, M.L.; Prevedello, L.; Salvagio Manta, D.; Sammartino, S.; Tamburrino, S.; Marsella, E. Heavy metals, polycyclic aromatic hydrocarbons and polychlorinated biphenyls in surface sediments of the Naples harbour (southern Italy). Chemosphere 2007, 67, 998–1009. [Google Scholar] [CrossRef]
  32. Perra, G.; Pozo, K.; Guerranti, C.; Lazzeri, D.; Volpi, V.; Corsolini, S.; Focardi, S. Levels and spatial distribution of polycyclic aromatic hydrocarbons (PAHs) in superficial sediment from 15 Italian marine protected areas (MPA). Mar. Pollut. Bull. 2011, 62, 874–877. [Google Scholar] [CrossRef]
  33. Baek, K.M.; Seo, Y.K.; Baek, S.O. Occurrence of Particulate Polycyclic Aromatic Hydrocarbons and Phthalates in the Ambient Air of Yeosu·Gwangyang Area. J. Kor. Soc. Atm. Environ. 2019, 35, 767–785. (In Korean) [Google Scholar] [CrossRef]
  34. Voice, T.C.; Weber, W.J., Jr. Sorption of hydrophobic compounds by sediments, soils and suspended solids—I. Theory and background. Water Res. 1983, 17, 1433–1441. [Google Scholar] [CrossRef] [Green Version]
  35. Wu, S.C.; Gschwend, P.M. Sorption kinetics of hydrophobic organic compounds to natural sediments and soils. Environ. Sci. Technol. 1986, 20, 717–725. [Google Scholar] [CrossRef]
  36. Smith, J.N.; Levy, E.M. Geochronology for polycyclic aromatic hydrocarbon contamination in sediments of the Saguenay Fjord. Environ. Sci. Technol. 1990, 24, 874–879. [Google Scholar] [CrossRef]
  37. Wang, D.G.; Alaee, M.; Byer, J.; Liu, Y.J.; Tian, C.G. Fugacity approach to evaluate the sediment–water diffusion of polycyclic aromatic hydrocarbons. J. Environ. Mon. 2011, 13, 1589–1596. [Google Scholar] [CrossRef]
  38. McElroy, A.E.; Farrington, J.W.; Teal, J.M. Bioavailability of polycyclic aromatic hydrocarbons in the aquatic environment. In Metabolism of Polycyclic Aromatic Hydrocarbons in the Aquatic Environment; CRC Press, Inc.: Boca Raton, FL, USA, 1989; pp. 1–39. [Google Scholar]
  39. Eganhouse, R.P. Molecular markers and their use in environmental organic geochemistry. Geochem. Soc. Spec. Publ. 2004, 9, 143–158. [Google Scholar]
  40. Kumata, H.; Yamada, J.; Masuda, K.; Takada, H.; Sato, Y.; Sakurai, T.; Fujiwara, K. Benzothiazolamines as tire-derived molecular markers: Sorptive behavior in street runoff and application to source apportioning. Environ. Sci. Technol. 2002, 36, 702–708. [Google Scholar] [CrossRef]
  41. Zakaria, M.P.; Takada, H.; Tsutsumi, S.; Ohno, K.; Yamada, J.; Kouno, E.; Kumata, H. Distribution of polycyclic aromatic hydrocarbons (PAHs) in rivers and estuaries in Malaysia: A widespread input of petrogenic PAHs. Environ. Sci. Technol. 2002, 36, 1907–1918. [Google Scholar] [CrossRef]
  42. Budzinski, H.; Bellocq, J.; Pierard, C.; Garrigues, P. Evaluation of sediment contamination by polycyclic aromatic hydrocarbons in the Gironde estuary. Mar. Chem. 1997, 58, 85–97. [Google Scholar] [CrossRef]
  43. Yan, W.; Chi, J.; Wang, Z.; Huang, W.; Zhang, G. Spatial and temporal distribution of polycyclic aromatic hydrocarbons (PAHs) in sediments from Daya Bay, South China. Environ. Pollut. 2009, 157, 1823–1830. [Google Scholar] [CrossRef]
  44. Yunker, M.B.; Macdonald, R.W.; Vingarzan, R.; Mitchell, R.H.; Goyette, D.; Sylvestre, S. PAHs in the Fraser River Basin: A critical appraisal of PAH ratios as indicators of PAH source and composition. Org. Geochem. 2002, 32, 489–515. [Google Scholar] [CrossRef]
  45. Luo, X.J.; Chen, S.J.; Mai, B.X.; Yang, Q.S.; Sheng, G.Y.; Fu, J.M. Polycyclic aromatic hydrocarbons in suspended particulate matter and sediments from the Pearl River Estuary and adjacent coastal areas. China. Environ. Pollut. 2006, 139, 9–20. [Google Scholar] [CrossRef]
  46. Korea Port Management Information System. Available online: https://new.portmis.go.kr (accessed on 26 November 2022). (In Korean).
  47. Ministry of Maritime Affairs and Fisheries. Central Maritime Safety Tribunal Maritime Accident Statistical Yearbook. 2014. Available online: https://www.kmst.go.kr/kmst/statistics/annualReport/selectAnnualReportList.do (accessed on 30 November 2014). (In Korean).
  48. Douglas, G.S.; Bence, A.E.; Prince, R.C.; McMillen, S.J.; Butler, E.L. Environmental stability of selected petroleum hydrocarbon source and weathering ratios Environ. Sci. Technol. 1996, 30, 2332–2339. [Google Scholar] [CrossRef]
  49. Boehm, P.D.; Douglas, G.S.; Burns, W.A.; Mankiewicz, P.J.; Page, D.S.; Bence, A.E. Application of petroleum hydrocarbon chemical fingerprinting and allocation techniques after the Exxon Valdez oil spill. Mar. Pollut. Bull. 1997, 34, 599–613. [Google Scholar] [CrossRef]
  50. Long, E.R.; Macdonald, D.D.; Smith, S.L.; Calder, F.D. Incidence of adverse biological effects with ranges of chemical concentrations in marine and estuarine sediments. Environ. Manag. 1995, 19, 81–97. [Google Scholar] [CrossRef]
  51. Kalf, D.F.; Crommentuijn, T.; van de Plassche, E.J. Environmental quality objectives for 10 polycyclic aromatic hydrocarbons (PAHs). Ecotoxicol. Environ. Safety 1997, 36, 89–97. [Google Scholar] [CrossRef] [PubMed]
  52. Farooq, M.S.; Chaudhry, A.H.; Shafiq, M.; Berhanu, G. Factors affecting students’ quality of academic performance: A case of secondary school level. J. Qual. Technol. Manag. 2011, 7, 1–14. [Google Scholar]
  53. Dudhagara, D.R.; Rajpara, R.K.; Bhatt, J.K.; Gosai, H.B.; Sachaniya, B.K.; Dave, B.P. Distribution, sources and ecological risk assessment of PAHs in historically contaminated surface sediments at Bhavnagar coast, Gujarat, India. Environ. Pollut. 2016, 213, 338–346. [Google Scholar] [CrossRef] [PubMed]
Figure 1. Sampling locations for surface sediment collection in the Wu Yi San oil spill site, the Yeosu Channel and Gwangyang Bay, Korea(No 1~20: the Yeosu Channel and Gwangyang Bay subtidal zone station/St. A~F: Oil spill accident areas station).
Water 15 00279 g001
Figure 3. Correlation between 16 water PAHs, 16 sediment PAHs, and alkyl PAHs.
Water 15 00279 g003
Figure 4. Plots of calculated (A) MP/P versus pyrognic index. (B) LMW/HMW versus IP/(IP + BgP) index(LMW/HMW - Pyrogenic Origin : < 1, Petrogenic Origin : >1; IP/IP+BgP - Pyrogenic Origin : > 0.2, Petrogenic Origin : <0.2; MP/P - Pyrogenic Origin : < 1, Petrogenic Origin : > 2; Pyrogenic index - Pyrogenic Origin : > 0.8, Petrogenic Origin : < 0.223).
Water 15 00279 g004
Figure 5. Plots of calculated C2-D/C2-P versus C3-D/C3-P.
Water 15 00279 g005
Table 1. Summary of the sampling to collet PAHs samples in the subtidal zone in the Wu Yi San oil spill site and in the Yeosu Channel and Gwangyang Bay, Korea.
March 2014May 2014August 2014November 2014February 2015May 2015
Oil spill
accident areas
6 points
(St.A-St.F)
-----
the Yeosu Channel and Gwangyang Bay, Korea-20 points
(St.1-St.20)
20 points
(St.1-St.20)
20 points
(St.1-St.20)
20 points
(St.1-St.20)
20 points
(St.1-St.20)
Table 2. Quantitative ion values used in the analysis of 16 PAHs and alkyl PAHs.
CompoundsCodeTarget
Ions
Confirmation (m/z)CompoundsCodeTarget
Ions
Confirmation (m/z)
PAHs Alkylated PAHs
2-Rings 2-Rings
NaphthaleneNap128127C1-NaphthalenesC1-Nap142
3-Rings 1-Methyl Napthalene142141
AcenaphthyleneAcPy1521512-Methyl Napthalene142141
AcenaphtheneAce154153, 152C2-NaphthalenesC2-Nap156
FluoreneFlu1661641,2-Dimethyl Naphthalene156154
PhenanthrenePhe178176C3-NaphthalenesC3-Nap170
AnthraceneAnT178176C4-NaphthalenesC4-Nap184
4-Rings 3-Rings
FluorantheneFluA202201C1-FluorenesC1-Flu180
PyrenePyr2022011-Methyl Fluorene180.2180
Benzo[a]anthraceneBaA228226C2-FluorenesC2-Flu194
ChryseneChr228226C3-FluorenesC3-Flu208
5 or 6 Rings C1-DibenzothiophenesC1-DBT198
Benzo[b]fluorantheneBbF2522504-Methyl Dibenzothiophenes198.3198
Benzo[k]fluorantheneBkF252250C2-DibenzothiophenesC2-DBT212
Benzo[a]pyreneBaP2522503-DibenzothiophenesC3-DBT226
Indeno(1,2,3-CD)pyreneDbA276275C1-PhenanthrenesC1-Phe192
Dibenz(a,h)anthraceneInP2782771-Methyl Phenanthrenes191192
Benzo[ghi]peryleneBghiP276275C2-PhenanthrenesC2-Phe206
C3-PhenanthrenesC3-Phe220
C4-PhenanthrenesC4-Phe234
4-Rings
C1-ChrysenesC1-Chr242
1-Methyl Chrysenes242242
C2-ChrysenesC2-Chr254
C3-ChrysenesC3-Chr268
Table 3. Total concentration of 16 PAHs and alkylated PAHs in subtidal sediments at the Wu Yi San oil spill site.
Station∑16 PAHs (ng/g dw.)∑Alkylated PAHs (ng/g dw.)
March 2014March 2014
St. A605.13071.9
St. B205.31839.0
St. C199.12530.9
St. D200.82651.8
St. E357.91900.9
St. F239.22625.8
Min199.11839.0
Max605.13071.9
Mean301.22436.7
SD146.7435.64
Median222.32578.4
Table 4. Total concentrations of 16 PAHs and alkylated PAHs in sediments from Gwangyang Bay and the Yeosu Channel.
Station∑16 PAHs (ng/g dw.)∑Alkylated PAHs (ng/g dw.)
May 2014August 2014November 2014February 2015May 2015May 2014August 2014November 2014February 2015May 2015
St. 1195.8193.663.138.2133.9335.8361.9380.0234.0168.9
St. 2883.2239.3171.3107.129.9316.4291.9273.0366.7211.0
St. 3192.5170.6101.2215.238.5343.595.4214.4210.3208.6
St. 4139.483.967.938.522.2167.5106.3207.3159.9167.3
St. 5244.0188.368.256.730.7217.0216.1137.2347.7228.5
St. 665.499.559.235.664.8156.0168.3109.174.2159.9
St. 7115.1146.752.747.323.5188.3173.4125.8242.0225.2
St. 8127.6157.055.827.434.4176.8227.8178.2138.4191.0
St. 9169.0397.268.366.225.0149.0227.0232.4524.4272.3
St. 10153.0150.049.3116.833.6232.8244.0100.0518.2197.9
St. 11148.5140.038.276.232.2283.8200.8175.3139.7212.6
St. 1245.798.442.671.824.685.1146.0119.3172.8187.0
St. 1339.6204.785.696.232.8197.1301.4265.7378.3186.9
St. 1443.6237.8109.836.846.0197.1349.5190.874.6253.5
St. 1554.6-97.792.249.5280.8-245.4235.1286.2
St. 16223.3227.0111.474.940.0402.5692.6484.8171.0151.3
St. 17246.9115.775.480.431.1238.4250.7320.1215.9232.8
St. 1874.1132.461.795.065.5108.8233.9211.4343.3295.1
St. 19186.8103.146.596.052.0242.3145.8171.0263.9265.4
St. 2086.7193.640.080.034.0116.0200.5191.1518.0128.5
Min39.683.938.227.422.285.195.4100.074.2128.5
Max883.2397.2171.3215.2133.9402.5692.6484.8524.4295.1
Mean171.7175.173.377.442.2221.8243.9216.6266.4211.5
SD176.072.331.440.724.382.8127.492.7136.445.1
Median143.9157.065.575.633.8207.1227.0199.2234.5209.8
Table 5. Comparison of PAH concentrations in surface sediments between this and other studies.
CountrySampling AreasN* ∑PAHs, ng/g Dry wt.Reference
16 PAHsAlkylated
PAHs
KoreaIncheon coast1662.34–260.79-[27]
Masan Bay39175 ± 358111 ± 116[22]
Haengam Bay39133 ± 12290.5 ± 40.6[22]
Wonmoon Bay39242 ± 619139 ± 102[22]
Gohyun Bay39214 ± 14187.2 ± 35.4[22]
ItalyMarine-protected areas160.71–1550-[32]
Naples harbour169–31,774-[31]
JapanOsaka Bay396.40–780013.7–1700[28]
EgyptMediterranean coastal393.5–14,10010–7500[29]
Arctic OceanChukchi Sea3930.5–601.193.0–2353.0[30]
Korea20 Station3439.6–883.385.1–692.6this study
Korea5 Station
(Accident point)
34199.1–605.11839.0–3071.9this study
Note: N*: analyzed numbers of PAH compounds in each study.
Table 6. Total concentrations of 16 PAHs and alkylated PAH concentrations in surface seawater in Gwangyang Bay and the Yeosu Channel.
Station∑16 PAHs (ng/L)
May 2014August 2014November 2014February 2015May 2015
St. 12.2167.911.015.99.1
St. 238.921.286.014.510.4
St. 324.954.974.437.59.3
St. 438.645.375.643.97.4
St. 539.846.681.646.06.5
St. 640.328.782.029.58.9
St. 725.740.02.932.010.2
St. 814.040.044.255.95.1
St. 917.846.011.09.06.5
St. 1018.318.88.419.05.5
St. 1115.419.713.156.38.2
St. 1214.6107.511.317.011.4
St. 1314.697.018.517.18.2
St. 1410.920.821.224.612.5
St. 1511.8-17.726.511.4
St. 1619.490.120.923.810.9
St. 1716.221.434.19.76.7
St. 1830.319.038.843.45.2
St. 1911.282.512.740.46.2
St. 2013.9167.9103.936.28.0
Min2.218.82.99.05.1
Max40.3167.9103.956.312.5
Mean20.959.738.529.98.4
SD10.946.031.814.22.2
Median17.045.321.028.08.2
Table 7. Characteristic values of selected molecular ratios for pyrolytic and petrogenic origins of PAHs.
Diagnostic RatioPyrogenic
Origin
Petrogenic
Origin
May 2014August 2014November 2014February 2015May 2015Accident Point
LMW/HMW a<1>10.05–0.370.10–0.260.06–0.620.13–5.100.29–1.220.31–0.92
IP/IP + BgP b>0.2<0.20.55–0.680.58–0.640.15–0.810.40–0.900.70–0.77N.D
MP/P c<1>21.42–4.551.55–4.690.85–2.600.11–5.520.49–10.51.46–3.11
Pyrogenic index d>0.8<0.2230.18–2.760.33–1.630.20–0.620.12–0.990.09–0.280.07–0.18
Note: a LMW/HMW: ratio of four-to-six-ring unsubstituted PAHs (except perylene) to the sum of two- and three-ring parent PAHs [42,43]. b IP/IP + BgP: Indeno(1,2,3-CD)pyrene/Indeno(1,2,3-CD)pyrene+Benzo[ghi]perylene [44]. c MP/P: ratio of (3-methylphenanthrene+2-methylphenanthrene+9-methylphenanthrene+1-methylphenanthrene) to phenanthrene [43,45]. d Pyrogenic index: ratio of the sum of the concentrations of EPA-priority unsubstituted three-to-six-ring PAHs to the sum of the concentrations of five targeted alkylated PAH homologues [2].
Table 8. Selected source diagnostic ratios for source identification.
Diagnostic RatioMay 2014August 2014November 2014February 2015May 2015Accident Point
C2-DBT/C2-Phe a0.11–1.270.13–2.030.27–1.340.12–2.260.49–1.490.63–1.68
C3-DBT/C3-Phe b0.16–1.230.39–1.480.20–0.580.20–0.440.08–1.280.55–0.91
Note: a C2-DBT/C2-Phe: C2-Dibenzothiophenes/C2-Phenanthrenes. b C3-DBT/C3-Phe: C3-Dibenzothiophenes/C3-Phenanthrenes.
Table 9. A comparison of ERM and ERL values with PAH concentrations in sediment samples from Gwangyang Bay and the Yeosu Channel.
CompoundSQG, ng/g dw.PAHs, ng/g dw.Sites with PAHs Concentration
above the ERL or ERM
ERLERMMinMaxBetween ERL and ERMAbove ERM
Naphthalene160210021.954.6
Acenaphthylene44640N.D.2.3
Acenaphthene16500N.D.9.9
Fluorene19540N.D.12.9
Dibenzothiophene19012003.97.9
Phenanthrene240150046.473.0
Anthracene8511004.811.9
Fluoranthene600510043.6113.6
Pyrene665260031.984.5
Benzo[a]anthracene6016004.034.3
Chrysene38028007.548.7
Benzo[a]pyrene4301600N.D.52.6
Indeno(1,2,3-CD)pyrene240950N.D.N.D.
Dibenz(a,h)anthracene63260N.D.N.D.
Denzo[ghi]perylene85330N.D.N.D.
2-Methylanphthalene70670N.D.N.D.
1-Methylanphthalene85800N.D.N.D.
C2-naphthalenes150145085.6197.8St. A
C1-phenanthrenes170200074.6190.1St. A, B
C2-phenanthrenes2002500233.6379.7St. A, B, C, D, E, F
C1-dibenzothiophenes8560031.051.6
Total402244,792588.81325.4
Disclaimer/Publisher’s Note: The statements, opinions and data contained in all publications are solely those of the individual author(s) and contributor(s) and not of MDPI and/or the editor(s). MDPI and/or the editor(s) disclaim responsibility for any injury to people or property resulting from any ideas, methods, instructions or products referred to in the content.

