
Short-Term Meteorological Conditions Explain Cyanobacterial Blooms in a Tropical Reservoir
by
Florencia Soledad Alvarez Dalinger
1,2,*,
Verónica Laura Lozano
1,2,
Claudia Nidia Borja
1,
Liliana Beatriz Moraña
1 and
Salusso María Mónica
1 1
Facultad de Ciencias Naturales, Universidad Nacional de Salta, Avenida Bolivia 5150, Salta 4400, Argentina
2
Consejo Nacional de Investigaciones Científicas y Técnicas (CONICET), Godoy Cruz 2290, Ciudad Autónoma de Buenos Aires 1425, Argentina
*
Author to whom correspondence should be addressed.
Water 2023, 15(2), 302; https://doi.org/10.3390/w15020302
Submission received: 6 December 2022
/
Revised: 30 December 2022
/
Accepted: 9 January 2023
/
Published: 11 January 2023
(This article belongs to the Special Issue Harmful Cyanobacterial Blooms (HCBs) in Freshwaters–an Increasing Global Concern)
Abstract
:Cyanobacterial blooms represent a major problem in reservoirs that are used for potable water supplies. The El Limón reservoir is one of the main reserves of water for consumption in northern Argentina (22°6′12.29″ S). This study analyzed the role of abiotic factors in the promotion of blooms in El Limón during warm seasons and explored the physical and chemical parameters affecting the morphological development of the most abundant cyanobacteria species. The results showed that short-term meteorological variations correlated with cyanobacterial abundances in this shallow reservoir. Average daily temperatures for 6 and 8 months before the sampling date were positively correlated with cyanobacterial abundances as well as filament length, while accumulated precipitation limited the abundances of cyanobacteria. Considering the highly probably effects of short-term meteorological factors on cyanobacterial blooms, the results support the need for continuous and periodic monitoring of tropical reservoirs.
1. Introduction
Freshwater resources are vulnerable to climate change [1]. In the coming decades, rivers, lakes, and reservoirs will experience increased temperatures, more persistent stratification of the water column [1], as well as alterations in the processes of mixing and nutrient distribution [2]. Rainfall alterations associated with climate change will also have effects on freshwater systems since they increase nutrient levels due to external loading [3]. On the other hand, although a possible reduction in precipitation would bring a lower supply of nutrients by runoff [4,5], in the case of shallow lakes, warmer conditions and water deficits could increase internal temperatures and likewise lead to eutrophication [6,7]. Climate change will also increase the risk of cyanobacterial blooms that produce environmental, health, and economic problems [8,9].
The proliferation of phytoplankton species depends on their specific capacity to use available resources [10]. The morphological and physiological flexibility of some cyanobacterial species makes them more competitive than most microalgae. The temperature increase will mainly favor the order Nostocales [11], while warmer summers will favor cyanobacteria with aerotopes due to their greater stability of the water column [12].
Cyanobacterial blooms are not a new worldwide phenomenon [13,14,15]. However, reports of these events have increased dramatically since 1960, mainly in freshwater bodies [8,16,17,18,19,20]. According to records, tropical and subtropical regions are the most affected [21], associated with their higher temperatures [22]. Cyanobacterial blooms are becoming more frequent and intense, and they are expected to affect areas that do not currently suffer from the problem [23,24].
Cyanotoxins produced by some species can affect aquatic and terrestrial biota, including humans [25]. Their release into the environment varies throughout the organism’s life cycle, being between 8 and 15 times higher in senescent populations [26]. Once the toxin is released, it can persist in the environment from a few days to months. In eutrophic freshwater systems, potentially toxic cyanobacterial species tend to be dominant [27,28,29,30,31].
In Argentina, the massive development of algae and cyanobacteria is quite common in reservoirs employed as drinking water supplies [32] Several studies concluded that the general trophic status of reservoirs in the country varies between mesotrophic and eutrophic, thus promoting the development of blooms [33,34,35].
To test the influence of weather conditions on the presence of cyanobacterial blooms in El Limón, this work conducted an in-depth analysis of two consecutive warm periods in the tropical reservoir. In addition, we characterized the composition and abundance of the phytoplankton and examined the morphological variations of the most frequent species.
2. Materials and Methods
2.1. Study Area
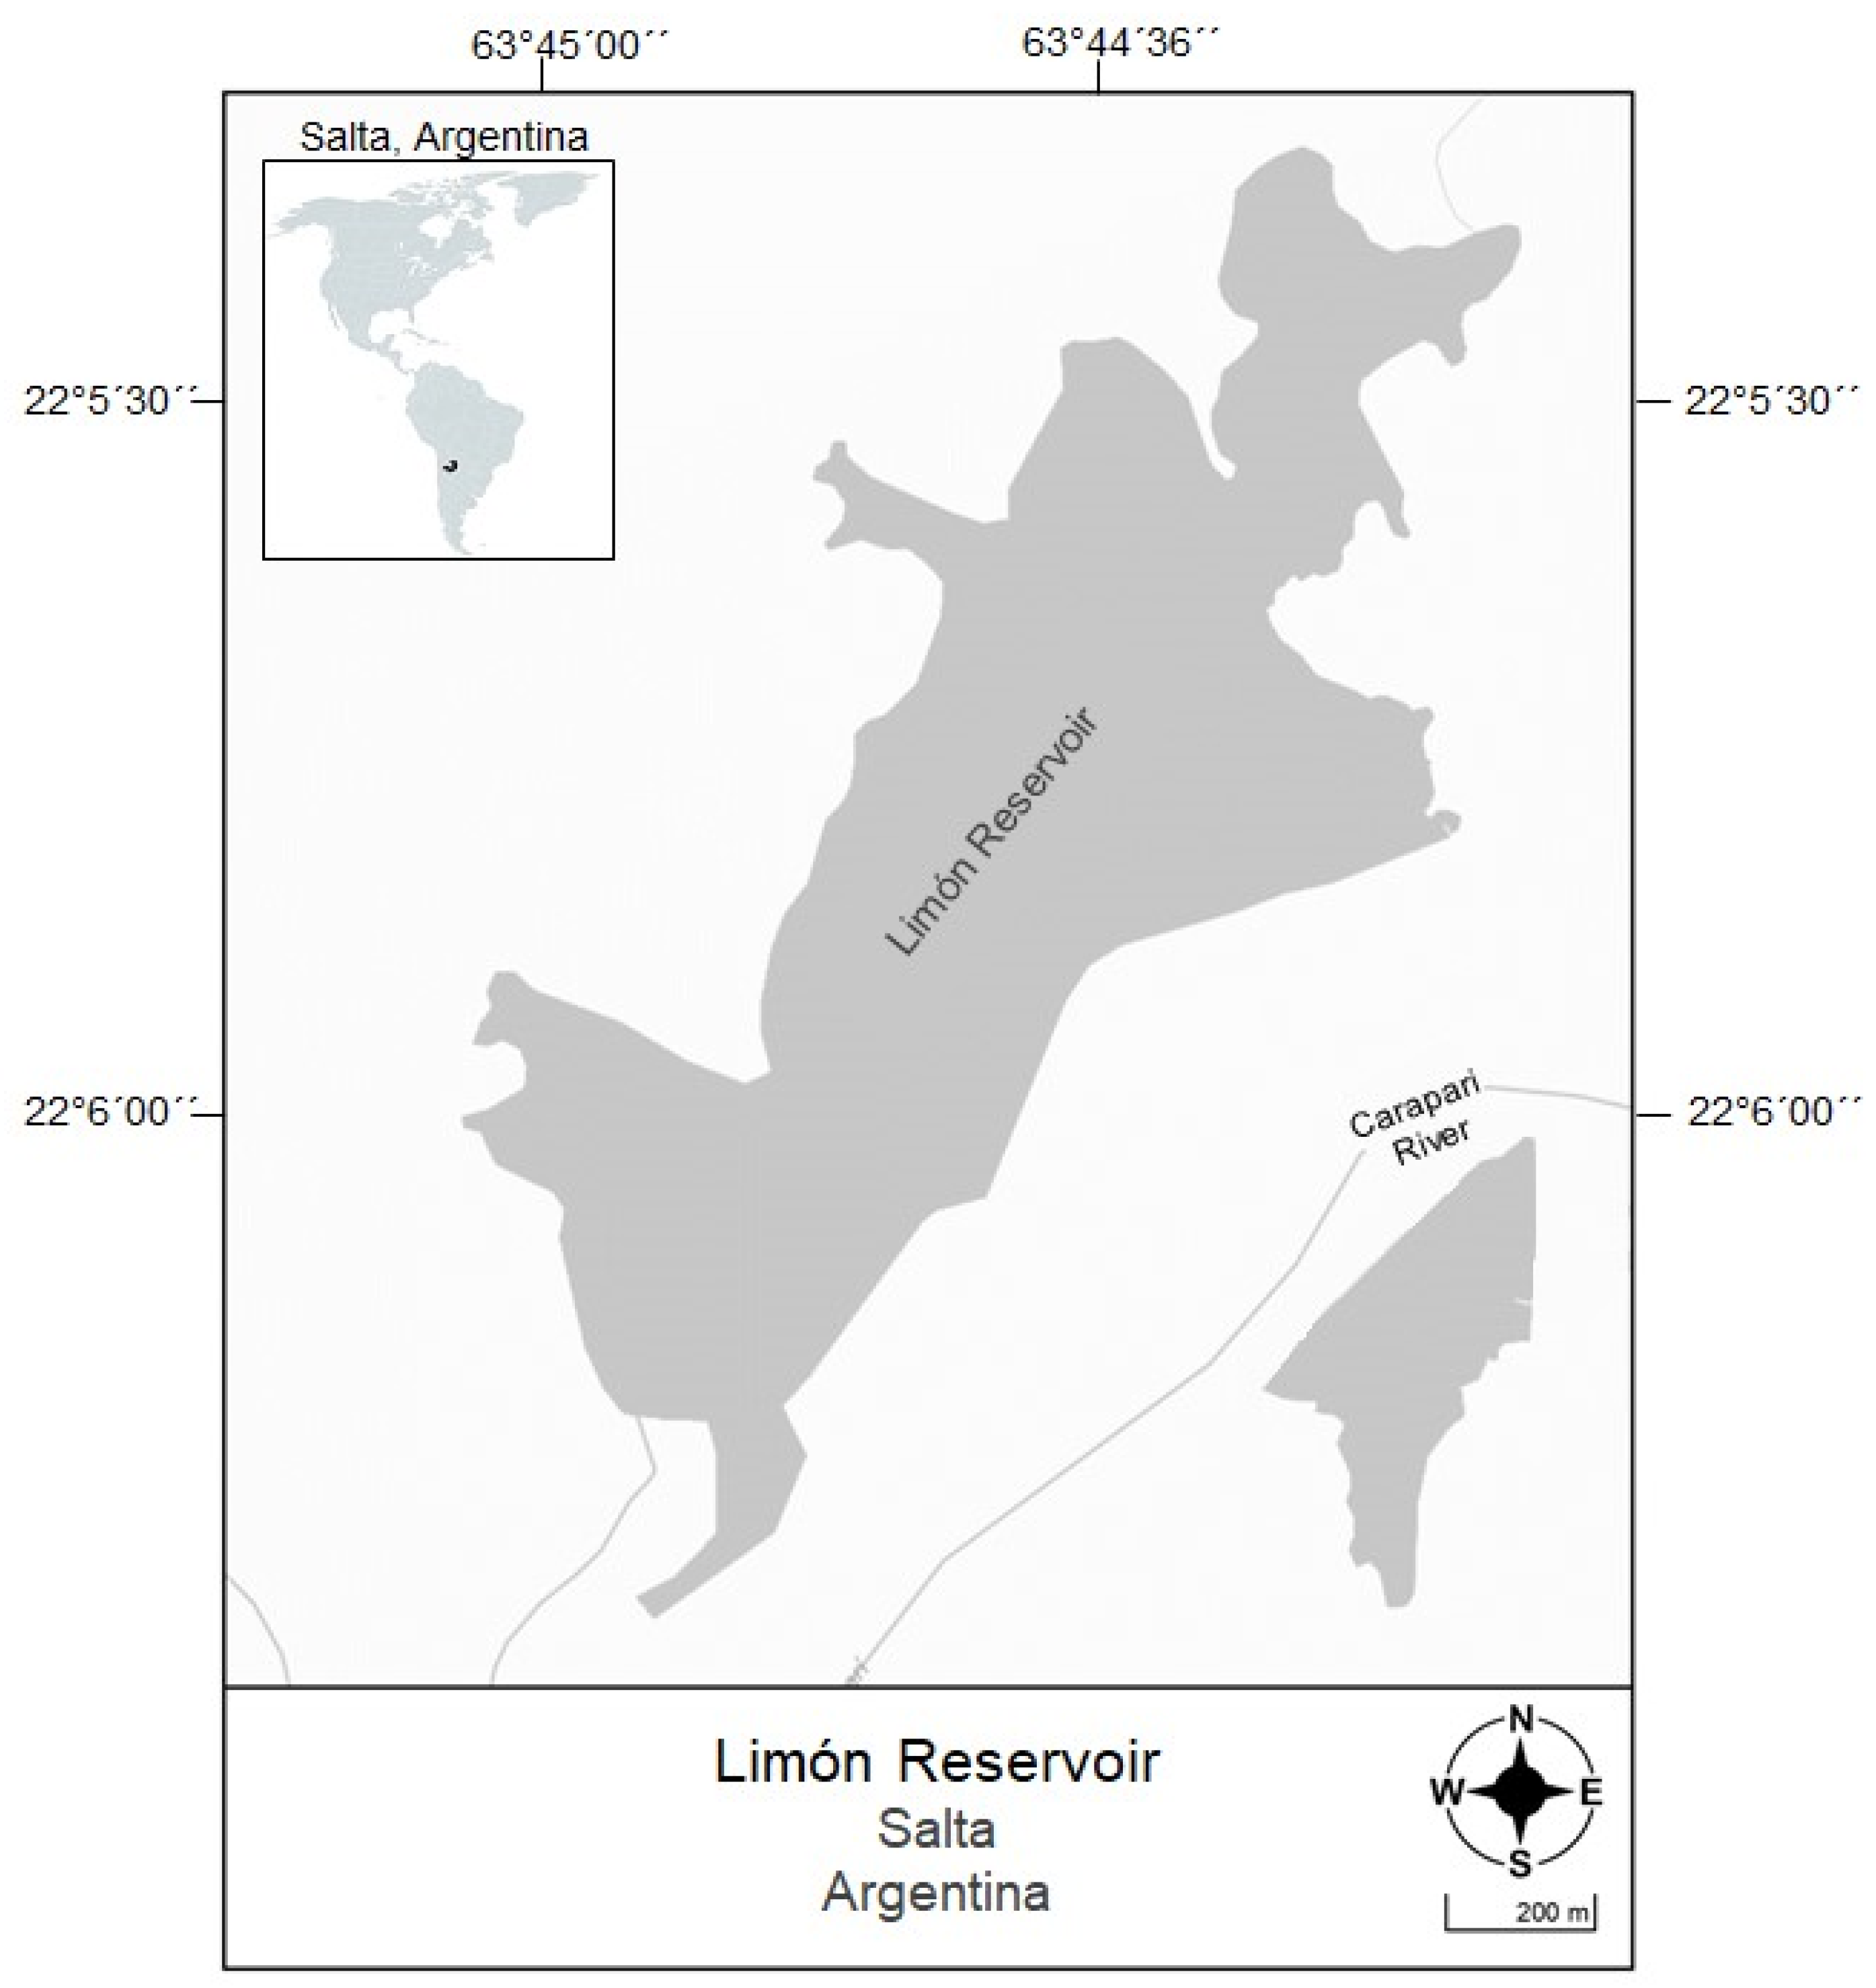
El Limón is a shallow (average depth of 5 m) and generally eutrophic reservoir that has experienced cyanobacterial bloom events in recent years [36]. It is located in northern Argentina, Province of Salta (22°6′12.29″ S; 63°44′21.34″ W) (Figure 1). The area, with a tropical climate, has an annual rainfall of 970 mm and an average annual temperature of 21 °C, although the maximum temperatures exceed 45 °C in summer. In the dry season (April–September), the reservoir presents stratification of the water column, which is subsequently interrupted by the rains. The El Limón reservoir is mainly used for water potabilization and consumption, but also for recreation and fishing, among other activities.
2.2. Sampling and Methodology
During two consecutive warm periods from 2018 and 2019, monthly samplings were conducted from September to December. Motivated by the appearance of intense blooms, an additionally sampling was carried out in January 2020.
During each sampling, the total depth and thermal profile of the water column were studied, measuring the temperature every 0.5 m of depth. The samples for measuring the physical and chemical parameters were obtained using a Van Dorn sampler at a depth of 1 Secchi and refrigerated 24 h until analysis. The samples were always taken in the same location, approximately 10 m from the shore, in one of the deepest parts of the reservoir.
2.3. Environmental Parameters
In each sampling, the in-situ temperature (°C), electrical conductivity (µS/cm), pH, and dissolved oxygen (mg/L) were measured using an Orion multiparameter sensor. Turbidity (NTU) was measured using a HACH brand turbidimeter and water transparency was measured using a Secchi Disk. Total solids, dissolved solids, and suspended solids (mg/L); true and apparent color; soluble reactive phosphorus (mg SRP/L); nitrates, nitrites and ammonium (mg N/L); alkalinity (carbonates, and bicarbonates) (mg CaCO3/L); hardness (calcium and magnesium) (mg CaCO3/L); and chemical oxygen demand (COD) (mg O2/L) were determined in the laboratory, according to APHA [37] standardized techniques. Chlorophyll a (CL-a) was determined using the modified Scor-Unesco technique [38].
The daily temperature and precipitation and historical records between 1981 and 2010 were provided by the National Meteorological Service of Argentina (SMN). The average daily temperature and accumulated rainfall were calculated considering 14 and 30 days and 6 and 8 months prior to sampling in order to assess short-term weather effects.
2.4. Phytoplankton and Microscopic Observation
For phytoplankton analysis, samples for qualitative analysis were collected subsurface using a 20 µm mesh net and fixed with 4% formaldehyde. Quantitative analysis was carried out on samples taken at the depth of 1 Secchi disk, fixed in acidified Lugol’s solution, and stored at 4 °C until analysis. After sedimentation for 24 h, counting was carried out following the method by Utermöhl [40]). A maximum error of 20% was accepted for the most abundant taxa [41]. In all cases, at least 300 individuals were counted (Supplementary Material Table S3). The results were expressed in cells/mL. Organisms without cellular content were not considered in the count. The species were identified using the following specialized bibliography: [42,43,44,45,46,47], among others. Cyanobacterial species were classified based on their morphological similarity, considering the following morphotypes [48] (Chorus & Welker, 2021): unicellular, colonial, non-heterocytous filament (species that do not produce heterocytes), and heterocytous filament (heterocytous cyanobacteria).
In this work, we considered a bloom to occur when the abundance of at least one cyanobacterial species exceeded 5000 cells/mL. Considering the total abundance of each cyanobacteria, each sample was classified based on the framework of alert levels and guidance levels for drinking and recreational waters, proposed by the WHO [21,48,49].
2.5. Morphological Analysis of the 4 Dominant Species of Cyanobacteria
The morphological analysis of the bloom-forming cyanobacteria was performed with the most frequent and/or abundant species in both years: Raphidiopsis mediterranea (RM), Cylindrospermopsis raciborskii (CYL), Aphanizomenon gracile (AG), and Aphanocapsa delicatissima (AD). The morphological data of a minimum of 20 individuals were taken for each month and species. For all the species found, the length (L) and width (W) of the filament and width and length of a vegetative cell in the middle zone of the filament were measured. In the case of colonial species, the smallest (D1) and largest (D2) diameters of the colony were also measured. The “width/length” index of the filament (W/L) was calculated and considered as an indicator of the development and performance of the organism to capture light (i.e., higher values denote greater aptitude) [50] In the case of colonial species, the smaller diameter/larger diameter ratio of the colony (D1/D2) was calculated. For the order Nostocales, the number of heterocytes and akinetes per vegetative cell were counted when present, and the relative frequency of heterocytes and akinetes was calculated based on the number of vegetative cells present. Density and biovolume (µm3/mL) were calculated as estimators of cyanobacterial abundance and biomass [51].
2.6. Statistical Analysis
Descriptive statistics were performed on the environmental and biological variables of the species. The correlations between physical, chemical, biological, and meteorological variables were evaluated using Spearman coefficients, performing the analyses by year or using all the data. The environmental variables were compared between years using the Student’s t-test and the Mann-Whitney U test for those variables that did not meet the normality and/or homogeneity requirements. In all cases, InfoStat v.2008 software was used to perform the statistical analysis.
3. Results
3.1. Meteorological Conditions
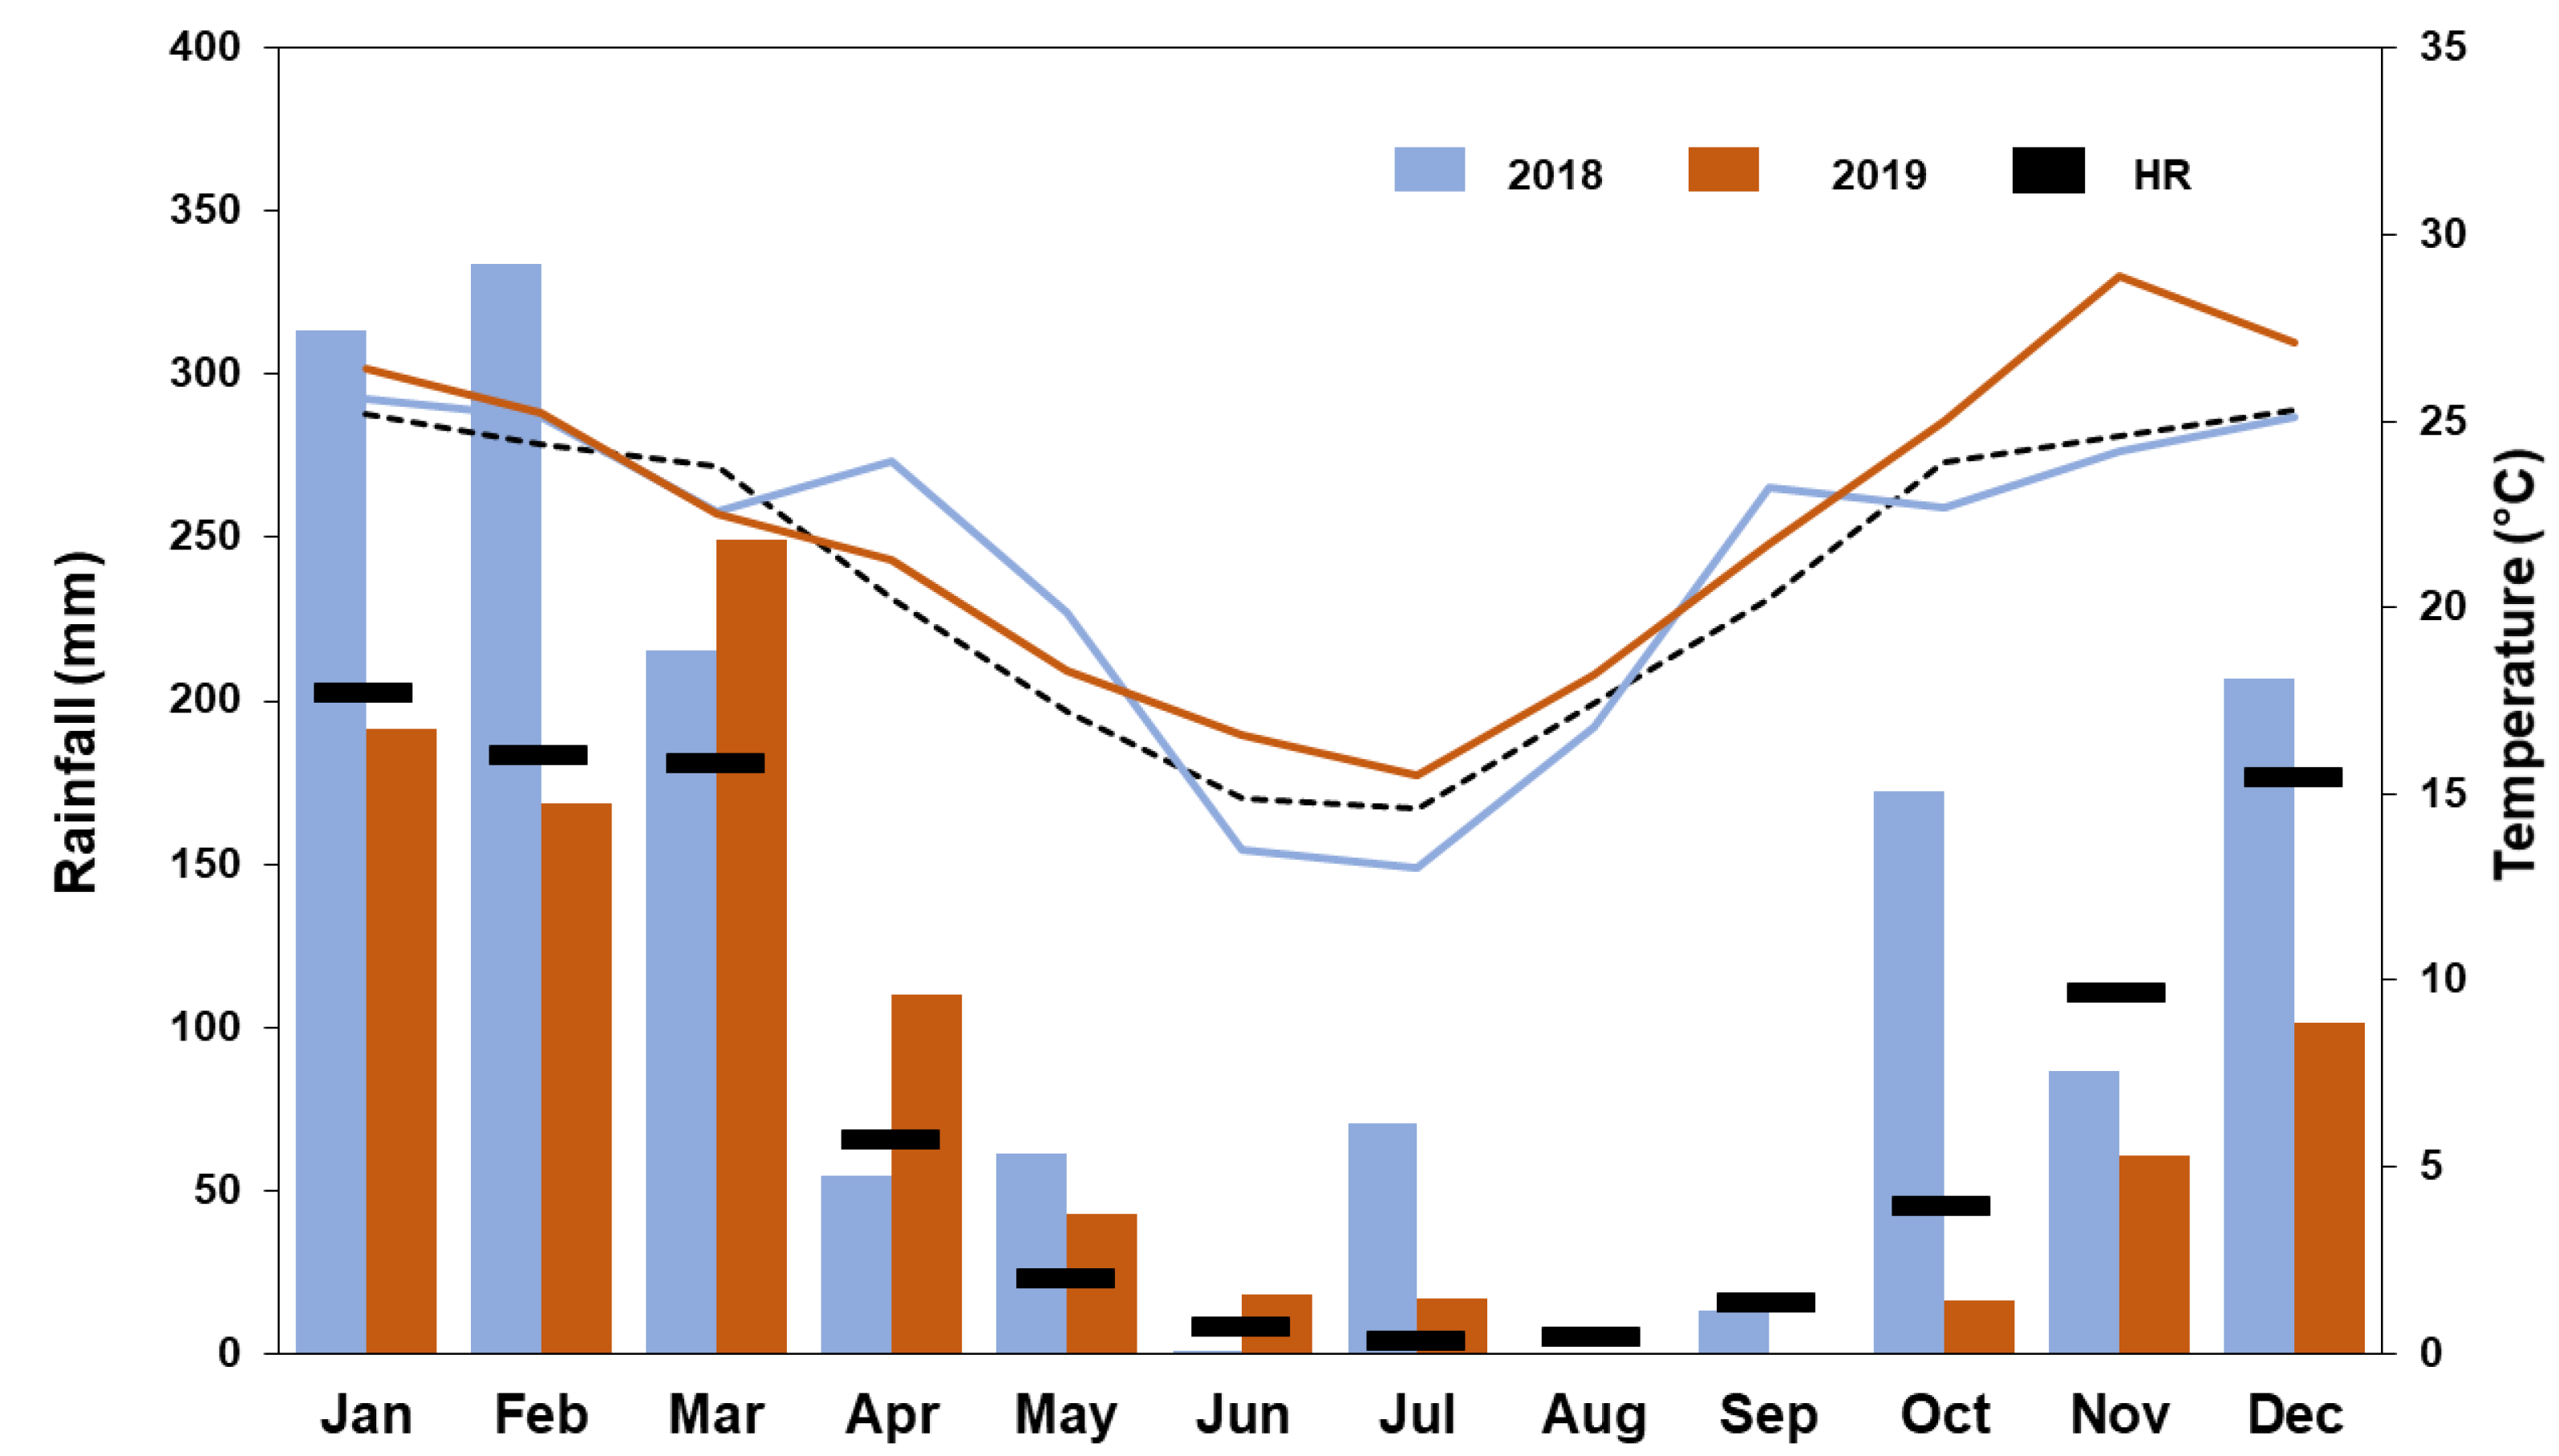
In general, precipitation was higher in 2018 than in 2019. The maximum of both sampling periods (September–December) was recorded in the month of December, being 2-fold higher in December 2019 than in December 2018. Considering the average historical records from 1981 to 2010, the historical monthly precipitation was exceeded in the months of October and December 2018, while they were always below historical monthly precipitation levels in 2019. The temperatures ranged between 23.2 and 25.6 °C in 2018, and between 21.7 and 28.9 °C in 2019, without significant differences among them (U = 16, p = 0.685). In 2018, the average monthly temperature was only exceeded in September, while the historical monthly temperature records were exceeded in all months in 2019 (Figure 2).
3.2. Physical and Chemical Variables
The depth of the water column in the El Limón reservoir ranged between 2.4 and 3.38 m in 2018 and between 1.8 and 2.6 m in 2019. The water temperature and transparency did not show differences between years (U = 12; p = 0.114 and U = 24.5; p = 0.085, respectively).
Table 1 details the main physical and chemical parameters measured in the reservoir in both years. Only total solids (t = 2.54, p = 0.0439), alkalinity (t = −7.84, p < 0.002), and bicarbonate content (t = −11.4, p < 0.0001) presented significant differences.
The mean concentration of dissolved oxygen in 2018 was 9.7 (±2.06) mg/L, while it was 8.64 (±1.23) in 2019. In both years, supersaturation was observed in 75% of the samples (samples were taken between 10 and 12 a.m.).
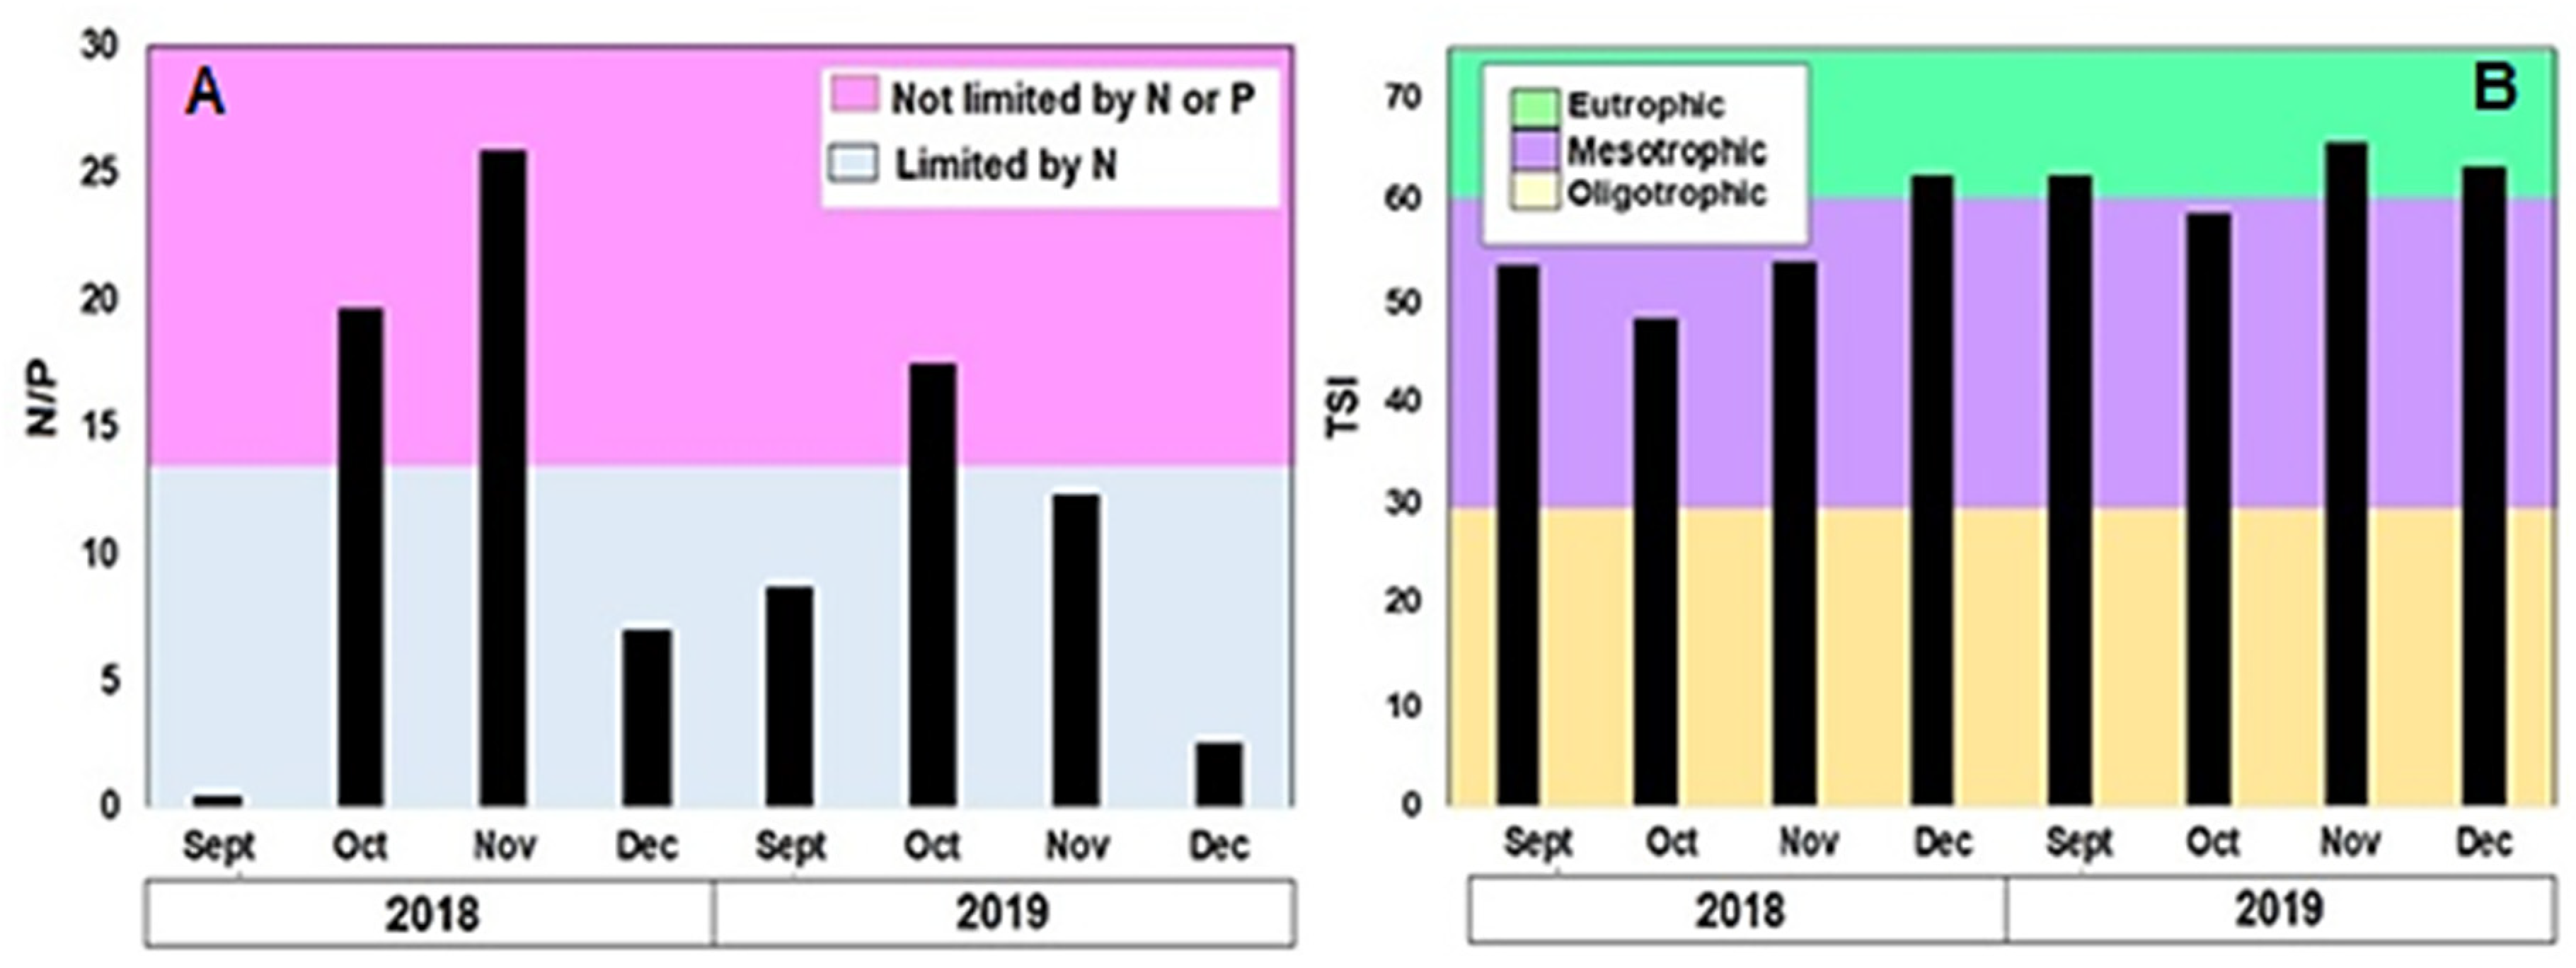
The possible limitation by nutrients was evaluated with the N/P ratio. In 2018, 3 samples presented nitrogen deficiency (Sept, Oct, and Dec), while the Nov sample did not present limitations. In 2019, 3 samples presented limitation by N (Sept, Nov, and Dec) and the Oct sample did not present any deficiency (Figure 3A). Phosphorus limitation was not observed in any case.
The trophic state of the reservoir in 2018 was predominantly mesotrophic, with the eutrophic state observed only in the month of December. In contrast, the eutrophic state was observed in 3 of the 4 samples in 2019, with the mesotrophic state observed in October 2019 (TSI = 58.68). No significant difference in TSI was observed between years (U = 11.5; p = 0.085); the maximum values were 62.51 and 65.46 for 2018 and 2019, respectively (Figure 3B).
3.3. Phytoplankton
The mean abundance of phytoplankton was higher in 2019 with 129,129 (±52,313) cells/mL than in 2018 with 27,330 (±10,664) cells/mL (U = 10, p = 0.028). The mean abundance of cyanobacteria was much higher in 2019 with an average of 125,132 (±53,117) cells/mL, compared to 2018 with an average of 23,736 (±10,265) cells/mL (U = 10; p = 0.028). The maximum abundance of cyanobacteria was observed in December 2018 with 42,045 cells/mL, while the maximum was observed in September 2019 with 175,888 cells/mL. The average relative abundance of cyanobacteria in spring-summer of 2018 was 86%, while it was 96% in the spring-summer 2019, with samples reaching 99% in November 2019. The other groups presented low abundances. Chlorophytes reached an average representation of 13% during 2018, while they did not exceed 2% in 2019. The other groups (Bacillariophyceae, Euglenozoa, Myozoa [syn. Dinophyta], Cryptista [syn. Cryptophyta], and Xanthophyta) never reached values above 5%.
Species richness was much higher in 2018 with 81 species than in 2019 with 46 species. Among the total species, only 36 were shared between years. Cyanobacterial richness included 31 species in 2018 and 17s species in 2019. In both years, the orders Synechococcales and Nostocales dominated with 21 and 7 species in 2018 and 8 and 6 in 2019, respectively. Among the observed cyanobacterial species, 81% and 82% corresponded to species that possibly produce toxins in 2018 and 2019, respectively. In the case of chlorophytes, 34 and 15 species were observed in 2018 and 2019, respectively. The diatoms presented a richness of 10 and 6 species in 2018 and 2019, respectively, predominantly pennate species. The list of species recorded in the reservoir is detailed in Supplementary Material Table S1A,B.
3.4. Cyanobacteria
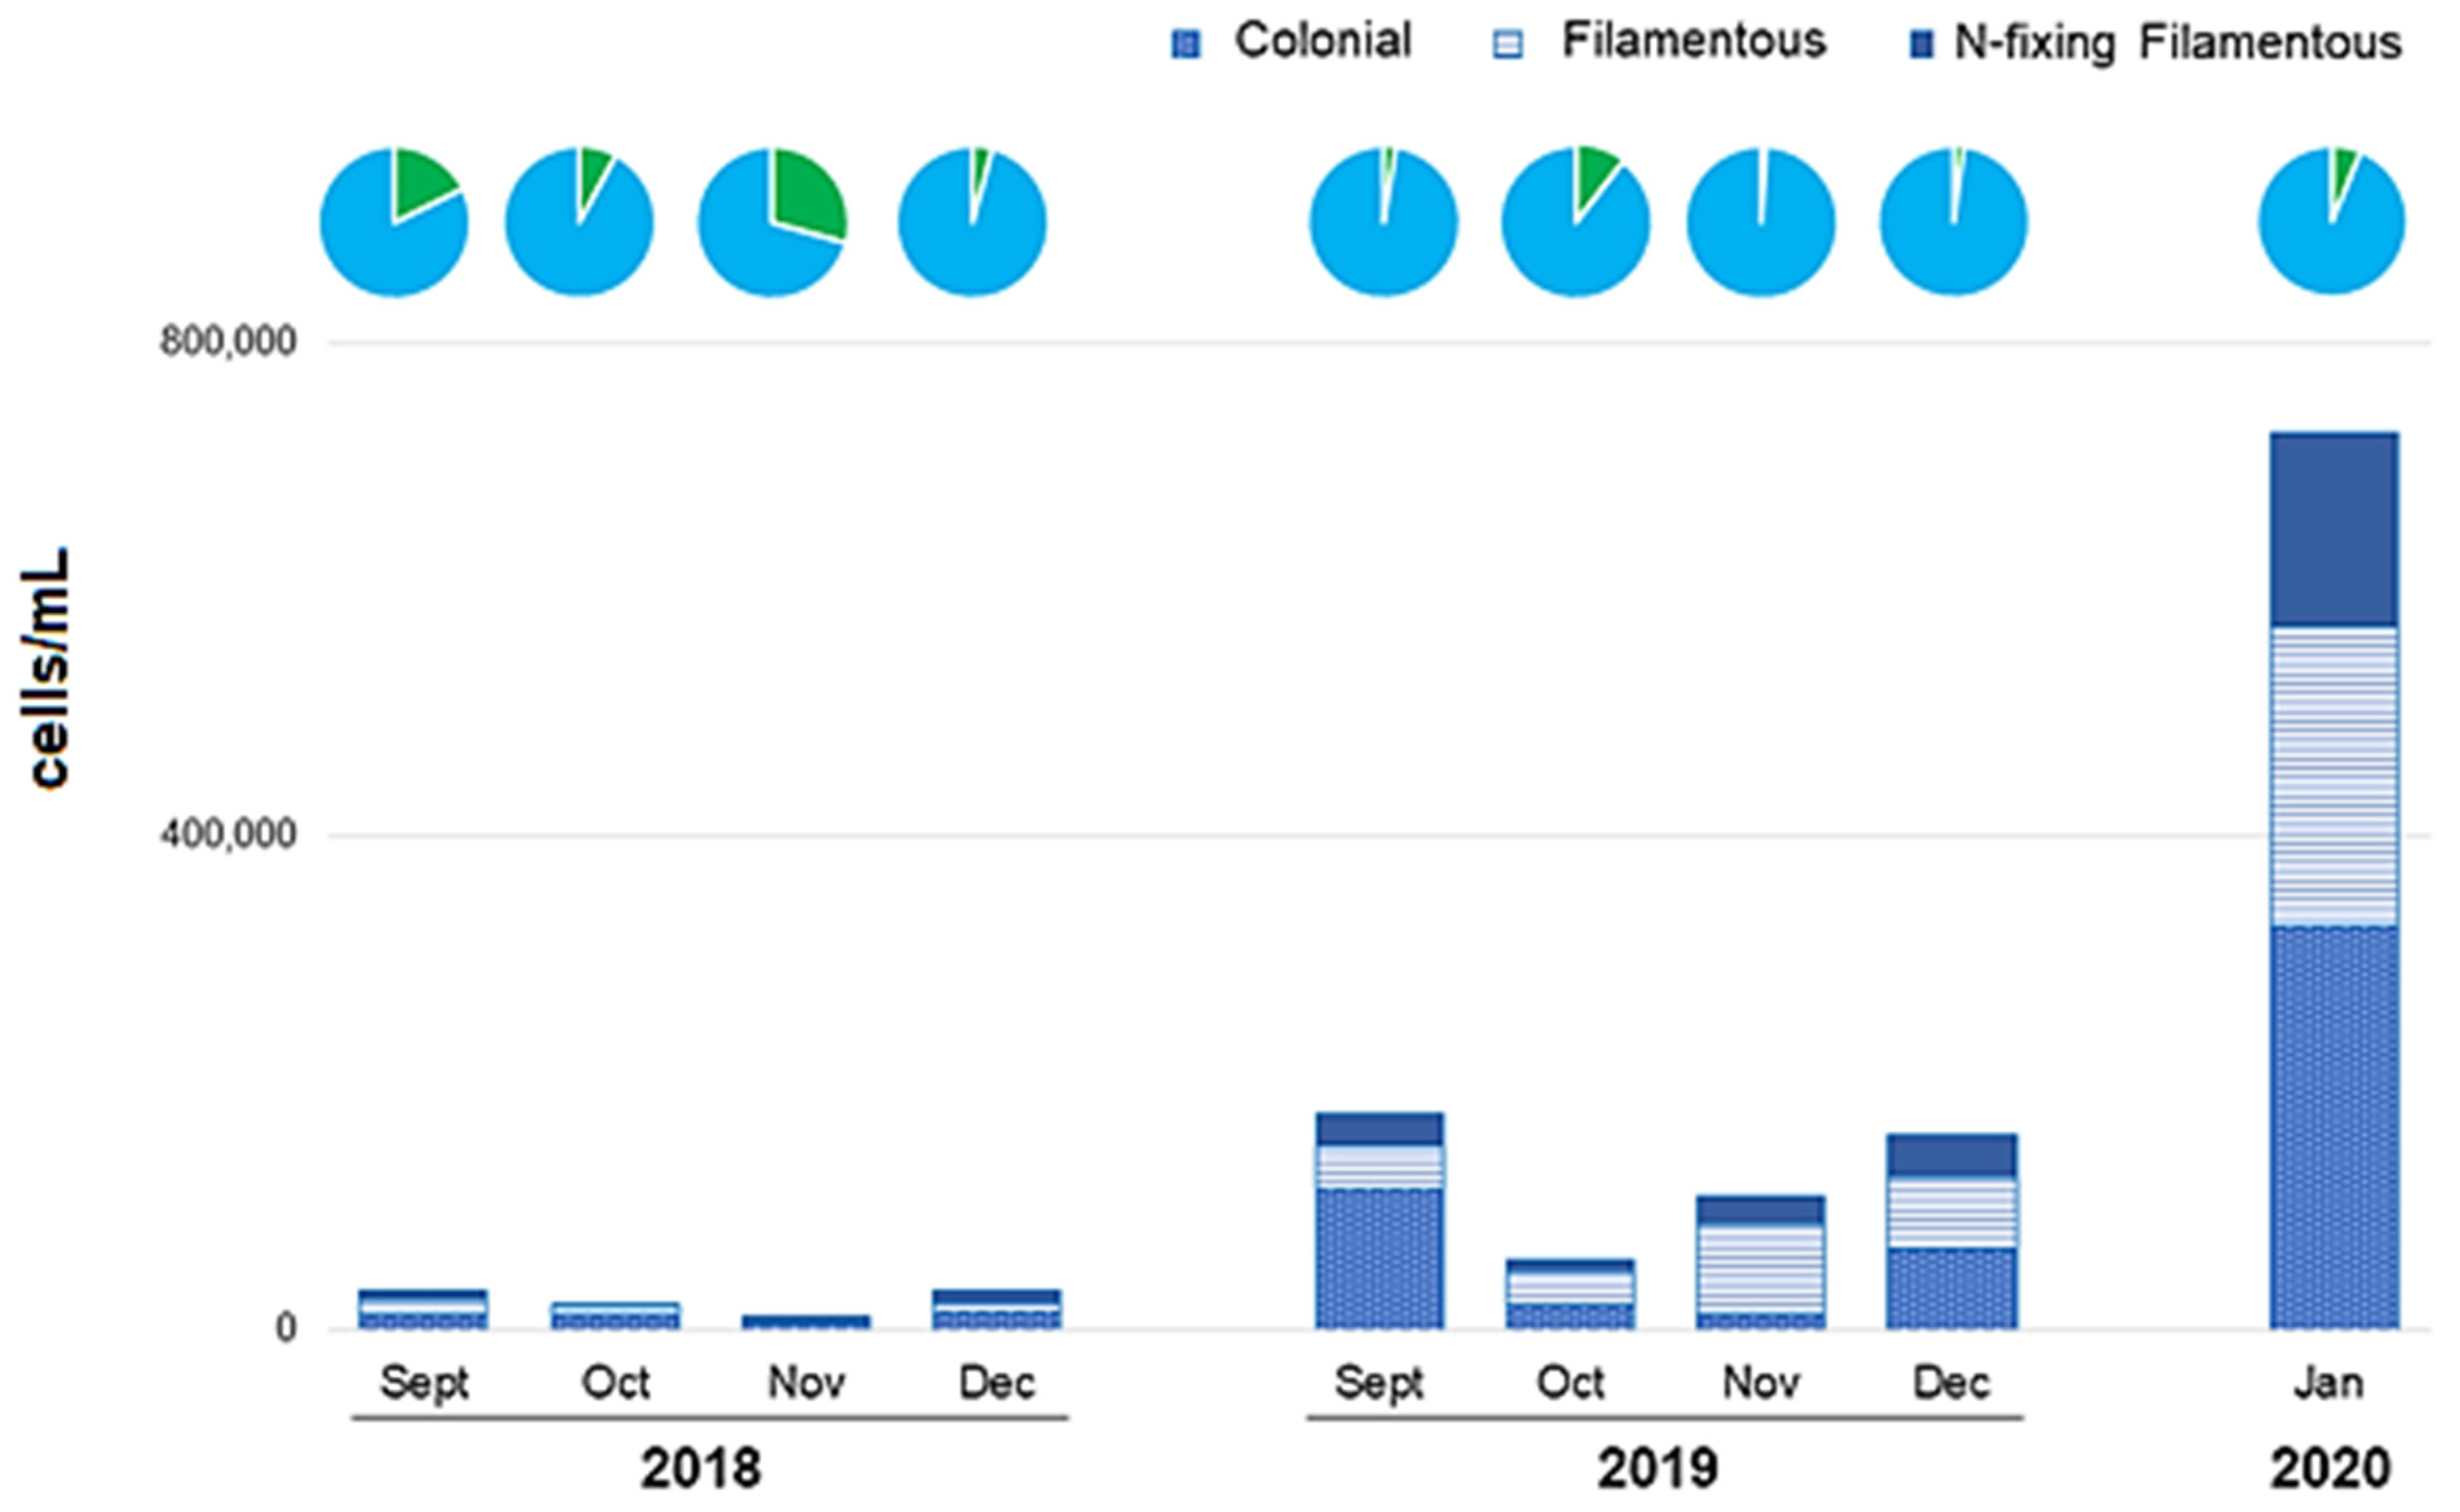
According to different levels of organization, colonial cyanobacteria predominated in 2018 with an average abundance of 11,222 (±3838) cells/mL represented by 13 species, followed by non-heterocytous filament cyanobacteria (4 species) with an average of 6824 (±4603) cells/mL, and finally, heterocytous cyanobacteria (7 species) with 5679 (±3554) cells/mL (Figure 4).
In 2019, colonial forms (5 species) dominated with a mean density of 53,030 (±46,803) cells/mL, followed by filamentous forms (7 species) with 48,596 (± 22,095) cells/mL, and finally, heterocyte-forming filamentous forms (5 species) with an average of 23,251 (±10,296) cells/mL (Figure 5). In both years, the main species of each subgroup were: Aphanocapsa delicatissima, Merismopedia elegans, and Woronichinia compacta (colonial); Raphidiopsis mediterranea and Raphidiopsis curvata (non-heterocytous filament); and Aphanizomenon gracile and Cylindrospermopsis raciborskii (heterocytous cyanobacteria).
The unicellular species presented very low abundances in both years, finding only 2 species in all samples: Synechococcus elongatus and Synechocystis aquatilis.
3.5. Correlation Analysis between Cyanobacterial Abundance and Physical, Chemical, and Metereological Variables
The correlations between the abundances of cyanobacteria and physical, chemical, and meteorological variables were calculated using Spearman coefficients (Table 2). The abundances of cyanobacteria showed significant correlations with the following physical and chemical parameters: total solids, Secchi disk, alkalinity, bicarbonates, and nitrites. In the case of total solids, they were negatively correlated with the abundance of cyanobacteria and colonial bacteria, while the Secchi disk was negatively correlated with all subgroups. Alkalinity was positively correlated with all subgroups except colonial species. Nitrites positively correlated with total cyanobacteria, colonial species, and heterocytous cyanobacteria.
In the case of the meteorological parameters, it was generally observed that temperature had a possible positive influence while precipitation had a possible negative influence on cyanobacterial blooms. The possible effects became more evident when considering the average temperature (6 and 8 months) and accumulated precipitation. Total cyanobacteria, non-heterocytous filamentous, heterocytous cyanobacteria, and colonial species were positively correlated with mean temperature, while only cyanobacterial abundances were negatively correlated with cumulative rainfall.
3.6. Blooms
During the 2018 sampling period, blooms were observed in 3 of the 4 samplings, while blooms were observed in all samplings in 2019. In all cases, the blooms were dominated by the species Aphanocapsa delicatissima, Raphidiopsis mediterranea, and Aphanizomenon gracile. In the sampling carried out in January 2020, 9 species of cyanobacteria exceeded 10,000 cells/mL and all of the species registered were potentially toxic.
Based on the total abundances of cyanobacteria in 2018, 3 samples were classified as Alert 2 or moderate (abundance 20,000–1000,000 cells/mL) and one sample was classified as Alert 1 or low (<20,000 cells/mL), corresponding to the month of November 2018. In 2019, 3 samples were classified as late alert (>100,000 cells/mL) and one as moderate alert. The additional sampling carried out at the end of January corresponded to a late alert with 728,640 cells/mL of cyanobacteria.
Bloom-Forming Species
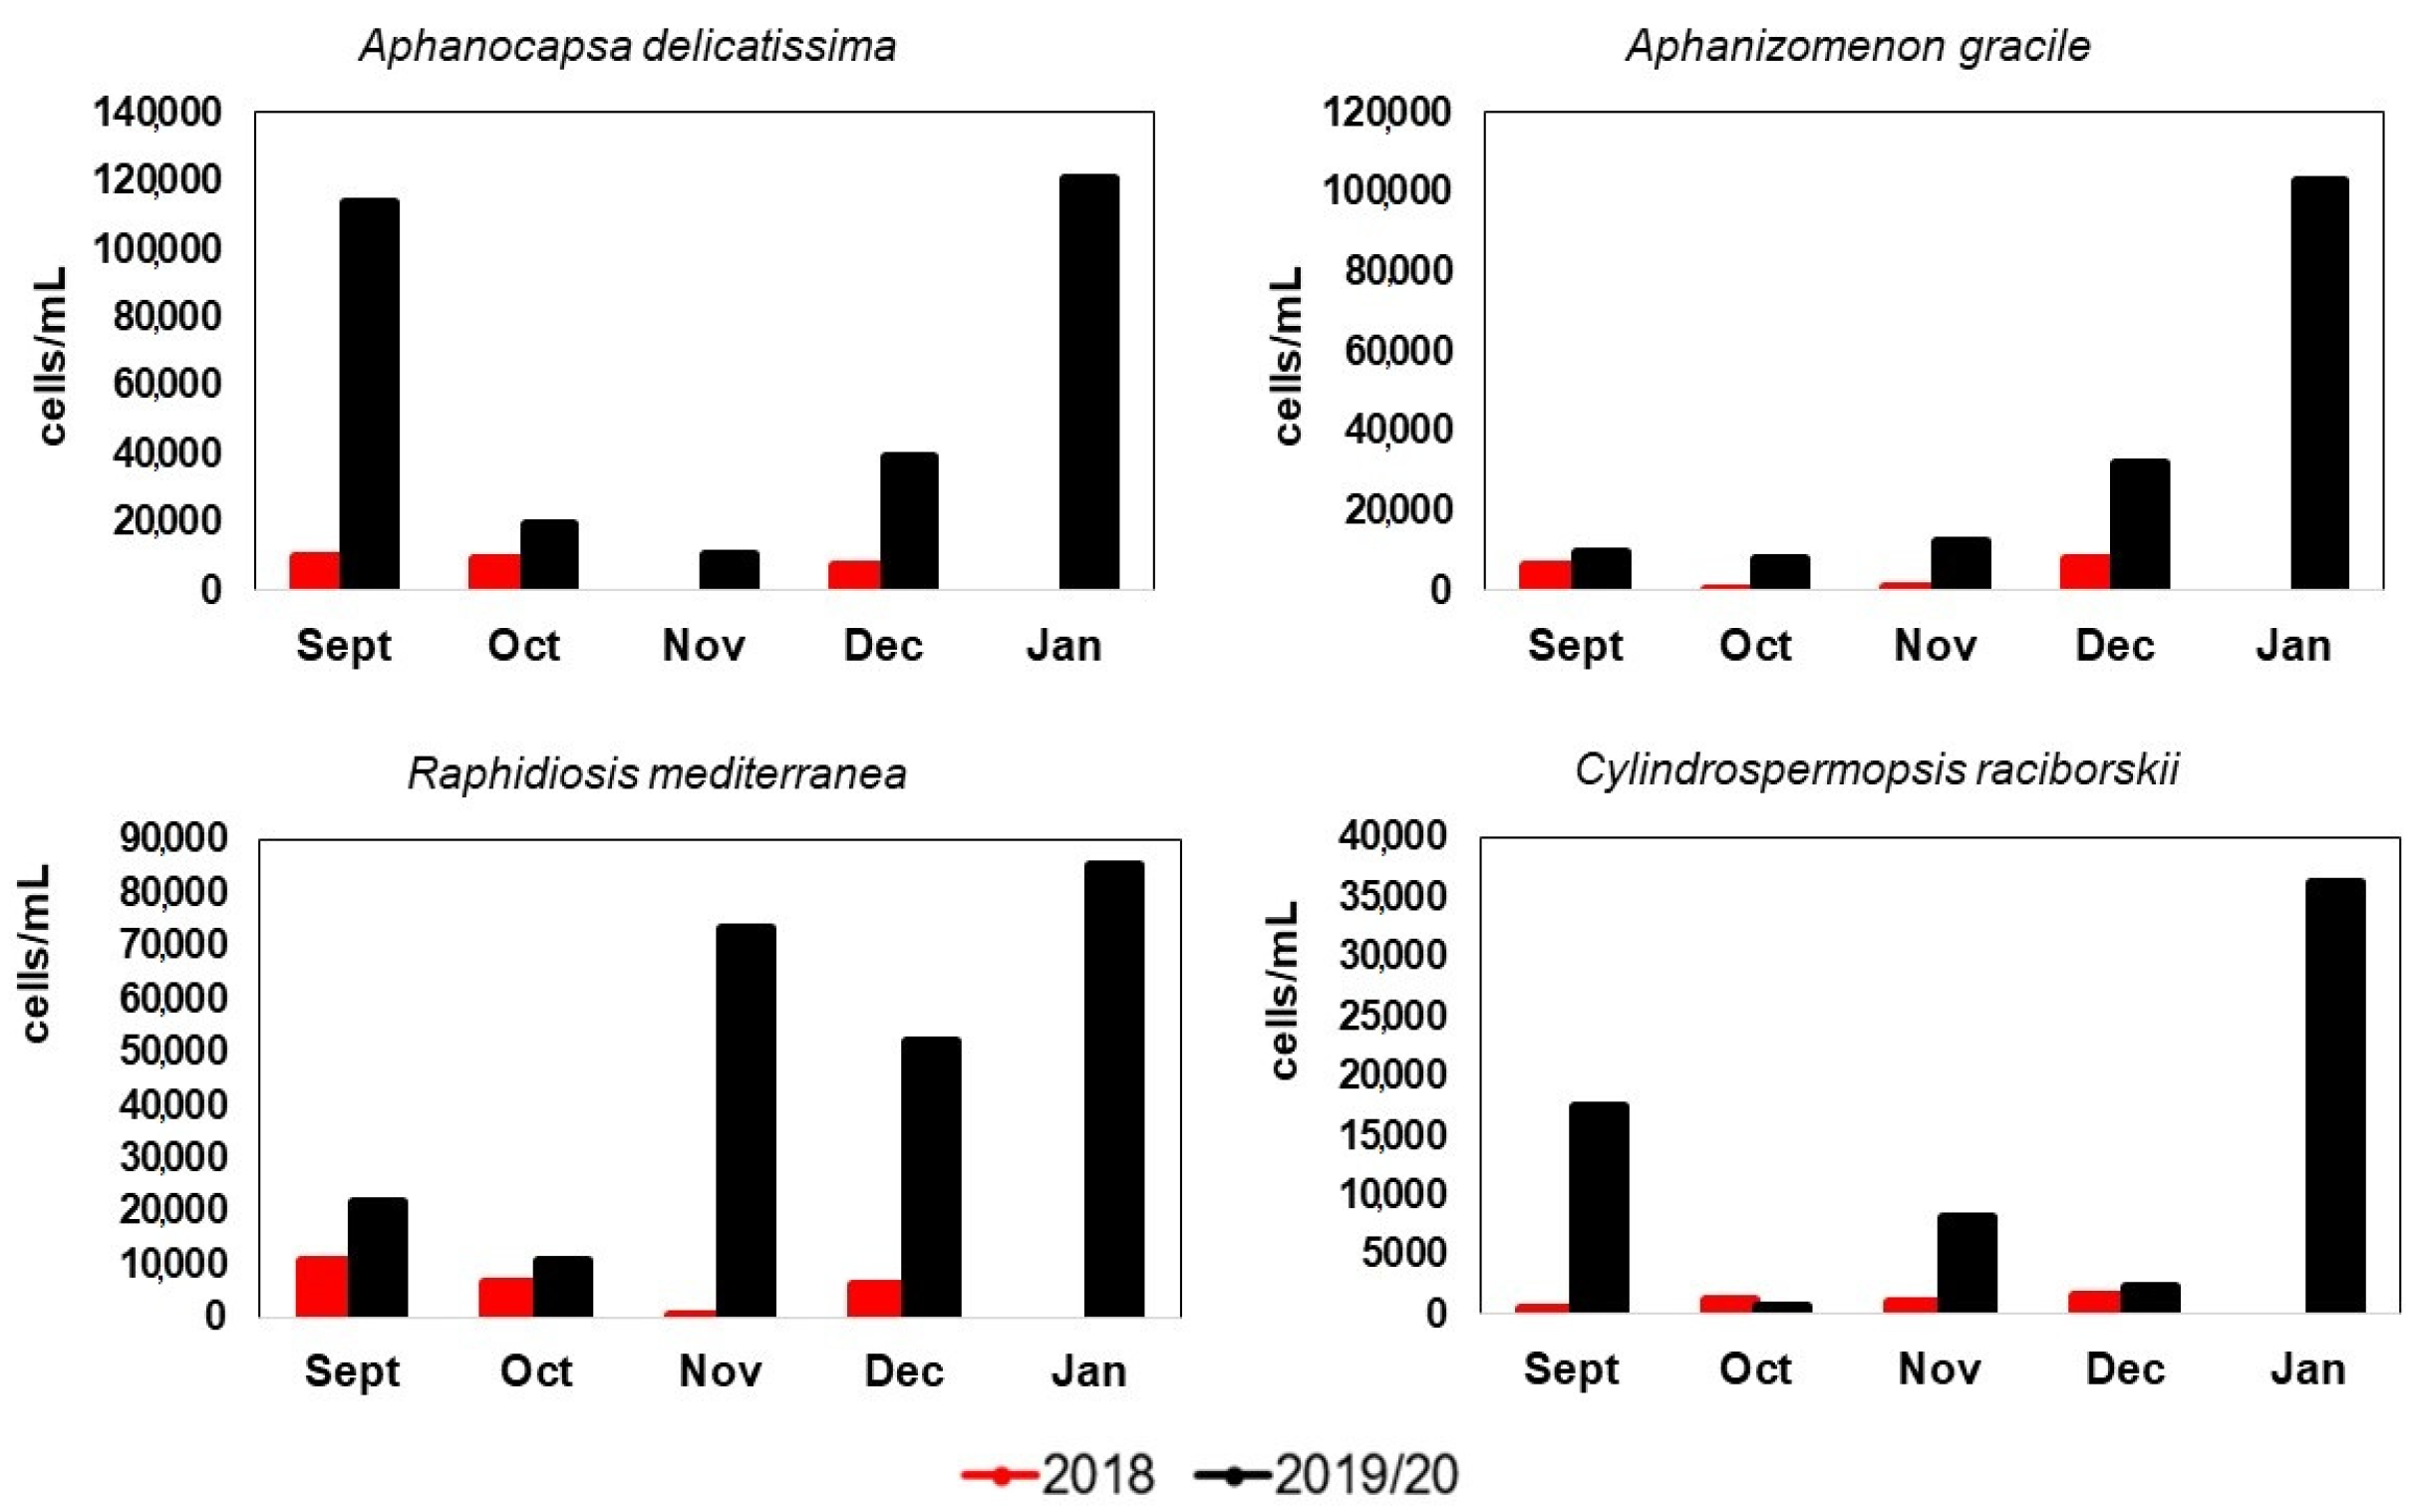
The abundance and morphological variation of 4 species of bloom-forming cyanobacteria present in both years were analyzed. The abundance (cells/mL) of the selected species varied throughout the samplings, with a marked increase towards 2019. Abundances differed between years for Aphanocapsa delicatissima (U = 10, p = 0.028) and Raphidiopsis mediterranea (U = 10, p = 0.028), while Cylindrospermopsis raciborskii and Aphanizomenon gracile did not show significant differences between years.
The most abundant species in both years was Aphanocapsa delicatissima (AD), with a mean of 6827 (±4661) cells/mL in 2018 and 45,810 (±46,942) cells/mL in 2019. In the case of filamentous species, the most abundant was Raphidiopsis mediterranea (RM) with 5913 (±4180) cells/mL in 2018 and 39,435 (±28,511) cells/mL in 2019. For RM, the abundances increased by 566% between years, while for AD the increase was 571% between years (Figure 5).
All species showed higher biovolumes in 2019; however, only RM and AG showed significant differences between the years (U = 10, p = 0.028). Biovolume was not correlated with any physical or chemical variable in any of the two years for the 4 species considered.
3.7. Morphometric Parameters
A total of 620 individuals were measured, considering the length and width of the filament, the presence of specialized cells (heterocyte/akinete), and the ratio between width and length (A/L). For colonial species, the smallest diameter (D1) and largest diameter (D2) were measured and their ratio (D1/D2) was calculated. The results are shown in Supplementary Material Table S2.
The filamentous species showed variations in both length and width. In December 2018, the 3 species showed a significant reduction in the width and especially length of the filaments, corresponding to the rainiest month of both years. In contrast, in the driest months such as September 2018 and September 2019, the sizes remained close to the average values. The frequency of heterocytes relative to vegetative cells was stable for both AG and CYL during both years. In the case of akinetes, these were only detected in the AG species, with a very low proportion in both years.
For AG, the greatest variation in the length of the filament presented in 2019, with a minimum of 47.3 μm and maximum of 340 μm, while the greatest variation in width was observed in 2018, with a minimum of 2.24 μm and maximum of 5.82 μm. In general, individuals were “longer” in 2019, although “less wide”. For CYL, less variation in terms of the length of the filaments was presented in 2019, with the greatest variation observed in the first sampling and even in January 2020. The widths remained stable in both years. RM showed greater variations in length in 2019, with a minimum of 36.8 μm and maximum of 180.2 μm.
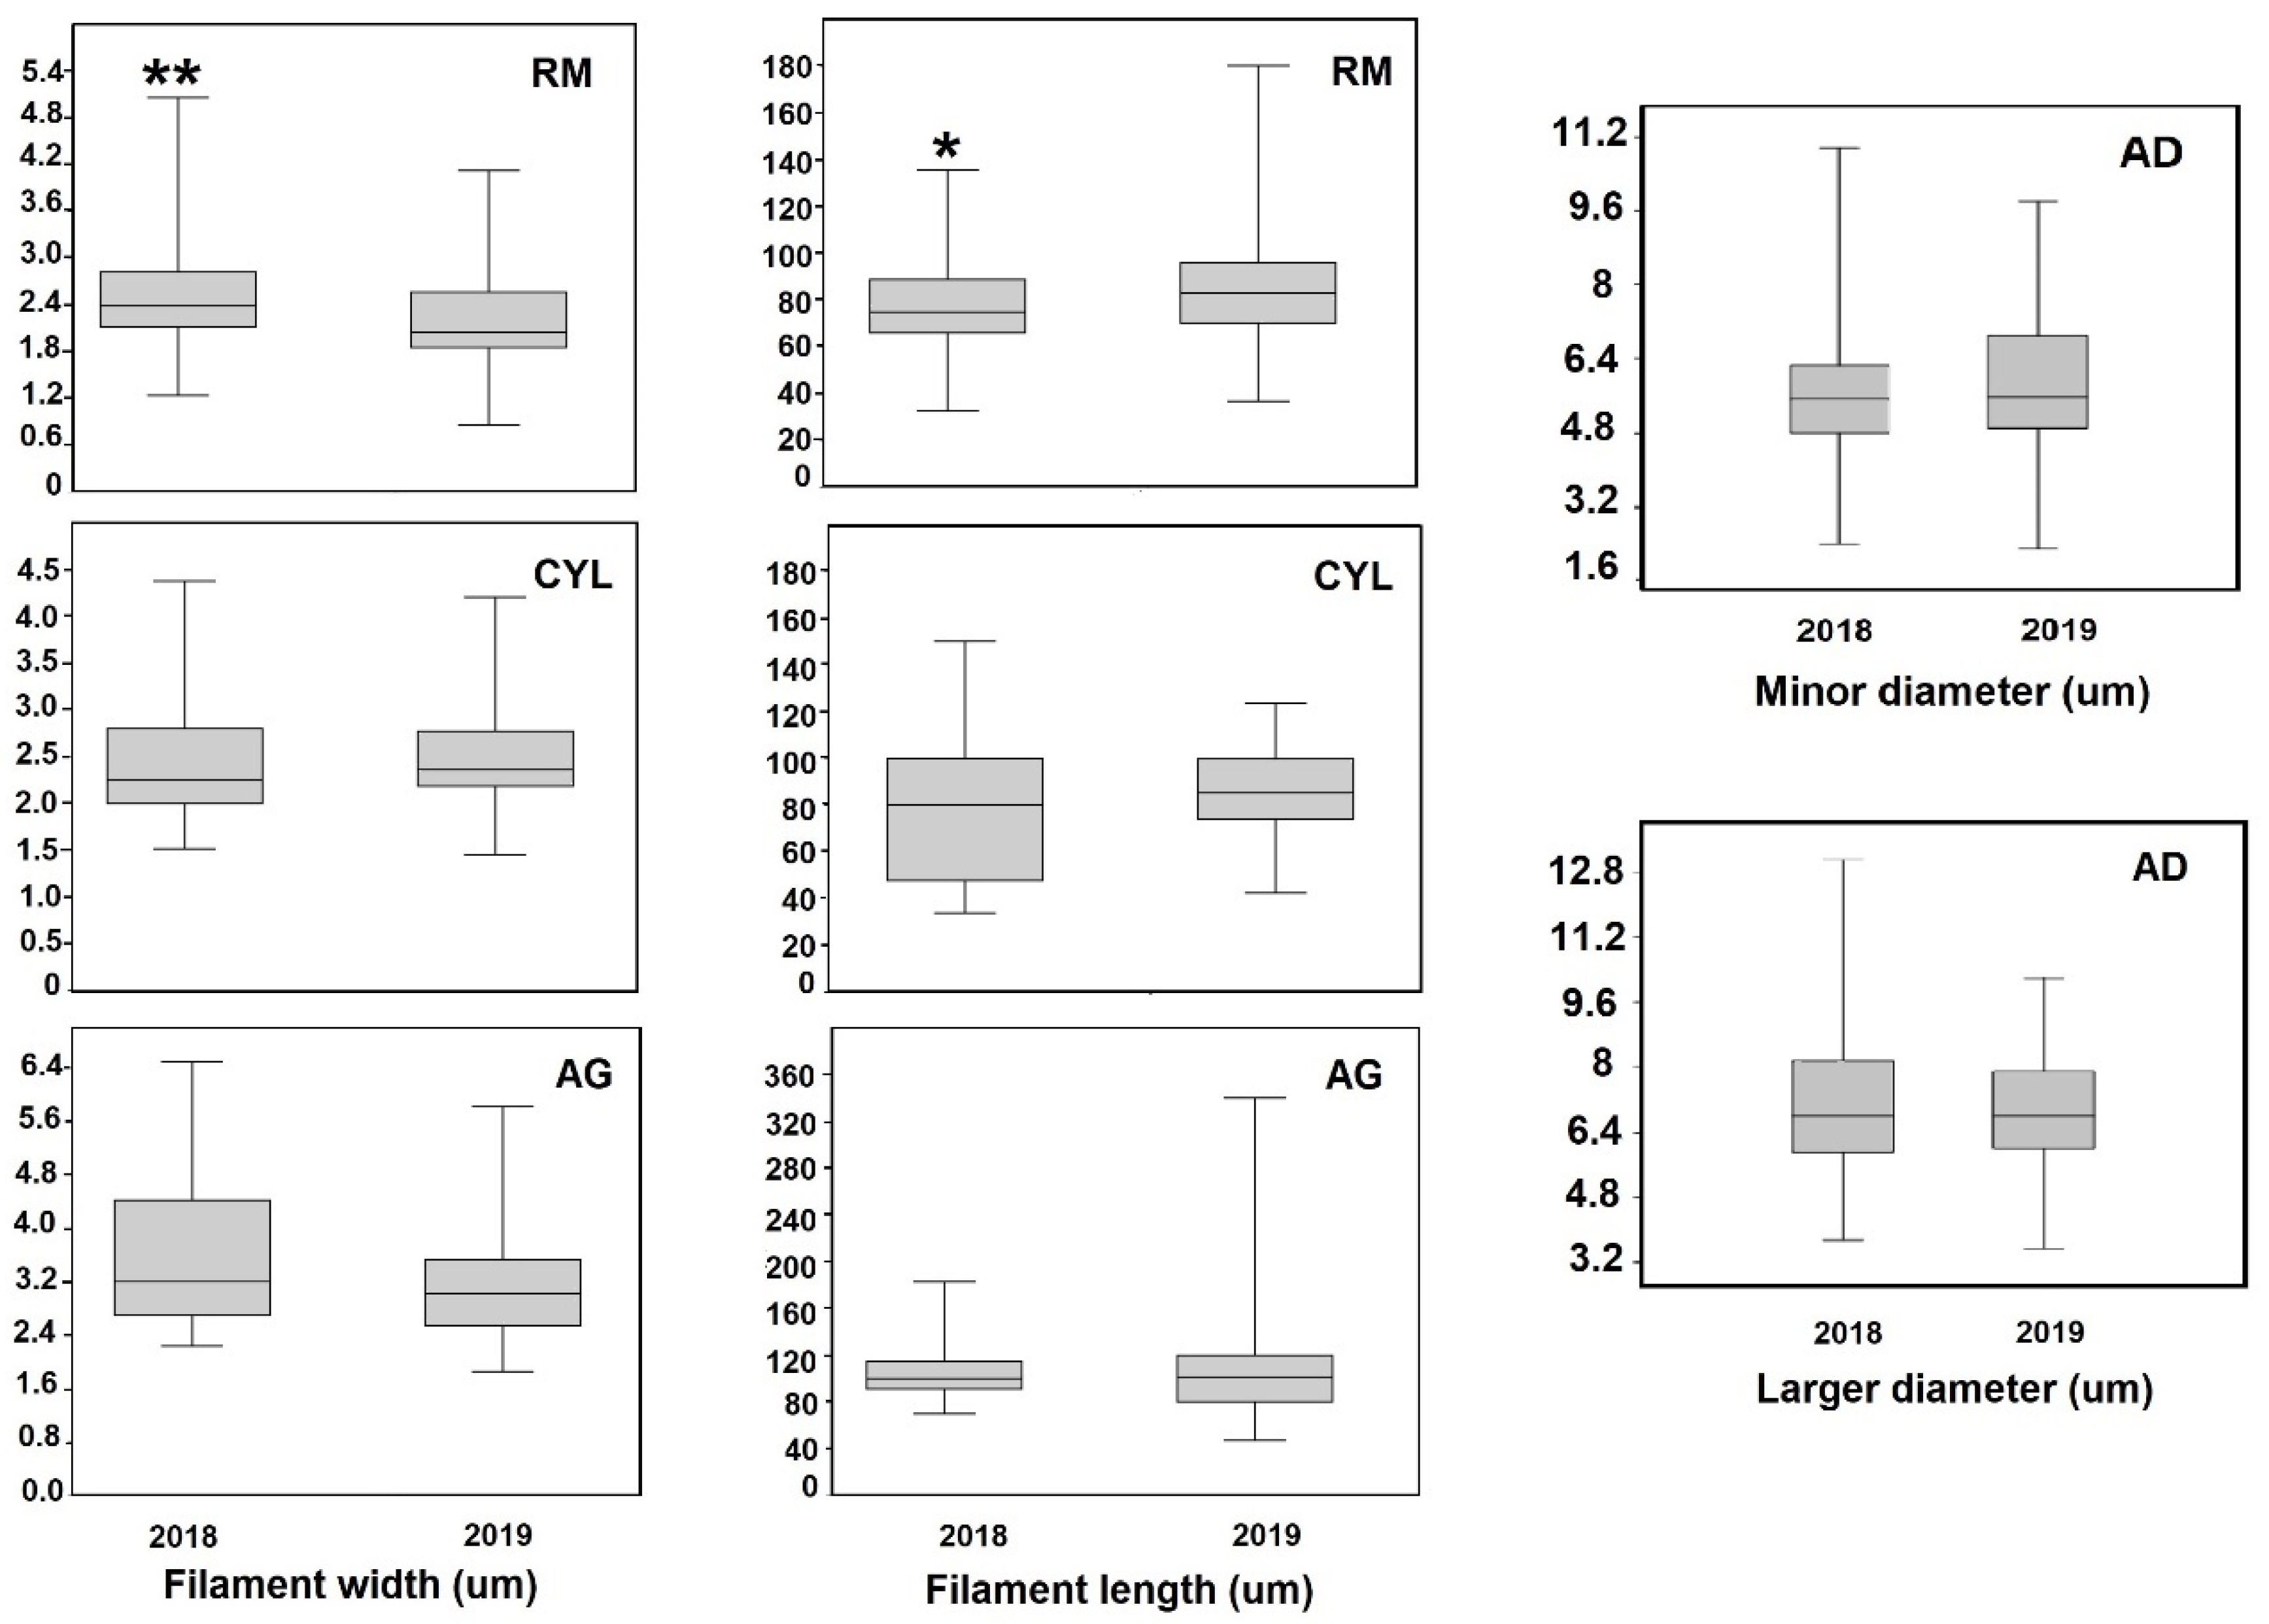
Considering the analyzed species, only RM showed significant differences between years for both filament width (U = 4248, p = 0.002) and filament length (U = 5589, p = 0.044). On the other hand, AD, CYL and AG did not show differences between 2018 and 2019 considered in relation to any morphometric parameter (Figure 6). Considering January 2020 blooms with respect to the 2019 samples, CYL differed in filament width (U = 795, p = 0.007), as did RM (U = 3079, p < 0.0001).
The physical and chemical variables that were correlated with the measured morphometric variables generally differed between species. On the one hand, the variables that most influenced the development of filamentous species were total solids, nitrites, and nitrates, all of which had a negatively influence on the width and length of the filaments. In the case of colonial species, it was observed that, unlike filamentous species, the total solids, turbidity, nitrites, and nitrates positively correlated with the diameter of the colonies. The frequency of heterocytes in AG was positively correlated with pH and negatively correlated with COD. Regarding the meteorological variables, only the 14-day average temperature favored the CYL width/length relationship, while 8-month accumulated rainfall was negatively correlated with the length of the RM filament (Table 3).
4. Discussion
Our results seem to indicate that variations in temperature and rainfall could influence the abundance of cyanobacteria in the short term, as well as greater or lesser development of their filaments and colony diameters.
Meteorological variability and anthropic activities directly influence phytoplankton, which can manifest as changes in the community structure, causing the disappearance of sensitive species or the appearance and success of harmful species that can release toxins [52,53] (Many species of cyanobacteria are capable of successfully adapting to changes and increasing their abundance over the rest of the phytoplankton, so this group can be considered a good indicator of climate change and its effects [54].
In this work, a possible favorable effect on cyanobacterial blooms was observed considering the average temperature of the previous 6 months, while a possible limiting effect of rainfall was observed considering the previous 8 months. The El Limón reservoir is strongly affected by cyanobacterial bloom events, in line with what has been reported in other reservoirs worldwide [32,55,56,57,58,59].
2019 was an unusually warm year in the region, surpassing the historical records of the last 30 years and the greatest development of cyanobacterial blooms was recorded in El Limón to date. An increase in abundance above 500% was observed between 2018 and 2019 for some species (i.e., Raphidiopsis mediterranea, Aphanizomenon gracile, among others). Additionally, when considering 2020, the percentage increase in abundance rose to 1000%.
2018 was rainier than 2019, so the stability of the water column would have been interrupted, with greater turbidity due to external contributions by runoff. The synergic effect of these factors probably acted as a limiting factor for the development of cyanobacteria that year. In this sense, the results show that the accumulated rainfall was negatively correlated with the abundance of cyanobacteria and, particularly, for some species such as Raphidiopsis mediterranea. Moreover, the total solids and water transparency also correlated negatively with the abundance of cyanobacteria, and an increase in the turbidity of the water may have been directly related to rainfall.
Cyanobacterial blooms observed in El Limón in 2019–2020 would also have limited the abundances of the other species, probably in an event of interspecific competition, since the species richness of 2019 much lower than the species richness registered in 2018. However, the most abundant species of cyanobacteria were present in both years. This may be associated with the adaptive and competitive capacity of cyanobacteria with respect to other algal groups. Although the species richness of other groups (i.e., Chlorophyta and Bacillariophyta) was important in both years, the abundances never exceed that of cyanobacteria, with the relative abundance of the latter being greater than 70% in all samples.
All the recorded blooms were composed of potentially toxin-producing species, such as Raphidiopsis mediterranea, Aphanizomenon gracile, Aphanocapsa dellicatissima, Cylindrospermopsis raciborskii, Raphidiopsis curvata, and Merismopedia elegans, among many others. Bloom events in this reservoir are dominated by species that present high abundances and frequency, that is, their presence could be considered stable. In general, most cyanobacterial blooms recorded in Argentina are monospecific, especially in intense events [32,60]; however, the El Limón reservoir showed multispecific events with a great variety of species. The results indicate that most of the time (8 of the 9 samplings carried out), the reservoir exceeded the early warning guideline level for safe drinking and recreational waters proposed by the WHO [21,49]. This means that the population was clearly exposed to an imminent risk, especially due to the use of the reservoir for the provision of drinking water.
The sensitivity of cyanobacteria to factors such as nutrient availability and temperature depends on the trophic status of the water body and the taxon considered [61]. Previous studies failed to explain the intensity of blooms in a broader ecological approach in Argentinean reservoirs, although water transparency was identified as a predictor variable [32]. In this work, the abundances of all cyanobacterial morphotypes were negatively correlated with water transparency in El Limón, as O’Farrell et al. [32] predicted.
We did not observe a significant relationship between the N/P ratio and total abundance of cyanobacteria. In 2019, in which blooms were drastically accentuated, the El Limón Reservoir was mostly eutrophic. Where nutrient concentrations exceed the absorption capacity of phytoplankton [62], it is possible that other variables will have greater importance in the establishment and dominance of cyanobacteria; for example: light, stability of the water column, or residence time [62,63]. In fact, in eutrophic tropical reservoirs, evidence suggests that light intensity is a more relevant factor for heterocytous cyanobacterial abundance than the N/P ratio or trophic status [64]. In any case, the influence of the N/P ratio on the growth of cyanobacteria has not been confirmed. Some authors have proposed that low N/P ratios are beneficial for cyanobacteria [15,65,66,67], while others have suggested that the abundance of heterocytous cyanobacteria does not always occur at low N/P ratios [12,68].
In El Limón, species of the order Nostocales were dominant during this study. Recently, the geographic distribution of some species of Nostocales has expanded enormously, and some authors claim that this could be due to climate change and increasing temperatures [69,70]. For example, this trend has been studied for the species Cylindrospermopsis raciborskii, which in the past was only a tropical or subtropical species, but is now being reported in temperate regions [69,71]. In the case of the genus Aphanizomenon, its expansion is expected due to global warming, including historical cold zones on the European continent [72]. The potential production of toxins by species belonging to this order and their increased distribution worldwide makes the analysis of these species highly relevant.
Filamentous and colonial species from the reservoir responded differently in this work, in terms of their morphology. A higher concentration of total solids limited the width and length of the filaments in 3 filamentous species, which coincided with the results for abundance. Conversely, a higher solids and turbidity content favored larger colony sizes of Aphanocapsa delicatissima. This could indicate that colonial species are better adapted to the turbid conditions of the reservoir than filamentous species. The nutrient levels influenced CYL and AD, with the results indicating that the filaments were smaller but the colonies were larger at higher concentrations of nitrites and nitrates. Some authors consider that the length of the filament can be a more useful indicator of environmental conditions and their variations than the differentiation of specialized cells [73,74]. Species with short filaments and little variation in size show dependence on nitrogen fixation, whereas species with long filaments and highly variable sizes are associated with high availability of nutrients and fixation is not necessary [50]. In the case of El Limón, greater variation in filament size was observed in the two heterocytous species while Raphidiopsis showed more stable mean values.
In the case of the rate or frequency of the appearance of heterocytes per vegetative cell, we only observed a possible positive influence of pH and a negative influence of COD for AG species. Meteorological variables seemed to have no influence on the differentiation of specialized cells for the species considered. In the case of CYL, the presence of heterocytes has been observed in conditions of low and high availability of nitrogen; therefore, the differentiation of heterocytes does not seem to be determined by nitrogen deficit in this species [75,76] It is expected that the higher the frequency of heterocytes per vegetative cell, the greater the nitrogen fixation capacity, with each facilitating better competition against the rest of the cyanobacteria.
The very low frequency of akinetes found for Aphanizomenon gracile could be due to the El Limón reservoir permanently achieving favorable characteristics for bloom development [77] In general, the factors that induce the development of akinetes vary according to the species considered. It has been shown that for some Nostocales, the environmental factors that lead to differentiation are low light intensity [78] or a deficiency or excess of phosphates [79,80,81]. In our case, P limitation was not observed, while light intensity was not evaluated.
Although in this study we focused on meteorological variables and physical and chemical parameters, biological interactions among species in the community would have relevant implications and should be further analyzed [82].
5. Conclusions
Short-term meteorological variability seems to have an important influence on the establishment of cyanobacterial blooms in El Limón as a shallow tropical reservoir. Temperature was correlated with variables such as the length and width of filaments and the abundances of both heterocytous and non-heterocytous species. Rainfall seemed to limit the abundance of cyanobacteria, while in the driest year (2019), blooms were favored by the greater stability of the water column. The external contribution of N and P by runoff caused by rainfall did not seem to correlate with the biomass of cyanobacteria. In samplings with intense blooms, a relationship between the length and width of the filaments of the species considered and the concentration of nitrogen and total solids was observed, and abundances were correlated with the 6- and 8-month average temperatures. The effects of an increase in average temperature and/or variations in historical rainfall will have rapid and tangible direct effects on shallow water reservoirs.
Supplementary Materials
The following are available online at https://www.mdpi.com/article/10.3390/w15020302/s1, Table S1A: title, Video S1: Species recorded in this study in El Limón during 2018, 2019 and 2020; Table S1B: Cyanobacteria species recorded in this study in El Limón during 2018, 2019 and 2020; Table S2: Morphometric variables measured for AG, AD, CYL and RM; Table S3: Additional information on the rigor of chamber counts according to the Utermöhl technique.* The maximum count error was calculated using the t-student distribution considering the number of fields per camera and the abundances of the most frequent species according to the criteria proposed by Venrick 1978.
Author Contributions
Conceptualization, F.S.A.D.; methodology, F.S.A.D.; software, F.S.A.D.; validation, L.B.M. and S.M.M.; formal analysis, F.S.A.D. and V.L.L., investigation, F.S.A.D. and S.M.M.; resources, L.B.M. and C.N.B.; data curation, F.S.A.D. and V.L.L., writing—original draft preparation, F.S.A.D. and V.L.L.; writing—review and editing, F.S.A.D. and V.L.L.; visualization, F.S.A.D. and V.L.L.; supervision, L.B.M. and C.N.B.; project administration, S.M.M., L.B.M. and C.N.B.; funding acquisition, V.L.L., S.M.M. and L.B.M.. All authors have read and agreed to the published version of the manuscript.
Funding
This research was funded by CONICET (Consejo Nacional de Investigaciones Científicas y Técnicas) grant number [500.000ARS] And The APC was funded by MDPI, Water Journal.
Data Availability Statement
All the supporting data can be requested to the email of any of the authors of this work.
Conflicts of Interest
The authors declare no conflict of interest.
References
- Carey, C.C.; Ibelings, B.W.; Hoffmann, E.P.; Hamilton, D.P.; Brookes, J.D. Eco-physiological adaptations that favour freshwater cyanobacteria in a changing climate. Water Res. 2012, 46, 1394–1407. [Google Scholar] [CrossRef] [PubMed]
- Winder, M.; Sommer, U. Phytoplankton response to a changing climate. Hydrobiologia 2012, 698, 5–16. [Google Scholar] [CrossRef]
- Nõges, T.; Ghiani, M. Increased nutrient loading and rapid changes in phytoplankton expected with climate change in stratified South European lakes: Sensitivity of lakes with different trophic state and catchment properties. Hydrobiologia 2011, 667, 255–270. [Google Scholar] [CrossRef]
- Giorgi, F.; Lionello, P. Climate change projections for the Mediterranean region. Glob. Planet. Chang. 2008, 63, 90–104. [Google Scholar] [CrossRef]
- Jeppesen, E.; Kronvang, B.; Meeρff, M.; Søndergaard, M.; Hansen, K.M.; Andersen, H.E.; Olesen, J.E. Climate change effects on runoff, catchment phosphorus loading and lake ecological state, and potential adaptations. J. Environ. Qual. 2009, 38, 1930–1941. [Google Scholar] [CrossRef]
- Søndergaard, M.; Jensen, J.P.; Jeppesen, E. Role of sediment and internal loading of phosphorus in shallow lakes. Hydrobiologia 2003, 506, 135–145. [Google Scholar] [CrossRef]
- Özen, A.; Karapınar, B.; Kucuk, İ. Drought-induced changes in nutrient concentrations and retention in two shallow Mediterranean lakes subjected to different degrees of management. Hydrobiologia 2010, 646, 61–72. [Google Scholar] [CrossRef]
- Hallegraeff, G.M. A review of harmful algal blooms and their apparent increase. Phycologia 1993, 32, 79–99. [Google Scholar] [CrossRef] [Green Version]
- Mur, L.R.; Skulberg, O.M.; Utkilen, H. Cyanobacteria in the environment. In Toxic Cyanobacteria in Water: A Guide to Their Public Health, Consequences, Monitoring and Management. St; Chorus, I., Bartram, J., Eds.; Edmundsbury Press: Suffolk, UK, 1999; pp. 15–40. [Google Scholar]
- Aubriot, L.; Bonilla, S.; Kruk, C. Cianobacterias planctónicas: Factores que regulan su crecimiento. In Cianobacterias Planctónicas del Uruguay Manual para la identificación y Medidas de Gestión; Bonilla, S., Ed.; UNESCO: Montevideo, Uruguay, 2009; Volume 16, pp. 5–12. [Google Scholar]
- Mehnert, G.; Rücker, J.; Nicklisch, A.; Leunert, F.; Wiedner, C. Effects of thermal acclimation and photoacclimation on lipophilic pigments in an invasive and a native cyanobacterium of temperate regions. Eur. J. Phycol. 2012, 47, 182–192. [Google Scholar] [CrossRef]
- Kosten, S.; Huszar, V.L.; Mazzeo, N.; Scheffer, M.; Sternberg, L.D.S.; Jeppesen, E. Lake and watershed characteristics rather than climate influence nutrient limitation in shallow lakes. Ecol. Appl. 2009, 19, 1791–1804. [Google Scholar] [CrossRef]
- Fogg, G.E.; Stewart, W.D.P.; Fay, P.; Walsby, A.E. The Blue-Green Algae; Academic Press: London, UK; New York, NY, USA, 1973; p. 459. [Google Scholar]
- Codd, G.A. Blue-green algal toxins: Water-borne hazards to health. Water Public Health 1994, 271–278. [Google Scholar]
- Paerl, H. Nutrient and other environmental controls of harmful cyanobacterial blooms along the freshwater–marine continuum. In Cyanobacterial Harmful Algal Blooms: STATE of the Science and Research Needs; Springer: New York, NY, USA, 2008; pp. 217–237. [Google Scholar]
- Anderson, D.; Glibert, P.; Burkholder, J. Harmful algal blooms and eutrophication: Nutrient sources, composition and consequences. Estuaries 2002, 25, 704–726. [Google Scholar] [CrossRef]
- Van Dolah, F.M. Marine algal toxins: Origins, health effects, and their increased occurrence. Environ. Health Perspect. 2000, 108, 1. [Google Scholar] [CrossRef] [PubMed] [Green Version]
- Carmichael, W. A world overview—One-hundred-twenty-seven years of research on toxic cyanobacteria—Where do we go from here? Cyanobacterial Harmful Algal Bloom. State Sci. Res. Needs 2008, 619, 105–125. [Google Scholar]
- Paerl, H.W.; Huisman, J. Blooms like it hot. Science 2008, 320, 57–58. [Google Scholar] [CrossRef] [PubMed] [Green Version]
- Hamilton, L.C.; Keim, B.D. Regional variation in perceptions about climate change. Int. J. Climatol 2009, 29, 2348–2352. [Google Scholar]
- World Health Organization. Guidelines for Safe Recreational Water Environments; Coastal and fresh waters: Geneva, Switzerland, 2003; Volume 1.
- Mowe, M.A.; Mitrovic, S.M.; Lim, R.P.; Furey, A.; Yeo, D.C. Tropical cyanobacterial blooms: A review of prevalence, problem taxa, toxins and inuencing environmental factors. J. Limnol. 2015, 74, 205–224. [Google Scholar] [CrossRef] [Green Version]
- Cheung, M.; Liang, Y.; Lee, J. Toxin-producing cyanobacteria in freshwater: A review of the problems, impact on drinking water safety, and efforts for protecting public health. J. Microbiol. 2013, 51, 1–10. [Google Scholar] [CrossRef]
- Vieira-Lanero, R.; Barca, S.; Cobo, M.C.; Cobo, F. Occurrence of Freshwater Cyanobacteria and Bloom Records in Spanish Reservoirs (1981–2017). Hydrobiology 2022, 1, 122–136. [Google Scholar] [CrossRef]
- Sivonen, K.; Jones, G. Cyanobacterial toxins. In Toxic Cyanobacteria in Water: A Guide to Public Health Significance, Monitoring and Management; Chorus, I., Bertram, J., Eds.; The World Health Organization: London, UK, 1999; pp. 44–111. ISBN 0–419–23930–8. [Google Scholar]
- Dyble, J.; Tester, P.A.; Litaker, R.W. Effects of light intensity on cylindrospermopsin production in the cyanobacterial HAB species Cylindrospermopsis raciborskii. Afr. J. Mar. Sci. 2006, 28, 309–312. [Google Scholar] [CrossRef]
- Moschini-Carlos, V.; De Freitas, L.G.; Pompeo, M. Limnological evaluation of water in the Rio Grande and Taquacetuba branches of the Billings Complex (São Paulo, Brazil) and management implications. Ambiente Agua Interdiscip. J. Appl. Sci. 2010, 5, 47–59. [Google Scholar] [CrossRef]
- Paerl, H.W.; Paul, V. Climate change: Links to global expansion of harmful cyanobacteria. Water Res. 2012, 46, 1349–1363. [Google Scholar] [CrossRef] [PubMed]
- Merel, S.; Walker Chicana, D.; Snyder, R.; Baurès, S.; Thomas, O. State of knowledge and concerns on cyanobacterial blooms and cyanotoxins. Environ. Int. 2013, 59, 303–327. [Google Scholar] [CrossRef] [PubMed]
- Machado, L.S.; Santos, L.G.; Lopez-Doval, J.C.; Pompeo, M.L.M.; Moschini, V. Fatores ambientais relacionados à ocorrência de cianobactérias potencialmente tóxicas no reservatorio de Guarapiranga. Rev. Ambiente Água 2016, 11, 810–818. [Google Scholar] [CrossRef] [Green Version]
- Huisman, J.; Codd, G.A.; Paerl, H.W.; Ibelings, B.W.; Verspagen, J.M.H.; Visser, P.M.P. Cyanobacterial blooms. Nat. Rev. Microbiol. 2008, 16, 471–483. [Google Scholar] [CrossRef] [PubMed]
- O’Farrell, I.; Motta, C.; Forastier, M.; Polla, W.; Otaño, S.; Meichtry, N.; Devercelli, M.; Lombardo, R. Ecological meta-analysis of bloom-forming planktonic Cyanobacteria in Argentina. Harmful Algae 2019, 83, 1–13. [Google Scholar] [CrossRef]
- Amé, M.; Diaz, M.; Wunderlin, D. Occurrence of toxic cyanobacterial blooms in San Roque reservoir (Córdoba, Argentina): A field and chemometric study. Environ. Toxicol. 2003, 18, 192–201. [Google Scholar] [CrossRef]
- Bazán, R.; Corral, M.; Pagot, M.; Rodríguez, A.; Oroná, C.; Rodríguez, M.I.; Busso, F. Teledetección y modelado numérico para el análisis de la calidad de agua del embalse Los Molinos, Córdoba, Argentina. Rev. Ing. Hidráulica En México 2005, 20, 121–135. [Google Scholar]
- Alvarez Dalinger, F.; Salusso, M.; Moraña, L. Primera caracterización de un reservorio tropical somero en riesgo en el norte de la Argentina. Ecol. Austral 2022, 32, 542–554. [Google Scholar] [CrossRef]
- Vidaurre, A.; Alvarez Dalinger, F.S.; Moraña, L.B.; Salusso, M.M. Cianobacterias en un embalse subtropical de la provincia de Salta (Argentina). Boletín De La Sociedad Argentina De Botánica 2018, 53, 543–549. [Google Scholar] [CrossRef]
- APHA; AWWA; WEF. Standard Methods for the Examination of Water and Wastewater, 21st ed.; APHA. Standard Method 10200H: Washington, DC, USA, 2005. [Google Scholar]
- Cabrera Silva, S. Estimación de clorofila a y feopigmentos. Una revisión metodológica. In Programa Sobre el Hombre y la Biosfera; UNESCO, Universidad de Chile: Santiago de Chile, Chile, 1984; p. 236. [Google Scholar]
- Carlson, R. A trophic state index for lakes. Limnol. Oceanogr. 1977, 22, 361–369. [Google Scholar] [CrossRef] [Green Version]
- Utermöhl, H. ZurVervollkomrnnungverquantitativenPhytoplankton-Methodic. Mitt. Int. Verein. Limnol. 1958, 9, 138. [Google Scholar]
- Venrick, E. How many cells to count? In Monographs on Oceanographic Methods 6: Phytoplankton Manual; Sournia, A., Ed.; United Nations Educational, Scientific and Cultural Organization: Paris, France, 1978; pp. 167–180. [Google Scholar]
- Komárek, J.; Anagnostidis, K. Cyano prokaryota 1. TeilChroococcales. In Süβwasserflora von Mitteleuropa; Ettl, H., Gärtner, G., Heynig, H., Mollenhaver, Y.D., Eds.; Springer: Berlin/Heidelberg, Germany, 1999; Volume 19, pp. 1–548. [Google Scholar]
- Komárek, J.; Anagnostidis, K.C. Süsswasserflora von Mitteleuropa Bd. 19/1: Cyanoprokaryota: Teil/Part 1: Chroococcales; Spektrum Akademischer Verlag: Stuttgart, Germany, 2005. [Google Scholar]
- Komárková-Legnerová, J. The systematics and ontogenesis of the genera Ankistrodesmus Corda and Monoraphidium gen. nov. Academia 1969. [Google Scholar]
- Komárek, J.; Kaštovský, J.; Mareš, J.; Johansen, J.R. Taxonomic classification of cyanoprokaryotes (cyanobacterial genera) using a polyphasic approach. Preslia 2014, 86, 295–335. [Google Scholar]
- Krammer, K.; Lange-Bertalot, H. Ba-cillaríophyceae, 1. Teil: Naviculaceae. In Süβwasserflora von Mitteleuropa; Ettl, H., Gärtner, G., Heynig, H., Mollenhaver, Y.D., Eds.; Springer: Berlin/Heidelberg, Germany, 1986; Volume 2, pp. 1–876. [Google Scholar]
- Krammer, K.; Lange Bertalor, H. Bacillaríophyceae. 3. Teil: Centrales, Fragilariaceae, Eunotiaceae. In Süsswasserflora von Mitteleuropa, G. Fischer, Jena Süsswasserflora von Mitteleuropa Bd. 2/3; Ettl, H., Gerloff, H., Heynig, H., Mollenhauer, D., Eds.; Gustav Fischer Verlag: Stuttgart, Germany, 1991. [Google Scholar]
- Chorus, I.; Welker, M. Toxic Cyanobacteria in Water: A Guide to Their Public Health Consequences, Monitoring and Management; Taylor & Francis: London, UK, 2021; p. 858. [Google Scholar]
- Chorus, I.; Bartram, J. Toxic Cyanobacteria in Water: A Guide to Their Public Health Consequences, Monitoring and Management; CRC Press: Boca Raton, FL, USA, 1999. [Google Scholar]
- Yema, L.; Kremer, C.T.; O’Farrell, I.; de Tezanos Pinto, P. Assessing patterns of morphological and physiological trait variations across heterocytous cyanobacteria at cellular and population levels. Hydrobiologia 2018, 823, 93–107. [Google Scholar] [CrossRef]
- Hillebrand, H.; Dürselen, C.D.; Kirschtel, D.; Pollingher, U.; Zohary, T. Biovolume calculation for pelagic and benthic microalgae. J. Phycol. 1999, 35, 403–424. [Google Scholar] [CrossRef]
- Simon, N.; Cras, A.L.; Foulon, E.; Lemée, R. Diversity and evolution of marine phytoplankton. Comptes Rendus Biologies 2009, 332, 159–170. [Google Scholar] [CrossRef]
- Bonilla, S.; Conde, D. El fitoplancton como descriptor sensible de cambios ambientales en las lagunas costeras de la Reserva Bañados del Este. Semin. Taller Sobre Monit. Ambient. 2000, 31, 1–5. [Google Scholar]
- Loza, S.; Carmenate, M.; Pereiro, Y.; Sánchez, M. Respuesta del fitoplancton ante el impacto antrópico de la zona costera NW de ciudad de La Habana, Cuba. In Proceedings of the III Convención de Medio Ambiente, La Habana, Cuba, July, 2–6 July 2007. [Google Scholar]
- Aguilera, A.; Haakonsson, S.; Martín, M.; Salerno, G.; Echenique, R.O. Bloom-forming cyanobacteria and cyanotoxins in Argentina: A growing health and environmental concern. Limnologica 2017, 69, 103–114. [Google Scholar] [CrossRef]
- Znachor, P.; Jurczak, T.; Komarkova, J.; Jezberová, J.; Mankiewicz, J.; Kaštovská, K.; Zapomělová, E. Summerchanges in cyanobacterial bloom composition and micro-cystin concentration in eutrophic Czech reservoirs. Environ. Toxicol. 2006, 21, 236–243. [Google Scholar] [CrossRef]
- Bormans, M.; Ford, P.; Fabbro, L. Spatial and tem-poral variability in cyanobacterial populations controlledby physical processes. J. Plankton Res. 2005, 27, 61–70. [Google Scholar] [CrossRef] [Green Version]
- Bittencourt-Oliveira, M.C. Detection of potential microcystin-producing cyanobacteria in Brazilian reservoirswith a mcyB molecular marker. Harmful Algae 2003, 2, 51–60. [Google Scholar] [CrossRef]
- Steel, J.A.; Duncan, A. Modelling the ecological aspects of bankside reservoirs and implications for man-agement. Hydrobiologia 1999, 395–396, 133–147. [Google Scholar] [CrossRef]
- Soares, M.C.S.; Huszar, V.L.M.; Miranda, M.N.; Mello, M.M.; Roland, F.; Lürling, M. Dominance in Brazil: Distribution and environmental preferences. Hydrobiologia 2013, 717, 1–12. [Google Scholar] [CrossRef]
- Rigosi, A.; Carey, C.C.; Ibelings, B.W.; Brookes, J.D. The interaction between climate warming and eutrophication to promote cyanobacteria is dependent on trophic state and varies among taxa. Limnol. Oceanogr 2014, 59, 99–114. [Google Scholar] [CrossRef] [Green Version]
- Paerl, H.W.; Fulton, R.S.; Moisander, P.H.; Dyble, J. Harmful freshwater algal blooms, with an emphasis on cyanobacteria. Sci. World J. 2001, 1, 76–113. [Google Scholar] [CrossRef] [Green Version]
- Chellappa, N.T.; Borba, J.M.; Rocha, O. Phytoplankton community and physical-chemical characteristics of water in the public reservoir of Cruzeta, RN, Brazil. Braz. J. Biol. 2008, 68, 477–494. [Google Scholar] [CrossRef] [Green Version]
- Mendes, C.F.; dos Santos Severiano, J.; de Moura, G.C.; dos Santos Silva, R.D.; Monteiro, F.M.; de Lucena Barbosa, J.E. The reduction in water volume favors filamentous cyanobacteria and heterocyst production in semiarid tropical reservoirs without the influence of the N: P ratio. Sci. Total Environ. 2022, 816, 151584. [Google Scholar] [CrossRef]
- Smith, V.H. Low nitrogen to phosphorus ratios favor dominance by blue-green algae in lake phytoplankton. Science 1983, 221, 669–671. [Google Scholar] [CrossRef] [Green Version]
- Downing, J.A.; McCauley, E. The nitrogen: Phosphorus relationship in lakes. Limnol. Oceanogr. 1992, 37, 936–945. [Google Scholar] [CrossRef] [Green Version]
- Dokulil, M.T.; Teubner, K. Cyanobacterial dominance in lakes. Hydrobiologia 2000, 438, 1–12. [Google Scholar] [CrossRef]
- Diaz, M.; Pedrozo, F.; Reynolds, C.; Temporetti, P. Chemical composition and the nitrogen-regulated trophic state of Patagonian lakes. Limnologica 2007, 37, 17–27. [Google Scholar] [CrossRef] [Green Version]
- Sukenik, A.; Hadas, O.; Kaplan, A.; Quesada, A. Invasion of Nostocales (cyanobacteria) to subtropical and temperate freshwater lakes–physiological, regional, and global driving forces. Front. Microbiol. 2012, 3, 86. [Google Scholar] [CrossRef] [PubMed] [Green Version]
- Wiedner, C.; Rücker, J.; Brüggemann, R.; Nixdorf, B. Climate change affects timing and size of populations of an invasive cyanobacterium in temperate regions. Oecologia 2007, 152, 473–484. [Google Scholar] [CrossRef]
- Briand, J.F.; Leboulanger, C.; Humbert, J.F.; Bernard, C.; Dufour, P. Cylindrospermopsis raciborskii (cyanobacteria) invasión at mid-latitudes: Selection, wide physiological tolerance or global warming? J. Phycol. 2004, 40, 231–238. [Google Scholar] [CrossRef]
- Mehnert, G.; Leunert, F.; Cirés, S.; Klaus, D.; Jöhnk, J.R.; Brigitte, N.; Claudia, W. Competitiveness of invasive and native cyanobacteria from temperate freshwaters under various light and temperature conditions. J. Plankton Res. 2010, 32, 1009–1021. [Google Scholar] [CrossRef]
- Sarthou Suarez, F.V. Floraciones de Cianobacterias: Efectos de la Eutrofización y la Variabilidad Climática; Universidad de la República: Montevideo, Uruguay, 2016. [Google Scholar]
- O’Farrell, I.; Vinocur, A.; de Tezanos Pinto, P. Longterm study of bloom-forming cyanobacteria in a highly fluctuating vegetated floodplain lake: A morpho-functional approach. Hydrobiologia 2015, 752, 91–102. [Google Scholar] [CrossRef]
- Yema, L.; Litchman, E.; de Tezanos Pinto, P. The role of heterocytes in the physiology and ecology of bloom-forming harmful cyanobacteria. Harmful Algae 2016, 60, 131–138. [Google Scholar] [CrossRef]
- Dolman, A.M.; Ru¨cker, J.; Pick, F.; Fastner, J.; Rohrlack, T.; Mischke, U.; Wiedner, C. Cyanobacteria and cyanotoxins: The influence of nitrogen versus phosphorus. PLoS ONE 2012, 7, e38757. [Google Scholar] [CrossRef]
- Kaplan-Levy, R.N.; Hadas, O.; Summers, M.; Rücker, J.; Sukenik, A. Akinetes: Dormant cells of cyanobacteria. In Dormancy and Resistance in Harsh Environments; Lubzens, E., Cerda, J., Clark, M., Eds.; Springer: Berlin/Heidelberg, Germany, 2010; pp. 5–27. [Google Scholar]
- Pérez, R.; Forchhammer, K.; Salerno, G.; Maldener, I. Clear differences in metabolic and morphological adaptations of akinetes of two Nostocales living in different habitats. Microbiology 2016, 162, 214–223. [Google Scholar] [CrossRef]
- Argueta, C.; Yuksek, K.; Patel, R.; Summers, M.L. Identification of Nostoc punctiforme akinete-expressed genes using differential display. Mol. Microbiol. 2006, 61, 748–757. [Google Scholar] [CrossRef] [PubMed]
- Argueta, C.; Summers, M.L. Characterization of a model system for the study of Nostoc punctiforme akinetes. Arch. Microbiol. 2005, 183, 338–346. [Google Scholar] [CrossRef] [PubMed]
- Sutherland, J.M.; Herdman, M.; Stewart, W.D. Akinetes of the cyanobacterium Nostoc PCC 7524: Macromolecular composition, structure and control of differentiation. Microbiology 1979, 115, 273–287. [Google Scholar] [CrossRef] [Green Version]
- Lozano, V.L. Hidden impacts of environmental stressors on freshwater communities could be revealed at lower concentrations by correlation of abundances network analyses: An example with herbicides glyphosate, 2,4-D, and their mixtures. Austral Ecol. 2022. [Google Scholar] [CrossRef]
Figure 1.
El Limón reservoir study area.

Figure 2.
Historical records (HR) of rainfall and temperature (1981–2010); and rainfall and average temperature for the years 2018 and 2019 registered in the study area, according to data from SMN. The dashed black line shows the historical temperatures calculated with the average monthly temperatures.

Figure 3.
Sample classification by (A) N/P ratio and (B) trophic status of the reservoir (TSI), according to the Carlson Index.
Figure 3.
Sample classification by (A) N/P ratio and (B) trophic status of the reservoir (TSI), according to the Carlson Index.

Figure 4.
Morphotypes of cyanobacteria by year. The proportions of cyanobacteria among total phytoplankton are shown as pie charts above (in blue); the other phytoplankton groups are represented in green.
Figure 4.
Morphotypes of cyanobacteria by year. The proportions of cyanobacteria among total phytoplankton are shown as pie charts above (in blue); the other phytoplankton groups are represented in green.

Figure 5.
Abundance dynamics of the most abundant species in 2018, 2019, and January 2020. Scales differ between charts.
Figure 5.
Abundance dynamics of the most abundant species in 2018, 2019, and January 2020. Scales differ between charts.

Figure 6.
Widths and lengths of the dominant cyanobacteria in 2018 and 2019. The statistical differences according to Mann Whitney are indicated as: * (p < 0.05) ** (p < 0.005).
Figure 6.
Widths and lengths of the dominant cyanobacteria in 2018 and 2019. The statistical differences according to Mann Whitney are indicated as: * (p < 0.05) ** (p < 0.005).


Table 1.
Physical and chemical parameters of the samplings per year.
| 2018 | 2019 | ||||||||
|---|---|---|---|---|---|---|---|---|---|
| Unit | Mean | SD | Min | Max | Mean | SD | Min | Max | |
| Secchi | M | 1.88 | 0.68 | 1 | 2.75 | 1.21 | 0.21 | 1 | 1.5 |
| pH | 7.01 | 0.17 | 6.74 | 7.21 | 7.58 | 0.79 | 6.4 | 8.06 | |
| E.C. | µS/cm | 634.13 | 31.01 | 593 | 682.8 | 644.7 | 25.28 | 617 | 678 |
| Turbidity | NTU | 4.14 | 2.35 | 1.87 | 7.82 | 3.38 | 1.76 | 2.2 | 6 |
| Alkalinity | mg CaCO3/L | 79.87 | 25.83 | 33 | 108 | 221.48 | 12.73 | 203.04 | 230.86 |
| Hardness | mg CaCO3/L | 505.65 | 648.43 | 222 | 1787.62 | 199.97 | 66.2 | 141.64 | 260.38 |
| N-NO2 | mg/L | 0.01 | 0.003 | 0.001 | 0.01 | 0.01 | 0.003 | 0.003 | 0.01 |
| N-NO3 | mg/L | 0.9 | 0.88 | 0.001 | 2.4 | 0.3 | 0.08 | 0.2 | 0.4 |
| N-NH3 | mg/L | 0.75 | 0.90 | 0.20 | 2.10 | 0.38 | 0.04 | 0.32 | 0.41 |
| NH4 | mg/L | 0.44 | 0.14 | 0.26 | 0.58 | 0.48 | 0.05 | 0.41 | 0.42 |
| SIN | mg/L | 1.21 | 0.82 | 0.6 | 2.07 | 0.68 | 0.05 | 0.61 | 0.73 |
| SRP | mg/L | 0.44 | 0.74 | 0.03 | 1.54 | 0.12 | 0.12 | 0.04 | 0.3 |
| N/P | 24.47 | 33.55 | 0.14 | 88.87 | 10.2 | 6.32 | 2.44 | 17.49 | |
| COD | Mg O2/L | 206.3 | 204.5 | 63 | 616.46 | 139.78 | 67.81 | 90.77 | 240.14 |
| CL-a | µg/L | 11.04 | 10.92 | 3.78 | 33.05 | 9.48 | 2.85 | 5.58 | 12.04 |
| In-situ water temperature | °C | 23.92 | 2.59 | 18.8 | 26 | 30.03 | 5.69 | 25 | 35.1 |
Table 2.
Spearman correlations coefficients between physical, chemical, metereological, and cyanobacterial abundances. Statistically significant coefficients are indicated in bold (p < 0.05). * The sampling date refers to the temperature or precipitation recorded on the day the sample was taken.
Table 2.
Spearman correlations coefficients between physical, chemical, metereological, and cyanobacterial abundances. Statistically significant coefficients are indicated in bold (p < 0.05). * The sampling date refers to the temperature or precipitation recorded on the day the sample was taken.
| Total Cyanobacteria | Non-Heterocytous Filament | Colonial | Heterocytous Cyanobacteria | ||
|---|---|---|---|---|---|
| Physical and chemical | pH | 0.080 | 0.330 | −0.030 | 0.250 |
| Electrical conductivity | −0.350 | −0.180 | −0.400 | −0.430 | |
| Turbidity | 0.600 | 0.580 | 0.600 | 0.630 | |
| Total solids | −0.700 | −0.530 | −0.730 | −0.670 | |
| Alkalinity | 0.680 | 0.830 | 0.570 | 0.700 | |
| Carbonates | 0.470 | 0.670 | 0.420 | 0.450 | |
| Bicarbonates | 0.710 | 0.580 | 0.720 | 0.670 | |
| Hardness | −0.320 | −0.550 | −0.130 | −0.430 | |
| Calcium | −0.300 | −0.280 | −0.300 | −0.470 | |
| Magnesium | −0.330 | −0.600 | −0.110 | −0.310 | |
| COD | 0.220 | 0.130 | 0.230 | 0.180 | |
| Dissolved oxygen | −0.320 | −0.170 | −0.500 | −0.400 | |
| Chlorophyll a | 0.780 | 0.700 | 0.680 | 0.830 | |
| Secchi Disk | −0.840 | −0.860 | −0.730 | −0.900 | |
| Nutrients | Nitrites | 0.680 | 0.510 | 0.790 | 0.770 |
| Nitrates | −0.120 | −0.300 | 0.030 | −0.060 | |
| Ammonium | −0.020 | 0.160 | −0.140 | −0.180 | |
| SIN | 0.000 | −0.130 | 0.120 | 0.000 | |
| PSRP | 0.220 | 0.190 | 0.240 | 0.200 | |
| N/P | −0.150 | −0.150 | −0.170 | −0.150 | |
| Temperature | Water | 0.670 | 0.720 | 0.580 | 0.770 |
| Sampling Date | 0.780 | 0.870 | 0.670 | 0.870 | |
| 14 d | 0.200 | 0.380 | 0.020 | 0.230 | |
| 30 d | 0.350 | 0.520 | 0.200 | 0.480 | |
| 6 months | 0.97 | 0.90 | 0.92 | 0.83 | |
| 8 months | 0.770 | 0.800 | 0.720 | 0.850 | |
| Rainfall | Sampling Date | −0.430 | −0.520 | −0.340 | −0.550 |
| 14 d | −0.440 | −0.450 | −0.410 | −0.380 | |
| 30 d | −0.230 | −0.250 | −0.180 | −0.080 | |
| 6 months | 0.05 | 0.03 | 0.18 | −0.20 | |
| 8 months | −0.700 | −0.680 | −0.620 | −0.620 |
Table 3.
Spearman correlations between physical, chemical, and meteorological variables with the morphological variables of AD (Aphanocapsa delicatissima), AG (Aphanizomenon gracile), RM (Raphidiopsis mediterranea), and CYL (Cylindrospermopsis raciborskii).
Table 3.
Spearman correlations between physical, chemical, and meteorological variables with the morphological variables of AD (Aphanocapsa delicatissima), AG (Aphanizomenon gracile), RM (Raphidiopsis mediterranea), and CYL (Cylindrospermopsis raciborskii).
| Specie | M | Meteorological Variable | R (Spearman) | p-Value |
|---|---|---|---|---|
| AG | W/L | Water temperature | 0.72 | 0.0427 |
| AG | W/L | Average T °C (30 days) | 0.72 | 0.0427 |
| AD | W/L | Daily rain | 0.69 | 0.0395 |
| CYL | Width | Accumulated rain (30 days) | −0.85 | 0.0034 |
| CYL | Width | Accumulated rain (30 days) | −0.91 | 0.0007 |
| CYL | Width | Accumulated rain (14 days) | −0.69 | 0.0401 |
| CYL | W/L | Average T °C (14 days) | 0.78 | 0.0267 |
| RM | Length | Accumulated rain (8 months) | −0.73 | 0.0381 |
| RM | W/L | Accumulated rain (8 months) | −0.8 | 0.0237 |
Disclaimer/Publisher’s Note: The statements, opinions and data contained in all publications are solely those of the individual author(s) and contributor(s) and not of MDPI and/or the editor(s). MDPI and/or the editor(s) disclaim responsibility for any injury to people or property resulting from any ideas, methods, instructions or products referred to in the content. |
© 2023 by the authors. Licensee MDPI, Basel, Switzerland. This article is an open access article distributed under the terms and conditions of the Creative Commons Attribution (CC BY) license (https://creativecommons.org/licenses/by/4.0/).
Share and Cite
MDPI and ACS Style
Alvarez Dalinger, F.S.; Lozano, V.L.; Borja, C.N.; Moraña, L.B.; María Mónica, S. Short-Term Meteorological Conditions Explain Cyanobacterial Blooms in a Tropical Reservoir. Water 2023, 15, 302. https://doi.org/10.3390/w15020302
AMA Style
Alvarez Dalinger FS, Lozano VL, Borja CN, Moraña LB, María Mónica S. Short-Term Meteorological Conditions Explain Cyanobacterial Blooms in a Tropical Reservoir. Water. 2023; 15(2):302. https://doi.org/10.3390/w15020302
Chicago/Turabian StyleAlvarez Dalinger, Florencia Soledad, Verónica Laura Lozano, Claudia Nidia Borja, Liliana Beatriz Moraña, and Salusso María Mónica. 2023. "Short-Term Meteorological Conditions Explain Cyanobacterial Blooms in a Tropical Reservoir" Water 15, no. 2: 302. https://doi.org/10.3390/w15020302
Note that from the first issue of 2016, this journal uses article numbers instead of page numbers. See further details here.