
Model-Based Mechanism Analysis of “7.20” Flash Flood Disaster in Wangzongdian River Basin
by
 ,
,
Sijia Hao
1,2,
Wenchuan Wang
1,
Qiang Ma
2,*,
Changzhi Li
2,
Lei Wen
3,
Jiyang Tian
2 and
Changjun Liu
2 1
College of Water Resources, North China University of Water Resources and Electric Power, Zhengzhou 450046, China
2
China Institute of Water Resources and Hydropower Research, Beijing 100038, China
3
College of Hydrology and Water Resources, Hohai University, Nanjing 210098, China
*
Author to whom correspondence should be addressed.
Water 2023, 15(2), 304; https://doi.org/10.3390/w15020304
Submission received: 29 November 2022
/
Revised: 6 January 2023
/
Accepted: 9 January 2023
/
Published: 11 January 2023
(This article belongs to the Special Issue Flash Floods: Forecasting, Monitoring and Mitigation Strategies)
Abstract
:With digital information technology based on limited data, disaster simulation review is an important guideline for analyzing disaster mechanisms, planning post-disaster reconstruction, and improving defense capability. Taking the “7.20” flash flood in the Wangzongdian river basin as a research area, a hydrological-hydrodynamic model was established using limited measured data. The results showed that the extreme rainstorm caused flooding in mountainous areas and the collapse of subgrade water damming, and the high-level flood quickly flowed into Wangzongdian Village in a short distance, which was the main cause of this serious disaster. Considering the collapse due to the congestion of the upstream bridge, the simulated flood flow in Wangzongdian Village reached 782 m3/s, which was basically consistent with the post-disaster survey results, with a relative error of only +8%. The modeling strategy proposed in this paper is applicable in the review of sudden heavy rainstorms and flash floods and can provide technical guidance for future flash flood simulation review analysis in other areas.
1. Introduction
Flash floods in China mainly refer to river floods caused by heavy rainfall in small watersheds (within an area of 200 km2) in hilly areas, which are characterized by small scope, short duration, high suddenness, and high destructive power, and are very likely to cause massive casualties and socioeconomic losses [1]. According to the statistics of the Ministry of Emergency Management of China, a total of 42 heavy rainfall events occurred in China in 2021, with an average precipitation of about 659 mm, an increase in about 6% over previous years, resulting in 59.01 million people being affected and an economic loss of about 245.89 billion yuan [2]. It is of great significance to carry out a review simulation analysis of flash floods in small mountain watersheds to understand the causes of flash floods, to improve the flood prevention and mitigation capacity in mountainous areas of China, to summarize prevention and control experience, and to establish and improve a sound flash flood disaster prevention and control system [3]. The basic monitoring facilities in China’s mountainous areas still need to be further improved, which makes it difficult to obtain refined data and more difficult to review flash floods [4]. However, a refined post-disaster review can be achieved on the basis of limited data by reasonably developing a flash flood review strategy based on domestic models.
The improvement of numerical algorithms and the rapid development of computer technology have guaranteed accurate and efficient flood analysis and simulation. Distributed hydrological simulations allow the reenactment of the effects of changes in different hydrological elements on water cycle processes according to the spatial variability of the watershed’s underlying surface [5,6]. Shu et al. [7] put forward a distributed hydrological model SHUD, which uses the finite volume method to solve surface-underground coupling and uses the irregular triangular network to construct the basin simulation space to realize the high-resolution numerical simulation of meters-kilometers in space and seconds-hours in time. Zhao et al. [8] established a distributed hydrological model VRGL for hilly regions by considering the role of soil-weathering bedrock interface in runoff generation and carried out the application in Tunxi streams in humid, hilly areas in China. The results showed that VRGL has good accuracy (the relative errors of peak discharge and flood volume are within ± 20%) and can be used for flood forecasting in hilly areas. Liu et al. [9] proposed a spatio temporally-mixed runoff model SKBY and the modular distributed hydrological model FFMS by analyzing the transformation and combination of small watershed infiltration and storage mechanism in two dimensions of time and space. It was proved that the model improves the simulation accuracy of floods under short-duration and heavy rainfall conditions. Hydrological models have been widely used in flood forecasting and warning in China. However, the output results of the model are the process of runoff generation obtained according to the hydrological conditions of the basin, which cannot achieve the dynamic description of flood routing in the inundated area [10]. Moreover, the simulation accuracy is greatly affected when the natural runoff generation mechanism of the basin changes due to the topographic changes caused by floods. The hydrodynamic model can not only simulate the evolution process of water flow in the river course and floodplain but also the waterlogging in the urban and rural areas. According to hydrodynamic calculation, the spatio-temporal variation of the submerged area can be obtained. The finite volume method is a commonly used numerical calculation method in the current hydrodynamic model. The numerical shallow water simulation using a Godunov-type scheme for the riemann approximate solver has good accuracy and is widely used [11,12]. Zhang et al. [13] established a two-dimensional hydrodynamic model of rainfall-runoff based on the Godunov-type scheme with unstructured grids and verified that with this model, the surface runoff movement could be finely simulated.
Scholars have conducted plenty of research on flash flood simulation review and disaster-causing mechanism analysis. Liu et al. [14] compared flood simulations with three methods: the watershed model method, reasoning formula method, and empirical formula method, and concluded that the results of the watershed model method were more reasonable. Zhang et al. [15] constructed a mountain hydrological model for the Guanshan River basin by introducing the rainstorm interflow mechanism and found that the rainstorm interflow mechanism is one of the important runoff generation mechanisms in small watersheds in humid mountainous areas, and it is considered that the hydrological model of small mountain watershed with this mechanism is more effective in flash flood forecasting and early warning. Sandrine et al. [16] simulated flash floods based on a distributed hydrological model and found that flash flood dynamics showed two phases: the first phase was mainly controlled by soil properties, and the second phase was by rainfall due to soil saturation. In summary, an accurate description of the geometry and underlying surface characteristics of the small watershed and a clear understanding of the characteristics of runoff generation are the keys to simulating the process of and analyzing the causes of flash floods. However, when the natural geomorphological conditions of the region change severely during the flooding process, the simulation results of the hydrological model often deviate greatly from the actual results. Lin et al. [17] analyzed the inundation of flash floods in small mountain watersheds based on one-dimensional and two-dimensional coupled hydrodynamic models, respectively, and verified that one-dimensional and two-dimensional coupled hydrodynamic models can effectively simulate the flood characteristics and evolution process in a small mountain watershed. Zhang et al. [13] simulated and analyzed the flood evolution after dam failure by using the dam failure model based on the Godunov-type scheme. The two-dimensional hydrodynamic model can automatically adapt to the change of flow regime and has unique advantages in the simulation of dam failure, dam break, and other flood types. Segura et al. [18] simulated the 2007 flash flood of the Girona River in Spain by using the coupled hydrological and hydrodynamic model and found that coupled model simulation considering geomorphological characteristics can help analyze flood causes and provide technical guidance for early warning. El-Saoud et al. [19] found that infrastructure construction aggravated flash flood disasters to some extent by using a hydrological model (HEC-1) with two-dimensional hydraulic modeling (HEC-RAS 5.0.7) software to draw the early warning map of flash flood risk in Mecca, Saudi Arabia. Although the hydrodynamic model can describe flood routing in detail, the amount of data required for modeling is relatively large, which is often limited by time, cost, and local realities in flood review, so it is difficult to be widely used. At present, flash flood disaster simulation reviews are mostly conducted by a single type of model. It is difficult to accurately reproduce the whole process of flood development, whether the flood simulation is realized by calculating the peak discharge through the hydrological model or by calculating the submerged water depth through the hydrodynamic model. Therefore, there is an urgent need for guidelines and strategy for the joint application of multiple models to optimize the whole process simulation of watershed flood routing.
Compared with foreign specialized models of water resources, China has a late-developing advantage in studying flood disasters based on hydrological and hydrodynamic models. However, in practical applications, especially in flash flood simulation, it is still necessary to develop appropriate model simulation strategies according to the extent of post-disaster data collection. From 17 to 24 July 2021, Henan Province was hit by unusually heavy rainfall, which triggered urban waterlogging and flash flood disasters, causing serious loss of life and property. In this paper, a hydrological-hydrodynamic model was used to analyze the “7.20” flash flood in Wangzongdian village based on national flash flood investigation results and postdisaster field survey data. A rapid modeling strategy of flash flood disasters using limited data was put forward based on the simulation results, helping to quickly clarify the sources and causes of floods and providing important technical and decision-making support for flash flood disaster prevention and early warning.
2. Research Materials
In July 2021, China’s Henan Province was hit by heavy rainfall. The daily rainfall in Xingyang exceeded the historical extreme value, causing a significant impact on people’s life and social production (Figure 1). According to statistics, this extraordinary rainstorm left 242,069 population affected in Xingyang City, with an affected area of 21,745.05 hectares of crops and 10,629 houses out of 3260 households collapsed. In addition, it caused varying degrees of damage to 630 communication base stations, 5473.95 km of fiber optic cables, 44 base station houses, 13 small and medium-sized reservoirs, five erosion and torrent control works, five rivers, two channels, and one irrigation station, resulting in direct economic losses of 5.051 billion yuan in Xingyang City [20]. This disaster event was selected for review to figure out the causes and mechanism of the disaster, which has technical reference significance for disaster review analysis in other areas affected by flash floods in China.
2.1. Study Area
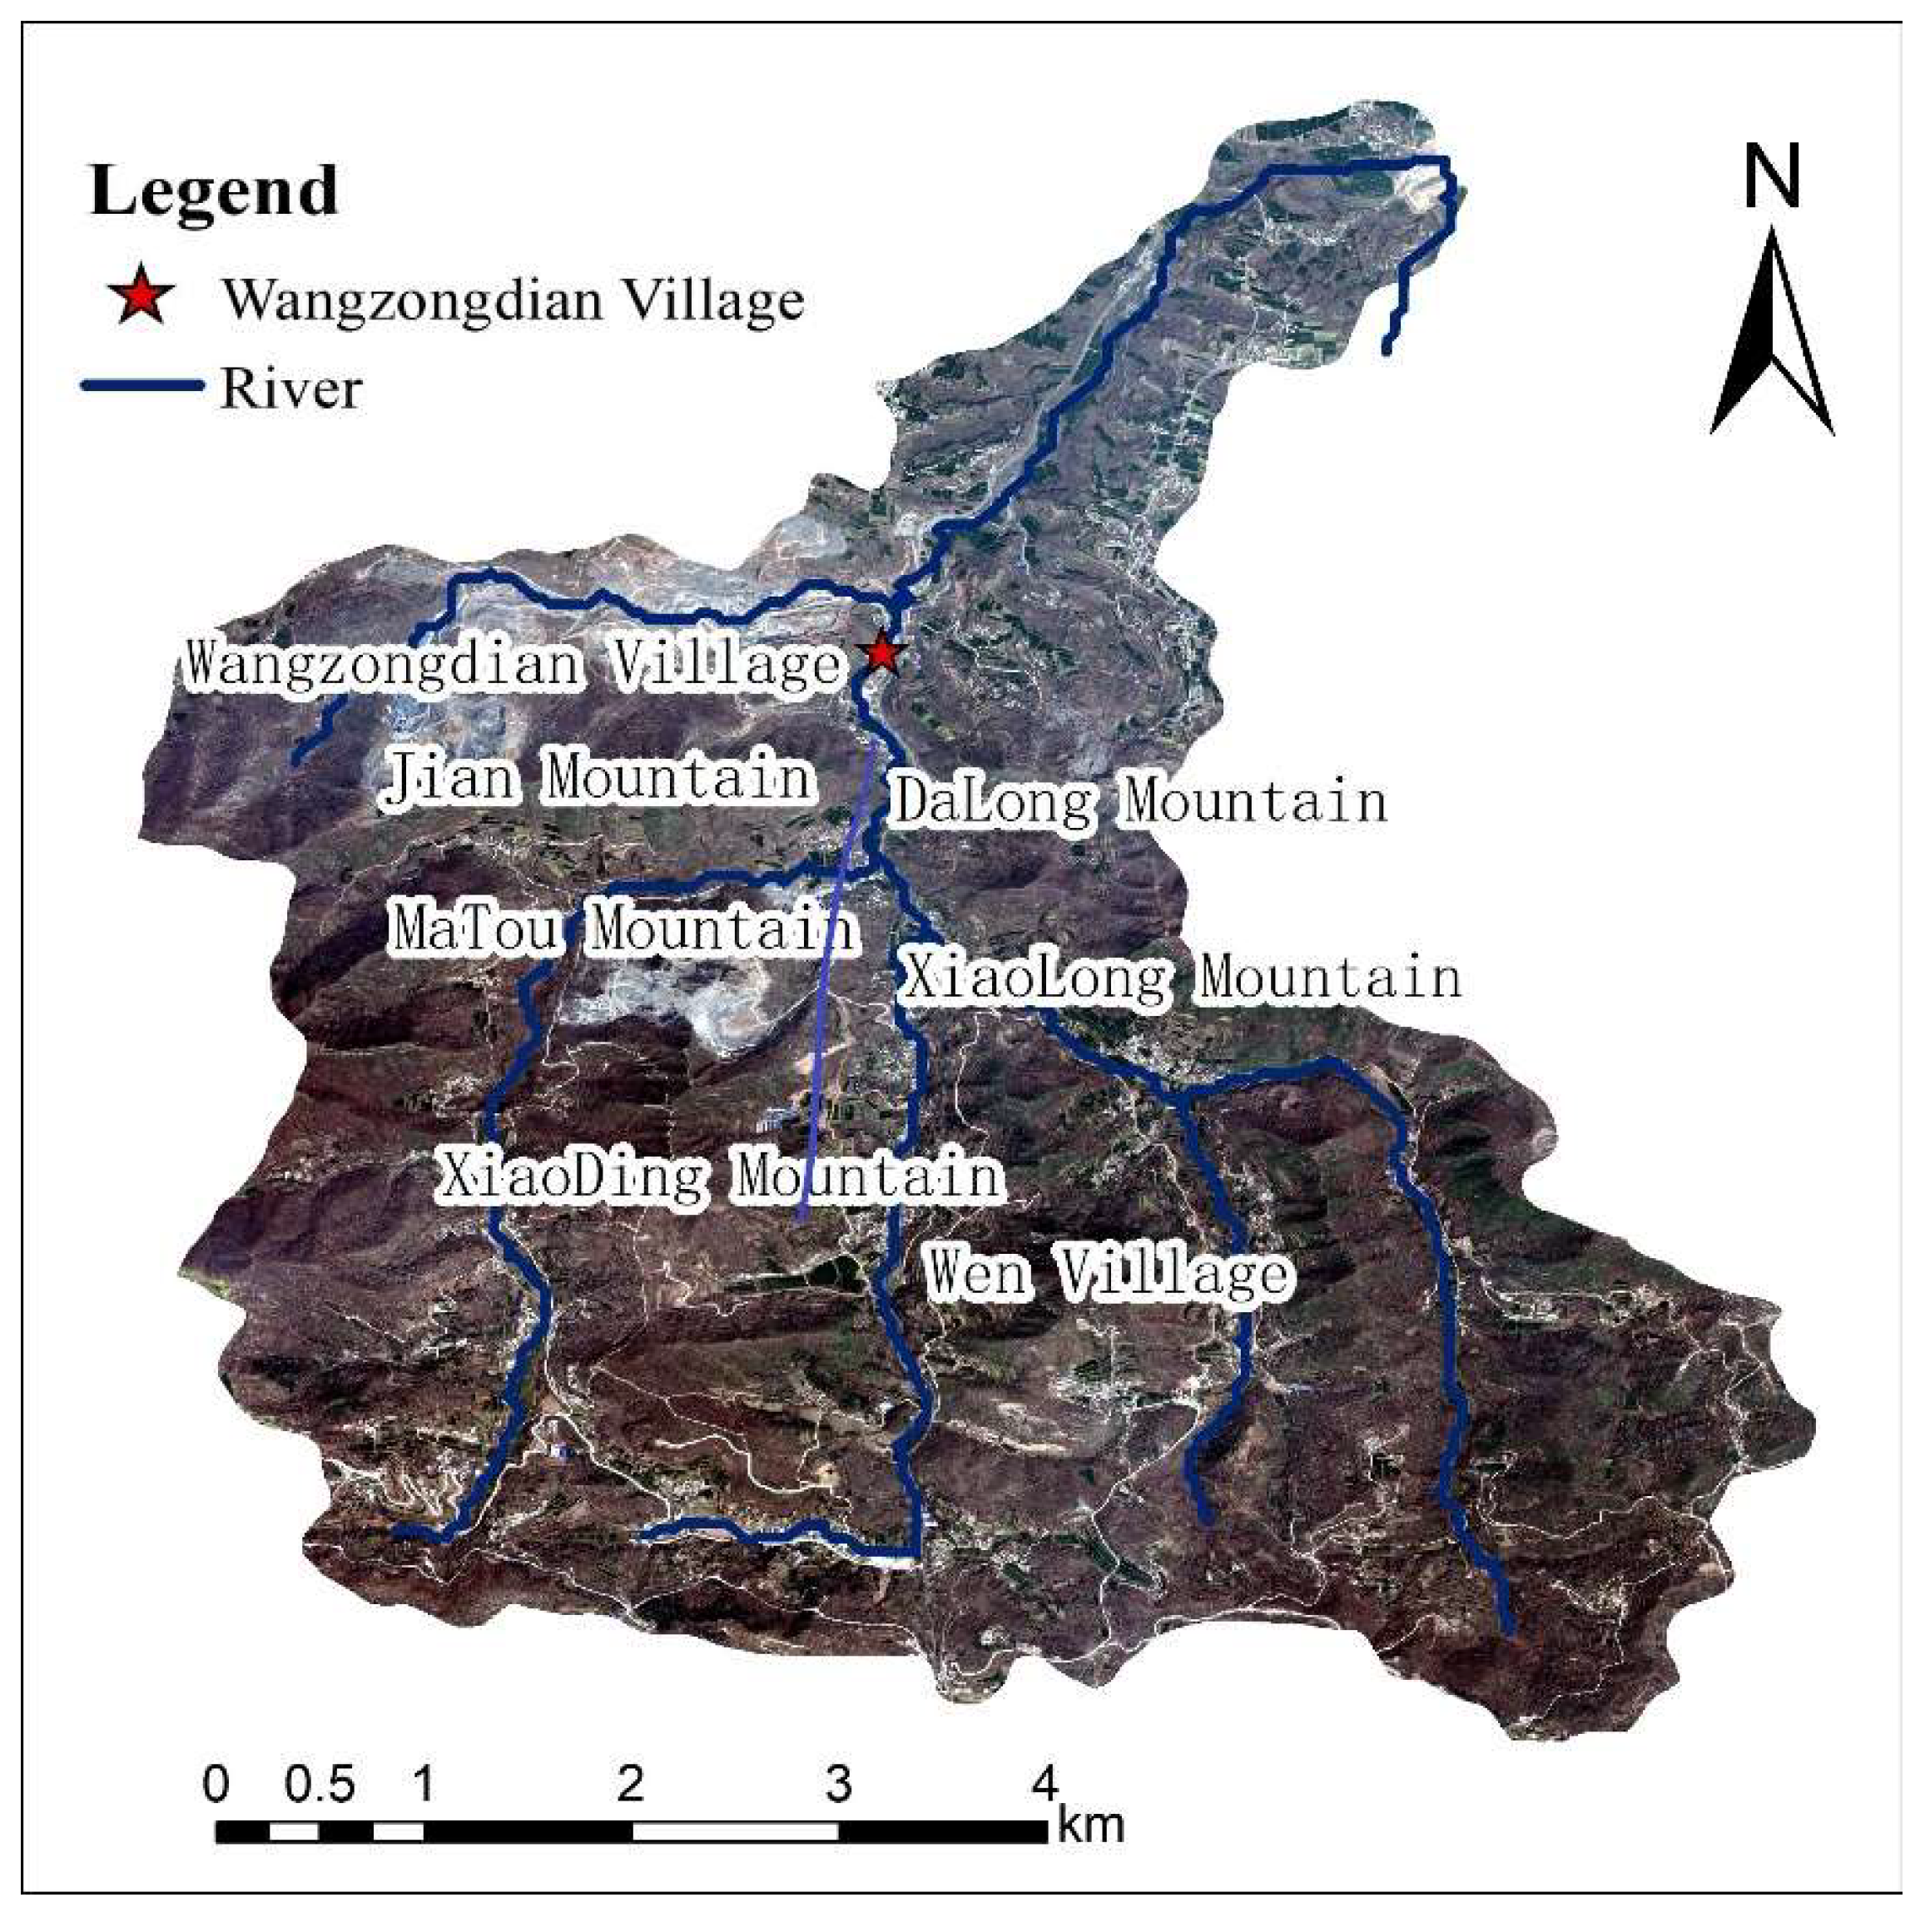
Wangzongdian Village is located in the central part of Henan Province, a shallow hilly area with complex topography, straddling the two major basins of the Yellow River and the Huai River. Its rainfall varies greatly interannually and is unevenly distributed within the year, with rainfall from June to September accounting for 65% of the annual rainfall. The upstream catchment area of Wangzongdian Village is 21.95 km2, including three branch ditches. The partially bare land in the upper reaches carried a large amount of sediment flowing with flash floods, causing damage to villages and infrastructure along the lower reaches of the river. Wangzongdian Village is surrounded by mountains on all sides, such as Dalong Mountain, Xiaolong Mountain, Xiaoding Mountain, Jianshan Mountain, Matou Mountain, and Jinjinggou Mountain. Such a geographical situation caused the flood to flow down mountains and converge in Wangzongdian Village, which was prone to cause flood disasters. The distribution of the watershed and location of Wangzongdian Village are shown in Figure 2.
2.2. Data Collection
The digital data used to build hydrological and hydrodynamic models mainly include terrain elevation data, small watersheds, water systems, nodes, soil texture, and land use. Table 1 records the details and source of the data.
2.2.1. Underlying Attribute Data
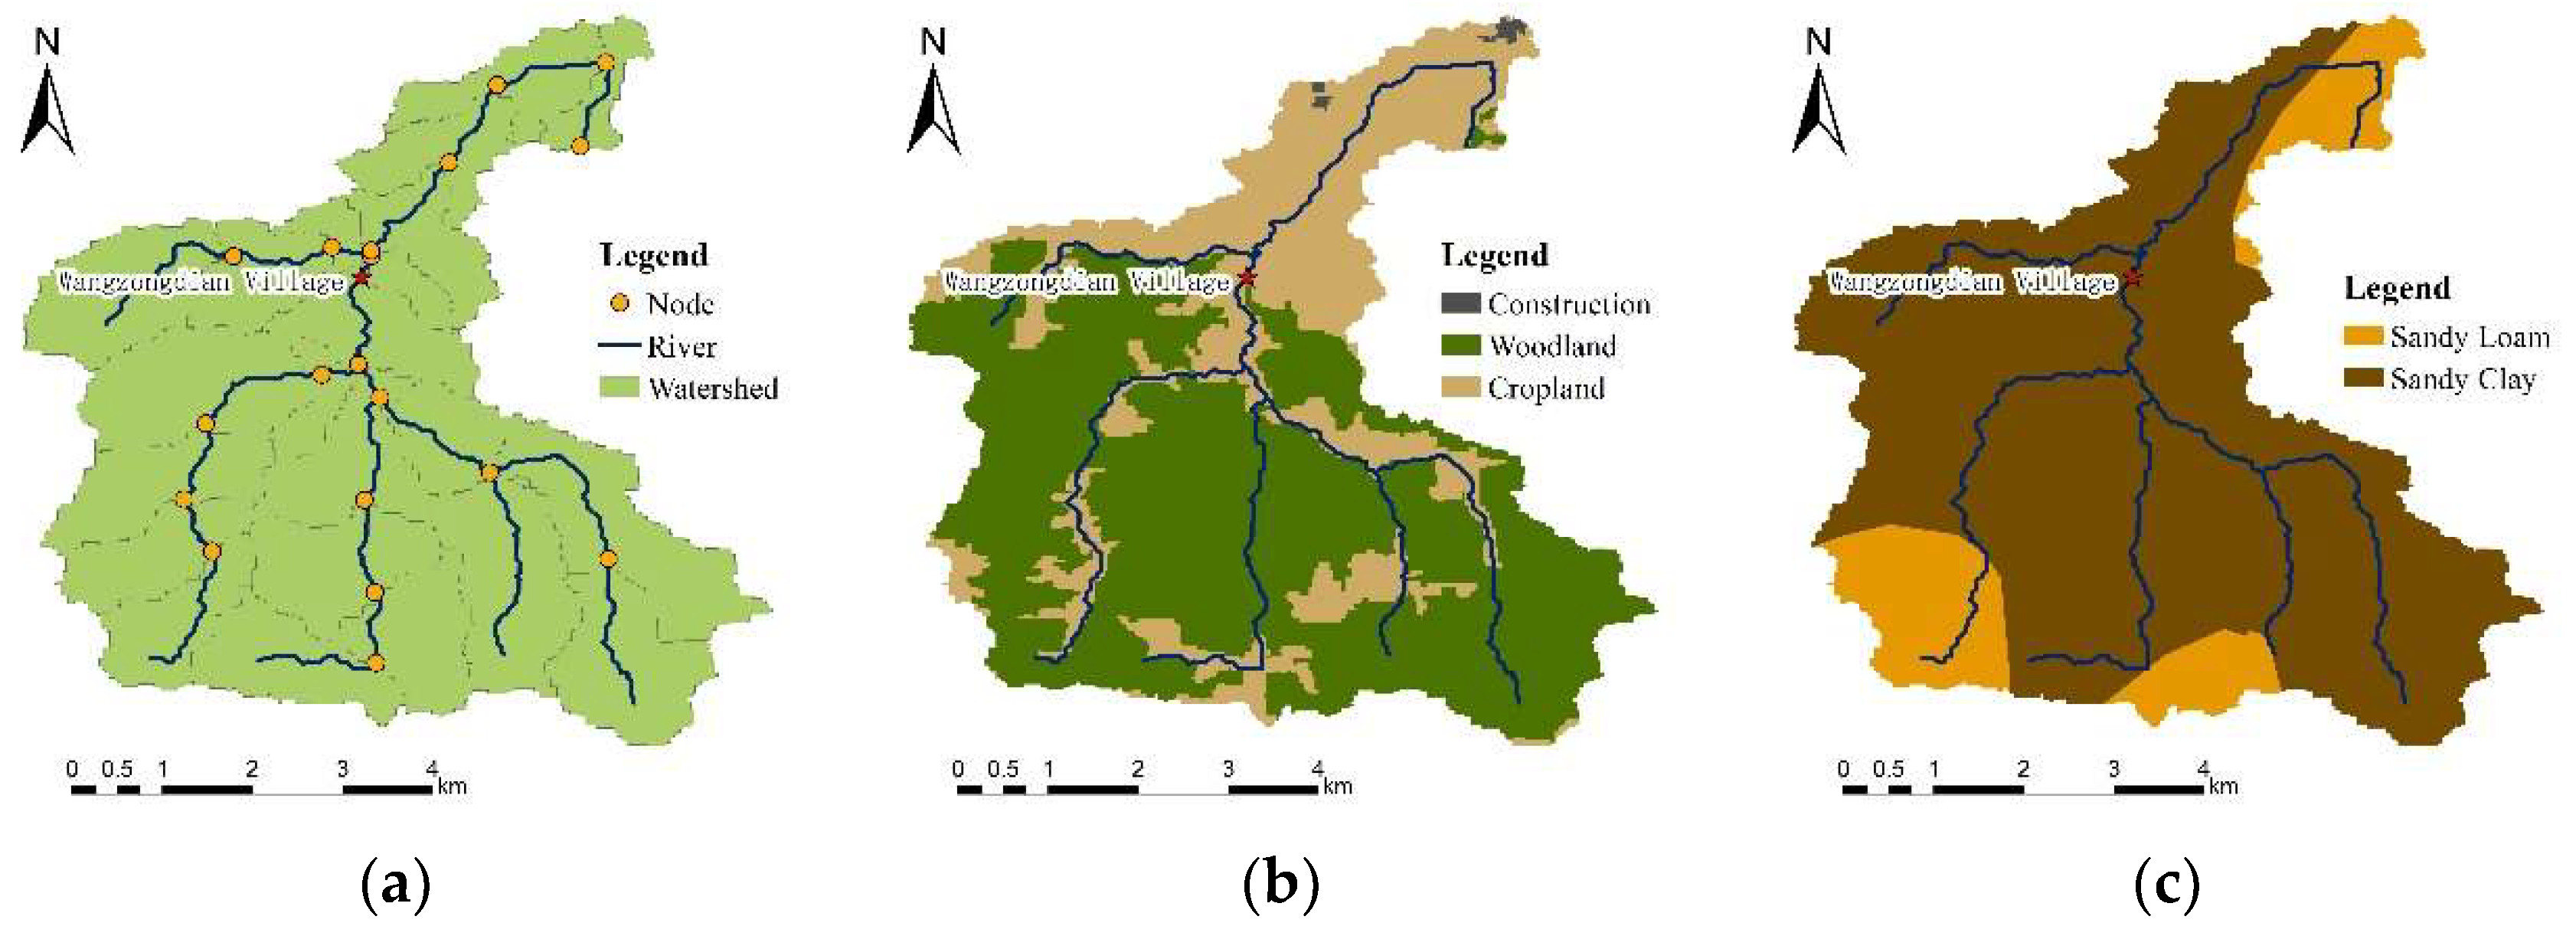
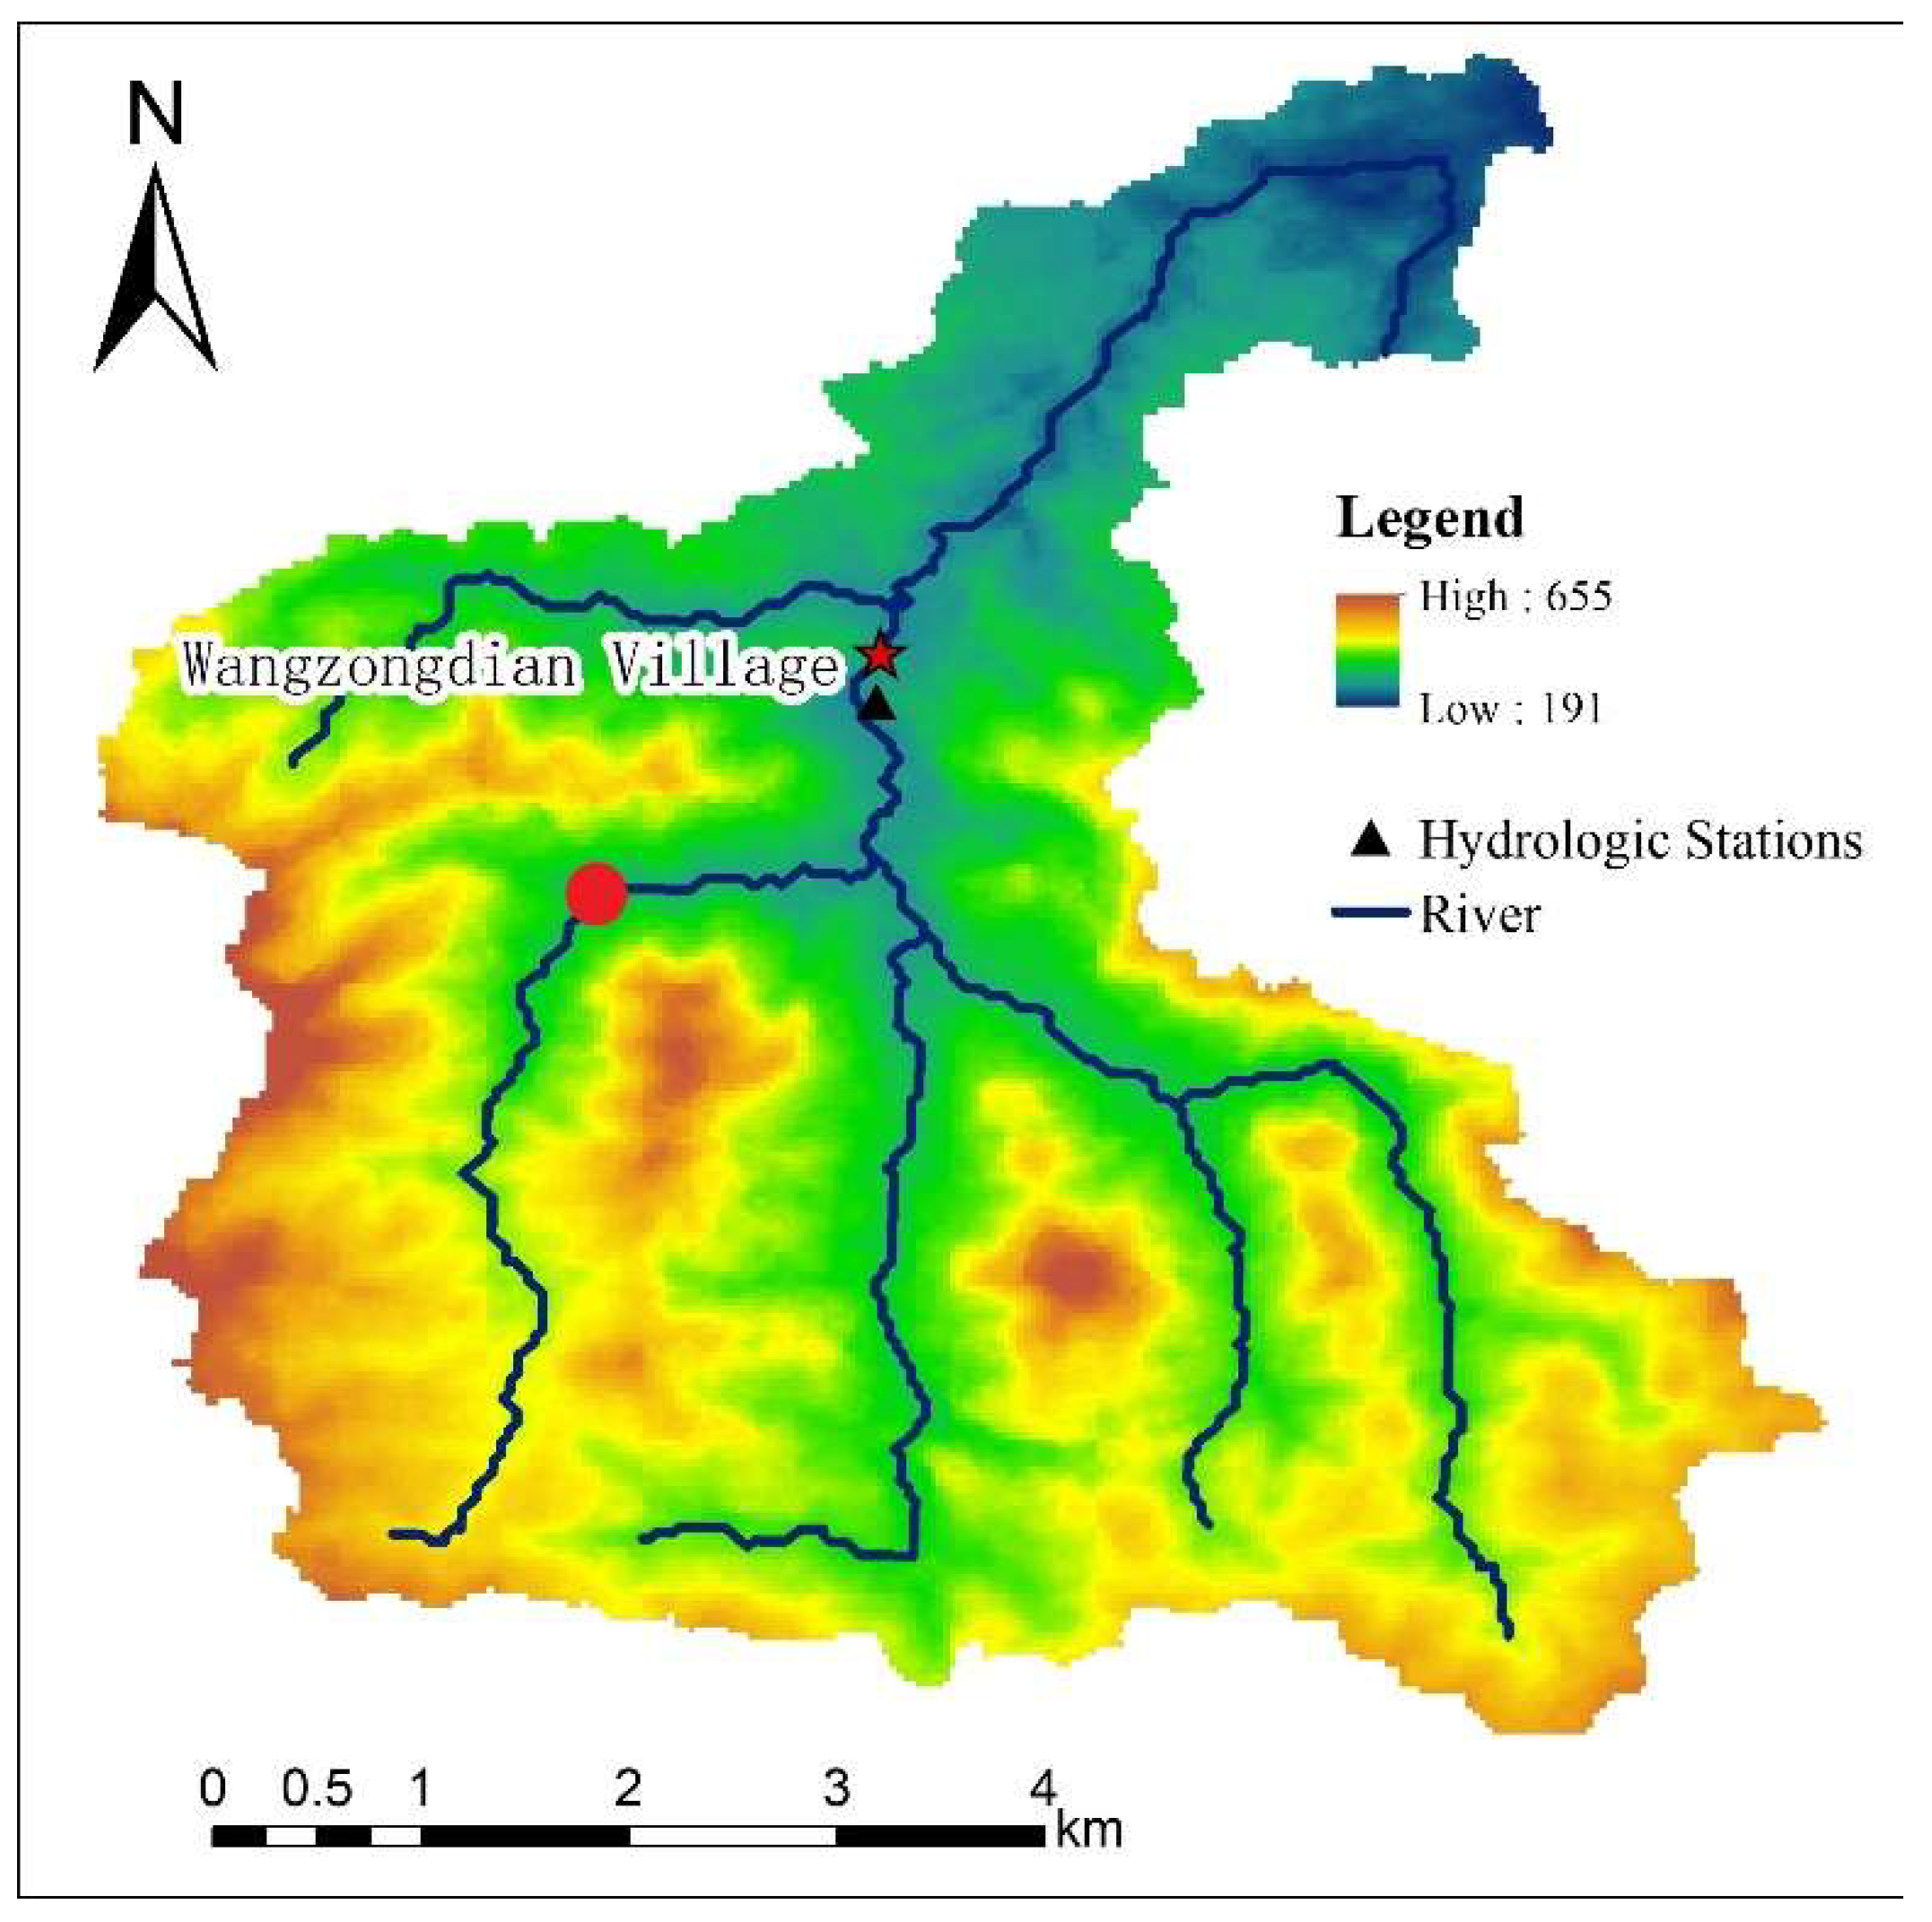
The modeled watershed area of the upper reaches of Wangzongdian was 29.1 km2, which was divided into 24 calculation units with an area of 0.16–1.6 km2. For each calculation unit, 75 items of basic attribute information, including spatial attributes, land use, and soil type of the small watershed, were extracted, and the spatial topological relationship with the small watershed as the unit was established, forming the basic data set of Wangzongdian Village flash flood small watershed. Statistically, the land use type of the watershed is dominated by arable land and forest land, accounting for 63% and 33% of the whole, respectively. The main types of soils are sandy loam and sandy clay, accounting for 66% and 34%, respectively. The distribution of land use, soil texture, and water system in the Wangzongdian watershed is shown in Figure 3. The 30 m DEM data are shown in Figure 4, and the red point is the dam-failure site.
2.2.2. Rainfall Data
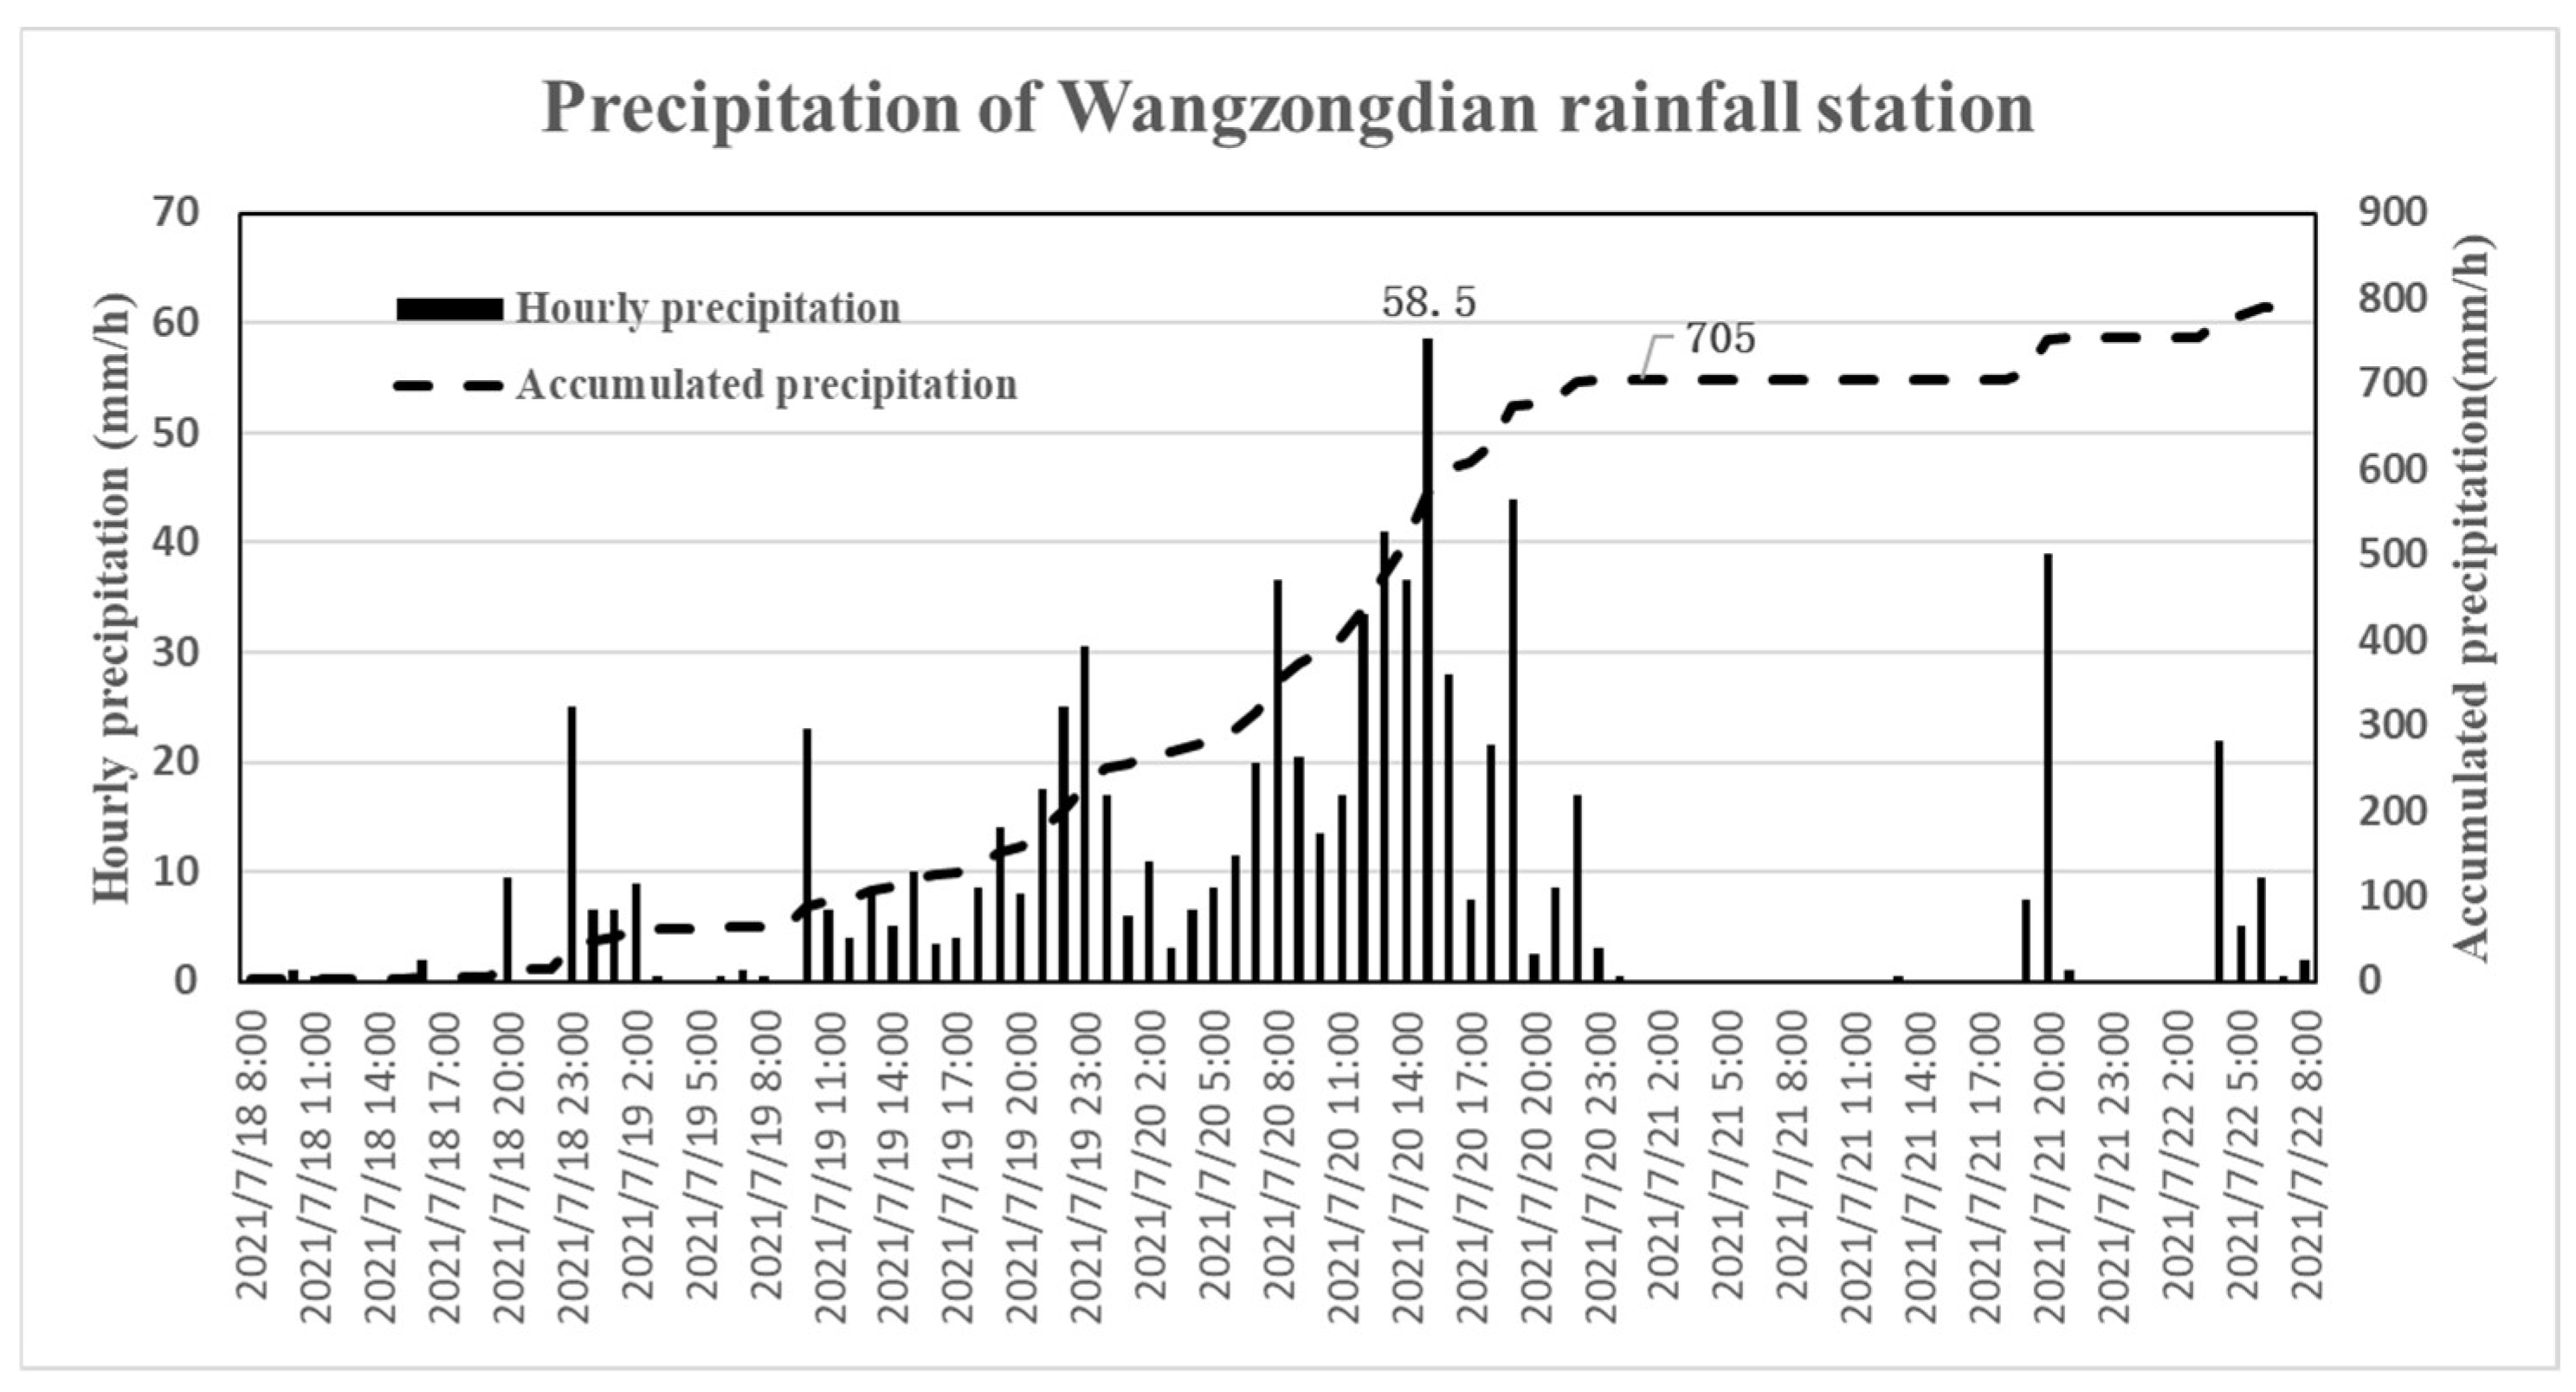
By analyzing the measured rainfall data of Wangzongdian Rainfall Station, it was found that the rainfall was wide in scope, large in amount, short in duration, and high in rainfall level. From 8:00 a.m. on July 18 to 8:00 a.m. on 22 July 2021, the total rainfall was 764.5 mm, exceeding its annual average rainfall (608 mm) by 156.5 mm in Wangzongdian Village, of which the maximum daily rainfall was 353 mm on July 20, exceeding half of the annual average rainfall (58.05%), with a rain intensity of 58.5 mm/h from 2:00 a.m. to 3:00 a.m. [21,22]. All broke the extreme historical value of local meteorological observation records. The cumulative and hourly rainfall distribution of Wangzongdian Village is shown in Figure 5 below.
2.2.3. Post-Disaster Investigation Data
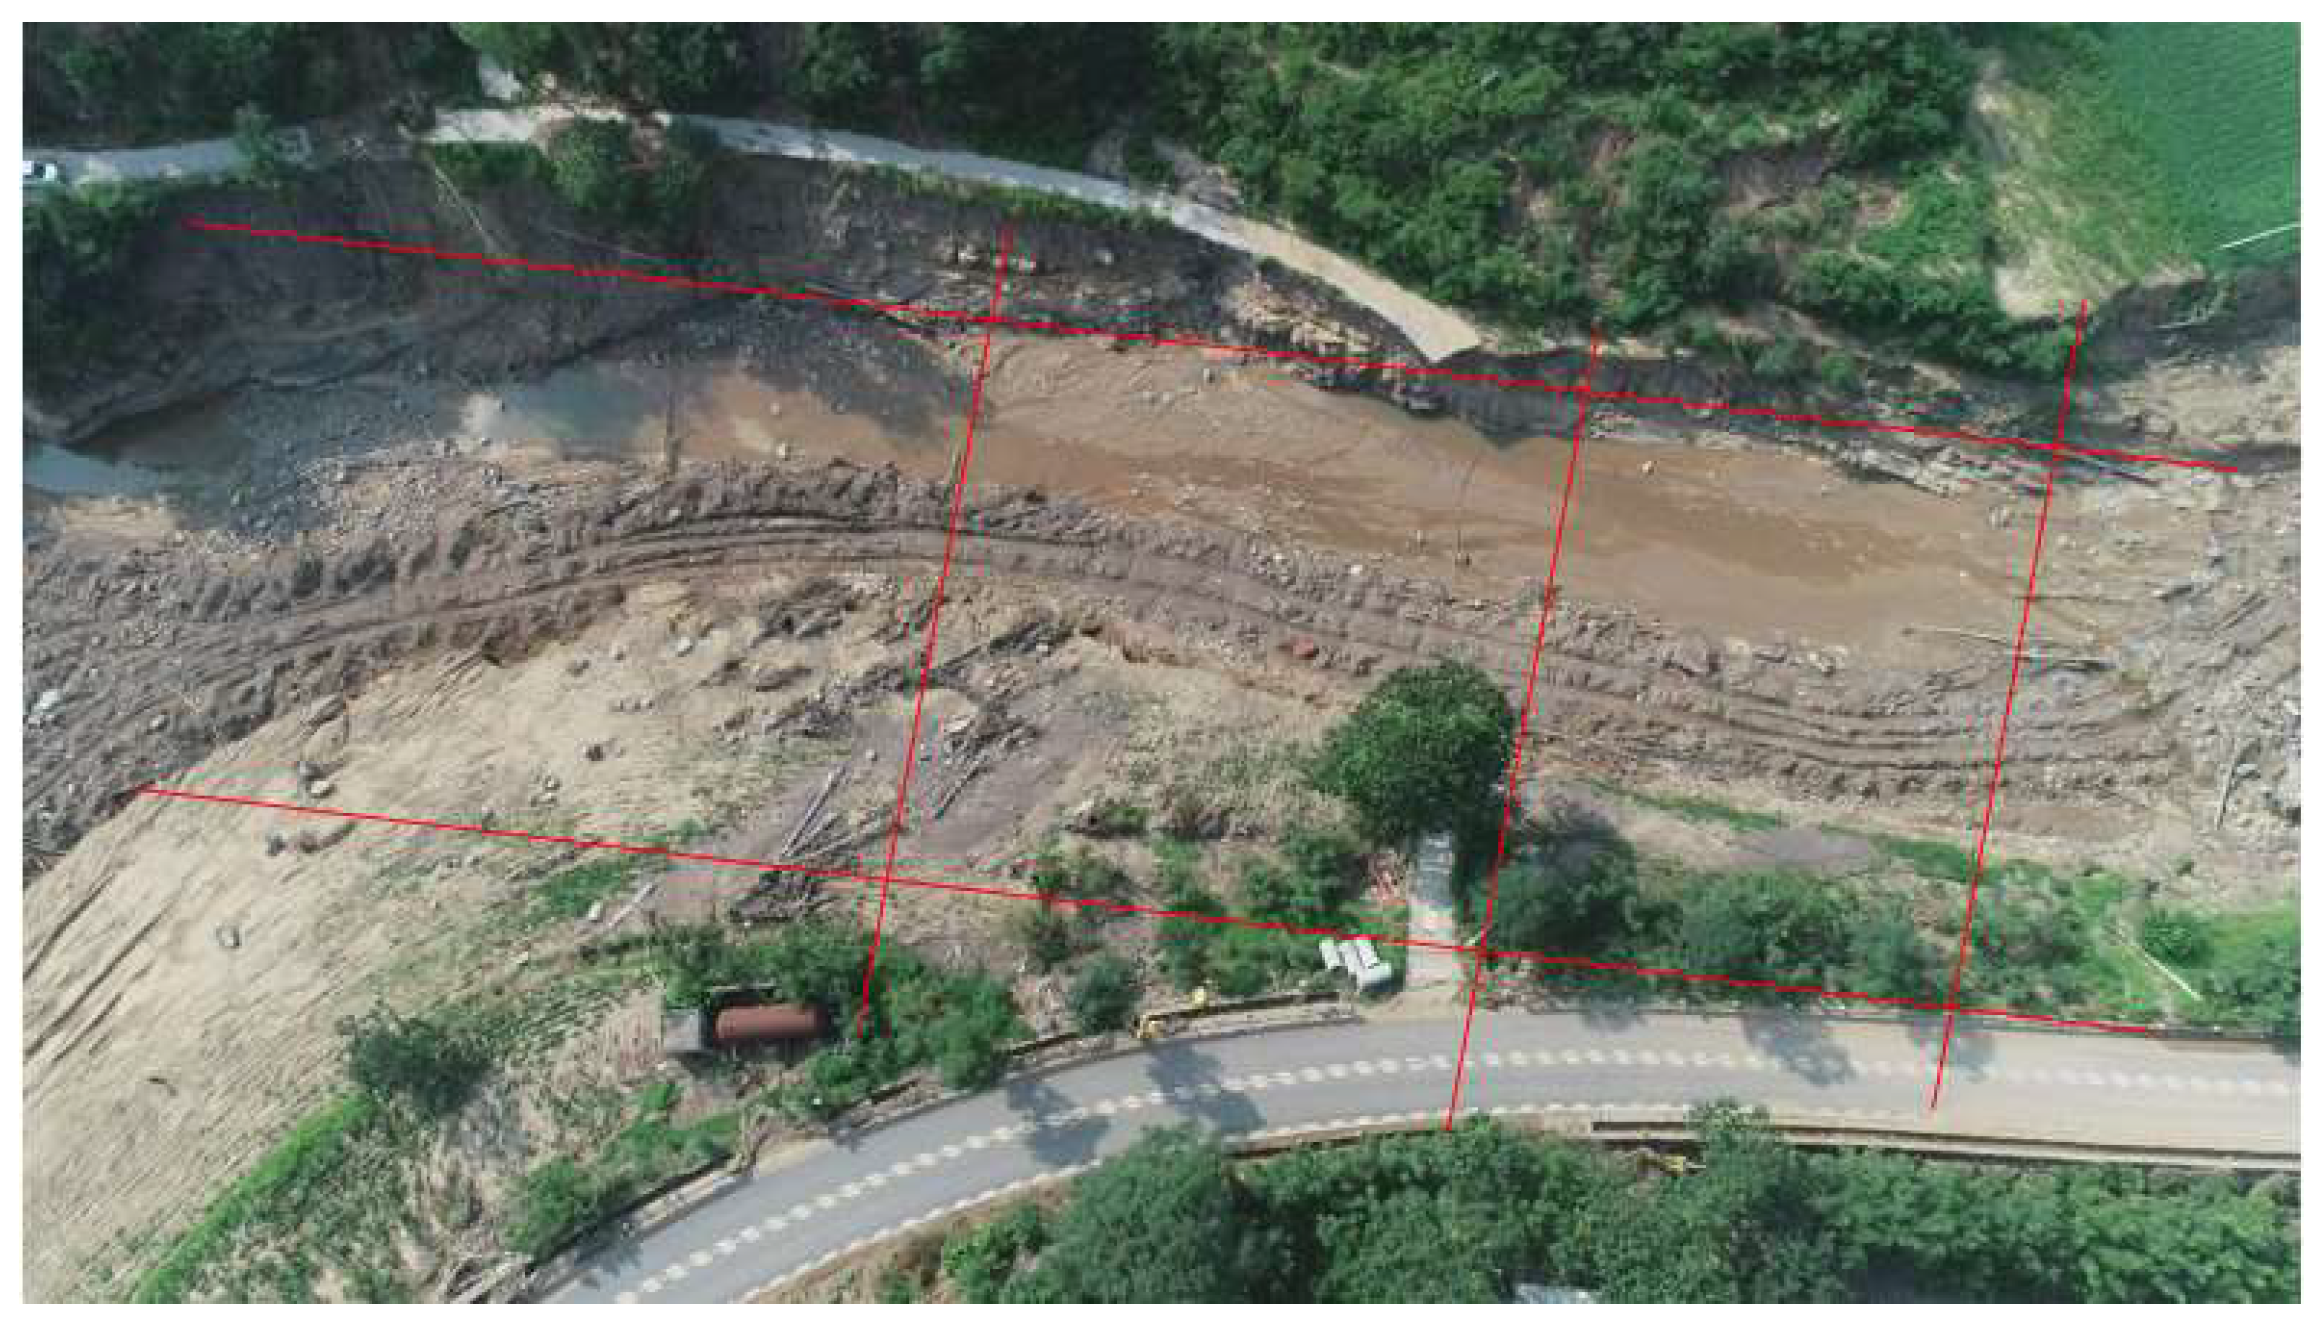
On the afternoon of August 6, 2021, Xingyang Municipal Water Resources Bureau commissioned a five-person survey team from Zhengzhou Hydrology and Water Resources Survey Bureau to investigate the river from upstream downward using instruments and equipment such as total station, RTK, and UAV. The team finally selected a relatively straight 100.4-m section of the channel segment as the survey section, as shown in the following Figure 6 [23], and the red line refers to the measuring line for the cross section.
The survey team measured the upper, middle, and lower sections, and it was known that the upper section was 60 m away from the middle section and the middle section 40.4 m from the lower section. According to the on-site survey of the river, the roughness n was determined to be 0.032, the average section area A was calculated to be 144 m2, the average wetted perimeter was 48 m, the hydraulic radius R was 2.99, and the surface slope S was 0.006. By using the mathematical formula , the peak discharge was preliminarily estimated to be 724 m3/s, and the average section velocity is 5.03 m/s. In this study, the disaster survey data will be compared with the simulation results as the result of actual measurement to verify the accuracy of the simulation results.
3. Simulation Analysis
3.1. Modeling Strategy
The crux of flash flood disaster simulation review lies in the collection of basic data and the optimization of simulation methods. Due to the strong destructive power of flash floods, had a great impact on the traffic and topography of the affected areas, which brought great difficulties to post-disaster data collection. In this case, investigators were unable to quickly collect all disaster-related data at one time, making the construction of the model more challenging. In this paper, a two-phase flash flood disaster review strategy was put forward, and different models were adopted to simulate and analyze the disaster according to different phases of data collection:
In Phase I, the distributed flash flood hydrological model was mainly used to simulate and review the disaster by using public data such as satellite remote sensing, collecting information on watershed underlying surface and rainfall data monitored by meteorological and hydrological departments. The main goal of this phase was to analyze the flood magnitude of the target flash flood disaster through simulation and to clarify the flood source.
In Phase II, focusing on the refined hydrodynamic model simulation, based on the simulation results of Phase I, a two-dimensional hydrodynamic model was constructed to simulate and analyze the spatial and temporal changes of the flood routing and inundation area in the more severely affected areas based on the actual measured, refined terrain, to replay the flood occurrence, the collapse of embankments and dams, and the inundation of villages and towns, to truly clarify the causes of flash flood disaster, and to provide guidance for the design of embankments, buildings and roads in some villages and towns in post-disaster reconstruction.
3.2. Modeling Tools
3.2.1. Hydrological Model
In this study, a modular small watershed flood analysis system, FFMS (Flash Flood Modelling System), was used to simulate the flooding process. As a new generation of small and medium-sized watershed heavy rains and flooding simulation software developed by the research team of China Institute of Water Resources and Hydropower Research, this software integrated the advantages of computer programming languages such as C++, Fortran, Java, and multi-format data pre- and post-processing technology supports the automatic division of small watersheds and parameter extraction. Moreover, it can realize modular parallel calculation of runoff generation and provide both intelligent parameter calibration schemes and two-dimensional visualization and display [24,25]. The software supports several domestic and international hydrological simulation methods (HEC, PRMS, Xinanjiang model, spatio-temporal variable source mixed runoff model) for automatic modeling and manual drag-and-drop modeling and has an intelligent expert parameter database containing watershed underlying surface runoff generation and river channel parameters under different conditions.
The hydrological simulation of the flash flood disaster in Wangzongdian was conducted based on this model software. The model constructed a distributed hydrological model of a small watershed in terms of planar mixing, vertical mixing, and temporal mixing of excess infiltration/storage [26] by dividing different geomorphic hydrological response units and generalizing the one-to-one correspondence between each small watershed geomorphic hydrological response unit and different runoff generation mechanisms [27]. In particular, for flash flood runoff generation, the model used CARTO one-dimensional unsaturated infiltration simulation method [28,29]. The soil moisture content domain was discretized into an interval with constant moisture content, and the one-dimensional infiltration equation was derived to quickly obtain the vertical displacement of the wetting front. Considering the mutual suction between different moisture content units, the lateral displacement of the wetting front was redistributed. Compared with Green-Ampt and Richard’s equations, this method used a numerical scheme without estimating the nonlinear gradient, which was more efficient and accurate [30].
3.2.2. Hydrodynamic Model
IFMS (Integrated Flood Modeling System) is a one- and two-dimensional visual hydrodynamic simulation software developed by the China Institute of Water Resources and Hydropower Research [31,32]. The software includes a 1D river network calculation engine supporting complex hydraulic engineering scheduling simulation, a high-resolution 2D flood analysis calculation engine, and a fast unstructured grid generation tool. The software is based on the GIS platform to complete model pre- and post-processing, which can realize 1D and 2D flood simulation and urban pipe network and 2D model coupling simulation. The software has strong visualization functions and simple operation, and it has now realized the coupled calculation of hydrological and hydrodynamic models with a CPU-GPU parallel computing strategy, which greatly improves computational efficiency [33].
The two-dimensional shallow water equation of water depth average can be simplified as follows:
where, h is the water depth; u is the velocity in the x direction; v is the velocity in the y direction; Sx, Sy are the source item
3.3. Modeling Process
The distributed hydrological model of the small watershed above Wangzongdian Village was established by using FFMS software based on Wangzongdian small watershed basic data set layer data and rainfall data of main stations. The inverse distance weighting method was used to obtain the rainfall at the surface of small watersheds, and the spatio-temporal variable source mixed runoff generation simulation method was selected for runoff generation calculation. The triangular generalized unit line method was used for slope confluence, the linear reservoir method for base flow, and the motion wave method for flood routing. This modeling process required a small amount of data and took a short time.
Based on the high-resolution DEM data (Figure 4), the red point in the Figure is the dam-failure site. Applied IFMS software to construct a two-dimensional hydrodynamic model of a small Wangzongdian watershed. The guiding principle was that the dam-failure formula was adopted to calculate the dam-failure site, and the results of the hydrological model were still used as boundary conditions for other tributaries.
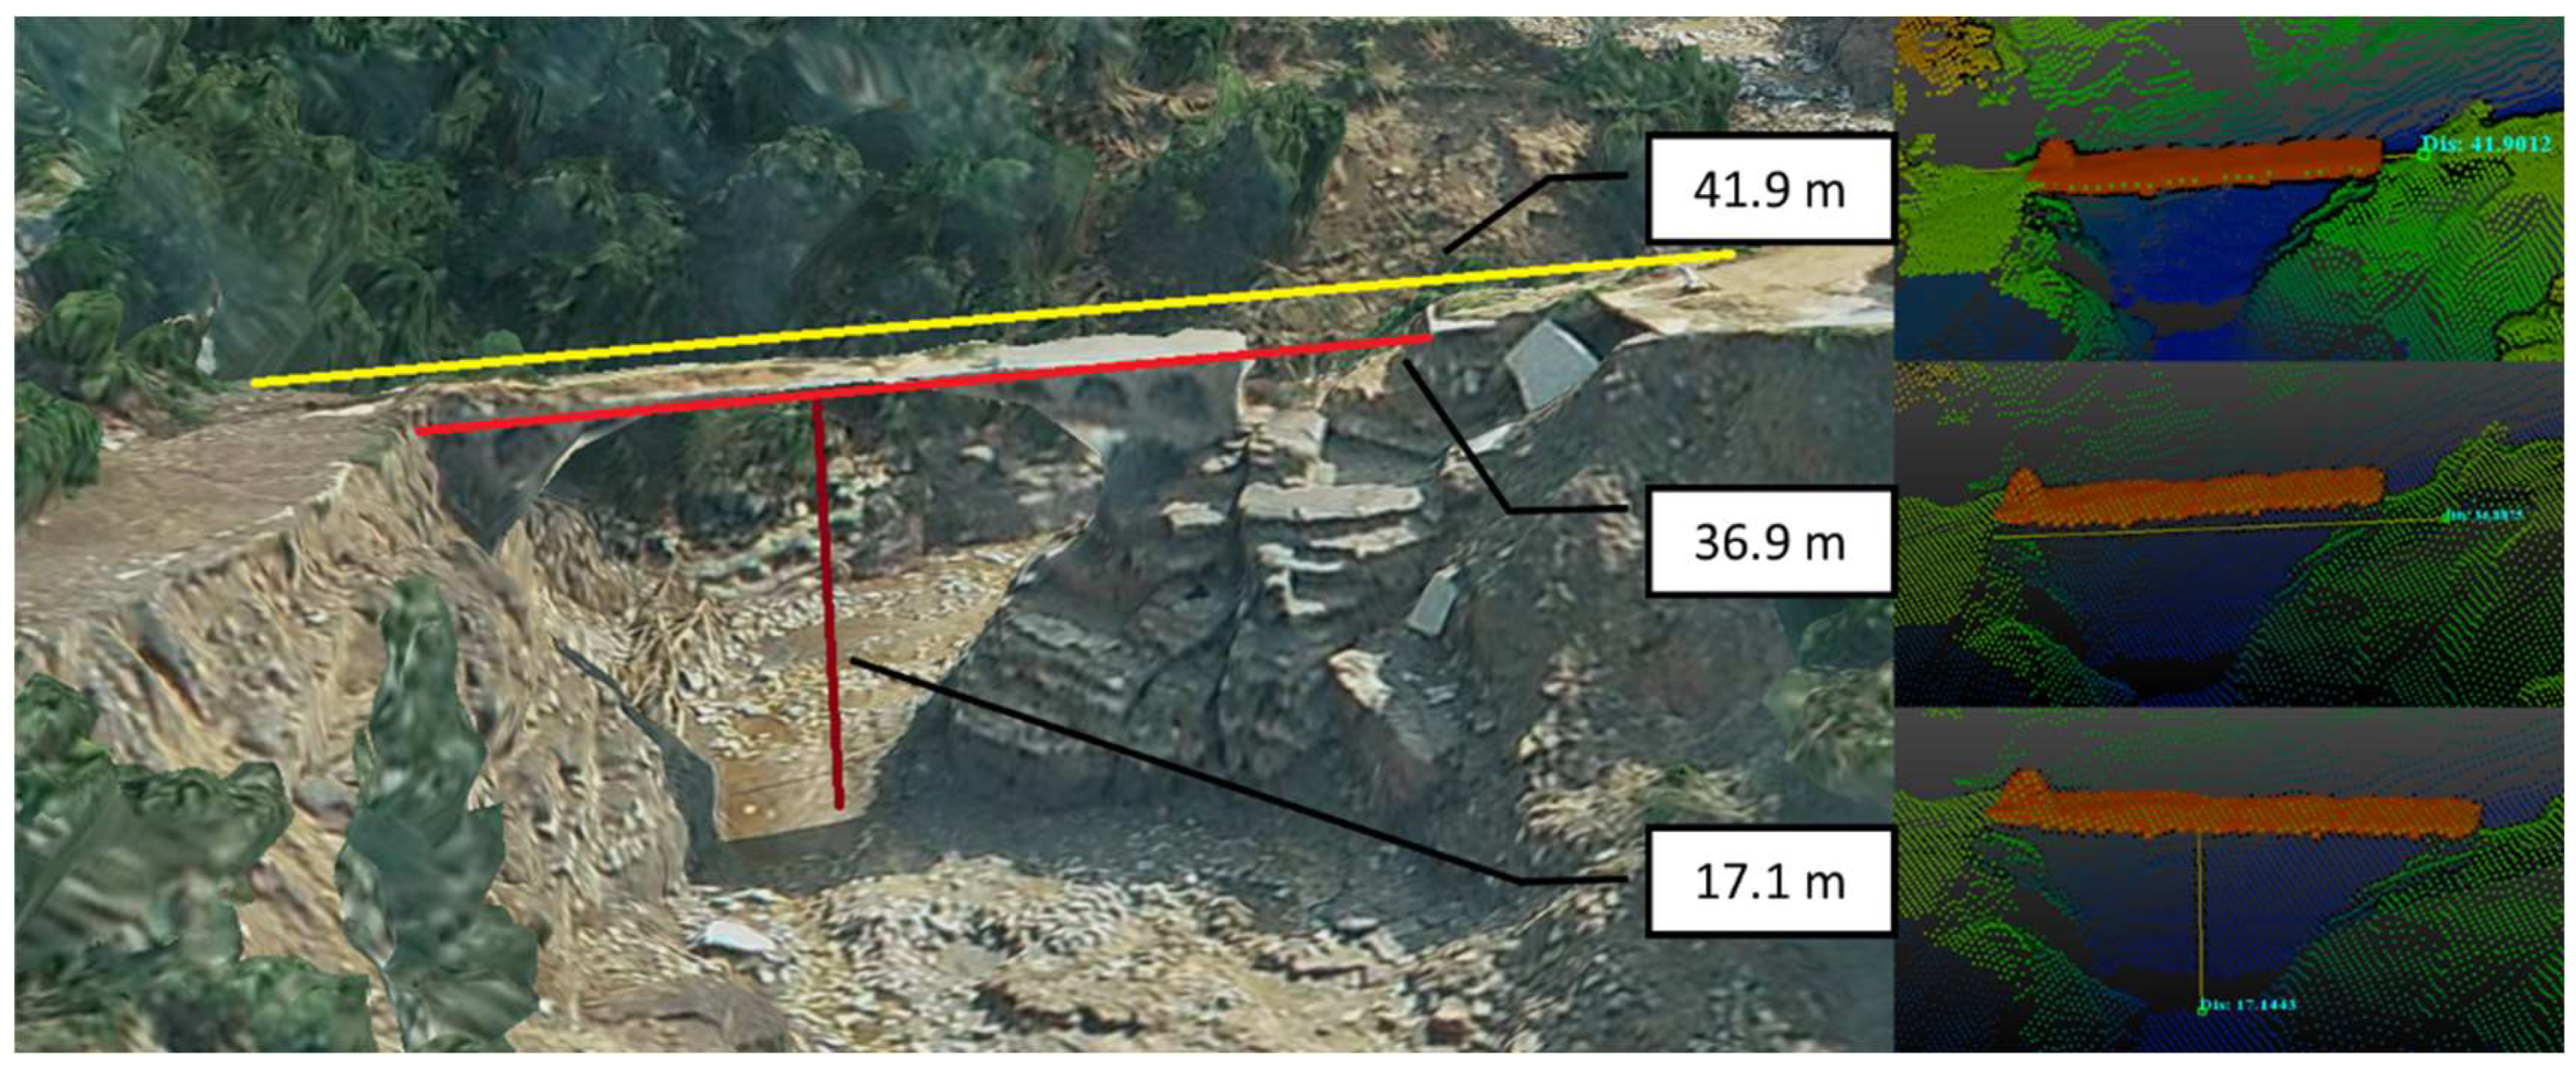
The required site survey data and laser point cloud measurement data for the dam failure are shown in Figure 7. The calculation of the peak flow of the breach was based on the empirical formula of the Research Institute of China’s Ministry of Railways [34].
where Qmax is the maximum flow rate of the dam bursting flood (m3/s); g is the acceleration of gravity (m/s2); g is the length of the reservoir area; when L/B > 5, take the L/B = 5; b is the average width of the breach (m); ℎ0 is the water depth in front of the dam (m); ℎ is the average height of the residual dam body at the breach (m); k is the empirical coefficient, and k and h are taken as 0. The laser point cloud measurement value L = 600 in Figure 7; B = 41.9(yellow line); b = 36.9(red line); h0 = 17.1(dark red line), Qmax = 3013 m3/s can be obtained.
4. Simulation Results and Analysis
4.1. Simulation Results
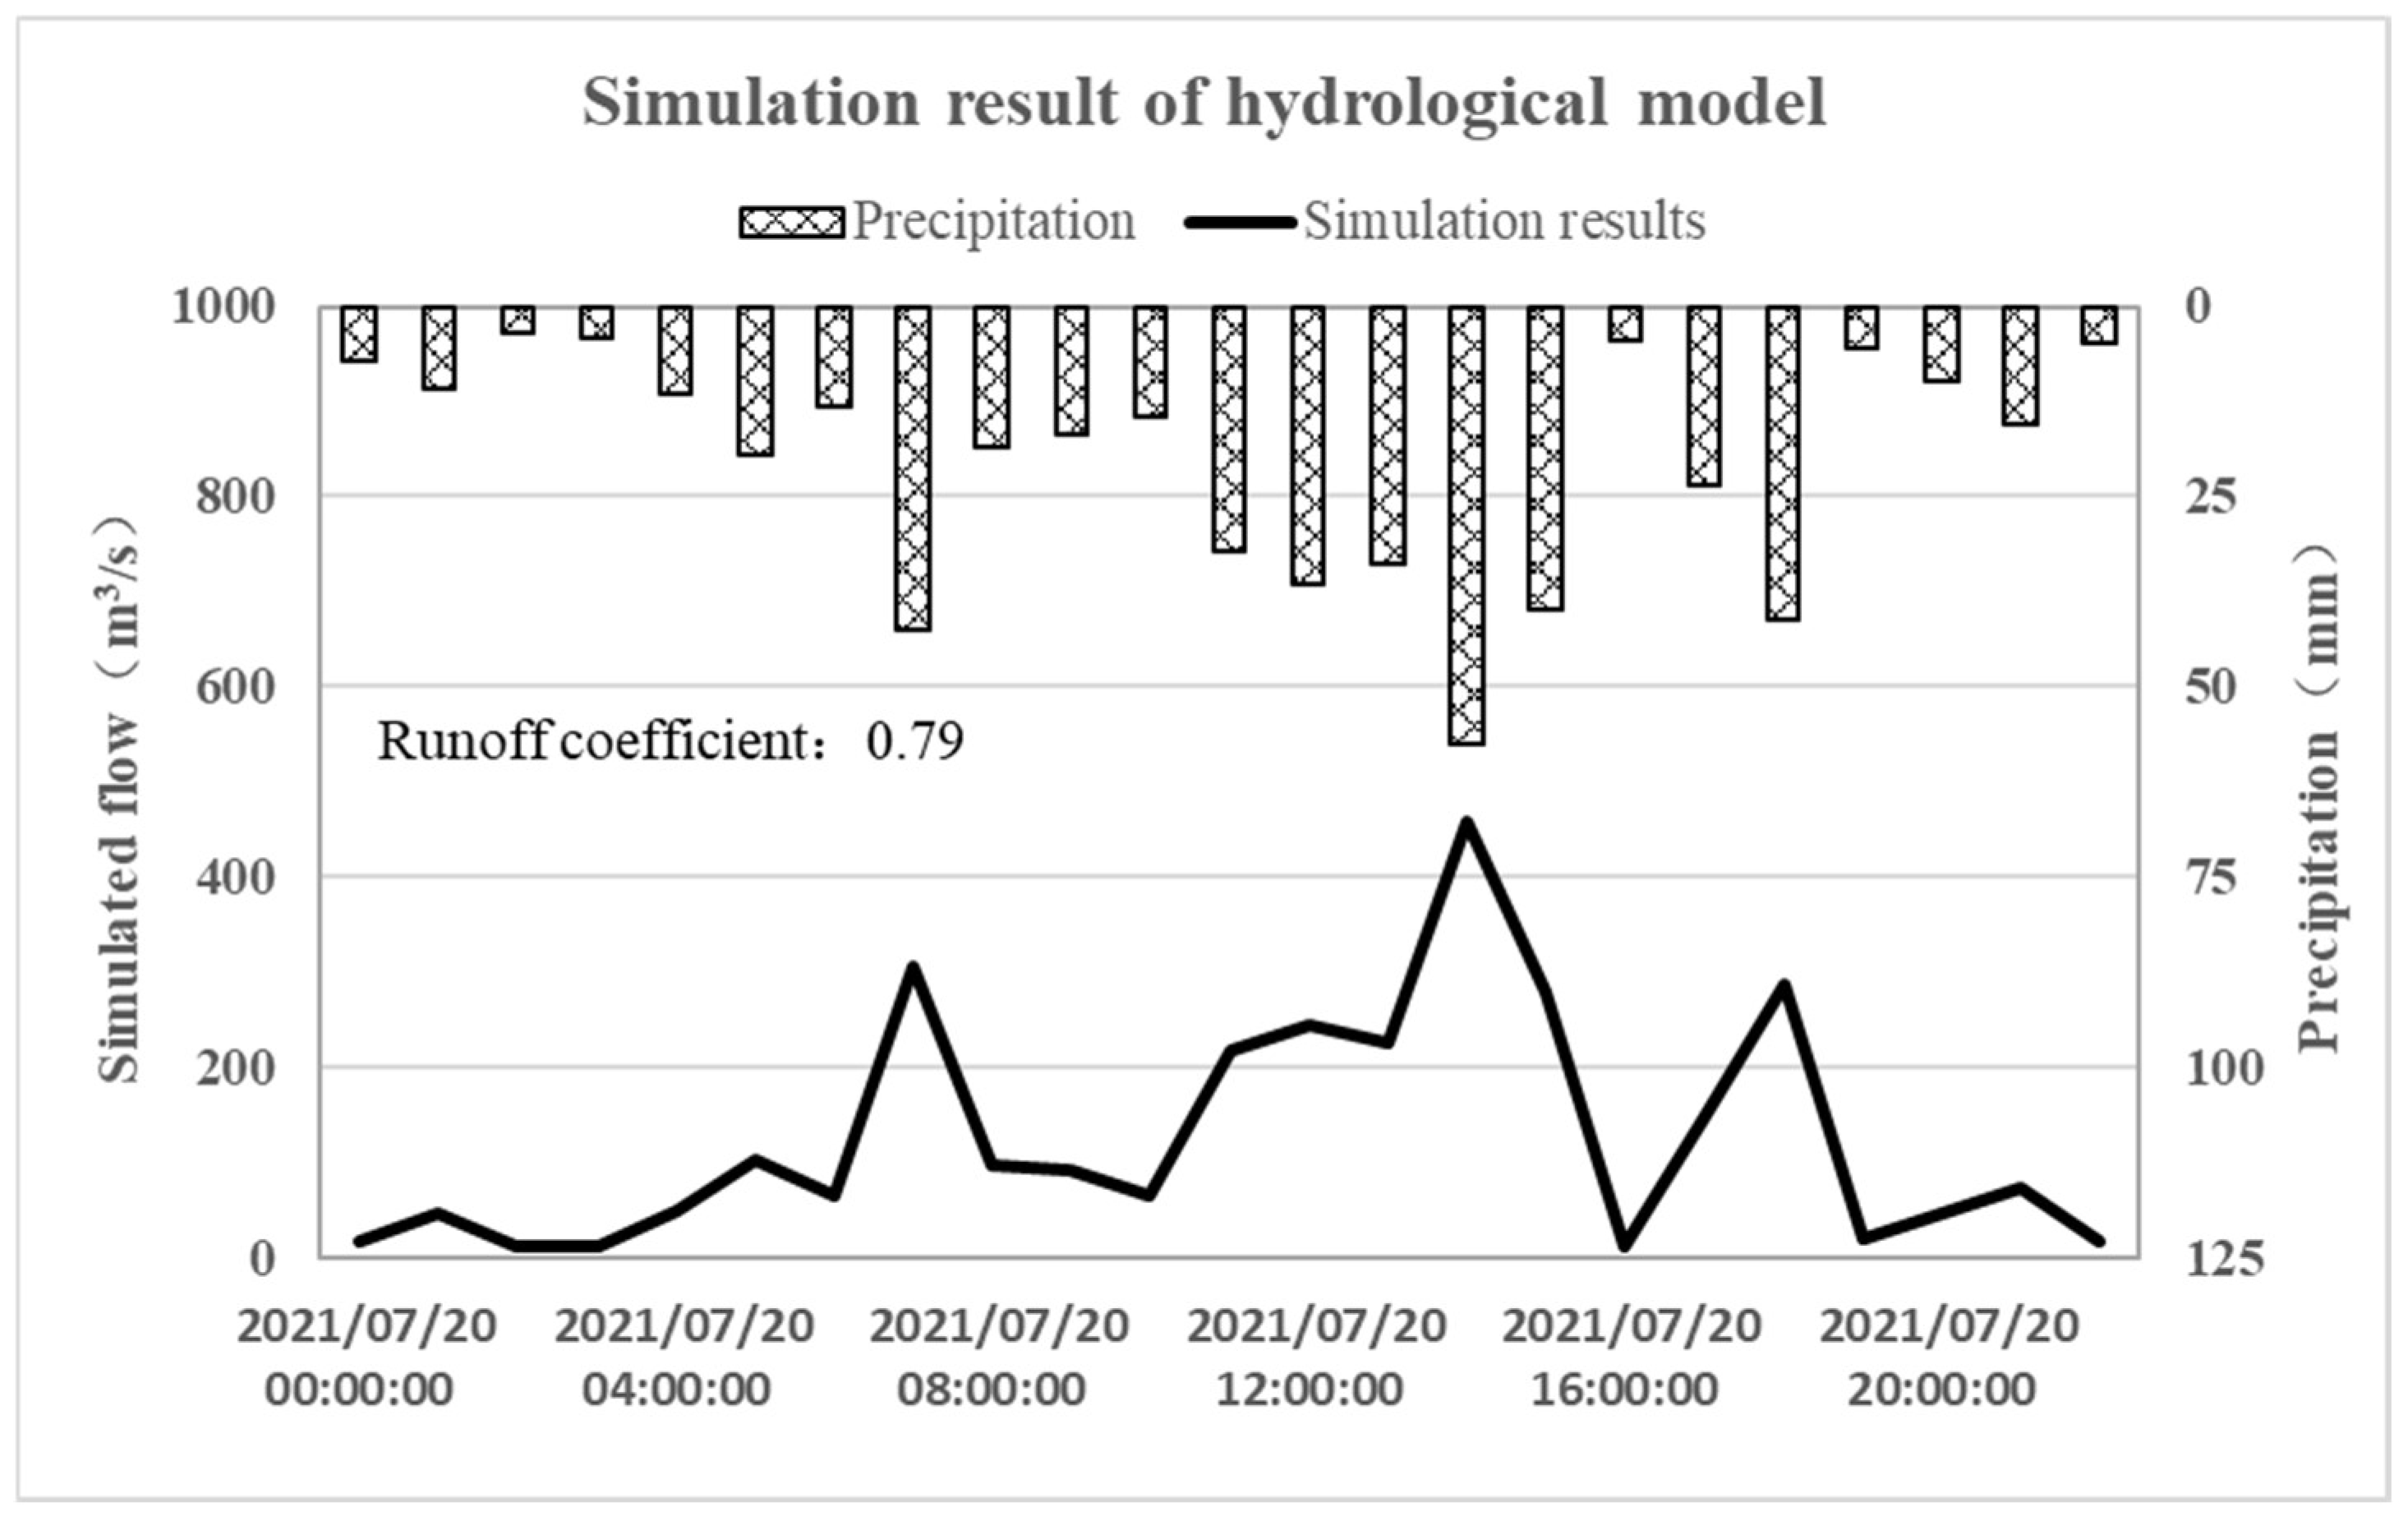
The model used default parameters for the distributed hydrological simulation of the hourly flash flood process in the Wangzongdian watershed from 0:00 a.m. on July 20 to 22:00 p.m. on July 2021. The simulated flood process line of the FFMS model is shown in Figure 8. The calculated runoff coefficient was about 0.79. Considering the large rain intensity and short duration of the flash flood in Wangzongdian Village, the simulated runoff coefficient was more reasonable. But the peak flow was 414.25 m3/s, only about half of the disaster survey results (724 m3/s). Accordingly, it was preliminarily judged that there was a special case in a flood event which changed the natural process of runoff generation and flood routing. Based on the proposed flash flood simulation review strategy, the need for a second phase of hydrodynamic simulation analysis was assessed.
Based on the conclusion of the hydrological simulation, field investigations showed that there was an arch bridge dam failure in the upper reaches of the watershed. This dam break process disrupted the natural runoff mechanisms of the watershed, making the distributed hydrologic model unable to better simulate the development of this flood. According to the review strategy, the disaster was simulated in the second step by a coupled hydrological and hydrodynamic simulation.
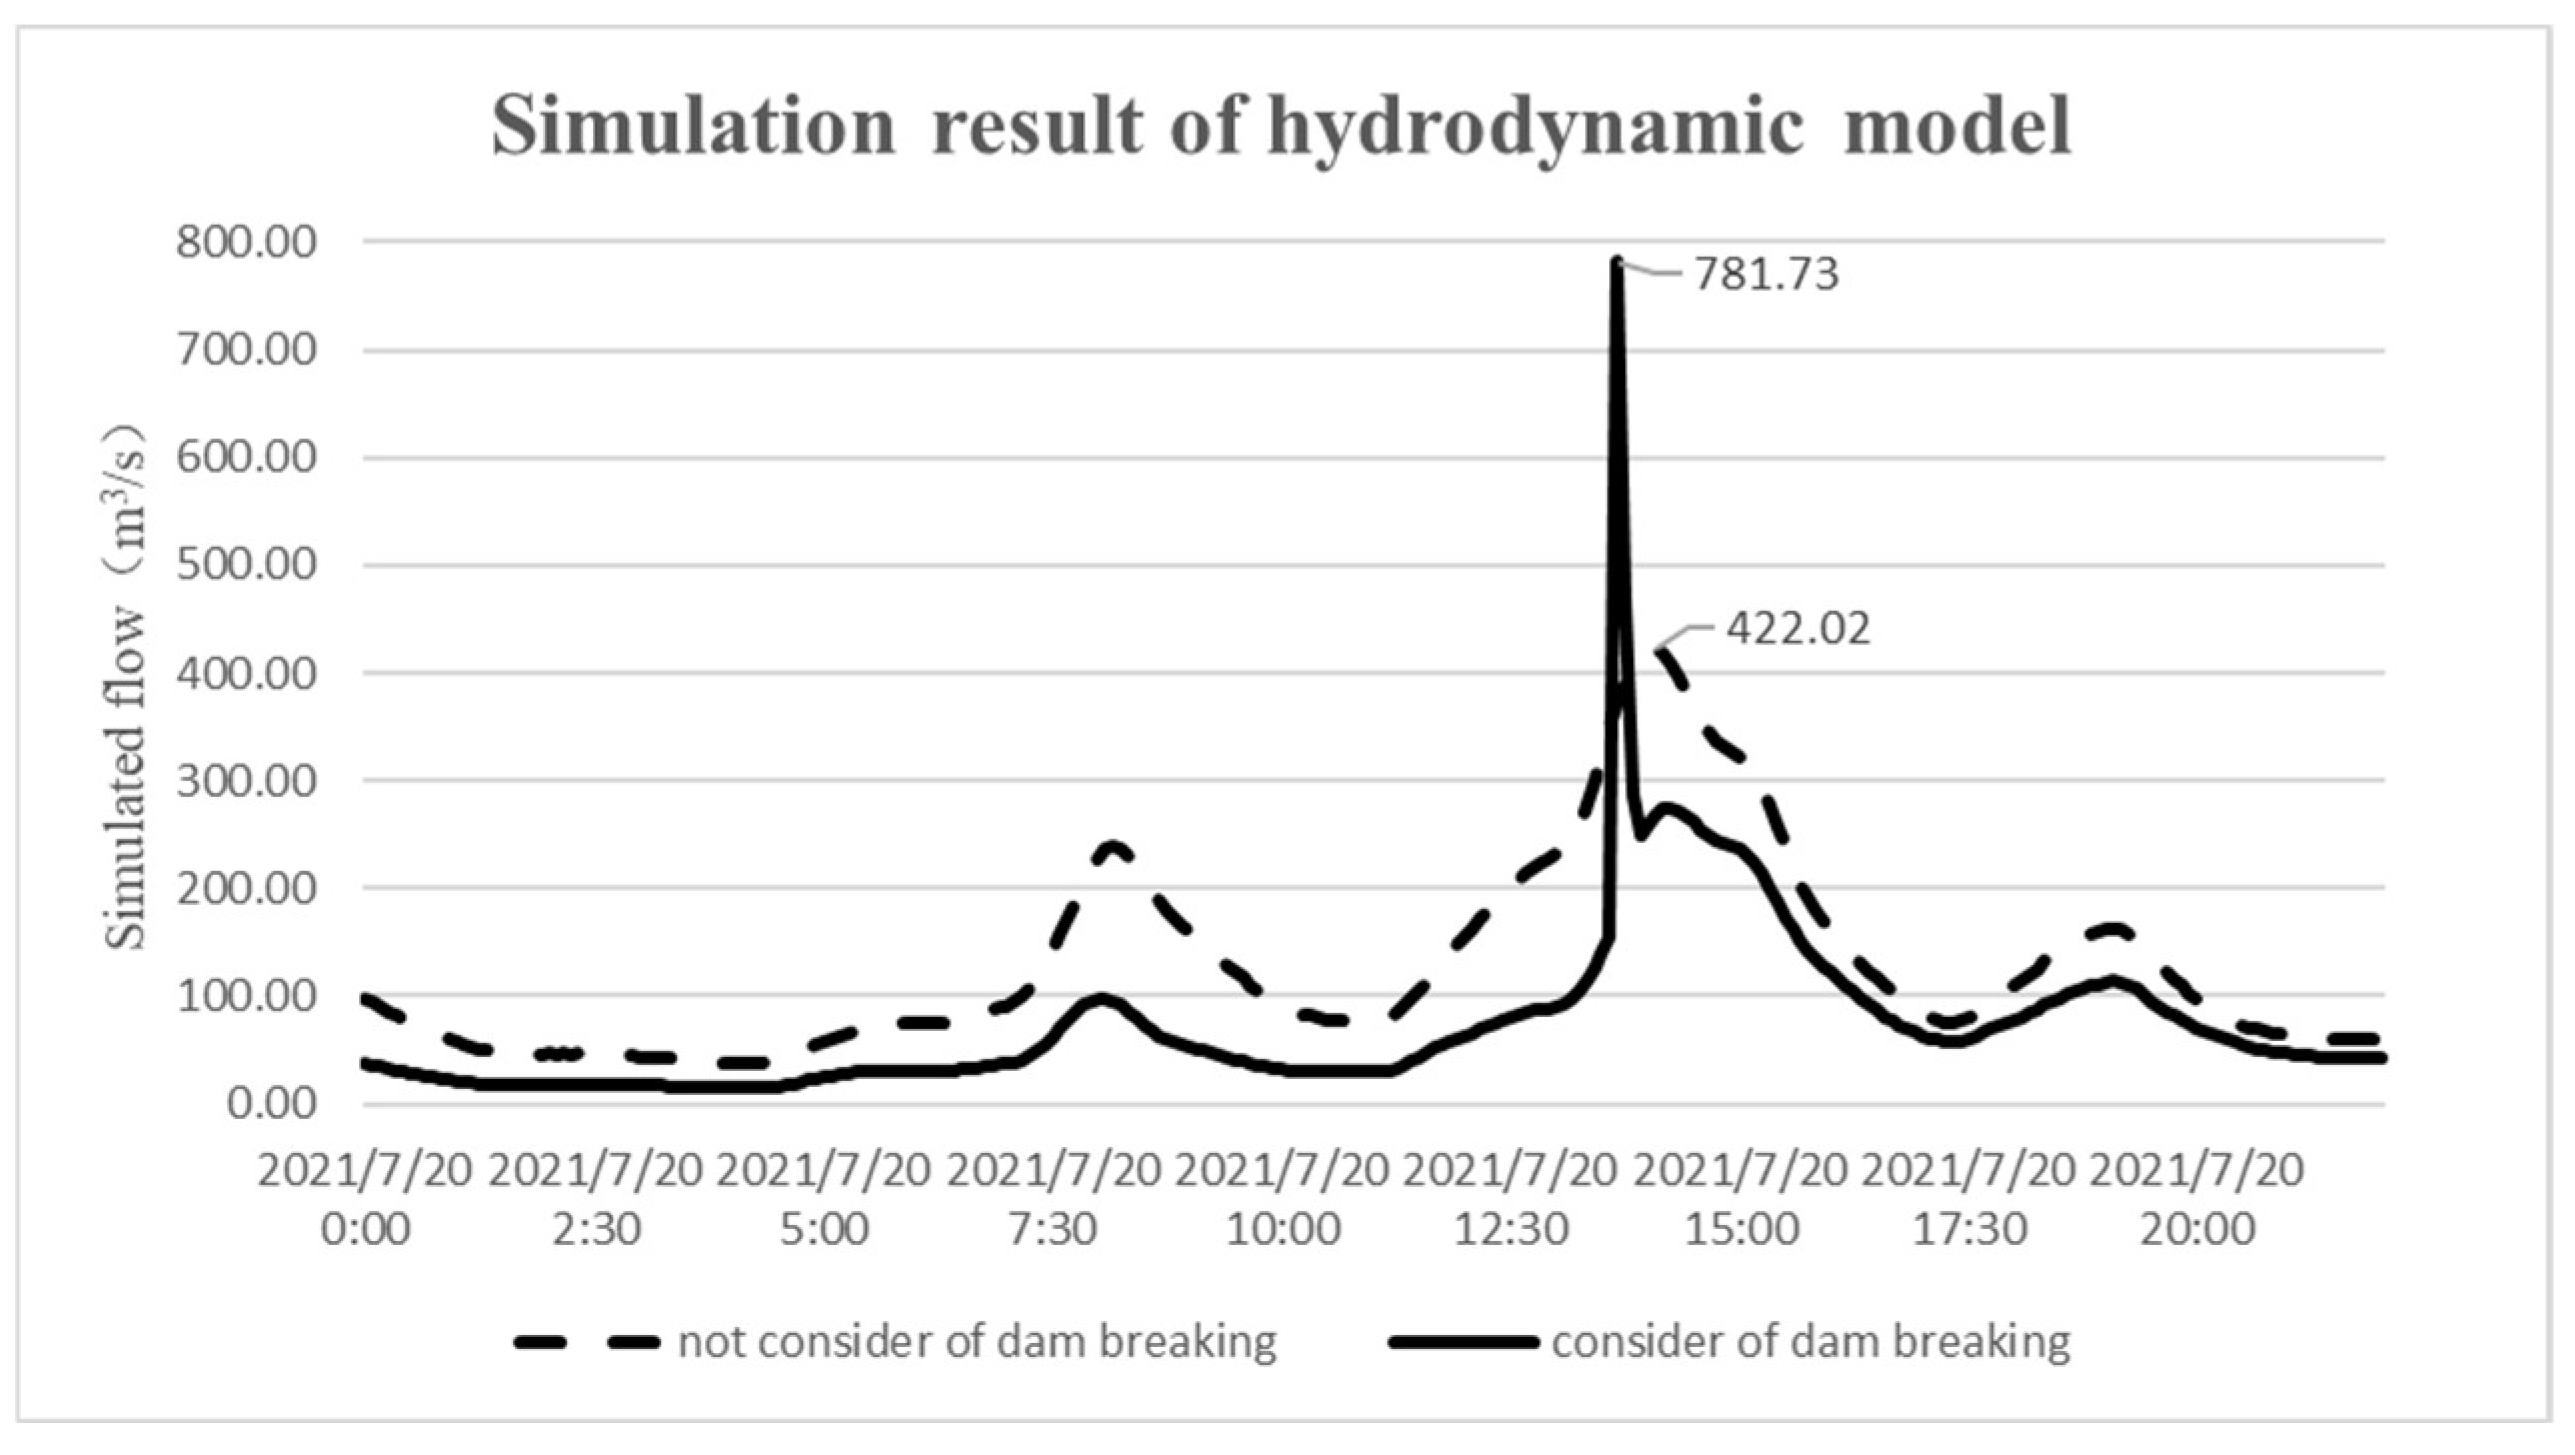
Based on IFMS software, the flooding process of Wangzongdian Village from 0:00 a.m. to 20:00 p.m. on 20 July 2021 was simulated in two cases: considering dam failure and not considering dam failure. The results are shown in Figure 9. Without considering dam failure, the simulated peak discharge of the hydrodynamic model was about 422 m3/s, close to the hydrological simulation result of 414.25 m3/s. However, the hydrodynamic model simulation result was about 782 m3/s under the consideration of dam failure, which was basically consistent with the disaster investigation results, with a relative simulation flood error of +8%. The results showed that the hydrodynamic model could review the process of this flash flood and support the analysis of the causes of the flash flood under the consideration of dam failure.
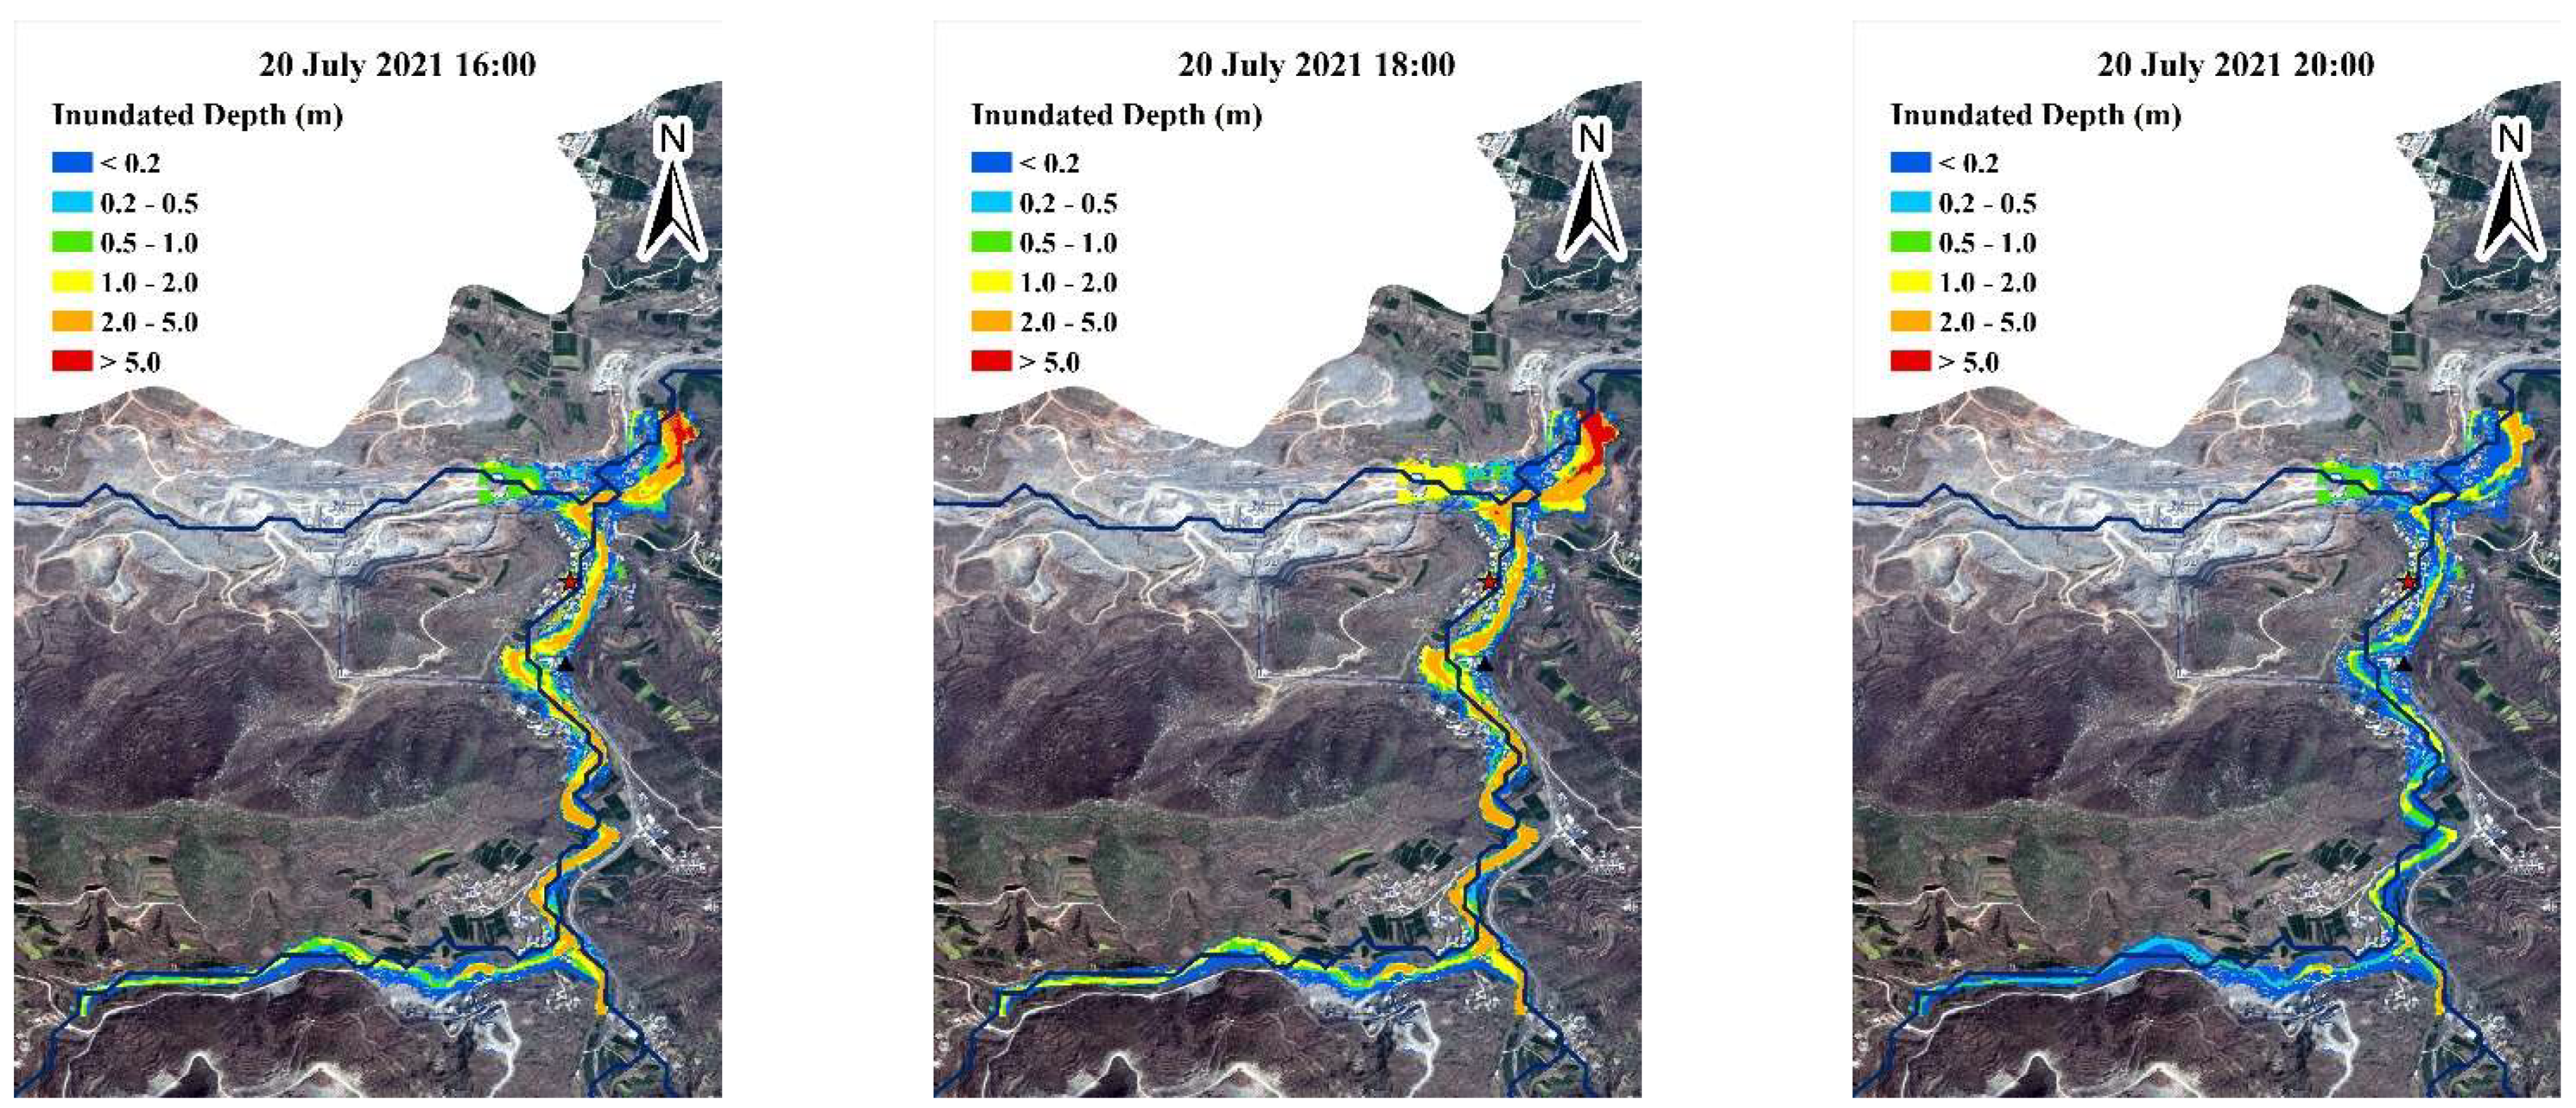
According to hydrodynamic calculation, the submerged water depth of the river at different times is shown in Figure 10. According to the rainfall distribution map of Wangzongdian Village (Figure 5), it can be seen that its cumulative precipitation was 162 mm from 0:00 a.m. to 10:00 a.m. on July 20, and the submerged water depth of some areas downstream reached 2–5 m. The rainfall gradually increased after 10:00 a.m., and at 12:00 p.m., some areas downstream of the Village were flooded to a depth of more than 5 m; the rainfall continued to increase from 12:00 p.m. to 14:00 p.m., and the maximum rainfall (57.6 mm) was at 12:00 p.m.; the submerged water depth of most areas in the upper reaches of Wangzongdian Village reaches 2–5 m, while that of most areas near Wangzongdian Village and its downstream exceeded 5 m. Subsequently, with the gradual decrease in rainfall in the watershed, the submerged water level near Wangzongdian Village gradually decreased, and the process of water withdrawal started. Based on the simulation evolution of the flood in the Wangzongdian watershed, it can be concluded that the flood is characterized by high flow and rapid rise.
4.2. Analysis of the “7.20” Flash Flood in Wangzongdian
Based on the simulation results of the hydrological-hydrodynamic Model, the causes of flash floods in Wangzongdian Village were analyzed in the following three main aspects:
- (1)
- On 20 July 2020, the total rainfall in the watershed of Wangzongdian Village reached the highest value of 353 mm, with a rainfall intensity of 58.5 mm/h. The flood peak discharge caused by short-term heavy rainfall and the rapid increase in water level were the direct causes of this disaster.
- (2)
- Due to the special geographical location of Wangzongdian Village, surrounded by mountains on all sides, water flowed down its surrounding mountains and converged here during heavy rainfall. Flooding encountered in the upper four channels further increased the flood flow and exacerbated the flood disaster.
- (3)
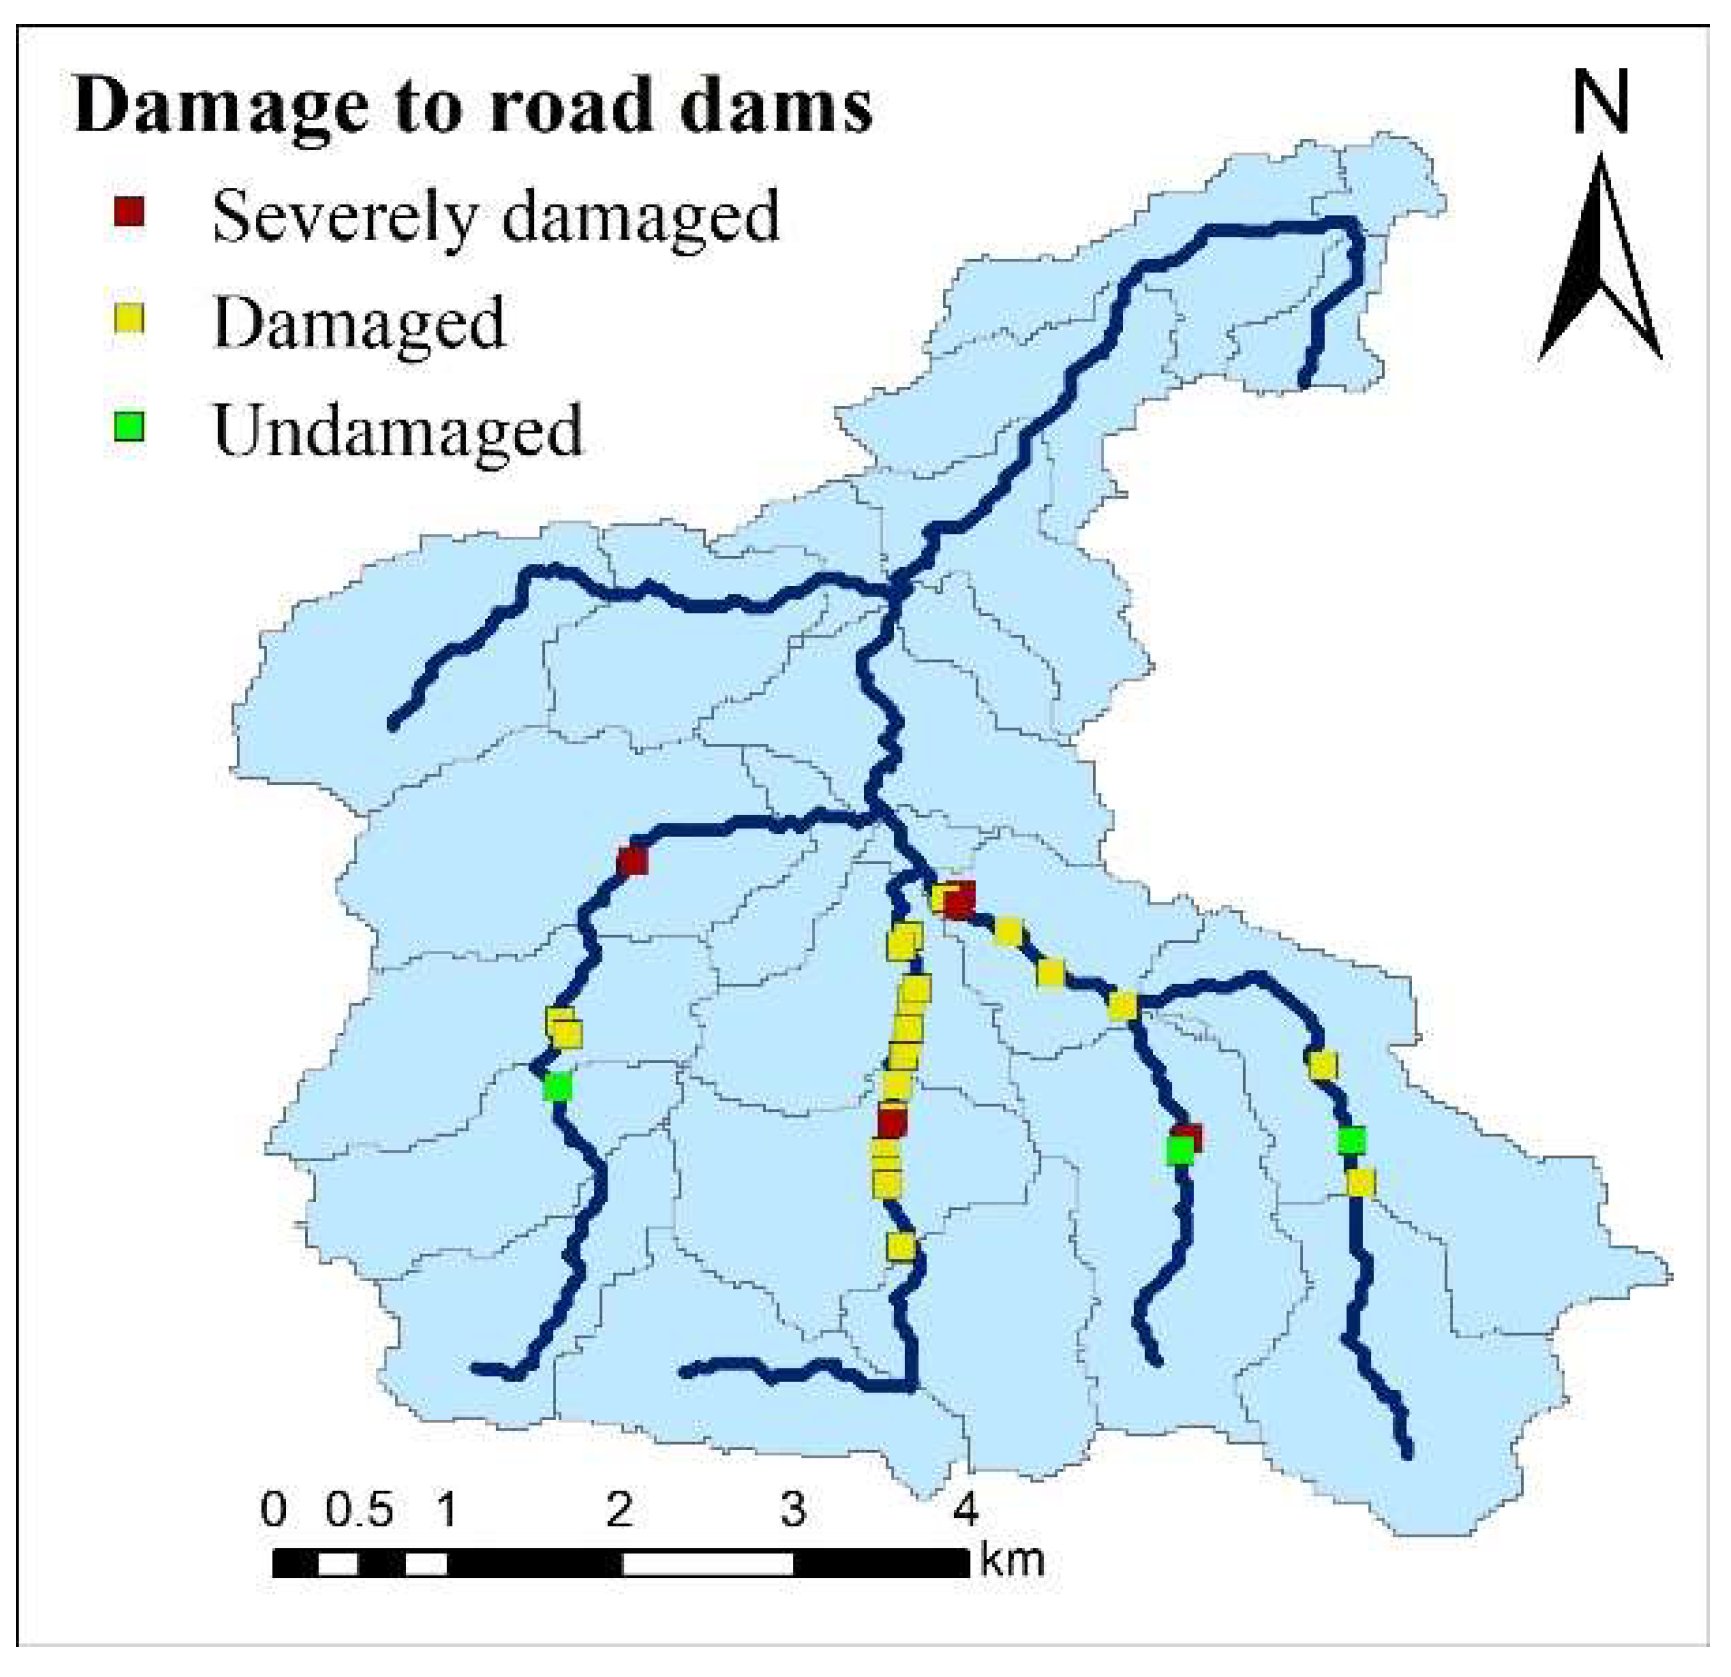
- There was some bare land in the upper reaches of the Wangzongdian watershed. Under the influence of high-intensity rainfall, flash floods carried a large amount of sediment down the river, causing serious damage to villages and infrastructure along the lower reaches of the river. Figure 11 shows the damage to the road and dams by the flash flood. It can be seen that many roads and dams in the upper reaches were damaged, and even continuous dam failures occurred. Due to the silting and shrinkage of river channels, multiple houses, bridges, roads, and other cross-channel buildings led to water blocking and water level rising, while the peak discharge caused by the water blocking and collapse of roads and bridges had devastating effects on the downstream.
4.3. Discussion
In this study, a distributed hydrological model and a two-dimensional hydrodynamic model were used to simulate the “7.20” flash flood event in Wangzongdian village based on the two-phase flash flood disaster review strategy. Post-flood estimates of maximum peak discharge, which is very valuable information available for small watersheds, are used to evaluate the accuracy of the simulation results. Up to now, a few studies, Sun et al. [35], used the KW−GIUH model to analyze the disaster mechanism of the “8·16” flash flood disaster that occurred in the Zhongdu River basin. Before the simulation calculation, the parameters of the KW−GIUH model need to be calibrated based on the historical flood data of the basin. In practice, the problems of imperfect monitoring facilities and insufficient measured data in small watersheds in mountainous areas often make it difficult to determine model parameters.
In order to simulate the evolution of natural disasters and make an assessment by setting the flood water sources in line with the flow discharge, a new distributed hydrological model named FFMS was developed. Hao et al. [27] reproduce the flooding process and the consistency of the flow discharge to explain the underlying reason for the disaster formation and evolution of the “8.12” Flash Flood in Liulin River Basin based on the FFMS model with an error of +13% compared with post-disaster investigation data. However, it can be seen from the simulation results of two different models in the “7.20” flash flood event that when a dam break caused by an extreme rainstorm destroys the natural process of basin flow generation and flood evolution, distributed hydrological simulation often fails to perform disaster recovery well, while hydrodynamic simulation results can better reflect the formation mechanism and evolution process of a flood, and the calculation results are more accurate.
Other scholars also do research on the “7.20” flash flood event. Liu et al. [36] analysis of the cause of the flash flood based on geological analysis. It is believed that the short-duration heavy rainfall and dam break are the main causes of the flash flood event, which is consistent with the result analysis based on model calculation. Therefore, the two-stage recovery strategy proposed in this paper can provide guidance for flood process reproduction and disaster mechanism analysis intuitively and can also apply to other regions in the future.
5. Conclusions
The reenactment simulation for extreme natural disasters such as flash floods is often plagued by data collection and modeling strategy, and there are few widely applicable reenactment approaches available for practical implementation. In this paper, the fast reenactment modeling strategy of flash flood disasters based on hydrological and hydrodynamic models was put forward, which can be used to carry out different degrees of flash flood disaster assessment in different situations. The selected validation case, the “7.20” flash flood disaster in Wangzongdian, is a representative extreme flood event in 2021. The hydrodynamic model simulation result is about 782 m3/s under the consideration of dam failure, which was basically consistent with the disaster investigation results, with a relative simulation flood error of +8%. The causes of the disaster are complex, both due to extreme rainfall and local blockage and dam failure. Through the modeling analysis, it was preliminarily determined that on 20 July 2020, in the Wangzongdian watershed, due to the pooling of flood water and the collapse of subgrade water damming caused by extremely heavy rainfall, the high level of flood water surged over a short distance to Wangzongdian Village, eventually causing this serious flash flood disaster. The analysis verified the applicability and operability of the reenactment modeling strategy proposed in this paper. Anyway, the selected model and method were able to represent the actual situation of flooding in hilly areas of China, with relatively strong parameter stability and high simulation accuracy. The simulation strategy of flash flood disaster reenactment based on the hydrological-hydrodynamic model proposed in this paper can provide technical support for future flash flood disaster analysis and post-disaster reconstruction in China.
Author Contributions
C.L. (Changzhi Li) and Q.M.: Conceptualization, Methodology. W.W.: Writing—review & editing. S.H.: Program implementation, data curation, Writing—original draft preparation. L.W.: Software. J.T.: Investigation. C.L. (Changjun Liu): Project administration. All authors have read and agreed to the published version of the manuscript.
Funding
This research was funded by National Key Research Program (2019YFC1510603), Major science and technology projects of the Ministry of Water Resources (SKR-2022034).
Institutional Review Board Statement
Not applicable.
Informed Consent Statement
Not applicable.
Data Availability Statement
All authors made sure that all data and materials support published claims and comply with field standards.
Acknowledgments
The research presented in this paper has been carried out as part of the National Key Research Program (No. 2019YFC1510603), Major science and technology projects of the Ministry of Water Resources (SKR-2022034).
Conflicts of Interest
The authors declare no conflict of interest.
References
- Ding, L.; Guo, L.; Liu, C.; He, B. Technical progress of flash flood disasters prevention and control systems in China. China Flood Drought Manag. 2020, 30, 11–17. [Google Scholar]
- Tang, W. Research on Simulation and Analysis Technology of Flash Floods in Small Mountain Watersheds. Master’s Thesis, Nanjing University of Information Science and Technology, Nanjing, China, 2022. [Google Scholar]
- Li, H.; Tan, G.; Wang, X. Advances in Study on Flash Flood Forecast and Warning. J. China Hydrol. 2014, 34, 12–16. [Google Scholar]
- Xing, Z.; Ma, M.; Wen, L. Application of HEC-HMS model in mountain flood forecasting in data deficient areas. J. China Inst. Water Resour. Hydropower Res. 2020, 18, 8. [Google Scholar]
- Wu, X.; Liu, C. Progress in Watershed Hydrological Models. Prog. Geogr. 2002, 21, 8. [Google Scholar]
- Liu, C.; Xia, J.; Guo, S. Advances in distributed hydrological modeling in the Yellow River basin. Adv. Water Sci. 2004, 15, 495–500. [Google Scholar]
- Shu, L.; Chang, Y.; Wang, J. A brief review of numerical distributed hydrological model SHUD. Adv. Earth Sci. 2022, 37, 680–691. [Google Scholar]
- Zhao, J.; Liang, Z.; Liu, J. Variable runoff generation layer distributed hydrological model for hilly regions. Adv. Water Sci. 2022, 33, 429–441. [Google Scholar]
- Liu, C.; Zhou, J.; Wen, L. Research on spatio temporally-mixed runoff model and parameter regionalization for small and medium-sized catchments. J. China Inst. Water Resour. Hydropower Res. 2021, 19, 99–114. [Google Scholar]
- Jiang, C.; Zhou, Q.; Shen, Y. Review on hydrological and hydrodynamic coupling models for flood forecasting in mountains watershed. J. Hydraul. Eng. 2021, 52, 14. [Google Scholar]
- Godunov, S. A finite difference method for the numerical computation of discontinuous solutions of the equations of fluid dynamics. Mat.-Eskij Sb. 1959, 47, 271–306. [Google Scholar]
- Berardi, L.; Laucelli, D.; Simeone, V.; Giustolisi, O. Simulating floods in ephemeral streams in Southern Italy by full-2D hydraulic models. Int. J. River Basin Manag. 2013, 1, 1–17. [Google Scholar] [CrossRef]
- Zhang, D.; Quan, J.; Ma, J. Two-dimensional numerical simulation for surface runoff in catchments based on Godunov scheme. J. Hydraul. Eng. 2018, 49, 787–794+802. [Google Scholar]
- Liu, C.; Wu, J.; Gao, J. Study on evaluation method of mountainous flood disaster. Yangtze River 2017, 48, 13–16. [Google Scholar]
- Zhang, Y.; Song, Y.; Dong, W. Research and Application of Mountain Hydrological Model Based on the Mechanism of Subsurface Storm Flow. Adv. Eng. Sci. 2022, 1–11. Available online: https://kns.cnki.net/kcms/detail/51.1773.TB.20220415.1133.002.html (accessed on 5 January 2023).
- Anquetin, S.; Braud, I.; Vannier, O.; Viallet, P.; Boudevillain, B.; Creutin, J.; Manus, C. Sensitivity of the hydrological response to the variability of rainfall fields and soils for the Gard 2002 flash-flood event. J. Hydrol. 2010, 394, 134–147. [Google Scholar] [CrossRef]
- Lin, Y.; Wang, X.; Bao, W. Flood Simulation and Submergence Analysis of Small Mountain Watershed Based on 1D and 2D Coupled Hydrodynamic Model. Water Power 2022, 48, 10–14. [Google Scholar]
- Segura-Beltrán, F.; Sanchis-Ibor, C.; Morales-Hernández, M.; Bussi, G.; Ortiz, E. Using post-flood surveys and geomorphologic mapping to evaluate hydrological and hydraulic models: The flash flood of the Girona River (Spain) in 2007. J. Hydrol. 2016, 1, 310–329. [Google Scholar] [CrossRef] [Green Version]
- El-Saoud, A.; Othman, A. An integrated hydrological and hydraulic modelling approach for flash flood hazard assessment in eastern makkah city, saudi arabia. J. King Saud Univ.-Sci. 2022, 34, 102045. [Google Scholar] [CrossRef]
- Xingyang Municipal Water Resources Bureau. Preliminary Verification Report on the "7.20" Rainstorm in Xingyang City; Xingyang Municipal Water Resources Bureau: Zhengzhou, China, 2021. [Google Scholar]
- Investigation Group on Disaster of State Council of China. Investigation Report on the "7.20" Extraordinary Rainstorm Disaster in Zhengzhou City, Henan Province; Investigation Group on Disaster of State Council of China: Beijing, China, 2022. [Google Scholar]
- Liu, C.; Lv, J.; Zhai, X. Risk simulation and comparative analysis of “21·7” heavy rainfall and flood in Henan Province. Express Water Resour. Hydropower Inf. 2021, 42, 8–17. [Google Scholar]
- Yellow River Engineering Consulting Co., Ltd. Investigation Report on "7.20" Flood in Wangzongdian in Cuimiao Town, Xingyang City; Yellow River Engineering Consulting Co., Ltd.: Zhengzhou, China, 2021. [Google Scholar]
- Tian, J.; Fan, S.; Wang, W. Comparison between FFMS Model and HEC-HMS Model Applied in Rainstorm and Flood Simulation. J. Yangtze River Sci. Res. Inst. 2021, 38, 59–65. [Google Scholar]
- Guo, L.; Ding, L.; Sun, D.; Liu, C.; He, B.; Liu, R. Key techniques of flash flood disaster prevention in China. J. Hydraul. Eng. 2018, 49, 1123–1136. [Google Scholar]
- Liu, C. A new generation of hydrological model driven by artificial intelligence and big data and its application in flood forecasting and early warning. China Flood Drought Manag. 2019, 29, 11+22. [Google Scholar]
- Hao, S.; Wang, W.; Ma, Q.; Li, C.; Wen, L.; Tian, J.; Liu, C. Analysis on the Disaster Mechanism of “8.12” Flash Flood in Liulin River Basin. Water 2022, 14, 2017. [Google Scholar] [CrossRef]
- Talbot, C.; Ogden, F. A method for computing infiltration and redistribution in a discretized moisture content domain. Water Resour. Res. 2008, 44, W08453. [Google Scholar] [CrossRef]
- Lai, W.; Ogden, F.; Steinke, R.; Talbot, C. An efficient and guaranteed stable numerical method for continuous modeling of infiltration and redistribution with a shallow dynamic water table. Water Resour. Res. 2015, 51, 1514–1528. [Google Scholar] [CrossRef]
- Zhang, X.; Zhou, J.; Wen, L. Application of spatio-temporal variable source mixed runoff model to flood simulation of small watersheds: A Case study of four small watersheds in Sichuan and Gansu Province. J. Water Resour. Water Eng. 2021, 32, 80–90. [Google Scholar]
- Liu, C.; Wen, L.; Zhou, J. Comparative analysis of hydrological and hydrodynamic calculation method for flash flood in small watershed. J. China Inst. Water Resour. Hydropower Res. 2019, 17, 262–270+278. [Google Scholar]
- Ma, J.; Yu, H. Features and applications of the flood analysis software IFMS/Urban. China Water Resour. 2017, 5, 74–75. [Google Scholar]
- Yu, H.; Ma, J.; Zhang, D. Application of IFMS Urban software in urban flood risk mapping. China Flood Drought Manag. 2018, 28, 13–17. [Google Scholar]
- Wang, S.; Tao, F.; Li, G.; Xie, H.; Ten, Y.; Gu, S. Comparative analysis of the calculation of maximum flow of embankment dam-breaking with different empirical formula. J. Qinghai Univ. (Nat. Sci. Ed.) 2012, 30, 38–41. [Google Scholar]
- Sun, T.; Yang, P.; Xu, Z.; Wang, Y.; Wang, X. Analysis on The Disaster Mechanism of “8.16” Flash Flood in Zhongdu River basin. Adv. Eng. Sci. 2021, 53, 132–138. [Google Scholar]
- Liu, C.; Huang, S. Research on “7.20” mountain torrents and geological disasters in Zhengzhou city, Henan Province of China. J. Eng. Geol. 2022, 30, 931–943. [Google Scholar]
Figure 1.
Comparison of before and after the “7.20” flash flood disaster in Wangzongdian Village, Henan Province. (a) before, (b) after.
Figure 1.
Comparison of before and after the “7.20” flash flood disaster in Wangzongdian Village, Henan Province. (a) before, (b) after.

Figure 2.
Overview of the study area.

Figure 3.
(a) Calculation unit division. (b) land use attribute data. (c) soil texture data.

Figure 4.
Digital Elevation data of Wangzongdian watershed.

Figure 5.
Cumulative and hourly rainfall distribution of Wangzongdian Rainfall Station.

Figure 6.
A real shot of the survey section after the flood.

Figure 7.
Dam failure site and laser point cloud measurement data.

Figure 8.
Simulation results of Wangzongdian watershed.

Figure 9.
Hydrodynamic model simulation results.

Figure 10.
Submerged water depth of rivers at different times.


Figure 11.
Distribution of damage to the upstream road dams in Wangzongdian Village.


Table 1.
Basic data information of study area.
| Data Type | Resolution | Time | Data Source |
|---|---|---|---|
| Rainfall data | - | 2021 | Rain gauge data |
| DEM | 30 m | 2021 | Geospatial data cloud web site |
| Remote sensing image | 2.5 m,30 m | 2015 | National flash flood disaster investigation and assessment |
| Watershed | 10~50 km2 | 2015 | |
| Land use | 30 m | 2015 | |
| Soil texture | 30 m | 2015 | |
| Dam break data | - | 2021 | Postdisaster field survey data. |
Disclaimer/Publisher’s Note: The statements, opinions and data contained in all publications are solely those of the individual author(s) and contributor(s) and not of MDPI and/or the editor(s). MDPI and/or the editor(s) disclaim responsibility for any injury to people or property resulting from any ideas, methods, instructions or products referred to in the content. |
© 2023 by the authors. Licensee MDPI, Basel, Switzerland. This article is an open access article distributed under the terms and conditions of the Creative Commons Attribution (CC BY) license (https://creativecommons.org/licenses/by/4.0/).
Share and Cite
MDPI and ACS Style
Hao, S.; Wang, W.; Ma, Q.; Li, C.; Wen, L.; Tian, J.; Liu, C. Model-Based Mechanism Analysis of “7.20” Flash Flood Disaster in Wangzongdian River Basin. Water 2023, 15, 304. https://doi.org/10.3390/w15020304
AMA Style
Hao S, Wang W, Ma Q, Li C, Wen L, Tian J, Liu C. Model-Based Mechanism Analysis of “7.20” Flash Flood Disaster in Wangzongdian River Basin. Water. 2023; 15(2):304. https://doi.org/10.3390/w15020304
Chicago/Turabian StyleHao, Sijia, Wenchuan Wang, Qiang Ma, Changzhi Li, Lei Wen, Jiyang Tian, and Changjun Liu. 2023. "Model-Based Mechanism Analysis of “7.20” Flash Flood Disaster in Wangzongdian River Basin" Water 15, no. 2: 304. https://doi.org/10.3390/w15020304
Note that from the first issue of 2016, this journal uses article numbers instead of page numbers. See further details here.