Article

Effect of Post-Drought Rehydration on Winter Wheat Fluorescence and Photosynthetic Indices under Different Levels of Nitrogen Application

1
School of Water Conservancy, North China University of Water Resources and Electric Power, Zhengzhou 450000, China
2
College of Land Science and Technology, China Agricultural University, Beijing 100193, China
*
Author to whom correspondence should be addressed.
Water 2023, 15(2), 305; https://doi.org/10.3390/w15020305
Submission received: 30 November 2022 / Revised: 28 December 2022 / Accepted: 5 January 2023 / Published: 11 January 2023

Abstract

:
Studying the response of winter wheat to post-drought rehydration is conducive to understanding the efficient utilization of water-saving technology, such as regulating deficit irrigation and increasing water use efficiency. The controlled condition experiment in the rain shelter was conducted in 2020. The two water stress treatments, including post-drought rehydration at the jointing and heading stages, were combined with high nitrogen (N) (250 kg/hm2), low N (125 kg/hm2), and no N (0 kg/hm2, control). The effects of post-drought rehydration on the relative chlorophyll content (SPAD), major fluorescence parameters, and photosynthetic indexes of winter wheat were determined. The results showed that post-drought rehydration increased the SPAD value, the efficiency of light energy conversion, maximum potential photo-electron transport, and the photosynthetic indices and decreased the photochemical quenching coefficient. Among them, the compensatory effect of rehydration at the heading stage on SPAD, fluorescence parameters, and photosynthetic indexes was more significant (p < 0.05), and the winter wheat needed a recovery process after rehydration. Increased application of N fertilizer can alleviate the effects of water stress on the fluorescence parameters and photosynthetic properties of flag leaf and promote the degree of the response of fluorescence parameters and photosynthetic properties to rehydration. The specific effects were as follows: high N > low N > no N application. As a result, winter wheat had a certain compensatory effect of rehydration after timely drought stress; the compensatory effect of rehydration could be enhanced under the condition of increasing N application.

1. Introduction

Wheat is one of the major food crops in China, accounting for more than 20% of the country’s food crop cultivation area; the annual output is more than 130 million tons. As the population grows and the economy develops, the amount of water available for agriculture decreases each year. It has decreased by about 3.4% in the past five years. Water-saving irrigation technology is an important way to stabilize wheat yield and is essential to ensuring food security in China. When developing irrigation systems for crops, a certain degree of drought stress is set to reduce evaporation and transpiration in the field. Studies have shown that crops suffering from drought stress can quickly recover their growth after rehydration, producing a compensatory effect or even a super-compensatory effect, which can minimize the adverse effects caused by drought in the early stage to a certain extent [1,2]. Therefore, research on the mechanism of post-drought rehydration is of great significance in improving the theoretical water-saving irrigation system.
More than 90% of the dry matter accumulation and yield formation of plants come from the photosynthesis of leaves, and the photosynthetic rate and relative chlorophyll content of leaves are responsive to water and fertilizer [3,4,5]. Chlorophyll fluorescence parameters can better reflect the photosystem performance of plants. Because, in fluorescent systems, part of the energy goes to the photosynthetic process in photosystem Ⅱ, part is lost in the form of heat and a part returns as fluorescence, which can be measured, and correlates with the level of stress felt by the plant. Therefore, this can be used as an evaluation tool. When the external conditions change, the changes in chlorophyll fluorescence parameters in plants can reflect the response mechanism of plants to the environment [6,7]. Drought stress reduces the photosynthetic rate in winter wheat. Ashar et al. [8] suggested that drought stress could reduce chlorophyll content, photosystem activity, and CO2 transport level and then inhibit photosynthetic capacity. Drought stress causes the disruption of photochemical reactions in PSII in wheat [9]. Some researchers suggested that physiological indicators of plants are rehydrated after moderate drought stress [10,11]. The response of crop growth indicators to drought stress at different growth stages also differs. Tian et al. [12] found the greatest effect on winter wheat yield under drought before the plucking and gestation stage. Irrigation at the flowering stage maximizes the number of grains on the maize ears and significantly increases the photosynthetic rate of maize at the spatulation stage [13]. Meanwhile, photosynthetic parameters and fluorescence characteristics of crops are closely related to plant nutrient levels. Appropriate water and nitrogen synergy could enhance the photosynthetic characteristics of winter wheat [14]. Follow-up nitrogen fertilization could improve fluorescence parameters, such as potential PSII activity and maximum photochemical efficiency (Fv/Fm), of winter wheat flag leaf [15]. The above studies investigated the effects of water and nitrogen fertilizer on photosynthetic and fluorescence characteristics of winter wheat, respectively. However, the fluorescence parameters and photosynthetic indexes of winter wheat rehydrated after drought at different growth stages under different nitrogen application levels were not sufficiently studied.
In this study, it is assumed that reduced irrigation and controlled irrigation methods can ensure the growth of winter wheat. Based on the water-saving irrigation of winter wheat in the North China Plain, we used a controlled experiment of rain avoidance and evapotranspiration measurement pits to measure the fluorescence and photosynthetic indices of winter wheat in different growth stages after post-drought rehydration under different N application levels. The objective of this study was to explore a suitable control irrigation method for winter wheat growth and the physiological response law of winter wheat under different water and nitrogen treatments under water-saving irrigation conditions. This is of great theoretical and practical significance to improve the theory of physiological regulation of efficient water use in crops and to promote the sustainable development of high-quality and efficiency in winter wheat production.

2. Materials and Methods

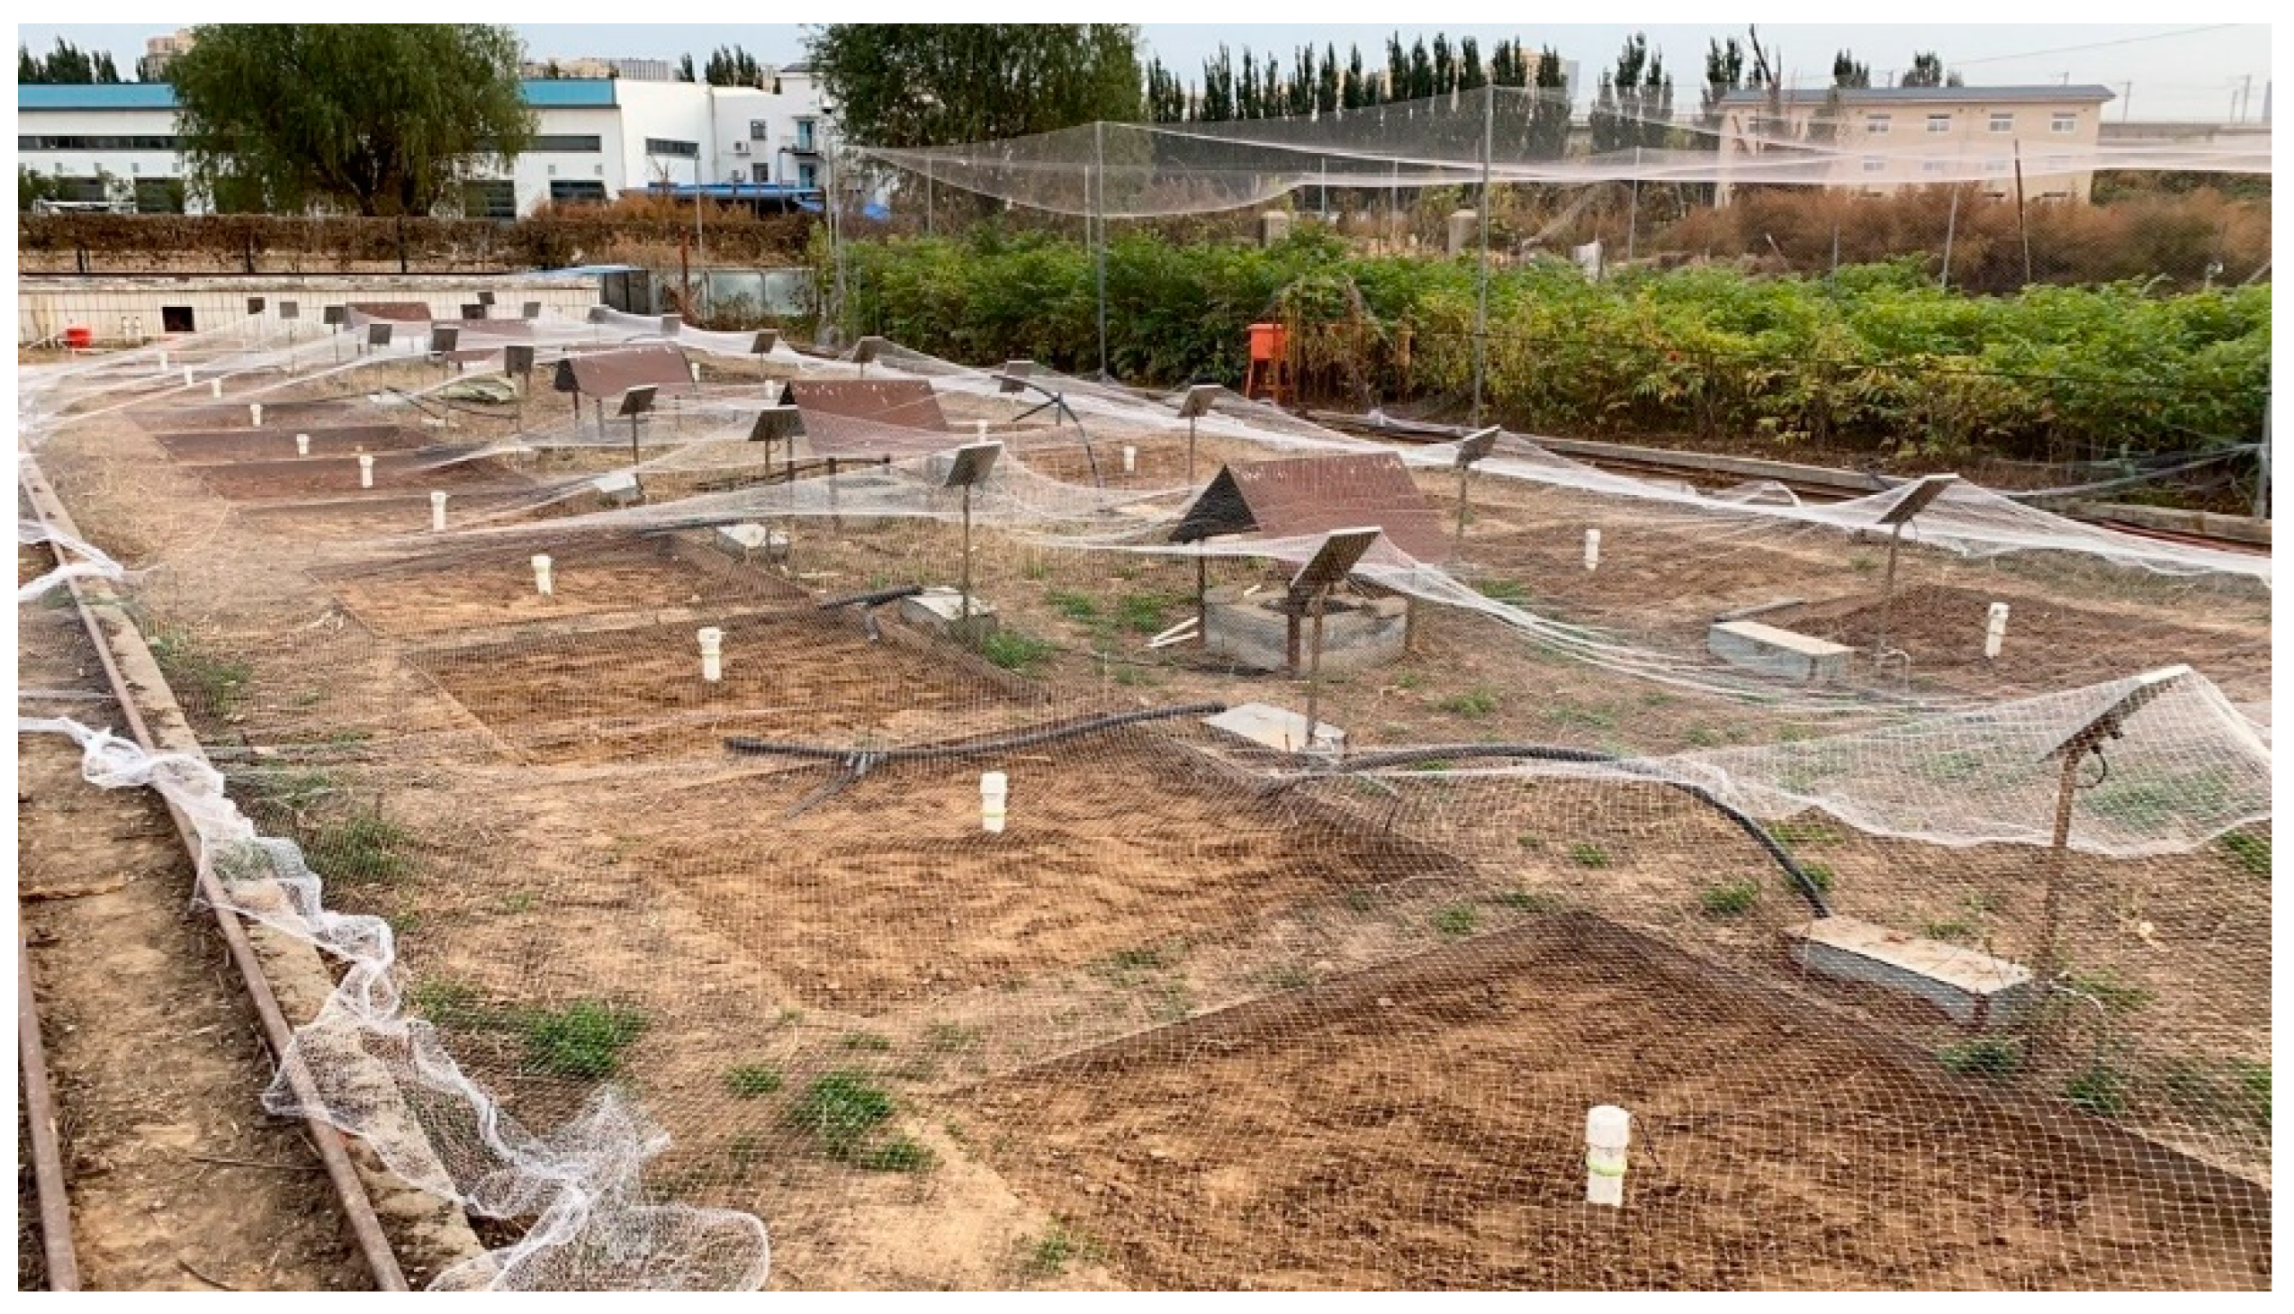
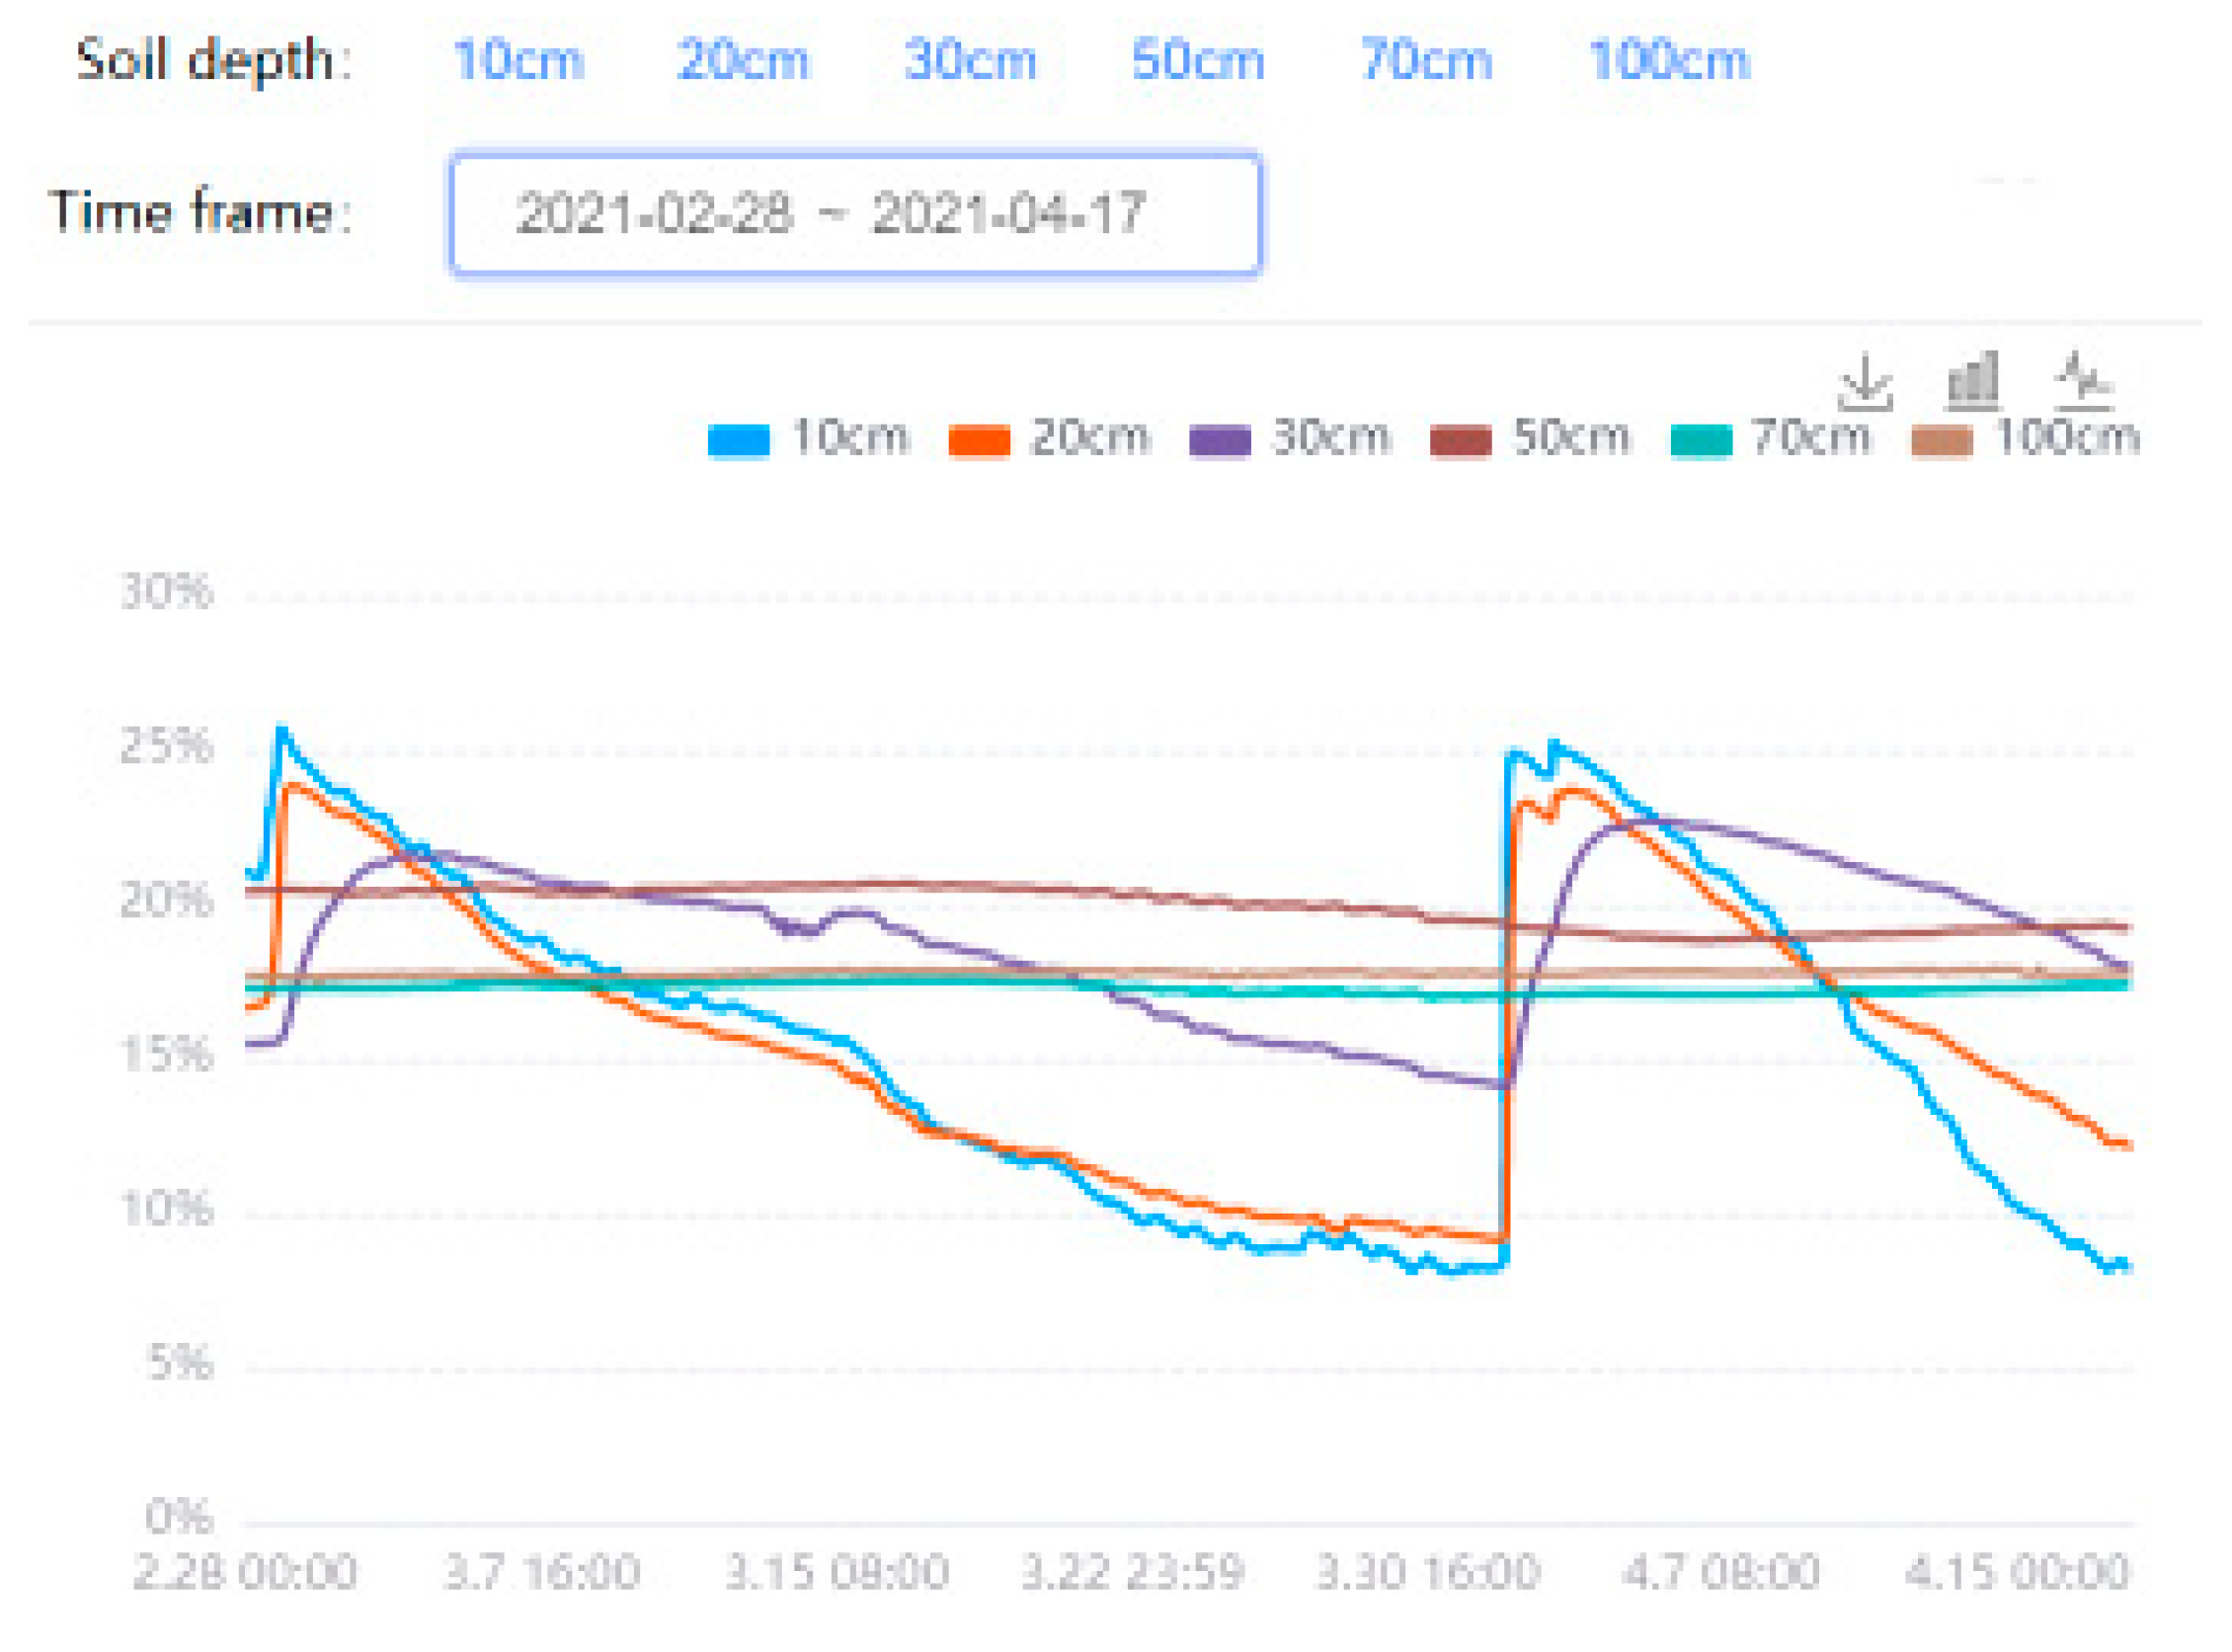
2.1. Overview of the Test Area

The experiment was conducted in the rain-sheltered evapotranspiration measurement pit at the Agricultural Efficient Water Use Laboratory of North China University of Water Resources and Electric Power (34°47′ N, 113°47′ E) from October 2020 to May 2021. It has a temperate monsoon climate with a multi-year average temperature of 14.3 °C, and the hottest month is July, with an average monthly temperature of 27.3 °C. January is the coldest month with an average monthly temperature of 0.1 °C, and with about 2400 h of sunshine and 200 d of frost-free conditions. The multi-year average rainfall is 624.3 mm, and the annual average water surface evaporation is 1112.6 mm, of which the rainfall from June to October accounts for 70% to 80% of the total annual rainfall. The average annual water surface evaporation is 1112.6 mm, of which the rainfall from June to October accounts for 70~80% of the total rainfall. The size of the pit is 2 m × 2 m × 3 m (length × width × height). There is a moisture monitoring device installed inside the pit, which can monitor the soil moisture content at different depths in real time (the depth of the monitoring device is 1 m, and every 10 cm is a monitoring depth). The bottom of the pit is equipped with an anti-filtration layer and a drainage pipe, and the ground is equipped with a mobile rain shelter and an underground corridor (Figure 1). The soil in the pit was cinnamon soil with a field water holding capacity of 30.51% (mass water content), pH value of 8.15, organic matter mass fraction of 16.46 g/kg, total N of 1.07 g/kg, total phosphorus of 0.63 g/kg, total potassium of 0.91 g/kg, and other major physical properties, as shown in Table 1.

2.2. Experimental Design

The three N application levels were 0 kg/hm2, 125.0 kg/hm2, and 250.0 kg/hm2. The two water stress treatments were post-drought rehydration at the jointing and heading stages. There were six treatments, as shown in Table 2, The moisture change curve is shown in Figure 2.
The experimental wheat variety is “Zhongmai 1062” (a new variety, Yumai 34 as female parent hybridized with Rotated 9873 as male parent), sown on 30 September 2020, and harvested on 1 June 2021. The sowing rate was 15.0 g/m2, and the planting spacing was 20 cm, with 8 rows planted in each pit. Both phosphorus and potassium fertilizer were applied at 15.0 g/m2 before sowing; 50% of N fertilizer was applied before sowing and 50% at the beginning of jointing (20 March). The growth of winter wheat is divided into five stages, namely the seedling stage, overwintering stage, regreening stage, jointing, heading, flowering stage, filling, and maturity states. There was no water control treatment during the seedling and overwintering stage. The overwatering irrigation quota was 75 mm. The lower limit of irrigation was 60% of the field water holding capacity at the jointing, heading, and flowering stage, and 75% of the field water holding rate during greening, filling, and maturity. The planned wetting layer was 60 cm at the greening and jointing stages, and 100 cm at the heading and maturing stages. When the average soil moisture content of the planned wetting layer was close to or slightly lower than the lower limit of the designed irrigation, the irrigation quota was 75 mm. All agronomic measures were the same except for water and fertilizer control.

2.3. Measurement Index and Method

To avoid edge effects, three wheat plants were randomly selected for tagging around the center of the test pits in each treatment. Fluorescence parameters and photosynthetic indexes of wheat were measured after rehydration at the current growth period in sunny weather after the 2nd d, 5th d, and 9th d of rehydration. The measuring time was from 9:00 a.m. to 12:00 a.m.
(1) Determination of SPAD: The SPAD was measured using a SPAD-502 chlorophyll meter. The section of wheat was measured at 1/2 of the flag leaf and at 3 cm above and below it. (2) Fluorescence parameter measurement: The light energy conversion efficiency (Fv/Fm), photochemical quenching coefficient (qP), non-photochemical quenching coefficient (NPQ), and fast fluorescence response curve (ETR) of wheat were measured by MINI-PAN-II ultraportable pulse-amplitude-modulation, which was first clamped at the middle of the flag leaf with a leaf clip before being measured. Then, the leaf was dark adapted for 15 min, and finally, the fiber optic. The fiber optic sensor was inserted into the leaf clip, and the shading sheet on the leaf was removed to start the chlorophyll fluorescence induction curve and rapid fluorescence response curve functions.
After rehydration at the heading stage, the soil water content of all experimental treatments subsided to normal levels. The rapid light response curve of winter wheat flag leaf under light acclimation conditions was measured. The light response curve was determined by accumulating photosynthetically active radiation flux density (PAR) using the instrument’s own photometric probe and thermocouple and settings of 0, 50, 100, 150, 200, 300, 450, 650, 1000, and 1500 μ. The flag leaf electron transfer rate (ETR) was measured with 10 gradients of 0, 50, 100, 150, 200, 300, 450, 650, 1000, and 1500 μmol·m−2·s−1. The measurement time was 10 s for each light intensity. The equations were fitted using the least squares method as follows.
ETR = rETR m   1     e - α × PAR   /   rETR m e β * PAR / rETR m
where rETRm is the maximum potential relative electron transfer rate in the absence of photoinhibition; α is the initial slope of the rETR-PAR curve, reflecting the plant’s ability to use light; half-saturation light intensity Ek = rETRm/α; and β is the photosynthetic inhibition parameter [16,17].
(3) Photosynthetic parameters were measured using a GFS-3000 portable photosynthesizer to measure the net photosynthetic rate (Pn), transpiration rate (Tr), stomatal conductance (Gs), and intercellular CO2 concentration (Ci) of winter wheat flag leaves under natural light conditions with a leaf chamber temperature of 25 °C, leaf chamber area of 4 cm2, CO2 concentration of 400 μmol.mol−1, flow rate of 750 μmol mol−1, and air humidity of 50%.

3. Results

3.1. Response of Winter Wheat Flag Leaf SPAD to Water and Nitrogen

The results of the 2nd d, 5th d, and 9th d after rehydration at different levels of N application are shown in Figure 3. T5 significantly increased the SPAD value by 12.0%, 17.9%, and 17.2% (p < 0.05) compared to T1; T3 increased significantly by 4.1%, 10.6%, and 11.4% (p < 0.05) compared to T1; T6 increased significantly by 25.6%, 33.0%, and 16.7% (p < 0.05) compared to T2; T4 increased significantly by 4.2%, 13.5%, and 15.5% (p < 0.05) compared to T2, respectively. The response of SPAD to rehydration was greater at the heading stage at different rehydration periods than at the jointing stage. Both of them reached the maximum at the 5th d after rehydration. At this time, the SPAD at three N application levels at the heading stage were 3.2%, 5.9%, and 4.1% higher than those at the jointing stage, respectively (Figure 3).
From the above results, SPAD showed a trend of first increasing and then decreasing. The recovery rate and maximum value of SPAD after rehydration were greater at the tassel stage than at the jointing stage. The magnitude effect of the N application level on SPAD was high N > low N > no N.

3.2. Response of Chlorophyll Fluorescence Kinetic Parameters of Winter Wheat Flag Leaves to Water and Nitrogen

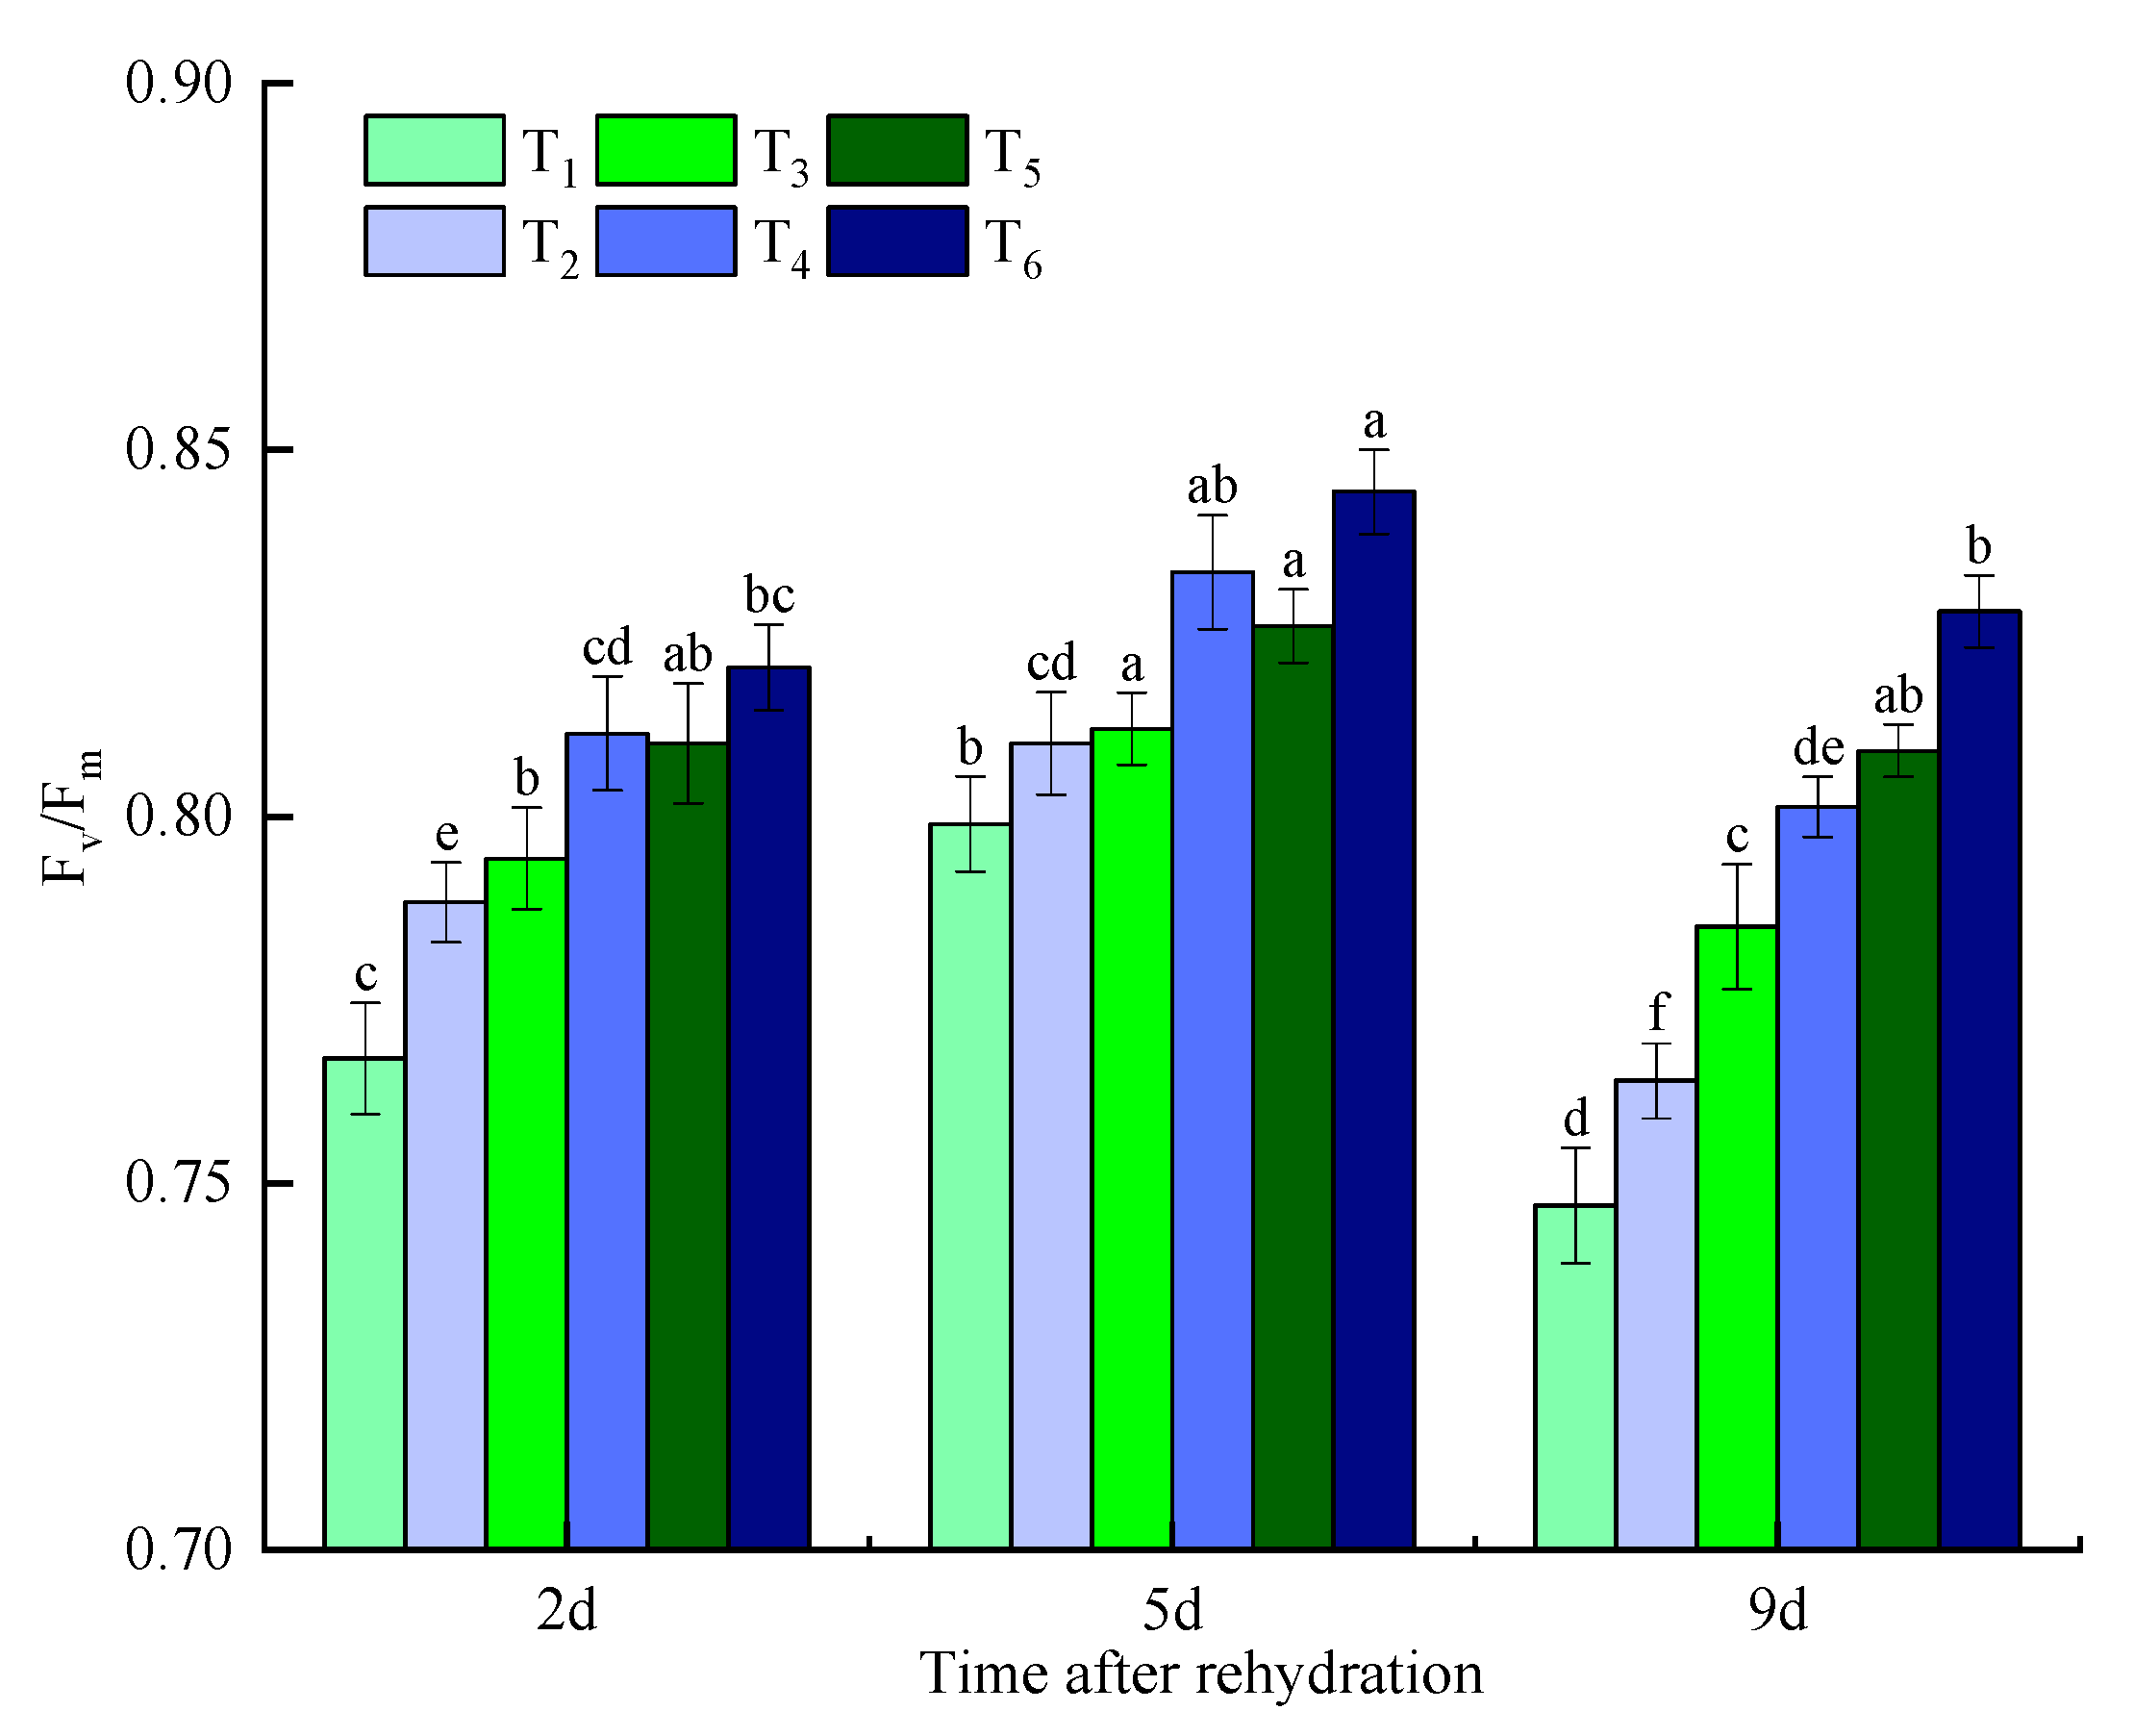
3.2.1. Response of Winter Wheat Flag Leaf Fv/Fm to Water and Nitrogen

The three measurements after rehydration were combined with different N levels. Compared with T1, T3 significantly increased Fv/Fm by 3.6%, 1.6%, and 5.1% (p < 0.05), and T5 had a greater increase than T3, whereas compared with T2, T4 significantly increased Fv/Fm by 2.9%, 2.9%, and 4.8% (p < 0.05). Moreover, T6 had a greater increase. At different rehydration periods, both of them reached the maximum at the 5th d after rehydration (Figure 4). From the above results, the value of Fv/Fm showed a trend of increasing and then decreasing after rehydration, and the increase was positively correlated with the level of N application. The Fv/Fm value reached the maximum at the 5th d after rehydration and gradually decreased after the 5th d. At the same time, its decrease was positively correlated with the level of N application. The increase in Fv/Fm after rehydration at the heading stage was greater than at the jointing stage, and Fv/Fm at the heading stage was greater than that at the jointing stage after the same rehydration time.

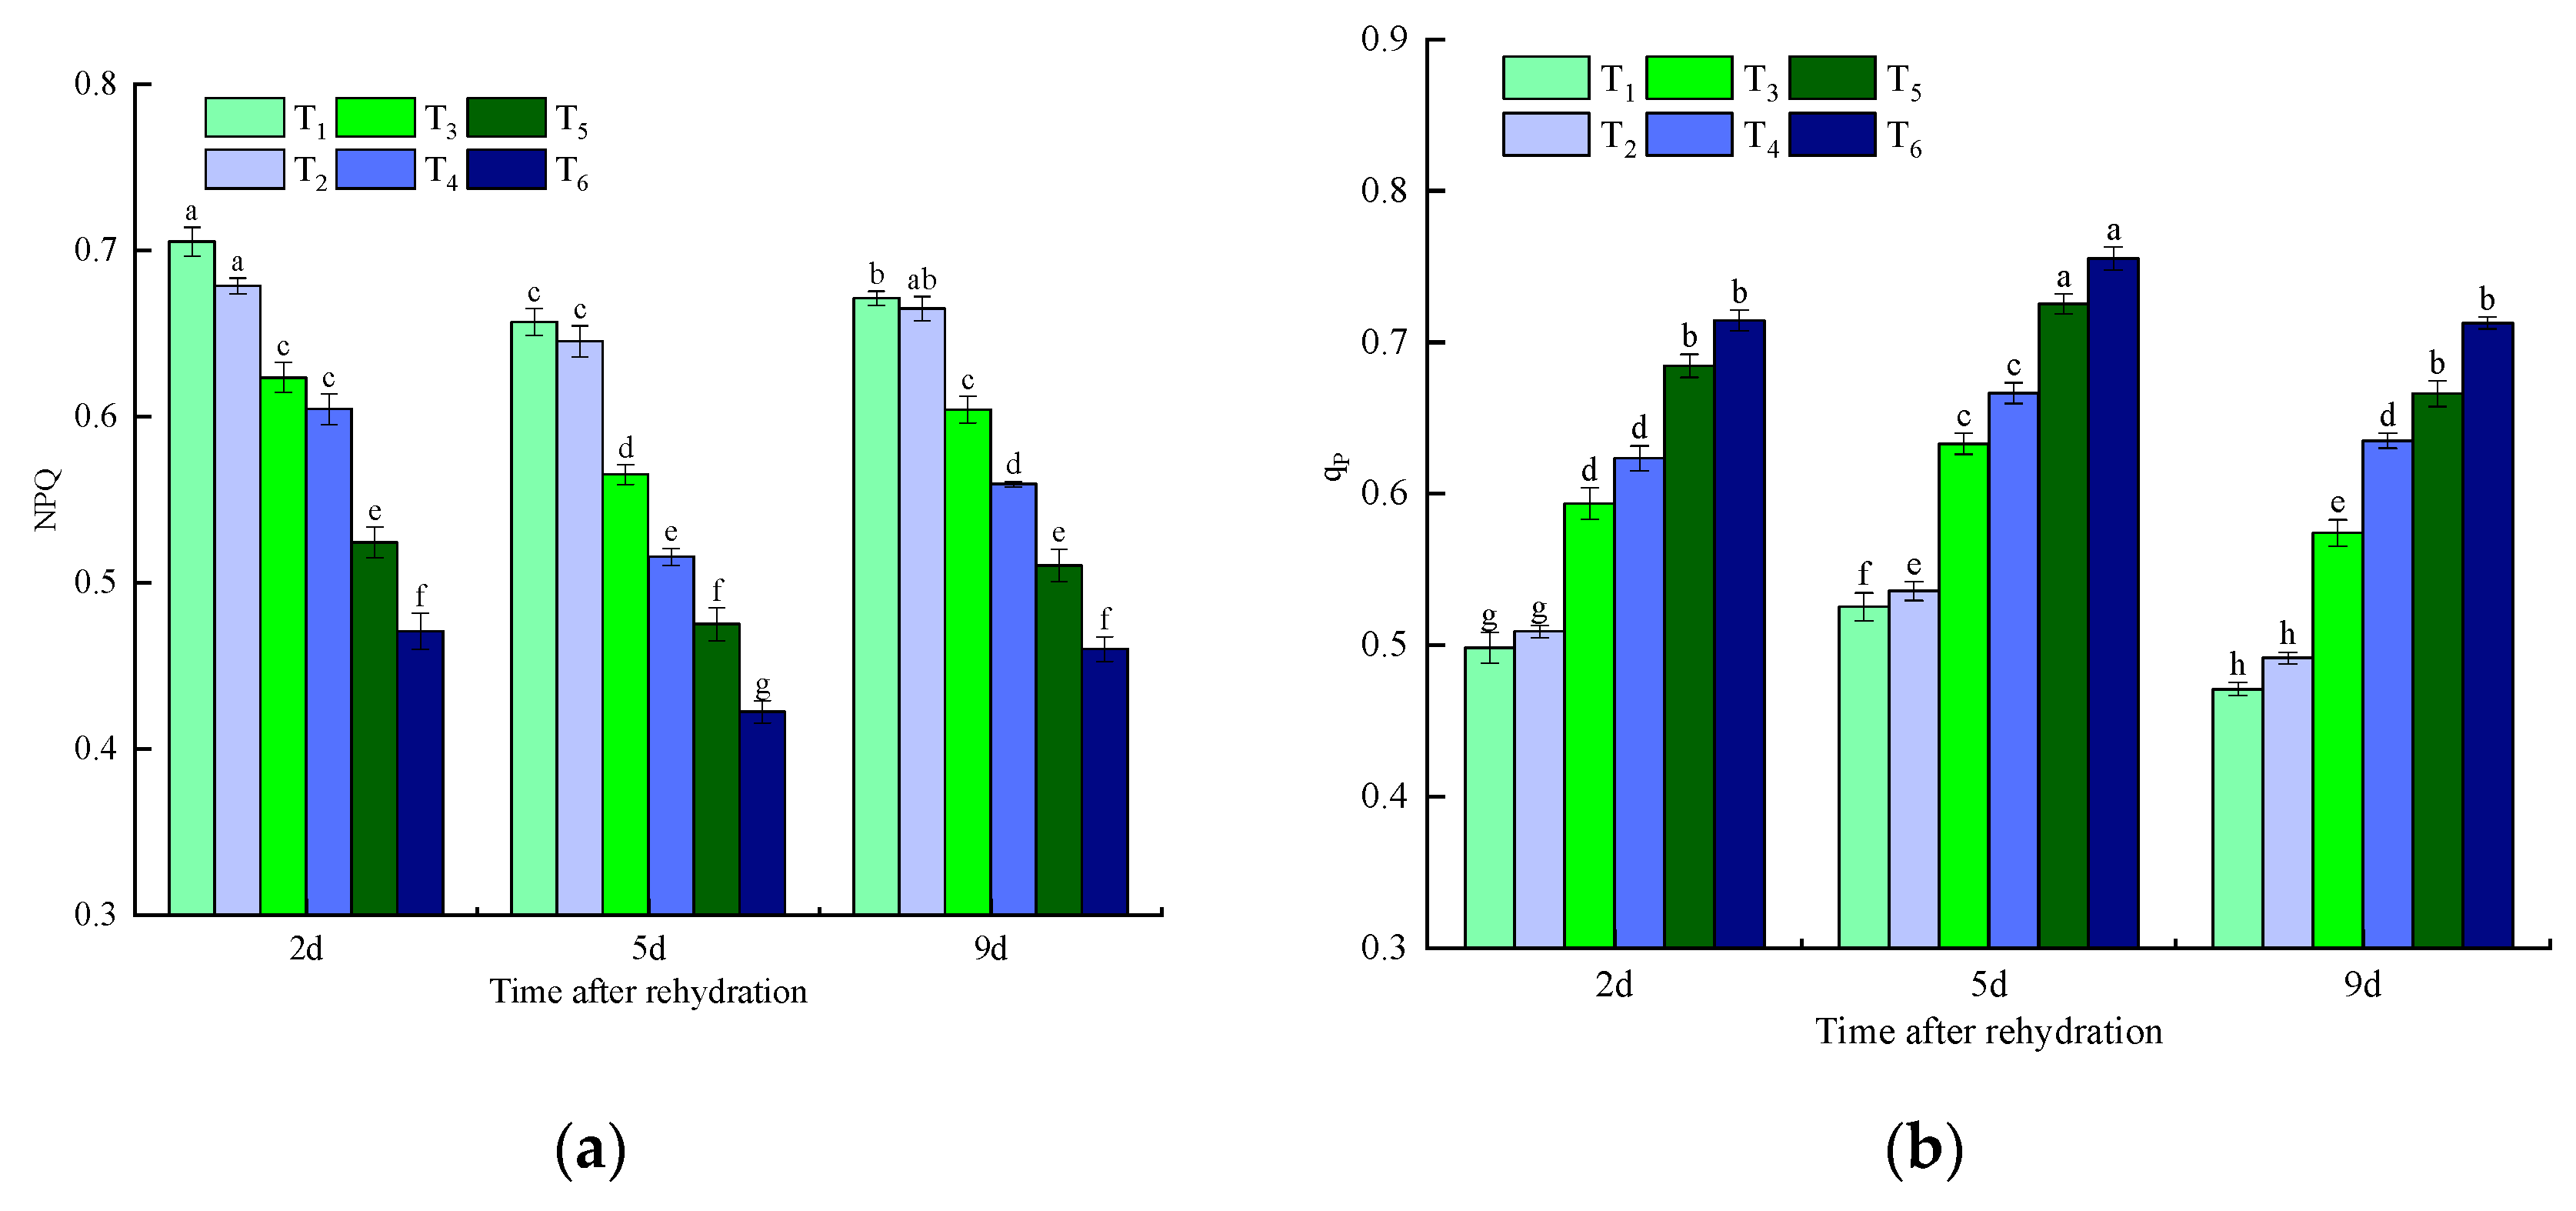
3.2.2. Response of Flag Leaf qP and NPQ of Winter Wheat to Water and Nitrogen

The qP increased and then decreased after rehydration, while the opposite was true for NPQ (Figure 5). At different levels of N application, the qP of T5 was significantly higher than T1, by 37.4%, 38.1%, and 41.4% (p < 0.05), and the qP of T3 was significantly higher than T1, by 19.1%, 20.5%, and 21.8% (p < 0.05), respectively. The qP significantly increased after rehydration at the heading stage. The trend of NPQ after rehydration is opposite to qP, but the magnitude of its change is basically similar to qP (Figure 5).
From the above results, it is clear that both qP and NPQ need a recovery period for their physiological activities after rehydration after drought stress, and they can generally recover to normal levels by about the 5th d. Increasing the N application level not only increased the recovery rate but also improved qP and reduced NPQ. The recovery rate of the fluorescence coefficient after rehydration is faster at the tasseling stage than at the pulling stage and also improves qP and reduces NPQ.

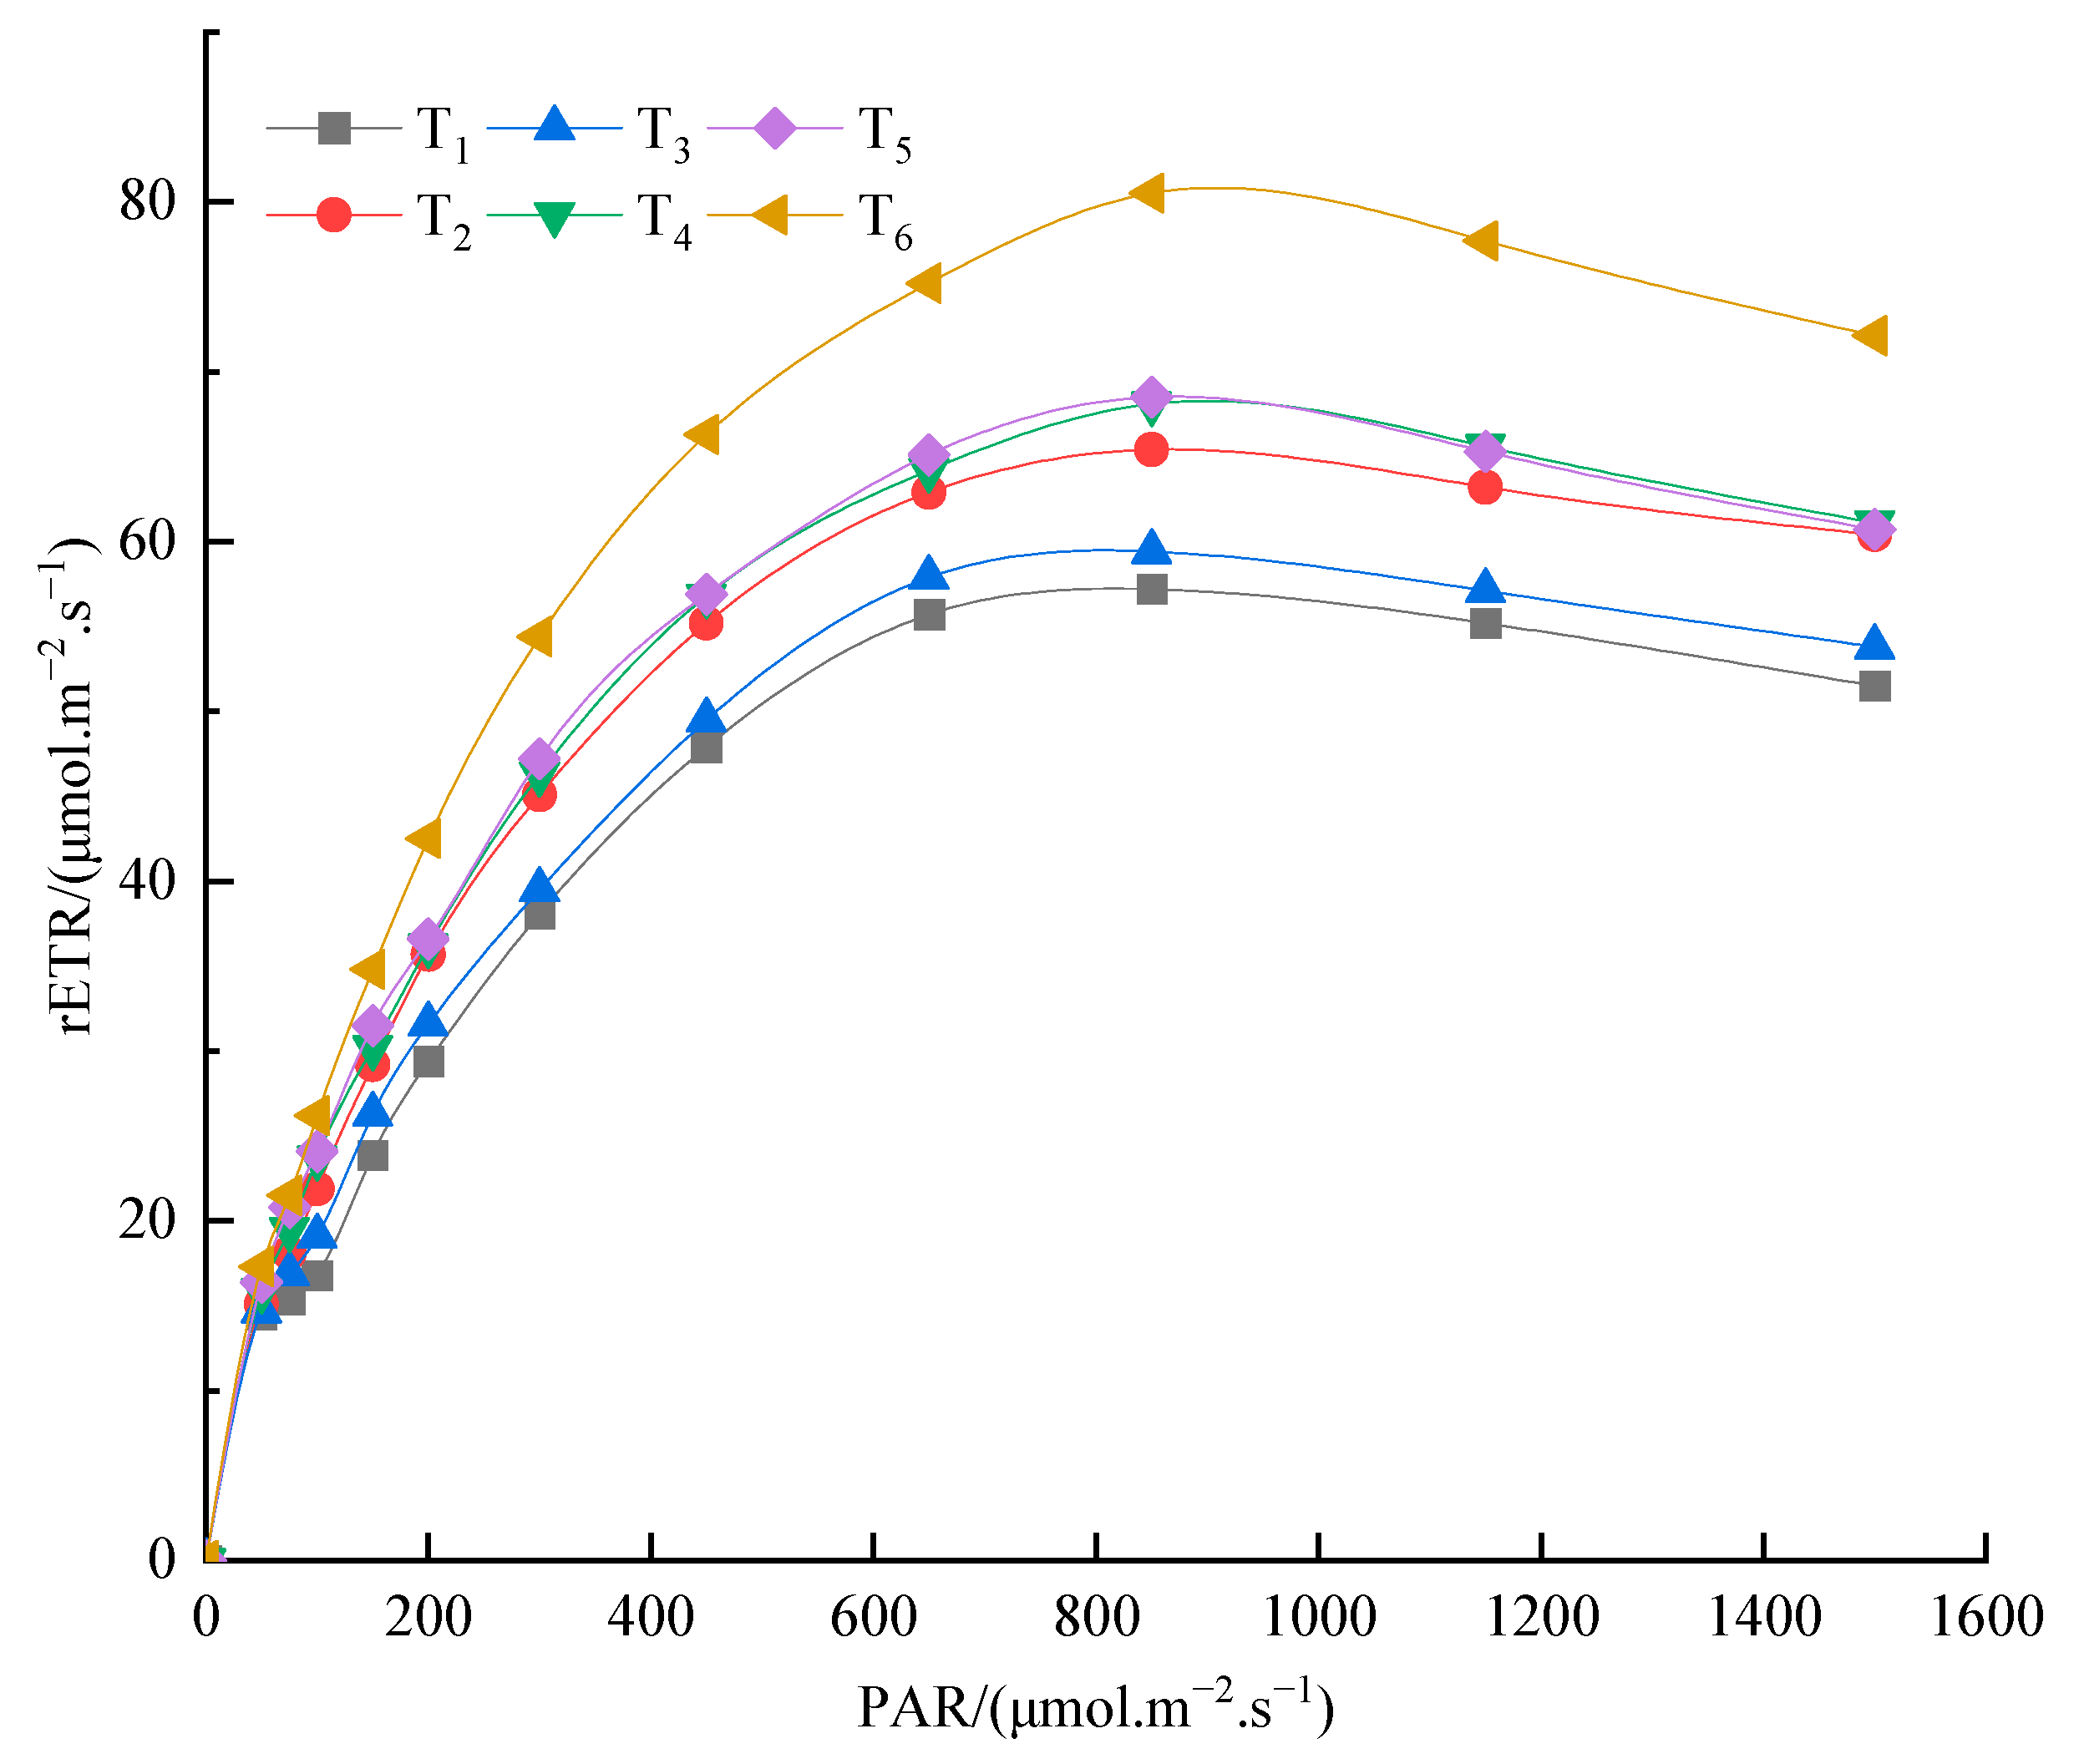
3.2.3. Response Analysis of Fast Fluorescence Response Curve to Water and Nitrogen

A nonlinear fit of the fast fluorescence response curve was performed by applying the least-squares method (Figure 6), and the results of the fitting of the characteristic parameters are shown in Table 3; none of the correlation coefficients R2 were less than 0.99, within the 95% confidence interval. Water replication and nitrogen application increased the light energy utilization capacity of maximum leaves, and rETRm was ranked from largest to smallest as T6, T4, T2, T5, T3, and T1. At the same level of nitrogen application, T6, T4, and T2 increased by 25.4%, 23.8%, and 26.6% compared to T5, T3, and T1, respectively. The rETRm was more influenced by the rehydration of the heading stage after the soil water content of all treatments subsided to normal levels. The rETRm increased with the increase in the level of N application. The initial slope and the response of half-saturation light intensity to water and nitrogen showed a similar pattern to that of rETRm.

3.3. Response of Photosynthetic Parameters of Winter Wheat to Water and Nitrogen

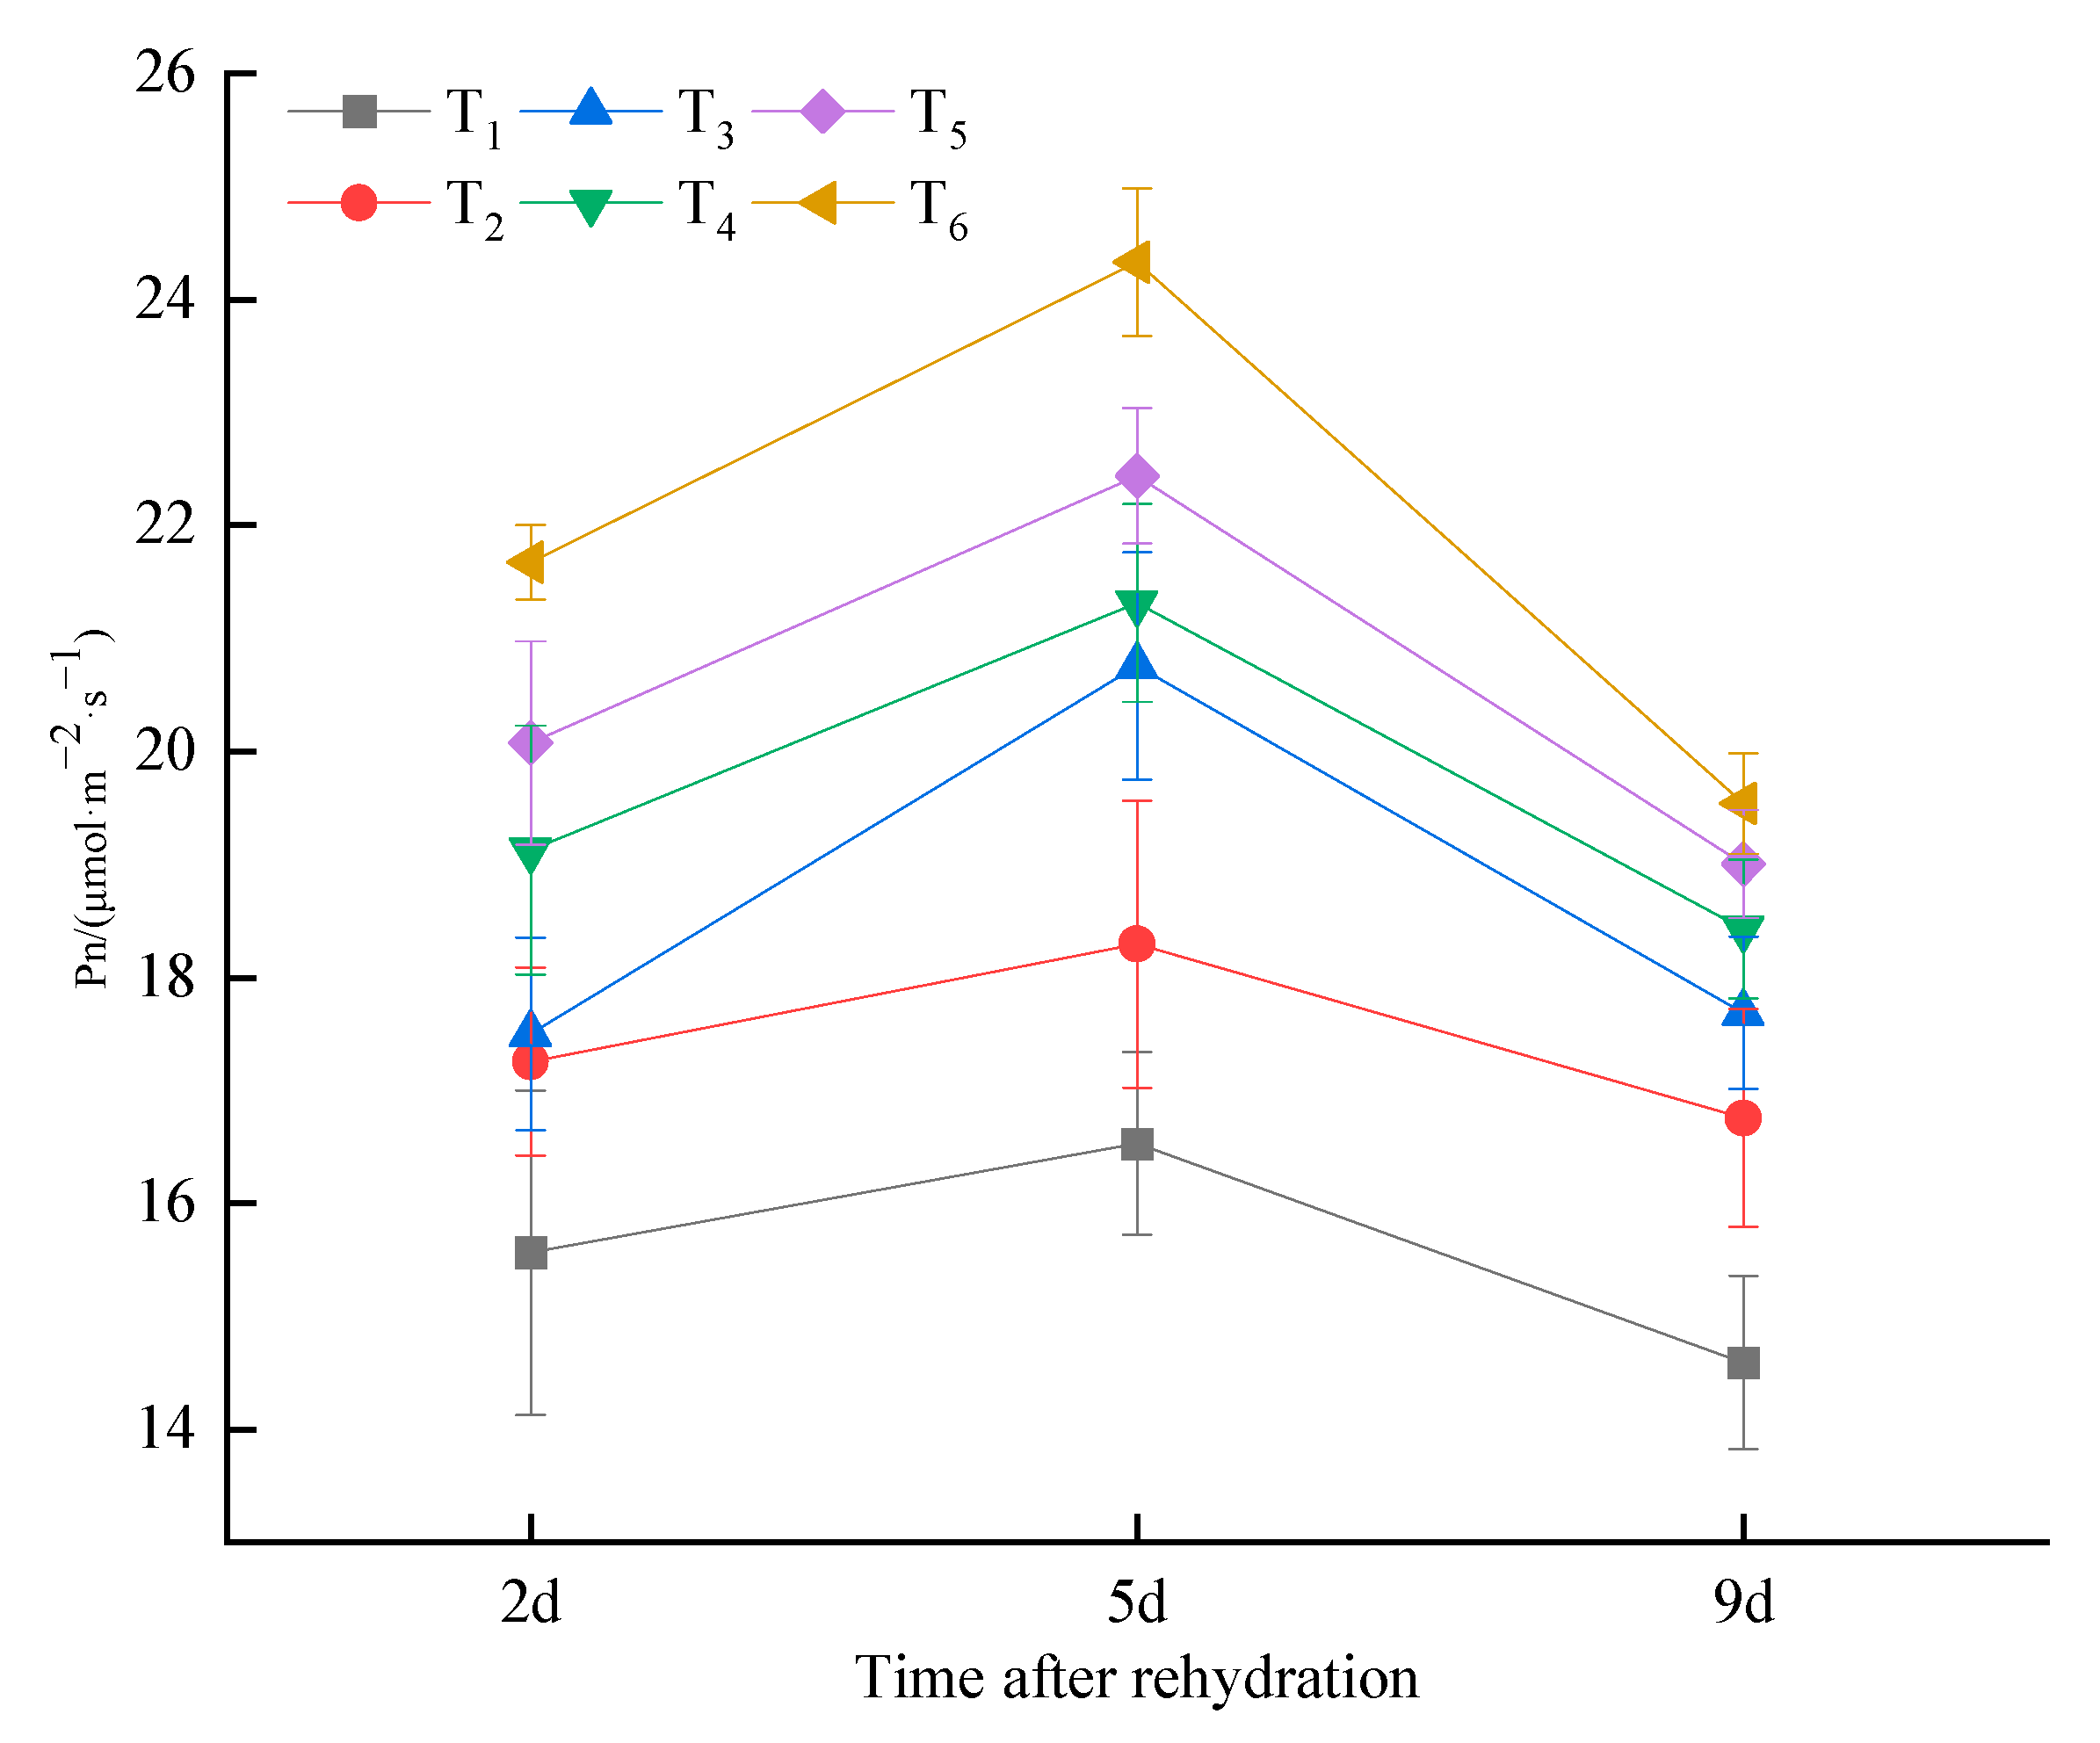
3.3.1. Response of Net Photosynthetic Rate of Flag Leaf of Winter Wheat to Water and Nitrogen

At different levels of N application, the results of the 2nd d, 5th d, and 9th d after rehydration showed that T5 increased significantly by 28.9%, 35.8%, and 30.2% (p < 0.05) compared to T1; T3 increased significantly by 12.4%, 25.6%, and 21.2% (p < 0.05) compared to T1; T6 increased significantly by 25.6%, 33.0%, and 16.7% (p < 0.05) compared to T2; T4 increased significantly by 10.8%, 16.5%, and 10.0% (p < 0.05) compared to T2, respectively. At the same level of N application in different rehydration periods, Pn showed a significant increase at the tassel stage compared to the pulling stage at the 2nd, 5th, and 9th d after rehydration (Figure 7).
After rehydration under different treatments, Pn required a period of recovery and generally recovered completely on 5th d. After the 5th d, Pn gradually decreased with the decrease in soil water content. The recovery rate of Pn after rehydration at the tasseling stage was greater than that at the nodulation stage. The maximum rate of Pn at the nodulation stage was higher than that at the nodulation stage after drought stress at the same N application level. With increased N application, not only can the recovery rate of Pn after rehydration be accelerated, but also the maximum Pn can be increased.

3.3.2. Response of Flag Leaf Transpiration Rate, Stomatal Conductance, and Intercellular CO2 Concentration of Winter Wheat to Water and Nitrogen

The changes in photosynthetic indexes under different treatments are shown in Table 4. Results of the 2nd d, 5th d, and 9th d after rehydration at different levels of N application were that the Tr of T5 increased significantly by 38.2%, 24.5%, and 18.8% (p < 0.05). Compared to T1, the Tr in T3 increased significantly by 21.7%, 13.0%, and 8.1% (p < 0.05), respectively. There was a more significant increase after rehydration at the heading stage. The change patterns of Tr and Gs under different treatments were basically the same. Ci was significantly accelerated in the first 5th d after rehydration under the N application treatment and began to decrease gradually after 5th d. However, Ci showed an increase in the measurement at the 9th d after rehydration at the jointing stage under the no N treatment, with an increase of 3.2% compared to the 5th d. Additionally, under the low N condition, only a small decrease was observed on the 3rd d measurement after rehydration. T6 and T5 showed a significant decrease of 10.3% and 11.6% (p < 0.05) at the 9th d compared to the 5th d, respectively (Table 4).
From the above results, all photosynthetic indexes gradually increased after rehydration, and the changes in Tr and Gs were basically the same. After the 5th d of rehydration, Tr and Gs started to decrease due to the receding soil moisture, but Ci showed an increase and a small decrease under the low N treatment without N application. Significant differences in photosynthetic indexes were observed under different N application treatments (p < 0.05). The photosynthetic indexes of the same N application treatment were also greater after rehydration at the tasseling stage than at the nodulation stage.

4. Discussion

N is essential for plant photosynthesis, and water is the basis for plant physiological activities. Many scholars have studied the effect of water and N regulation and chlorophyll fluorescence properties in plants [18,19,20,21]. Research shows that water and N promote each other and limit each other, water can accelerate the rate of N transport by crop roots, and N can promote the water uptake capacity of crop roots [22]. Insufficient water will affect the transport of crop nutrients, while insufficient growth will affect the uptake of water by crops. Optimum water and N can improve the physiological performance of crops and promote photosynthesis [23].

4.1. Response of Winter Wheat Flag Leaf SPAD to Water and Nitrogen

Chlorophyll is an indispensable substance for photosynthesis in plants; when chlorophyll content is high, the leaves can use more light energy and absorb and convert more CO2 for photosynthesis [24,25]. There is a significant positive correlation between the relative chlorophyll content (SPAD) and chlorophyll content of plant leaves, that is, the SPAD can be measured instead of the traditional measurement of chlorophyll values [26,27]. The higher the N level, the greater the SPAD value at the same water level. N promoted chlorophyll synthesis and slowed chlorophyll decomposition in winter wheat, increasing SPAD in winter wheat [28]. SPAD does not return to normal levels immediately after rehydration, and its return to normal water generally takes about 5 d, the reasons for this are that the chlorophyllase activity in flag leaves did not fully recover at the early stage after rehydration due to the effects of the previous drought [29]. There was a significant (p < 0.05) difference between SPAD under the value of N application treatment and the treatment without N application after rehydration (Figure 3). It is possible that N promotes the physiological activity of winter wheat and enhances water uptake by the root system. However, the compensatory effect of N on SPAD decreased as the level of N application increased. Our results agree with Shi et al. [30] who found that SPAD in winter wheat first increased and then decreased with increasing N application level, so the above phenomenon may be due to exceeding the N demand for SPAD at high N levels, resulting in a lower compensation benefit per unit of N. At the same level of N application, winter wheat undergoing pre-drought stress will have a compensatory effect on SPAD after rehydration, and the SPAD of winter wheat undergoing pre-drought stress is greater than that of winter wheat not undergoing drought stress. It is possible that drought stress increased the physiological activity of winter wheat and increased the compensatory effect of SPAD produced after rehydration at the heading stage. The physiological activity of the crop differs at different growth stages, and the response of winter wheat flag leaf SPAD to rehydration also differs [31]. Therefore, physiological activity needs a recovery process when winter wheat is rehydrated under drought, which is usually fully recovered by about the 5th d. Rehydration treatment at the heading stage is better for improving N utilization and chlorophyll formation and promoting photosynthesis in winter wheat under drought and moderate N at the nodulation stage.

4.2. Response of Flag Leaf Fluorescence Parameters of Winter Wheat to Water and Nitrogen

Chlorophyll fluorescence kinetic parameters can fully reflect the efficiency of light energy capture, translocation, distribution, and energy consumption by leaves [32]. Overall, the Fv/Fm and photochemical quenching coefficients decreased while non-chemical quenching coefficients increased when winter wheat chlorophyll fluorescence parameters were subjected to drought stress. The drought stress caused permanent damage to the photosynthetic reaction center PSII under long-term stress, resulting in blocked photosynthetic primary reactions and, thus, reduced photosynthetic rates [32,33,34]. There were differences in the degree of response of different photosynthetic parameters to rehydration and N. There was a significant (p < 0.05) compensatory effect of Fv/Fm at different N levels after rehydration (Figure 3), and the compensatory effect of rehydration at the tassel stage was greater. Photochemical quenching coefficient and non-chemical quenching coefficient are two parameters with opposite trends because different photosynthetic parameters have different patterns of change in response to environmental stress (Figure 4) [35]. None of the fluorescence parameters recovered rapidly after rehydration without N application, and under N application, fluorescence parameters responded rapidly to rehydration, which is consistent with Sao’s [36] study. This was because of the inhibition of the fluorescence response of the flag leaf in winter wheat due to the N deficiency [37]. It is possible that the increasing N application increased the root activity of winter wheat and enhanced the water and nutrient uptake capacity of winter wheat roots. After moderate drought stress at the pulling stage, winter wheat improved the water and N utilization capacity and their tolerance of winter wheat flag leaves during drought. The recovery rate of the fluorescence coefficient was accelerated after rehydration at the tasseling stage. Therefore, the energy consumption during the photosynthesis of winter wheat flag leaf could be appropriately reduced under the treatment of rehydration and moderate N application after moderate drought, increasing the openness of the light response system and improving the photosynthetic rate.

4.3. Response of Fast Fluorescence Response Curve and Characteristic Parameters to Water and Nitrogen

The N application level and rehydration period could have significant effects on the fluorescence response characteristics of winter wheat flag leaves under normal water conditions. Before the light intensity reached the saturation point, the fast fluorescence response curve tended to be smooth as the electron transfer rate gradually increased with the increase in light intensity, and the fast fluorescence response curve of leaves slightly decreased when the light intensity saturated [38]. It may be that when the light intensity is too high, the plant cannot adapt and photoinhibition occurs (Figure 6). The flag leaf electron transfer rate (ETR) refers to the absolute electron transfer rate of PS Ⅱ, i.e., the absolute linear electron flow rate through PS Ⅱ. The larger the slope, the faster the electron transfer rate [39,40]. The maximum potential relative electron transfer rate, initial slope of fluorescence response curve α, half saturation, and light intensity under normal water conditions were most affected by the high N treatment at the tassel stage (Table 3). It is possible that the drought stress in the pre-stage period of winter wheat enhanced the resistance of winter wheat to stress and strengthened the uptake of water and nitrogen under drought conditions. The maximum potential relative electron transfer rate is significantly (p < 0.05) reduced under prolonged drought stress, probably because the enzymes associated with photochemical reactions in PSII are reduced, decreasing the maximum potential relative electron transfer rate [41].

4.4. Response of Flag Leaf Photosynthetic Index of Winter Wheat to Water and Nitrogen

Photosynthesis is the process by which green plants absorb solar energy, assimilate carbon dioxide and water, produce organic matter, and release oxygen. Appropriate irrigation and N application will accelerate the photosynthetic rate of winter wheat flag leaves and improve crop yield [42,43]. Net photosynthetic rate (Pn) reflects the final oxygen production and organic matter accumulation in leaves. As the most critical physiological leaf of wheat in the late reproductive stage, the photosynthetic capacity rate of flag leaf is closely related to the growth and development of the plant, and ultimately affects the accumulation of dry matter in the crop [44]. Transpiration rate, stomatal conductance, and intercellular CO2 concentration laterally reflect the response of leaves to the factors influencing photosynthesis during photosynthesis [45]. The changes in net photosynthetic rate, transpiration rate, and stomatal conductance remained basically the same (Figure 7, Table 4). This is mainly because a decrease in stomatal conductance means that stomata are closed, and leaves cannot exchange gases with the outside world through stomata, which in turn affects the net photosynthetic rate and transpiration rate of leaves. The photosynthetic indexes were affected by the level of N application at the same water level: high N > low N > no N application, probably because N enhanced the water uptake capacity of winter wheat roots, resulting in more water in the leaves and increased openness of stomatal conductance, which accelerated the transpiration rate and photosynthetic rate of the leaves [46], and the rate of net photosynthetic rate was relatively low under no and low N conditions. Comparing the photosynthetic indexes at different growth stages with the same level of N application, stomatal conductance, net photosynthetic rate and transpiration rate were more responsive to rehydration at the heading stage than at the jointing stage. This is probably because short-term drought stress increased the tolerance of winter wheat to drought, and the rehydration increased the water and N uptake capacity of winter wheat, which in turn elevated the water content of the flag leaf, accelerating Tr, and Gs increased the stronger photosynthetic characteristics of winter wheat during the heading stage [47]. Tr decreased most significantly under drought conditions (p < 0.05), and water deficit had the most direct effect on the transpiration rate.
The trend of intercellular CO2 concentration was different from the other three photosynthetic indicators (Table 4). The rehydration after drought could increase intercellular CO2 concentration substantially, and the increase was correlated with the level of N application. When soil moisture decreased, intercellular CO2 concentration decreased significantly (p < 0.05) at high N levels, and only a small change in intercellular CO2 concentration occurred at low and no N application. The above phenomenon is due to the simultaneous lack of water and N, resulting in decreased photosynthetic activity of winter wheat flag leaves. Most intercellular CO2 concentration is not fixed through plant photosynthesis, resulting in an intercellular elevation [48]. After rehydration, the water increases in plants accelerated the photosynthetic rate, increased stomatal opening and the rate of gas exchange between flag leaves and the outside world, and N promoted the water uptake capacity of the root system [49]. High N leaves can increase the compensatory benefits of photosynthetic indicators after rehydration, while reducing the magnitude of Ci increase due to non-stomatal factors. The decrease in field water holding capacity reduced the water content of winter wheat flag leaves and reduced stomatal opening, while the photosynthetic rate decreased.

5. Conclusions

The results of water regulation studies on winter wheat at different levels of N application showed that a brief drought stress reduced SPAD, Fv/Fm, qP, rETRm, and photosynthetic indices of winter wheat flag leaves and increased NPQ. The degree of response of different photosynthetic parameters to drought stress differed. After rehydration, fluorescence and photosynthetic can be recovered in a few days. The increase in N application can alleviate the degree of drought stress of fluorescence and photosynthetic parameters and increase the compensation effect produced by rehydration. Since the formation of winter wheat yield mainly occurs after the heading stage, moderate drought exercise and increased N application under controlled irrigation in the early growth period of winter wheat are beneficial to improving winter wheat yield.

Author Contributions

Methodology, S.G. and D.L.; software, H.L. and H.H.; validation, H.L.; formal analysis, H.L.; investigation, H.L. and H.H.; data curation, H.L.; writing—original draft preparation, H.L.; writing—review and editing, S.G. and S.J.L.; visualization, H.L.; supervision, Y.L.; project administration, D.L.; funding acquisition, Y.L. All authors have read and agreed to the published version of the manuscript.

Funding

National Natural Science Foundation of China: Research on Water saving Irrigation Mode in Yellow River Diversion Irrigation Area Based on Hydrology Water Quality Crop Growth Coupling Model (52179015); Key R&D and promotion projects in Henan Province (212102110031).

Data Availability Statement

The data presented in this study are available on demand from the third author.

Conflicts of Interest

The authors declare no conflict of interest.

References

  1. Lahuta, L.B.; Szablińska, P.J.; Horbowicz, M. Changes in Metabolic Profiles of Pea (Pisum sativum L.) as a Result of Repeated Short-Term Soil Drought and Subsequent Re-Watering. Int. J. Mol. Sci. 2022, 23, 1704. [Google Scholar] [CrossRef]
  2. Kuan, T.; Yun, W.; Dan, C.; Cao, M.; Luo, J. Influence of Drought Stress and Post-Drought Rewatering on Phytoremediation Effect of Arabidopsis thaliana. Bull. Environ. Contam. Toxicol. 2022, 108, 594–599. [Google Scholar]
  3. Li, J.M.; Pan, T.H.; Wang, H.L.; Du, Q.J.; Chang, Y.B.; Zhang, D.L.; Liu, Y. Effects of water-fertilizer coupling on tomato photosynthesis, yield and water use efficiency. Trans. Chin. Soc. Agric. Eng. 2014, 30, 82–90. [Google Scholar]
  4. Wu, Y.; Wang, W.; Zhao, Z.; Huang, X.F.; Fan, Y.T.; Su, L.Y.Z. Photosynthesis Rate and Leaf Water Use Efficiency of Korla Fragrant Pear Tree under Regulated Deficit Irrigation. Trans. Chin. Soc. Agric. Mach. 2012, 11, 80–86. [Google Scholar]
  5. Evans, L.T.; Dunstone, R.L. Some physiological aspects of evolution in wheat. Aust. J. Biol. Sci. 1970, 23, 725–741. [Google Scholar] [CrossRef] [Green Version]
  6. Meng, Y.H.; Sha, L.W.; Jen, H.W. Rapid Light-Response Curve of Chlorophyll Fluorescence in Terrestrial Plants: Relationship to CO2 Exchange among Five Woody and Four Fern Species Adapted to Different Light and Water Regimes. Plants 2021, 10, 445. [Google Scholar]
  7. Guarini, J.M.; Moritz, C. Modelling the dynamics of the electron transport rate measured by PAM fluorimetry during Rapid Light Curve experiments. Photosynthetica 2009, 47, 206–214. [Google Scholar] [CrossRef]
  8. Ashraf, M.; Harris, P. Photosynthesis under Stressful Environments. Photosynthetica 2013, 51, 163–190. [Google Scholar] [CrossRef]
  9. Lu, C.; Zhang, J. Effects of water stress on photosystem II photochemistry and its thermostability in wheat plants. J. Exp. Bot. 1999, 50, 1199–1206. [Google Scholar] [CrossRef]
  10. Zhang, Y.Y. Compensatory effects of Rewatering after Droughton Growth and Physiology of Platycladus orientalis. Master’s Thesis, Northwest A & F University, Xianyang, China, 2020. [Google Scholar]
  11. Xing, J.Y. Effects of Drought Priming and N Application on Physiological Characteristics and Water Use Efficiency of Wheat. Master’s Thesis, Chinese Academy of Agricultural Sciences, Beijing, China, 2021. [Google Scholar]
  12. Tian, W.Z.; Feng, W.S.; Li, J.H.; Yang, H.Q.; Wen, H.X.; Zhang, S.L.; Duan, G.H. Effects of light drought at different periods on wheat yield traits and flag leaf antioxidant enzyme activity. Jiangsu Agric. Sci. 2021, 49, 99–104. [Google Scholar]
  13. Gao, Z.; Liang, X.G.; Zhang, L.; Zhao, X.; Du, X.; Cui, Y.H. Effects of irrigating at different growth stages on kernel number of spring maize in the North China Plain. Acta Agron. Sin. 2021, 47, 1324–1331. [Google Scholar]
  14. Cong, X.; Pang, G.B.; Zhang, L.Z.; Xu, Z.G.; Yang, J.L.; Mo, X.H. Effects of N-reducing and Suitable Water on Photosynthetic Characteristics of Winter Wheat and Distribution of Soil Water and N. Trans. Chin. Soc. Agric. Mach. 2021, 26, 1000–1298. [Google Scholar]
  15. Zhang, Y.L.; Cao, C.F.; Li, H.W.; Qiao, Y.Q.; Zhao, Z. Effect of N Application on Yield Quality and Fluorescent Characteristic of Late sown Winter Wheat. J. Triticeae Crops 2013, 33, 965–971. [Google Scholar]
  16. Peter, J.R. Rapid light curves: A powerful tool to assess photosynthetic activity. Aquat. Bot. 2005, 82, 222–237. [Google Scholar]
  17. Platt, T.; Gallegos, C.L.; Harrison, W.G. Photoinhibition of photosynthesis in natural assemblages of marine phytoplankton. J. Mar. Res. 1980, 38, 341–345. [Google Scholar]
  18. Hui, W. Effects of Water and N Coupling on Growth, Nutrient Uptake and Water and N Utilization of Quinoa; TaiYuan Shanxi University: Taiyuan, China, 2021. [Google Scholar]
  19. Cao, X.; Zhong, C.; Sajid, H. Effects of watering regime and N application rate on the photosynthetic parameters, physiological characteristics, and agronomic traits of rice. Acta Physiol. Plant. 2017, 39, 135–147. [Google Scholar] [CrossRef]
  20. Jin, K.; Wang, D.S.; Cai, D.X.; Zhou, Y.; Guo, S.C.; Huang, F. Response and interaction for water and fertilizer I interaction of N, P and water in the year of different precipations. Plant Nutr. Fertil. Sci. 1999, 5, 1–7. [Google Scholar]
  21. Zhou, H.M.; Zhang, S.; Du, X.W.; Niu, X.L.; Wang, S.S.; Xie, X.L. Effects of Water and Fertilizer Coupling on Growth and Physiological Characteristics of Young Apple Tree under Drip Irrigation. Trans. Chin. Soc. Agric. Mach. 2021, 10, 1000–1298. [Google Scholar]
  22. Hao, Z.; Li, H.Y. Post-anthesis alternate wetting and moderate soil drying enhances activities of key enzymes in sucrose-to-starch conversion in inferior spike lets of rice. J. Exp. Bot. 2012, 63, 215–227. [Google Scholar]
  23. Dong, Z.Q.; Lu, L.H.; Zhang, L.H.; Yao, Y.R.; Zhang, J.T.; Shen, H.P. Yield and Photosynthetic Characteristics of Winter Wheat Released in Different Ages under LongTerm Water-N Interaction. J. Triticeae Crops 2020, 40, 1524–1532. [Google Scholar]
  24. Zhang, Y.S. Characteristic Analysis of Chlorophyll Content and Chlorophyll Fluorescence Parameters of C3 and C4 Plants in the Desert Steppe of Inner Mongolia; Inner Mongolia Normal University: Hohhot, China, 2016. [Google Scholar]
  25. Chug, P.; Sharma, P. Effect of Heat Stress on the Relationship between SPAD and Chlorophyll Content in Indian Mustard Genotypes. Curr. J. Appl. Sci. Technol. 2021, 40, 38–47. [Google Scholar] [CrossRef]
  26. Ai, T.C.; Li Fang, m.; Zhou, Z.A.; Zhang, M.; Wu, H.R. Study on the correlation between chlorophyll content and SPAD value of crop leaves. J. Hubei Agric. Univ. 2000, 20, 6–8. [Google Scholar]
  27. Shen, Y.Y. SPAD and Photosynthetic Characteristics of Juglans regia L Leaves Under Different Water Stress; Henan Agricultural University: Zhengzhou, China, 2017. [Google Scholar]
  28. Li, P.; Jia, Y.H.; Zhang, J.S.; Luo, S.W.; Wang, K.; Shi, S.B. Effects of N Topdressing Ratio on Photosynthetic Traits and Yield of Winter Wheat under Uniform Sowing. J. Triticeae Crops 2021, 41, 1015–1022. [Google Scholar]
  29. Li, Y.B.; Bian, Z.P.; Li, D.X.; Feng, Y. Effects of Drought Rehydration before Anthesis on Photosynthetic Characteristics, Yield and Water Use Efficiency of Winter Wheat. China Rural Water Hydropower 2020, 6, 109–114+138. [Google Scholar]
  30. Shi, Z.; Gao, S.M.; Li, T.; Li, Y.Z.; Li, H.X. Effect of N Application Rate on Growth Yield and Quality of Wheat with Different Chlorophyll Content. J. Triticeae Crops 2021, 41, 1134–1142. [Google Scholar]
  31. Li, D.X.; Lou, R.T.; Li, Y.B. Effects of Multi-Stage Continuous Drought on Photosynthetic Characteristics, Yield and Water Use Efficiency of Winter Wheat. Phyton 2020, 89, 691–703. [Google Scholar] [CrossRef]
  32. Ptushenko, V.V.; Ptushenko, O.S.; Tikhonov, A.N. Chlorophyll fluorescence induction, chlorophyll content, and chromaticity characteristics of leaves as indicators of photosynthetic apparatus senescence in arboreous plants. Biochemistry 2014, 79, 260–272. [Google Scholar] [CrossRef]
  33. Oksana, S.; Andrey, K.; Ekaterina, G. Analysis of chlorophyll fluorescence parameters as predictors of biomass accumulation and tolerance to heat and drought stress of wheat (Triticum aestivum) plants. Funct. Plant Biol. FPB 2021, 49, 155–169. [Google Scholar]
  34. Yu, K.S.; Bhandari, S.R.; Jo, J.S. Effect of Drought Stress on Chlorophyll Fluorescence Parameters, Phytochemical Contents, and Antioxidant Activities in Lettuce Seedlings. Horticulturae 2021, 7, 238. [Google Scholar]
  35. Chen, X.E.; Li, J.H.; Wu, Y.; Li, A.; Wen, B.; Bai, W.F. Effects of soil water stress on chlorophyll fluorescence characteristic of two blueberry varieties. J. Cent. South Univ. For. Technol. 2019, 39, 109–114+138. [Google Scholar]
  36. Wu, J.Z.; Wang, Z.M.; Li, Y.J.F.; Wei, S.; Tian, W.Z.; Gao, H.T. Flag Leaf Chlorophyll Fluorescence Characteristics and Its Response to Drought Stress in Different Cultivars of Winter Wheat. J. Triticeae Crops 2015, 35, 699–706. [Google Scholar]
  37. Sao, R.R. Effects of Water and N Coupling on Physiological Characteristics and Yield of Oats; Liaoning University: Shenyang, China, 2020. [Google Scholar]
  38. Dong, Q.L. Effects of Controlled-Released Blend Bulk Fertilizers and Sowing Date on Photosynthetic Characteristics and N Utilization of Winter Wheat; Shandong Agricultural University: Tai’an, China, 2019. [Google Scholar]
  39. Zhao, D.H.; Cui, J.S.; Duan, L.L.; Wu, T.; Wang, L.X.; Liu, D.X. Study on Biological Toxicity Response Characteristics of Algae Chlorophyll Fluorescence to Herbicides. Spectrosc. Spectr. Anal. 2018, 38, 2820–2827. [Google Scholar]
  40. Jin, L.Q.; Che, X.K.; Zhang, Z.S.; Gao, H.Y. The Relationship between the Changes in Wk and Different Damage Degree of PSII Donor Side and Acceptor Side under High Temperature with High Light in Cucumberv. Plant Physiol. J. 2015, 51, 969–976. [Google Scholar]
  41. Yu, S.E.; Liu, Z.X.; Gao, S.X.; Wang, M.; Ding, J.H. Effects of Waterlogging and Drought Alternative Stress Patterns on Fluorescence Parameters and Photosynthetic Characteristics of Rice. Trans. Chin. Soc. Agric. Mach. 2019, 50, 304–312. [Google Scholar]
  42. Wu, S.S.; Xu, X.X.; Zhang, X.; Ge, H.M.; Zhang, C.X.; Wang, L.X. Relationship Analysis of Chlorophyll Fluorescence Parameters and Drought Resistance in Different Winter Wheat Varieties at Seedling Stage. Acta Agric. Boreali-Sin. 2020, 35, 90–99. [Google Scholar]
  43. Shahzad, A.; Yue, X.X.; Xiang, C.M. Improvement in winter wheat productivity through regulating PSII photochemistry, photosynthesis and chlorophyll fluorescence under deficit irrigation conditions. J. Integr. Agric. 2022, 21, 654–665. [Google Scholar]
  44. Cao, Q.; Guo, M.M.; Yang, Y.S.; Ma, R.Q.; Zhao, K.N.; Zhu, Y.J. Effects of N application and row spacing on net photosynthetic rate and SPAD value of wheat flag leaves. In Proceedings of the 2018 Annual Academic Meeting of Crop Society of China, Xi’an, China, 25 October 2018; p. 59. [Google Scholar]
  45. Zi, M.Y. Photosynthetic Efficiency of Apple Leaves under Water Storage Pit Irrigation; Taiyuan University of Technology: Taiyuan, China, 2018. [Google Scholar]
  46. Li, X.; Kang, S.; Zhang, X. Deficit irrigation provokes more pronounced responses of maize photosynthesis and water productivity to elevated CO2. Agric. Water Manag. 2018, 195, 71–83. [Google Scholar] [CrossRef]
  47. Lou, R.T. Study on The Response of Winter Wheat to Continuous Drought; North China University of Water Resources and Electric Power: Zhengzhou, China, 2021. [Google Scholar]
  48. Gimenez, C.; Mitchell, V.J.; Lawlor, D.W. Regulation of Photosynthetic Rate of Two Sunflower Hybrids under Water Stress. Plant Physiol. 1992, 98, 516–524. [Google Scholar] [CrossRef] [PubMed]
  49. Wang, H.B.; Cao, H.M.; Hao, S.X.; Pan, X.Y. Responses of Plant Nutrient and Photosynthesis in Greenhouse Tomato to Water-Fertilizer Coupling and Their Relationship with Yield. Sci. Agric. Sin. 2019, 52, 1761–1771. [Google Scholar]
Figure 1. Plan of the pit.
Water 15 00305 g001
Figure 2. Water retention curve for wheat in this soil. Notes: The figure shows the change curve of soil moisture after irrigation at jointing stage.
Water 15 00305 g002
Figure 3. Changes in leaf SPAD under different rehydration times and different N leaves. Notes: Different lowercase letters indicate significant differences at 0.05 level between different treatments (the same below); T1, T3, and T5 rehydration at the jointing stage, and T2, T4, and T6 rehydration at the heading stage; the significance analysis at the same time.
Water 15 00305 g003
Figure 4. Changes in leaf Fv/Fm under different rehydration times and different N leaves. Notes: Different lowercase letters indicate significant differences at 0.05 level between different treatments; T1, T3, and T5 rehydration at jointing stage, and T2, T4, and T6 rehydration at heading stage; the significance analysis at the same time.
Water 15 00305 g004
Figure 5. Characteristic curves of rapid fluorescence response under different rehydration times and different N leaves. Notes: Different lowercase letters indicate significant differences at 0.05 level between different treatments; T1, T3, and T5 rehydration at jointing stage, and T2, T4, and T6 rehydration at heading stage; the significance analysis at the same time.
Water 15 00305 g005
Figure 6. Characteristic curves of rapid fluorescence response under different rehydration times and different N leaves. Notes: T1, T3, and T5 rehydration at jointing stage, and T2, T4, and T6 rehydration at heading stage.
Water 15 00305 g006
Figure 7. Variation of flag leaf Pn of winter wheat under different rehydration times and different N leaves.
Water 15 00305 g007
Table 1. Main physical properties of cinnamon soil in the test pit in the test area.
Soil Depth (cm)Field Water Holding Capacity (mass, %)Bulk Density
(g·cm−3)
Mass Fraction of Soil Particle Size (%)
SandSiltClay Particle
0–3030.511.3728.7838.3532.87
30–6029.311.4129.1239.1531.73
60–10028.091.4630.1738.2131.62
Table 2. Table of soil moisture content in different stages.
Experimental TreatmentNitrogen Application Rate (kg/hm2) Lower Limit of Irrigation
Regreening StageJointing StageHeading StageFlowering StageMaturing Stage
No nitrogen applicationT107560757575
T27575607575
Low nitrogenT3125.07560757575
T47575607575
High nitrogenT5250.07560757575
T67575607575
Notes: The data in the table is the ratio (%) of the average soil moisture content of the planned wet layer of the test pit to the field water holding capacity; 60% soil moisture is drought, 75% soil moisture is normal, and 70–80% soil moisture is suitable for winter wheat growth.
Table 3. Parameters of fast fluorescence response characteristic curve under different rehydration times and different N leaves.
Test TreatmentrETRmInitial SlopeEkR2
(μmol·m−2·s−1)Initial Slope Rate (α)(μmol·m−2·s−1)
T169.30.211328.690.993
T287.70.249348.190.994
T377.30.224345.280.992
T495.70.269355.760.995
T583.40.246338.780.995
T6104.60.298358.220.996
Table 4. Changes of Tr, Ci, and Gs in flag leaves of winter wheat under different rehydration times and different N leaves.
Test TreatmentTrGsCi
(mmol·m−2·s−1)(mmol·m−2·s−1)(μmol·m−2·s−1)
Time after Rehydration
2 d5 d9 d2 d5 d9 d2 d5 d9 d
Rehydration at the jointing stageT12.72 g3.84 c2.98 f0.19 c0.25 b0.20 c185.48 e214..49 c221.27 bc
T33.31 e4.34 b3.22 e0.24 b0.30 a0.23 b202.84 d226.11 b216.39 c
T53.76 c4.78 a3.54 d0.26 b0.33 a0.25 b217.72 c248.61 a219.87 bc
Rehydration at heading stageT23.12 g4.04 c3.11 g0.22 e0.28 c0.22 e221.82 f247.69 bc239.23 d
T43.62 e4.62 b3.37 f0.25 d0.32 b0.24 de229.53 e253.33 b228.09 e
T63.97 cd5.27 a3.79 de0.29 c0.36 a0.28 c232.43 cd265.74 a238.47 d
Notes: Different lowercase letters indicate significant differences at 0.05 level between different treatments; T1, T3, and T5 rehydration at jointing stage, and T2, T4, and T6 rehy-dration at heading stage; the significance analysis at the same time.
Disclaimer/Publisher’s Note: The statements, opinions and data contained in all publications are solely those of the individual author(s) and contributor(s) and not of MDPI and/or the editor(s). MDPI and/or the editor(s) disclaim responsibility for any injury to people or property resulting from any ideas, methods, instructions or products referred to in the content.

