
eDNA Biomonitoring of Macroinvertebrate Communities for the Bioassessment of a River’s Ecological Status
Guangdong Provincial Key Laboratory of Water Quality Improvement and Ecological Restoration for Watersheds, School of Ecology, Environment and Resources, Guangdong University of Technology, Guangzhou 510006, China
*
Author to whom correspondence should be addressed.
Water 2023, 15(2), 308; https://doi.org/10.3390/w15020308
Submission received: 13 December 2022
/
Revised: 31 December 2022
/
Accepted: 5 January 2023
/
Published: 11 January 2023
(This article belongs to the Special Issue DNA-Based Biomonitoring of Aquatic Ecosystems)
Abstract
:Environmental DNA (eDNA) becomes a promising technology for macroinvertebrate monitoring worldwide. In recent decades, with increasing humanization processes, such as water pollution and habitat fragmentation, the richness and abundance of macroinvertebrates show a dramatic decline, which is particularly evident in tropical or subtropical rivers. The high-throughput and rapid monitoring of species’ survival and the ecological status of their habitats are relevant to river management. Here, we used the eDNA technology to detect macroinvertebrates in the Dongjiang River—a typical subtropical river in Southern China, to assess the ecological status, based on eDNA datasets. Our data showed a total of 640 OTUs detected by eDNA technology, belonging to three phyla, five classes, 13 orders, 33 families and 71 genera of macroinvertebrates, and these taxa had a 36.6% coverage rate with historical data at the genus level. The traditional water quality index (WQI) showed that the upstream of Dongjiang River were mainly levels I~II, the middle stream were levels II~III, and the downstream were levels IV~V. The eDNA-based biotic indices showed almost the same findings, that is, the overall ecological status of Dongjiang River was: upstream > middle reaches > downstream. Overall, this study provides important datasets and technical support for eDNA technology in macroinvertebrate monitoring and ecosystem management in the subtropical rivers.
1. Introduction
Macroinvertebrates are an important part of the structure and function of the river ecosystem, which is sensitive to environmental changes, due to their relatively long life cycles and weak migration abilities [1,2,3]. In recent decades, the richness and abundance of macroinvertebrates have been sharply reduced, driven by human activities, such as water pollution and climate change [4,5,6]. As we know, macroinvertebrates can accelerate the decomposition of benthic debris, promote the material exchange at the terrestrial-aquatic interface and the self-purification of water, and maintaining the biodiversity of macroinvertebrates is directly related to the key ecosystem processes, such as nutrient circulation, energy flow, material decomposition and migration in the river biological system [7,8,9]. Currently, macroinvertebrates have been widely adopted by countries around the world to indicate the river ecological status [10,11,12,13]. However, most current projects for macroinvertebrate monitoring, especially in developing countries, are still based on traditional morphological methods. Many deficiencies, such as the long monitoring cycle, that is time-consuming and laborious, makes it difficult to carry out large-scale macroinvertebrate monitoring projects at the watershed scale.
Recent advances in the eDNA technology provide new opportunities for improving the throughput, accuracy and standardization of macroinvertebrate monitoring [14,15,16]. Compared with the traditional methods, eDNA technology does not need a lot of manpower and material resources, it is low cost and easy to operate [17,18,19]. More importantly, this technology is highly sensitive and can accurately detect the presence of the target species, even at very low species densities [17,20,21]. Recently, eDNA technology is considered as one of the most promising methods to achieve the rapid, large-scale and large-sample species monitoring of aquatic ecology [22,23,24]. For example, Blackman et al. [25] used eDNA to characterize the spatio-temporal patterns of the multi-trophic biodiversity and food-web characteristics uncovered across a river catchment; Liu et al. [26] compared the structure and diversity of macroinvertebrates in the Okinawa Trough and Mariana Trench, by eDNA metabarcoding; Serrana et al. [27] studied the ecological consequences of sediment bypass tunnels on macroinvertebrates in dam-fragmented rivers, by DNA metabarcoding. Although the methodology, based on eDNA, is becoming more and more mature, there is still a lack of sufficient evidence to directly apply the eDNA datasets to assess the river’s ecological status, especially in tropical or subtropical river systems, compared with temperate regions [28].
Here, we used the eDNA technology to monitor macroinvertebrates in the Dongjiang River. Dongjiang River is a typical subtropical waterway, which is one of the four important water systems in Southern China. Dongjiang River supports an important drinking water source for the Guangdong-Hong Kong-Macao Greater Bay Area (the Greater Bay Area), which is also a natural habitat for macroinvertebrates and other aquatic species [29]. In recent decades, with the rapid development of the social economy in the Greater Bay Area, some important tributaries of Dongjiang River have undergone great changes, such as water attenuation and water pollution, resulting in a significant reduction of the habitat diversity and biodiversity, and the habitat of many important biological groups has been destroyed and degraded [30,31,32]. Therefore, the accurate and comprehensive monitoring of the dynamic changes of the aquatic species resources in Dongjiang River is the basis for biodiversity protection. Our objectives include: (1) to compare and analyze the consistency between the eDNA datasets and the historical records of the Pearl River basin; (2) to evaluate the ecological status of the Dongjiang River, based on the eDNA dataset, and to compare the consistency with the traditional water quality index.
2. Material and Methods
2.1. Study Area and eDNA Sampling
Dongjiang River is one of the three major tributaries in the Pearl River basin, located between 113 30′–115 45′ E and 22 45′–25 30′ N, which supplies a major source of drinking water for nearly 40 million people living in six cities, including Hong Kong, Shenzhen, Guangzhou, Dongguan, Huizhou and Heyuan, in the Greater Bay Area [25,30]. In recent decades, with the rapid economic development of the Dongjiang River, human-driven land use changes led to a serious deterioration of the eco-environmental quality and water security [33]. As one of the indicators widely adopted in the river ecological status assessment [34,35,36], the rapid and complete monitoring of macroinvertebrates and their living spaces was relevant to the ecological protection and management in the Dongjiang River. To identify and verify the reliability of the eDNA technology in distinguishing habitats with different human impacts, this study selected three different river systems in the Dongjiang River, according to the different densities of human land use, such as cropland and impervious cover [33], six sites were set up for each river system, namely the upstream group (DJ 01-06), midstream group (LJ 01-06) and the downstream group (SM 01-06).
Field eDNA samples were collected in October 2021, referring to the published protocols [33,37]. Briefly, three 1-liter samples were sampled at each site using the Thermo Fisher sterile bottles, then the samples were transferred and stored in a dark closed incubator (0~4 ℃) and filtered within 6h. In the pretreatment chamber, 300–500 mL volumes of water were filtered through 0.45 μm hydrophilic nylon membranes (Merck, Rahway, NJ, USA), until 3L of surface water was filtered, and finally, six replicates (or subsamples) were obtained at each site. To monitor the possible contaminants between the different sites, blank controls were prepared at each site. All duplicate eDNA samples and blank controls were individually placed in 5.0 mL centrifuge tubes and stored at −20 °C before the eDNA extraction.
2.2. Determination of the Water Quality Parameters
Eight water quality parameters were measured at each site, including total nitrogen (TN, mg/L), total phosphorus (TP, mg/L), ammonia nitrogen (NH3-N, mg/L), total dissolved particles (TDS, mg/L), water temperature (WT, °C), pH, dissolved oxygen (DO, mg/L) and the potassium permanganate index (CODMn, mg/L). Specifically, TDS, WT, pH, and DO were recorded by AP-2000 multiparameter water quality instruments (Aquaread, Broadstairs, UK) on-site. One liter of surface water was collected at each site, and five or six drops of concentrated sulfuric acid were added into the bottles, then they were brought back to the laboratory in dark and sealed conditions, to measure the TN, TP and NH3-N, following standard methods (NEPB, 2002). The other one liter of surface water was stored in low temperatures and in dark conditions (0 °C to 4 °C), then sent to the laboratory to measure the CODMn within 24 h.
2.3. eDNA Extraction and the High-Throughput Sequencing
All eDNA replicates and blank controls were extracted using a DNeasy PowerWater Kit (QIAGEN, Hilden, Germany). The polymerase chain reaction (PCR) assays were performed using a specific COI primer for detecting macroinvertebrates [38]. The primer sequences are as followed: forward:5′-AACGACGCTAGCAAACAAATARDGGTATTCGDTY-3′; reverse:5′-GGDACWGGWTGAACWGTWTACCHCC-3′. The reverse primer was carried with a 12-nt unique short nucleotide sequence to label the different replicates. Each reaction included 10 μL of 2x Taq Plus Master MixII, 2 μL of the template DNA, 1 μL of upstream and downstream primers each, and 6 μL of enzyme-free water in a total reaction volume of 20 μL. The PCR amplification was performed under the following conditions: 95 °C pre-denaturation for 30 s; 95 °C denaturation for 5 s, 54 °C renaturations for 30 s, 72 °C extensions for 10 s, 40 amplification cycles; 72 °C extensions for 5 min; 4 °C preservation. The PCR products were further purified after detection by 2% agarose gel electrophoresis. The equipment and reagents used in the DNA extraction and the PCR amplification were all sterile in the state or sterilized to avoid cross-contamination during the operation.
2.4. Bioinformatics Analysis and Biodiversity
The PCR products obtained from the DNA amplification were pooled into a single tube with equimolar quantities for NGS sequencing on the Illumina MiSeq PE150 platform (Illumina, San Diego, CA, USA). First, the forward and reverse sequences were merged using the “-fastq_mergepairs” script in the VSEARCH pipeline [39]. Then, FASTQ files were converted to FASTA format using SeqIO in Python version 2.7. The merged sequences were filtered for the low-quality reads using the “split_libraries.py” script with “−w 50 −s 25 -l 100” parameters in the QIIME toolkit v1.91 [40]. All cleaned sequences were clustered into operational taxonomic units (OTUs), using the USEARCH 11 pipeline with a similarity threshold of 97% [41]. The representative OTUs were aligned to a custom reference database (NCBI NT Genbank database downloaded in March 2022, and an indigenous database), and the similarity threshold was set at 85%. Three taxonomic α diversity indices (i.e., Shannon–Weiner Index, Simpson Index and Margalef Index) were calculated using the “alpha_diversity.py” script in the QIIME toolkit.
2.5. Bioassessment of the River’s Ecological Status
- Calculation of the comprehensive water quality index (WQI)
The single factor water quality index Pi of each main pollution index was calculated according to the monitoring water quality parameters, which was composed of whole digits and one decimal number, represented as:
Among them, X1 and X2 were calculated, X1 is the overall water quality category of the river; X2 is the position of the monitoring data in the water quality variation range of class X1, and the value was determined according to the principle of rounding. Then we calculated the comprehensive water quality identification index WQI. The calculation formula was given in Equation (2).
where, m is the number of the single water quality index for the comprehensive water quality evaluation; P1′, P2′, Pm′ is the single factor water quality index for the 1st and 2nd... mth water quality index, respectively. The water quality evaluation grade, based on the comprehensive water quality identification index method was shown in Supplementary Materials Table S1.
- 2.
- Biotic Pollution Index
The biotic pollution index (BPI) was used to evaluate the water quality and characterize the proportion of the pollution-resistant and sensitive species. The BPI index values increased as the water quality conditions deteriorated, the calculation formula was shown in Equation (3).
where N1 is the number of individuals of Oligochaeta, Hirudinea and Chironomidae larvae, N2 is the number of Polychaeta, Malacostraca and other aquatic insects, except Chironomidae larvae, and N3 is the number of individuals of mollusks. In this study, the sequence number of OTUs corresponding to each taxon was used to represent the number of individuals to calculate the biological pollution index of each site, and the criteria for evaluating the water quality were shown in Supplementary Materials Table S2.
- 3.
- Biotic Indices
The biotic indices (BIs) were originally proposed by Chutter [42] in 1972 and were mainly used to evaluate the water quality after organic pollution. Currently, it has no longer been limited to a single organic pollution factor, but could be used to evaluate the water quality degradation caused by various pollution factors (physical and chemical). The smaller BI values indicated a better ecological status, the calculation formula was shown in Equation (4).
Among them, ni is the number of individuals (genus or species level) of the ith taxon, and N is the total number of individuals in the sample, ti is the tolerance value. The tolerance value refers to the tolerance of living organisms to the environmental stress in time and space, reflecting the relative ability for live organisms to survive and reproduce under the interference of environmental stress [43]. The criteria for evaluating the water quality were shown in Supplementary Materials Table S3.
3. Results and Discussion
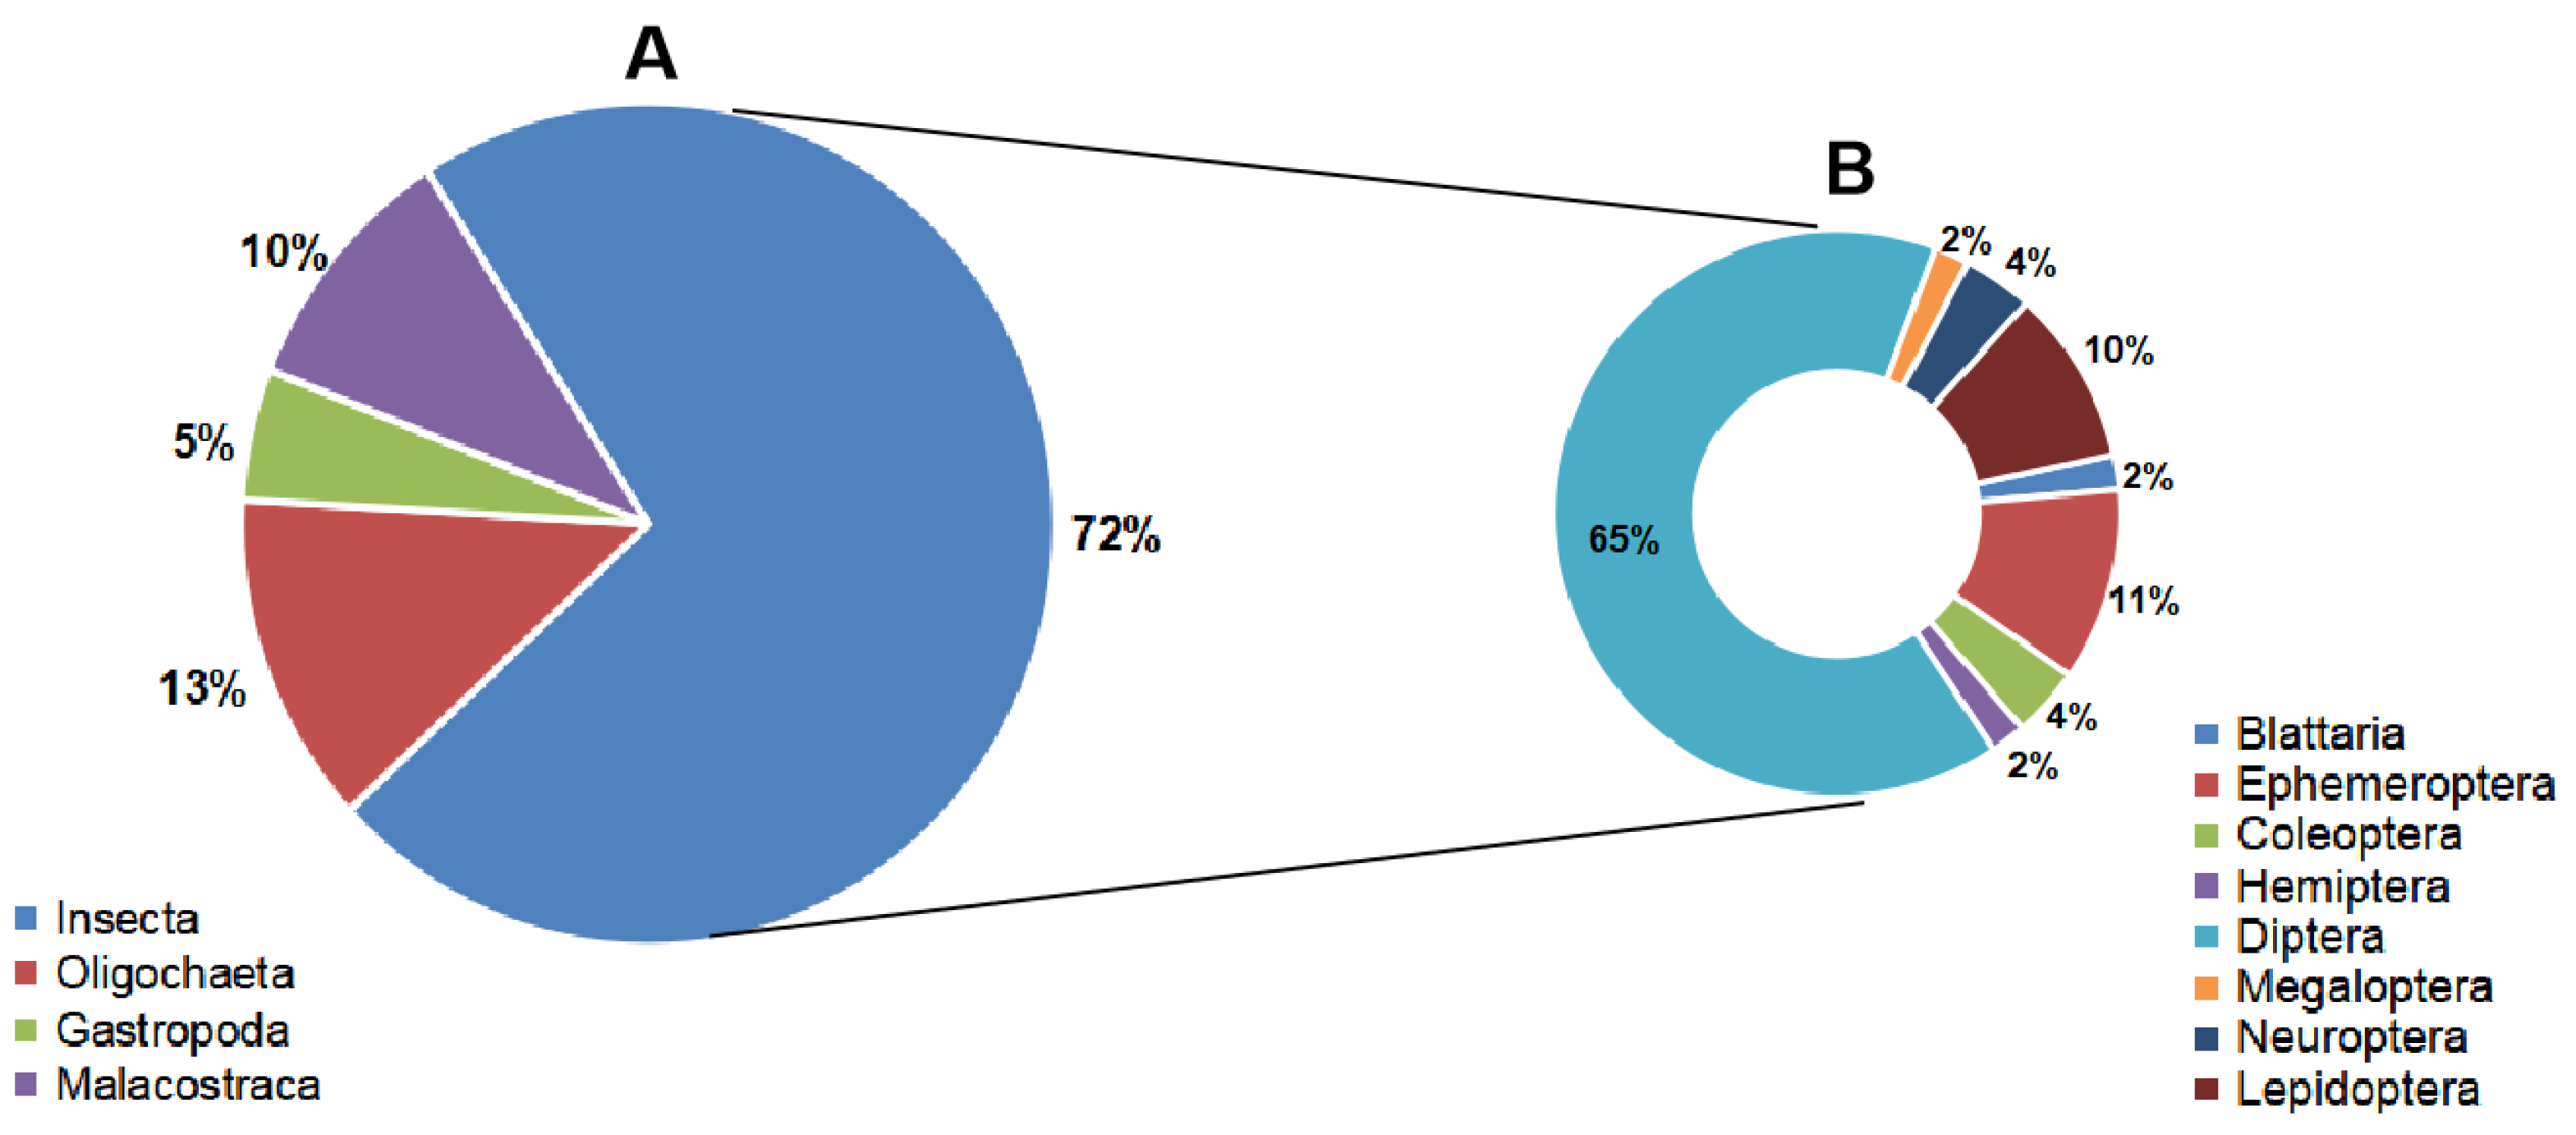
A total of 640 OTUs were detected by the eDNA technology in the Dongjiang River, which was annotated to three phyla, five classes, 13 orders, 33 families and 71 genera (Table S4). Specifically, there were 57 genera of Arthropoda (accounted for 81.2% of the total species), nine genera of Annelida and five genera of Mollusca. Arthropoda, Insecta and Diptera accounted for the largest proportion of macroinvertebrate species at the class and order level, respectively (Figure 1).
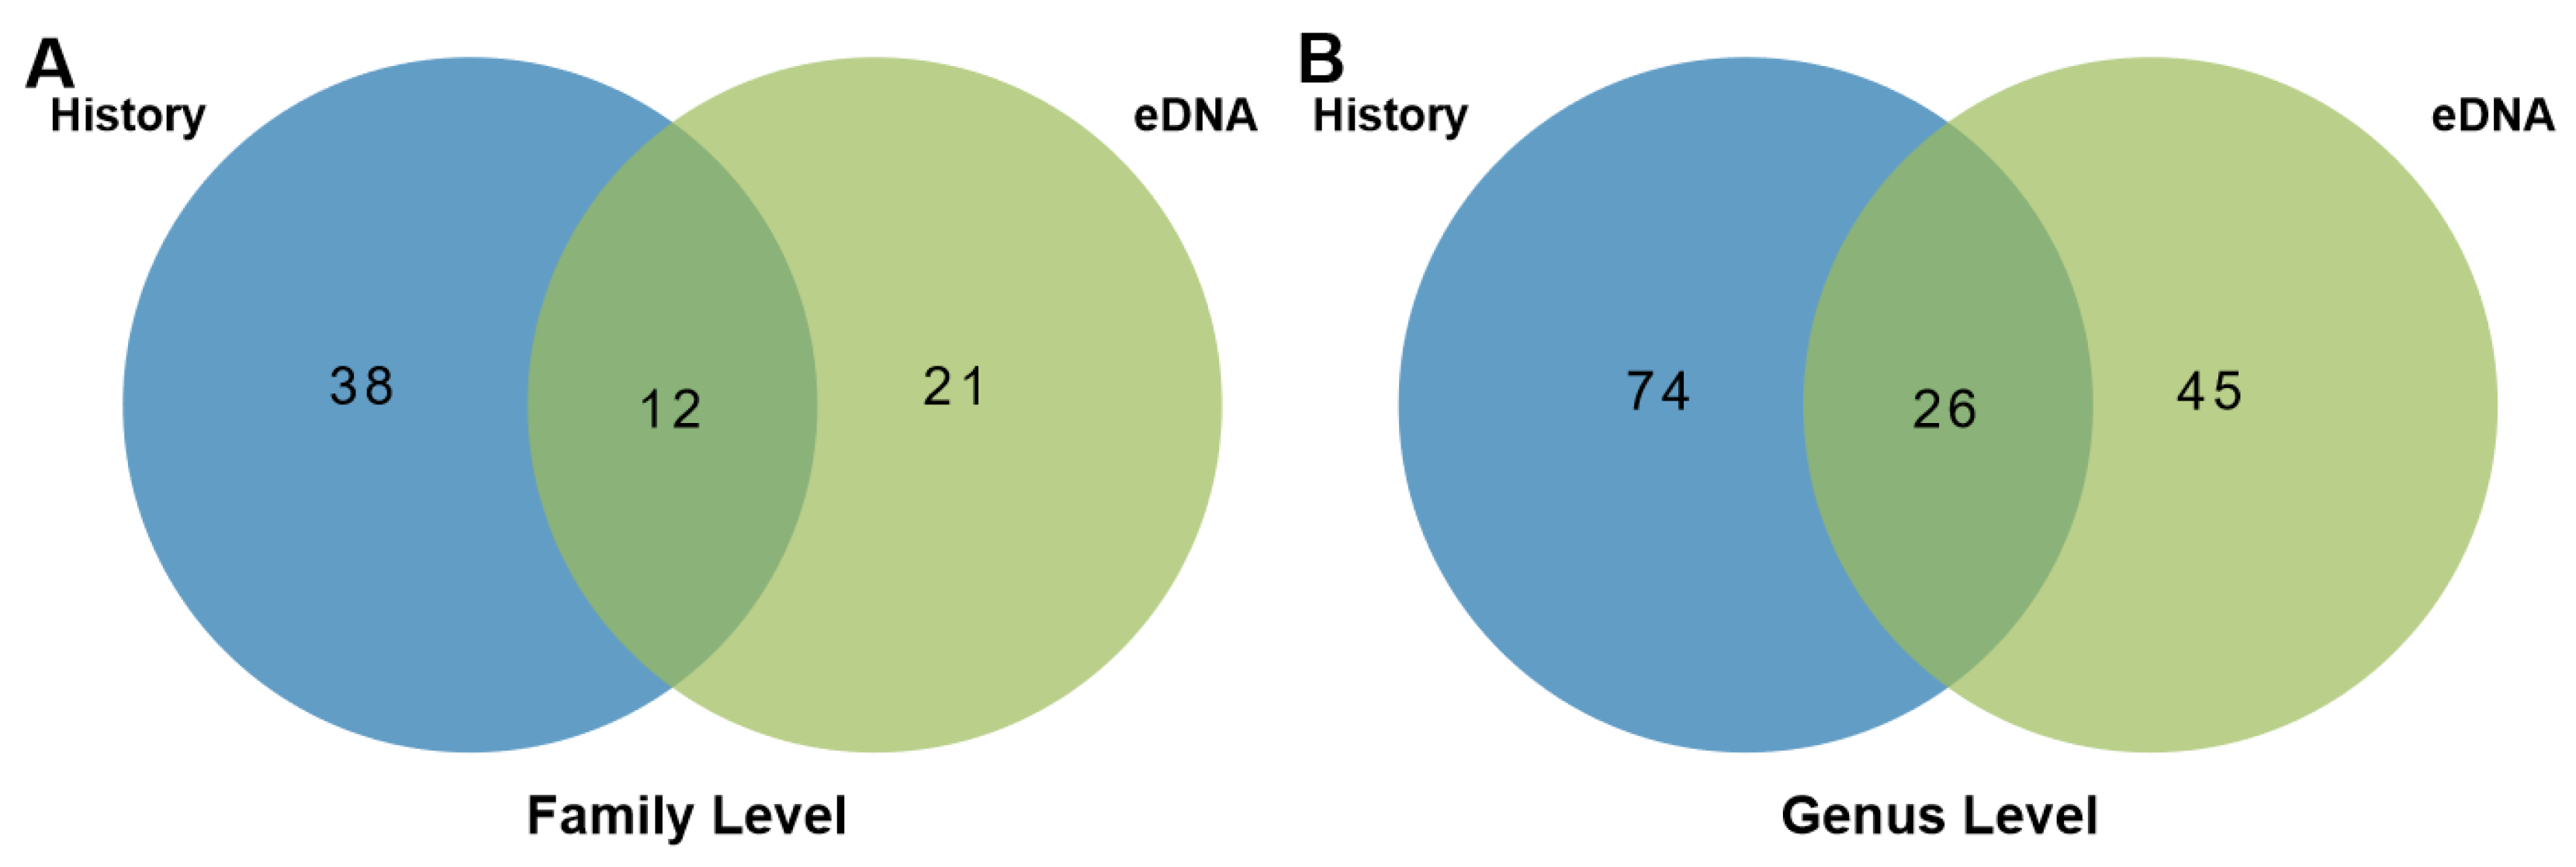
We found 12 coverages at the family level between the eDNA datasets and historical records, and 21 families did not coincide with the historical records. At the genus level, there were 26 coverages at the genera level, and there were also 45 genera that were not covered in the historical records (Figure 2). Although the number of taxa detected by the eDNA technology was less than the historical records, this may be because the historical morphology-based investigation was conducted in four quarters. In this study, we only had one time or a snapshot of eDNA monitoring datasets, but it still showed the advantages of the new technology in biomonitoring, over traditional methods [44,45]. In general, habitat and hydrological changes in different seasons had a huge impact on the structure of aquatic communities. For example, Cai et al. [46] found that the community structure and spatial pattern of macroinvertebrates were strongly correlated with the nutrient status, wind-induced disturbances and habitat complexities. Weerakoon et al. [47] showed that seasonal water-level fluctuations and changes in tropical reservoirs had significant effects on the structure of macroinvertebrates’ communities.
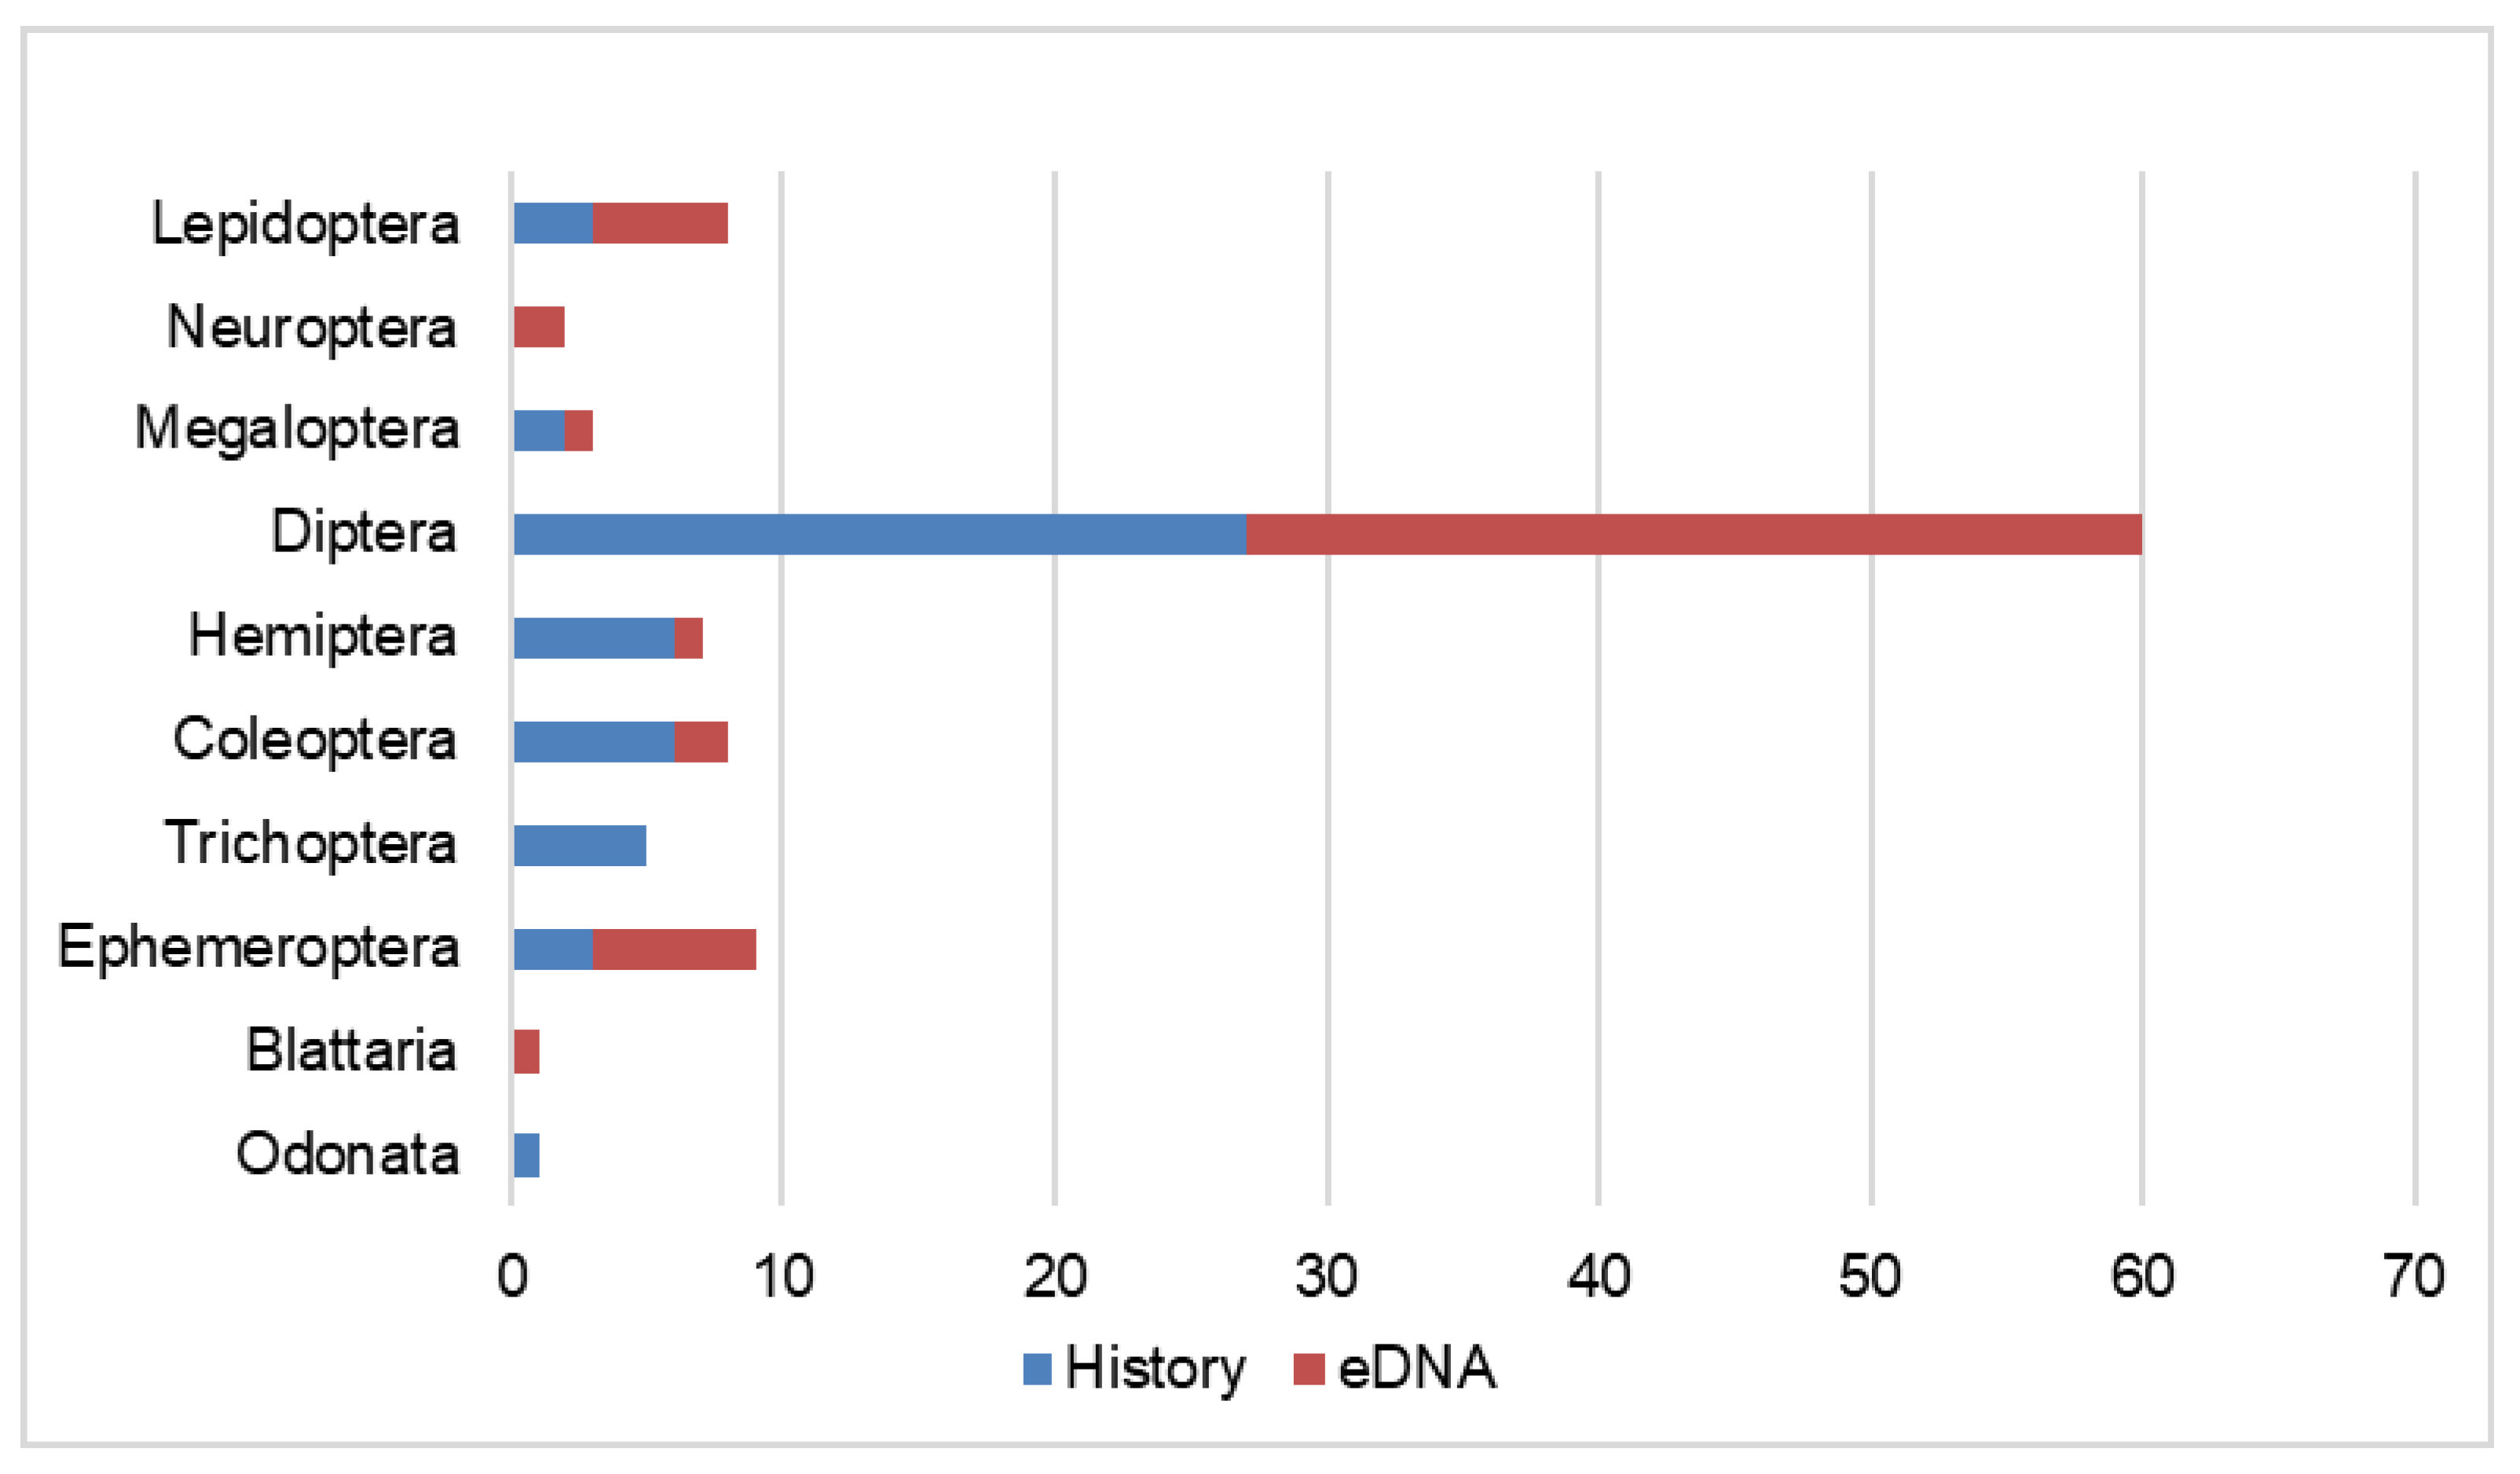
We found that among the taxa detected by the eDNA technology across different orders, there were obvious differences from the historical records (Figure 3). Specifically, the number of Diptera, Neuroptera and Lepidoptera detected by the eDNA technology was higher than in the historical records, which may be because the eDNA technology performs a species annotation at the molecular level and could monitor some species that were not easily detected using conventional techniques [48]. However, it was also slightly insufficient in the monitoring of other macroinvertebrates, such as Megaloptera, Hemiptera and Trichoptera. This may be due to a primer bias [49], for example, to amplify enough species, the universal primer was required to have a high degeneracy [50], it may lead to great differences in the amplification ability for different species, and the effects were obvious to amplify the mixed DNA of multiple species. The DNA of some species could not or was difficult to be amplified, which led to the subsequent high-throughput sequencing and bioinformatics analysis failure to annotate some species. Therefore, some studies suggested that different primers should be used for different species monitoring [51]. Apart from that, despite the scientific maturity of the eDNA techniques, several factors affect the eDNA extraction and results, such as the source of eDNA, the shedding rate, the degradation rate, the translocation, and sedimentation [52].
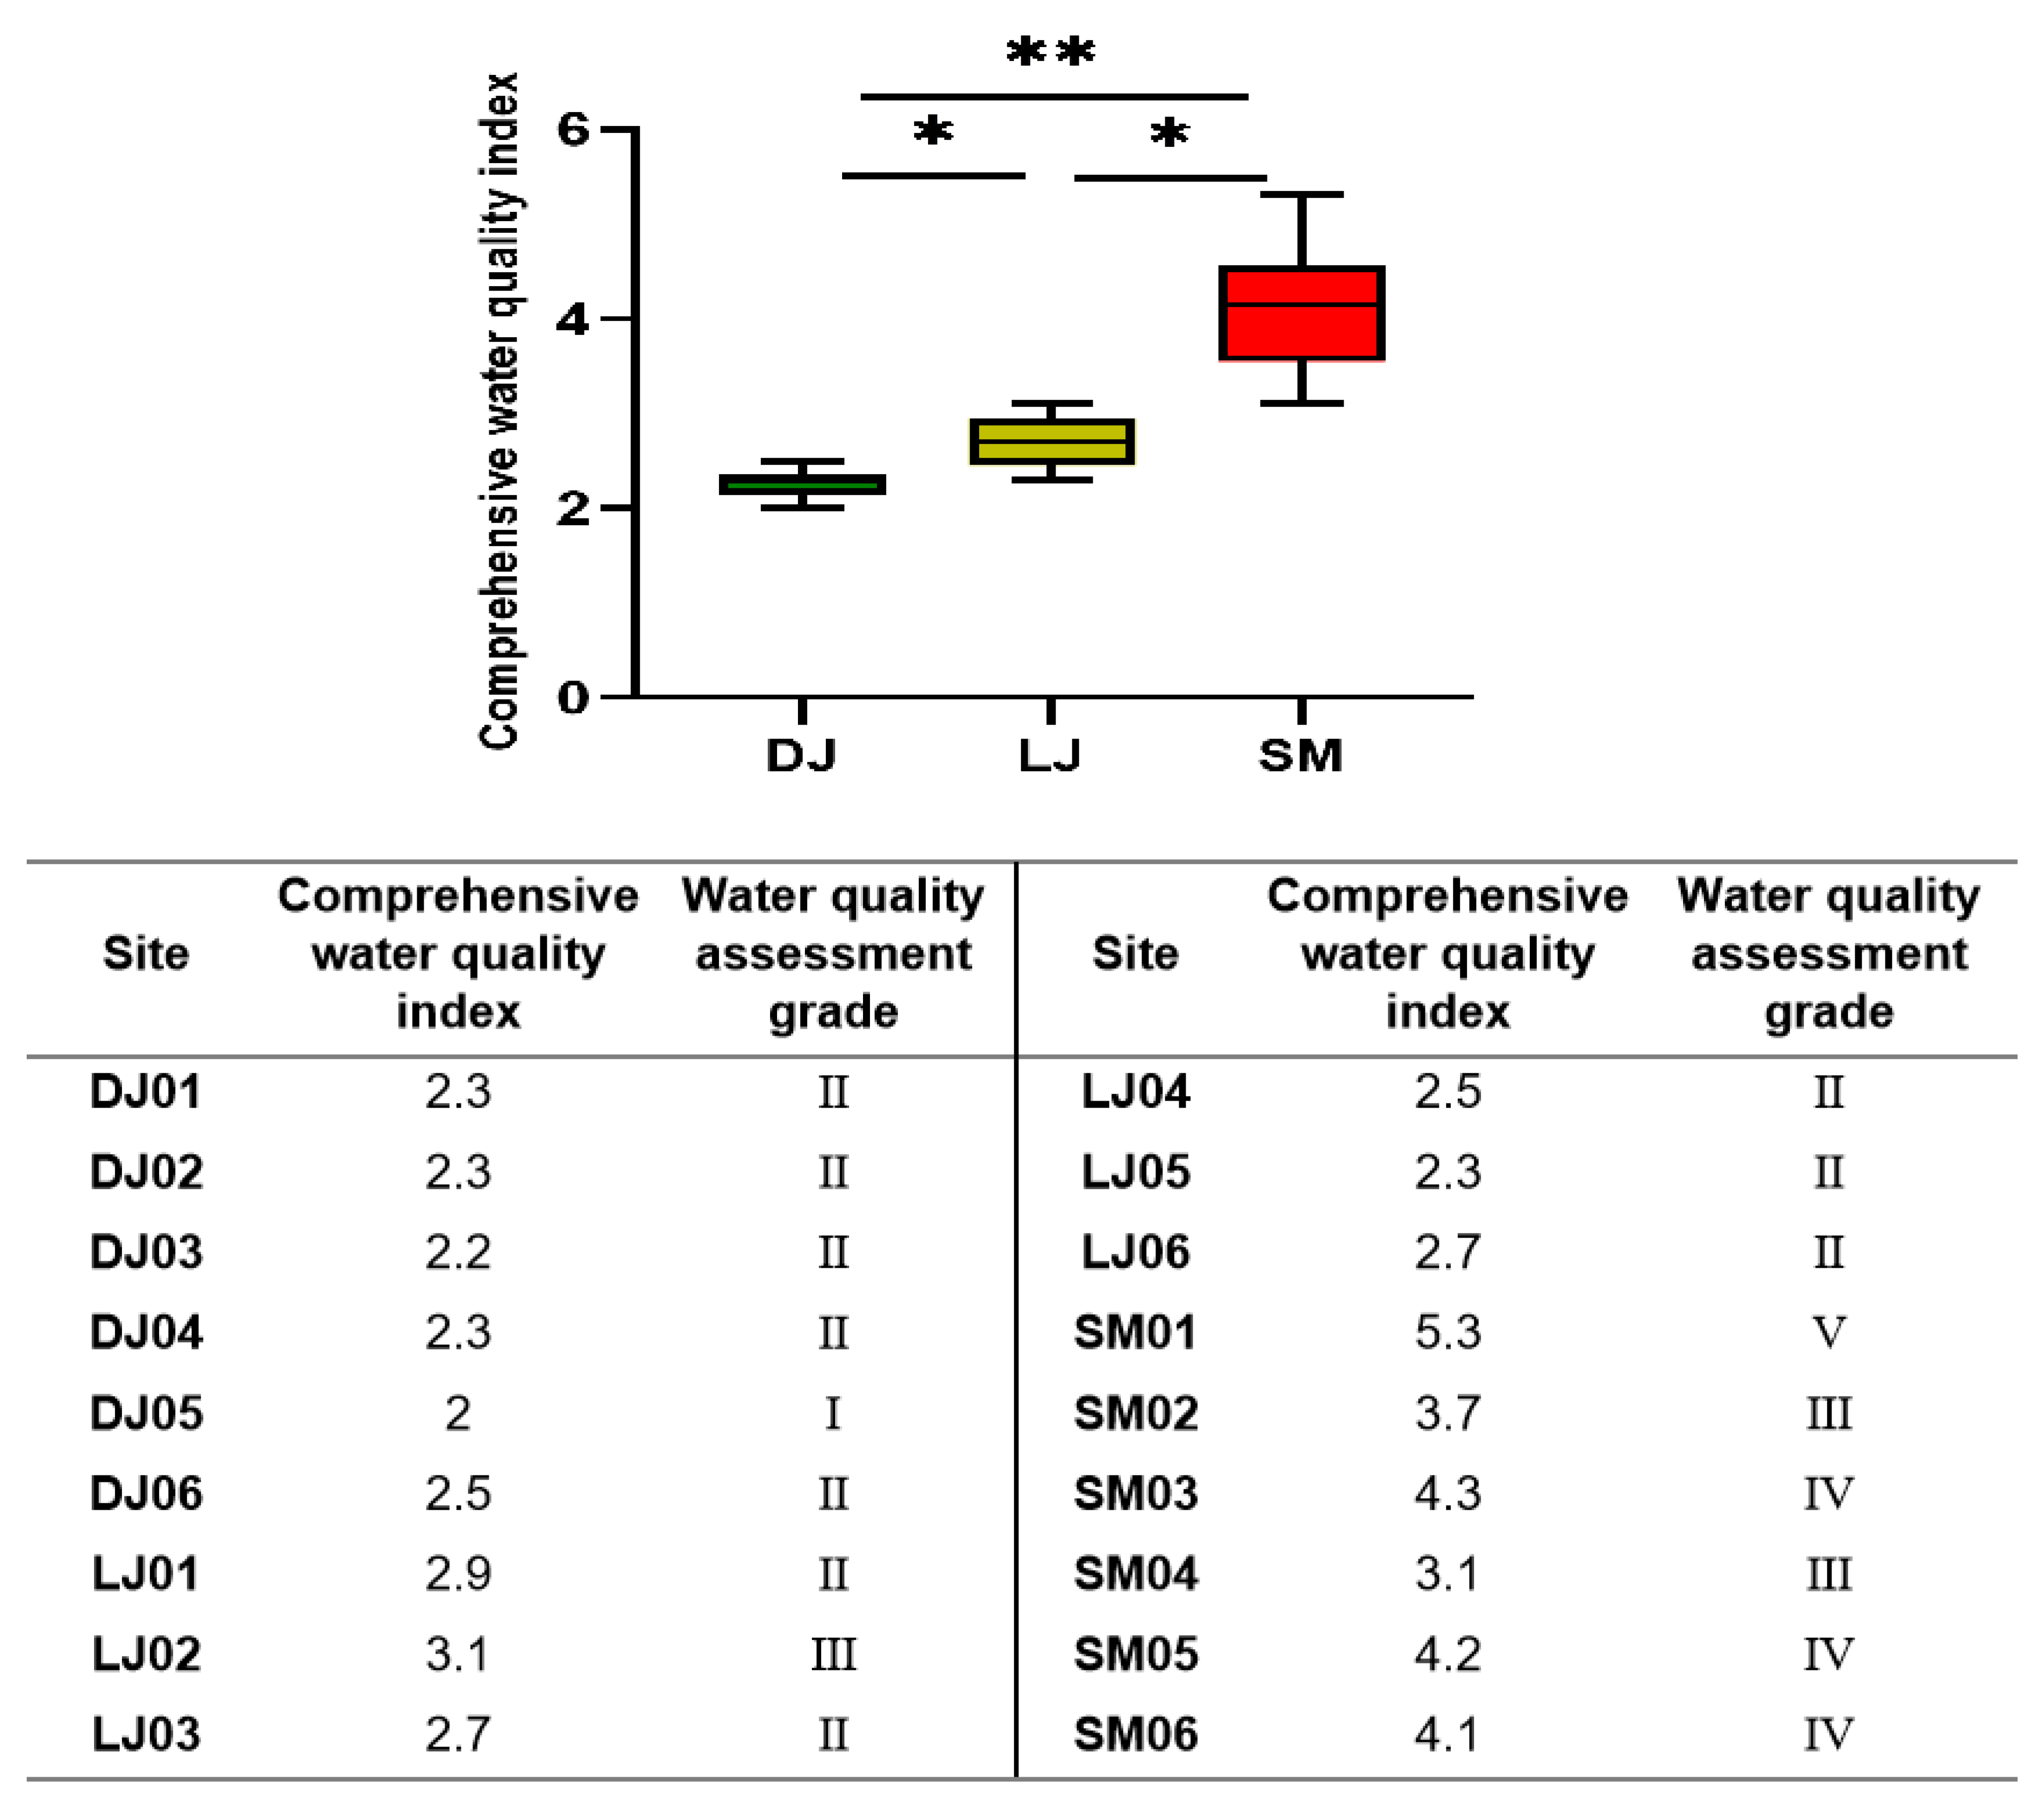
Based on the comprehensive water quality index, the upstream water quality of Dongjiang River was better than that in the mid- and downstream, and mainly belonged to Levels I~II, among which, site DJ05 was Level I, basically meeting the requirements of the source water and surface water source first-class protection zone; the water quality of the midstream was mostly Levels II~III, among which, site LJ02 was Level III; there were three Level IV sites and two Level III sites in the downstream, among which SM01 had the highest comprehensive water quality index (i.e., 5.3), belonging to Level V (Figure 4).
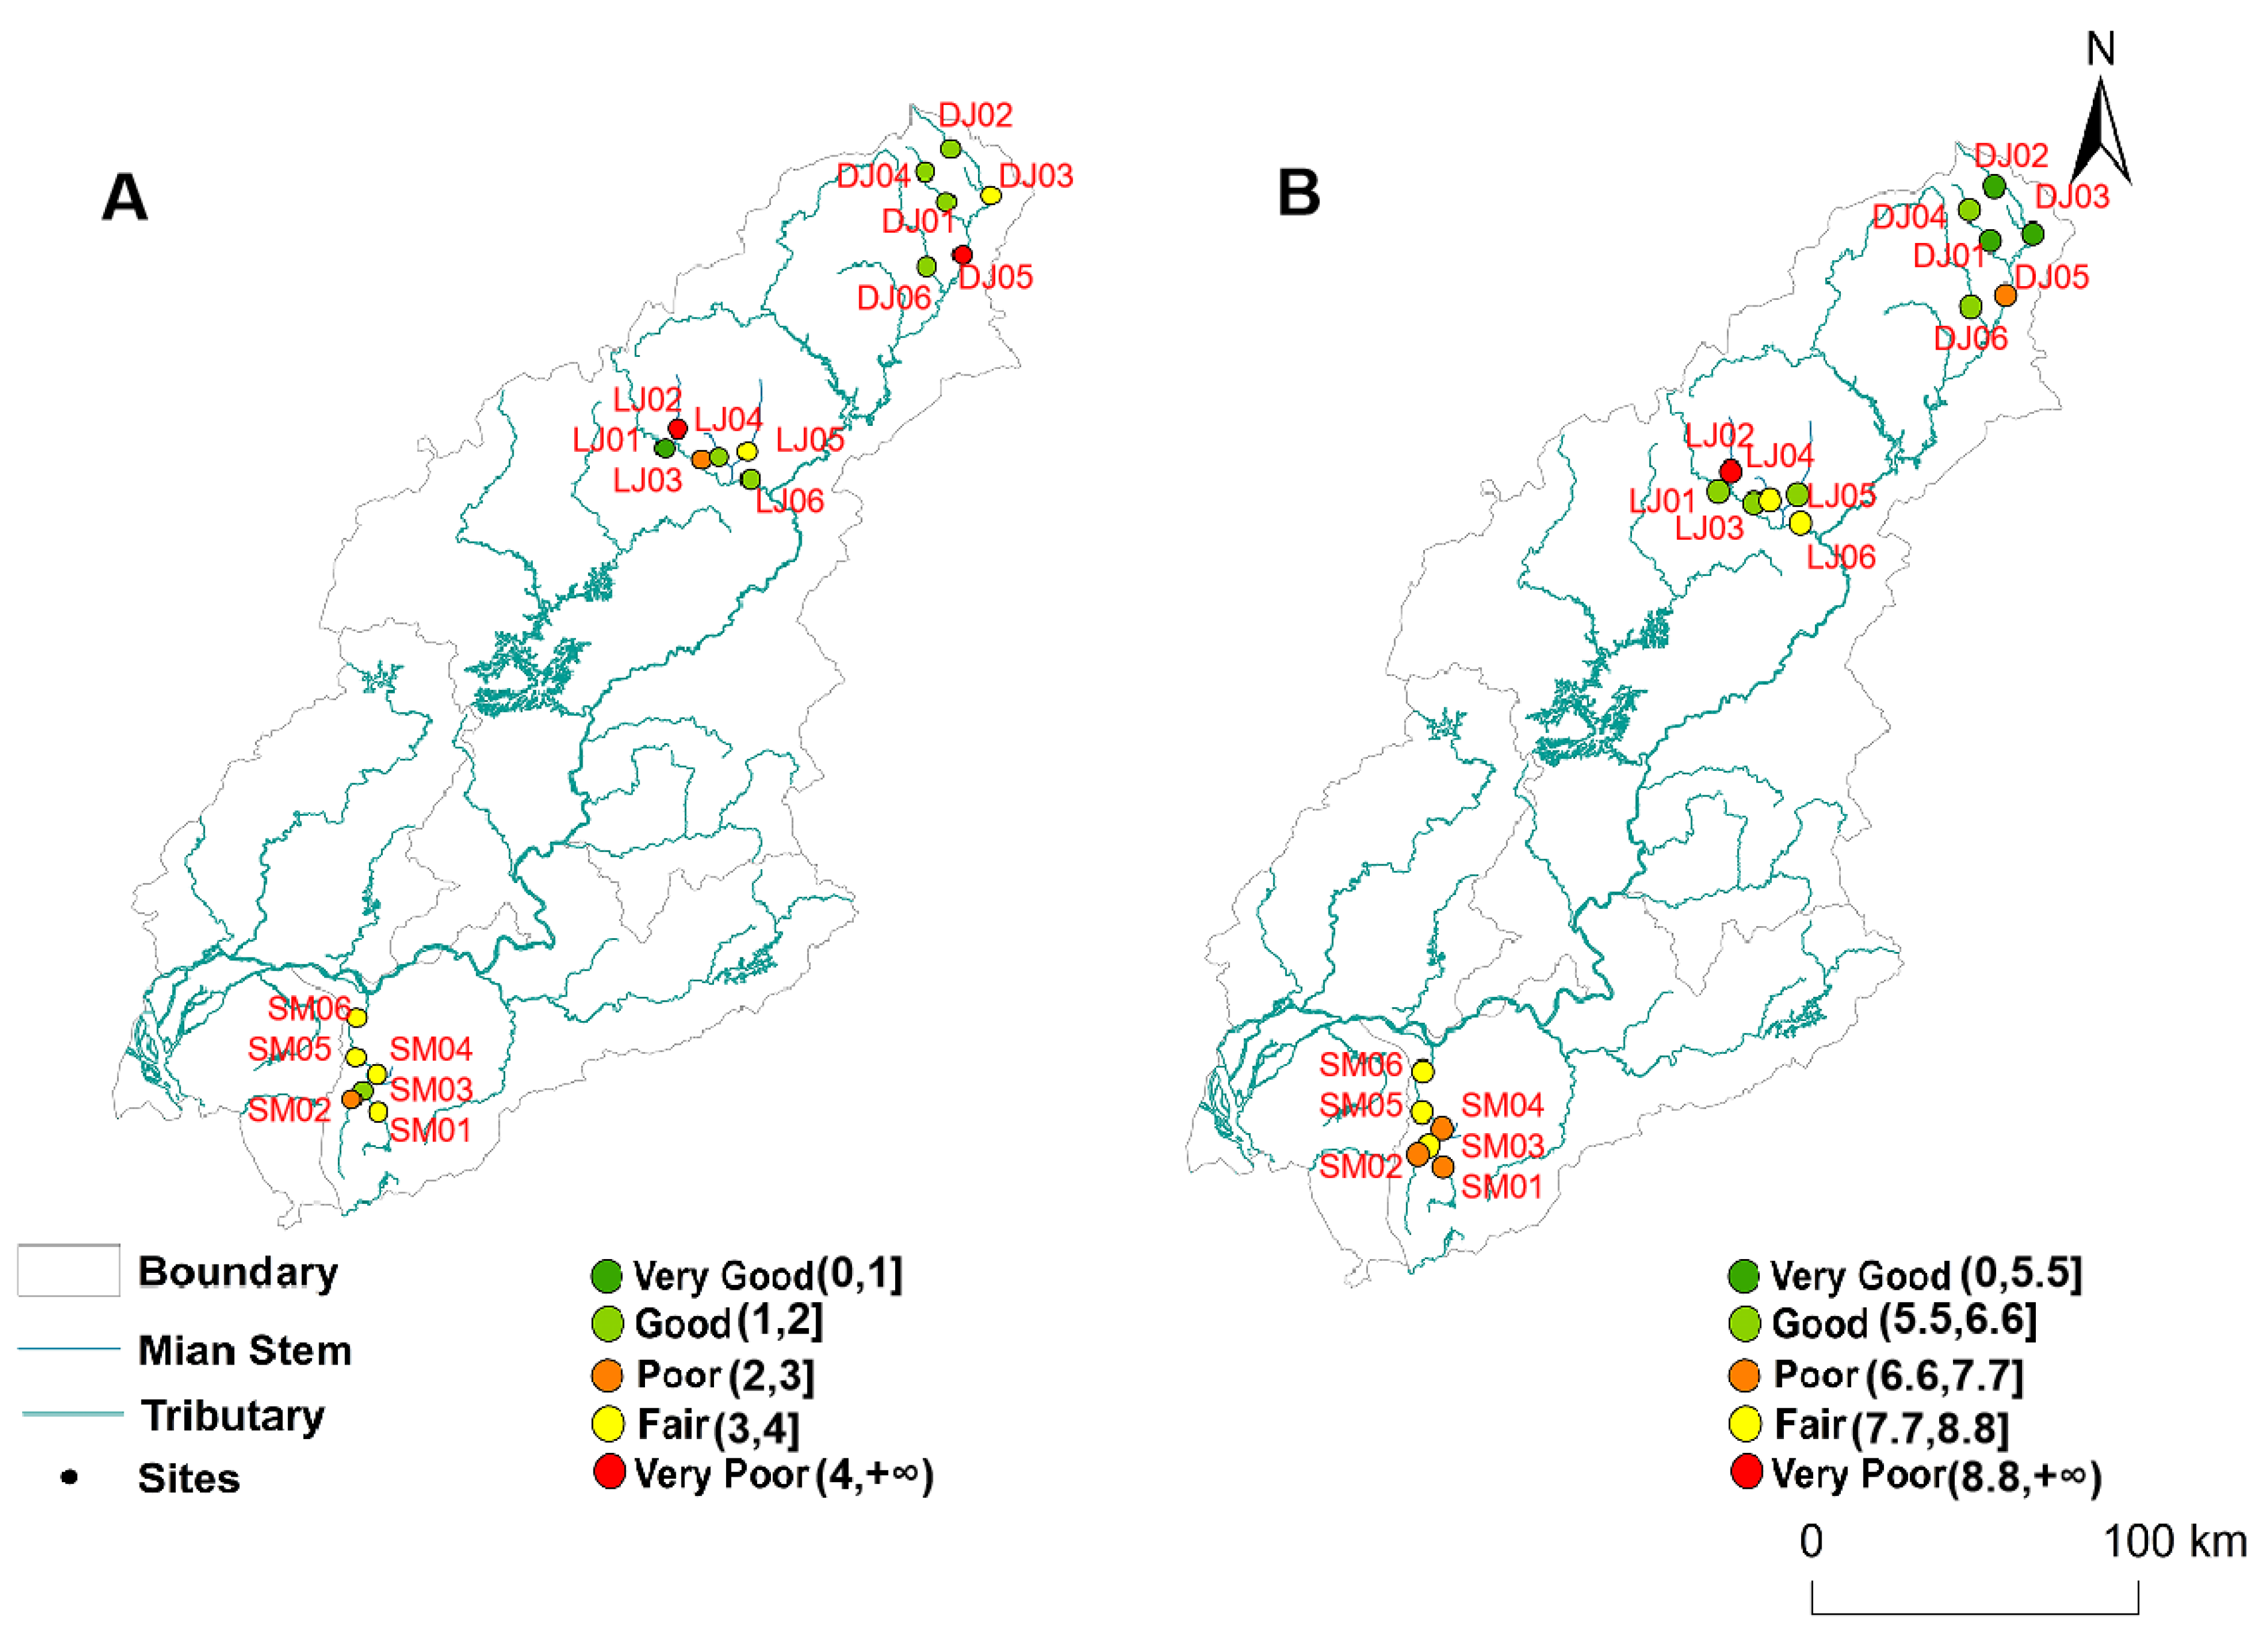
The eDNA-based biotic indices showed almost the same findings as the comprehensive water quality index (Figure 5). For example, the eDNA-based Shannon–Wiener index showed that the ecological status of Dongjiang River was between clean and slightly polluted, as a whole. The ecological status of the upstream area was better than that of the midstream and downstream. The clean sites were concentrated in the upstream reaches, while there was only one clean site in the downstream, and other sites in the downstream were lightly or moderately polluted. The results of BI showed the three cleanest sites, namely DJ01, DJ02 and DJ03, and the five clean sites were mainly concentrated in the mid and upper reaches. Site LJ02 had the highest BI value, which was consistent with the Shannon–Wiener index, both of which were heavily polluted. The ecological status in the downstream was mainly light pollution and medium pollution, with three light pollution sites and three medium pollution sites. The average BPI was the highest in the downstream (i.e., 0.72), followed by the upstream zone (i.e., 0.65) and the midstream (i.e., 0.61). Based on the results of the BPI, the ecological status of Dongjiang River was β-medium pollution. This was mainly due to our data showing that the monitored sites were dominated by Oligochaeta, Chironomidae and other pollution-resistant species.
Although the eDNA-based biological index (e.g., the Shannon–Wiener index and BI) was consistent with the traditional WQI in the overall results, there were also slight differences in a few sites. For example, site DJ05 was moderately or heavily polluted, based on the Shannon–Wiener index or BI, while the evaluation results of the comprehensive WQI were Level I. These results would be attributed to the fact that Dongjiang River was an important rare earth mining area [53], the water upstream of site DJ05 may be polluted by heavy metals and other pollutants, the species and diversity of macroinvertebrates could be reduced, due to the heavy metals or salinity loads [53,54,55,56]. In addition, the Shannon–Wiener index of site SM01 showed that it was lightly polluted, but its comprehensive WQI was Level V, and the concentrations of ammonia nitrogen, total nitrogen and total phosphorus all reached above the fifth grade. These results may be because the Shannon– Wiener index was only focused on the level of the species diversity [57], the diversity and uniform distribution of the tolerant species may also lead to the discrepancy between the Shannon–Wiener index and the actual water quality [58]. The total nitrogen and total phosphorus of site SM01 were selected as candidate parameters to calculate the comprehensive trophic state index, and the result was 91.4, which was in a severe eutrophication state. The result of the BI showed that it was moderately polluted and that it was closer to the actual water quality. Currently, the biological index has been adopted by countries around the world for the ecological status assessment, such as In North America, where multiple biological indices were used to comprehensively assess the ecological status, as early as the early 1990s [59]. Although the physical and chemical parameters of the water quality could reflect the concentration of pollutants, the traditional water quality only paid attention to a few common variables. As we know, the river flow velocity, climate, bed sediment composition and other physicochemical variables beyond the monitoring range should also affect the community structure of macroinvertebrates, which lead to the difference between the biological index and the traditional physicochemical evaluation [60].
In general, eDNA technology is revolutionizing the era of biomonitoring, especially for developing countries with a backward monitoring technology. New technologies provide high-throughput datasets, which are crucial for the protection and management of subtropical rivers with fewer study efforts. It is believed that this study was only the first attempt at a new technology in a developing country’s subtropical river, and some surprising findings were uncovered, such as the only one-time eDNA datasets that could provide the same scale as the historical records, and the results the eDNA -based biological index, were generally consistent with the traditional WQI. However, many efforts still need to be made before new technologies can be popularized, such as the ecological process of eDNA in tropical rivers and the primer bias. It is mainly because of the differences in a natural context, such as the water temperature and sunlight. Biodiversity and eDNA itself are obviously different in tropical or subtropical rivers and in cold or temperate rivers.
Supplementary Materials
The following supporting information can be downloaded at: https://www.mdpi.com/article/10.3390/w15020308/s1, Table S1. Classification of water quality based on the comprehensive water quality index (WQI), Table S2. Classification of ecological status based on the Biotic Pollution Index (BPI), Table S3. Classification of ecological status based on the Biotic Index (BI), Table S4. Comparison of species composition of macroinvertebrates between historical records and the eDNA approach in the Dongjiang river.
Author Contributions
F.W. and F.L. designed the study and wrote the first draft of the manuscript, F.L. and Y.Z. (Yuan Zhang) provided the funding, Y.Z. (Yanting Zou), F.W. and S.Q. collected the data and conducted the statistical analyses, and Y.Z. (Yuan Zhang) contributed to the discussion and revisions. All authors have read and agreed to the published version of the manuscript.
Funding
This study was financially supported by the National Key Research and Development Program of China (2021YFC3201004), Guangdong Provincial Key Laboratory Project (2019B121203011), and National Natural Science Foundation of China (52100216).
Institutional Review Board Statement
Not applicable.
Informed Consent Statement
Not applicable.
Data Availability Statement
The data that support the findings of this study are openly available in the Supporting Information and are available from the corresponding author upon reasonable request.
Conflicts of Interest
The authors declare no conflict of interest.
References
- Clarke, A.; Mac Nally, R.; Bond, N.; Lake, P.S. Macroinvertebrate Diversity in Headwater Streams: A Review. Freshw. Biol. 2008, 53, 1707–1721. [Google Scholar] [CrossRef]
- Sundar, S.; Heino, J.; Roque, F.D.O.; Simaika, J.P.; Melo, A.S.; Tonkin, J.D.; Gomes Nogueira, D.; Silva, D.P. Conservation of Freshwater Macroinvertebrate Biodiversity in Tropical Regions. Aquat. Conserv. Mar. Freshw. Ecosyst. 2020, 30, 1238–1250. [Google Scholar] [CrossRef]
- Masero, J.A.; Pérez-González, M.; Basadre, M.; Otero-Saavedra, M. Food Supply for Waders (Aves: Charadrii) in an Estuarine Area in the Bay of Cádiz (SW Iberian Peninsula). Acta Oecologica 1999, 20, 429–434. [Google Scholar] [CrossRef]
- Lessard, J.L.; Hayes, D.B. Effects of Elevated Water Temperature on Fish and Macroinvertebrate Communities below Small Dams. River Res. Appl. 2003, 19, 721–732. [Google Scholar] [CrossRef]
- Yetter, S.E. Freshwater Macroinvertebrates of the Mid-Atlantic Region. In Mid-Atlantic Freshwater Wetlands: Advances in Wetlands Science, Management, Policy, and Practice; Springer: New York, NY, USA, 2013; pp. 339–379. [Google Scholar] [CrossRef]
- Hill, M.J.; Death, R.G.; Mathers, K.L.; Ryves, D.B.; White, J.C.; Wood, P.J. Macroinvertebrate Community Composition and Diversity in Ephemeral and Perennial Ponds on Unregulated Floodplain Meadows in the UK. Hydrobiologia 2017, 793, 95–108. [Google Scholar] [CrossRef] [Green Version]
- Gore, J.A.; Layzer, J.B.; Mead, J. Macroinvertebrate Instream Flow Studies after 20 Years: A Role in Stream Management and Restoration. Regul. Rivers Res. Manag. 2001, 17, 527–542. [Google Scholar] [CrossRef]
- Nieto, C.; Ovando, X.M.C.; Loyola, R.; Izquierdo, A.; Romero, F.; Molineri, C.; Rodríguez, J.; Rueda Martín, P.; Fernández, H.; Manzo, V.; et al. The Role of Macroinvertebrates for Conservation of Freshwater Systems. Ecol. Evol. 2017, 7, 5502–5513. [Google Scholar] [CrossRef]
- Lindegaard, C. The Role of Zoobenthos in Energy Flow in Two Shallow Lakes. In Nutrient Dynamics and Biological Structure in Shallow Freshwater and Brackish Lakes; Springer Science & Business Media: Cham, Switzerland, 1994; pp. 313–322. [Google Scholar] [CrossRef]
- Borja, A.; Franco, J.; Pérez, V. A Marine Biotic Index to Establish the Ecological Quality of Soft-Bottom Benthos Within European Estuarine and Coastal Environments. Mar. Pollut. Bull. 2000, 40, 1100–1114. [Google Scholar] [CrossRef]
- Muxika, I.; Borja, Á.; Bald, J. Using Historical Data, Expert Judgement and Multivariate Analysis in Assessing Reference Conditions and Benthic Ecological Status, According to the European Water Framework Directive. Mar. Pollut. Bull. 2007, 55, 16–29. [Google Scholar] [CrossRef]
- Mistri, M.; Munari, C. BITS: A SMART Indicator for Soft-Bottom, Non-Tidal Lagoons. Mar. Pollut. Bull. 2008, 56, 587–599. [Google Scholar] [CrossRef]
- Resh, V.H. Which Group Is Best? Attributes of Different Biological Assemblages Used in Freshwater Biomonitoring Programs. Environ. Monit. Assess. 2008, 138, 131–138. [Google Scholar] [CrossRef] [PubMed]
- Shogren, A.J.; Tank, J.L.; Egan, S.P.; Bolster, D.; Riis, T. Riverine Distribution of Mussel Environmental DNA Reflects a Balance among Density, Transport, and Removal Processes. Freshw. Biol. 2019, 64, 1467–1479. [Google Scholar] [CrossRef]
- Thomsen, P.F.; Willerslev, E. Environmental DNA—An Emerging Tool in Conservation for Monitoring Past and Present Biodiversity. Biol. Conserv. 2015, 183, 4–18. [Google Scholar] [CrossRef]
- Liu, J.; Zhang, H. Combining Multiple Markers in Environmental DNA Metabarcoding to Assess Deep-Sea Benthic Biodiversity. Front. Mar. Sci. 2021, 8, 684955. [Google Scholar] [CrossRef]
- Bohmann, K.; Evans, A.; Gilbert, M.T.P.; Carvalho, G.R.; Creer, S.; Knapp, M.; Yu, D.W.; De Bruyn, M. Environmental DNA for Wildlife Biology and Biodiversity Monitoring. Trends Ecol. Evol. 2014, 29, 358–367. [Google Scholar] [CrossRef]
- Rees, H.C.; Maddison, B.C.; Middleditch, D.J.; Patmore, J.R.M.; Gough, K.C. REVIEW: The Detection of Aquatic Animal Species Using Environmental DNA—A Review of EDNA as a Survey Tool in Ecology. J. Appl. Ecol. 2014, 51, 1450–1459. [Google Scholar] [CrossRef]
- Mächler, E.; Deiner, K.; Steinmann, P.; Altermatt, F. Utility of Environmental DNA for Monitoring Rare and Indicator Macroinvertebrate Species. Freshw. Sci. 2014, 33, 1174–1183. [Google Scholar] [CrossRef]
- Valentini, A.; Taberlet, P.; Miaud, C.; Civade, R.; Herder, J.; Thomsen, P.F.; Bellemain, E.; Besnard, A.; Coissac, E.; Boyer, F.; et al. Next-Generation Monitoring of Aquatic Biodiversity Using Environmental DNA Metabarcoding. Mol. Ecol. 2016, 25, 929–942. [Google Scholar] [CrossRef]
- Jerde, C.L.; Mahon, A.R.; Chadderton, W.L.; Lodge, D.M. “Sight-Unseen” Detection of Rare Aquatic Species Using Environmental DNA. Conserv. Lett. 2011, 4, 150–157. [Google Scholar] [CrossRef]
- Harper, L.R.; Buxton, A.S.; Rees, H.C.; Bruce, K.; Brys, R.; Halfmaerten, D.; Read, D.S.; Watson, H.V.; Sayer, C.D.; Jones, E.P.; et al. Prospects and Challenges of Environmental DNA (EDNA) Monitoring in Freshwater Ponds. Hydrobiologia 2019, 826, 25–41. [Google Scholar] [CrossRef] [Green Version]
- Tzafesta, E.; Zangaro, F.; Specchia, V.; Pinna, M. An Overview of DNA-Based Applications for the Assessment of Benthic Macroinvertebrates Biodiversity in Mediterranean Aquatic Ecosystems. Diversity 2021, 13, 112. [Google Scholar] [CrossRef]
- Duarte, S.; Leite, B.R.; Feio, M.J.; Costa, F.O.; Filipe, A.F. Integration of DNA-Based Approaches in Aquatic Ecological Assessment Using Benthic Macroinvertebrates. Water 2021, 13, 331. [Google Scholar] [CrossRef]
- Blackman, R.C.; Ho, H.-C.; Walser, J.-C.; Altermatt, F. Spatio-Temporal Patterns of Multi-Trophic Biodiversity and Food-Web Characteristics Uncovered across a River Catchment Using Environmental DNA. Commun. Biol. 2022, 5, 259. [Google Scholar] [CrossRef]
- Liu, J.; Du, L.; Sun, Z.; Zhang, H. Comparison of Structure and Diversity of Benthic Communities in the Okinawa Trough and Mariana Trench by Environmental DNA Metabarcoding. Deep. Sea Res. Part I Oceanogr. Res. Pap. 2022, 185, 103806. [Google Scholar] [CrossRef]
- Serrana, J.M.; Yaegashi, S.; Kondoh, S.; Li, B.; Robinson, C.T.; Watanabe, K. Ecological Influence of Sediment Bypass Tunnels on Macroinvertebrates in Dam-Fragmented Rivers by DNA Metabarcoding. Sci. Rep. 2018, 8, 10185. [Google Scholar] [CrossRef] [PubMed] [Green Version]
- Yao, M.; Zhang, S.; Lu, Q.; Chen, X.; Zhang, S.; Kong, Y.; Zhao, J. Fishing for Fish Environmental DNA: Ecological Applications, Methodological Considerations, Surveying Designs, and Ways Forward. Mol. Ecol. 2022, 31, 5132–5164. [Google Scholar] [CrossRef]
- Liang, Y.; Hong, H.C.; Dong, L.H.; Lan, C.Y.; Han, B.P.; Wong, M.H. Sources and Properties of Natural Organic Matter (NOM) in Water Along the Dongjiang River (the Source of Hong Kong’s Drinking Water) and Toxicological Assay of Its Chlorination By-Products. Arch. Environ. Contam. Toxicol. 2008, 54, 597–605. [Google Scholar] [CrossRef] [PubMed]
- Ding, J.; Jiang, Y.; Liu, Q.; Hou, Z.; Liao, J.; Fu, L.; Peng, Q. Influences of the Land Use Pattern on Water Quality in Low-Order Streams of the Dongjiang River Basin, China: A Multi-Scale Analysis. Sci. Total Environ. 2016, 551–552, 205–216. [Google Scholar] [CrossRef]
- Zhang, B.; Zhang, Q.-Q.; Zhang, S.-X.; Xing, C.; Ying, G.-G. Emission Estimation and Fate Modelling of Three Typical Pesticides in Dongjiang River Basin, China. Environ. Pollut. 2020, 258, 113660. [Google Scholar] [CrossRef]
- Zhou, T.; Wu, J.; Peng, S. Assessing the Effects of Landscape Pattern on River Water Quality at Multiple Scales: A Case Study of the Dongjiang River Watershed, China. Ecol. Indic. 2012, 23, 166–175. [Google Scholar] [CrossRef]
- Li, F.; Qin, S.; Wang, Z.; Zhang, Y.; Yang, Z. Environmental DNA Metabarcoding Reveals the Impact of Different Land Use on Multitrophic Biodiversity in Riverine Systems. Sci. Total Environ. 2023, 855, 158958. [Google Scholar] [CrossRef] [PubMed]
- Arimoro, F.O.; Keke, U.N. Stream Biodiversity and Monitoring in North Central, Nigeria: The Use of Macroinvertebrate Indicator Species as Surrogates. Environ. Sci. Pollut. Res. 2021, 28, 31003–31012. [Google Scholar] [CrossRef] [PubMed]
- Edegbene, A.O.; Odume, O.N.; Arimoro, F.O.; Keke, U.N. Identifying and Classifying Macroinvertebrate Indicator Signature Traits and Ecological Preferences along Urban Pollution Gradient in the Niger Delta. Environ. Pollut. 2021, 281, 117076. [Google Scholar] [CrossRef] [PubMed]
- Pinel-Alloul, B.; Méthot, G.; Lapierre, L.; Willsie, A. Macroinvertebrate Community as a Biological Indicator of Ecological and Toxicological Factors in Lake Saint-François (Québec). Environ. Pollut. 1996, 91, 65–87. [Google Scholar] [CrossRef]
- Li, F.; Guo, F.; Gao, W.; Cai, Y.; Zhang, Y.; Yang, Z. Environmental DNA Biomonitoring Reveals the Interactive Effects of Dams and Nutrient Enrichment on Aquatic Multitrophic Communities. Environ. Sci. Technol. 2022, 56, 16952–16963. [Google Scholar] [CrossRef]
- Leese, F.; Sander, M.; Buchner, D.; Elbrecht, V.; Haase, P.; Zizka, V.M.A. Improved Freshwater Macroinvertebrate Detection from Environmental DNA through Minimized Nontarget Amplification. Environ. DNA 2021, 3, 261–276. [Google Scholar] [CrossRef]
- Rognes, T.; Flouri, T.; Nichols, B.; Mahé, F. VSEARCH: A Versatile Open Source Tool for Metagenomics. PeerJ 2016, 4, e2584. [Google Scholar] [CrossRef] [Green Version]
- Caporaso, J.G.; Kuczynski, J.; Stombaugh, J.; Bittinger, K.; Bushman, F.D.; Costello, E.K.; Fierer, N.; Peña, A.G.; Goodrich, J.K.; Gordon, J.I.; et al. QIIME Allows Analysis of High-Throughput Community Sequencing Data. Nat. Methods 2010, 7, 335–336. [Google Scholar] [CrossRef]
- Edgar, R.C. Search and Clustering Orders of Magnitude Faster than BLAST. Bioinformatics 2010, 26, 2460–2461. [Google Scholar] [CrossRef] [Green Version]
- Chutter, F.M. An Empirical Biotic Index of the Quality of Water in South African Streams and Rivers. Water Res. 1972, 6, 19–30. [Google Scholar] [CrossRef] [Green Version]
- Whittier, T.R.; Sickle, J.V. Macroinvertebrate Tolerance Values and an Assemblage Tolerance Index (ATI) for Western USA Streams and Rivers. J. North Am. Benthol. Soc. 2010, 29, 852–866. [Google Scholar] [CrossRef]
- Pawlowski, J.; Bruce, K.; Panksep, K.; Aguirre, F.; Amalfitano, S.; Apotheloz-Perret-Gentil, L.; Baussant, T.; Bouchez, A.; Carugati, L.; Cermakova, K.; et al. Environmental DNA Metabarcoding for Benthic Monitoring: A Review of Sediment Sampling and DNA Extraction Methods. Sci. Total Environ. 2022, 818, 151783. [Google Scholar] [CrossRef] [PubMed]
- Goodwin, K.D.; Thompson, L.R.; Duarte, B.; Kahlke, T.; Thompson, A.R.; Marques, J.C.; Cacador, I. DNA Sequencing as a Tool to Monitor Marine Ecological Status. Front. Mar. Sci. 2017, 4, 107. [Google Scholar] [CrossRef] [Green Version]
- Cai, Y.; Gong, Z.; Qin, B. Benthic Macroinvertebrate Community Structure in Lake Taihu, China: Effects of Trophic Status, Wind-Induced Disturbance and Habitat Complexity. J. Great Lakes Res. 2012, 38, 39–48. [Google Scholar] [CrossRef]
- Weerakoon, S.N.; Chandrasekara, W.U.; Amarasinghe, U.S. Seasonal Water--level Fluctuations and Changes in Macro--benthic Community Structure in Tropical Reservoirs: A Sri Lankan Case Study. Lakes Reserv. Res. Manag. 2021, 26, e12358. [Google Scholar] [CrossRef]
- Dai, S.; Bai, M.; Jia, H.; Xian, W.; Zhang, H. An Assessment of Seasonal Differences in Fish Populations in Laizhou Bay Using Environmental DNA and Conventional Resource Survey Techniques. Fishes 2022, 7, 250. [Google Scholar] [CrossRef]
- Piñol, J.; Mir, G.; Gomez-Polo, P.; Agustí, N. Universal and Blocking Primer Mismatches Limit the Use of High-Throughput DNA Sequencing for the Quantitative Metabarcoding of Arthropods. Mol. Ecol. Resour. 2015, 15, 819–830. [Google Scholar] [CrossRef]
- Hu, W.; Su, C.; Liu, Q.; Kong, Y.; Hua, S.; Hu, Z. Comparison of Fish Communities Using Environmental DNA Metabarcoding and Capture Methods in a Freshwater Lake: A New Set of Universal PCR Primers. Fish. Res. 2022, 253, 106365. [Google Scholar] [CrossRef]
- Gibson, J.; Shokralla, S.; Porter, T.M.; King, I.; Van Konynenburg, S.; Janzen, D.H.; Hallwachs, W.; Hajibabaei, M. Simultaneous Assessment of the Macrobiome and Microbiome in a Bulk Sample of Tropical Arthropods through DNA Metasystematics. Proc. Natl. Acad. Sci. USA 2014, 111, 8007–8012. [Google Scholar] [CrossRef] [Green Version]
- Wineland, S.M.; Welch, S.M.; Pauley, T.K.; Apodaca, J.J.; Olszack, M.; Mosher, J.J.; Holmes, J.N.; Waldron, J.L. Using Environmental DNA and Occupancy Modelling to Identify Drivers of Eastern Hellbender (Cryptobranchus Alleganiensis Alleganiensis) Extirpation. Freshw. Biol. 2019, 64, 208–221. [Google Scholar] [CrossRef] [Green Version]
- Shang, G.; Wang, X.; Zhu, L.; Liu, S.; Li, H.; Wang, Z.; Wang, B.; Zhang, Z. Heavy Metal Pollution in Xinfengjiang River Sediment and the Response of Fish Species Abundance to Heavy Metal Concentrations. Int. J. Environ. Res. Public Health 2022, 19, 11087. [Google Scholar] [CrossRef] [PubMed]
- Qu, X.; Wu, N.; Tang, T.; Cai, Q.; Park, Y.-S. Effects of Heavy Metals on Benthic Macroinvertebrate Communities in High Mountain Streams. Ann. De Limnol. Int. J. Limnol. 2010, 46, 291–302. [Google Scholar] [CrossRef]
- Bian, B.; Zhou, Y.; Fang, B.B. Distribution of Heavy Metals and Benthic Macroinvertebrates: Impacts from Typical Inflow River Sediments in the Taihu Basin, China. Ecol. Indic. 2016, 69, 348–359. [Google Scholar] [CrossRef]
- Kang, S.-R.; King, S.L. Influence of Salinity and Prey Presence on the Survival of Aquatic Macroinvertebrates of a Freshwater Marsh. Aquat. Ecol. 2012, 46, 411–420. [Google Scholar] [CrossRef]
- Spellerberg, I.F.; Fedor, P.J. A Tribute to Claude Shannon (1916–2001) and a Plea for More Rigorous Use of Species Richness, Species Diversity and the ‘Shannon–Wiener’ Index. Glob. Ecol. Biogeogr. 2003, 12, 177–179. [Google Scholar] [CrossRef] [Green Version]
- Ding, Y.; Pan, B.; Zhao, G.; Sun, C.; Han, X.; Li, M. Geo-Climatic Factors Weaken the Effectiveness of Phytoplankton Diversity as a Water Quality Indicator in a Large Sediment-Laden River. Sci. Total Environ. 2021, 792, 148346. [Google Scholar] [CrossRef]
- Resh, V.H.; Norris, R.H.; Barbour, M.T. Design and Implementation of Rapid Assessment Approaches for Water Resource Monitoring Using Benthic Macroinvertebrates. Austral. Ecol. 1995, 20, 108–121. [Google Scholar] [CrossRef]
- Liu, L.; Xu, Z.; Yin, X.; Li, F.; Wang, M. Development of an Index Based on Fish, Macroinvertebrates, Phytoplankton, and Physicochemical Properties to Assess Urban Aquatic Ecosystems in Jinan, China. River Res. Appl. 2022, 39, 73–83. [Google Scholar] [CrossRef]
Figure 1.
Community composition of macroinvertebrates at the class (A) and order (B) levels detected by the eDNA technology in the Dongjiang River.
Figure 1.
Community composition of macroinvertebrates at the class (A) and order (B) levels detected by the eDNA technology in the Dongjiang River.

Figure 2.
Paired comparison of the eDNA monitoring datasets and the historical records at the family (A) and genus (B) levels in the Dongjiang River.
Figure 2.
Paired comparison of the eDNA monitoring datasets and the historical records at the family (A) and genus (B) levels in the Dongjiang River.

Figure 3.
Differences between the historical records and the eDNA approach of different orders.

Figure 4.
Results of the water quality evaluation, based on the comprehensive water quality index in Dongjiang River. “*” indicates significant at the 0.05 level “**” indicates significant at the 0.01 level.
Figure 4.
Results of the water quality evaluation, based on the comprehensive water quality index in Dongjiang River. “*” indicates significant at the 0.05 level “**” indicates significant at the 0.01 level.

Figure 5.
Classification of the ecological status, assessed by the eDNA-based Shannon–Weiner index (A) and the biotic indices (B) in Dongjiang River.
Figure 5.
Classification of the ecological status, assessed by the eDNA-based Shannon–Weiner index (A) and the biotic indices (B) in Dongjiang River.

Disclaimer/Publisher’s Note: The statements, opinions and data contained in all publications are solely those of the individual author(s) and contributor(s) and not of MDPI and/or the editor(s). MDPI and/or the editor(s) disclaim responsibility for any injury to people or property resulting from any ideas, methods, instructions or products referred to in the content. |
© 2023 by the authors. Licensee MDPI, Basel, Switzerland. This article is an open access article distributed under the terms and conditions of the Creative Commons Attribution (CC BY) license (https://creativecommons.org/licenses/by/4.0/).
Share and Cite
MDPI and ACS Style
Wu, F.; Zou, Y.; Qin, S.; Li, F.; Zhang, Y. eDNA Biomonitoring of Macroinvertebrate Communities for the Bioassessment of a River’s Ecological Status. Water 2023, 15, 308. https://doi.org/10.3390/w15020308
AMA Style
Wu F, Zou Y, Qin S, Li F, Zhang Y. eDNA Biomonitoring of Macroinvertebrate Communities for the Bioassessment of a River’s Ecological Status. Water. 2023; 15(2):308. https://doi.org/10.3390/w15020308
Chicago/Turabian StyleWu, Feifei, Yanting Zou, Shan Qin, Feilong Li, and Yuan Zhang. 2023. "eDNA Biomonitoring of Macroinvertebrate Communities for the Bioassessment of a River’s Ecological Status" Water 15, no. 2: 308. https://doi.org/10.3390/w15020308
Note that from the first issue of 2016, this journal uses article numbers instead of page numbers. See further details here.