Article

Microwave-Assisted Extraction of Polyphenols from Eucalyptus Bark—A First Step for a Green Production of Tannin-Based Coagulants

by
Isabella T. Tomasi
1,2,
Sílvia C. R. Santos
1,2,*,
Rui A. R. Boaventura
1,2 and
Cidália M. S. Botelho
1,2
1
LSRE-LCM—Laboratory of Separation and Reaction Engineering-Laboratory of Catalysis and Materials, Faculty of Engineering, University of Porto, Rua Dr. Roberto Frias, 4200-465 Porto, Portugal
2
ALiCE—Associate Laboratory in Chemical Engineering, Faculty of Engineering, University of Porto, Rua Dr. Roberto Frias, 4200-465 Porto, Portugal
*
Author to whom correspondence should be addressed.
Water 2023, 15(2), 317; https://doi.org/10.3390/w15020317
Submission received: 21 December 2022 / Revised: 9 January 2023 / Accepted: 10 January 2023 / Published: 12 January 2023

Abstract

:
Tannins are natural polyphenolic compounds widely found in plants. The production of natural coagulants for water treatment is one of their new applications. Polyphenols extraction is the first step for synthesizing tannin-based coagulants. Eucalyptus globulus bark (EGB), an abundant by-product of the pulp and paper industry, usually applied as fuel for energy production, was used in this work as a tannin source. The extraction of polyphenols from EGB was studied using water as a solvent. Extraction assays employing different extraction techniques were conducted. Microwave-assisted extraction showed superior performance and was further optimized. The influence of irradiation time, water-to-bark ratio, and temperature were evaluated using Response Surface Methodology. The extraction yield and the total phenolic content of the extract were modeled as function of the extraction conditions. The overall best conditions that maximize both responses were obtained through multi-response optimization. Optimized values (15% of extraction yield and a phenolic content of 354 mg of gallic acid equivalents per gram of extract) were predicted for an extraction time of 15 s, a liquid-to-solid ratio of 48.5 mL/g, and 141 °C. The extract generated under these conditions presented a condensed tannin content of 645 mg/g, expressed in terms of catechin equivalents. EGB presented good tannin-extractable contents to produce natural coagulants.

1. Introduction

Eucalyptus wood is widely used for industrial purposes. In Europe, Eucalyptus globulus is mainly cultivated in the Iberian Peninsula for paper pulp production [1]. Portugal stands out as the third biggest European producer of chemical pulp and the eleventh of paper and paperboard [2]. Bark and wood residues, one of the various wastes generated in the pulp and paper industry, are typically used as a cheap energy source [3], despite their high potential for valorization into bio-based products.
Tannins are polyphenolic biomolecules stored in vegetable cells. They have been explored at research/academy and industry levels for different purposes, such as in formulations for leather and textile industries, adhesives, antifungals, and more recently as precursors of adsorbents and coagulants/flocculants for water and wastewater treatment [4,5,6]. In the last years, coagulants derived from plants have been highly investigated as substitutes for conventional coagulants. Tannin-based coagulants are derived from renewable resources, produce a lower volume of toxic sludge, present reduced associated costs, and emerge as a healthier option, in comparison with aluminum-based coagulants (associated with neurodegenerative diseases such as Alzheimer’s [7]) and organic synthetic polymers, whose residual concentrations in water may be toxic [5].
In general, the production of a tannin-based coagulant involves tannin extraction from the vegetable precursor, followed by cationization. To accomplish the first step, different extraction methods may be used, such as supercritical fluid extraction (SFE), solid–liquid extraction (SLE) [8,9], pressurized liquid extraction (PLE), ultrasound-assisted extraction (UAE), and microwave-assisted extraction (MAE). Tannin extraction through these different approaches has been recently reviewed [5,10]. Among the different extraction techniques, MAE presents some advantages over other methods. The microwave energy heats the polar solvents in contact with the solid material, resulting in a quick rise in the temperature, lesser solvent consumption, and a faster extraction (1–20 min) [5,11,12], as microwave irradiation improves mass transfer through sample agitation [10]. The principle and operation of the extraction are specific for each technique, but in general, the extraction efficiency depends on the extractant (solvent), contact time, temperature, pressure (PLE), power (MAE and UAE), and liquid-to-solid ratio [5]. Tannin extraction from eucalyptus bark has been evaluated through different methods and using different solvents, including water, aqueous solutions containing sodium carbonate, sodium hydroxide and sodium sulfite, and organic solvents such as ethanol and methanol [8,13,14,15]. However, little attention has been given to the use of water as an extractant. In the present investigation, extraction using distilled water was examined in order to engage in a greener and more sustainable extraction process.
Some investigations using E. globulus bark extracts as coagulants/flocculants have already been developed, but mostly for microalgae harvesting [16,17]. Motivated by the importance of E. globulus in Portugal, its polyphenol-richness, and the growth of the tannin-derived coagulants market [5], the current research aims to optimize tannin extraction from eucalyptus bark as a first step to produce a tannin-based coagulant for water and effluent treatment. After an initial comparison between different extraction methods, MAE was optimized using the Response Surface Methodology (RSM). RSM is a powerful statistical optimization method, providing information and precision estimations based on established models, and minimizing the required number of experimental trials [18].

2. Materials and Methods

2.1. Eucalyptus Globulus Bark

Eucalyptus globulus bark (EGB) was collected from a familiar farm located in Porto region, Portugal, in August 2022. After collection, the bark was cut into small pieces (approx. 2 cm2), air-dried for 48 h, and milled into particle sizes <1 mm (Ultra Centrifugal Mill ZM 100—Retsch, Haan, Germany). Afterward, samples were oven-dried at 60 °C for 24 h and stored in the desiccator until use.

2.2. Comparison of Extraction Techniques

E. globulus bark was submitted to different extraction techniques, such as SLE, PLE, UAE, and MAE, using distilled water as solvent at a constant liquid-to-solid ratio (L:S) of 15 mL.g−1. Considering the specificity of the extraction methods, identical conditions could not be used in the different techniques. SLE was conducted in stirred vessels heated to 90 °C using a heating plaque with temperature control (Velp Scientifica Arex Digital Pro—Monza and Brianza—Italy). PLE was performed in an autoclave operating at a relative pressure of 1 bar and at 121 °C. UAE was performed in an ultrasonic bath machine (Elmasonic S 120 (H)—Singen, Germany) arranged to work for 5 min at 1000 W, 50–60 Hz, and 30 °C. MAE was conducted in closed vessels, under temperature control, on the Milestone Start D Microwave Digestion System (Sorisole, Italy). The power was set to a maximum of 500 W, and it was automatically adjusted by the equipment in order to keep the required temperature constant. The extraction was accomplished at 90 °C, while the extraction time was measured after this temperature was reached (15 min of heating period). All trials were performed in duplicate. Previous conditions were selected according to a literature survey [1]. Moreover, to understand the effect of sodium hydroxide on the tannin extraction, some SLE and PLE assays were conducted using sodium hydroxide aqueous solutions as extractants (NaOH concentrations of 2.5 to 5.0%, w/w respecting the bark mass). The effect of the extraction time (5, 15, and 60 min) was also assessed in SLE, PLE, and MAE.
After extraction, the suspensions were vacuum filtered through glass microfibers membrane (VWR—696, porosity 1.5 μm). The liquid extract was transferred to a volumetric flask and the volume was made up with distilled water. A portion was used for total phenol content (TPC) analysis. The remaining liquid was lyophilized for the condensed tannin content (CT) analysis and to be preserved for future use. The solid residue was dried at 105 °C until constant weight.

2.3. Analytical Methods

The extraction results were evaluated through the calculation of the extraction yield (EY) and analysis of the contents of polyphenols (TPC) and condensed tannins (CT) in the dried extract, as representative parameters to assess the extract quality. The extraction yield (EY, %) was calculated by a mass balance equation (Equation (1)), where mi and mf are the initial (before extraction) and final (final residue) mass values of dried EGB.
EY   ( % ) = m i   m f m i · 100
The total phenolic content of the extract (TPC) was determined following the Folin–Ciocalteu method [2,3]. In brief, 1.0 mL of the diluted extract was mixed with 0.50 mL of Folin–Ciocalteu reagent, 2.0 mL of a 100 g.L−1 sodium carbonate solution, and 5.0 mL of distilled water. After 90 min in the dark, the absorbance of the mixture was measured at 765 nm. The absorbance values were converted in TPC and expressed in mg-GAE/g-E (milligrams of gallic acid equivalent per gram of dry extract) using a calibration curve. Condensed tannins (CT) were evaluated for selected samples of extracts, using the vanillin acidified method [4,5,6]. The adapted procedure was as follows: lyophilized extracts were dissolved in methanol; 1.0 mL of the diluted extract was combined with 1.0 mL of 1% (w/v) vanillin in methanol solution, and 1.0 mL of 8% (v/v) hydrochloric acid. The mixtures were kept in the dark for 20 min at 30 °C, and the absorbance was measured at 500 nm. The results were given in milligrams of catechin equivalent (CE) per gram of extract (mg-CE/g-E).

2.4. Optimization of Microwave-Assisted Extraction

2.4.1. Experimental Design

The extraction of tannins from EGB through MAE and using water as extractant was studied in detail. Literature has shown that variables such as temperature (or microwave power), solid-to-liquid ratio, and contact time influence the extraction efficiency using microwave energy [1,7]. To explore the relationship between these variables and the extraction results, the response surface methodology (RSM), coupled with the Central Composite Inscribed (CCI) design (three factors, five levels), was used. The extraction time (denoted as t), liquid-to-solid ratio (L:S), and extraction temperature (T) were the three factors studied in the experimental domain presented in Table 1. The factors were converted into dimensionless variables, denoted as x1, x2, and x3, respectively, generating coded levels of −α, −1, 0, 1 and α, where α is 1.682 [8]. Actual values of the factors were selected for two levels (low and high), respectively coded as (−1) and (+1), and the middle value was coded as 0. Actual values for the extreme coded levels (−1.682 and +1.682) were calculated accordingly. The experimental range selected for this study was based on the results obtained in preliminary microwave-assisted extractions. CCI requires 20 experimental runs (including six center points), which were replicated, totalizing 40 extraction experiments. Two responses were considered in the optimization process—the extraction yield (EY) and total phenolic content of the extract (TPC). The coagulation capability is assumed to increase with the availability of phenolic groups in tannin extracts [19] and TPC was selected as a relevant parameter.

2.4.2. Extractions

Microwave-assisted extractions using water as extractant were accomplished as mentioned before (Section 2.2), but using the operating conditions (extraction time, liquid-to-solid ratio, and temperature) according to the CCI experimental design and domain (Table 1). The desired L:S values were obtained by mixing a constant volume of distilled water (20.0 mL) in the vessels and variable amounts of EGB.

2.4.3. Data Analysis

The statistical software JMP® (trial version 16) was employed for data analysis and model building. A second-order polynomial equation (Equation (2)) including linear, interaction, and quadratic effects of time, liquid-to-solid ratio, and temperature (variables in coded levels) was used to model each one of the responses (Y) of the process, EY, and TPC. The coefficients of the terms were denoted as β.
Y = β 0 + i = 1 k β i X i + i = 1 k 1 j = i + 1 k β ij X i X j + i = 1 k β ii X i 2
Preliminary fits to Equation (2) were performed for each one of the responses (EY and TPC). The statistically significant terms were identified through the Student’s t-test, considering a confidence level of 95%. Non-significant terms (Prob > |t| above 0.05) were removed from Equation (2) and reduced models were refitted to experimental data for each response. The accuracy of the models representing EY and TPC was evaluated through analysis of variance (ANOVA), coefficients of determination (R2), and lack-of-fit tests.
The optimization of the extraction process was done, in the first instance, to find the optimum conditions (time, S:L, and temperature) that maximize EY and TPC individually (single-response optimization). In a second approach, a multi-response technique was used to optimize MAE considering EY and TPC simultaneously. Both responses should be considered in order to find the overall best extraction conditions, as an ideal extraction should provide a reasonable amount of product (correlated with EY) and an extract with good properties (represented by TPC) to the intended purpose (in this case, for coagulants development). It is important to note that in certain experimental domains, EY and TPC present antagonist responses. Therefore, the desirability function approach, combined with RSM, has been applied to solve the optimization of MAE. An individual desirability function was defined for each one of the responses, transforming EY and TPC results into scale-free values lying between 0 and 1 (the value 0 is attributed to the least desirable response and 1 to the most desirable response) [9]. A geometric mean was then used to combine the individual desirability levels into a composite function, an overall desirability D. This D can be achieved using individual desirability values weighted equally or placing higher weight in certain responses. In this work, considering that obtaining extracts with a high content of polyphenols is more important than meeting the quantitative requirement, the relative weights of EY and TPC were set to 1 and 3, respectively.

3. Results and Discussion

3.1. Comparison of Extraction Techniques

Different extraction methods, such as SLE, PLE, UAE, and MAE, were evaluated to extract tannins from E. globulus bark, and the results are presented in Table 2. The influence of sodium hydroxide added to the solvent was evaluated for SLE and PLE. Alkaline conditions usually improve extraction yields by preventing tannin self-condensation [1]. The results here obtained confirmed the expected behavior, with gradual improvements of EY for increasing levels of NaOH added to the water. These observations are also in line with several research articles [10,11,12,13]. SLE and PLE results show that 2.5% NaOH addition provided a significant increase in the TPC of the extracts in comparison to water. However, higher levels of NaOH did not generate further improvement. Other authors have reported similar observations. Bacelo et al. indicated minor variations in the phenolic content of pine bark extracts, using NaOH concentrations varying from 2.5 to 10% wt [14]. Although NaOH addition led to better qualitative and quantitative results, which can be interesting for specific purposes (e.g., alkaline polymerization of tannins for adsorbents synthesis), this work focuses on extraction techniques conducted using only water. The extracts are envisioned for coagulant/flocculant synthesis, which is based on the cationization of the extracts, and acid conditions are necessary to generate the protonation of the amine bound to the tannin in the cationization phase [15].
Comparing 5 min extractions, conducted using water and different methods, UAE seems to be the least effective approach, as it generated the lowest extraction yield and poorest extract. SLE, MAE, and PLE demonstrated to be superior methods, providing similar extraction yields. MAE generated the extract with the highest phenolic content. The effect of extraction time was assessed for these methods. The results show negligible variations in the extraction yields, and a worsening in the extract quality for 15 min extractions. Based on the outcome of these experiments, MAE was selected as the approach to be further optimized to extract tannins from EGB.

3.2. Microwave-Assisted Extraction

3.2.1. Modeling of MAE Responses

Table 3 presents the experimental results obtained in the MAE trials performed according to the CCI design. Preliminary fittings of the full quadratic models (Equation (2)) were done to EY and TPC results. For EY, the interaction terms time-L:S and time-temperature, and the quadratic effect terms of time and L:S ratio, were found to be non-significant (Prob > |t| above 0.05) and were removed from the model. For TPC, non-significant terms were the linear effect of temperature (not removed from the model to keep the hierarchy) and the three interaction terms time-L:S, time-temperature, and temperature-L:S.
The reduced models expressed by Equations (3) and (4) were then used to fit EY and TPC, respectively. The obtained parameters are presented in Table 4. In addition to the t-ratio and Prob > |t|, confidence intervals for each parameter were also provided. As it can be seen from the Prob > |t| values (below 0.05) and from the confidence intervals (which do not contain zero), all the terms are significant (except temperature, for TPC, as previously mentioned) and the coefficient is nonzero.
TPC = β 0 + β 1 X 1 + β 2 X 2   + β 3 X 3 + β 11 X 1 2   + β 22 X 2 2   + β 33 X 3 2
EY = β 0 + β 1 X 1 + β 2 X 2   + β 3 X 3 +   β 23 X 2 X 3 + β 33 X 3 2

3.2.2. Validation of the Models

Table 5 shows a detailed summary of the fit and ANOVA for each one of the models describing EY and TPC. The squared-R quantifies the strength between the experimental data and responses predicted by the models. Obtained R2-values suggest good adjustments, as 90.7% and 88.7% of the variability in EY and TPC are explained by the models. Adjusted determination coefficients (R2adj) were also calculated, and the obtained values (89.3% and 86.6%, respectively for EY and TPC) are very close to the respective R2-values, indicating that most of the variation is explained by variables actually affecting the responses [8]. The accuracy of the models is also visible in the small root mean squared errors (RMS) (Table 5).
The ANOVA approach separates the overall variance of the results into the variance associated with factor effects, and the variance related to the random error uses F-test to assess whether the former is significant when compared to the latter [8]. As can be seen from Table 5, F-ratio values are greater than the tabulated ones for a 95% significance level, and Prob > F are below 0.0001. These results confirm the significance of both models in describing EY and TPC results.
The adequacy of the fitted models was also evaluated by lack-of-fit analysis. In this test, the sum of squares of the residuals is divided into two parts: lack-of-fit error (based on model performance) and pure error (based on replicated measurements). The F-ratio is calculated by dividing the lack-of-fit mean square by the pure error mean square, and this statistic is used to determine whether the lack of fit is significant or not, at a certain significance level (95%, in this study) [16]. The high F-ratio values obtained (3.6 for EY and 5.1 for TPC) and the corresponding error probabilities (Prob > F of 0.005 and 0.0008, respectively, for EY and TPC, both values lower than 0.05) indicate an undesirable significance of the lack-of-fit.

3.2.3. Effect of Extraction Conditions

This research aimed to optimize the conditions for extracting tannins from eucalyptus bark, and understand how the contact time, solvent volume, and temperature affect the amount and properties of the extract. 
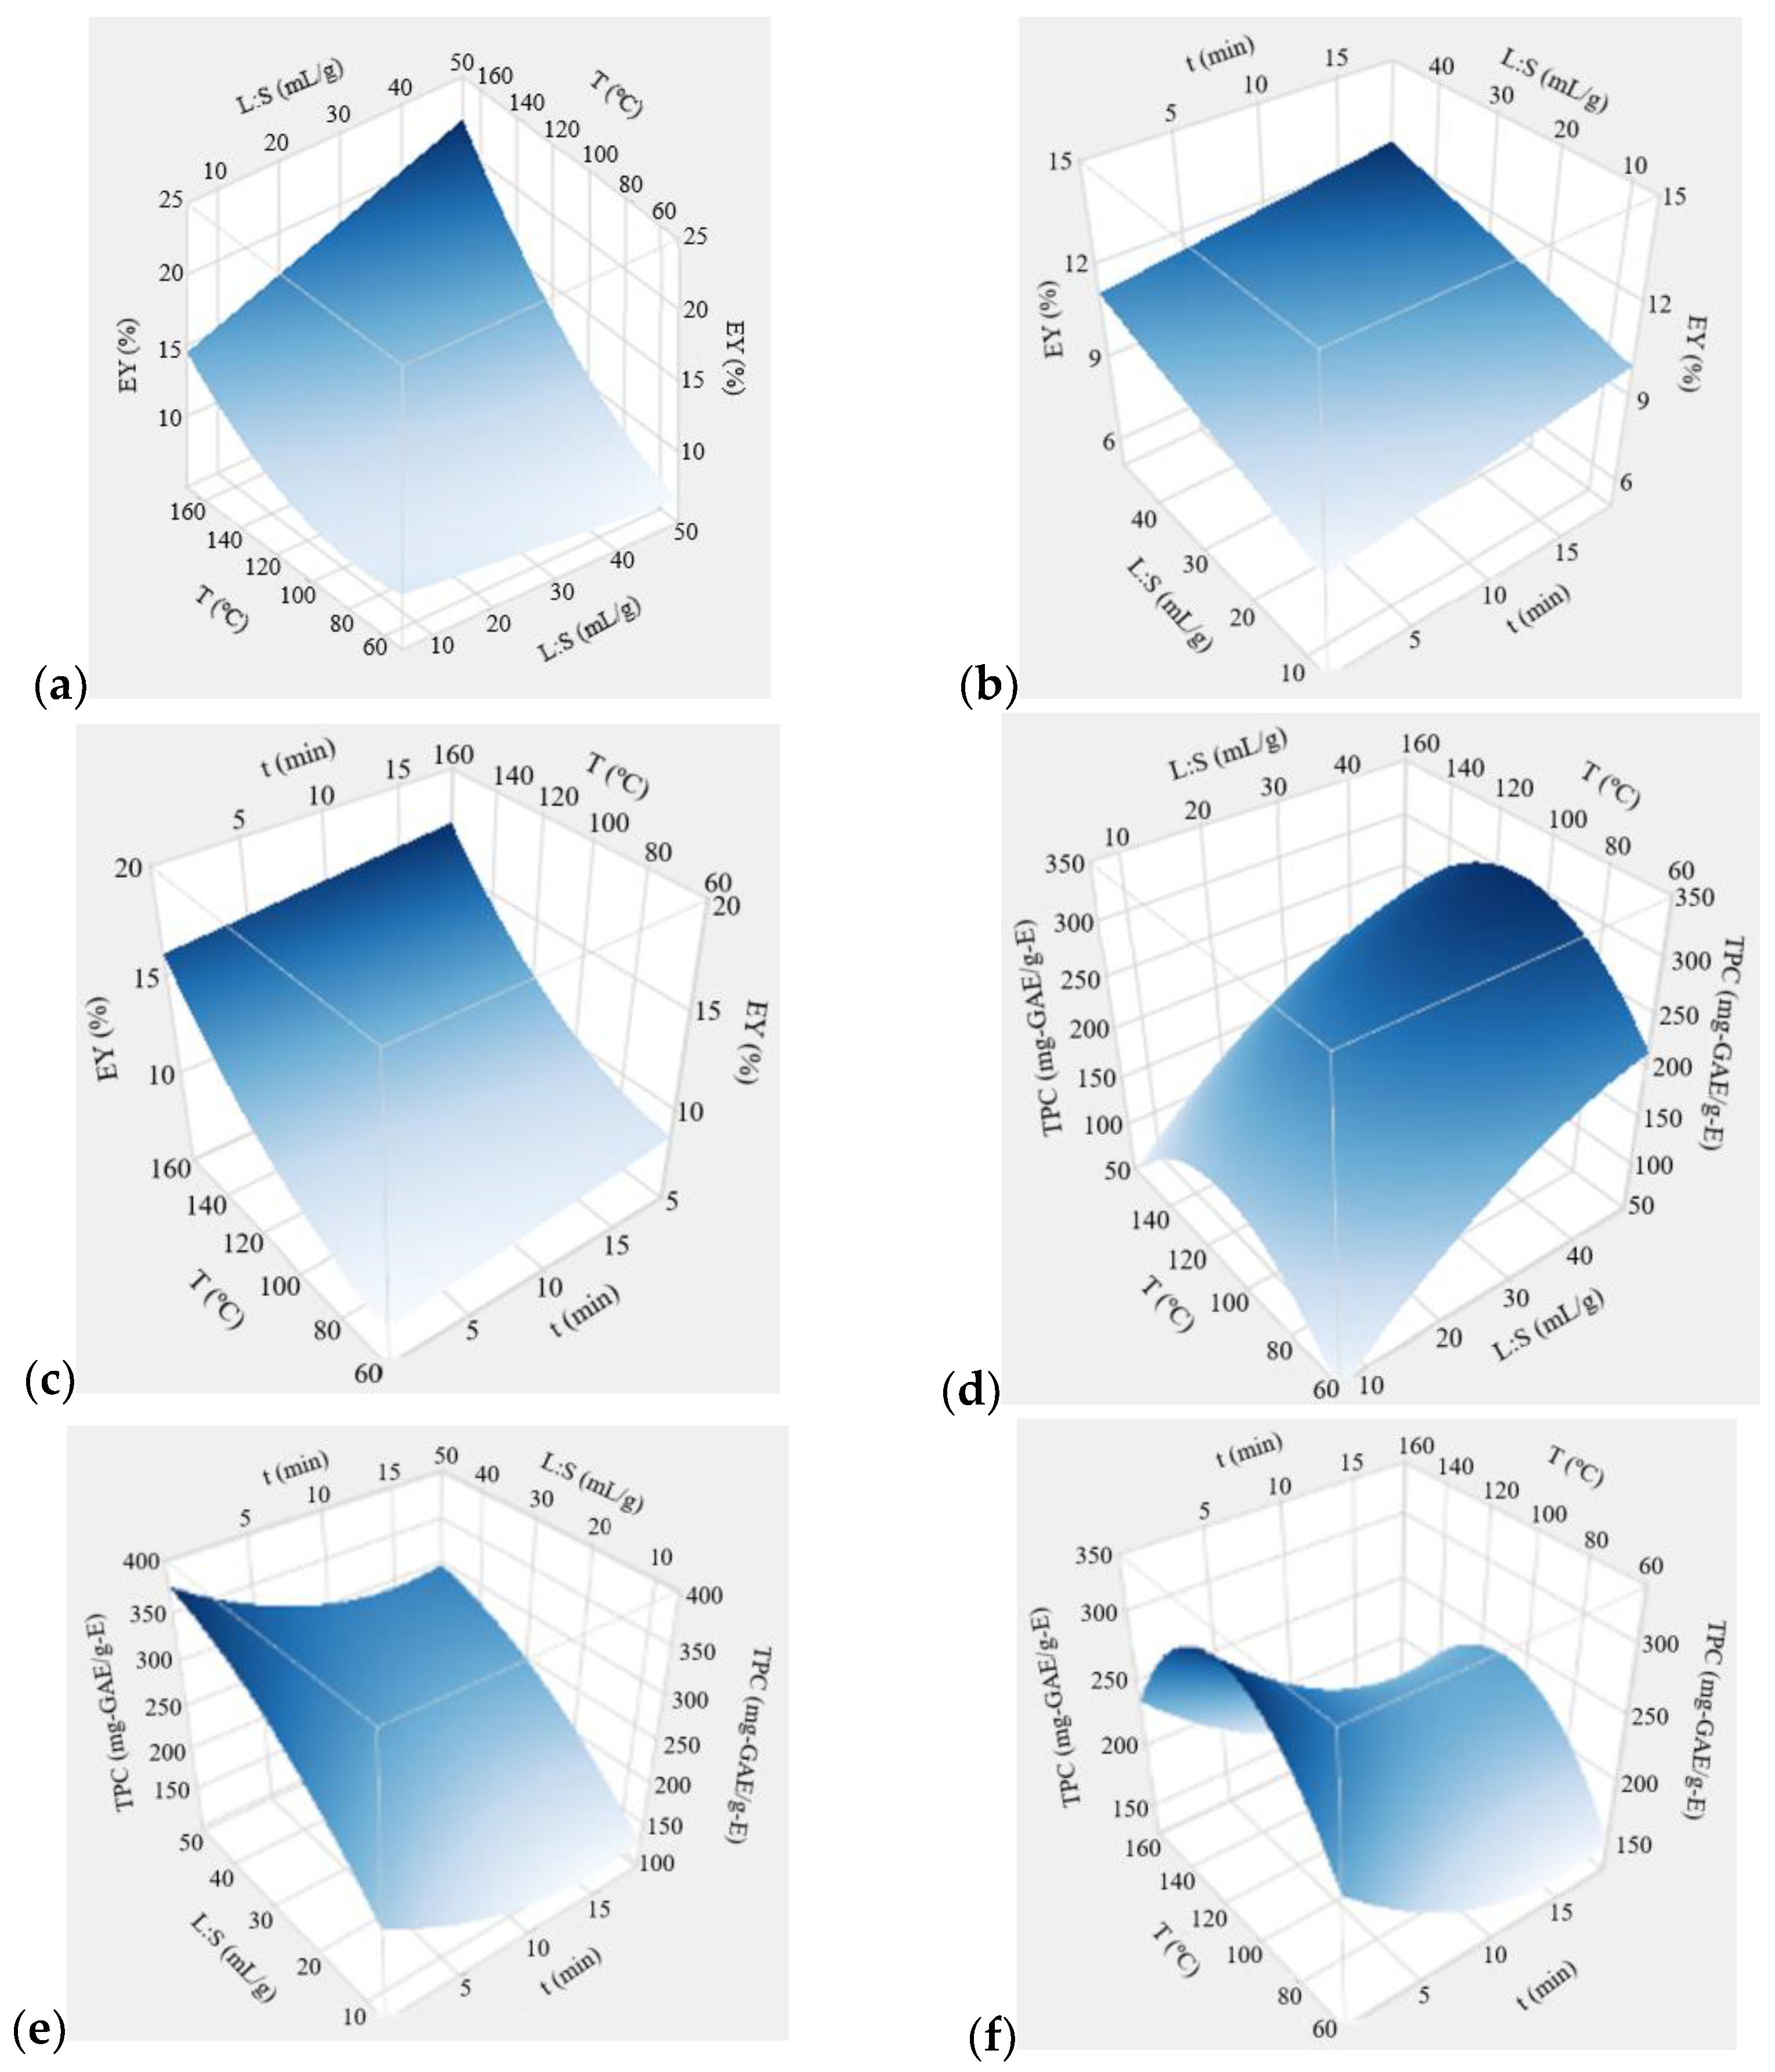
Figure 1 presents the three-dimensional response surface plots for EY and TPC, developed using the fitted models.
Results show that the extraction time exerts a statistically significant (albeit small) influence on the EY through a positive linear effect. The extraction yield presents very low improvements (typically 1.3%) when the extraction time increases from 0.25 to 18.8 min (Figure 1b,c). The influence of this factor on the TPC is more marked, resulting from the a combination of linear negative and quadratic effects of time (Table 4). The surface plots (Figure 1e,f) show a decrease in TPC with increasing extraction times up to 16 min, followed by a very slight improvement in TPC. Maximum TPC values are observed for the shortest extraction time (0.25 min). This TPC versus time pattern has been also observed for flavonoids MAE from Cannabis sativa L. [17]. Ašperger et al. (2022) tested irradiation times in the range 5–60 min to extract polyphenols from grape skins and reported optimum conditions using the shortest studied time. This is explained by the ionic conduction and water dipole rotation effects caused by microwave heating, which quickly generates pressure within the plant cells, leading to a molecular interaction with the electromagnetic field and a fast energy transfer between the solvent and the plant material [18]. Moreover, prolonged extraction and long-term thermal exposure may cause structural defects in sensitive extracted compounds [20]. These results support one of the main advantages of MAE, the extraction speed, which is also interesting from economic and environmental points of view.
The L:S ratio significantly affected both extraction responses. According to the mass transfer principles, extraction will take place until an equilibrium is established between the concentrations of extracted compounds in the solid and the liquid phases. Higher L:S means a greater driving force for extraction, due to an increased concentration gradient, and an equilibrium shifts to the extraction side [7]. This explains the results depicted in Figure 1a, showing an almost linear increase in EY with increasing amounts of solvent, especially for average and high temperatures of the operating range. For low temperatures (below 80 °C), L:S exerted a very small decrease in EY. In these conditions, the extraction efficiency is low, and the effect of low pressure and agitation inside the vessel when higher L:S ratios (lower amount of EGB particles) are used may overlap the positive influence of the higher amount of solvent. Regarding the extract quality, the amount of solvent was the factor that most affected TPC. Figure 1d,e show a marked increase in the phenolics content with raising L:S, also compatible with the enunciated mass transfer principle, and in line with other MAE studies. For instance, TPC values in carob kibble extracts obtained through MAE using ethanol aqueous mixtures increased with the increase of L:S, and the best-optimized value was found at the highest evaluated level (30 mL/g) [21]. A similar effect was observed on polyphenols MAE from Eucalyptus robusta leaves, using water as a solvent, where the optimal L:S was identified as 50 mL/g [22].
The temperature was the most influential parameter for the EY response. Higher temperatures are associated with higher extraction yields as the result of positive linear, quadratic, and interaction effects of the factor (Table 4). The variation of EY is especially significant for high liquid-to-solid ratios. Temperature directly affects the mass transfer coefficients and the solubility of compounds, being responsible for enhanced values. Increasing temperature reduces solvent viscosity and surface tension, which improves the wetting of the solid, the matrix penetration, and the solubility of compounds [20]. The increase in the extraction yield with temperature is also reported for MAE applied to other plant materials, e.g., Russian olive leaves and flowers [23]. However, the excessive temperature may cause thermal degradation of extracted compounds and a decline in extraction performance [23]. The combination of two opposed effects (enhanced mass transfer, thermal degradation) explains the TPC variation observed in Figure 1d,f. The phenolic content of the extract increased with the extraction temperature up to a maximum value observed at 111 °C. Above this level, an increase in temperature caused a decline in TPC. These results seem to corroborate a literature study on phenolics stability under MAE conditions, which indicates that all the evaluated compounds are stable up to 100 °C, but the degradation of a few phenolic compounds occurred at 125 °C [24]. It is noteworthy that some works on MAE evaluate irradiation power as a factor instead of temperature, possibly because the operating temperature cannot be regulated in some microwave devices [25]. The behavior of TPC as a function of power reported in those studies seems to be quite similar to that found here for temperature: an increase in TPC values with rising microwave power to a certain point, and a gradual decrease or stagnation as the irradiation power continued to rise [25,26]. The extraction temperature is expected to increase with the microwave power, although limited to the boiling point of the solvents at the observed pressure conditions. Whenever the temperature is not measured, different patterns of TPC variation with microwave power may be observed. Moreover, the importance of considering the irradiation power combined with sample size, i.e., power density, as a factor instead of the microwave power alone has been suggested [25].

3.2.4. Extraction Optimization

The extraction yield and the total phenolic content were examined to determine the optimum conditions to extract polyphenols from the Eucalyptus globulus bark. In the first approach, these two responses were optimized independently, and the results are presented in Table 6. The extraction time, liquid-to-solid ratio, and temperature that maximize the extraction yield (optimum value: 20%) were obtained at the highest values evaluated for the three factors: 18.8 min, solvent amount of 48.5 mL/g, and temperature of 160 °C. Regarding the polyphenolic content of the extract, the maximum predicted value is 374 mg-GAE/g-E, expected to be obtained when the extraction is carried out for 15 s, using a water volume of 48.5 mL per gram of bark and at a temperature of 111 °C. In order to validate these predicted responses, experiments were performed under optimal conditions (Table 6). Experimental results, named as EYexp and TPCexp (average values ± uncertainty), agree quite well with the values calculated from the developed models (EYpred and TPCpred; values ± 95% confidence interval). Condensed tannin contents (CT) were measured in the generated extracts. This class of tannins is the most interesting for coagulant production, due to the reactivity of nucleophilic sites. High contents of condensed tannins were obtained (no statistically significant difference among CT values in both extracts).
As seen in the previous section, antagonistic responses of EY and TPC are observed with the variation of the extraction time and temperature. Therefore, the desirability approach was used to maximize a function D that combines both responses, as explained in 
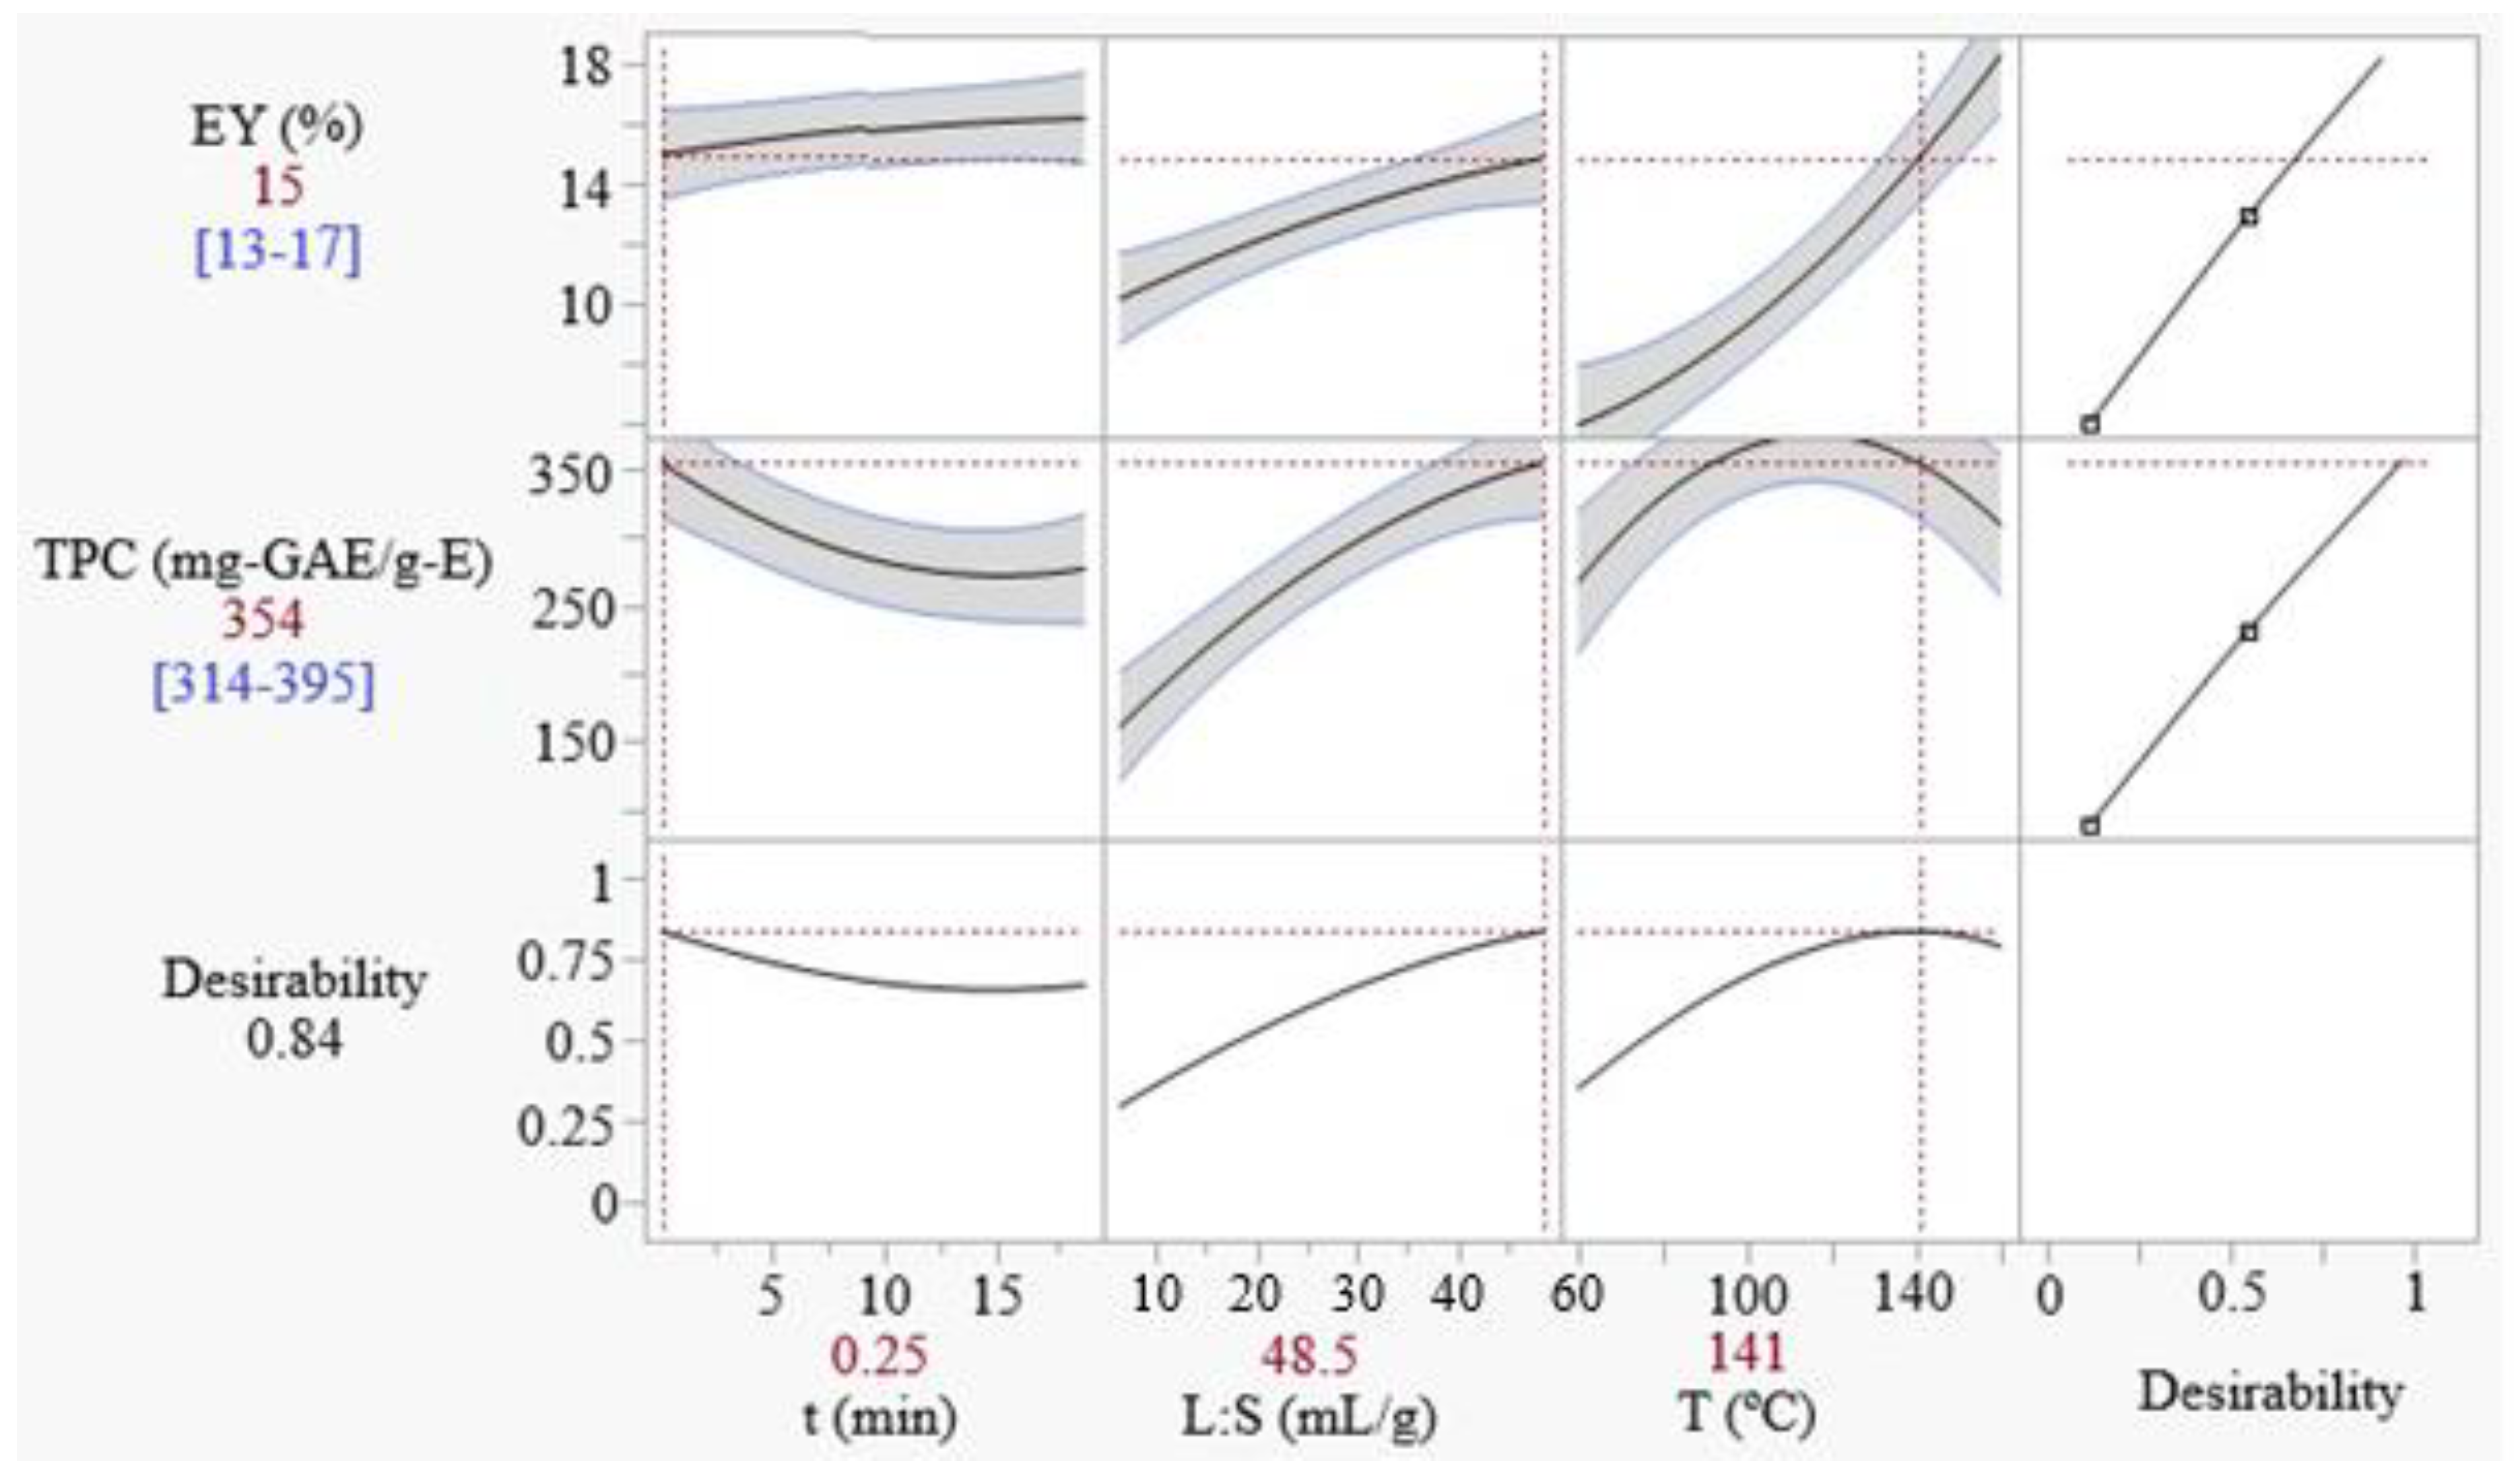
Section 2.4.3. The optimal conditions that maximize the overall desirability D, representing an optimum compromise between EY and TPC, were found as: 15 s, 48.5 mL/g, and 141 °C. The predicted values for EY and TPC are 15 ± 2% and 354 ± 40 mg-GAE/g-E, respectively, corresponding to an overall desirability of 0.84. These predicted responses values are confirmed by experimental values of EY and TPC, obtained under the same conditions (15.3 ± 0.3% and 330 ± 64 mg-GAE/g).
Figure 2 shows the prediction profile of the responses near the overall optimum point. As it can be seen, the liquid-to-solid ratio is the factor that most dramatically affects the desirability value, followed by temperature. The optimization study here conducted has considered three operating variables (time, liquid-to-solid ratio, and temperature) and aimed to optimize the extraction parameters. From the point of view of reducing production costs, the lowest possible values of irradiation time, solvent amount, and temperature are desirable. In the case of extraction time, the optimum was obtained as the minimum tested value (15 s), which is interesting considering the minimization of energy. The optimum L:S ratio, on the other side, was obtained at the highest level tested (48.5 mL/g). A higher L:S means increased energy consumption to remove the solvent and concentrate the dry extract product (drying, freeze-drying, or spray-drying drying). The overall desirability shows to be relatively sensitive to the L:S ratio, which means that the use of reduced L:S ratios, compared to the optimum values, may cause significant losses to D. For instance, the use of 27.5 mL/g (average value of the range) would result in EY and TPC drops from 15% and 354 mg-GAE/g-E to 13% and 285 mg-GAE/g-E, respectively. A 20% reduction in L:S in respect to the optimum value, i.e. 40 mL/g, causes little variation in D (EY reduces from 15 to 14% and TPC from 354 to 333 mg-GAE/g-E). The extract drying is not a matter of the present study, but the models here developed for EY and TPC are useful, allowing to set the L:S to desired levels and calculate the predicted impact on the extraction parameters. Regarding the temperature, 141 °C was defined as the optimum. However, the extraction temperature can be significantly reduced to values of 100 °C, with a small impact on D. For instance, the desirability level that would be obtained if 111 °C was used is 0.76, representing a significant decrease in the EY (from 15 to 11%) and an increase in TPC (from 354 to 374 mg-GAE/g), compared to the use of the optimum temperature (141 °C).

3.2.5. Comparison to Literature

The specific characteristics of each extraction method make direct comparisons challenging. Eucalyptus bark origin, species, conservation, and particle size have an impact on the extraction results and are an additional source of variation. A literature survey on the extraction of eucalyptus bark and other plant parts led to the results shown in Table 7.
Considering eucalyptus bark extractions through different methods and solvents, the reported values for EY and TPC are respectively in the ranges of 0.5–22% (typically above 7%) and 61–407 mg-GAE/g-E. The highest TPC in bark and other plant parts extracts has been obtained using organic solvents, which are undesirable from an environmental point of view. EY and TPC results obtained in this work by MAE, using water as the only extractant, are higher than the ones reported in the literature for SLE with the same solvent [10,12]. Compared to the values found using organic solvents, EY and TPC values obtained here, although lower, are quite significant. At optimized conditions, the number of polyphenols that can be extracted from EGB is 50.5 mg-GAE per gram of bark, which compares favorably with 37.8 mg-GAE/g obtained through SLE using methanol 50% v/v solution as extractant [29] or 25.8 mg-GAE/g obtained with sodium hydroxide/sodium sulfite solution [13]. However, the values are lower than the amounts that can be extracted from eucalyptus leaves.

4. Conclusions

This study investigated the extractable polyphenol content of Eucalyptus globulus bark, using water as an extractant. A comparison between different aqueous extraction techniques showed that MAE outperforms SLE, PLE, and UAE procedures regarding extraction yield, polyphenolic content, and extraction time. RSM combined with a Central Composite Inscribed experimental design was used to optimize MAE. Extraction time, solvent amount, and temperature were evaluated as independent variables, and extraction yield and total polyphenolic content were considered the measured responses. A validated model was established for each response and optimal MAE conditions were obtained. The desirability function approach was used for the overall optimization of the process, considering the maximization of both responses (extraction yield and polyphenolic content of the extract, the latter with a thrice weight compared to the former). The obtained optimum conditions were 15 s, 48.5 mL/g, and 141 °C, leading to a predicted extraction yield of 15% and a total polyphenolic content of 354 mg-GAE/g-E (values in line with experimental results). The condensed tannin content in optimized extracts was 473–645 mg-CE/g-E, confirming the great potential of eucalyptus bark aqueous extracts to be used for the production of tannin-based coagulants.

Author Contributions

Conceptualization, I.T.T. and S.C.R.S.; methodology, I.T.T. and S.C.R.S.; validation, S.C.R.S., C.M.S.B. and R.A.R.B.; formal analysis, I.T.T. and S.C.R.S.; investigation, I.T.T.; data curation, I.T.T.; writing—original draft preparation, I.T.T. and S.C.R.S.; writing—review and editing, C.M.S.B. and R.A.R.B.; visualization, I.T.T.; supervision, C.M.S.B. and R.A.R.B.; project administration, C.M.S.B.; funding acquisition, C.M.S.B. and R.A.R.B. All authors have read and agreed to the published version of the manuscript.

Funding

This work was financially supported by LA/P/0045/2020 (ALiCE), UIDB/50020/2020 and UIDP/50020/2020 (LSRE-LCM), funded by national funds through FCT/MCTES (PIDDAC). Isabella T. Tomasi and Sílvia C. R. Santos acknowledge doctoral and postdoctoral scholarships (respectively, BD/11977/2022 and SFRH/BPD/117387/2016), awarded by the Portuguese Science and Technology Foundation (FCT).

Conflicts of Interest

The authors declare no conflict of interest.

References

  1. Tomasi, I.T.; Machado, C.A.; Boaventura, R.A.; Botelho, C.M.; Santos, S.C. Tannin-based coagulants: Current development and prospects on synthesis and uses. Sci. Total Environ. 2022, 822, 154005. [Google Scholar] [CrossRef]
  2. Blainski, A.; Lopes, G.C.; De Mello, J.C.P. Application and Analysis of the Folin Ciocalteu Method for the Determination of the Total Phenolic Content from Limonium brasiliense L. Molecules 2013, 18, 6852–6865. [Google Scholar] [CrossRef] [PubMed] [Green Version]
  3. Agbor, G.A.; Vinson, J.A.; Donnelly, P.E. Folin-Ciocalteau Reagent for Polyphenolic Assay. Int. J. Food Sci. Nutr. Diet. 2014, 3, 147–156. [Google Scholar] [CrossRef]
  4. Broadhurst, R.B.; Jones, W.T. Analysis of condensed tannins using acidified vanillin. J. Sci. Food Agric. 1978, 29, 788–794. [Google Scholar] [CrossRef]
  5. Muanda, F.N.; Soulimani, R.; Diop, B.; Dicko, A. Study on chemical composition and biological activities of essential oil and extracts from Stevia rebaudiana Bertoni leaves. LWT-Food Sci. Technol. 2011, 44, 1865–1872. [Google Scholar] [CrossRef]
  6. Kovačević, D.B.; Barba, F.J.; Granato, D.; Galanakis, C.M.; Herceg, Z.; Dragović-Uzelac, V.; Putnik, P. Pressurized hot water extraction (PHWE) for the green recovery of bioactive compounds and steviol glycosides from Stevia rebaudiana Bertoni leaves. Food Chem. 2018, 254, 150–157. [Google Scholar] [CrossRef]
  7. de Hoyos Martinez, P.L.; Merle, J.; Labidi, J.; Charrier-El Bouhtoury, F. Tannins extraction: A key point for their valorization and cleaner production. J. Clean. Prod. 2019, 206, 1138–1155. [Google Scholar] [CrossRef] [Green Version]
  8. NIST/SEMATECH e-Handbook of Statistical Methods. Available online: http://www.itl.nist.gov/div898/handbook/ (accessed on 10 December 2022).
  9. Obermiller, D.J. “Multiple Response Optimization using JMP”. The Dow Chemical Company. Available online: https://support.sas.com/resources/papers/proceedings/proceedings/sugi22/INFOVIS/PAPER178.PDF (accessed on 14 April 2022).
  10. Vázquez, G.; González-Alvarez, J.; Santos, J.; Freire, M.S.; Antorrena, G. Evaluation of potential applications for chestnut (Castanea sativa) shell and eucalyptus (Eucalyptus globulus) bark extracts. Ind. Crops Prod. 2009, 29, 364–370. [Google Scholar] [CrossRef]
  11. Vázquez, G.; Antorrena, G.; González, J.; Alvarez, J.C. Tannin-Based Adhesives for Bonding High-Moisture Eucalyptus Veneers: Influence of Tannin Extraction and Press Conditions; Springer: Berlin/Heidelberg, Germany, 1996; pp. 93–97. [Google Scholar]
  12. Pinto, P.C.R.; Sousa, G.; Crispim, F.; Silvestre, A.J.D.; Neto, C.P. Eucalyptus globulus Bark as Source of Tannin Extracts for Application in Leather industry. ACS Sustain. Chem. Eng. 2013, 1, 950–955. [Google Scholar] [CrossRef]
  13. Vázquez, G.; Santos, J.; Freire, M.S.; Antorrena, G.; González-Álvarez, J. Extraction of antioxidants from eucalyptus (Eucalyptus globulus) bark. Wood Sci. Technol. 2012, 46, 443–457. [Google Scholar] [CrossRef]
  14. Bacelo, H.; Santos, S.C.R.; Botelho, C.M.S. Removal of arsenic from water by an iron-loaded resin prepared from Pinus pinaster bark tannins. Euro-Mediterr. J. Environ. Integr. 2020, 5, 47. [Google Scholar] [CrossRef]
  15. Arismendi, W.A.; Ortiz-Ardila, A.E.; Delgado, C.V.; Lugo, L.; Sequeda-Castañeda, L.G.; Celis-Zambrano, C.A. Modified tannins and their application in wastewater treatment. Water Sci. Technol. 2018, 78, 1115–1128. [Google Scholar] [CrossRef] [Green Version]
  16. Noordin, M.; Venkatesh, V.; Sharif, S.; Elting, S.; Abdullah, A. Application of response surface methodology in describing the performance of coated carbide tools when turning AISI 1045 steel. J. Mater. Process. Technol. 2004, 145, 46–58. [Google Scholar] [CrossRef] [Green Version]
  17. Mazzara, E.; Carletti, R.; Petrelli, R.; Mustafa, A.M.; Caprioli, G.; Fiorini, D.; Scortichini, S.; Dall’Acqua, S.; Sut, S.; Nuñez, S.; et al. Green extraction of hemp (Cannabis sativa L.) using microwave method for recovery of three valuable fractions (essential oil, phenolic compounds and cannabinoids): A central composite design optimization study. J. Sci. Food Agric. 2022, 102, 6220–6235. [Google Scholar] [CrossRef]
  18. Dahmoune, F.; Nayak, B.; Moussi, K.; Remini, H.; Madani, K. Optimization of microwave-assisted extraction of polyphenols from Myrtus communis L. leaves. Food Chem. 2015, 166, 585–595. [Google Scholar] [CrossRef]
  19. Ibrahim, A.; Yaser, A.Z.; Lamaming, J. Synthesising tannin-based coagulants for water and wastewater application: A review. J. Environ. Chem. Eng. 2020, 9, 105007. [Google Scholar] [CrossRef]
  20. Bener, M.; Şen, F.B.; Önem, A.N.; Bekdeşer, B.; Çelik, S.E.; Lalikoglu, M.; Aşçı, Y.S.; Capanoglu, E.; Apak, R. Microwave-assisted extraction of antioxidant compounds from by-products of Turkish hazelnut (Corylus avellana L.) using natural deep eutectic solvents: Modeling, optimization and phenolic characterization. Food Chem. 2022, 385, 132633. [Google Scholar] [CrossRef]
  21. Huma, Z.; Jayasena, V.; Nasar-Abbas, S.M.; Imran, M.; Khan, M.K. Process optimization of polyphenol extraction from carob (Ceratonia siliqua) kibbles using microwave-assisted technique. J. Food Process. Preserv. 2017, 42, e13450. [Google Scholar] [CrossRef]
  22. Bhuyan, D.J.; Van Vuong, Q.; Chalmers, A.C.; van Altena, I.A.; Bowyer, M.C.; Scarlett, C.J. Microwave-assisted extraction of Eucalyptus robusta leaf for the optimal yield of total phenolic compounds. Ind. Crops Prod. 2015, 69, 290–299. [Google Scholar] [CrossRef]
  23. Darvishzadeh, P.; Orsat, V. Microwave-assisted extraction of antioxidant compounds from Russian olive leaves and flowers: Optimization, HPLC characterization and comparison with other methods. J. Appl. Res. Med. Aromat. Plants 2022, 27, 100368. [Google Scholar] [CrossRef]
  24. Liazid, A.; Palma, M.; Brigui, J.; Barroso, C.G. Investigation on phenolic compounds stability during microwave-assisted extraction. J. Chromatogr. A 2007, 1140, 29–34. [Google Scholar] [CrossRef]
  25. Dahmoune, F.; Spigno, G.; Moussi, K.; Remini, H.; Cherbal, A.; Madani, K. Pistacia lentiscus leaves as a source of phenolic compounds: Microwave-assisted extraction optimized and compared with ultrasound-assisted and conventional solvent extraction. Ind. Crops Prod. 2014, 61, 31–40. [Google Scholar] [CrossRef]
  26. Zhao, C.-N.; Zhang, J.-J.; Li, Y.; Meng, X.; Li, H.-B. Microwave-Assisted Extraction of Phenolic Compounds from Melastoma sanguineum Fruit: Optimization and Identification. Molecules 2018, 23, 2498. [Google Scholar] [CrossRef] [PubMed] [Green Version]
  27. Santos, J.; Antorrena, G.; Freire, M.S.; Pizzi, A.; González-Álvarez, J. Environmentally friendly wood adhesives based on chestnut (Castanea sativa) shell tannins. Eur. J. Wood Wood Prod. 2016, 75, 89–100. [Google Scholar] [CrossRef]
  28. Said, Z.; Slimani, S.; Remini, H.; Idir-Himed, H.; Mazauric, J.; Madani, K.; Boulekbache-Makhlouf, L. Phytochemical analysis and antioxidant activity of Eucalyptus globulus: A comparative study between fruits and leaves extracts. SDRP J. Chem. Eng. Bioanal. Chem. 2016, 1, 1–10. [Google Scholar]
  29. Santos, S.A.; Villaverde, J.J.; Silva, C.M.; Neto, C.P.; Silvestre, A.J. Supercritical fluid extraction of phenolic compounds from Eucalyptus globulus Labill bark. J. Supercrit. Fluids 2012, 71, 71–79. [Google Scholar] [CrossRef]
  30. Gullón, B.; Gullón, P.; Lú-Chau, T.A.; Moreira, M.T.; Lema, J.M.; Eibes, G. Optimization of solvent extraction of antioxidants from Eucalyptus globulus leaves by response surface methodology: Characterization and assessment of their bioactive properties. Ind. Crops Prod. 2017, 108, 649–659. [Google Scholar] [CrossRef]
  31. Fernández-Agulló, A.; Freire, M.S.; González-Álvarez, J. Effect of the extraction technique on the recovery of bioactive compounds from eucalyptus (Eucalyptus globulus) wood industrial wastes. Ind. Crops Prod. 2015, 64, 105–113. [Google Scholar] [CrossRef]
  32. Gullón, B.; Muñiz-Mouro, A.; Lú-Chau, T.A.; Moreira, M.T.; Lema, J.M.; Eibes, G. Green approaches for the extraction of antioxidants from eucalyptus leaves. Ind. Crops Prod. 2019, 138, 111473. [Google Scholar] [CrossRef]
Figure 1. Response surface plots showing the effect of extraction conditions on the extraction yield and total phenolic content of the extract. Surface plots obtained for: (a,d) extraction time of 9.5 min; (b,e) temperature of 110 °C; (c,f) liquid-to-solid ratio of 27.5 mL.g−1.
Water 15 00317 g001
Figure 2. Prediction profile of the maximized desirability.
Water 15 00317 g002
Table 1. Experimental domain: actual and coded values of the factors for MAE optimization.
Coded LevelsActual Levels
t (min)L:S (mL.g−1)T (°C)
−α0.256.560
−14.015.080
09.527.5110
+115.040.0140
18.848.5160
Table 2. Tannin extraction from E. globulus bark by different methods and extraction conditions (L:S = 15 mL/g).
MethodT (°C)Solventt (min)EY (%)TPC (mg-GAE/g-E)
SLE90H2O59.1 ± 0.1159 ± 2
90H2O158.9 ± 0.2158 ± 8
90H2O609 ± 1113 ± 9
902.5% NaOH6017.4 ± 0.4140 ± 7
905.0% NaOH6020.5 ± 0.4152 ± 19
907.5% NaOH6027 ± 1146 ± 13
PLE a120H2O58.5 ± 0.2120 ± 28
120H2O157.4 ± 0.3141 ± 10
120H2O609.1 ± 0.491 ± 10
1202.5% NaOH514.0 ± 0.1189 ± 2
1202.5% NaOH1516 ± 1172 ± 9
1202.5% NaOH6016.9 ± 0.2179 ± 10
UAE b30H2O55.3 ± 0.134 ± 11
MAE90H2O0.058.0 ± 0.3254 ± 10
90H2O59.1 ± 0.3206 ± 23
90H2O1510.1 ± 0.7169 ± 20
Notes: a 1 bar b 1000 W—60–70 Hz.
Table 3. CCI Design: experimental conditions, results (EY and TPC), and predicted responses (EYpred and TPCpred).
RunX1X2X3EY (%)EYpred (%)TPC (mg-GAE/g-E)TPCpred (mg-GAE/g-E)
1a−1−1−19.3 ± 0.18.0212187
1b−1−1−18.6 ± 0.18.0221187
2a+1−1−19.1 ± 0.18.8163141
2b+1−1−18.8 ± 0.18.8168141
3a−1+1−18.8±0.28.2299288
3b−1+1−19.0 ± 0.28.2247288
4a+1+1−18.5 ± 0.19.0232242
4b+1+1−19.0 ± 0.19.0234242
5a−1−1+112.2 ± 0.111.9172190
5b−1−1+111.3 ± 0.111.9200190
6a+1−1+113.0 ± 0.112.7147144
6b+1−1+113.5 ± 0.112.7142144
7a−1+1+115.1 ± 0.214.8256291
7b−1+1+115.7 ± 0.214.8284291
8a+1+1+114.3 ± 0.215.6226245
8b+1+1+115.1 ± 0.215.6249245
9a−α008.7 ± 0.19.8308313
9b−α008.5 ± 0.19.8337313
10aα0011.0 ± 0.111.2249236
10bα0011.9 ± 0.111.2217236
11a0−α08.51 ± 0.039.299136
11b0−α07.96 ± 0.039.2103136
12a0α012.3 ± 0.211.8316306
12b0α010.4 ± 0.211.8353306
13a00−α6.8 ± 0.17.8145155
13b00−α7.4 ± 0.17.8131155
14a00α18.2 ± 0.116.7168160
14b00α15.5 ± 0.116.7191160
15a00010.3 ± 0.110.5253245
15b00011.0 ± 0.110.5264245
16a0009.8 ± 0.110.5238245
16b00010.8 ± 0.110.5238245
17a00011.4 ± 0.110.5239245
17b00010.8 ± 0.110.5255245
18a00010.1 ± 0.110.5236245
18b00010.8 ± 0.110.5237245
19a00011.3 ± 0.110.5247245
19b00010.7 ± 0.110.5238245
20a00011.1 ± 0.110.5234245
20b00010.5 ± 0.110.5266245
Table 4. Regression coefficients for the models describing the extraction yield and the phenolic content of the extract obtained by MAE of EGB.
CoefficientsEYTPC
Valuet-RatioIC (95%)Prob > |t|Valuet-RatioIC (95%)Prob > |t|
β010.4962.40.34<0.0001245.439.312.7<0.0001
β10.392.460.320.019−22.9−5.598.32<0.0001
β20.734.630.32<0.000150.512.38.35<0.0001
β32.6316.50.32<0.00011.410.348.460.736
β12-- --- -
β13-- --- -
β230.683.260.420.003-- -
β12-- -10.22.637.870.013
β22-- --8.67-2.237.920.033
β320.624.010.310.0003-31.2-7.518.43<0.0001
Table 5. Summary of the fits and ANOVA results for EY and TPC modeling.
ResponseR2RMSSourceDFSSMSF-RatioFcritProb > F
EY0.9070.83Model522745.3665.982.49<0.0001
Error3423.40.69
C. Total39250
TPC0.88721.6Model61.21∙1052.01∙10443.012.39<0.0001
Error331.55∙104468
C. Total391.36∙105
Notes: RSM—Root Mean Square; DF—Degrees of Freedom; MS—Mean Square; F-ratio—calculated F-ratio; Fcrit—critical F value at 95% probability level.
Table 6. Optimum conditions and responses (TPC expressed in mg-GAE/g-E; CT expressed in mg-CE/g-E).
Optimization Goalt (min)L:S (mL/g)T (°C)EYpred (%)TPCpredEYexp (%)TPCexpCT
Maximum EY18.848.516020 ± 2210 ± 1220.6 ±0.2169 ± 33538 ± 69
Maximum TPC0.2548.511111.2 ± 0.3374 ± 3610.4 ± 0.8351 ± 30473 ± 68
Maximum D0.2548.514115 ± 2354 ± 4015.3 ± 0.3330 ± 64645 ± 68
Table 7. Literature results for the extraction of polyphenols from Eucalyptus globulus plant parts.
Plant Part/MethodSolvent/ConditionsL:S (mL/g)t (min)T (°C)EY (%)TPC
(mg-GAE/g-E)
Ref.
Bark/SLEH2O818014014-[12]
Bark/SLEH2O1560906.8180.9[10]
Bark/SLE2.5% NaOH15609010.887.7
Bark/SLE1.5% Na2SO3 + 0.75% NaOH1560907.1-[27]
Fruits/SLE70% acetone + 0.5% AcOH1001 wk--464.71[28]
Leaves/SLE70% acetone + 0.5% AcOH1001 wk--432.63
Bark/SLE50% EtOH10024 hRT9.74159.57[29]
Bark/SLE50% MeOH10024 hRT9.28407.41
Bark/SFE10 g CO2/min, 20% EtOH, 300 bar--700.4861.20
Bark/SLE1.5% Na2SO315601007.1228[13]
Bark/SLE1.5% Na2SO3 + 3% NaOH156010021.9118
Leaves/SLE56% EtOH202255032.792.9 *[30]
Wood trimmings/MAEEtOH8.810652.3650.3[31]
Leaves/MAE56% EtOH107--79.4 *[32]
Leaves/UAE 56% EtOH109050-84.0 *
Bark/MAEH2O48.50.2514915.3330here
Notes: * TPC expressed in mg-GAE per gram of dry weight of dry plant; RT—room temperature.
Disclaimer/Publisher’s Note: The statements, opinions and data contained in all publications are solely those of the individual author(s) and contributor(s) and not of MDPI and/or the editor(s). MDPI and/or the editor(s) disclaim responsibility for any injury to people or property resulting from any ideas, methods, instructions or products referred to in the content.

