
Numerical Simulation of Flow-Induced Noise in Horizontal Axial Flow Pumps in Forward and Reverse Conditions

1
College of Energy and Electrical Engineering, Hohai University, Nanjing 210098, China
2
School of Aeronautics, Nanjing University of Aeronautics and Astronautics, Nanjing 210016, China
*
Author to whom correspondence should be addressed.
Water 2023, 15(2), 322; https://doi.org/10.3390/w15020322
Submission received: 18 November 2022
/
Revised: 8 January 2023
/
Accepted: 9 January 2023
/
Published: 12 January 2023
(This article belongs to the Section Hydraulics and Hydrodynamics)
Abstract
:This paper investigates the influence of pressure pulsation and flow-induced noise using a two-way dual-purpose pump. The pressure pulsation signal is obtained from the Detached Eddy Simulation (DES) turbulent model calculation as the fan sound source, and the noise sound field distribution in the impeller is calculated. The numerical results show that the external characteristics and pressure pulsation obtained from the simulation correlate well with the experimental values. Under different working conditions, the pressure pulsation decreases with the increase in the flow rate; no evident dominant frequency occurs in the frequency spectrum at a low flow rate, and many spurious frequencies occur. The primary frequency in the runner chamber is the leaf frequency, and that in the nonblade area is the rotating frequency. The sound field distribution of the flow-induced noise has dipole characteristics, and its directivity distribution and sound pressure radiation level can reflect the pressure pulsation characteristics. It is primarily affected by the blade frequency, and the distribution with the flow rate is consistent with the pressure pulsation. Avoiding a low flow and operating in a reasonable flow area can effectively reduce pressure pulsation and flow-induced noise and ensure the stability of unit operation.
1. Introduction
Axial flow pumps with a low lift and a large flow are widely used in agricultural irrigation, urban water supply, flood drainage, drought relief, and nuclear power engineering [1,2,3,4,5]. Rismondo et al. [6] studied the difference in sound pressure between rigid solid and elastic solid and adopted a large eddy simulation to show the influence of fluid–solid interactions on noise generation and propagation. Zheng, Y. et al. [7] studied variable speed and displacement and found that the pump’s pressure pulsation change can be affected. The pulsation amplitude under high speed and low displacement is the smallest, and the system noise change is opposite to the pulsation change trend. Cheng Xiaorui et al. [8] conducted numerical calculation studies and found that the appropriate circumferential position of the guide vane can effectively improve the pump’s pressure pulsation distribution, reducing the pump’s vibration. Jiao Weixuan et al. [9] found a large backflow in the pump’s inlet and outlet water passages, and low-frequency pulsation is dominant. Li Rennian et al. [10] analyzed the influence of the pressure pulsation characteristics in the cascade on the flow-induced noise and found that the optimization design of noise reduction should focus more on the flow-induced noise at the rotating frequency. Yeo et al. [11] simulated the flow field around the submarine and conducted a two-phase hydrodynamics analysis to study the flow-induced noise distribution of the submarine under the condition of the ventilator, which is mainly divided into bubble noise and turbulence noise, with a limit of 500 Hz.
Scholars’ research on the internal pressure pulsation characteristics of pumps focuses on mixed flow pumps [12,13,14,15], oblique flow pumps [16,17,18], pump turbines [19,20,21], and centrifugal pumps [22,23,24,25,26,27,28]. Few studies exist on the flow pump, especially regarding the pressure pulsation characteristics in the pump under multiple working conditions and their influence on the flow-induced noise. This study takes a pumping station’s horizontal axial flow pump as the research object, and three-dimensional turbulent flow numerical simulation and the actual machine test are used to explore the pressure pulsation characteristics in the pump under different working conditions. Based on this, the dipole sound source rotating by the vane is analyzed. The generated external noise is calculated and simulated, and the influence of the pulsation characteristics on the flow-induced noise is further analyzed, providing a reference for the unit’s stable operation, safe maintenance, and noise control.
2. Numerical Simulation
2.1. Governing Equations
In actual operations, the water flow inside the axial flow pump can be considered an incompressible fluid, and it operates at room temperature without considering the heat exchange with the outside world. Fluid-governing equations primarily include the continuity and Navier–Stokes equations.
Continuity equation:
where ρ is the fluid density, and u is the velocity vector.
Navier–Stokes equation:
where u is the speed, p is the pressure, f is the mass force, and ρ is the density.
2.2. Calculation Model
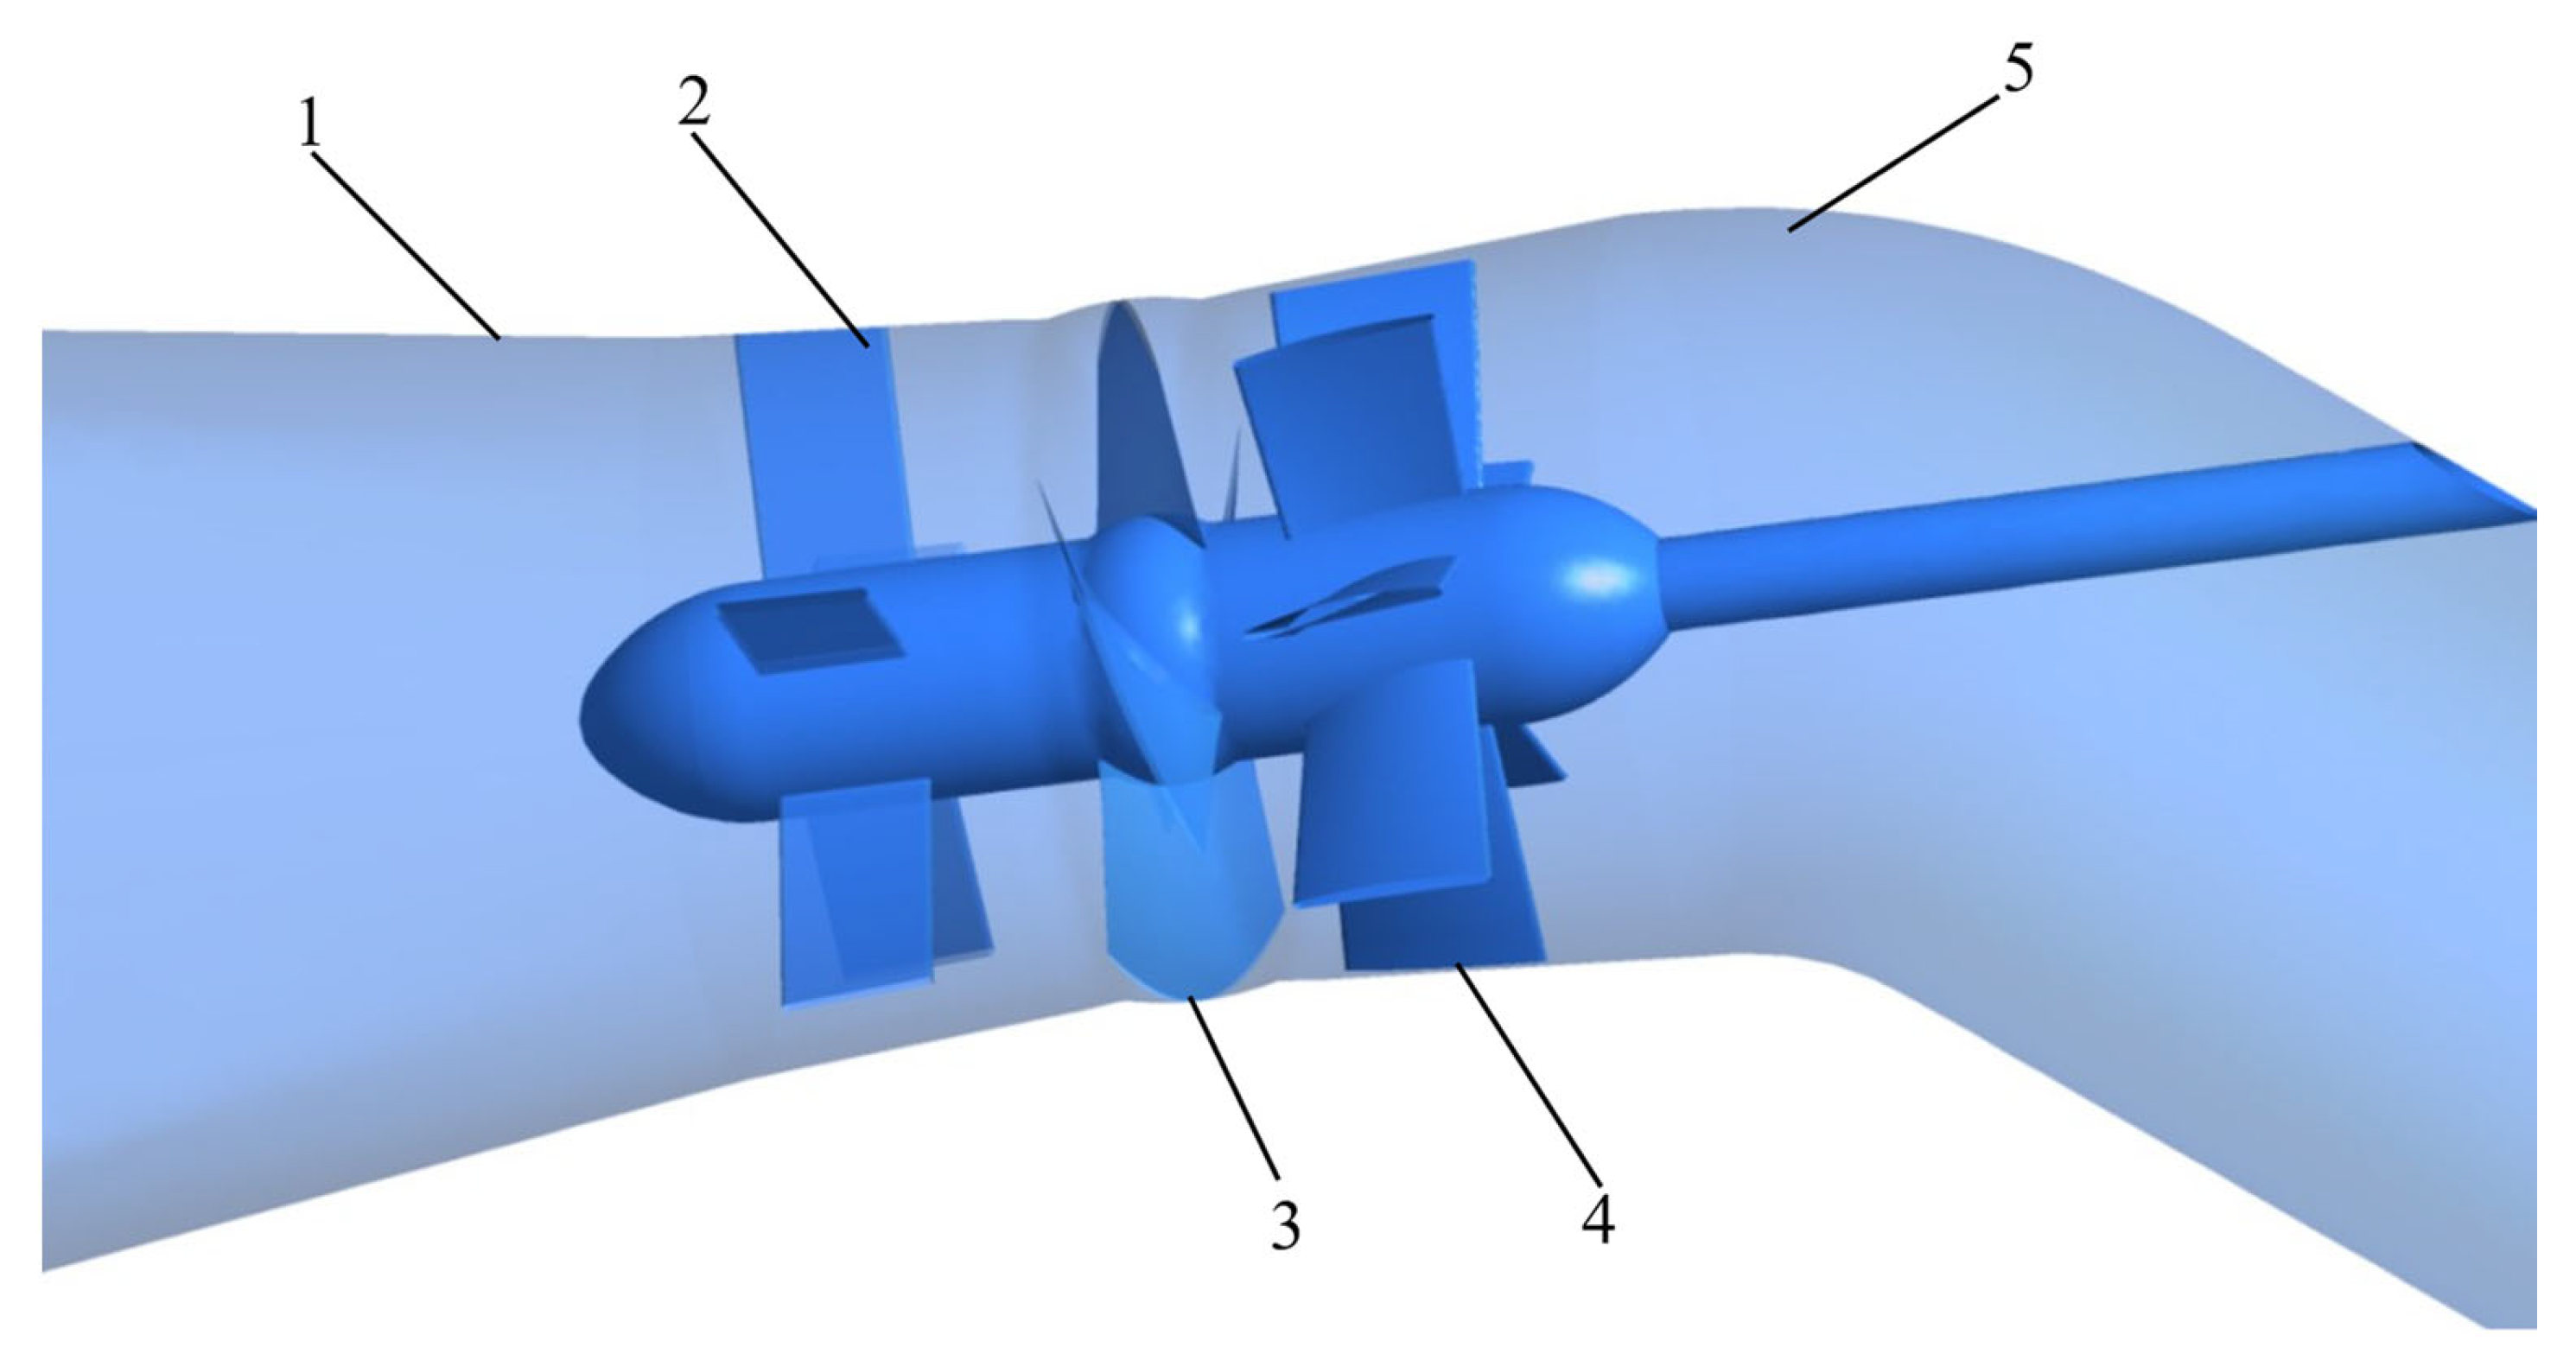
This study’s calculation model software is the modeling software ug10.0 of Siemens. The model can be divided into three parts: the inlet flow channel, the overflow part, and the outlet flow channel. The overcurrent component includes a front guide vane body, a runner body, and a movable guide vane body (Figure 1). Table 1 shows the axial flow pump’s relevant design parameters. The impeller diameter is 1.7 m; the design flow is 10 m3/s; the design head is 2.5 m; the rated speed is 250 r/min, and the number of runner blades is four, that of the front guide vanes is five, and that of the active guide vanes is seven.
2.3. Meshing
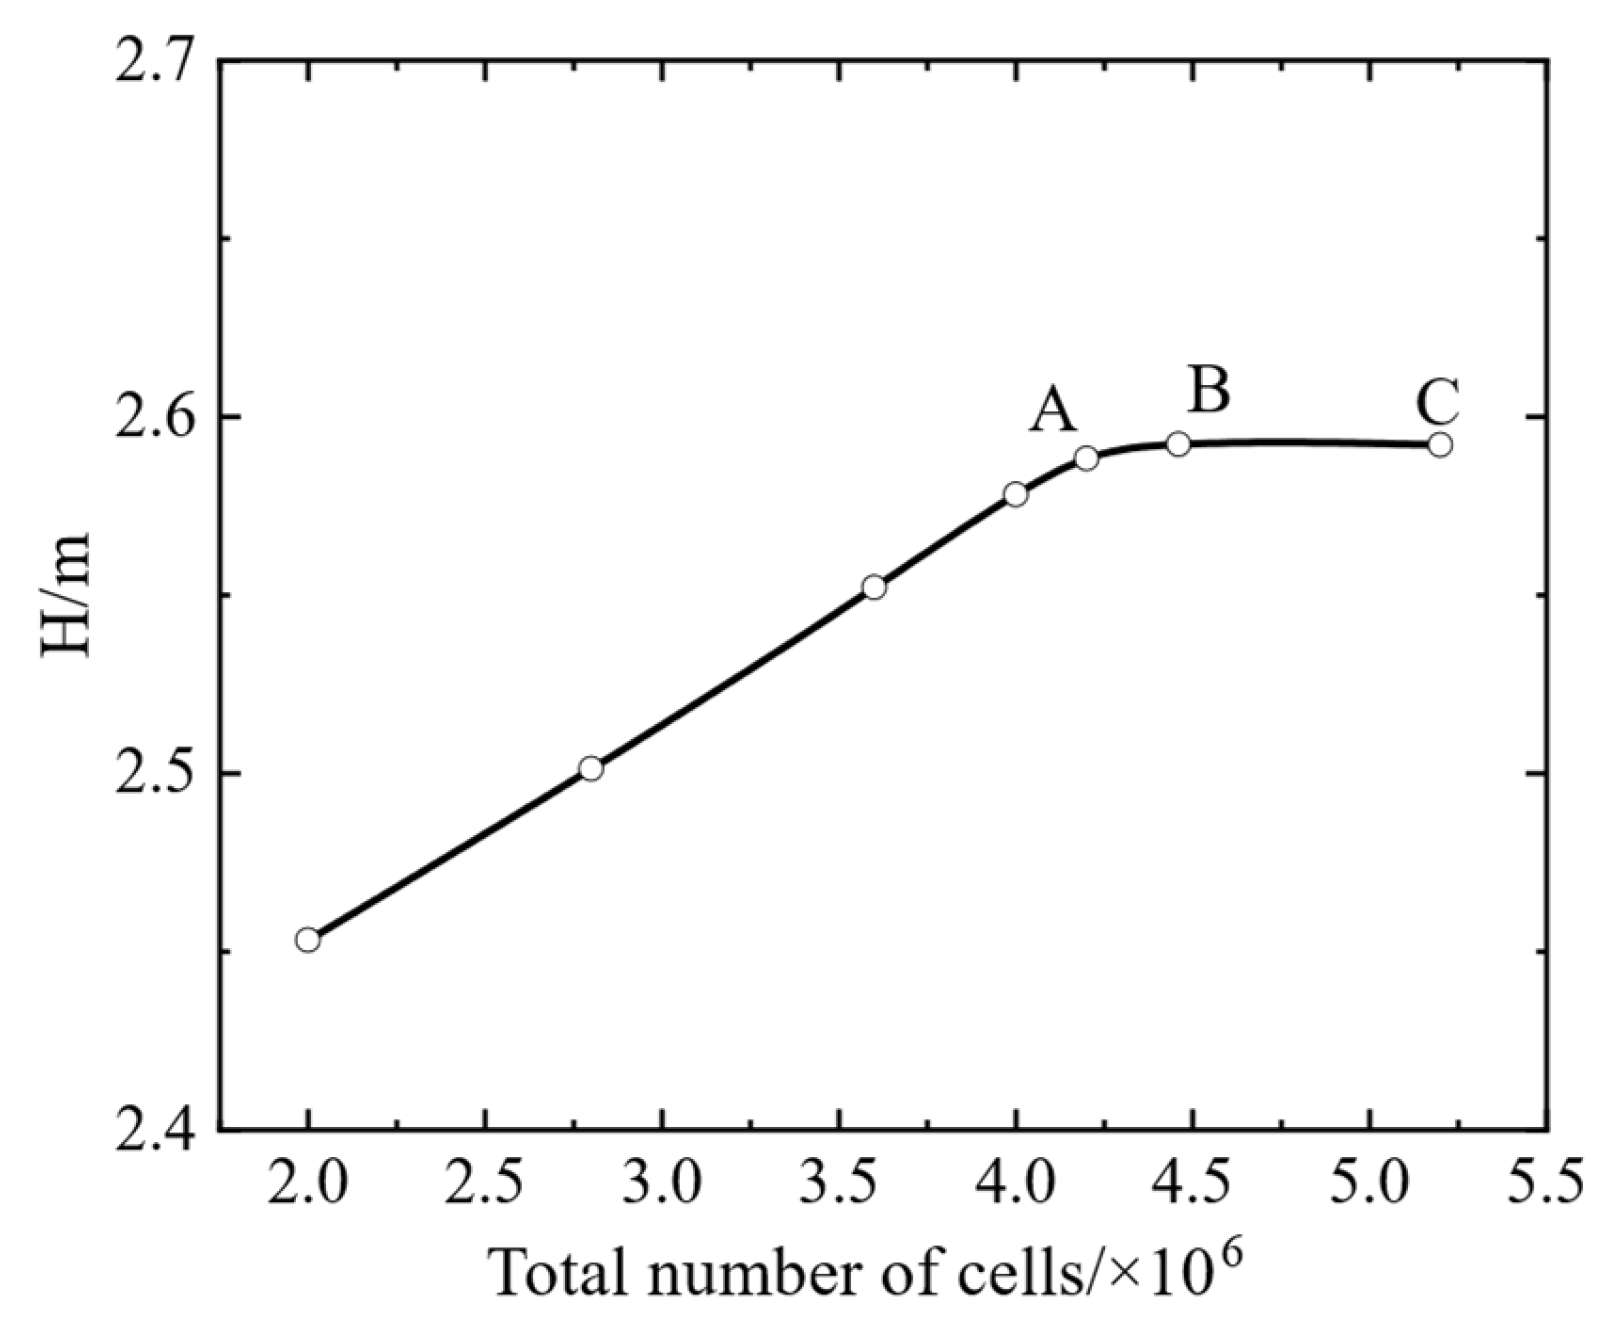
Figure 2 is the grid independence analysis. Different points in the figure represent the selection of different grid numbers for verification. Seven sets of grids with different grid numbers were designed using ICEM software to ensure the accuracy of the calculated values and the rational use of computing resources, and the design water head was selected as the reference to verify the grid independence. When the grid number reaches 4 million, the head’s fluctuation error is already within 1%. Due to factors, such as computing resources, the final selection grid is 4.32 million. The impeller area is 2 million; the front guide vane area is 700,000; the rear guide vane area is 800,000; the inlet section is 600,000, and the outlet section is 300,000.
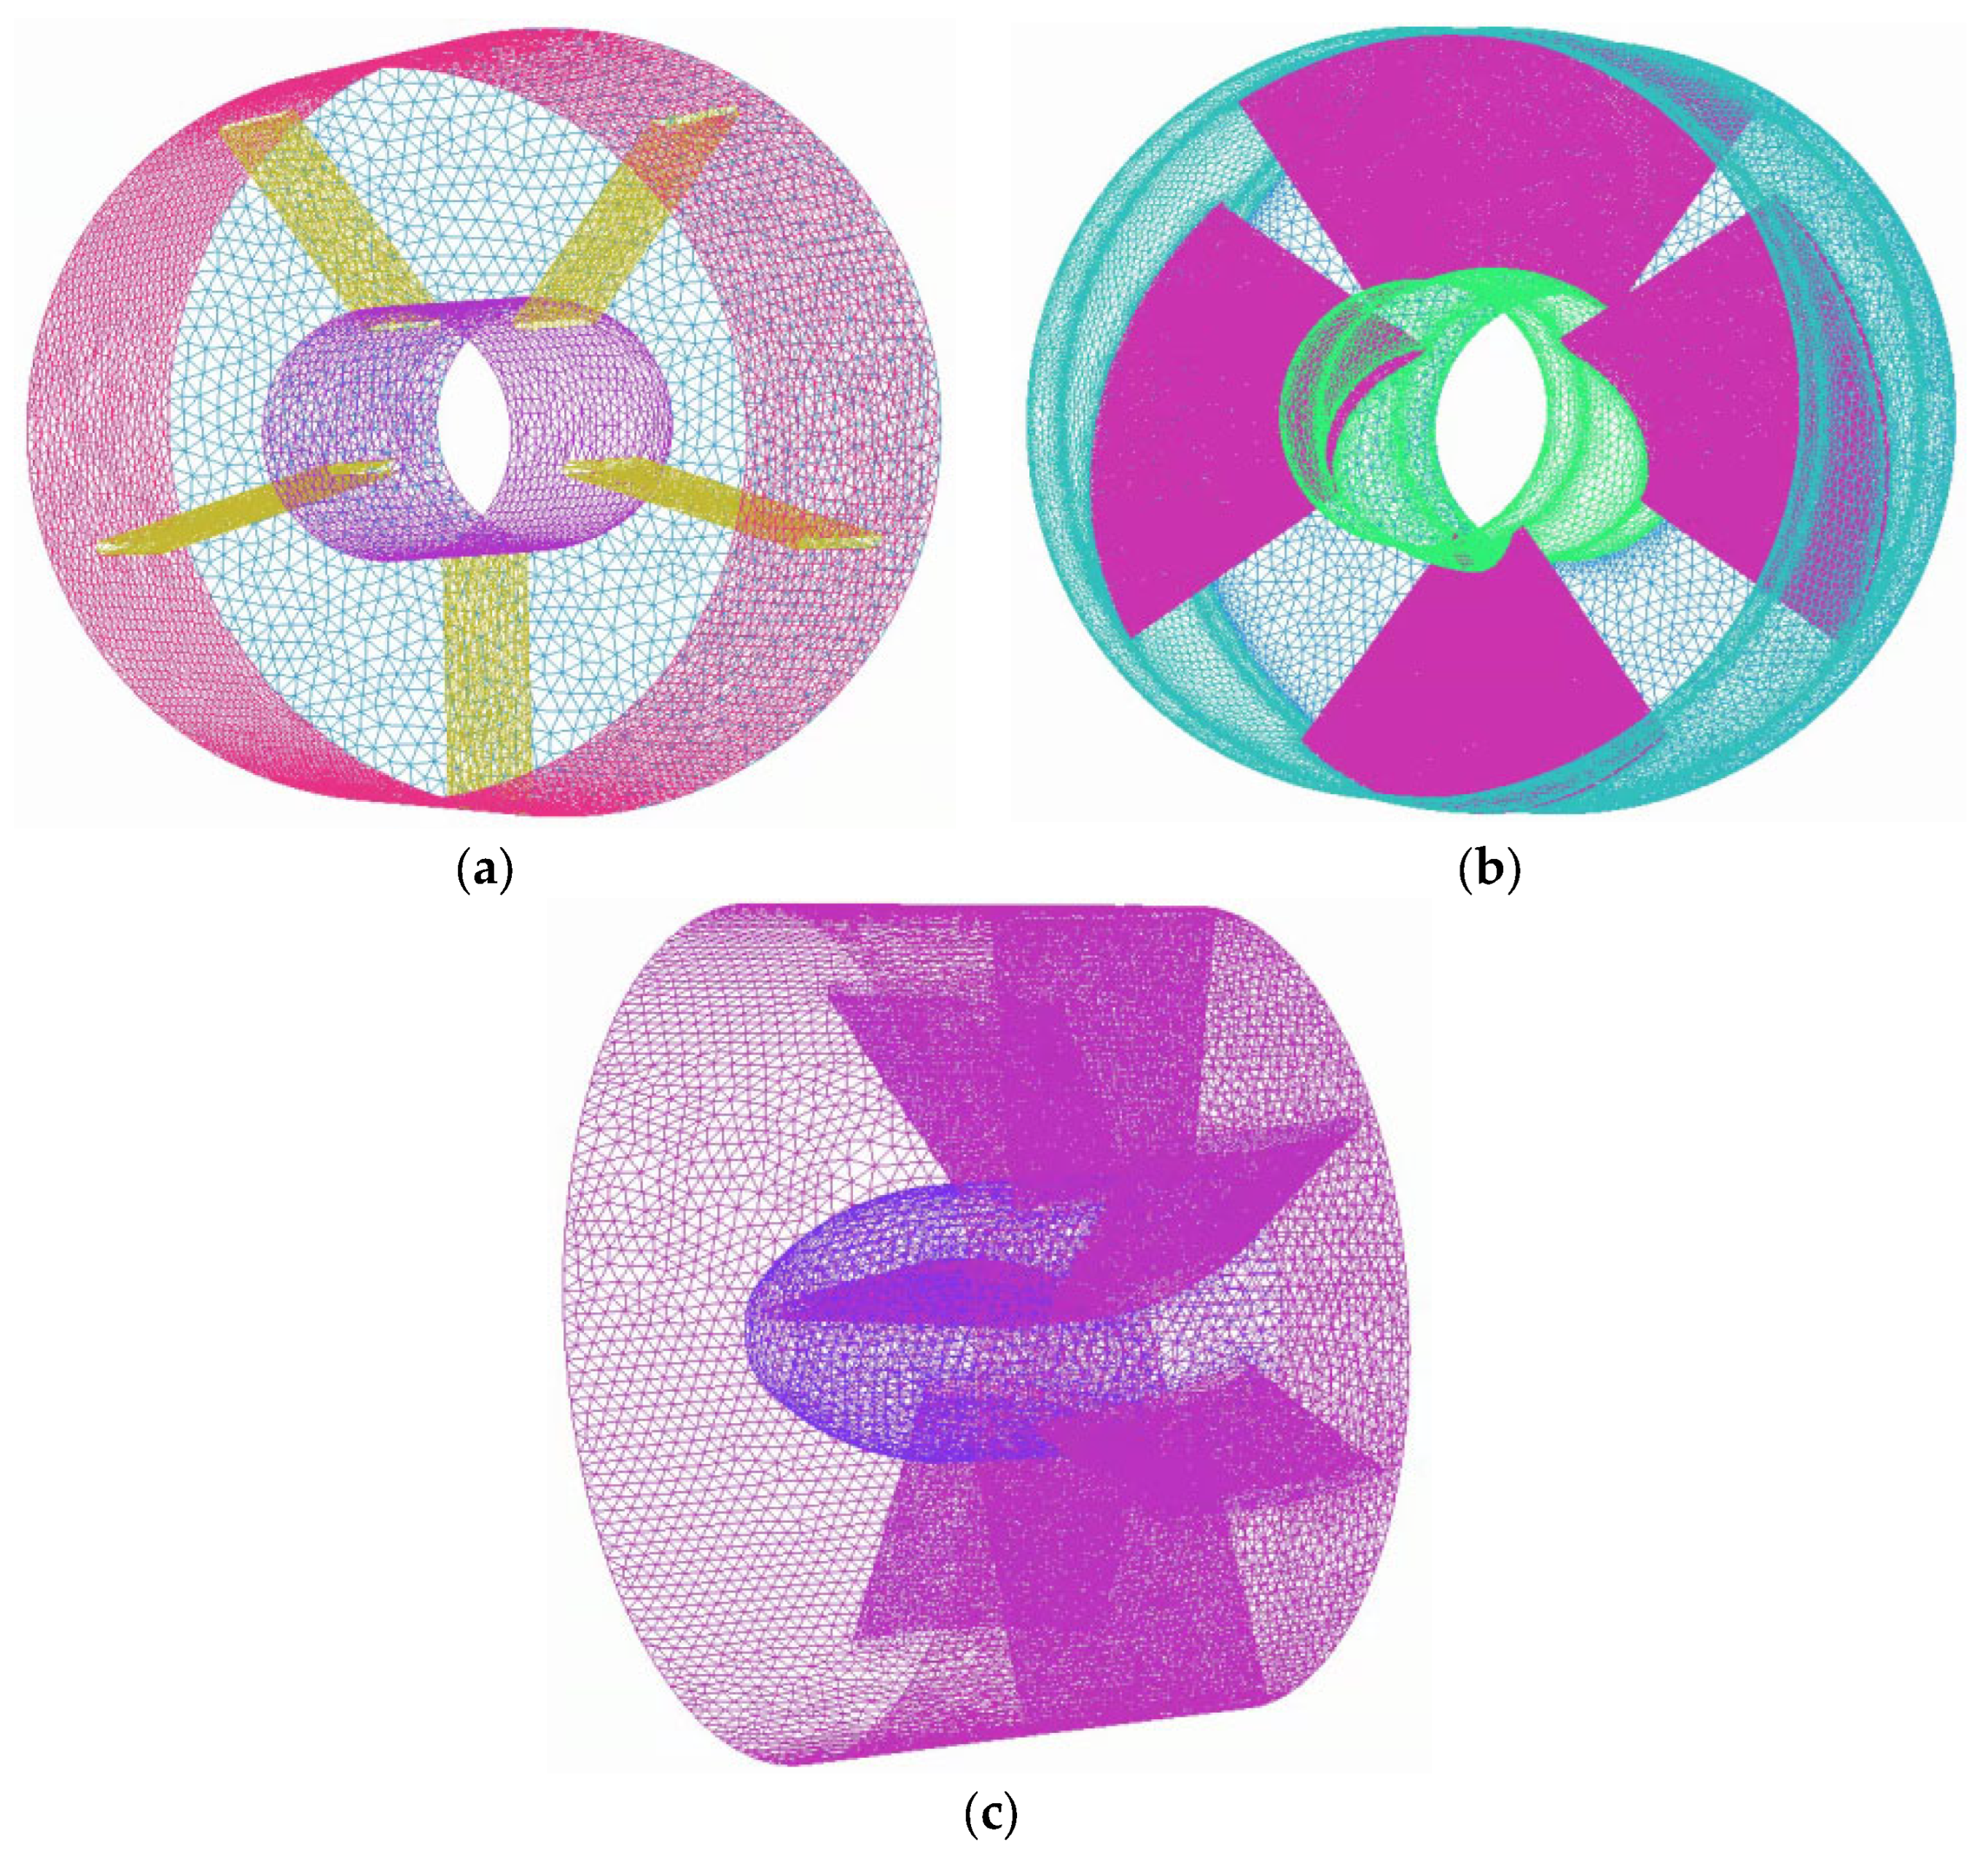
The fluid and solid domains are meshed separately. Due to the research model’s complexity and computational efficiency, the fluid domain is divided into adaptive meshes, and the runner blades are locally refined. The solid domain was meshed using the meshing module of the workbench platform, and an adaptive tetrahedral mesh divides the structure. Five mesh sizes were selected: 0.2, 0.1, 0.08, 0.02, and 0.002 m. The verification found that when the grid size reaches 0.02 m, the stress amplitude fluctuation is within 2%. When the grid size reaches 0.002 m, the stress fluctuation is not evident, and the number of structural grids is significant, requiring enormous computing resources. Therefore, a mesh size of 0.02 m was selected for solid domain meshing. Figure 3 shows the meshing of part of the fluid computing domain. Different colors are used to show different parts of the fluid computing domain, especially the blade section.
2.4. Numerical Setup and Monitoring Points
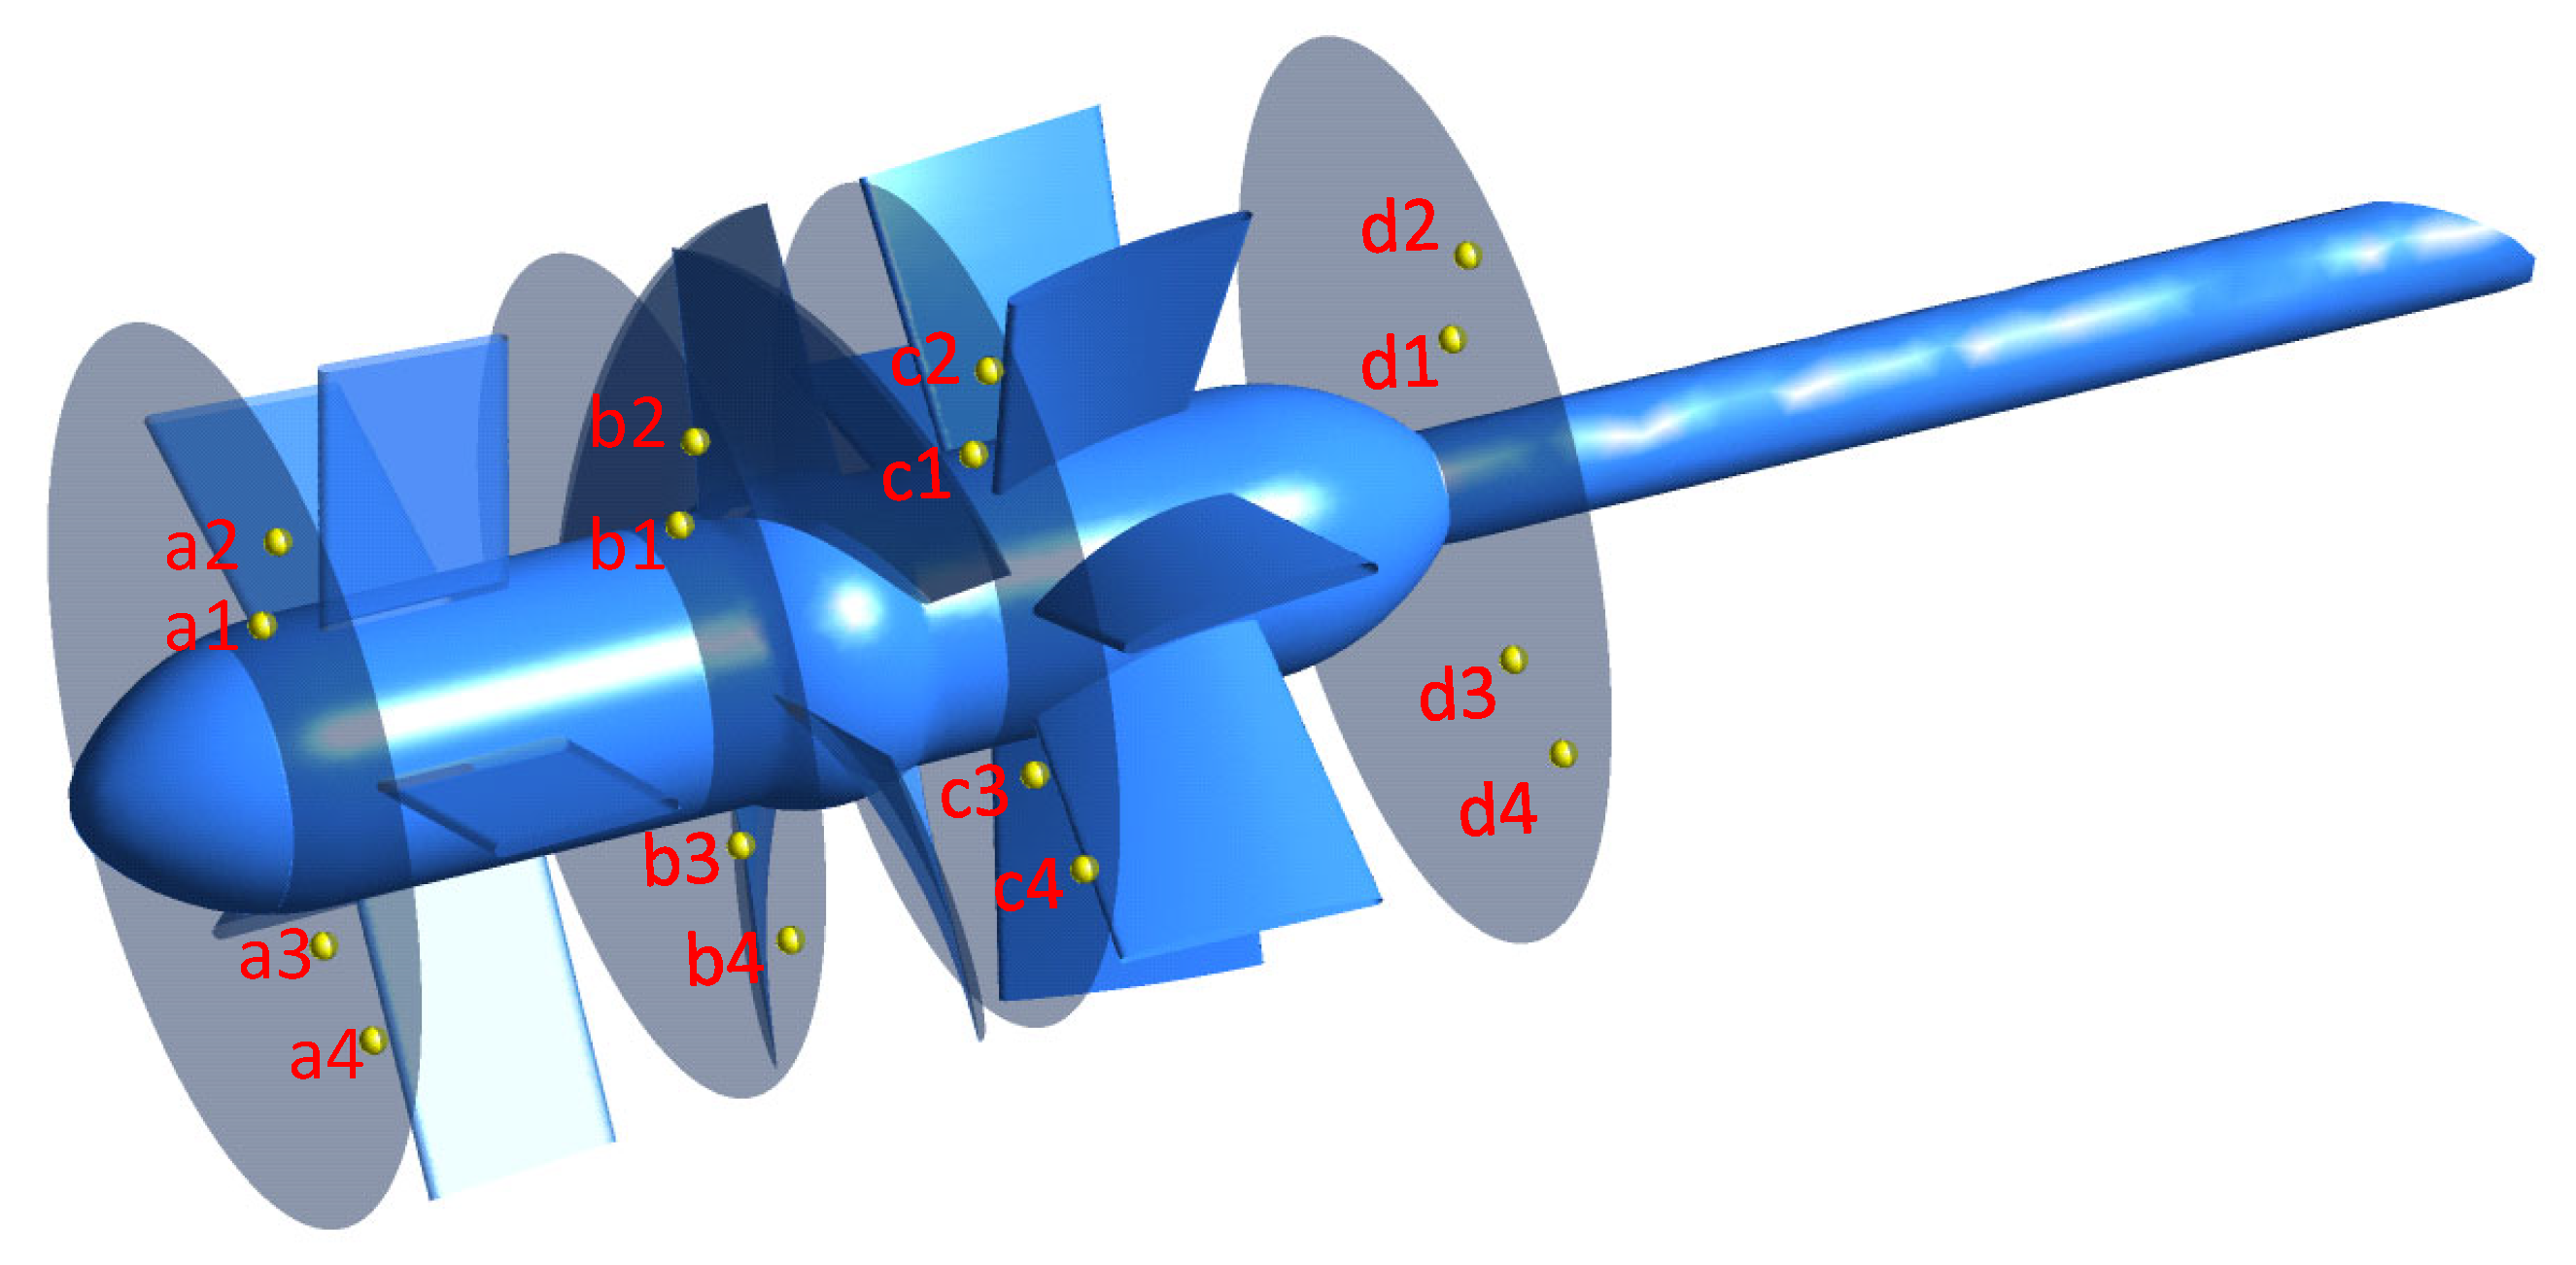
Figure 4 shows the layout of the computational model’s monitoring points. As shown in the figure, four monitoring surfaces are set, located at the inlet of the front guide vane, the inlet and outlet of the runner chamber, and the outlet of the movable guide vane. Four monitoring points are set on each monitoring surface, and 16 points are set to monitor the changes in the pressure pulsation on different interfaces in more detail. The monitoring points are distributed radially on different monitoring surfaces, and the angle between the two groups of monitoring points is 90°. The monitoring points a2 and b3 are located at the outer edge positions of each monitoring surface, consistent with the monitoring positions of the test arrangement.
The finite element method was used to calculate fluid field. ANSYS CFX was used for numerical simulation. The DES turbulence model was selected, which has been widely used in industrial applications [18,28]. We used the automatic wall function to set the solid wall as a no-slip wall. The numerical calculation precision is 10−4. The inlet and outlet boundary conditions are set as mass inlet and free outflow boundary conditions. When calculating the working conditions of the turbine in reverse, the inlet is the total pressure inlet, and the outlet is the static pressure outlet.
The steady-state calculation was performed on the model first, and the unsteady-state calculation was performed on the steady-state calculation results. In the unsteady calculation of the axial flow pump under various working conditions, sliding mesh technology was used in the runner body’s area. The runner’s rotating speed is 250 r/min, and one cycle is T = 1/n = 0.24 s. To ensure the stability of the setting analysis and facilitate calculation and analysis, the time step of the unsteady calculation is 0.002 s. The time step was verified by Courant number, which is defined by Equation (3), to verify the formula [28]. This paper’s sampling time for the unsteady calculation is 10 cycles to ensure the stability of the unsteady calculation results.
where L represents the smallest size of the grid cell, v is the biggest velocity of the main flow, and ∆t is the time step. The maximum speed in the runner is 22.4 m/s; the minimum mesh size L is more than 1 mm, and the time step is set to 0.002 s. Then, the calculated maximum Co is 44.8, which satisfies the time-step independence.
2.5. Sound Field Calculation
The numerical solutions of induced noise include the direct and indirect boundary element methods. The acoustic boundary element method based on the wave equation can solve the low-frequency noise very well. The direct boundary element method to solve acoustic problems requires that the mesh boundaries used in the calculation must be completely closed, while the indirect boundary element method is relatively flexible and has a wider range of applications. Considering that the axial flow pump is not completely closed in the actual operation process, this paper adopts the indirect boundary element method for calculation. The indirect method combines computational fluid dynamics and computational acoustics solutions. Compared with the direct method, it has lower requirements on discrete scheme, turbulence model, and boundary conditions [13]. Its governing equation is the Lighthill acoustic analogy equation,
where ρ is the fluid density (kg/m3), is the average density (kg/m3), t is time (s), and is the speed of sound. and both represent spatial coordinates; represents the Lighthill stress tensor; f represents the solid boundary function, and ∇ represents the Laplace operator. p represents the flow field pressure (Pa); represents the time-averaged pressure value (Pa), and is the Kronecker function.
The three components on the right-hand side of the equation are the effects of quadrupole, dipole, and monopole sources on the flow-induced noise. The surface pulsation excitation causes the dipole source, and the flow-induced noise inside the pump is not cavitated. The noise sources are primarily dipole sound [20]. The dipole sound source inside the axial flow pump is primarily the vane-rotating dipole sound source. This paper focuses on the flow-induced noise caused by it.
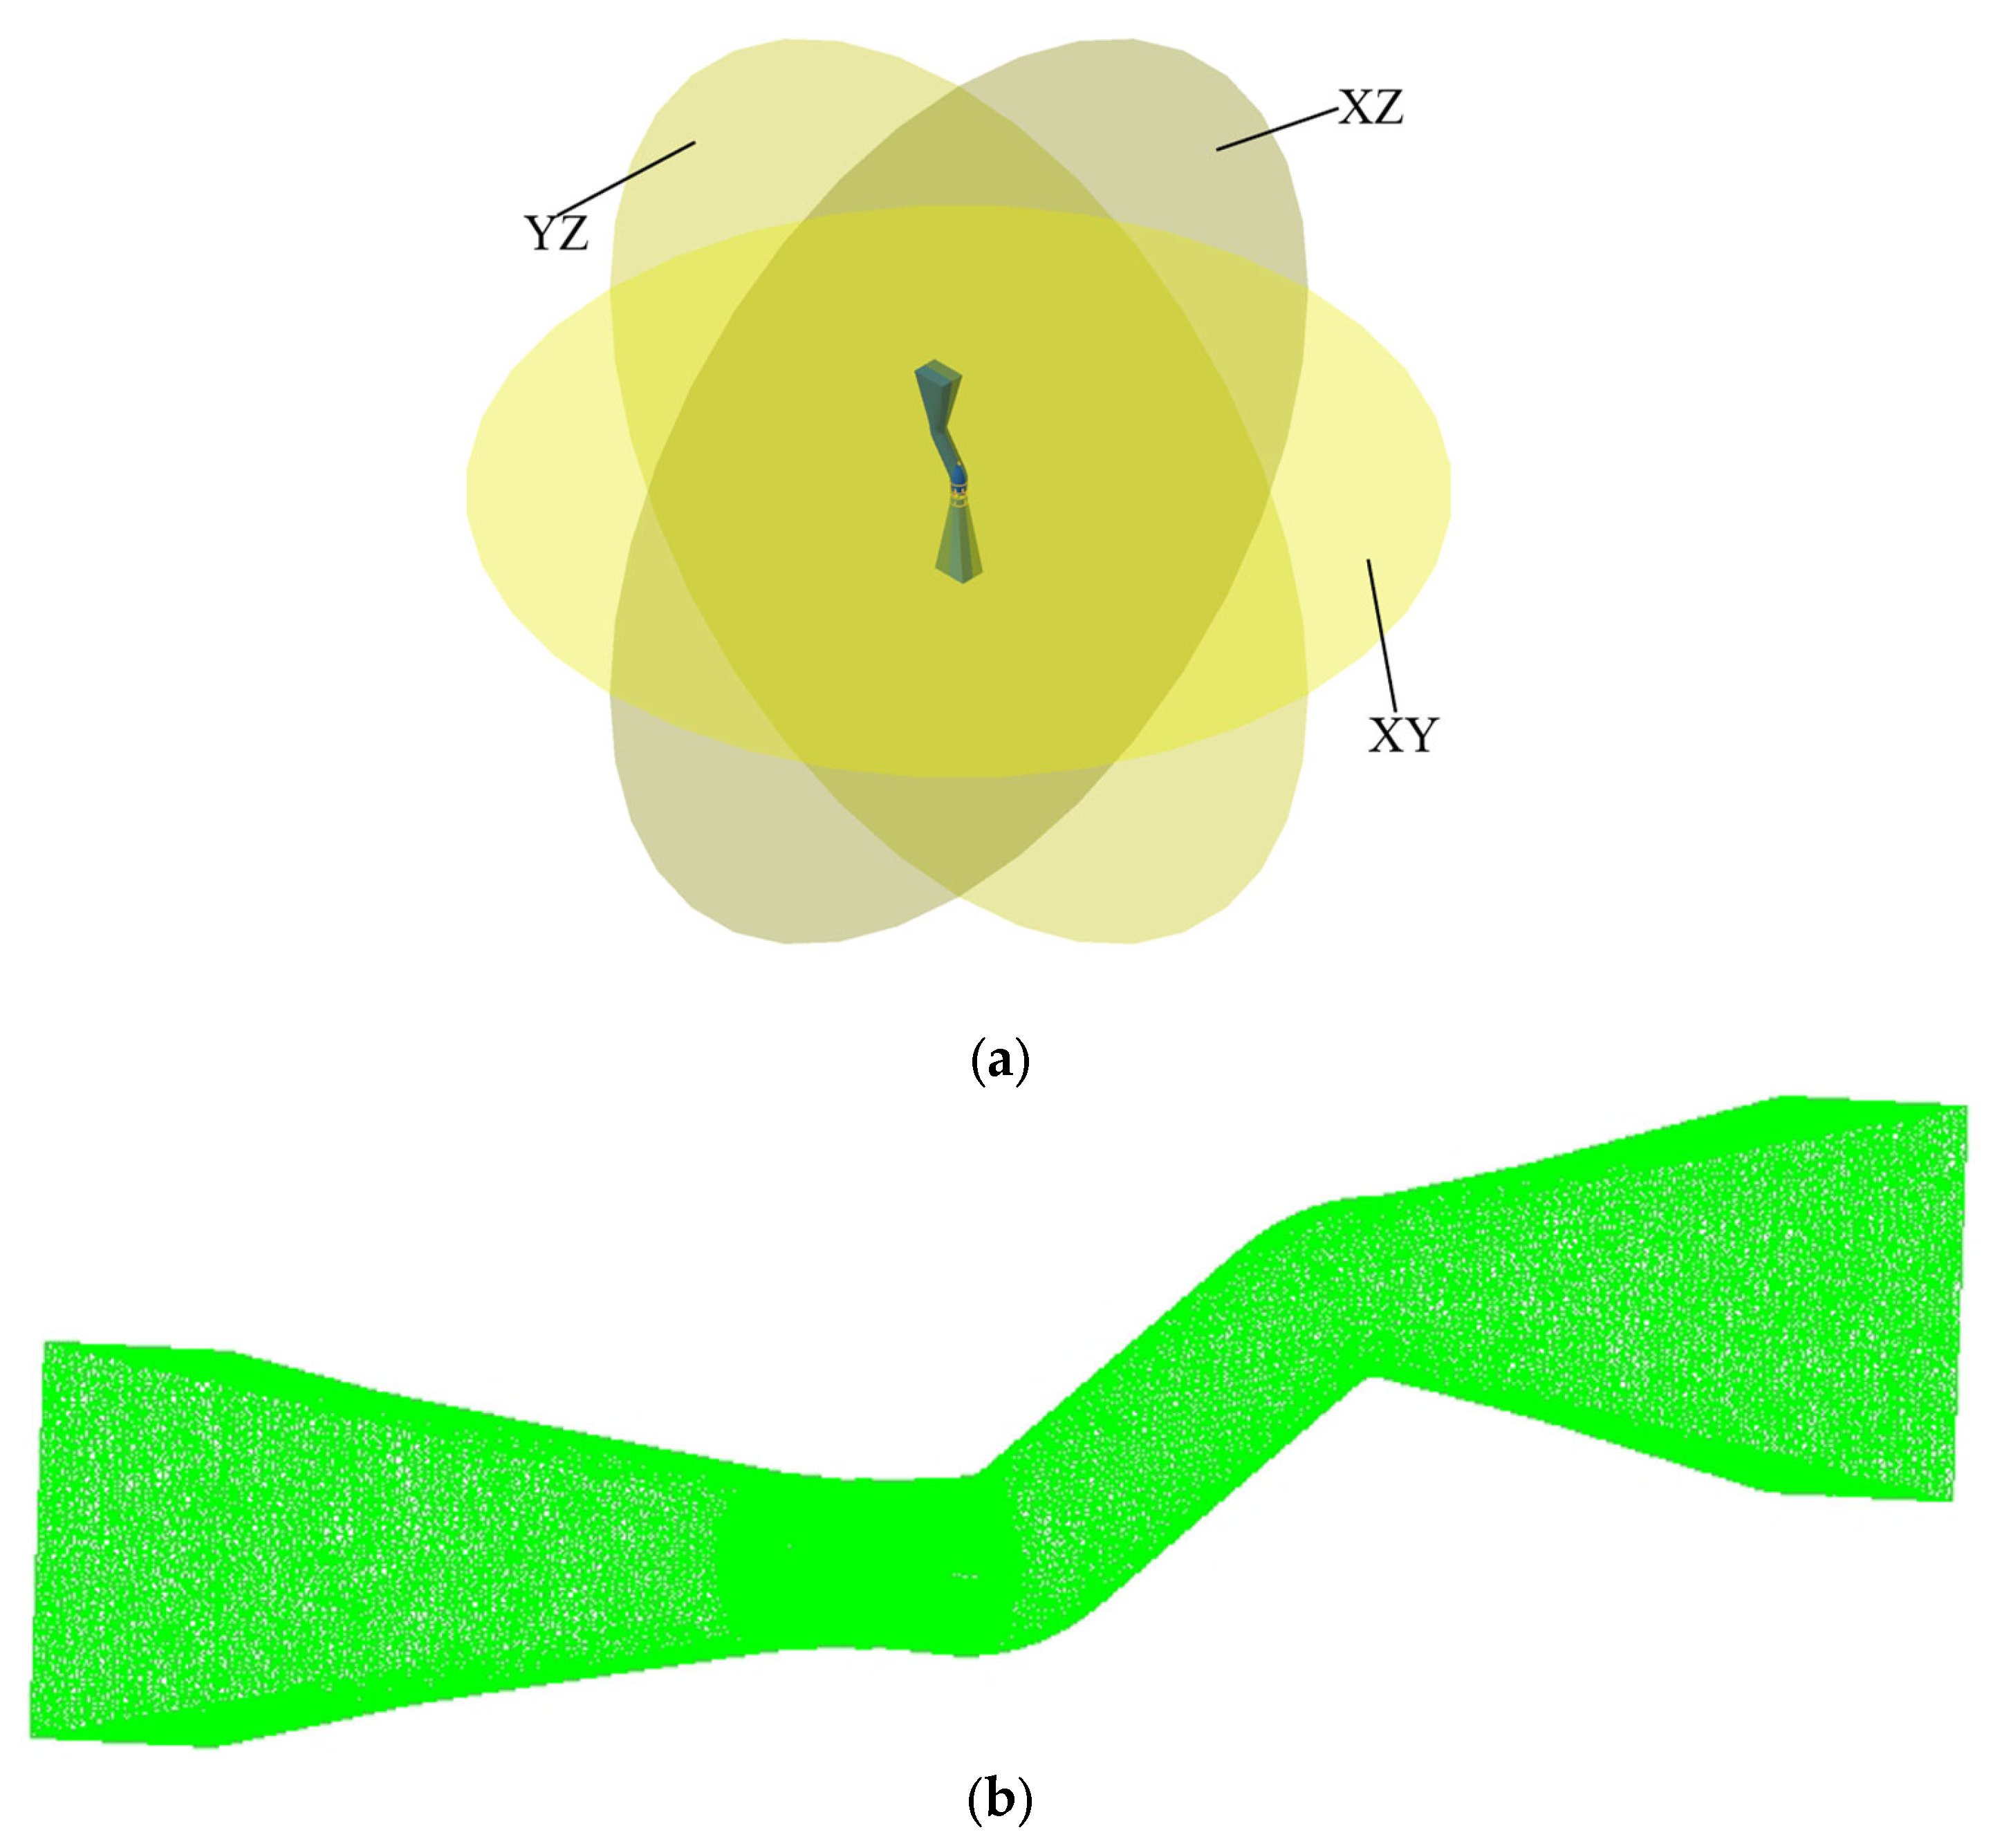
The sound propagation is directional; therefore, the distance and direction of the sound field point setting relative to the sound source will directly affect the spectral noise distribution [17]. To comprehensively study the directional distribution and radiation level of the flow-induced noise of the axial flow pump, with the center of rotation of the runner as the circle’s center, a circular surface with a distance of 50 m from the runner’s center was established on the XY plane, XZ plane, and YZ plane. Figure 5a shows that each surface is radially divided into 12 circumferential directions; a monitoring point is arranged every 10° in each circumferential direction, and 36 monitoring points are arranged on each surface to obtain the axial flow pump’s circumferential sound pressure level distribution law. Figure 5b shows the acoustic calculation grid. For the solution of the indirect boundary element model, it is generally assumed that there are at least six grid cells in the acoustic wave in order to ensure sufficient accuracy of the calculation. It is assumed that the sound velocity in the medium is c, and the length of a single small cell is L. The linear grid cell was used for calculation, and the length of the grid cell of the boundary element satisfies the calculation requirements as follows:
In this paper, cwater is 1500 m/s, and cair is 340 m/s. Because the time step set in the unsteady calculation is 0.002 s, fmax is 500 Hz. Then, it can be obtained that L must be less than 113 mm. The maximum grid size is 60 mm, which provides a good calculation. The total number of grids is 1.2 million. The material selected for the blade part is ZG06Cr13Ni4Mo; the density is 7730 kg/m3; the pump water body is used as the inner sound field, and the external air is set as the outer sound field. The sound wave propagation speed in the inner sound field is 1500 m/s, and the sound wave propagation speed in the air is 340 m/s. The medium of the internal sound field is water, whose density is 1000 kg/m3, and the water temperature is 25 °C. The medium of the external sound field is air, whose density is 1.255 kg/m3.
3. Test Verification
3.1. External Characteristic Test
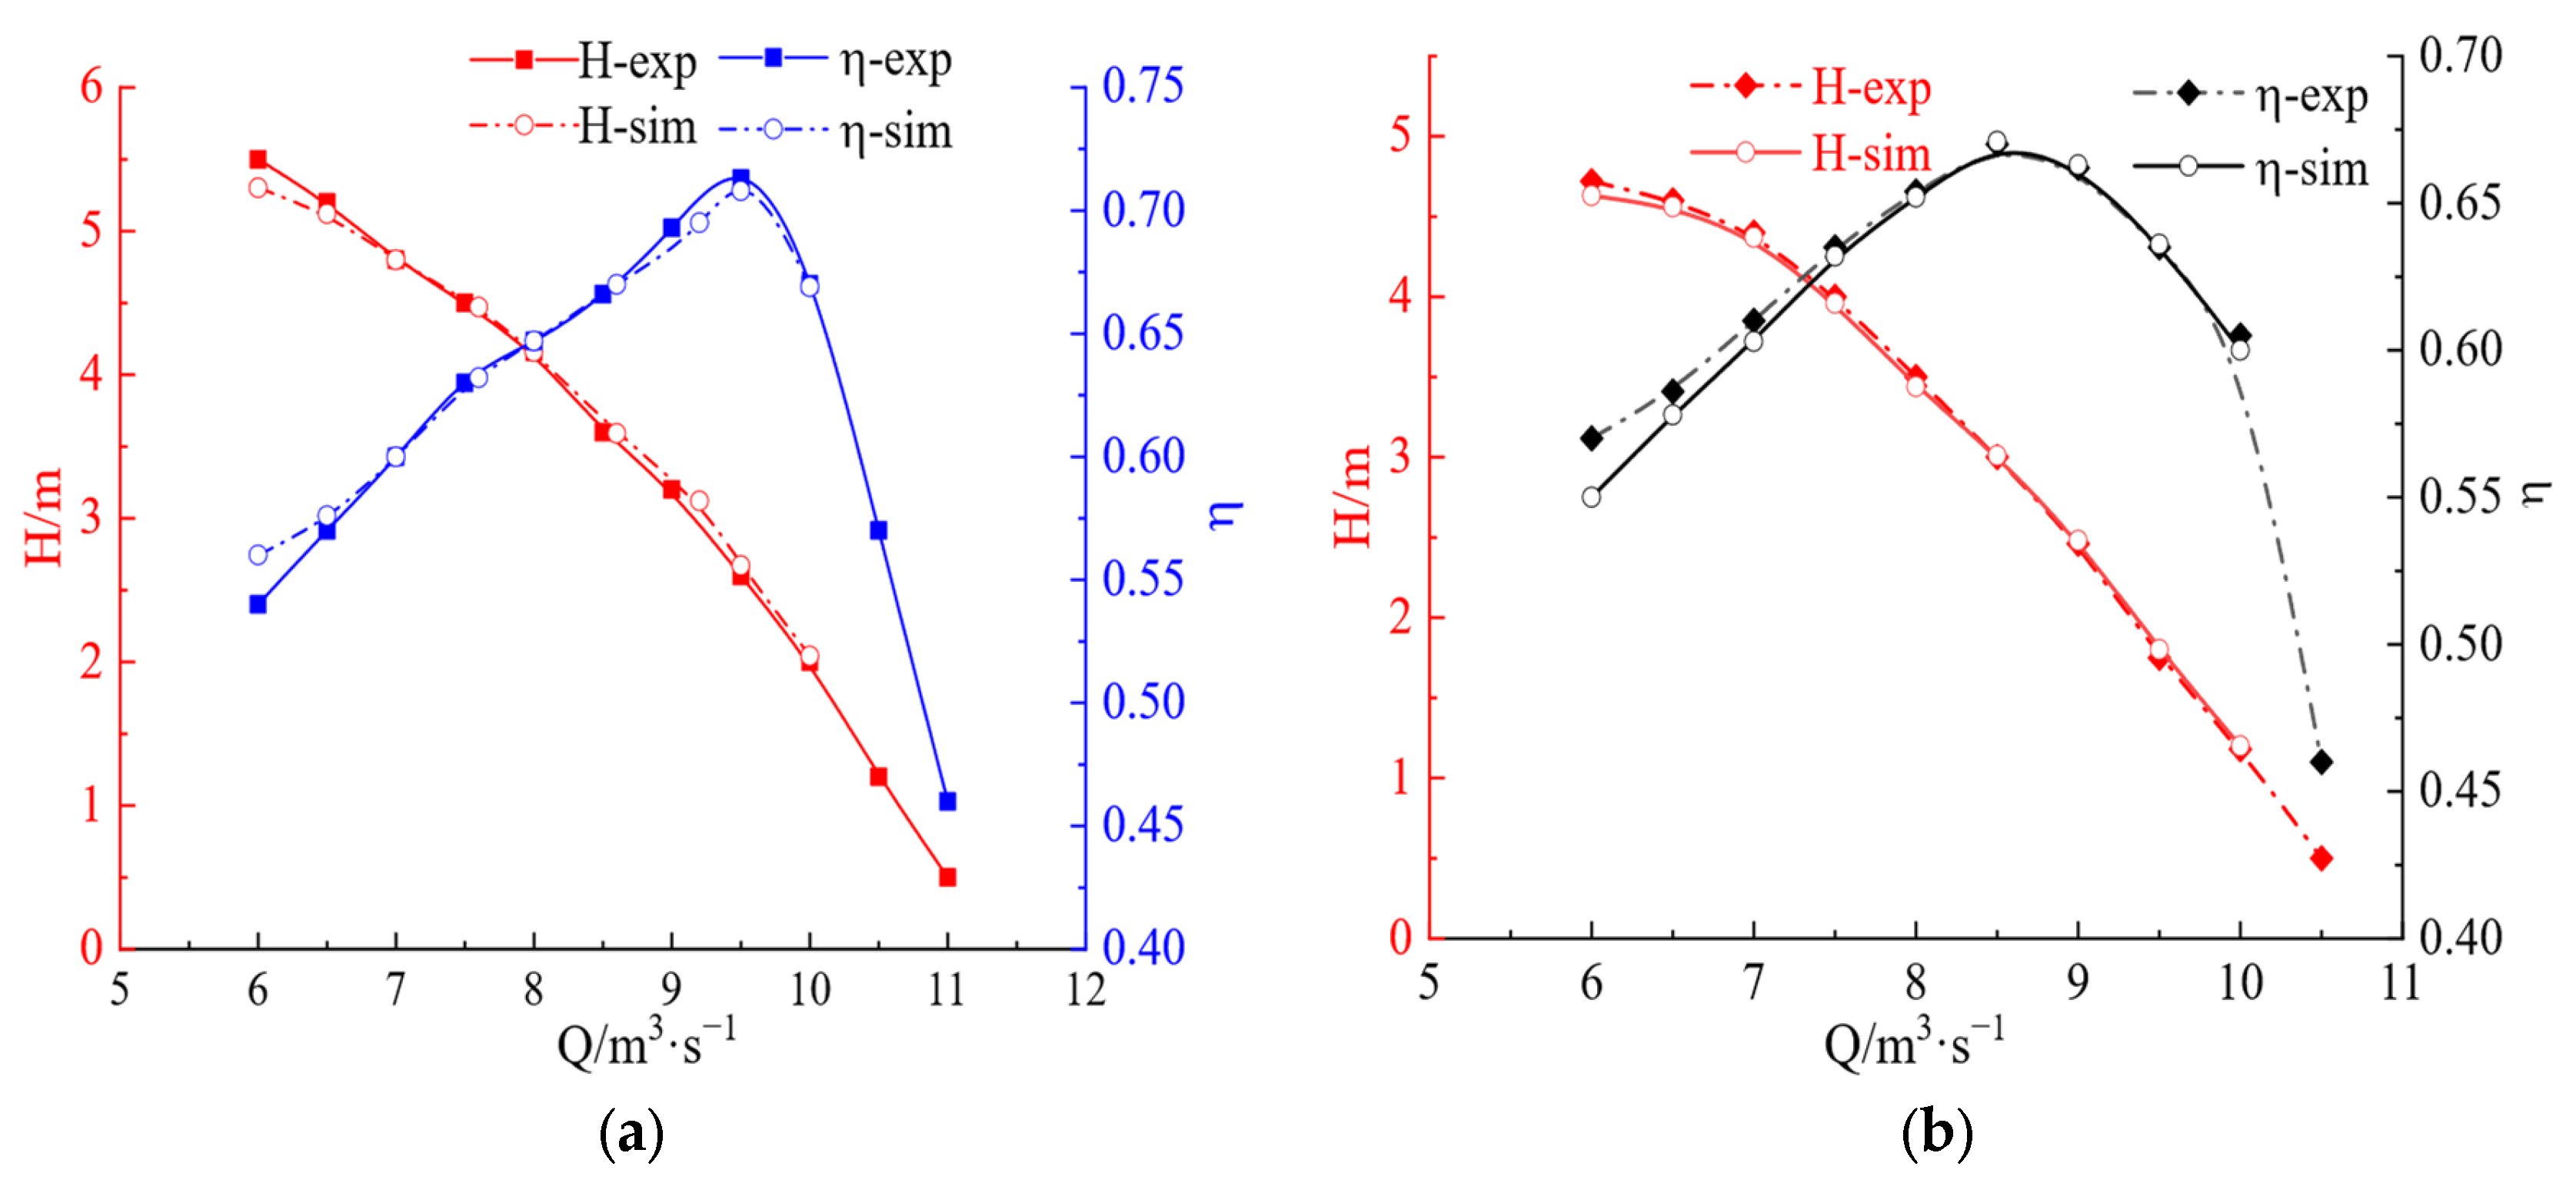
Several operating points under the pump and turbine conditions were selected to verify the accuracy of the numerical simulation results, and the external characteristic curve obtained from the numerical simulation was drawn. Figure 6a,b show the external characteristic curves of the axial-flow pump during forward and reverse operation, respectively. Compared with the characteristic curve of the prototype unit obtained from the experiment, some deviation occurs in the efficiency at a low flow rate; the maximum deviation is within 3%, and the head is slightly lower than the experimental result. The results are close to the experimental values. Due to the calculation model’s deviation, the prototype pump’s local structure, and the influence of the number of meshes, some deviations in the numerical simulation results are inevitable. In general, the simulation results correlate well with the experimental values, and the head and efficiency of the numerical simulation are consistent with the performance trends of the experimental measurements. Therefore, this paper’s numerical simulation results have credibility.
3.2. Pressure Pulsation Test
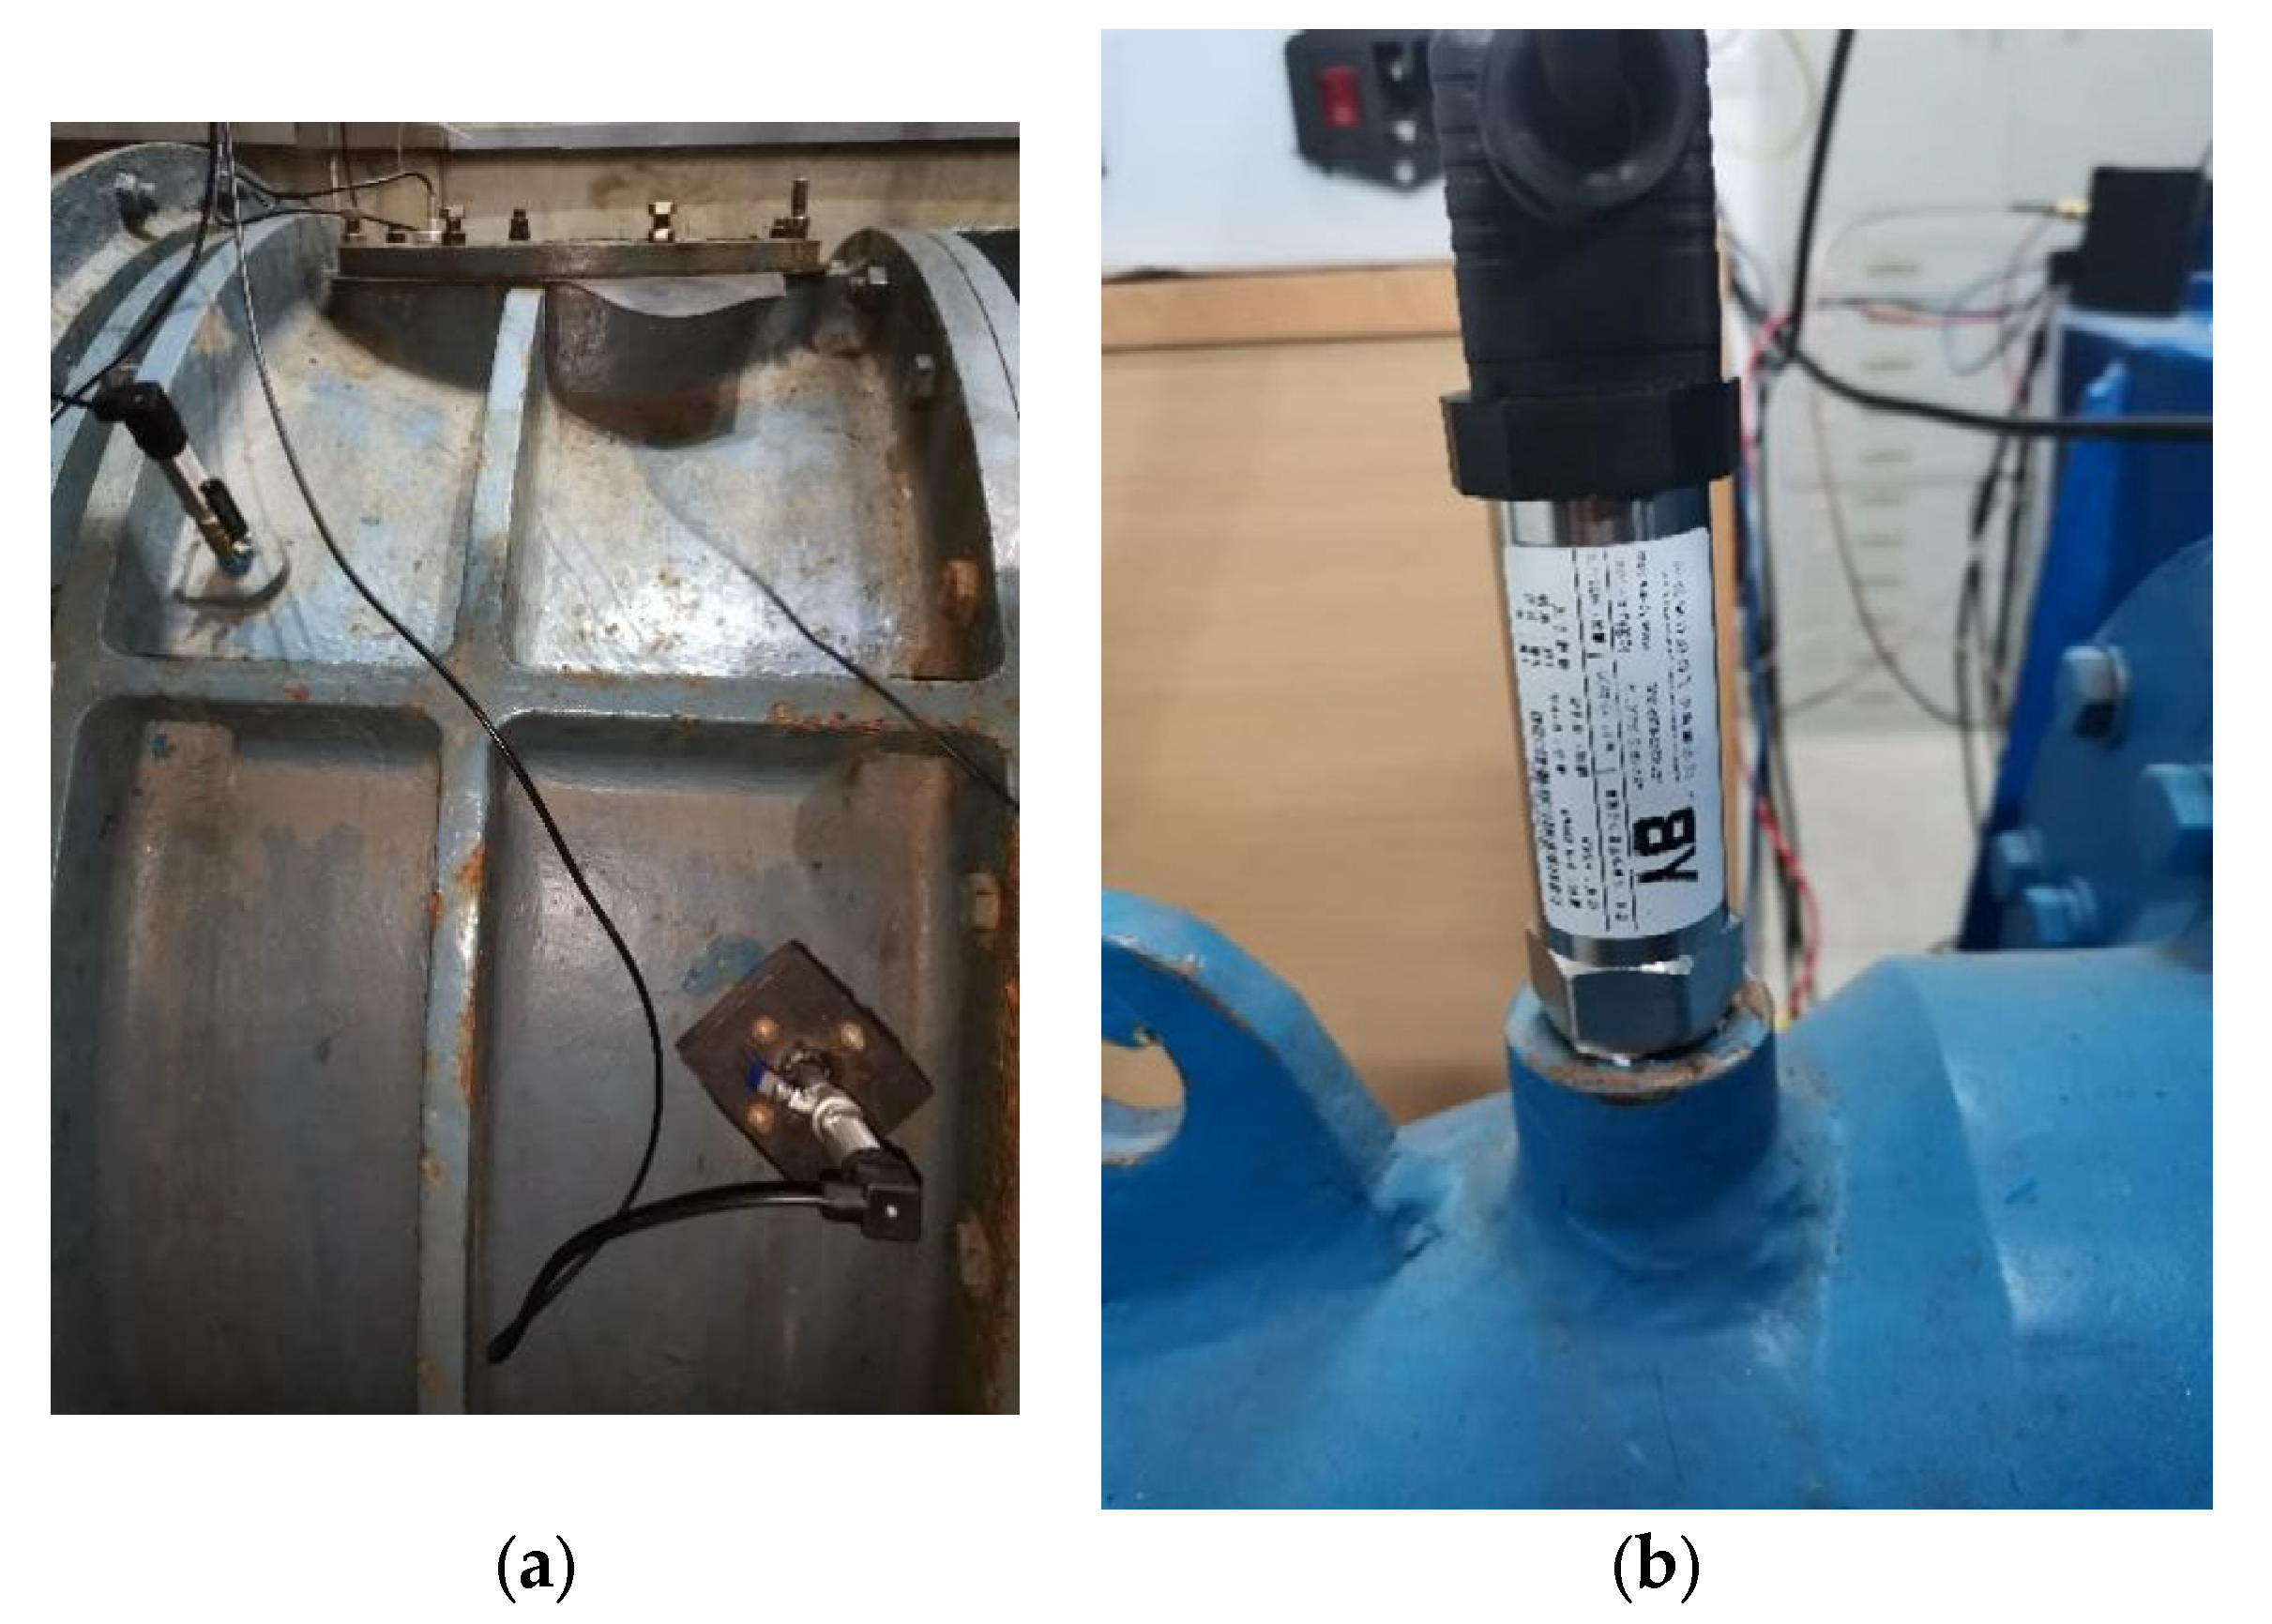
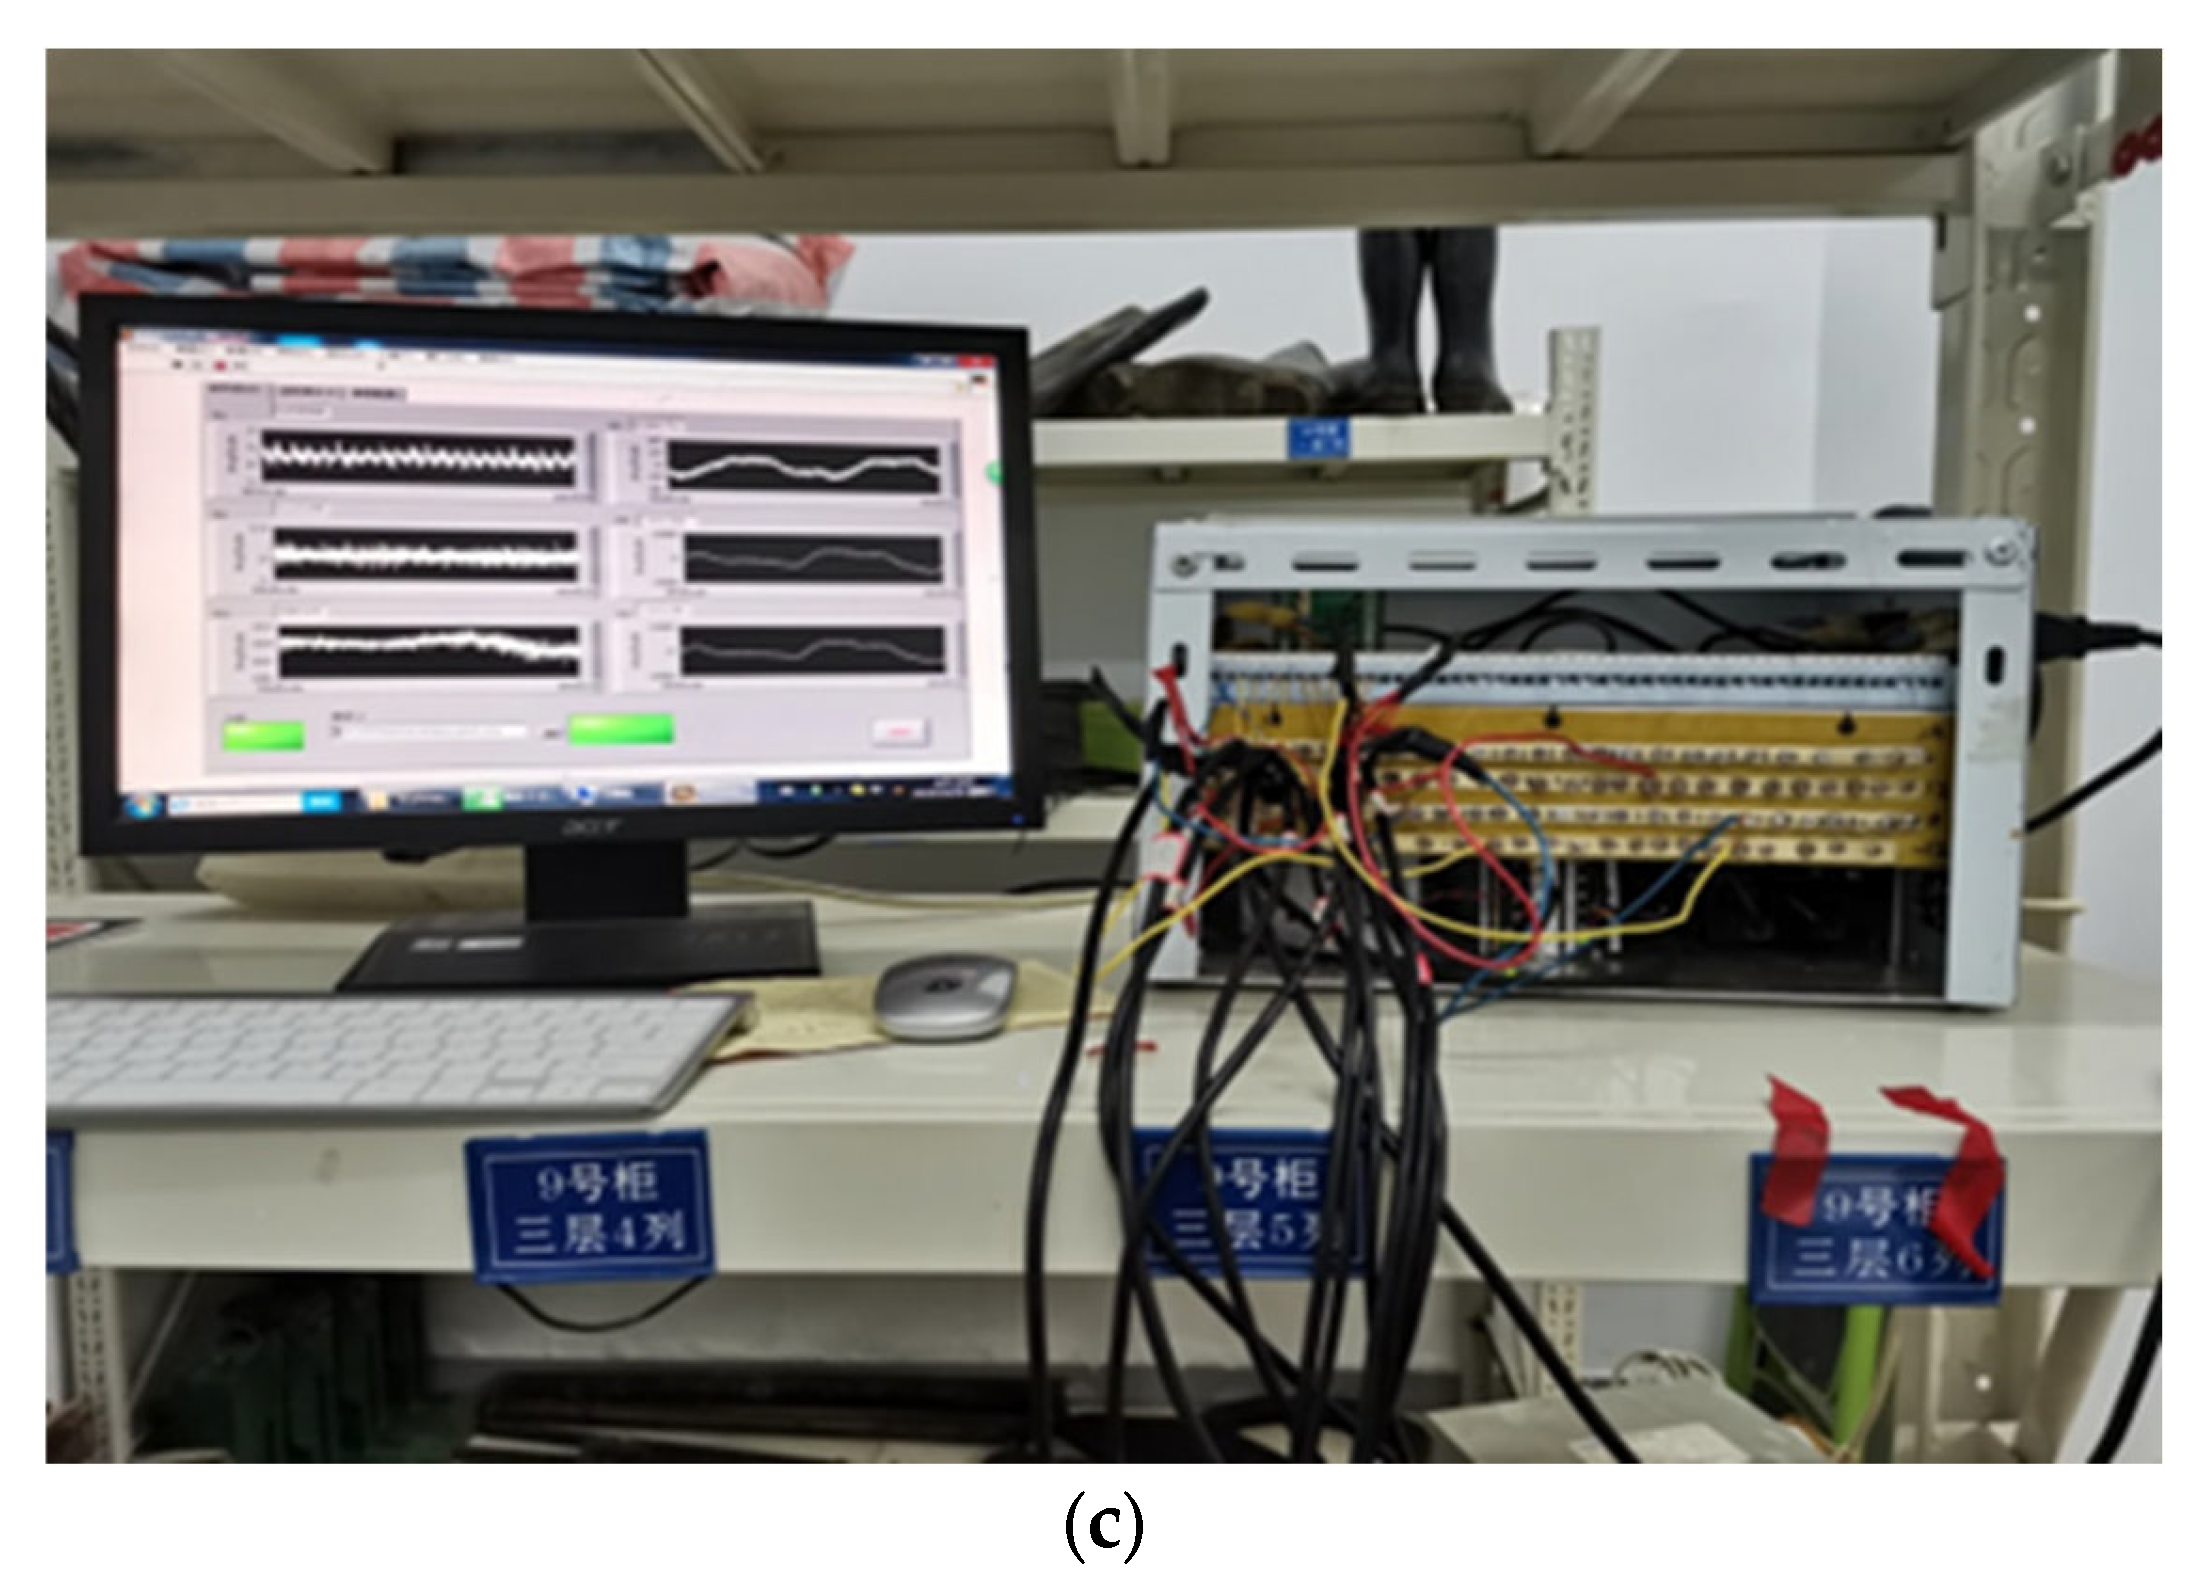
Figure 7 shows the site layout during the test of a pumping station, including the layout of pressure pulsation monitoring points, the selected pressure pulsation sensor, and onsite measuring instruments. Restricted by the natural and working environments, the actual machine test selects the test when the speed is 250 r/min. Because the real machine test cannot open holes at random in the unit, according to the unit’s characteristics, holes are opened at the front end of the front guide vane and the front end of the runner. We selected the outer edge of the inlet of the leading vane and the outer edge of the inlet of the runner chamber as the pressure pulsation test points. The specific arrangement is shown in Figure 7a. During the test, we ensured that the pressure sensor was placed vertically with the pipeline. This paper selected the HPT900 high-frequency dynamic pressure sensor provided by Kunshan Yubin Electronic Technology Co., Ltd. (Suzhou China). with an accuracy of 0.5%. Figure 7b shows the pressure sensor arrangement.
The pressure pulsation test’s sampling frequency is 1000 Hz; therefore, the sampling time interval is 0.001 s. Because it is an actual machine test measurement, we first measured the nonrunning state of the unit for 30 s after debugging the instrument, and then we turned on the unit and directly recorded the pressure pulsation during the entire process from startup to shut down.
4. Results
4.1. Comparison of Experiment and Simulation
The local average pressure and impeller parameters were normalized to the pressure data to eliminate the influence of position, and the formula is as follows:
where p is the local static pressure (Pa), is the average pressure (Pa), u is the peripheral velocity of the impeller outlet (m/s), and ρ is the density of water (1000 kg/m3).
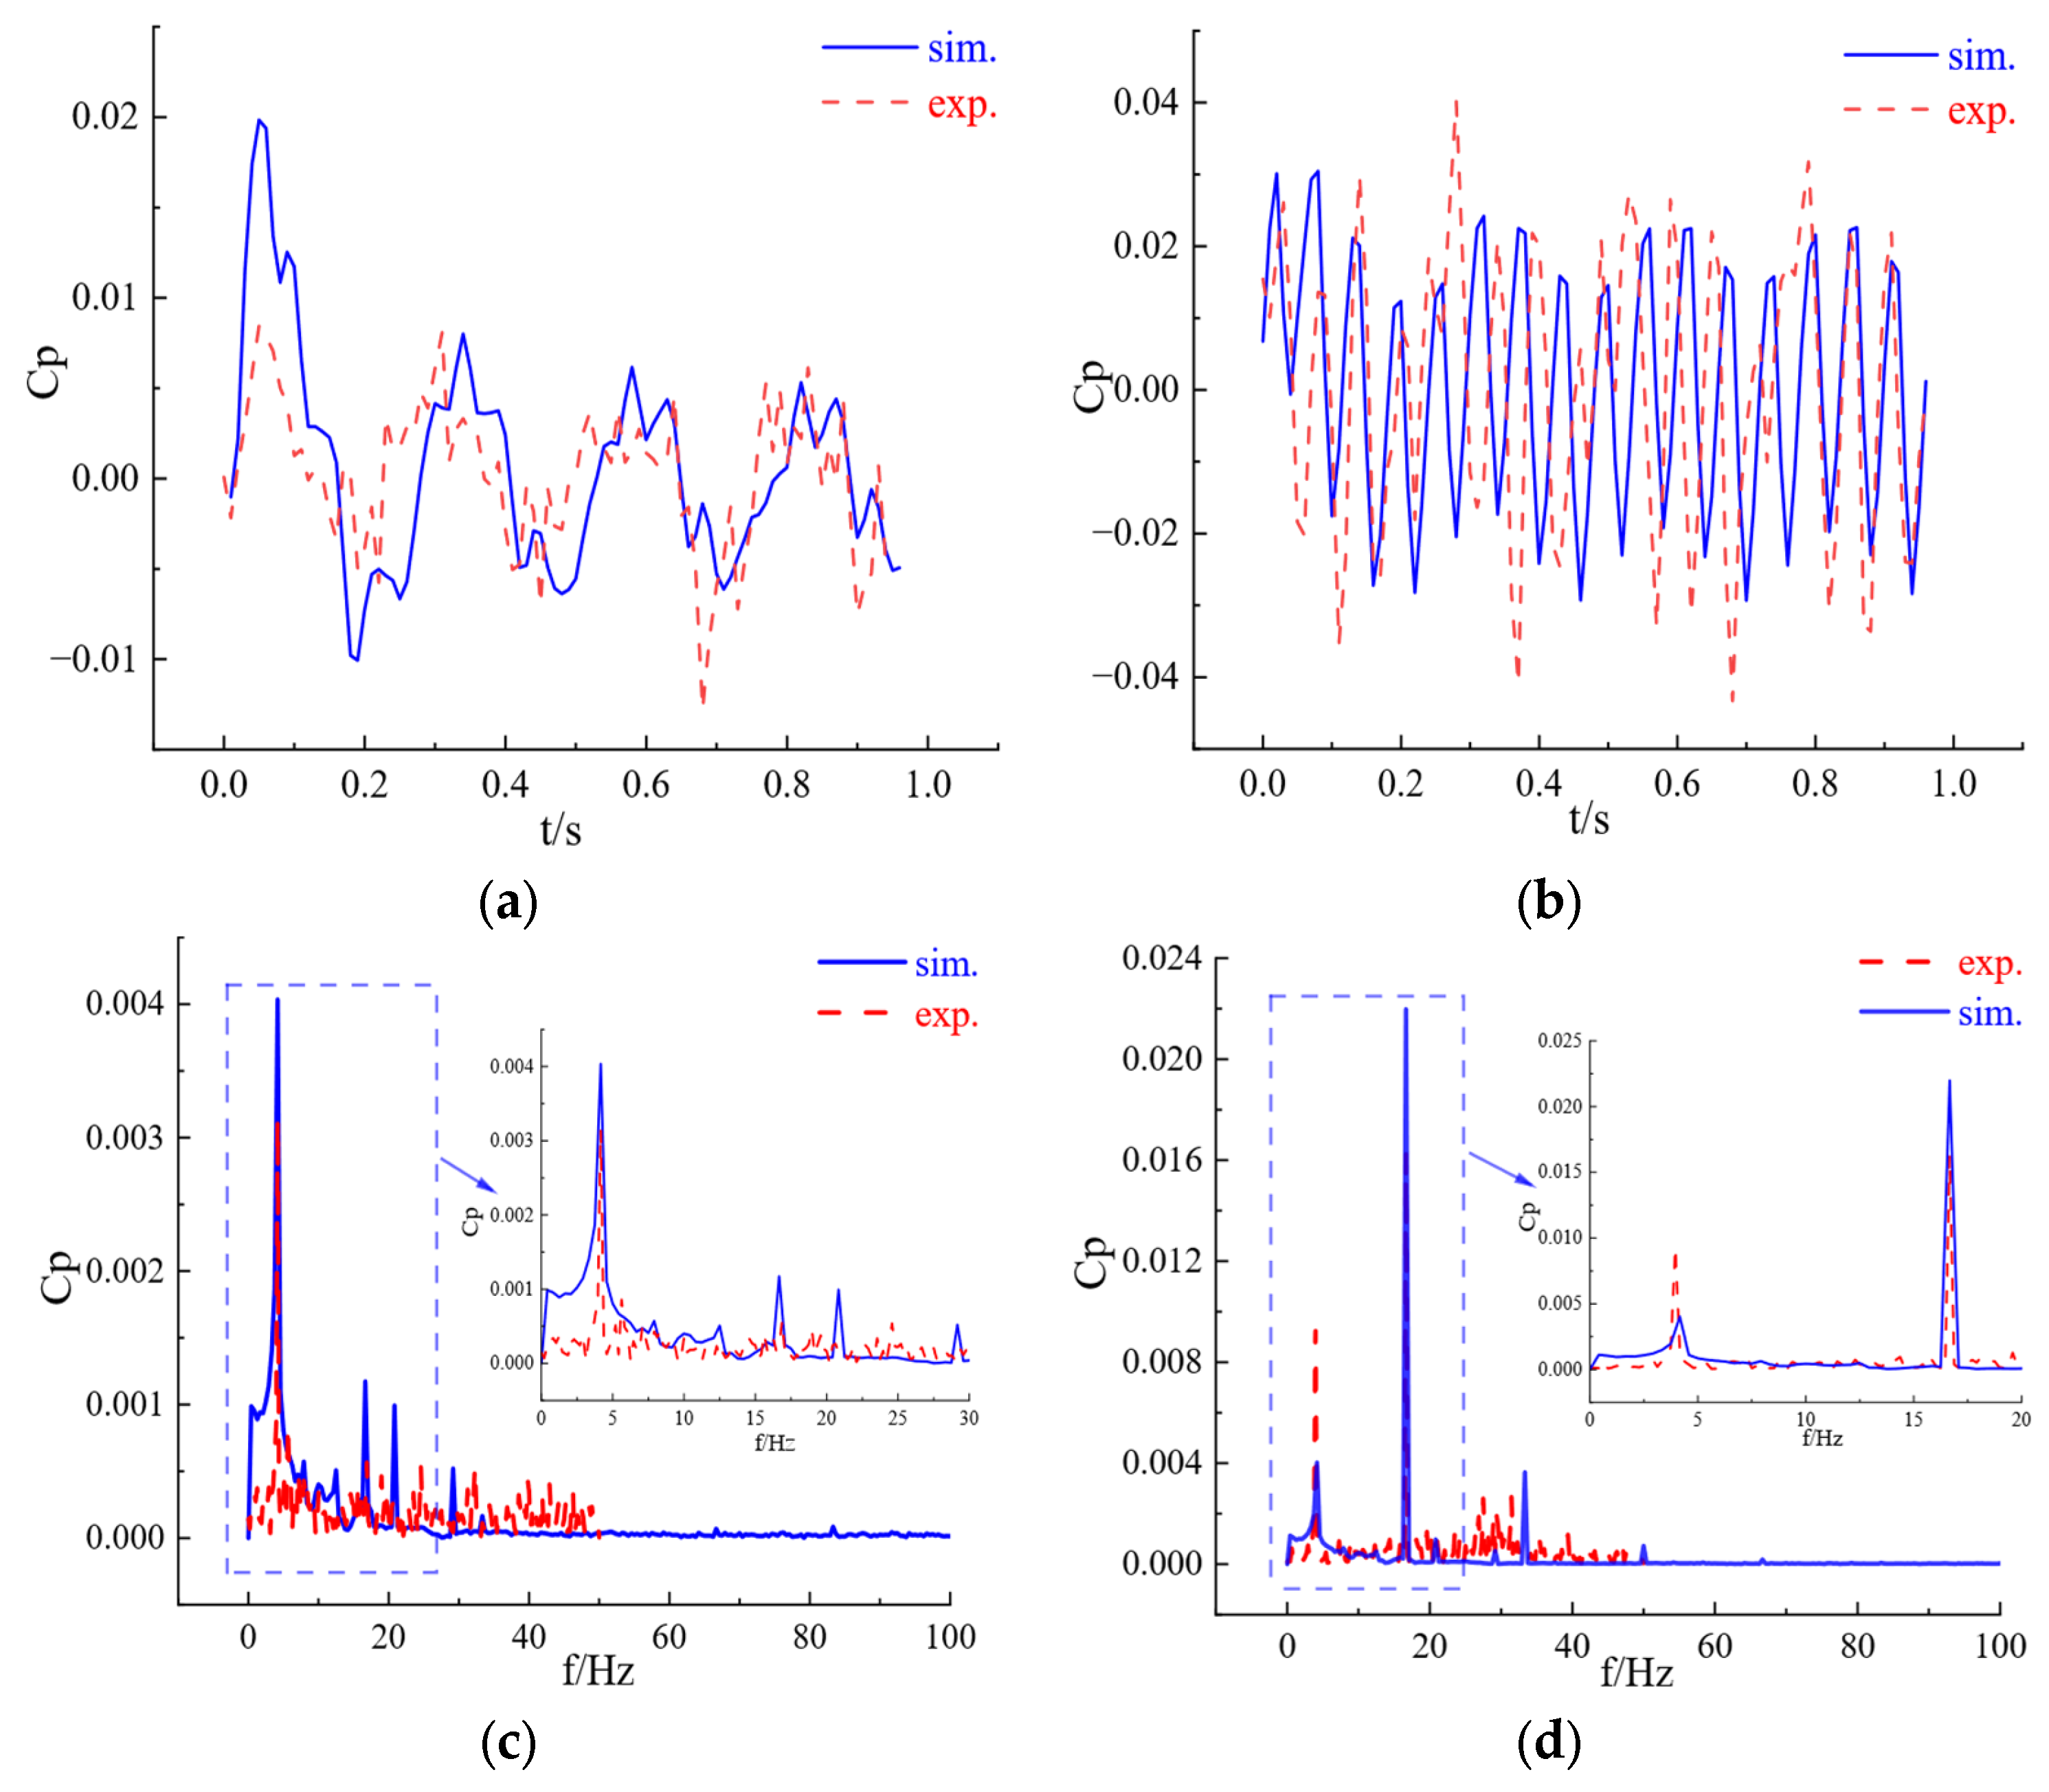
In this paper, the pressure pulsation at the runner’s inlet and the front guide vane’s inlet is measured using the actual machine test; the monitoring points are arranged at the inlet position’s outer edge, and the numerical simulation results are compared with the measured values of the actual machine test. Figure 8 shows the comparison results, which are the time domain and frequency domain graphs of the pressure pulsation obtained from the experiment and numerical simulation, respectively. From the figure, the results of the actual machine test correlate well with the results obtained from the numerical simulation. Figure 8a,b show some deviation between the test results and the numerical simulation results, and a difference occurs in the pressure pulsation amplitude when changing with time. From Figure 8c,d, the simulation’s frequency domain distribution of the pressure pulsation obtained is consistent with the experiment. The primary frequency at the leading position is the rotation frequency; the frequency at the runner’s inlet is the blade-passing frequency, and the rotation frequency is twice the secondary frequency. Due to the slight deviation in the position of the monitoring points, the influence of the calculation grid on the results and the related disturbances on the site might cause deviations in the results; however, the amplitude deviation is within 5%, within a reasonable range and acceptable. Therefore, it is considered that the numerical simulation results are consistent with the experiments, and the numerical simulation results are trustworthy.
4.2. Flow Field Analysis
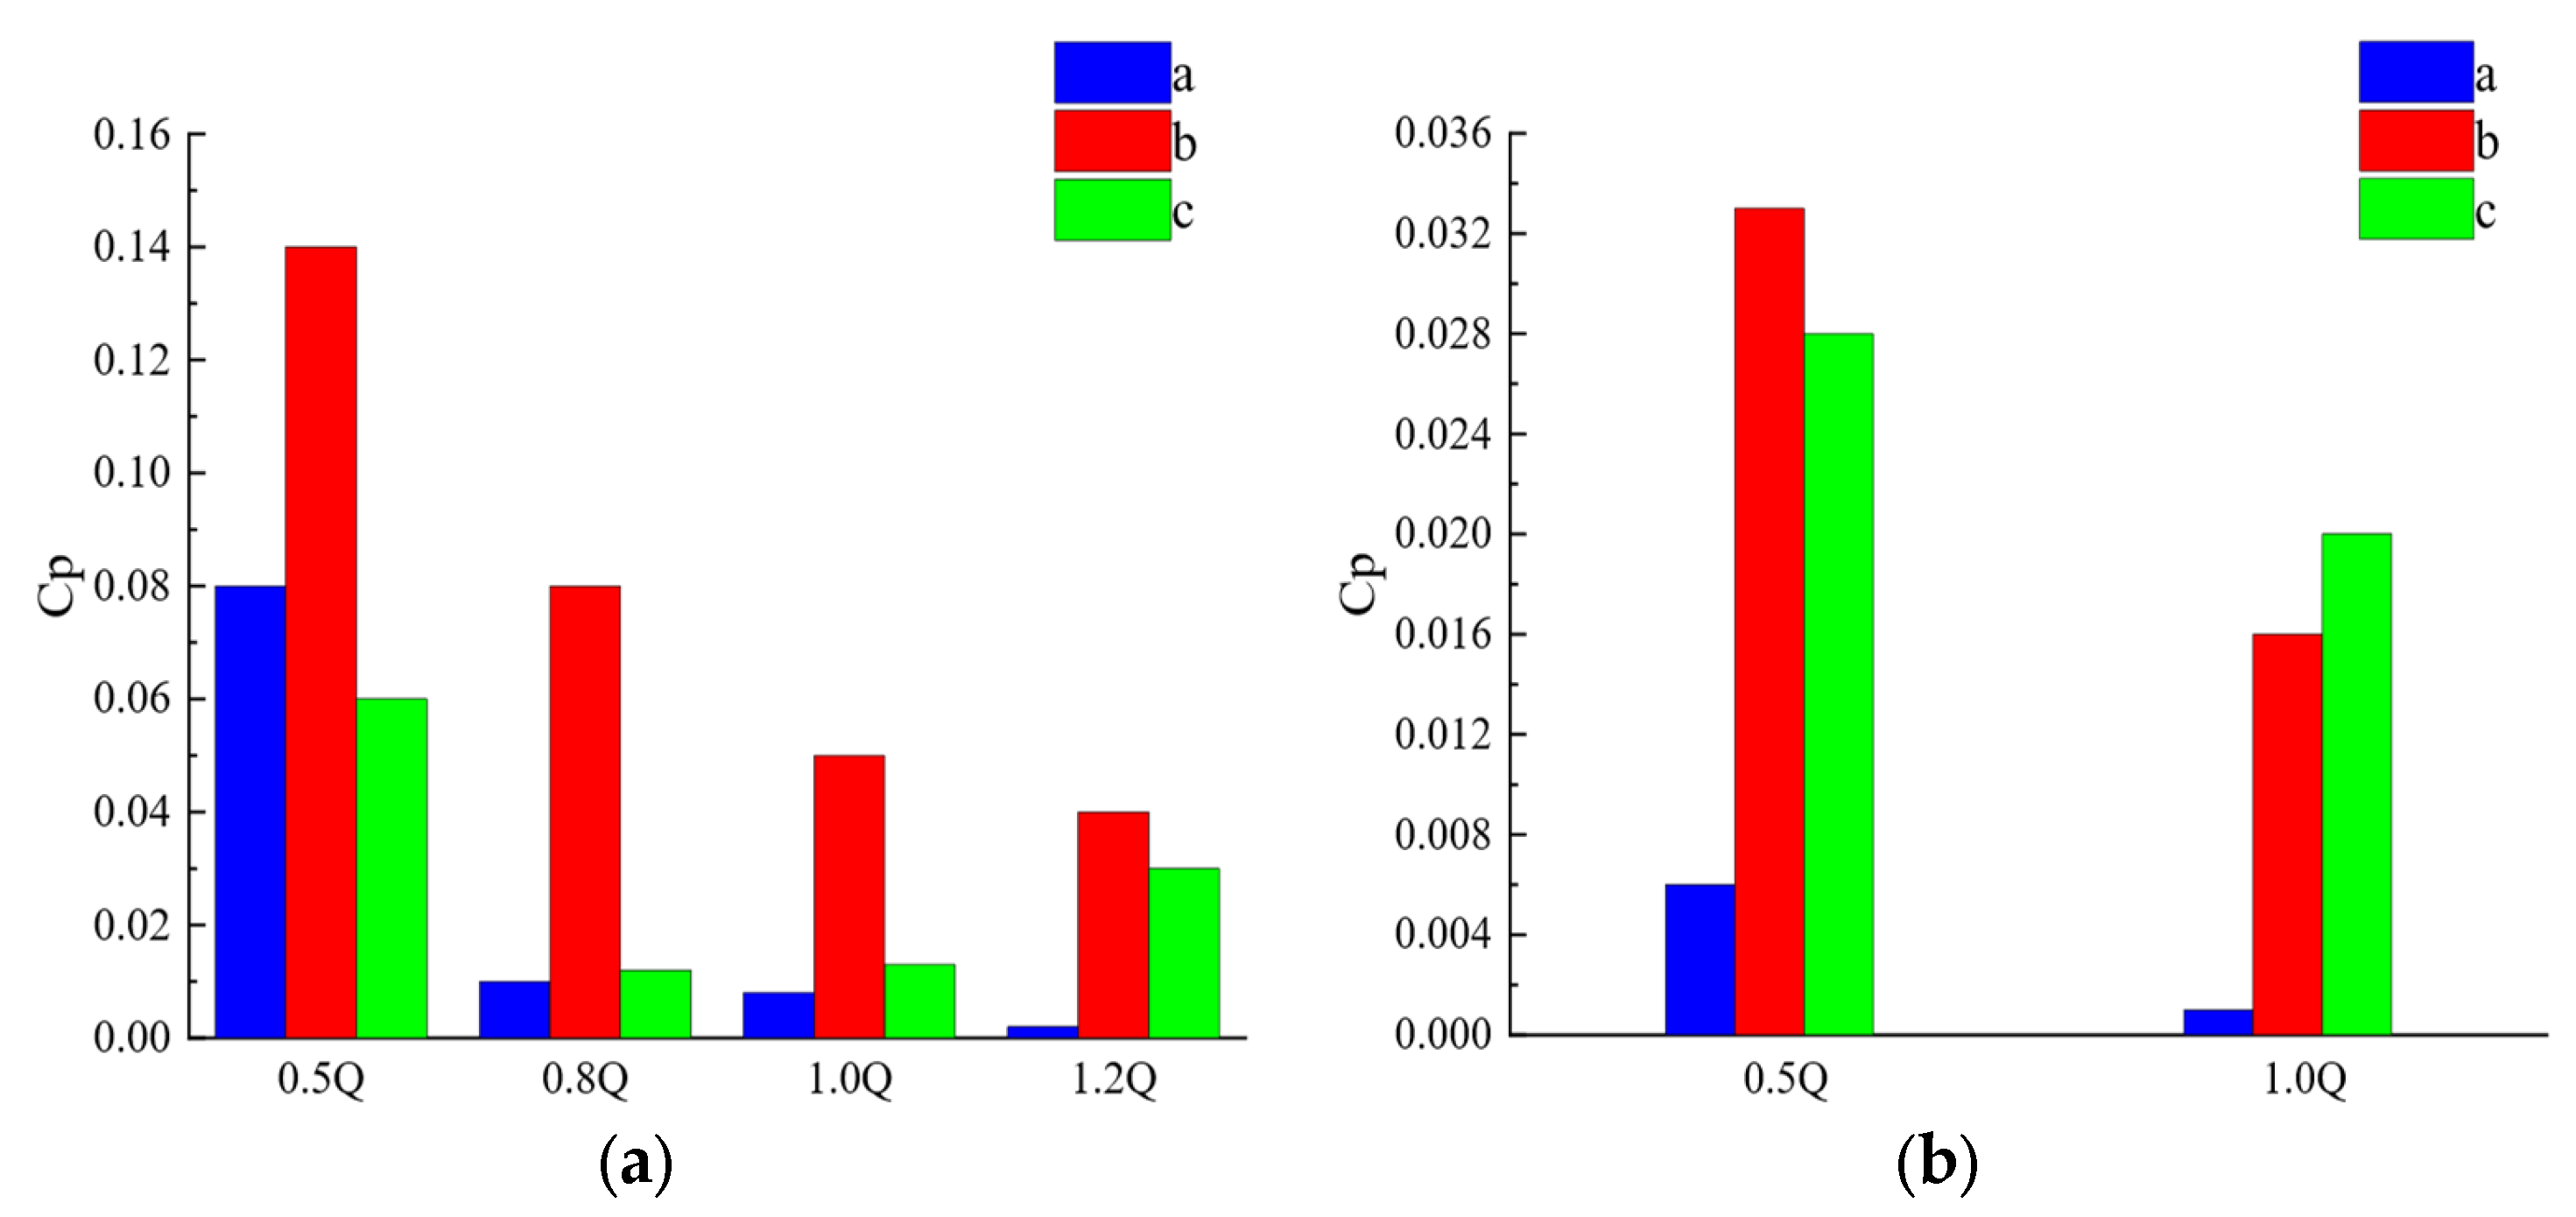
During the axial flow pump’s operation, pressure pulsation is formed due to the hydraulic excitation caused by the unit’s vibration and the rotation of the blades. Its variation law is frequently overly complicated by many factors. This paper uses a peak-to-peak value with a confidence level of 97% as the index to investigate the pressure pulsation. Figure 9 shows the pressure pulsation with 97% confidence; the vertical axis is the pressure coefficient, and the horizontal axis is the monitoring surface under different flow conditions (a, b, and c) in the legend corresponding to a3, b3, and c3, respectively. This paper only focuses on the pressure pulsation distribution at the inlet and outlet of the runner chamber. Under the pump condition (Figure 9a), the pressure coefficient decreases with the increase in flow, except for at the runner’s outlet when the flow is large. Under the same flow conditions, the peak-to-peak value of the pressure pulsation at the runner’s inlet is the largest, indicating that the pressure pulsation changes violently here. When the unit is in the working condition of the turbine, with an increase in the flow rate, the peak-to-peak value of the pressure pulsation of each monitoring surface decreases. The peak-to-peak value of the pressure pulsation at the runner’s inlet and outlet is much larger than the pressure pulsation in the nonblade area, indicating that the blade rotation strengthens the hydraulic excitation, and the guide vanes can improve the water flow effectively. The peak-to-peak value of the pressure pulsation during forward operation is much larger than that during the reverse operation, indicating that when the pump is operating under the operating condition, the internal pressure pulsation of the unit is larger, the hydraulic excitation is pronounced, and there should be damage to the unit’s overcurrent components. If it is larger, operating under reasonable flow conditions is necessary.
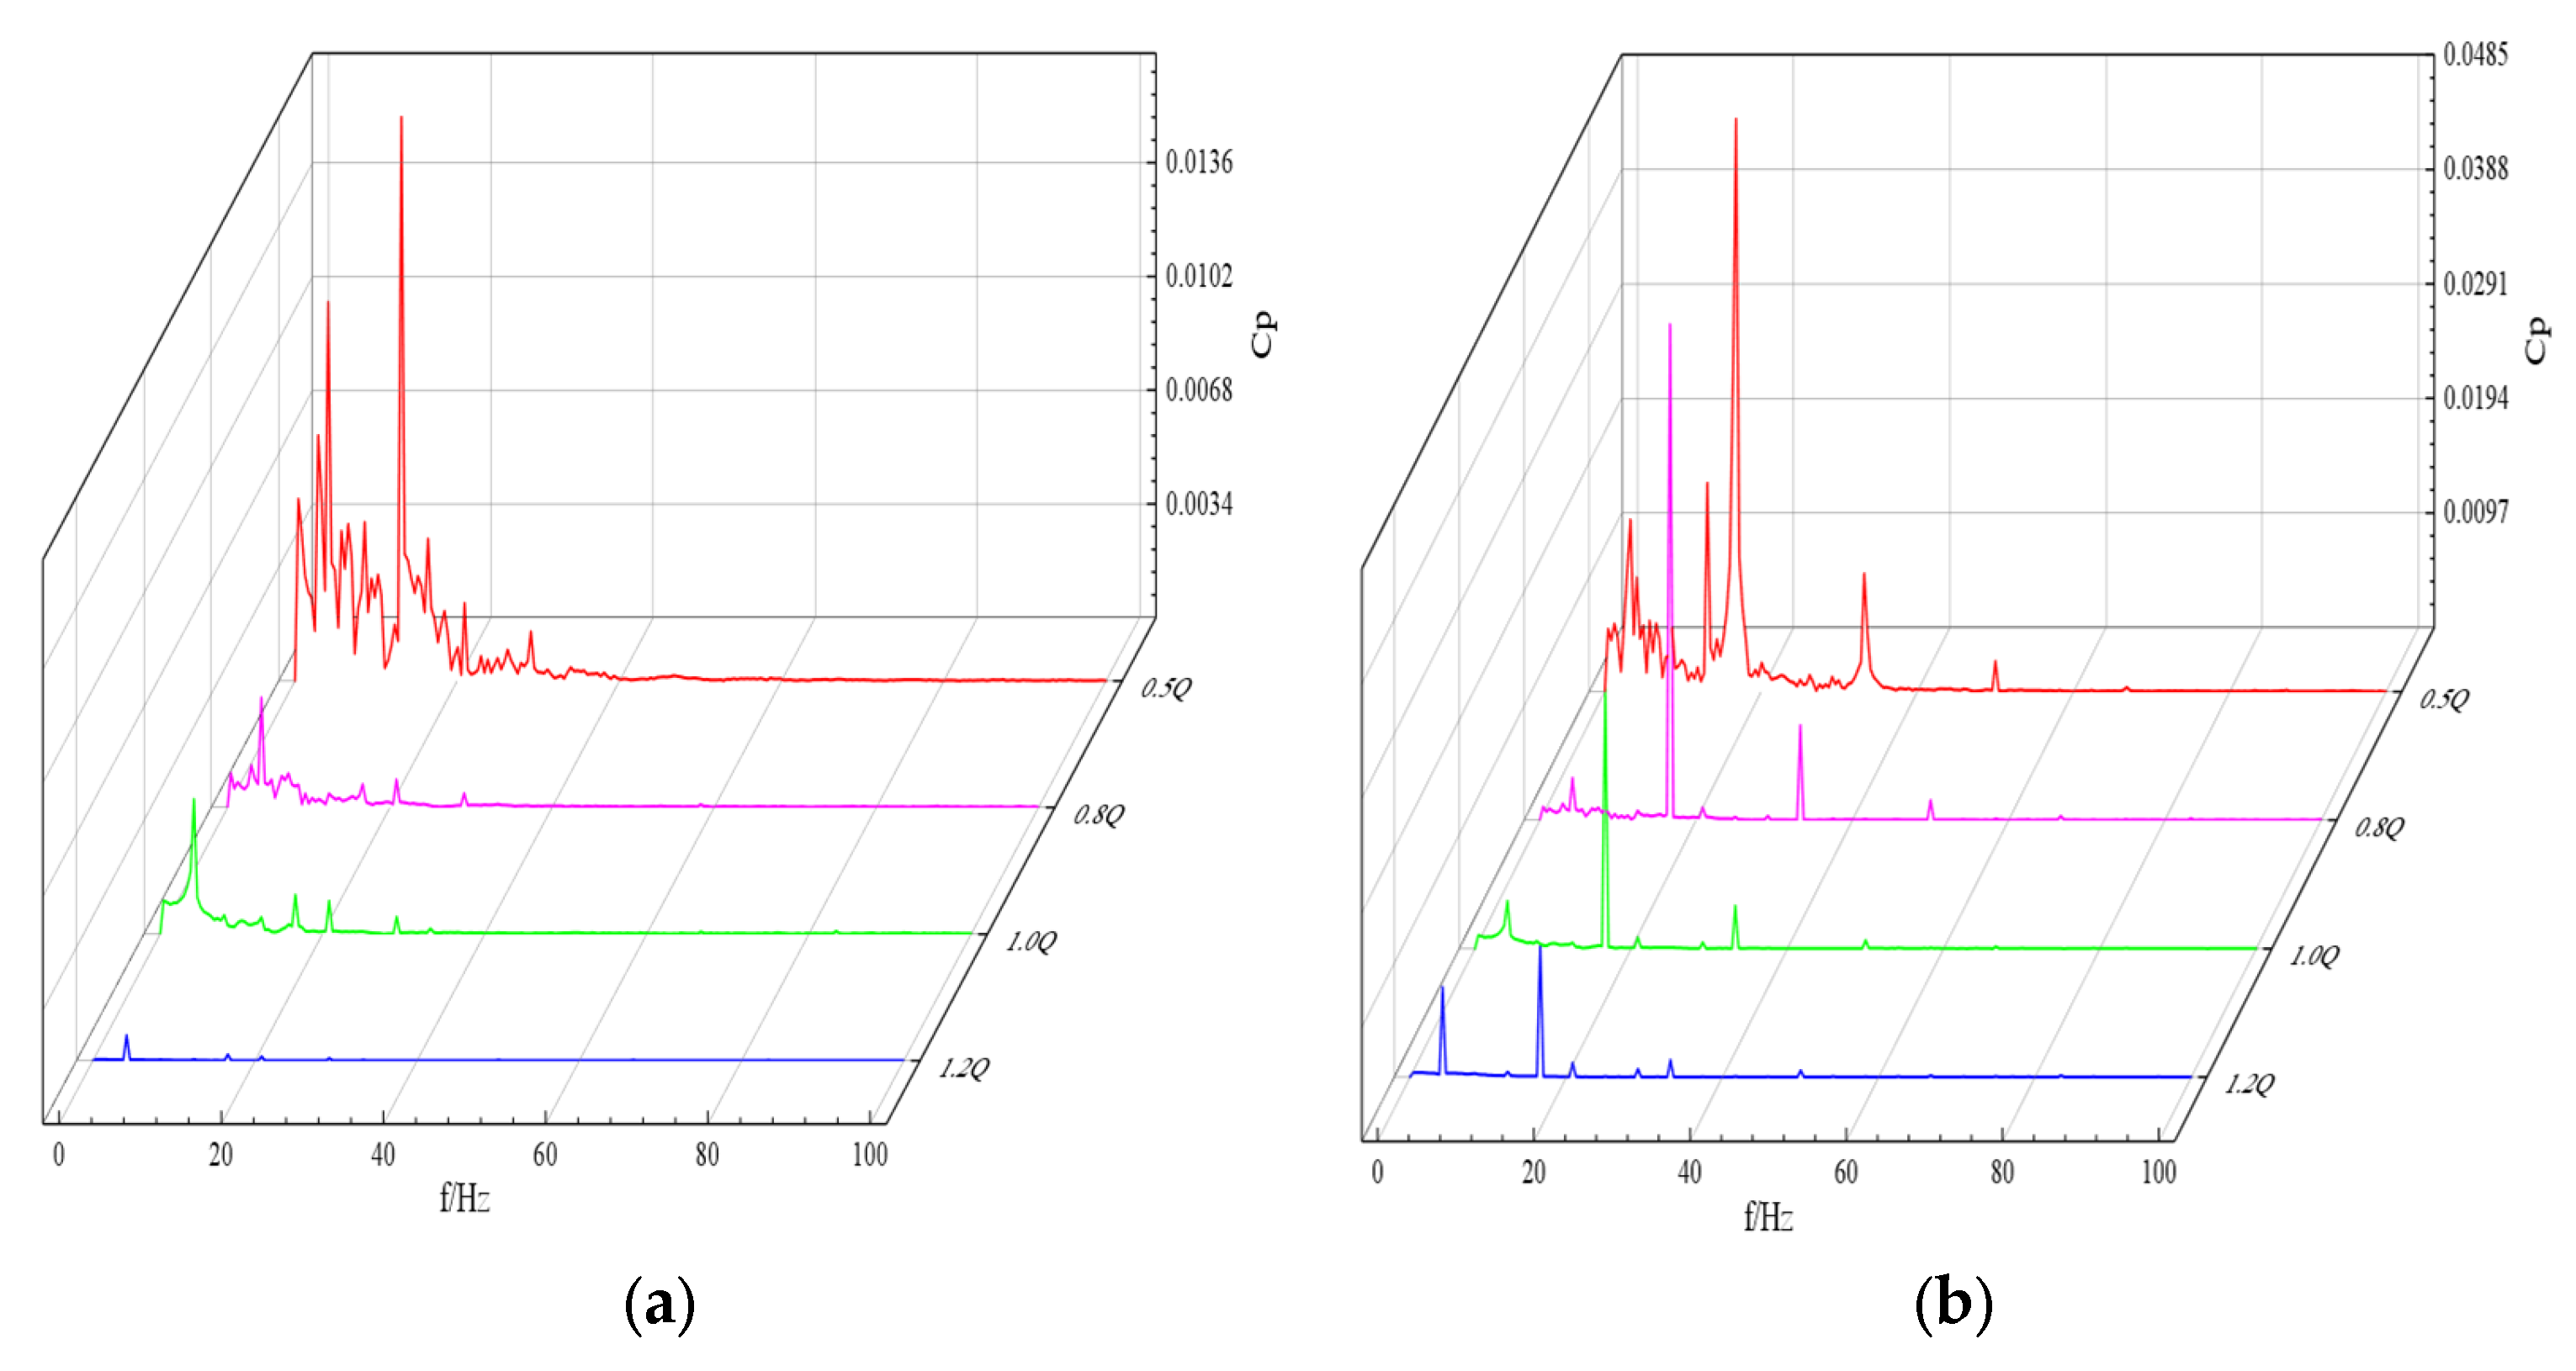
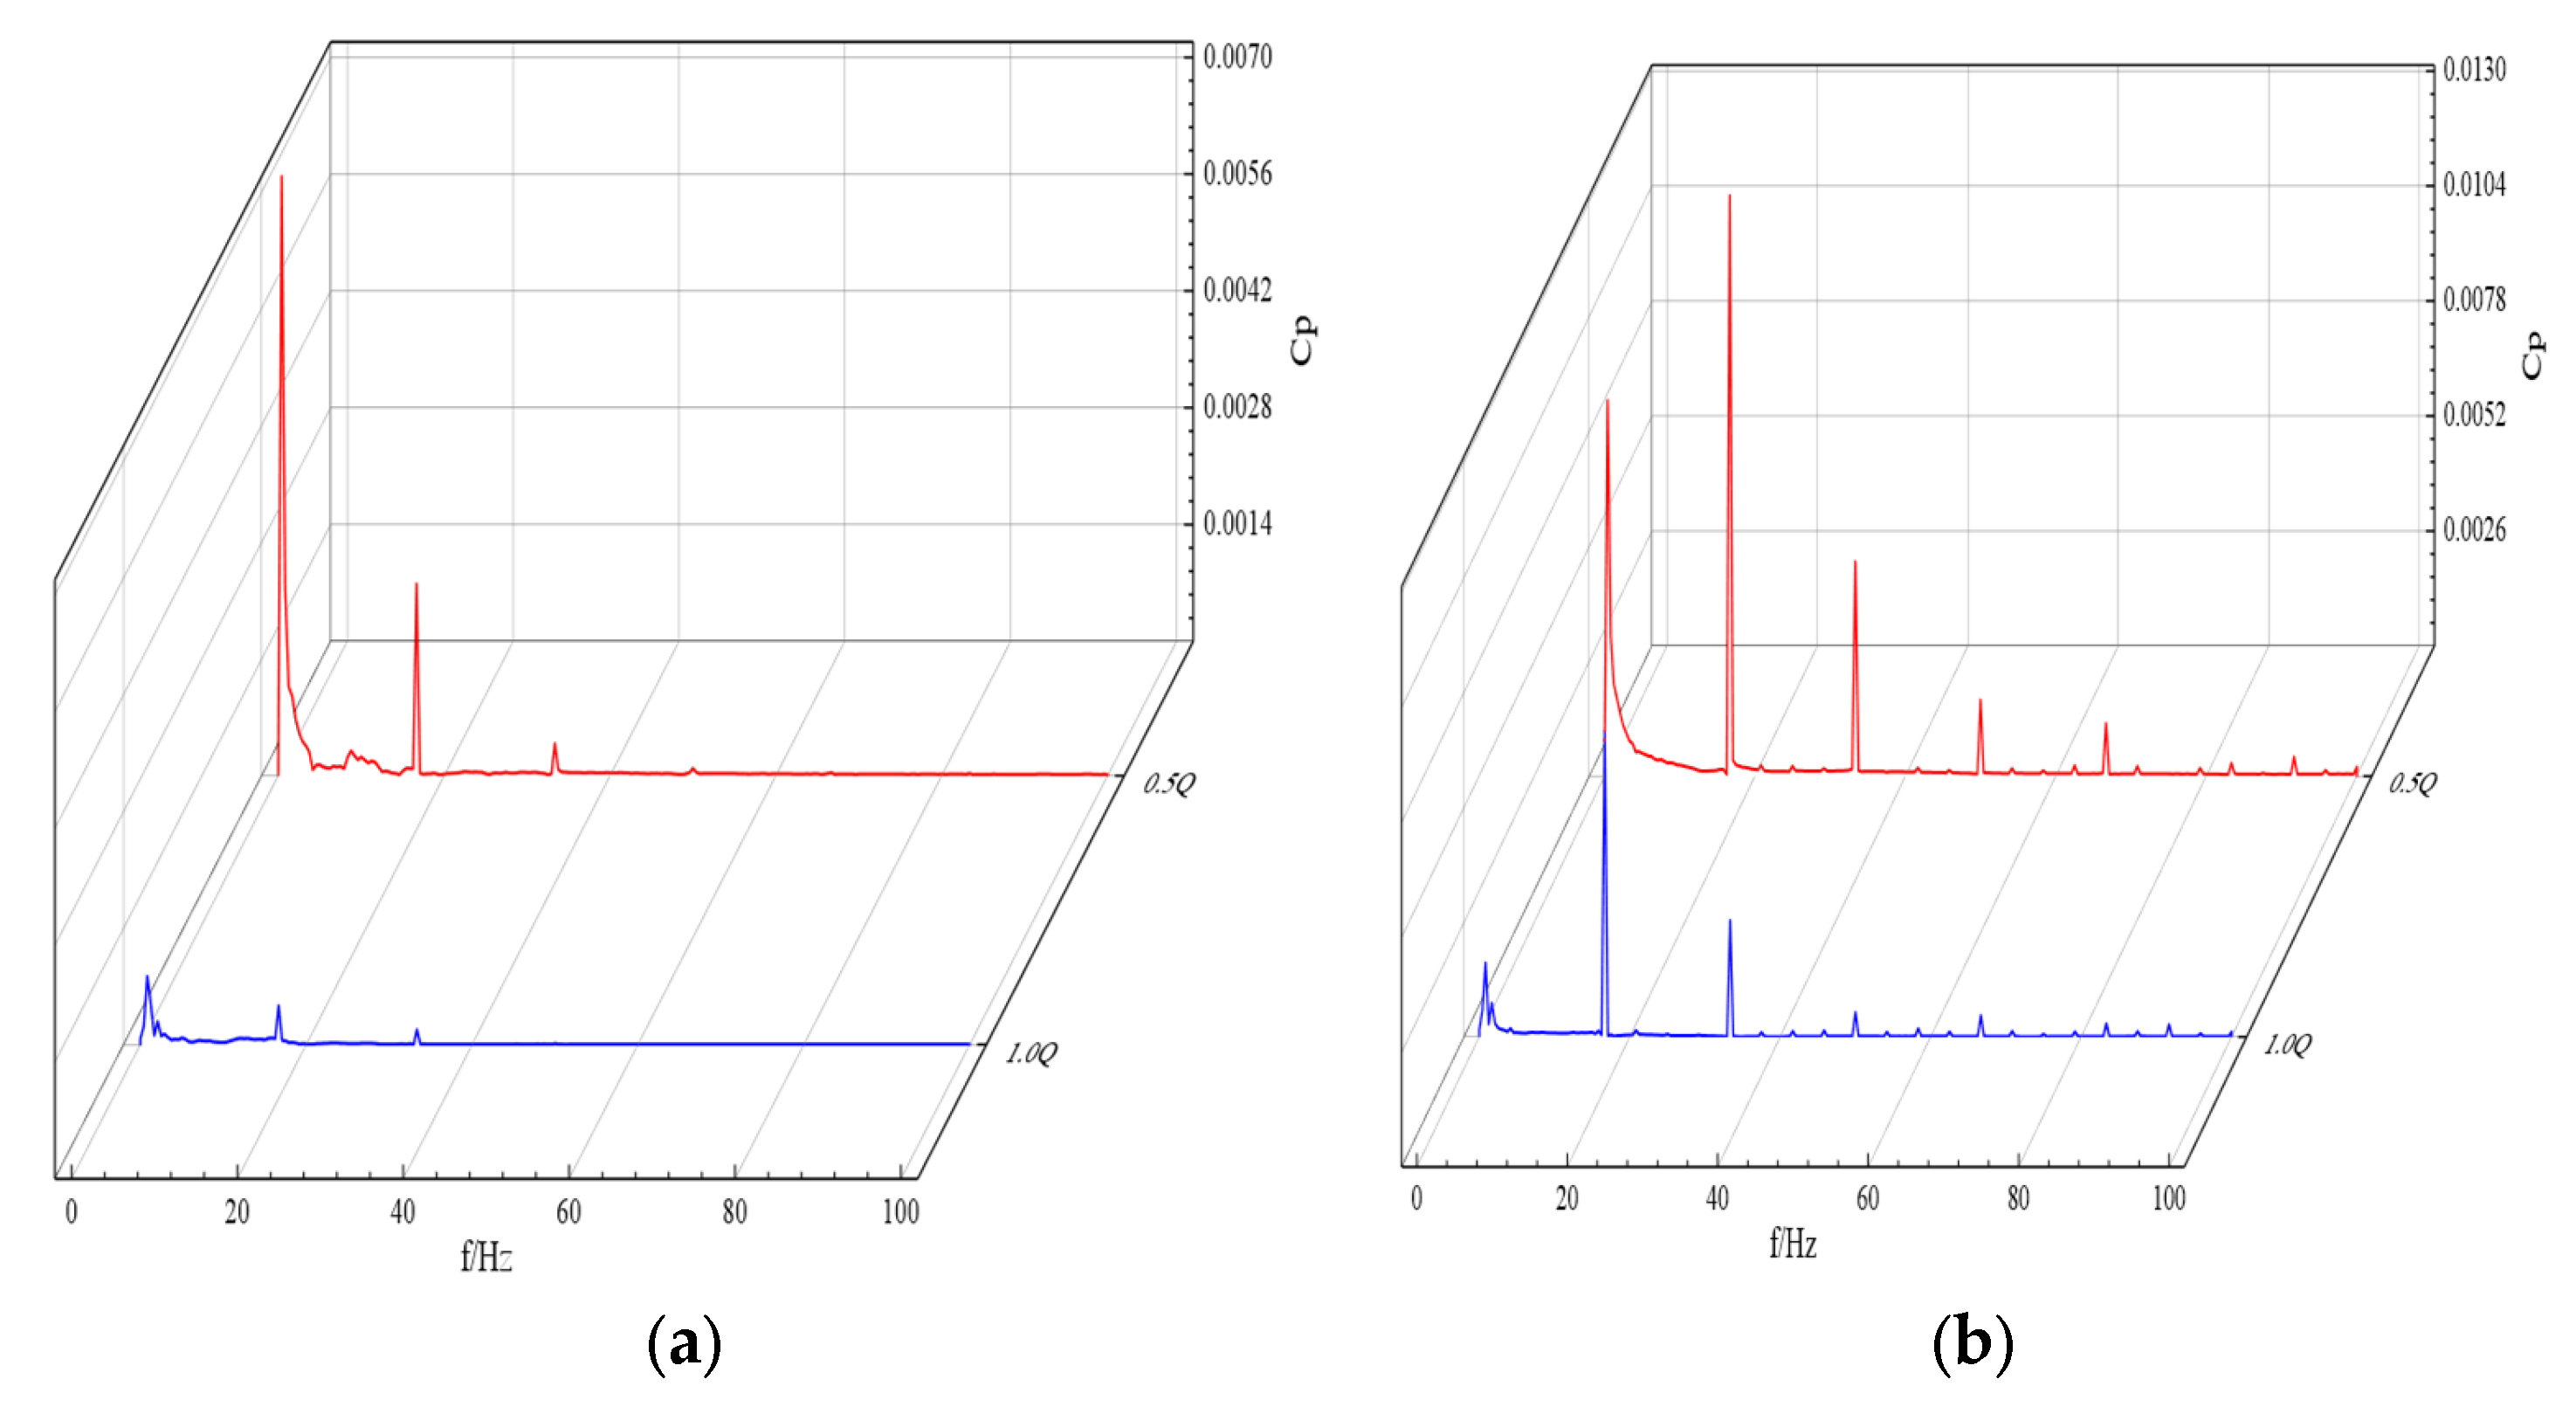
Fourier transform was performed on the previously selected pressure pulsation data. We obtained the frequency domain distribution of the pressure pulsations. Figure 10 and Figure 11 are the frequency domain distribution of pressure pulsation on different monitoring surfaces under the pump and turbine conditions, respectively. Figure 10 shows that the pressure pulsation is extremely unstable on different monitoring planes when the unit operates at a low flow rate. Clutter frequencies of different sizes occur. When operating near the design flow, the primary and secondary frequencies of the pressure pulsation frequency domain of each monitoring surface are noticeable, and no clutter frequency occurs. When the axial flow pump is running in low flow conditions, the flow state in the runner is poor, and reflux, flow separation, and other phenomena can easily occur. The primary frequency is at the blade, and the secondary frequencies are at the runner’s inlet and outlet. For the rotation frequency and its multiplication, the primary frequency of the pressure pulsation is the rotation frequency, and the secondary frequency is the rotation frequency multiplication far from the bladeless area. The figure shows that the amplitude of the primary frequency of the pressure pulsation at the runner’s inlet is the largest at the same flow rate. The water flow from the front guide vane area enters the runner chamber and impacts the blades, and the rotation of the blades drives the flow of the water body. The pulsation is much stronger than that in the leafless region.
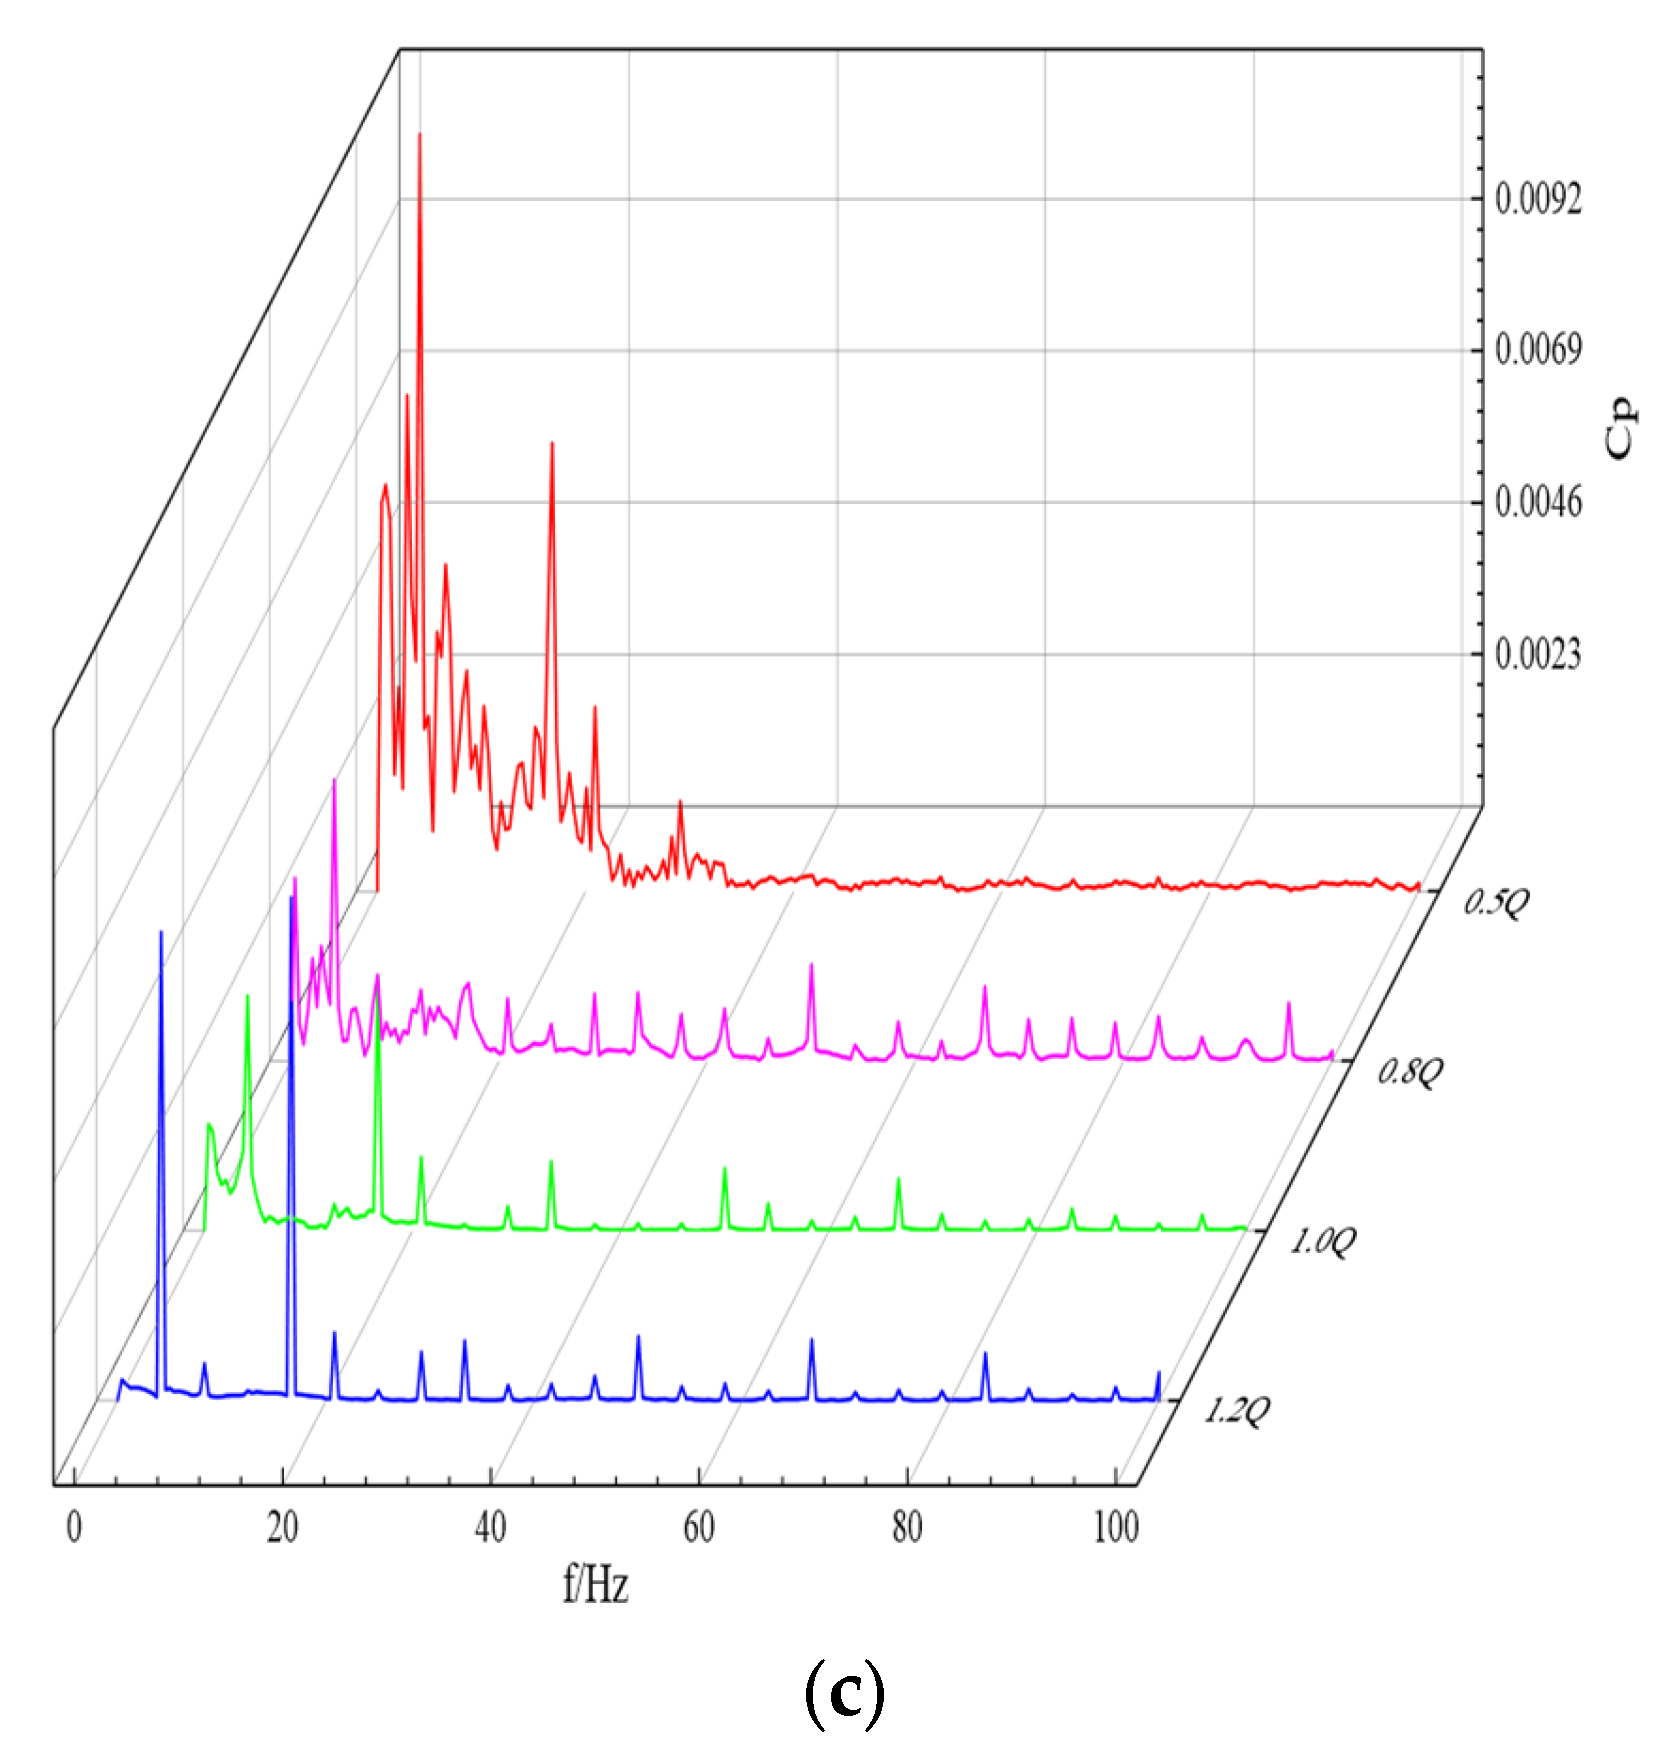
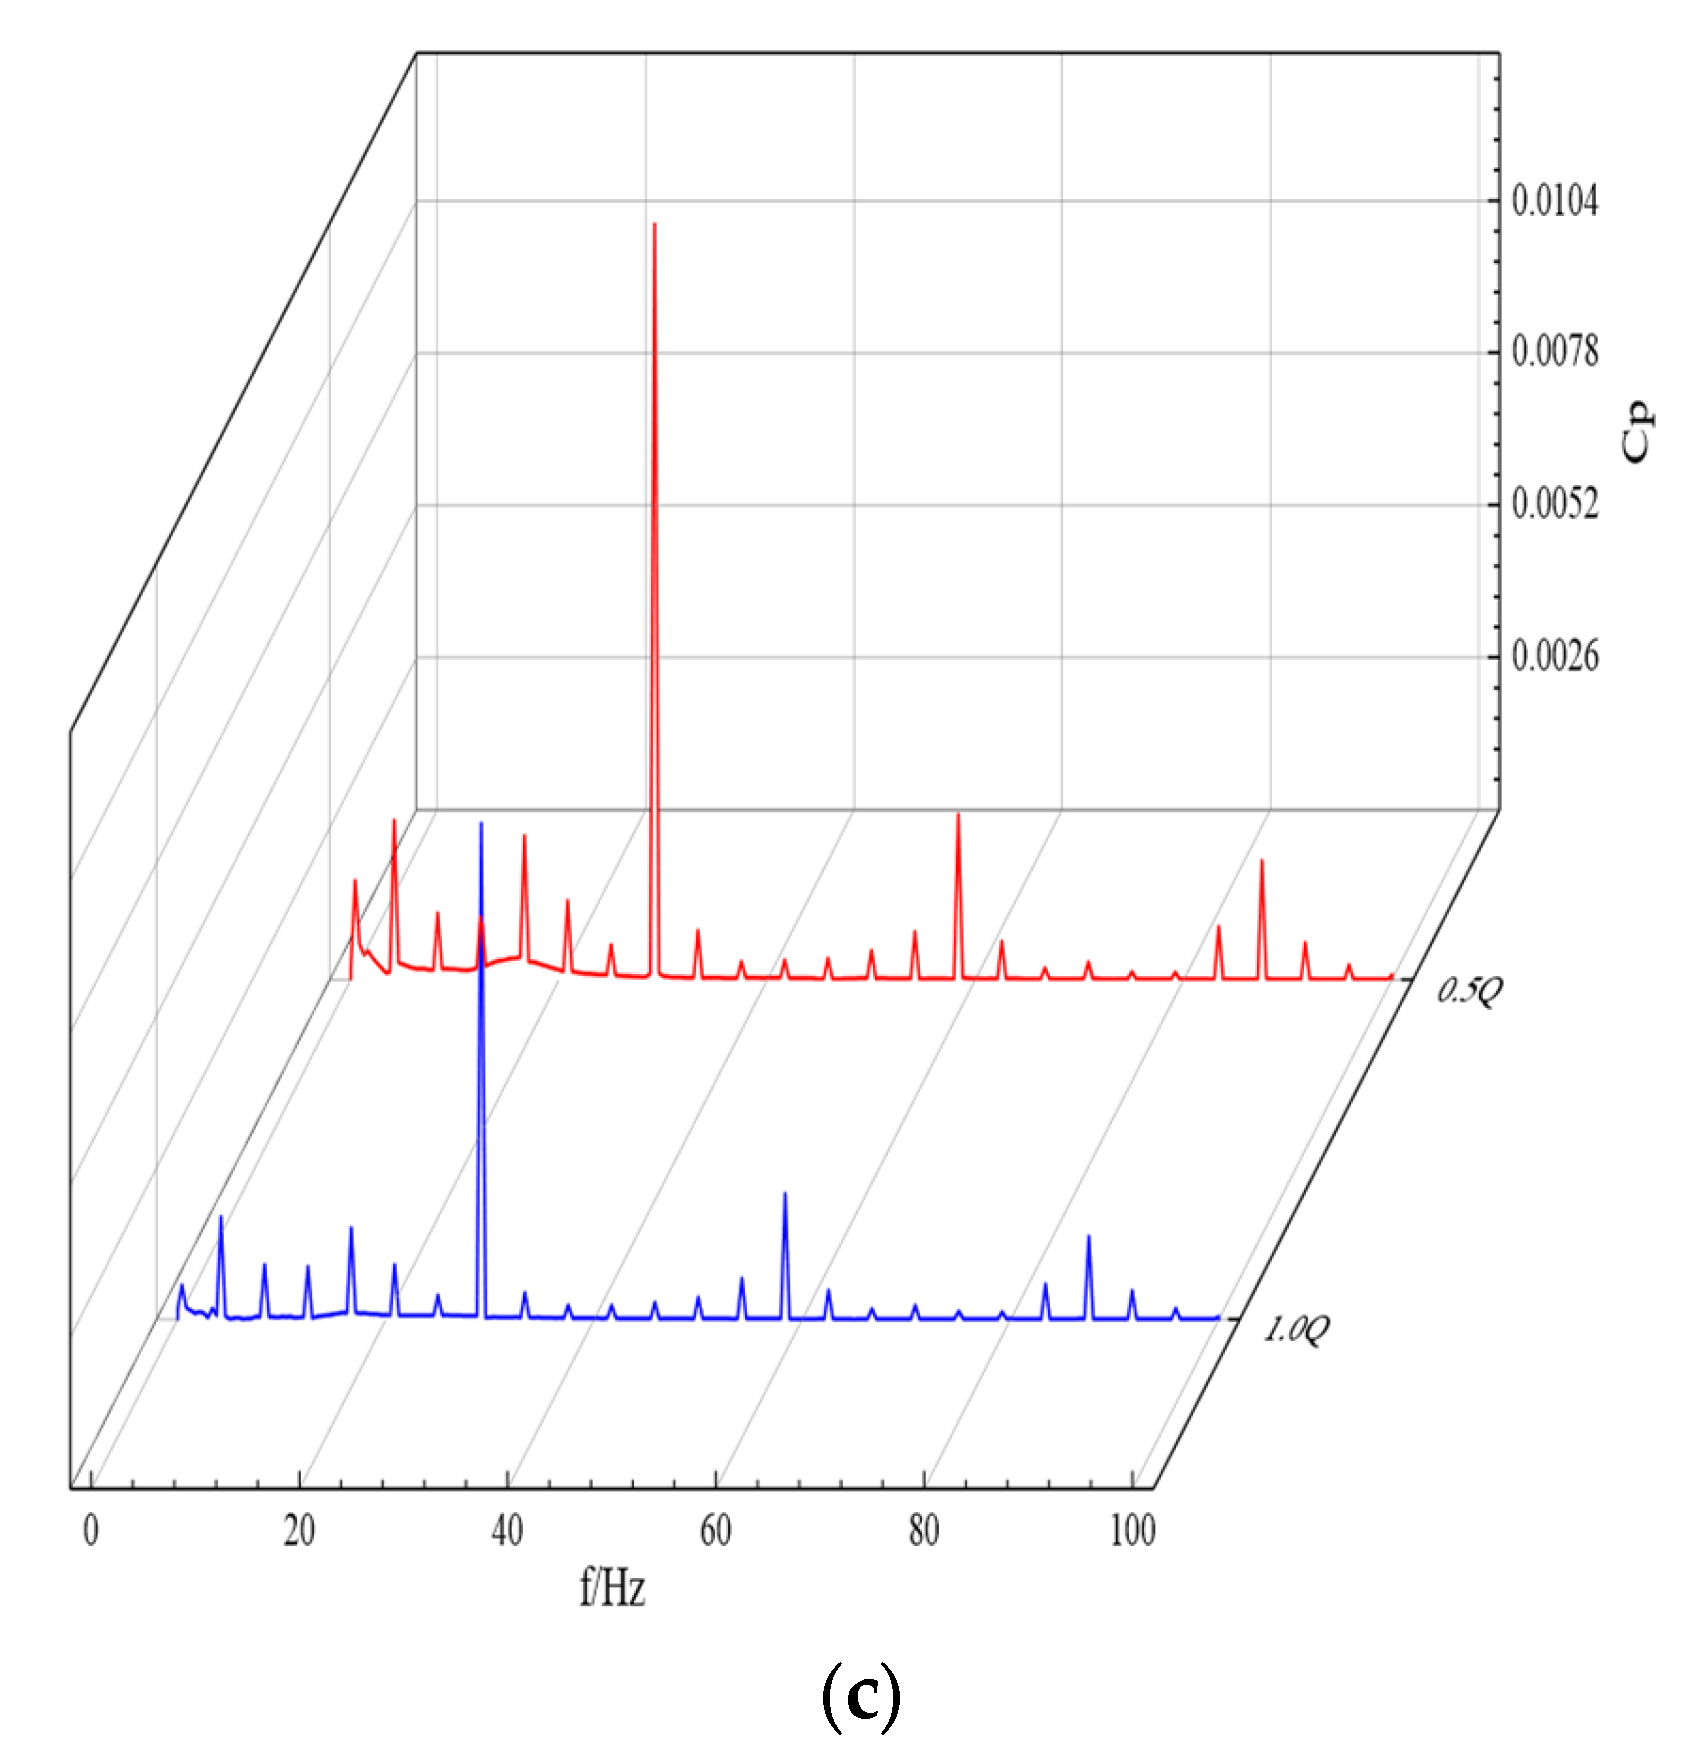
Under different flow rates on different monitoring surfaces, the primary and secondary frequencies of pressure pulsation are noticeable when the unit is in the turbine condition, and no spurious frequency occurs (Figure 11). In the vaneless area away from the runner chamber, the primary pressure pulsation frequency is the rotational frequency, and the secondary frequency is its multiplier. At the runner chamber’s outlet, the primary frequency of the pressure pulsation is the vane frequency, and the secondary frequency is the rotational frequency and its multiplier. On the runner’s inlet section, the primary frequency of the pressure pulsation is the pilot frequency, and the secondary frequency is the rotational frequency and its multiplier. The pressure pulsation spectrum distribution is consistent under different flow conditions, and with the increase in the flow rate, the pressure pulsation amplitude decreases, indicating that the higher the flow rate, the better the flow state, and the smaller the pressure pulsation, the more stable the operation. In the dynamic and static interference areas near the runner chamber, the pressure pulsation is much larger than the pressure pulsation amplitude in the vaneless area.
The frequency domain distribution of the pressure pulsation is closely related to the number of runner blades when the unit operates under different working conditions. The difference is that during forward operation, although the movable guide vane can adjust the flow state well, it has little effect on the pressure pulsation. When running in the forward direction, the primary pressure pulsation frequency on the outlet section of the movable guide vane is the pilot frequency, which is related to the number of guide vanes. Therefore, the frequency domain distribution of the pressure pulsation has a relationship with the number of runner blades and guide vanes and is closely related to the unit’s operating state.
4.3. Sound Field Analysis
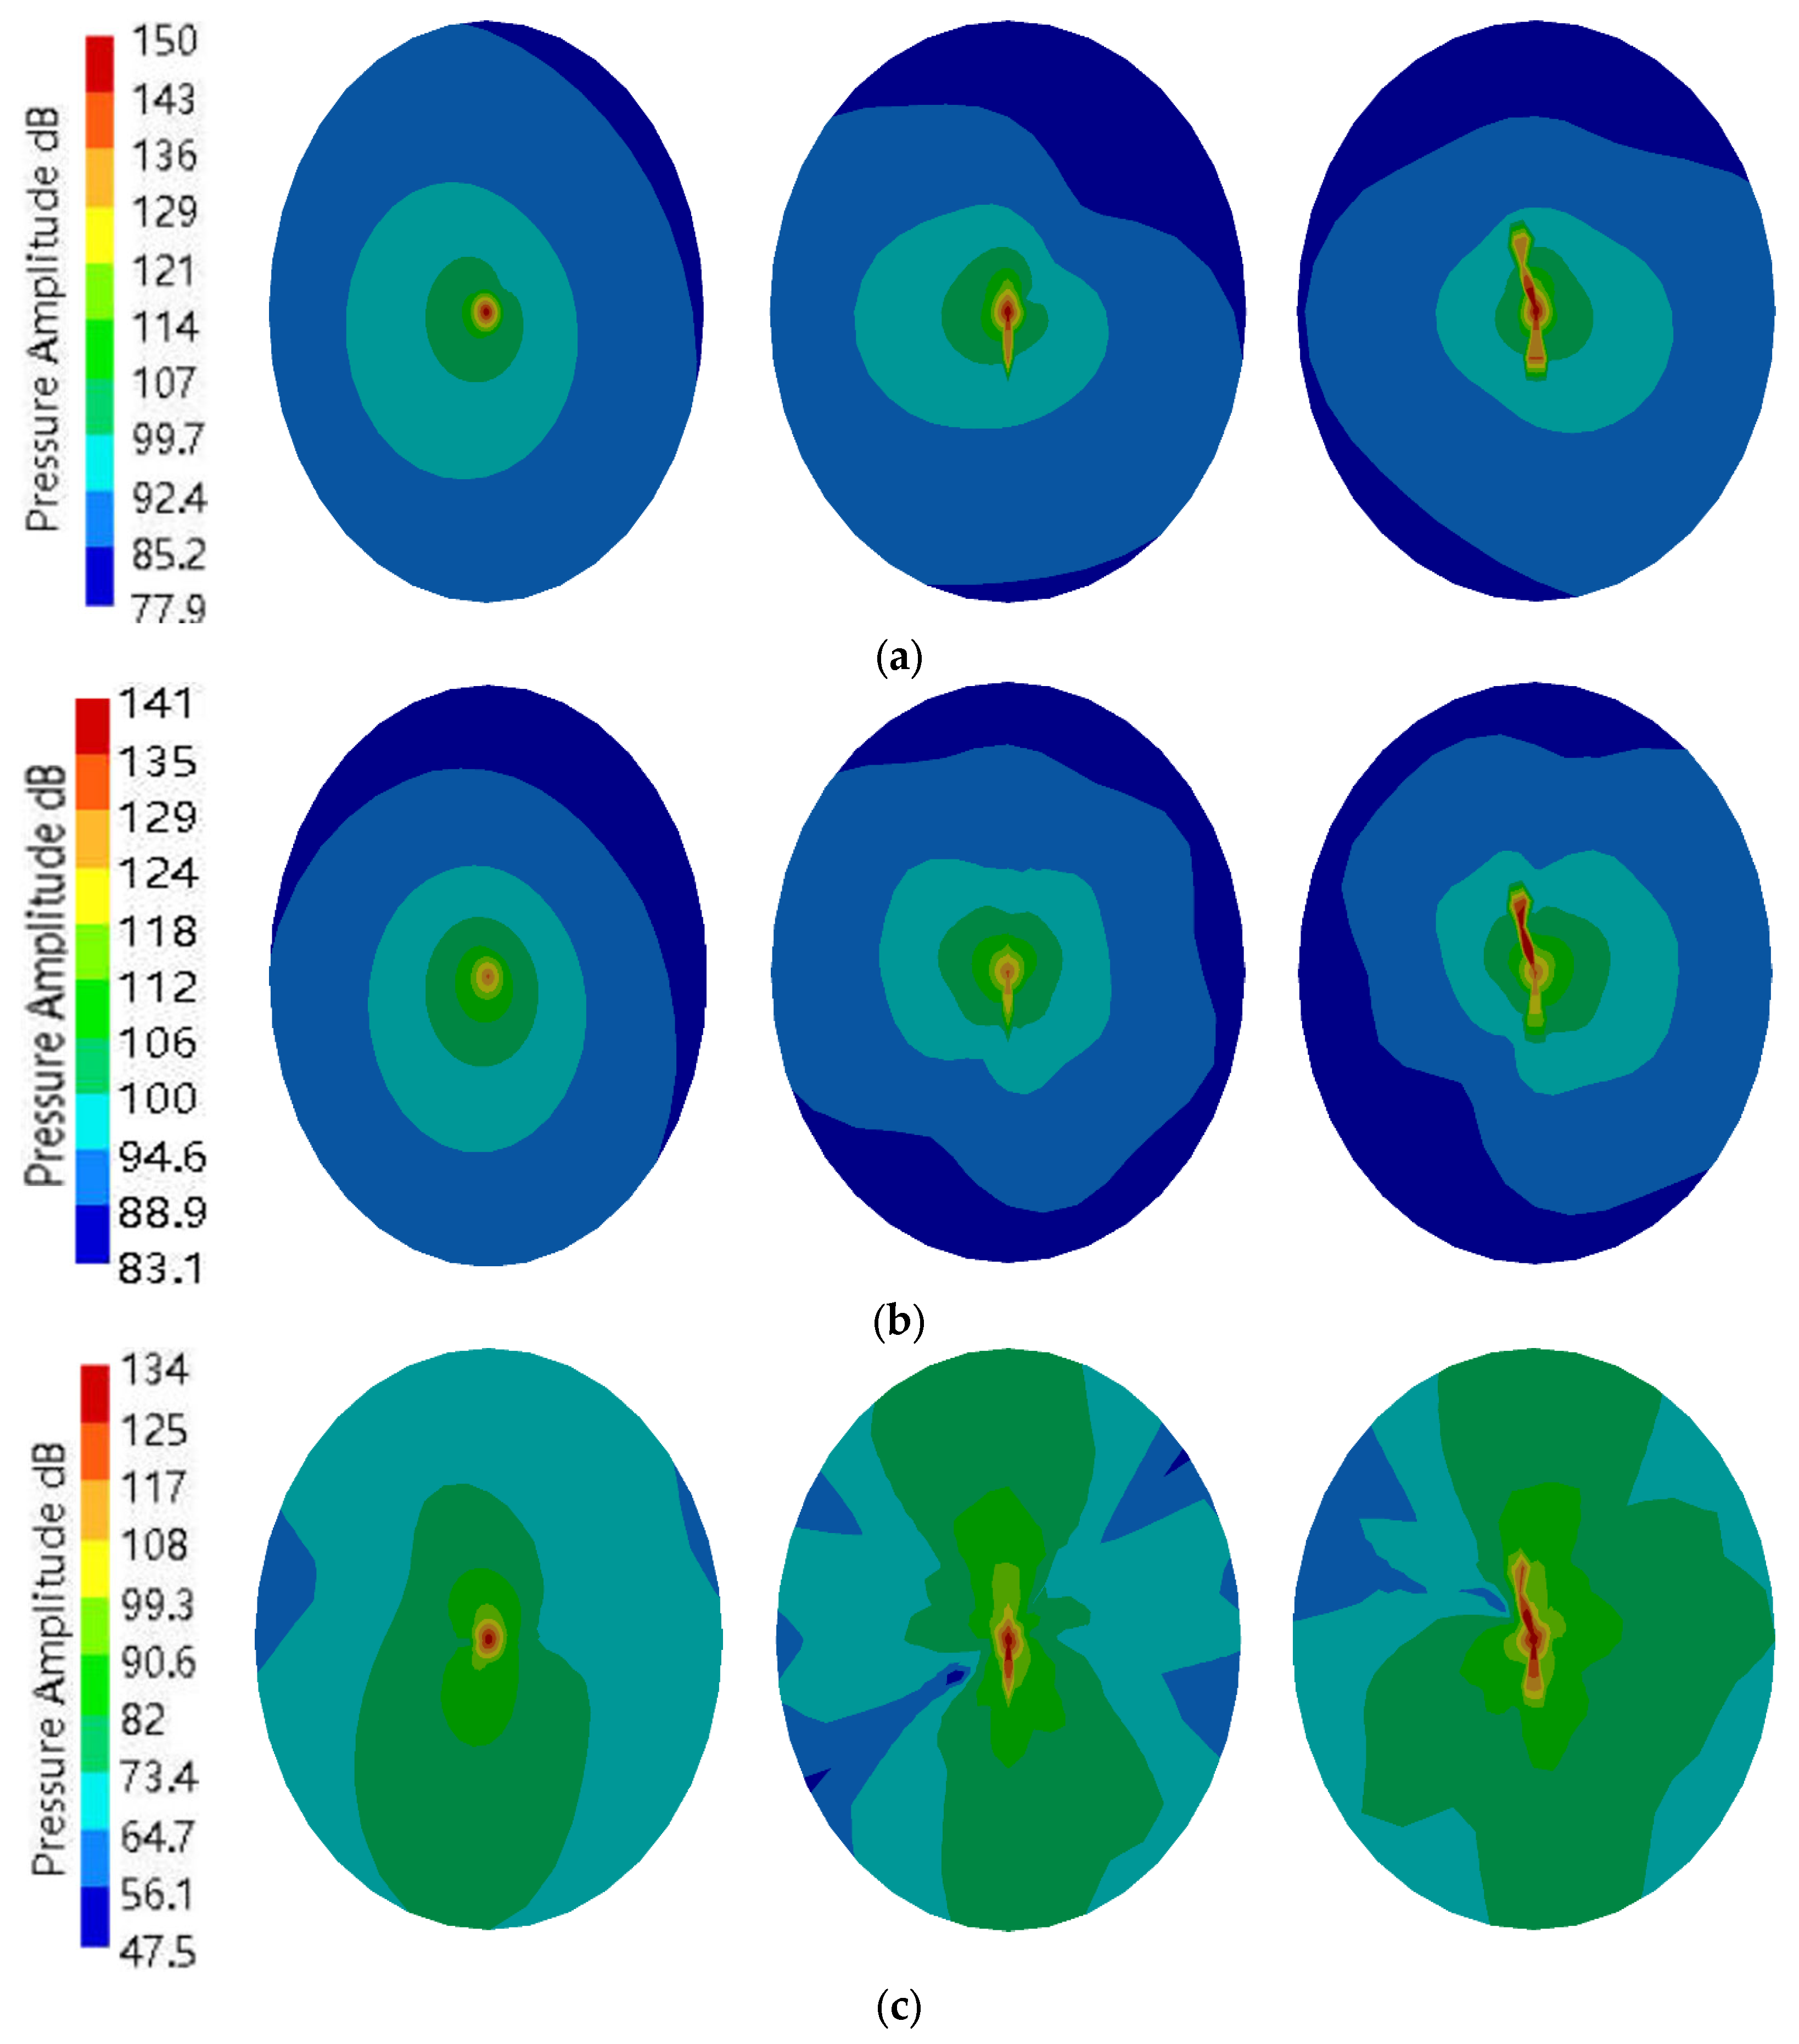
The directional distribution change trend of the flow-induced noise in the axial flow pump is similar in all directions, and this trend does not change with the change in the flow rate [13]. Therefore, the XY, YZ, and XZ planes were selected to analyze the external noise, and the directivity distribution and radiation level of the noise at the first- to third-order leaf frequencies were studied. This paper provides the sound pressure amplitude distribution diagrams corresponding to the first-order and third-order blade frequencies under the design flow condition. Figure 12, Figure 13, Figure 14 and Figure 15 show that the sound pressure nephogram corresponding to the dipole sound source on the blade surface has a dipole directional shape, and at each leaf frequency, the directional distribution of sound pressure values on the XY plane has symmetry, proving that the blade noise radiation has dipole characteristics.
Figure 12 shows the sound pressure cloud diagram of the design flow’s first-, second- and third-order blade frequencies. The sound pressure distribution exhibits symmetrical attenuation, and the approximate axial flow direction and the approximate axial flow normal direction are consistent [20]. The sound pressure amplitude is the largest at the sound source and decreases continuously as the distance from the sound source increases. At the first-order leaf frequency, the sound pressure is distributed in the form of concentric radiation on the XY plane, indicating that the radiation capacity in different directions is similar. At the third-order leaf frequency, the sound pressure distribution cloud map corresponding to the dipole sound source presents an ∞-pointed shape. Under the same flow conditions, the sound pressure value of the sound field at the first-order blade frequency is higher than that at the third-order blade frequency. As the distance from the sound source increases, the sound pressure attenuation degree of the sound field at the first-order blade frequency also increases. The sound pressure value is lower than the third-order lobe frequency, especially far away from the sound source. The sound pressure value of the first-order lobe frequency is much larger than that at the third-order lobe frequency, indicating that the flow-induced noise is more intense in the low-frequency band, and as the frequency increases, the noise intensity decreases, showing that the first-order lobe frequency plays a dominant role regarding the pressure pulsation change.
Figure 13 shows the flow-induced noise’s sound pressure distribution under the turbine’s working conditions. As with the step-by-step situation in the pump condition, under the first-order blade frequency, the sound pressure distribution at different positions of the sound field is circular, indicating that the external noise’s radiation capacity in different directions is similar. The sound pressure amplitude at the sound source is the largest; the sound pressure amplitude at the first-order blade frequency is greater than that at the same sound field at the third-order blade frequency, and the sound pressure attenuation degree is smaller at low frequencies.
Comparing the pump unit’s sound pressure distribution under the operating conditions of the pump and the turbine shows that the influence of the flow rate on the induced noise means that the lower the flow rate, the stronger the noise radiation, and the sound pressure value at low frequencies is significantly higher than that at high frequencies. This shows that the noise intensity and sound field distribution are mainly affected by the blade pass frequency, while the main frequency of the pressure pulsation obtained from the previous study is the blade-passing frequency, and it is mainly distributed in the low-frequency band, indicating that there is a close relationship between the flow-induced noise and the pressure pulsation. This shows that the stronger the internal pressure pulsation of the axial flow pump under different working conditions, the stronger the corresponding flow-induced noise radiation level. The study of pressure pulsation characteristics has a guiding significance for flow-induced noise prediction.
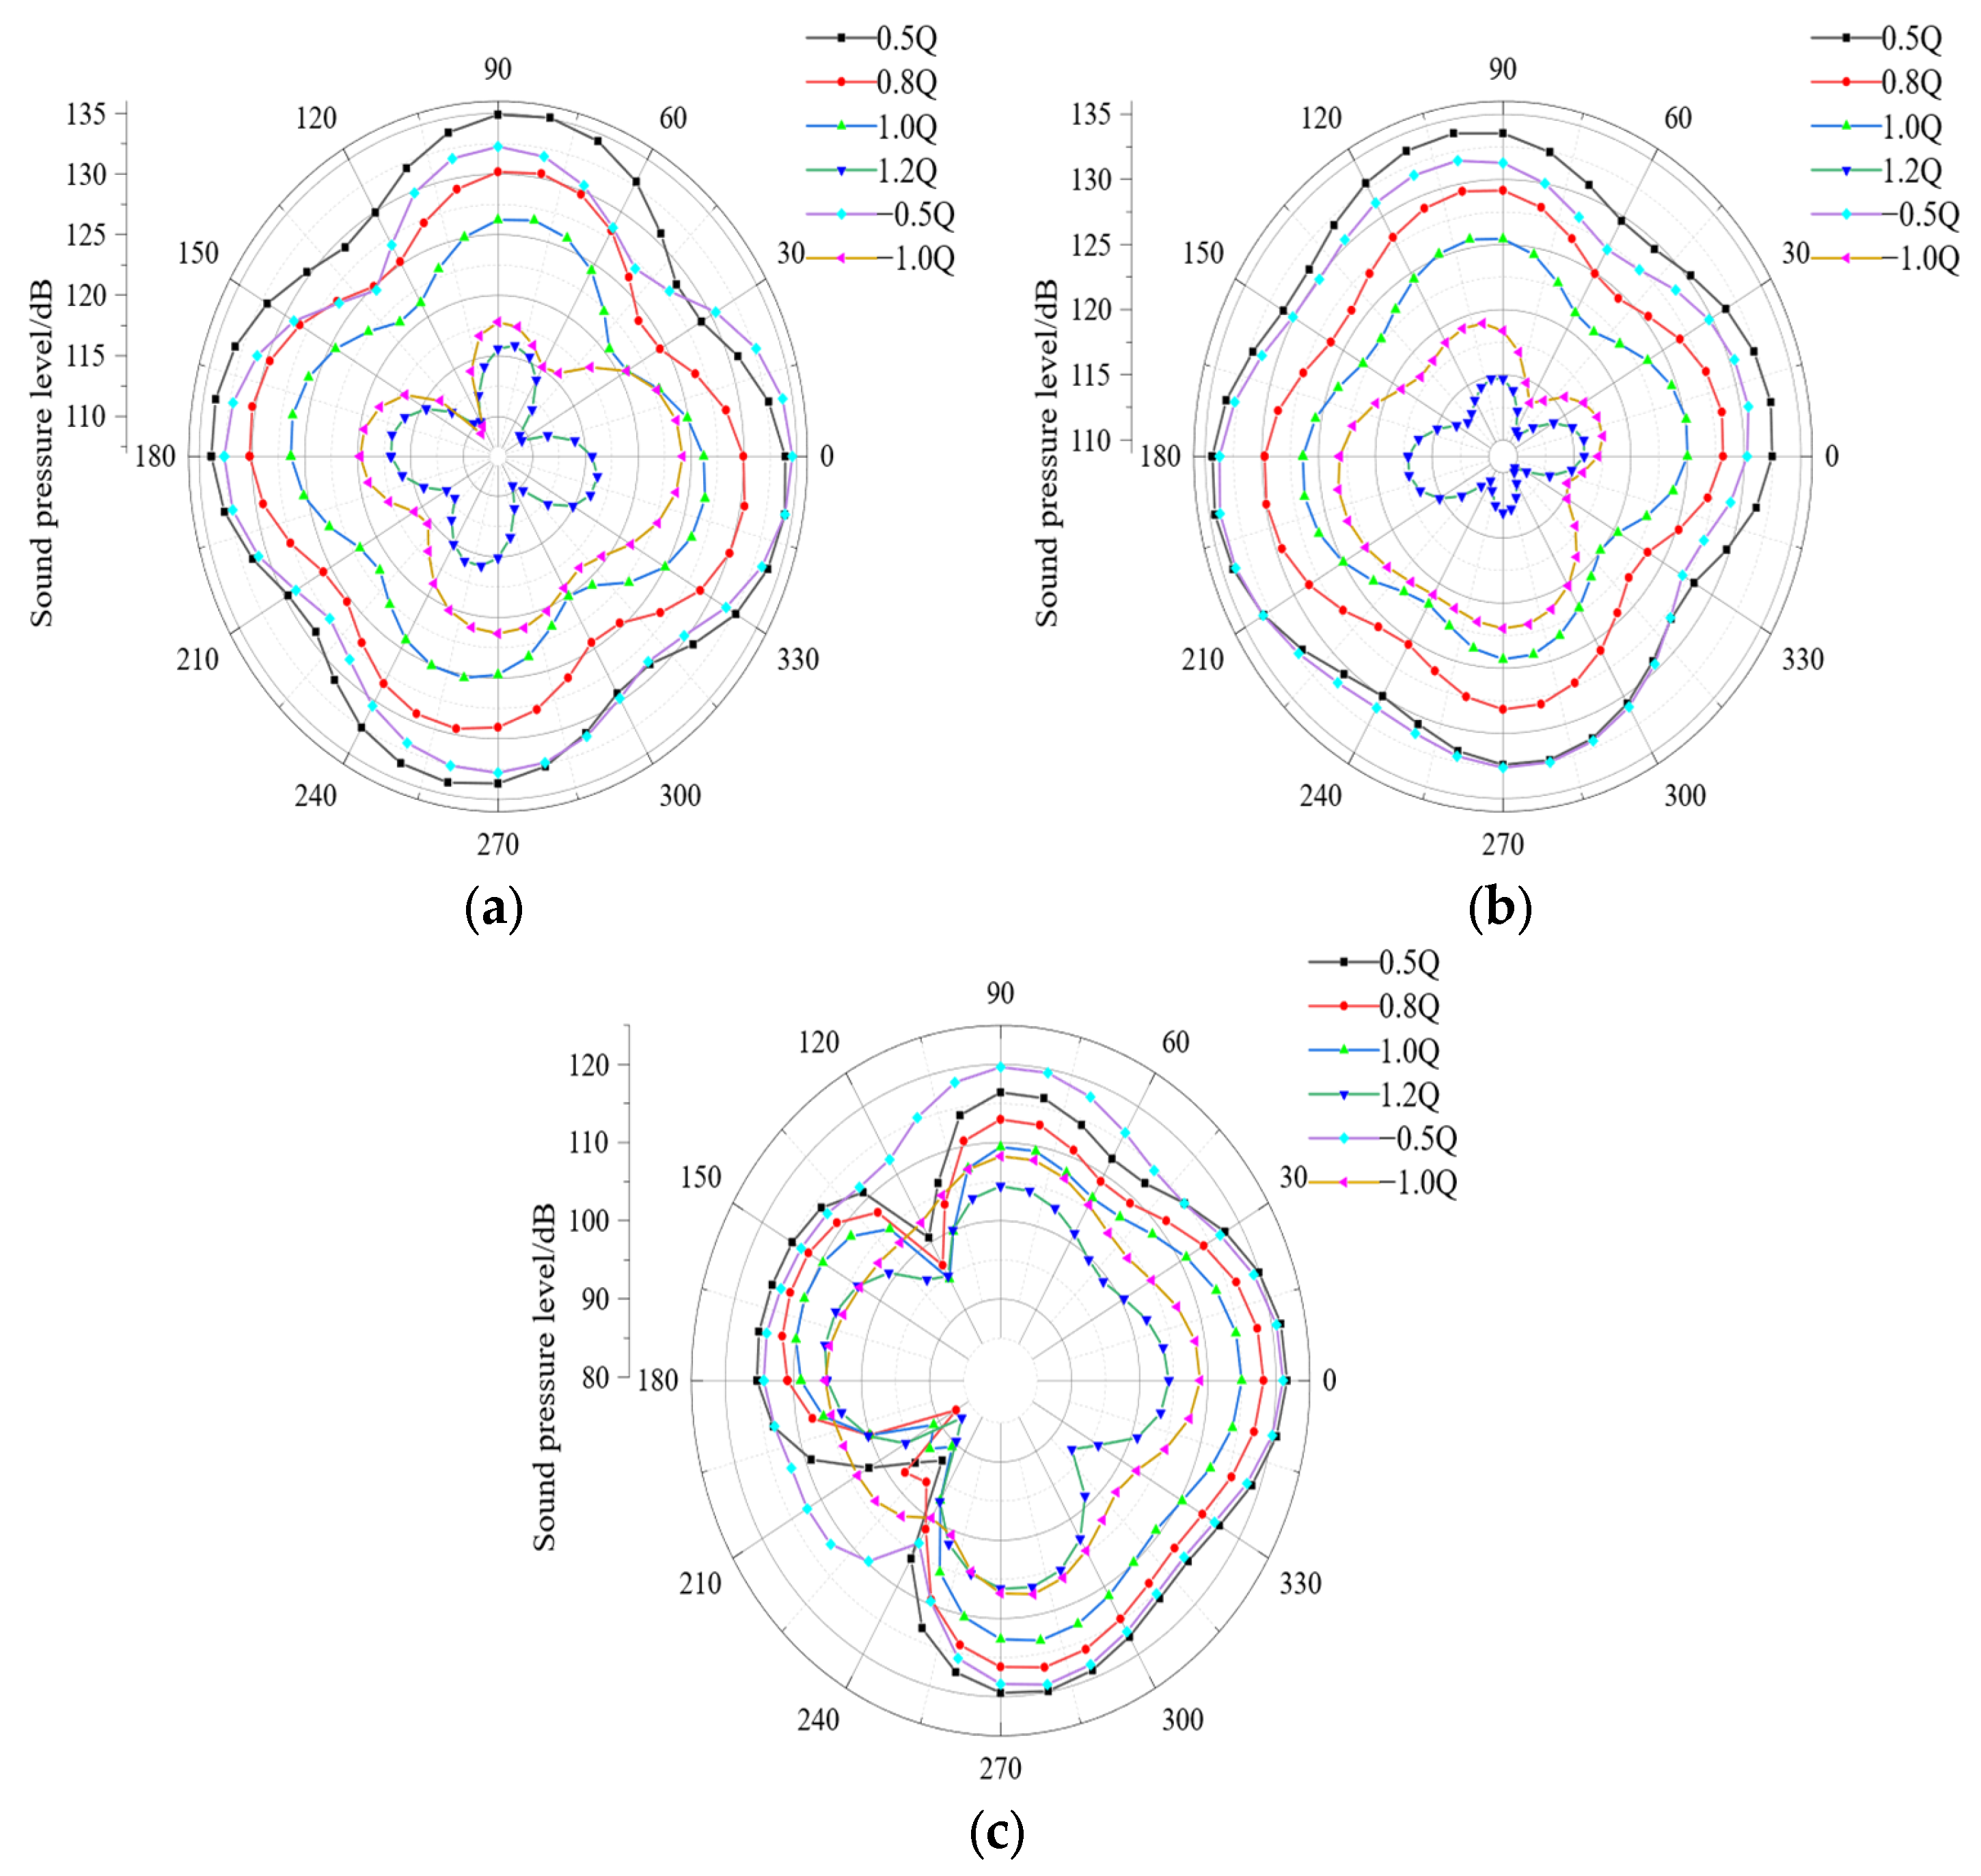
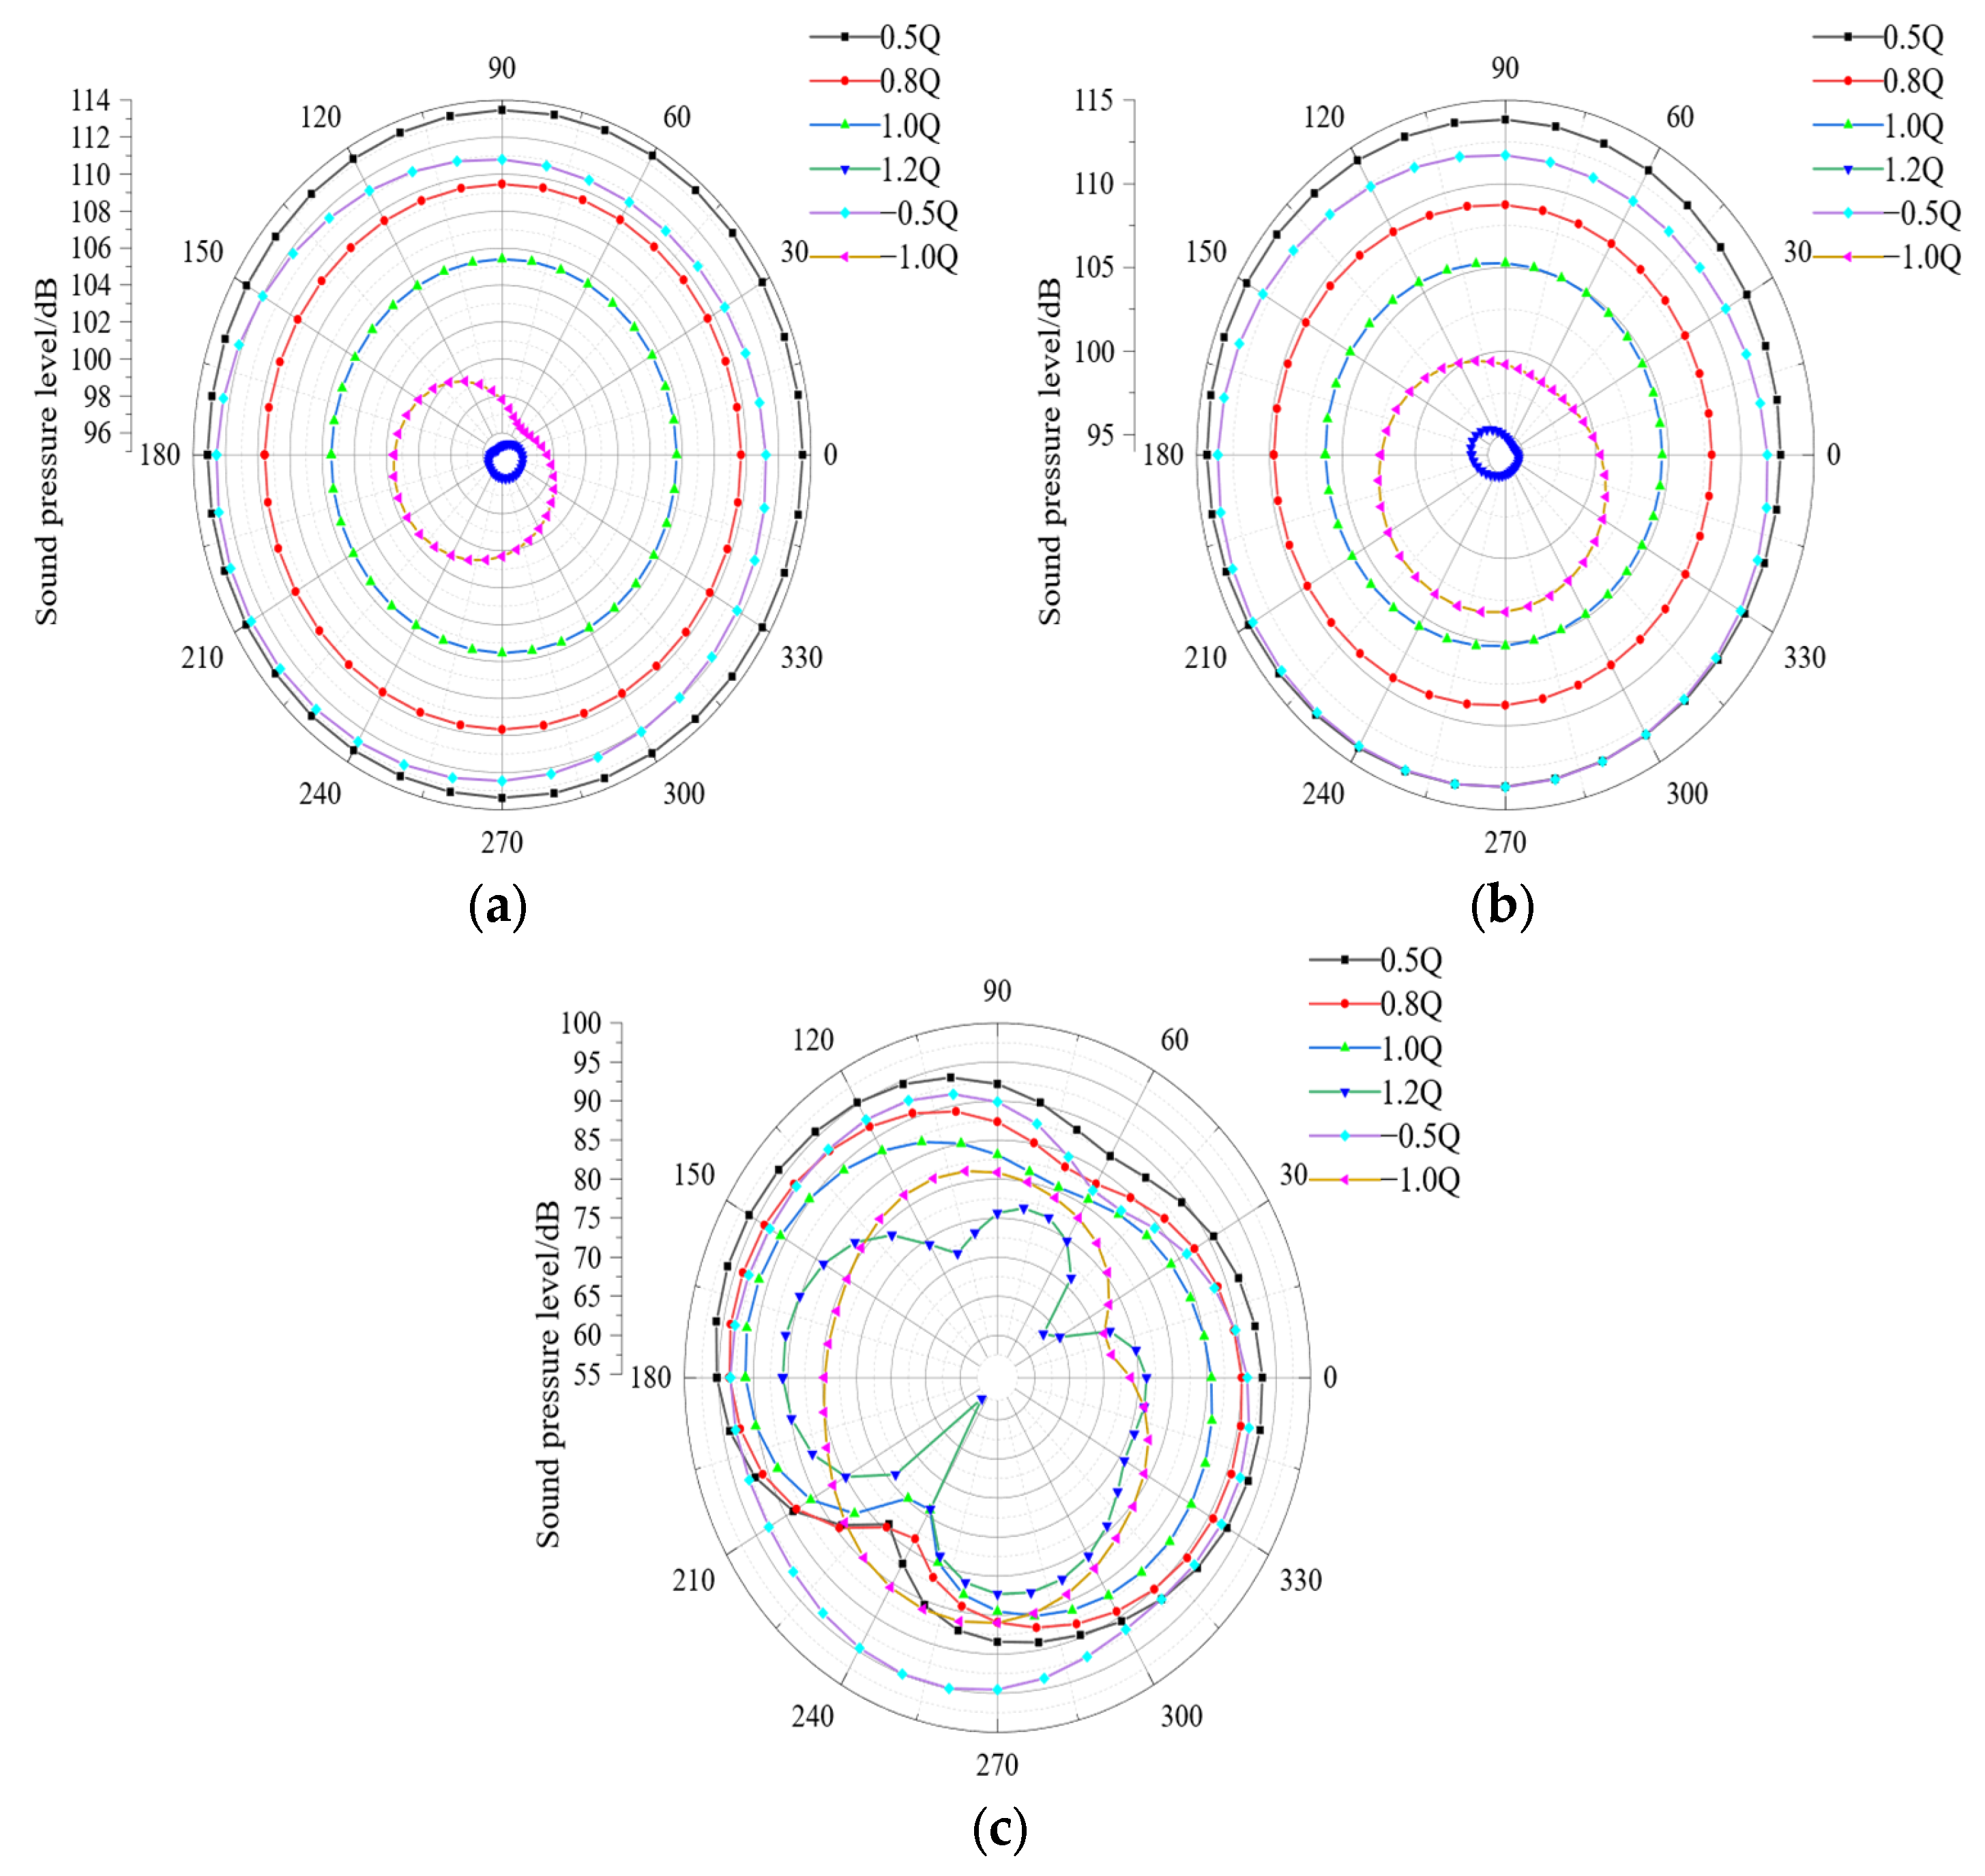
Figure 14 and Figure 15 are the directivity distributions of flow-induced noise at different positions of the XY plane from the sound source. In the figure, −0.5 Q and −1.0 Q represent the flow conditions corresponding to reverse operation. With the change in the flow rate, the influence of the external noise radiation capacity is the weakest under large flow conditions and the strongest under small flow conditions. Under the low flow condition, the water flow in the outlet channel is insufficient to supplement the cavity position, aggravating the formation of the eddy current and affecting the noise radiation. This result is consistent with the previous effect of pressure pulsation changes. When the pump is running in a low flow condition, the flow state inside the runner is worse, and the low-frequency band of pressure pulsation appears cluttered. At the same time, the noise pressure value also increases significantly compared with the rated condition.
At the third-order blade frequency, the flow-induced noise exhibits a “∞”-shaped directional distribution with obvious dipole characteristics. The minimum value of the sound pressure appears near 60° and 240°, and the maximum value appears at 150° and 330°. Nearby, the position of the maximum value is located at the inlet of the guide vane. The main reason is that this position is in the dynamic and static interference areas, the velocity distribution is uneven, and the fluid flow is affected by the dynamic and static interference between the runner blades and the guide vane, indicating that the dynamic interference and static interference are caused by the main cause of flow-induced noise. The influence of flow change on the noise radiation capability is consistent with the influence of the first-order and second-order blade frequencies, which are the strongest under the condition of low flow and the weakest under the condition of high flow. The sound pressure value of the external field noise at the third-order blade frequency is significantly lower than that at the first-order and second-order blade frequencies, indicating that the influence of the external field radiation noise is weaker at high frequencies. The frequency bands are consistent, which fully shows that the pressure pulsation has a certain influence on the flow-induced noise.
When the unit runs in the forward and reverse operations, the noise directivity distribution of the sound field displays the maximum sound pressure amplitude at the first-order blade frequency and the minimum at the third-order blade frequency near and far away from the sound source. The distribution law at the sound source is consistent. As the flow rate increases, the sound pressure amplitude decreases continuously, and at the same flow rate, the sound pressure amplitude of the sound field under the pump condition is higher than that under the turbine condition. In a previous study, the pressure pulsation of the pump working condition was also stronger than that of the turbine working condition at the same flow rate. The primary frequency of the runner chamber’s pressure pulsation is the blade frequency, consistent with the sound field distribution of the flow-induced noise, showing that the noise characteristics are closely related to the pressure pulsation distribution in the unit.
5. Conclusions
This study uses experiments to measure the pressure pulsation at the runner inlet and the leading inlet of an axial flow pump. It obtains the external characteristic curve of the axial flow pump simultaneously to verify the calculation results obtained from the numerical simulation. The pressure pulsation distribution at the runner’s inlet and outlet is obtained from the calculation. This study imports the pressure pulsation result as the sound source into the acoustic calculation software to obtain the sound field distribution of the axial flow pump blade and explores the correlation between the pressure pulsation and the flow-induced noise. The research results are as follows.
- The axial flow pump’s external characteristic curve obtained from the numerical simulation slightly deviates from the test value at a low flow rate, and the rest is consistent with the test value. The error is within a reasonable range. The pressure pulsation is obtained from the simulation, and the test value is obtained from the measurement. The changes with time are similar, and the primary and secondary frequency distributions are the same, indicating that the results obtained from the numerical simulation can effectively verify the test results and have high reliability.
- The unit’s pressure pulsation during forward operation is much larger than during reverse operation, and the pressure pulsation at the runner’s inlet and outlet is significantly higher than the pressure pulsation in the bladeless area. When the unit is in the pump condition, the blade frequency is the primary pressure pulsation frequency at the runner’s inlet and outlet. On the monitoring surface far from the runner chamber, the primary pressure pulsation frequency is the rotation frequency. The primary frequency at the leaf outlet is the pilot frequency, indicating that static interference and dynamic interference primarily affect the pressure pulsation and have a specific relationship with the number of blades. With the increase in flow rate, the pressure pulsation amplitude decreases. The flow state is poor at a low flow rate, and spurious frequencies occur in the low-frequency band. Avoiding the operation of low flow conditions can effectively reduce the pressure pulsation and protect the unit.
- The flow-induced noise is distributed symmetrically at each blade frequency and has dipole characteristics. At the first-order blade frequency, the sound field’s radiation characteristics are the strongest, and the sound pressure amplitude is the largest. The sound pressure amplitude decreases, and the sound field radiation characteristics under the pump condition are significantly stronger than that of the turbine at the same flow rate. Consistent with the pressure pulsation change, the blade frequency primarily affects the flow-induced noise sound field distribution and the radiation characteristics. The same is true for the sound pressure distribution variation with flow rate.
Author Contributions
Conceptualization, D.W.; methodology, D.W.; software, D.W.; validation, D.W.; formal analysis, D.W.; investigation, D.W.; resources, D.W.; data curation, D.W.; writing—original draft preparation, D.W.; writing—review and editing, Y.B.; visualization, D.W.; supervision, D.W.; project administration, Y.B. All authors have read and agreed to the published version of the manuscript.
Funding
This work was supported by the National Natural Science Foundation of China (11402115) and the Jiangsu Province Natural Science Foundation (BK20130782) of China.
Data Availability Statement
The data is unavailable due to privacy or ethical restrictions.
Acknowledgments
We thank the Qinhuaihe Pumping Station for providing the unit for testing. We also thank our colleagues for their help and knowledge in the experiment and their support and assistance in the use of the software.
Conflicts of Interest
The authors declare no conflict of interest.
References
- Nautiyal, H.; Kumar, A. Reverse running pumps analytical, experimental and computational study: A review. Renew. Sustain. Energy Rev. 2010, 14, 2059–2067. [Google Scholar] [CrossRef]
- Reuter, E.L. Applications of automatic equipment identification to studies of rail noise and vibration in North America. J. Acoust. Soc. Am. 2016, 140, 3094. [Google Scholar] [CrossRef]
- Desheng, Z.; Haiyu, W.; Weidong, S.; Qingyun, D.; Yuquan, Z.; Weidong, L. Pressure fluctuation characteristic test of axial flow pump under multiple working conditions. Trans. Chin. Soc. Agric. Mach. 2014, 45, 139–145. [Google Scholar]
- Jurevicius, D.; Evans, T.; Stead, M. A New Approach to Implementing Facade Treatments in Context of the South Australian Road Traffic Noise Guidelines. Acoust. Aust. 2016, 44, 263–271. [Google Scholar] [CrossRef]
- He, A.; Shao, C. Study on the induced noise of gas–liquid two-phase flow in a centrifugal pump. Appl. Acoust. 2021, 176, 107892. [Google Scholar] [CrossRef]
- Rismondo, G.; Cianferra, M.; Armenio, V. Acoustic Response of a Vibrating Elongated Cylinder in a Hydrodynamic Turbulent Flow. J. Mar. Sci. Eng. 2022, 10, 1918. [Google Scholar] [CrossRef]
- Zheng, Y.; Quan, L.; Jiahai, H. Study on pulsation characteristics and noise of dual control axial piston pump with variable speed and variable displacement. J. Mech. Eng. 2016, 52, 176–184. [Google Scholar]
- Xiaorui, C.; Chengli, J.; Congxin, Y.; Xiaogang, L. Influence of circumferential arrangement of guide vane on pressure fluctuation of nuclear main pump. J. Mech. Eng. 2016, 52, 197–204. [Google Scholar]
- Jiao, W.; Cheng, L.; Yan, H.; Jiang, H. Study on pressure fluctuation characteristics of Ultra-low Head bidirectional flow channel pump device. J. Hydroelectr. Eng. 2019, 38, 101–112. [Google Scholar]
- Li, R.; Li, J.; Quan, H.; Hui, P.; Pai, B. Pressure fluctuation characteristics in cascades and their effects on convective noise. J. Mech. Eng. 2019, 55, 225–232. [Google Scholar]
- Yeo, S.-J.; Hong, S.Y.; Song, J.-H.; Kwon, H.-W.; Seol, H.-S. Integrated analysis of flow-induced noise from submarine under snorkel condition. Proc. Inst. Mech. Eng. Part M J. Eng. Marit. Environ. 2020, 234, 147509022091659. [Google Scholar] [CrossRef]
- Zhai, J.; Zhu, B.; Li, K.; Wang, K.; Cao, S. Study on internal pressure fluctuation characteristics of guide vanes of low specific speed mixed flow pump. Trans. Chin. Soc. Agric. Mach. 2016, 47, 42–46. [Google Scholar]
- Jin, S.; Wang, Y.; Su, Y.; Chang, S. Study on pressure fluctuation characteristics of mixed flow pump internal flow field. Trans. Chin. Soc. Agric. Mach. 2013, 44, 64–68. [Google Scholar]
- Zheng, Y.; Chen, Y.; Mao, X.; Wang, H.; Shi, W.; Kan, K.; Zhang, Y. Pressure fluctuation characteristics of mixed flow pump and its influence on flow induced noise. J. Agric. Eng. 2015, 31, 67–73. [Google Scholar]
- Li, W.; Ji, L.; Shi, W.; Zhou, L.; Ping, Y. Pressure fluctuation test of mixed flow pump under different flow conditions. Trans. Chin. Soc. Agric. Mach. 2016, 47, 70–76. [Google Scholar]
- Shi, W.; Zhou, P.; Zhang, D.; Zhou, L. Unsteady pressure pulsation characteristics of high specific speed diagonal flow pump. Trans. Chin. Soc. Agric. Eng. 2011, 27, 147–152. [Google Scholar]
- Zhang, D.; Liu, J.; Geng, L.; Shi, L.; Zhang, J. Numerical simulation and experiment of pressure pulsation of inclined flow pump under small flow condition. Trans. Chin. Soc. Agric. Mach. 2017, 48, 117–125. [Google Scholar]
- Zhang, D.; Wang, C.; Dong, Y.; Shi, L.; Jin, Y. Experimental study on internal pressure pulsation characteristics of high specific speed diagonal flow pump. J. Vib. Shock. 2019, 38, 27–34. [Google Scholar]
- Mao, X.; Pavesi, G.; Chen, D.; Xu, H.; Mao, G. Flow induced noise characterization of pump turbine in continuous and intermittent load rejection processes. Renew. Energy 2019, 139, 1029–1039. [Google Scholar] [CrossRef]
- Waqas, M.; Ahmad, N. Computation of Stress Distribution in Hydraulic Horizontal Propeller Turbine Runner Based on Fluid–Structure Interaction Analysis. Arab. J. Sci. Eng. 2020, 45, 9325–9337. [Google Scholar] [CrossRef]
- Mao, X.; Sun, A.; Pavesi, G.; Zhen, Y.; Ge, X. Numerical simulation of flow induced noise during load rejection of pump turbine. Trans. Chin. Soc. Agric. Eng. 2018, 34, 52–58. [Google Scholar]
- Liu, H.; Liu, D.; Wang, Y.; Wu, X.-f.; Wang, J.; Du, H. Experimental investigation and numerical analysis of unsteady attached sheet cavitating flows in a centrifugal pump. J. Hydrodyn. 2013, 25, 370–378. [Google Scholar] [CrossRef]
- Si, Q.; Yuan, J.; Yuan, J.; Yang, J. Numerical prediction of centrifugal pump flow induced noise based on CFD/Ca. J. Mech. Eng. 2013, 49, 177–184. [Google Scholar]
- Peijian, Z.; Fujun, W.; Zhifeng, Y. Study on pressure fluctuation characteristics of centrifugal pump impeller under rotating stall condition. Trans. Chin. Soc. Agric. Mach. 2015, 46, 56–61. [Google Scholar]
- Houlin, L.; Jian, D.; Yong, W.; Minggao, T.; Huan, X. Numerical simulation of hydrodynamic noise of centrifugal pump based on large eddy simulation. J. Mech. Eng. 2013, 49, 177–183. [Google Scholar]
- Zhenyu, W.; Ailing, Y.; Rong, D. Numerical prediction of flow induced noise in centrifugal pumps. J. Mech. Eng. 2012, 48, 162–167. [Google Scholar]
- Shouqi, Y.; Qiaorui, S.; Fei, X.; Yuan, J.; Zhang, Z. Numerical calculation of flow induced noise in volute of centrifugal pump. J. Drain. Irrig. Mach. Eng. 2011, 29, 93–98. [Google Scholar]
- Qiao, R.; Guochen, S.; Yaguang, H.; Qianglei, C.; Kaile, H.; Jiangsu University Fluid Machinery Engineering Technology Research Center. Numerical simulation of centrifugal pump flow induced noise based on Lighthill acoustic analogy theory. J. Vib. Shock. 2018, 37, 84–90, 97. [Google Scholar]
Figure 1.
Flow channel diagram. 1. Inlet channel. 2. Front guide vane. 3. Runner. 4. Guide vane. 5. Outlet channel.
Figure 1.
Flow channel diagram. 1. Inlet channel. 2. Front guide vane. 3. Runner. 4. Guide vane. 5. Outlet channel.

Figure 2.
Grid independence verification. A4.2 × 106 B4.46 × 106 C5.2 × 106.

Figure 3.
Unstructured mesh in some regions of the axial flow pump in the flow field. (a) Front guide vane area. (b) Turbine blade region. (c) Active guide vane region.
Figure 3.
Unstructured mesh in some regions of the axial flow pump in the flow field. (a) Front guide vane area. (b) Turbine blade region. (c) Active guide vane region.

Figure 4.
Monitoring point setting.

Figure 5.
Sound field settings. (a) Sound field monitoring surface. (b) Acoustic computation grid.

Figure 6.
(a) Forward characteristic curve. (b) Inverse characteristic curve.

Figure 7.
Experimental setup. (a) Monitoring point layout. (b) Pressure sensor. (c) Measuring instrument.
Figure 7.
Experimental setup. (a) Monitoring point layout. (b) Pressure sensor. (c) Measuring instrument.


Figure 8.
Comparison of experimental and numerical simulation results. (a) Time domain diagram of inlet pressure pulsation of preguide vanes. (b) Time domain diagram of runner inlet pressure pulsation. (c) The frequency domain diagram of the inlet pressure pulsation of the front guide vane. (d) Frequency domain diagram of runner inlet pressure pulsation.

Figure 9.
Pressure pulsation peak-to-peak. (a) Run forward. (b) Run in reverse.

Figure 10.
Frequency domain distribution of pressure pulsation in pump working conditions. (a) Monitoring point a3 (b) Monitoring point b3. (c) Monitoring point c3.
Figure 10.
Frequency domain distribution of pressure pulsation in pump working conditions. (a) Monitoring point a3 (b) Monitoring point b3. (c) Monitoring point c3.


Figure 11.
The frequency domain distribution of pressure pulsation under turbine operating conditions. (a) Monitoring point a3 (b) Monitoring point b3. (c) Monitoring point c3.
Figure 11.
The frequency domain distribution of pressure pulsation under turbine operating conditions. (a) Monitoring point a3 (b) Monitoring point b3. (c) Monitoring point c3.


Figure 12.
Amplitude distribution of sound pressure amplitude in pump conditions. (a) 1.0 Q first-order leaf frequency sound pressure amplitude. (b) 1.0 Q second-order leaf frequency sound pressure amplitude. (c) 1.0 Q third-order leaf frequency sound pressure amplitude.
Figure 12.
Amplitude distribution of sound pressure amplitude in pump conditions. (a) 1.0 Q first-order leaf frequency sound pressure amplitude. (b) 1.0 Q second-order leaf frequency sound pressure amplitude. (c) 1.0 Q third-order leaf frequency sound pressure amplitude.

Figure 13.
Amplitude distribution of sound pressure in turbine operating conditions. (a) 1.0 Q first-order leaf frequency sound pressure amplitude. (b) 1.0 Q second-order leaf frequency sound pressure amplitude. (c) 1.0 Q third-order leaf frequency sound pressure amplitude.
Figure 13.
Amplitude distribution of sound pressure in turbine operating conditions. (a) 1.0 Q first-order leaf frequency sound pressure amplitude. (b) 1.0 Q second-order leaf frequency sound pressure amplitude. (c) 1.0 Q third-order leaf frequency sound pressure amplitude.

Figure 14.
Noise directivity distribution at the sound source. (a) First-order. (b) Second-order. (c) Third-order.
Figure 14.
Noise directivity distribution at the sound source. (a) First-order. (b) Second-order. (c) Third-order.

Figure 15.
Noise directivity distribution. (a) First-order. (b) Second-order. (c) Third-order.


Table 1.
Parameters of axial flow pump.
| Pump | 1700ZWSQ10-2.5 | Blade Placement Angle | –6° ~ + 4° |
|---|---|---|---|
| Diameter of impeller | 1.7 m | Impeller center elevation | 1 m |
| Number of impeller blades | 4 | Design discharge | 10 m3/s |
| Number of front guide vanes | 5 | Design head | 2.5 m |
| Number of guide vanes | 7 | Design speed | 250 r/min |
Disclaimer/Publisher’s Note: The statements, opinions and data contained in all publications are solely those of the individual author(s) and contributor(s) and not of MDPI and/or the editor(s). MDPI and/or the editor(s) disclaim responsibility for any injury to people or property resulting from any ideas, methods, instructions or products referred to in the content. |
© 2023 by the authors. Licensee MDPI, Basel, Switzerland. This article is an open access article distributed under the terms and conditions of the Creative Commons Attribution (CC BY) license (https://creativecommons.org/licenses/by/4.0/).
Share and Cite
MDPI and ACS Style
Wu, D.; Bai, Y. Numerical Simulation of Flow-Induced Noise in Horizontal Axial Flow Pumps in Forward and Reverse Conditions. Water 2023, 15, 322. https://doi.org/10.3390/w15020322
AMA Style
Wu D, Bai Y. Numerical Simulation of Flow-Induced Noise in Horizontal Axial Flow Pumps in Forward and Reverse Conditions. Water. 2023; 15(2):322. https://doi.org/10.3390/w15020322
Chicago/Turabian StyleWu, Donglei, and Yalei Bai. 2023. "Numerical Simulation of Flow-Induced Noise in Horizontal Axial Flow Pumps in Forward and Reverse Conditions" Water 15, no. 2: 322. https://doi.org/10.3390/w15020322
Note that from the first issue of 2016, this journal uses article numbers instead of page numbers. See further details here.