
Phenology-Based Remote Sensing Assessment of Crop Water Productivity

State Key Laboratory of Water Resources and Hydropower Engineering Science, Wuhan University, Wuhan 430072, China
*
Authors to whom correspondence should be addressed.
Water 2023, 15(2), 329; https://doi.org/10.3390/w15020329
Submission received: 9 November 2022
/
Revised: 8 January 2023
/
Accepted: 10 January 2023
/
Published: 12 January 2023
(This article belongs to the Section Water, Agriculture and Aquaculture)
Abstract
:The assessment of crop water productivity (CWP) is of practical significance for improving regional agricultural water use efficiency and water conservation levels. The remote sensing method is a common method for estimating large scale CWP, and the assessment errors in CWP by remote sensing originate mainly from remote sensing inversion errors in crop yield and evapotranspiration (ET). The phenological period is the important factor in crop ET and yield estimation. The crop coefficient (Kc) and harvest index (HI), which are closely related to different phenological periods, are considered during the processes of crop ET and yield estimation. The crop phenological period is detected from enhanced vegetation index (EVI) curves using Moderate Resolution Imaging Spectroradiometer (MODIS) data and Sentinel-2 data. The crop ET is estimated using the surface–energy balance algorithm for land (SEBAL) model and Penman‒Monteith (P-M) equation, and the crop yield is estimated using the dry matter mass–harvest index method. The CWP is calculated as the ratio of the crop yield to ET during the growing season. The results show that the daily ET and crop yield estimated from remote sensing images are consistent with the measured values. It is found from the variation in daily ET that the peaks appear at the heading period of wheat and maize, which are in good agreement with the rainfall and growth characteristics of the crop. The relationship between crop yield and ET shows a negative parabolic correlation, and that between CWP and crop yield shows a linear correlation. The average CWPs of wheat and maize are 1.60 kg/m3 and 1.39 kg/m3, respectively. The results indicate that the phenology-based remote sensing inversion method has a good effect on the assessment of CWP in Lixin County.
1. Introduction
Scarcity of water resources is one of the main constraints to achieving more food production [1]. CWP is an important indicator for assessing agricultural water resources, reflecting whether agricultural production levels and irrigation methods are scientific and reasonable. It also provides a reliable basis for water resource management [2]. CWP is the ratio of crop yield to its evapotranspiration during the growing season [3,4]. There are different water requirements and water contributions to yield at different stages of crop growth and development. Therefore, the crop phenological stage is an important factor in the remote sensing retrieval process of ET and yield, which is closely related to the estimation of CWP.
The remote sensing method of retrieving crop ET and yield from satellite images is a common method for estimating large-scale CWP [5,6]. Cai et al. [7] estimated the actual ET by the Surface Energy Balance System (SSEB) remote sensing inversion model and crop yield from NDVI products of MODIS and then evaluated the CWP of rice in the Indo-Gangetic River basin. Zwart et al. [8] developed a water productivity model (WATPRO) on the basis of remote-sensing-derived input datasets, which was a combination of Monteith’s theoretical framework for crop yield and an energy balance model to assess ET. Nana Yan et al. [9] estimated crop ET using ETWatch and yield using the Carnegie–Ames–Stanford Approach (CASA) model, with the purpose of analyzing crop water productivity in the Haihe basin. Bastiaanssen and Steduto [1] assessed the global water productivity of wheat, rice, and maize by using the SEBAL model for ET and the dry matter mass–harvest index method. In terms of crop ET estimation, the SEBAL model as a typical single-source remote sensing model simplifies input parameters compared with dual-source models, and is more flexible for processing remote sensing images [10]. In terms of yield estimation, the dry biomass–harvest index method is a widely used crop yield estimation model by remote sensing [11,12,13]. Although remote sensing inversion models of ET and yield are widely applied in CWP assessments on a large scale, the remote sensing estimation accuracy still needs to be improved.
The assessment errors in CWP by remote sensing originate mainly from remote sensing inversion errors in crop yield and ET, which may propagate to errors in CWP as high as 108.2% [14]. Yuan et al. [15] found that the EC-LUE model has good performance in simulating gross primary production (GPP). However, HI is a fixed value without consideration of different phenology characteristics, which leads to errors in crop yield simulation. Kalma et al. [16] considered that the temporal scale expansion has an impact on evapotranspiration estimation. Errors exist especially in the temporal scale expansion from daily to the whole growth stage, and the main factor leading to this situation may be that different crops in different places have different phenological characteristics. Therefore, the accuracy of CWP may be improved by considering phenological characteristics in crop ET and yield estimation.
Due to crop phenology variability, applying fixed dates of the crop calendar to crop ET and yield estimation may affect the assessment accuracy of CWP. Kc and HI are parameters that are closely related to the phenological period. Kc is an important parameter in the temporal scale expansion of ET, and HI is an important parameter for crop yield estimation. However, Kc and HI are often defined as constants, which may lead to the low accuracy of CWP estimation [1,17]. Zhao Nana et al. [18] found that Kc varies greatly at different phenological stages of the summer maize growing season. M. Moriondo calculated HI by combining NDVI and crop phenological characteristics and applied it to agricultural water use assessment [19]. The accuracy of CWP estimation may be improved by acquiring the variability in Kc and HI on the basis of crop phenology.
Crop phenological characteristics and key time points of the crop calendar can be extracted from satellite images on the basis of remote sensing. The normalized difference vegetation index (NDVI) and EVI can reflect the change in vegetation properties in the phenological period [20]. In comparison with NDVI, EVI, which integrates information from NIR (near-infrared band) and red and blue bands, provides a better optimization for vegetation phenological signals by reducing the influence of atmospheric attenuation and canopy background uncertainty; thus, crop phenological characteristics are more accurately extracted from EVI by remote sensing than NDVI [21,22]. Two extraction methods of crop phenology from vegetation indices are the threshold method and the slope method. The threshold method needs to be manually adjusted according to crop types and area range, while the slope method occurs through the extraction of crop phenology information directly from the slope of the EVI curve [23,24,25].
In this paper, crop phenological characteristics are extracted from EVI curves according to the slope method, and the MODIS data and Sentinel-2 data are fused to improve the spatial resolution. After retrieving crop phenology by remote sensing, the cumulative ET during the growing season was obtained by using the temporal scale expansion of Kc based on crop phenology. The HI for crop yield estimation is calculated according to key phenological time points. Thus, Kc and HI based on crop phenological characteristics are introduced into the remote sensing assessment of CWP, which may improve the assessment accuracy.
Lixin County, the study area, is located in the Huaibei Plain, which is one of the important commercial grain production bases in China. The objectives of this study are to: (1) detect the crop phenological periods; (2) estimate ET, yield, and CWP of wheat and maize; (3) analyze the spatial distribution of ET, yield, and CWP; (4) analyze the results of phenological periods and ET; and (5) analyze the relationships among ET, yield, and CWP. These results will provide a reference for regional farmland water consumption and a decision-making basis for the rational and efficient allocation of regional water resources.
2. Study Area and Data Acquisition
2.1. Study Area
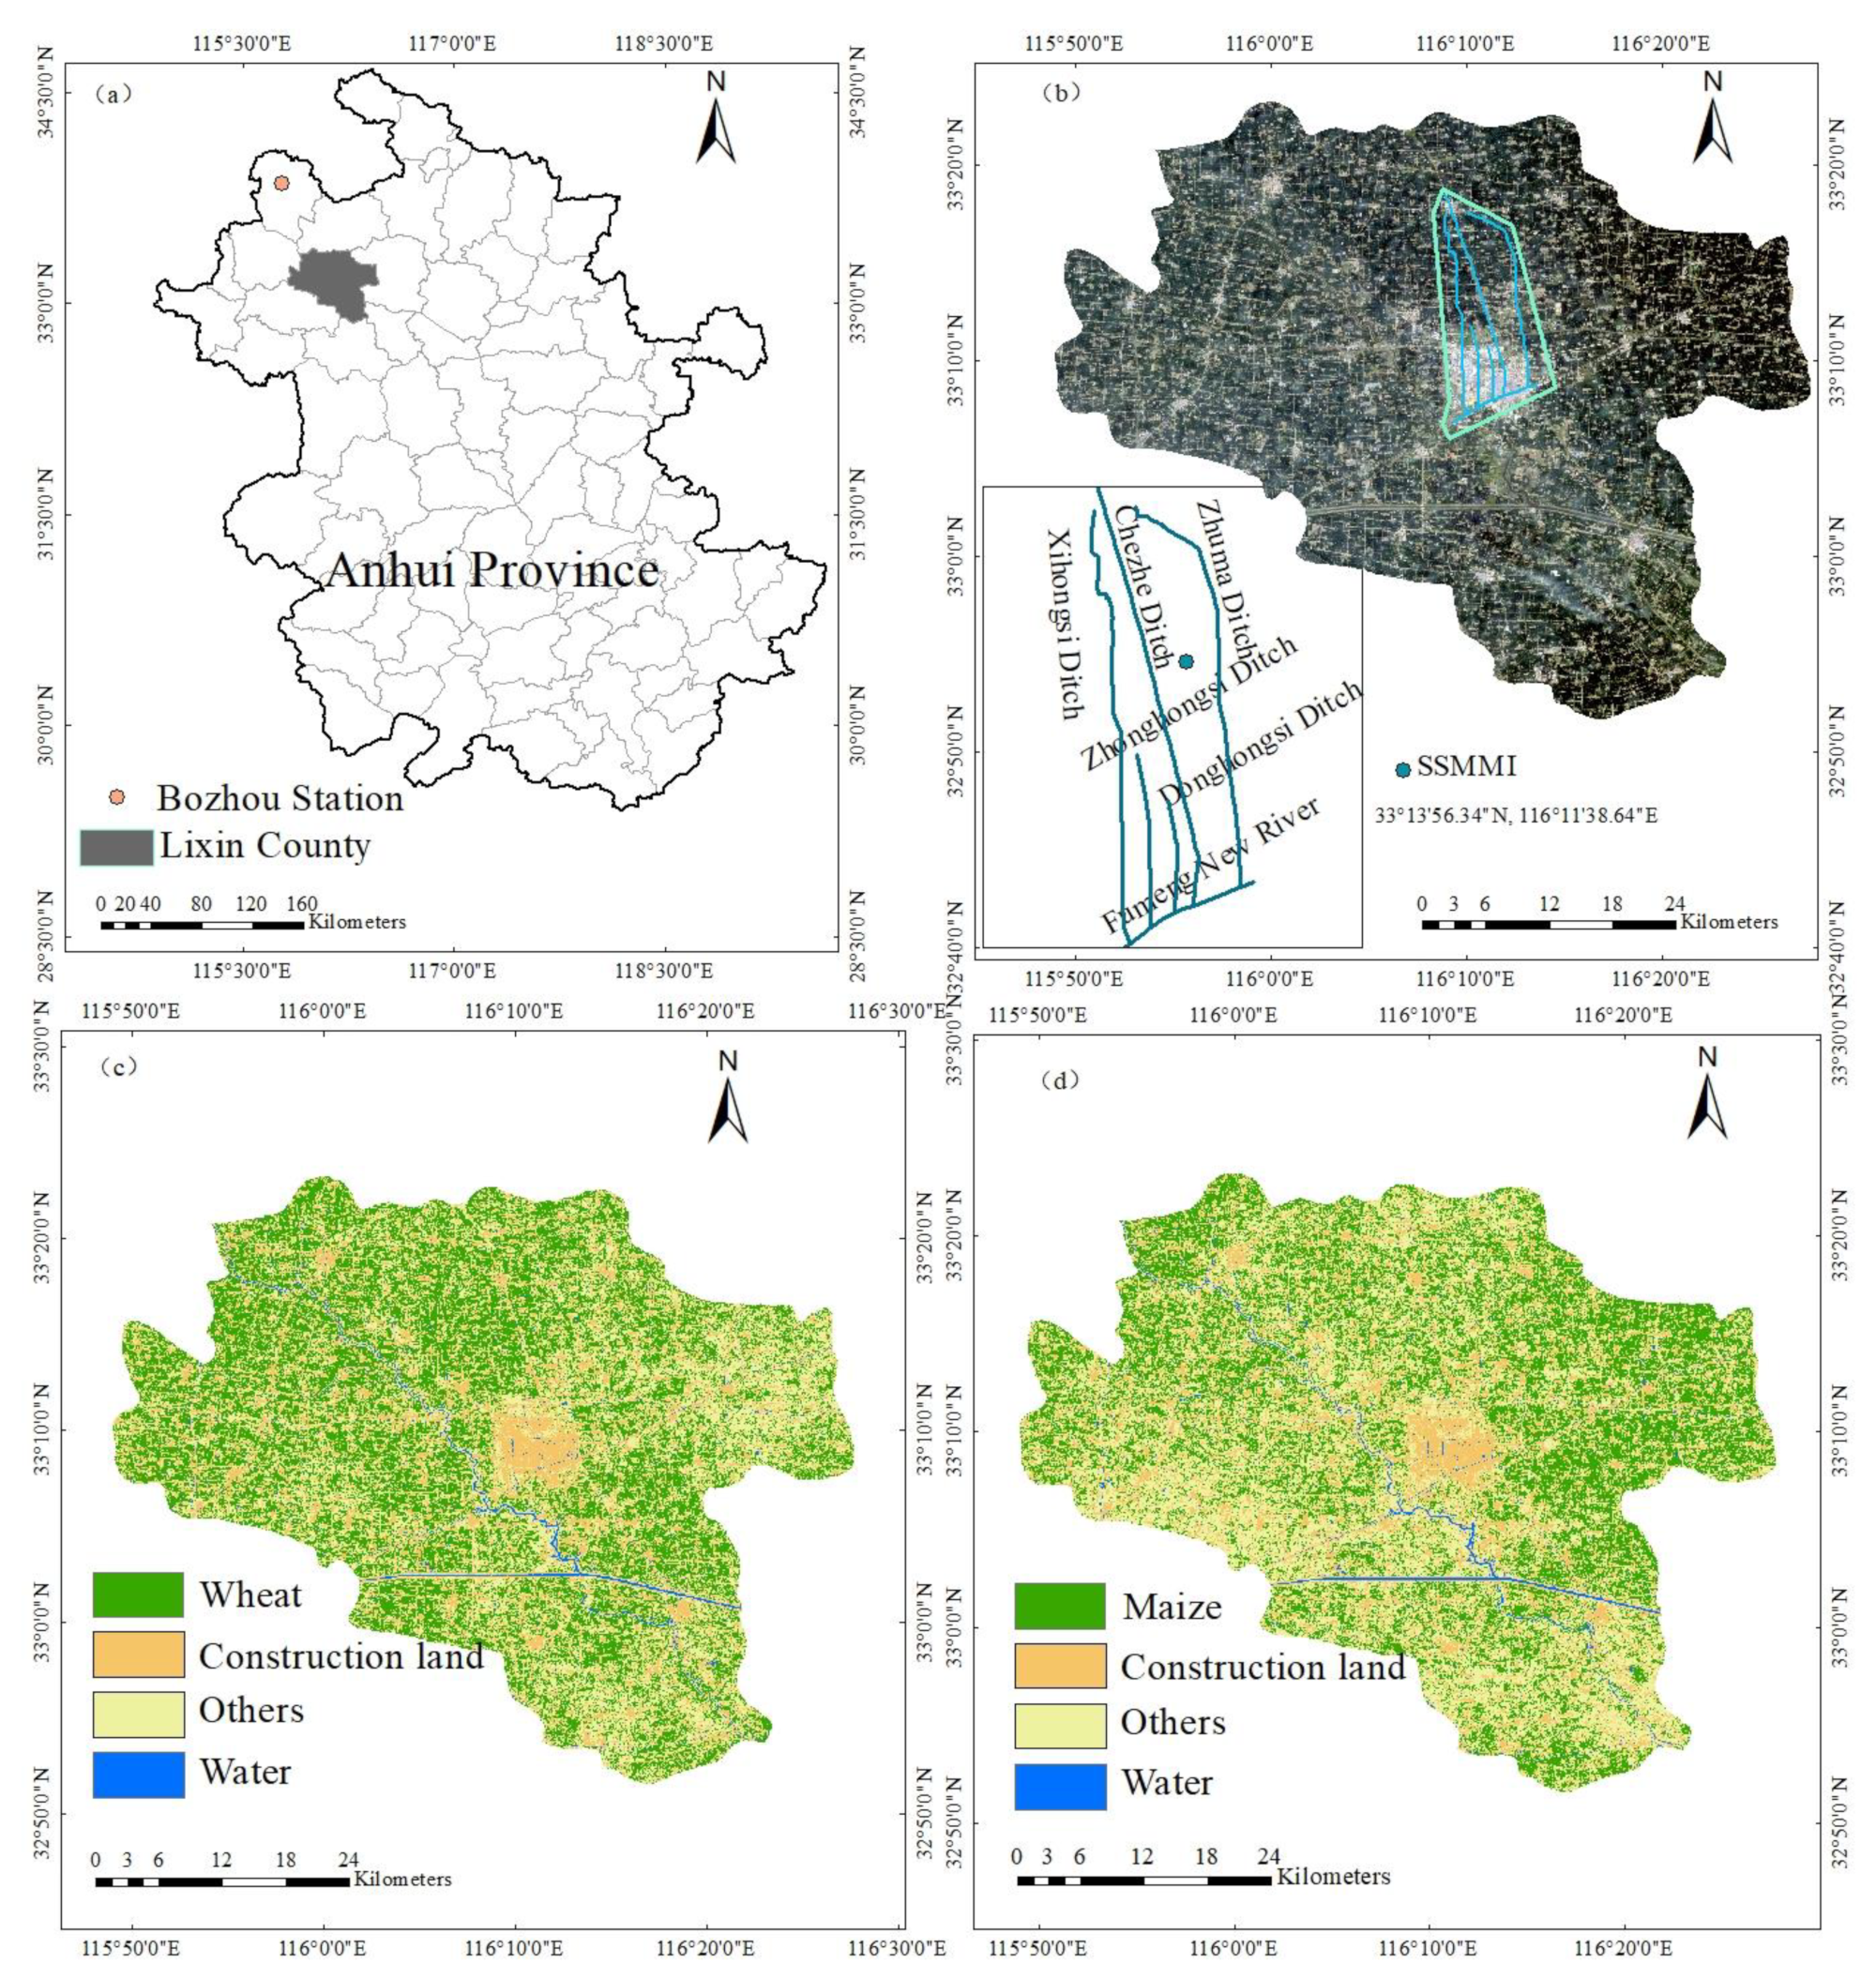
Lixin County (N 32°51′–33°27′, E 115°54′–116°31′) is in the northwest of Anhui Province, which is shown in Figure 1. The total area is approximately 2005 km2, with a population of 1.236 million. The terrain slopes gently, with an average elevation of 28 m. Arable land resources are abundant, with 1.44 ha of arable land per capita. Lixin County is located in a semi-humid monsoon climate zone, with an average annual temperature of 14.8 °C and an average annual precipitation of 824 mm. The winter is dry and less rainy, and the summer is hot and rainy. The summer harvesting crop is mainly wheat, and the autumn harvesting crop is mainly maize. The classification maps of wheat and maize in Figure 1 are extracted from Landsat images using the decision tree classification method.
2.2. Data Acquisition
2.2.1. Satellite Data
The time of the satellite data is from 2020 to 2021. The information regarding the data is shown in Table 1 and Table 2.
MOD09A1 product is the surface reflectance dataset of MODIS. The spatial resolution of the red and NIR bands is 250 m, and others are 500 m.
Sentinel-2 includes 13 bands, the highest spatial resolution of which is 10 m and the lowest spatial resolution of which is 60 m. In this paper, the blue, red, and NIR bands were chosen to calculate the EVI, with a spatial resolution of 10 m.
2.2.2. Meteorological Data
Meteorological data from Bozhou station were obtained from the China Meteorological Data Network (https://data.cma.cn/ (accessed on 15 December 2021)). The location of this station is shown in Figure 1a. The meteorological data in this paper include temperature, wind speed, actual water vapor pressure, saturated water vapor pressure, and so on, from April 2020 to June 2021.
2.2.3. Field Data
The measured ET, as the validation data, were calculated through the Soil Water Atmosphere Plant model (SWAP) combined with meteorological data, soil profile data, and soil water content data. The measured soil moisture data were obtained from the smart soil moisture monitoring instrument (SSMMI), the location of which is shown in Figure 1b.
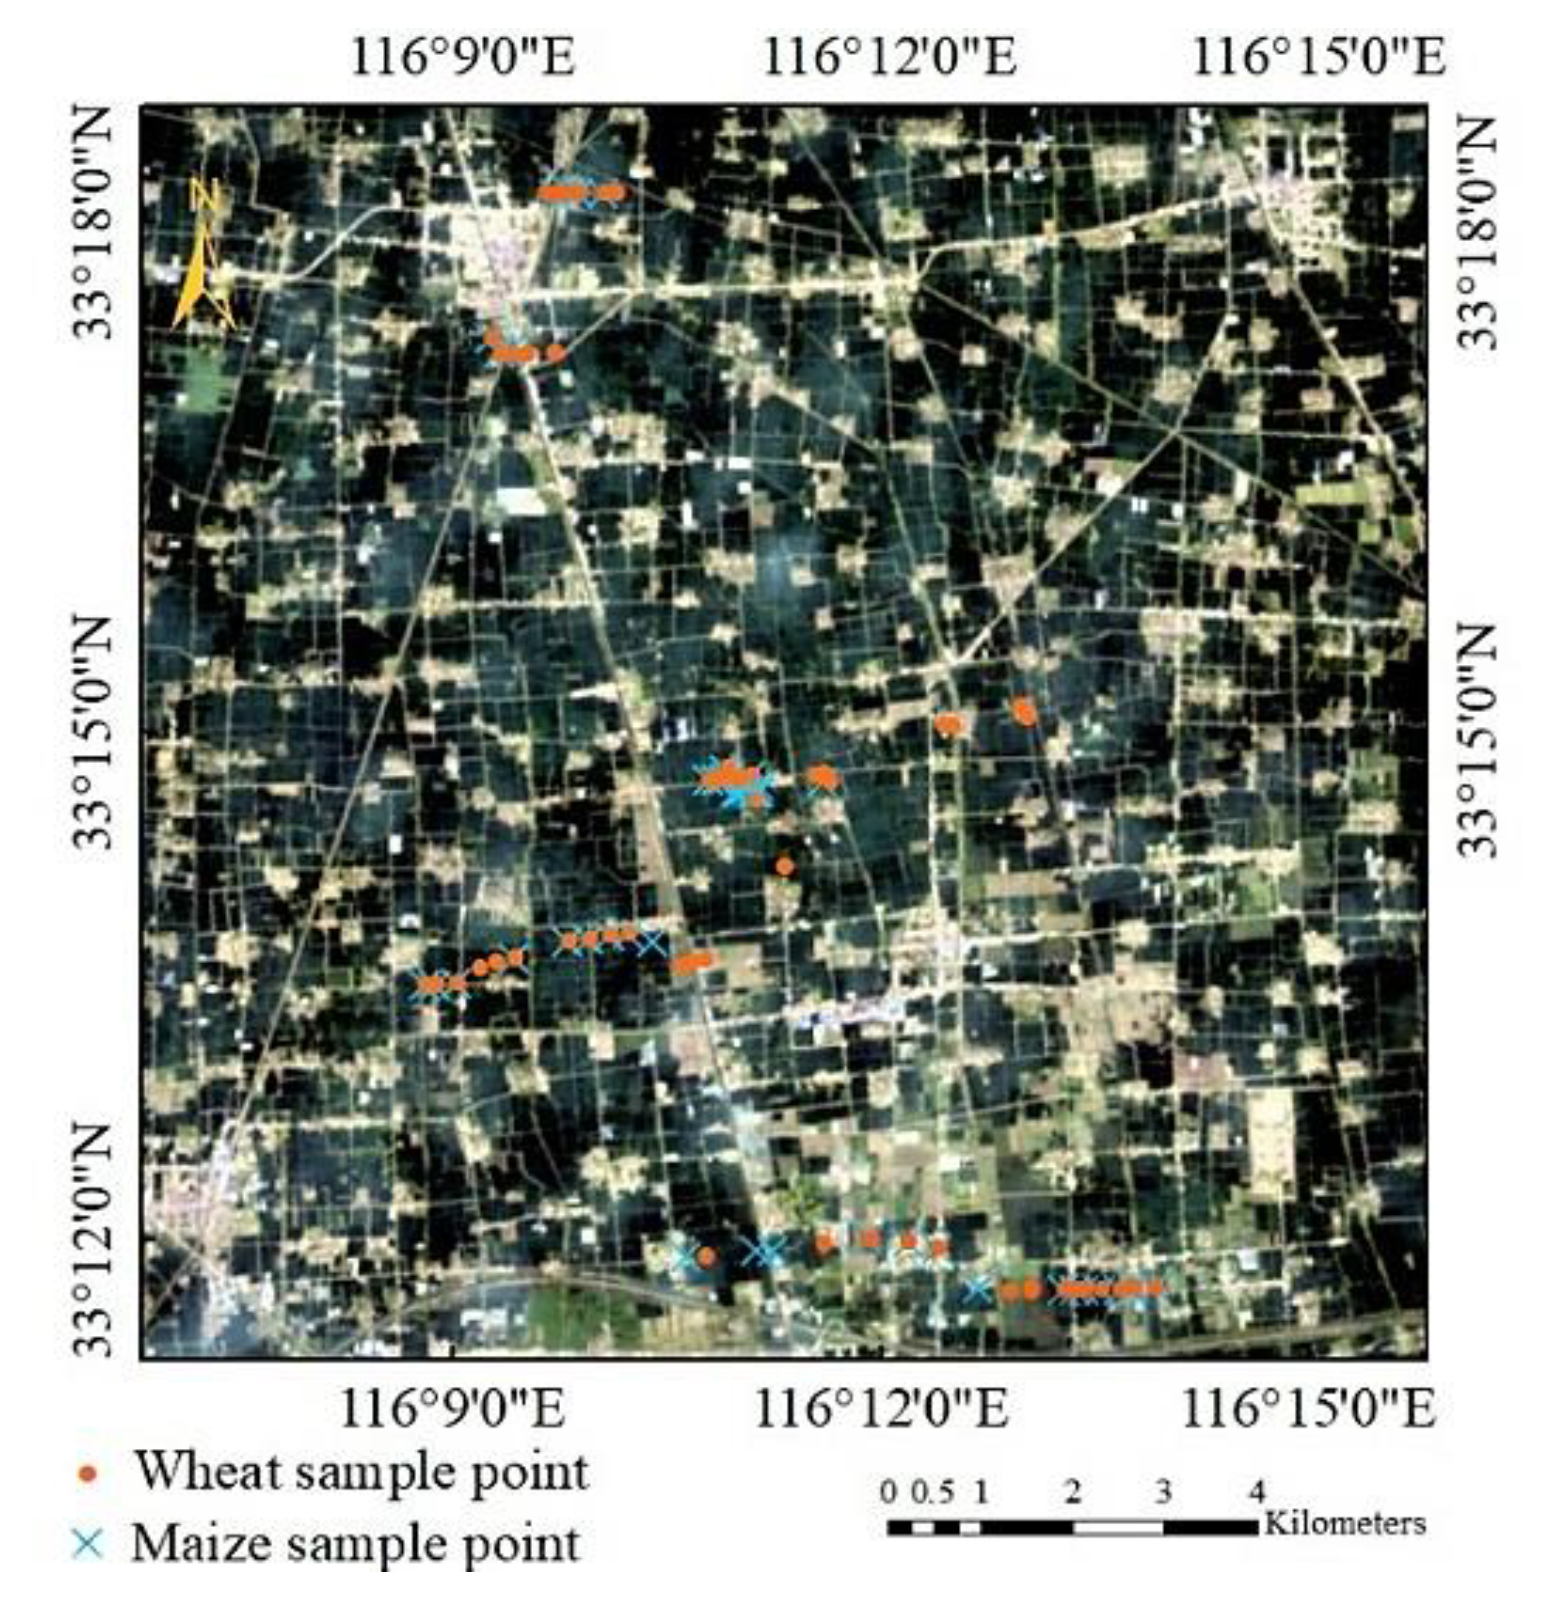
The measured yields of maize and wheat were measured near the Zhuma Ditch, Chezhe Ditch, and Xihongsi Ditch, and at the same time, the locations of the sampling sites were recorded through the handheld GPS. The locations of the sampling sites are shown in Figure 2. Maize yield was measured in late September 2021. In the field investigation, we selected 50 maize sampling points and 48 wheat sampling points. At every sampling site, 10 maize cobs were randomly selected in an area of 6 m2, which were then threshed, dried, and weighed. Wheat yield was measured at the end of May 2021. At every sampling site, some wheat ears were selected in a random area of 1 m2 and then were weighed after threshing and drying.
3. Methods
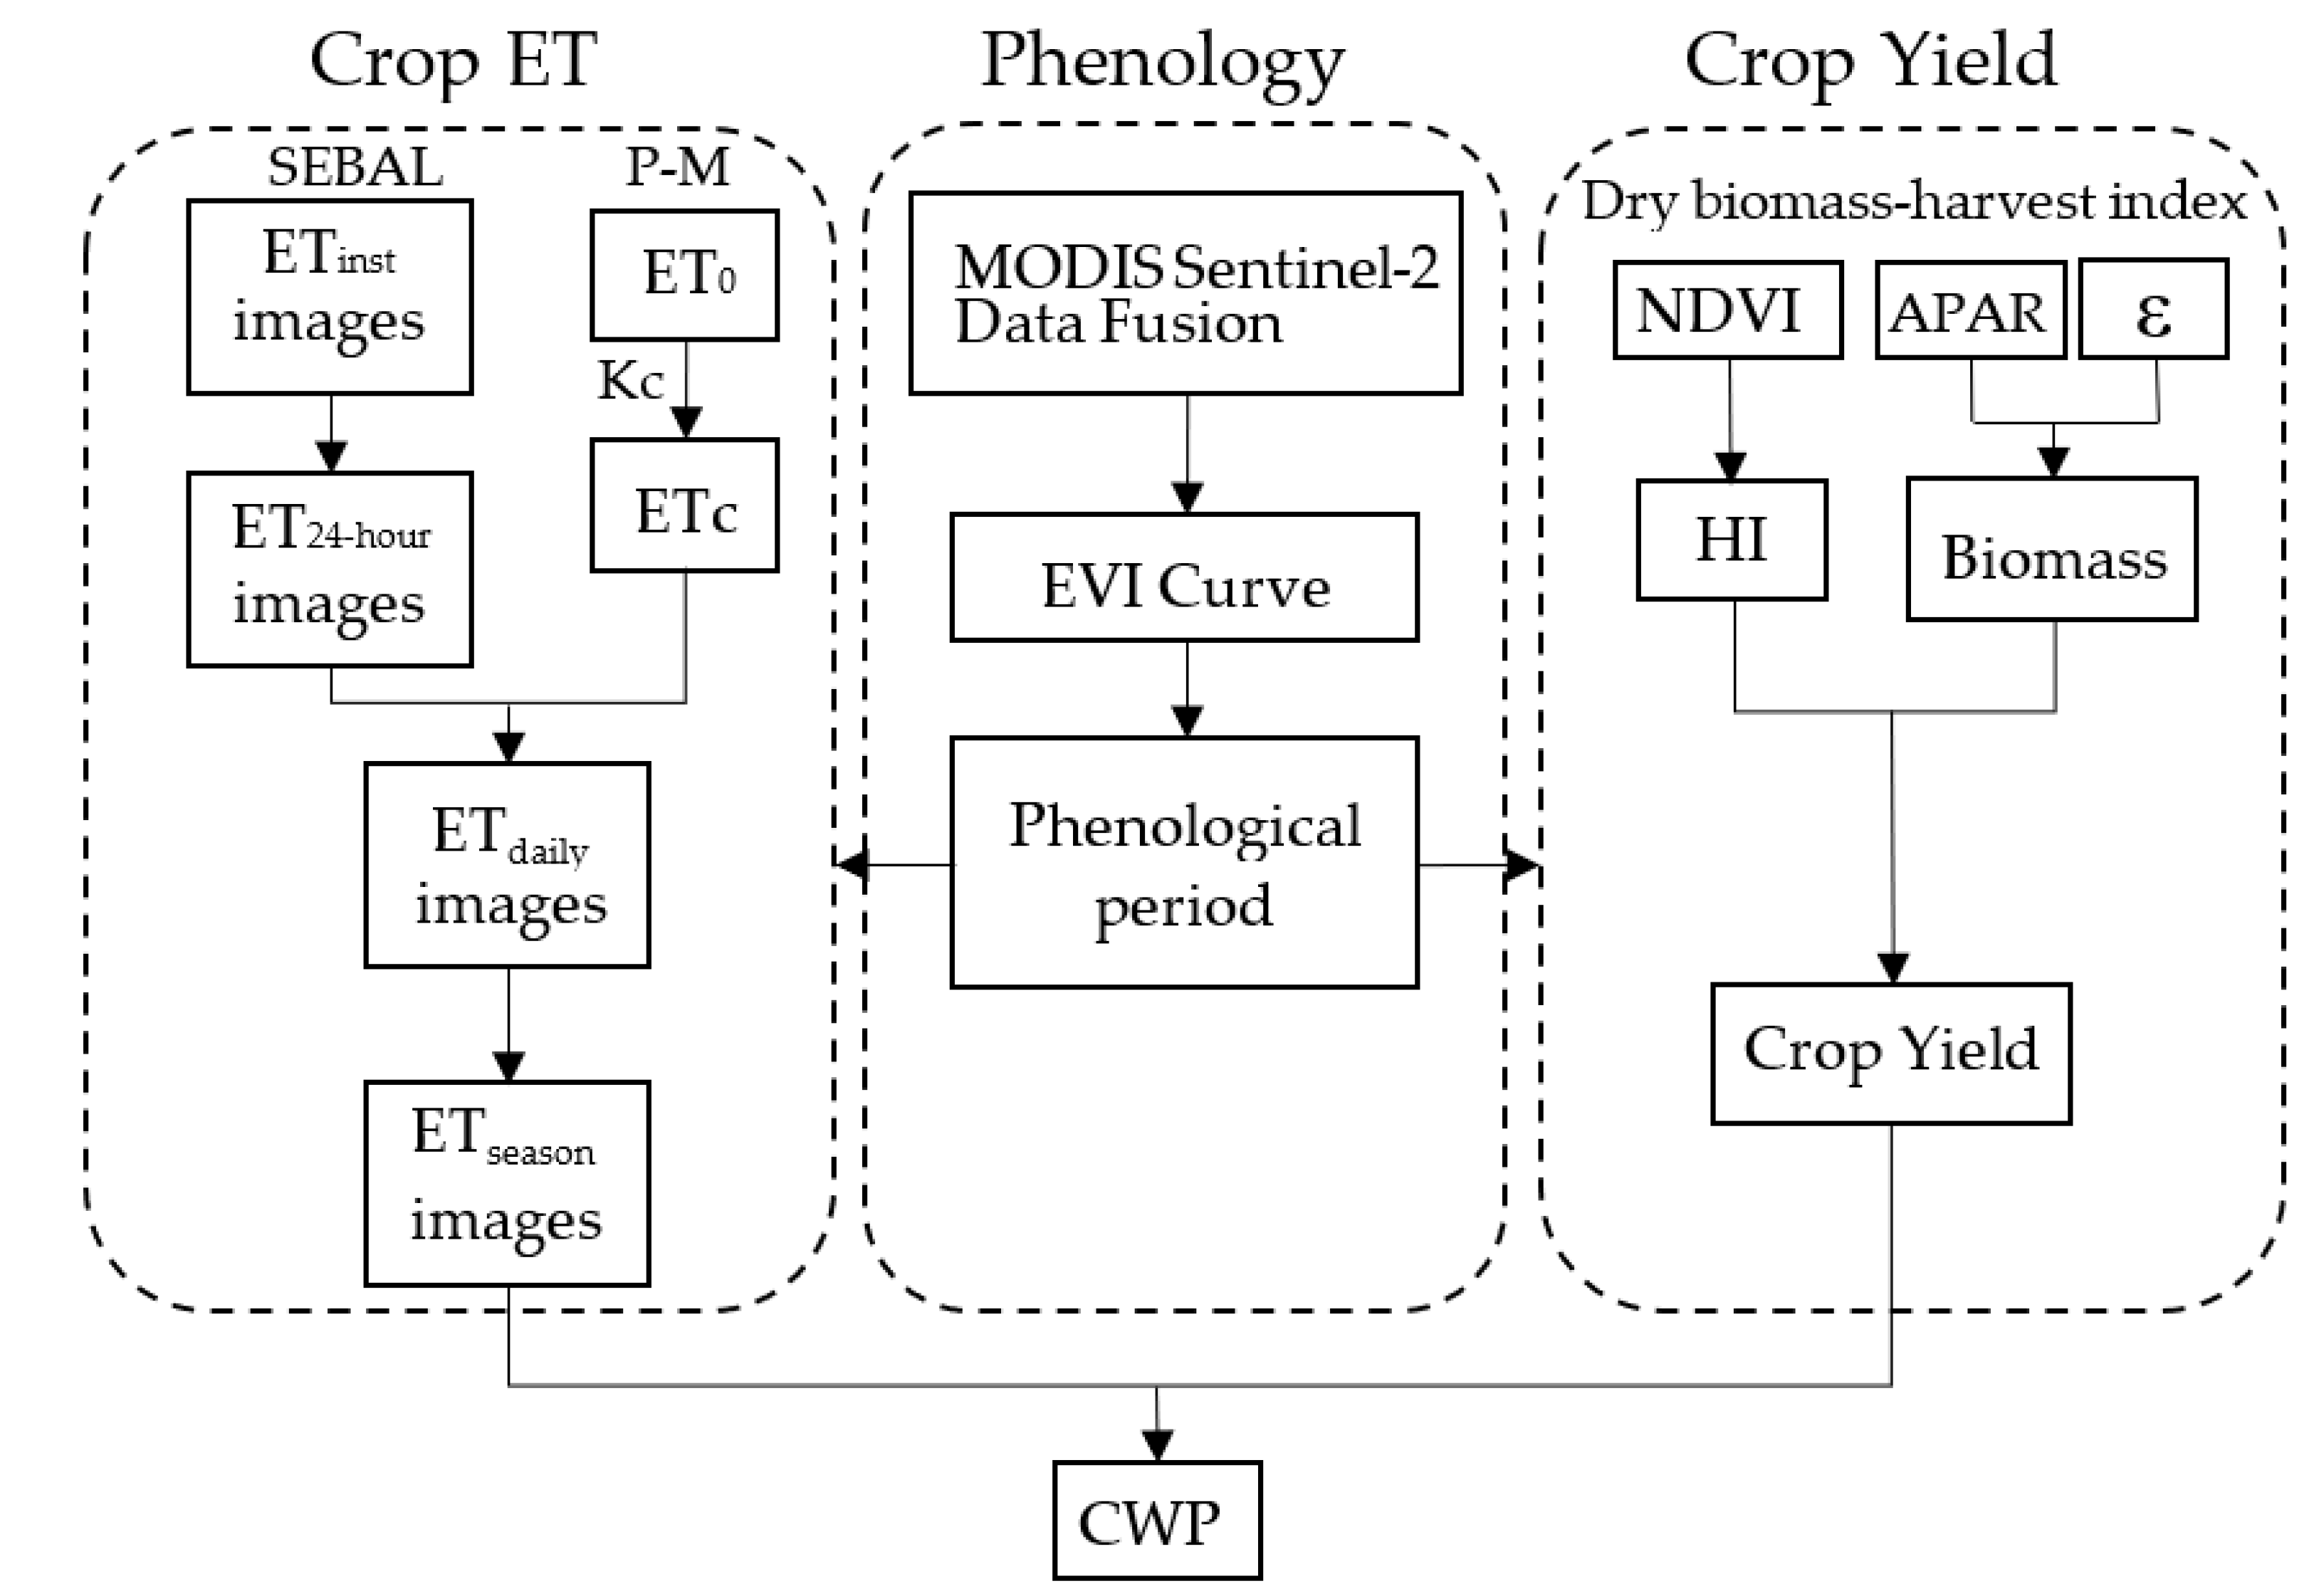
Crop water productivity (CWP) is the ratio of crop yield to ET during the growing season. Crop phenological period is detected from EVI curves based on MODIS and Sentinel-2 data. Crop seasonal ET (ETseason) is calculated by the SEBAL and P-M methods. Crop yield is estimated by the dry biomass–harvest index method. For accurate ET and yield estimation, the dates of crop phenological period are added to the processes of crop ET and yield estimation. The methodology framework is shown in Figure 3.
3.1. Crop Phenological Period Detection Method
Crop phenological periods are detected from the EVI curve by using the slope method. The MODIS and Sentinel-2 data are fused to increase the accuracy. Five phenological periods are obtained, including the sowing period, emergence period, heading period, anthesis, and maturity period.
3.1.1. The EVI Curve Extraction from the Fusion Data of MODIS and Sentinel-2
An EVI similar to NDVI is used to quantify vegetation greenness, which is appropriate for crop phenological period detection [26,27]. Satellite remote sensing image data resources provide spatially and temporally extensive options for estimate EVI values. The revisit period of MODIS is short, and the data quality is stable. However, it does not apply to the small-scale area due to the low spatial resolution [28,29]. The spatial–temporal resolution of Sentinel-2 data is higher than that of MODIS data, but the data quality is unstable [30].
In this study, MODIS and Sentinel-2 data are fused to extract EVI time series with a spatial resolution of 10 m and a time resolution of 8 d. The continuity correction method is used to correct every MODIS image using all the available Sentinel-2 images of the year. The data fusion formula is as follows:
where is the value of the image pixel after fusing. is the value of the MODIS image pixel. is the value of the Sentinel-2 image pixel. n is the number of Sentinel-2 images. is the DOY corresponding to the MODIS data; is the DOY corresponding to the Sentinel-2 data; and is the weight of the high-resolution image at . K is an empirical coefficient and accounts for the influence of missing Sentinel-2 images on data fusion.
The fundamental principle of the above data fusion method was proposed by Liu et al. [31]. In this study, the correction coefficient K is introduced in Equation (2) for correction to consider the effect of the uneven time interval of available Sentinel-2 images.
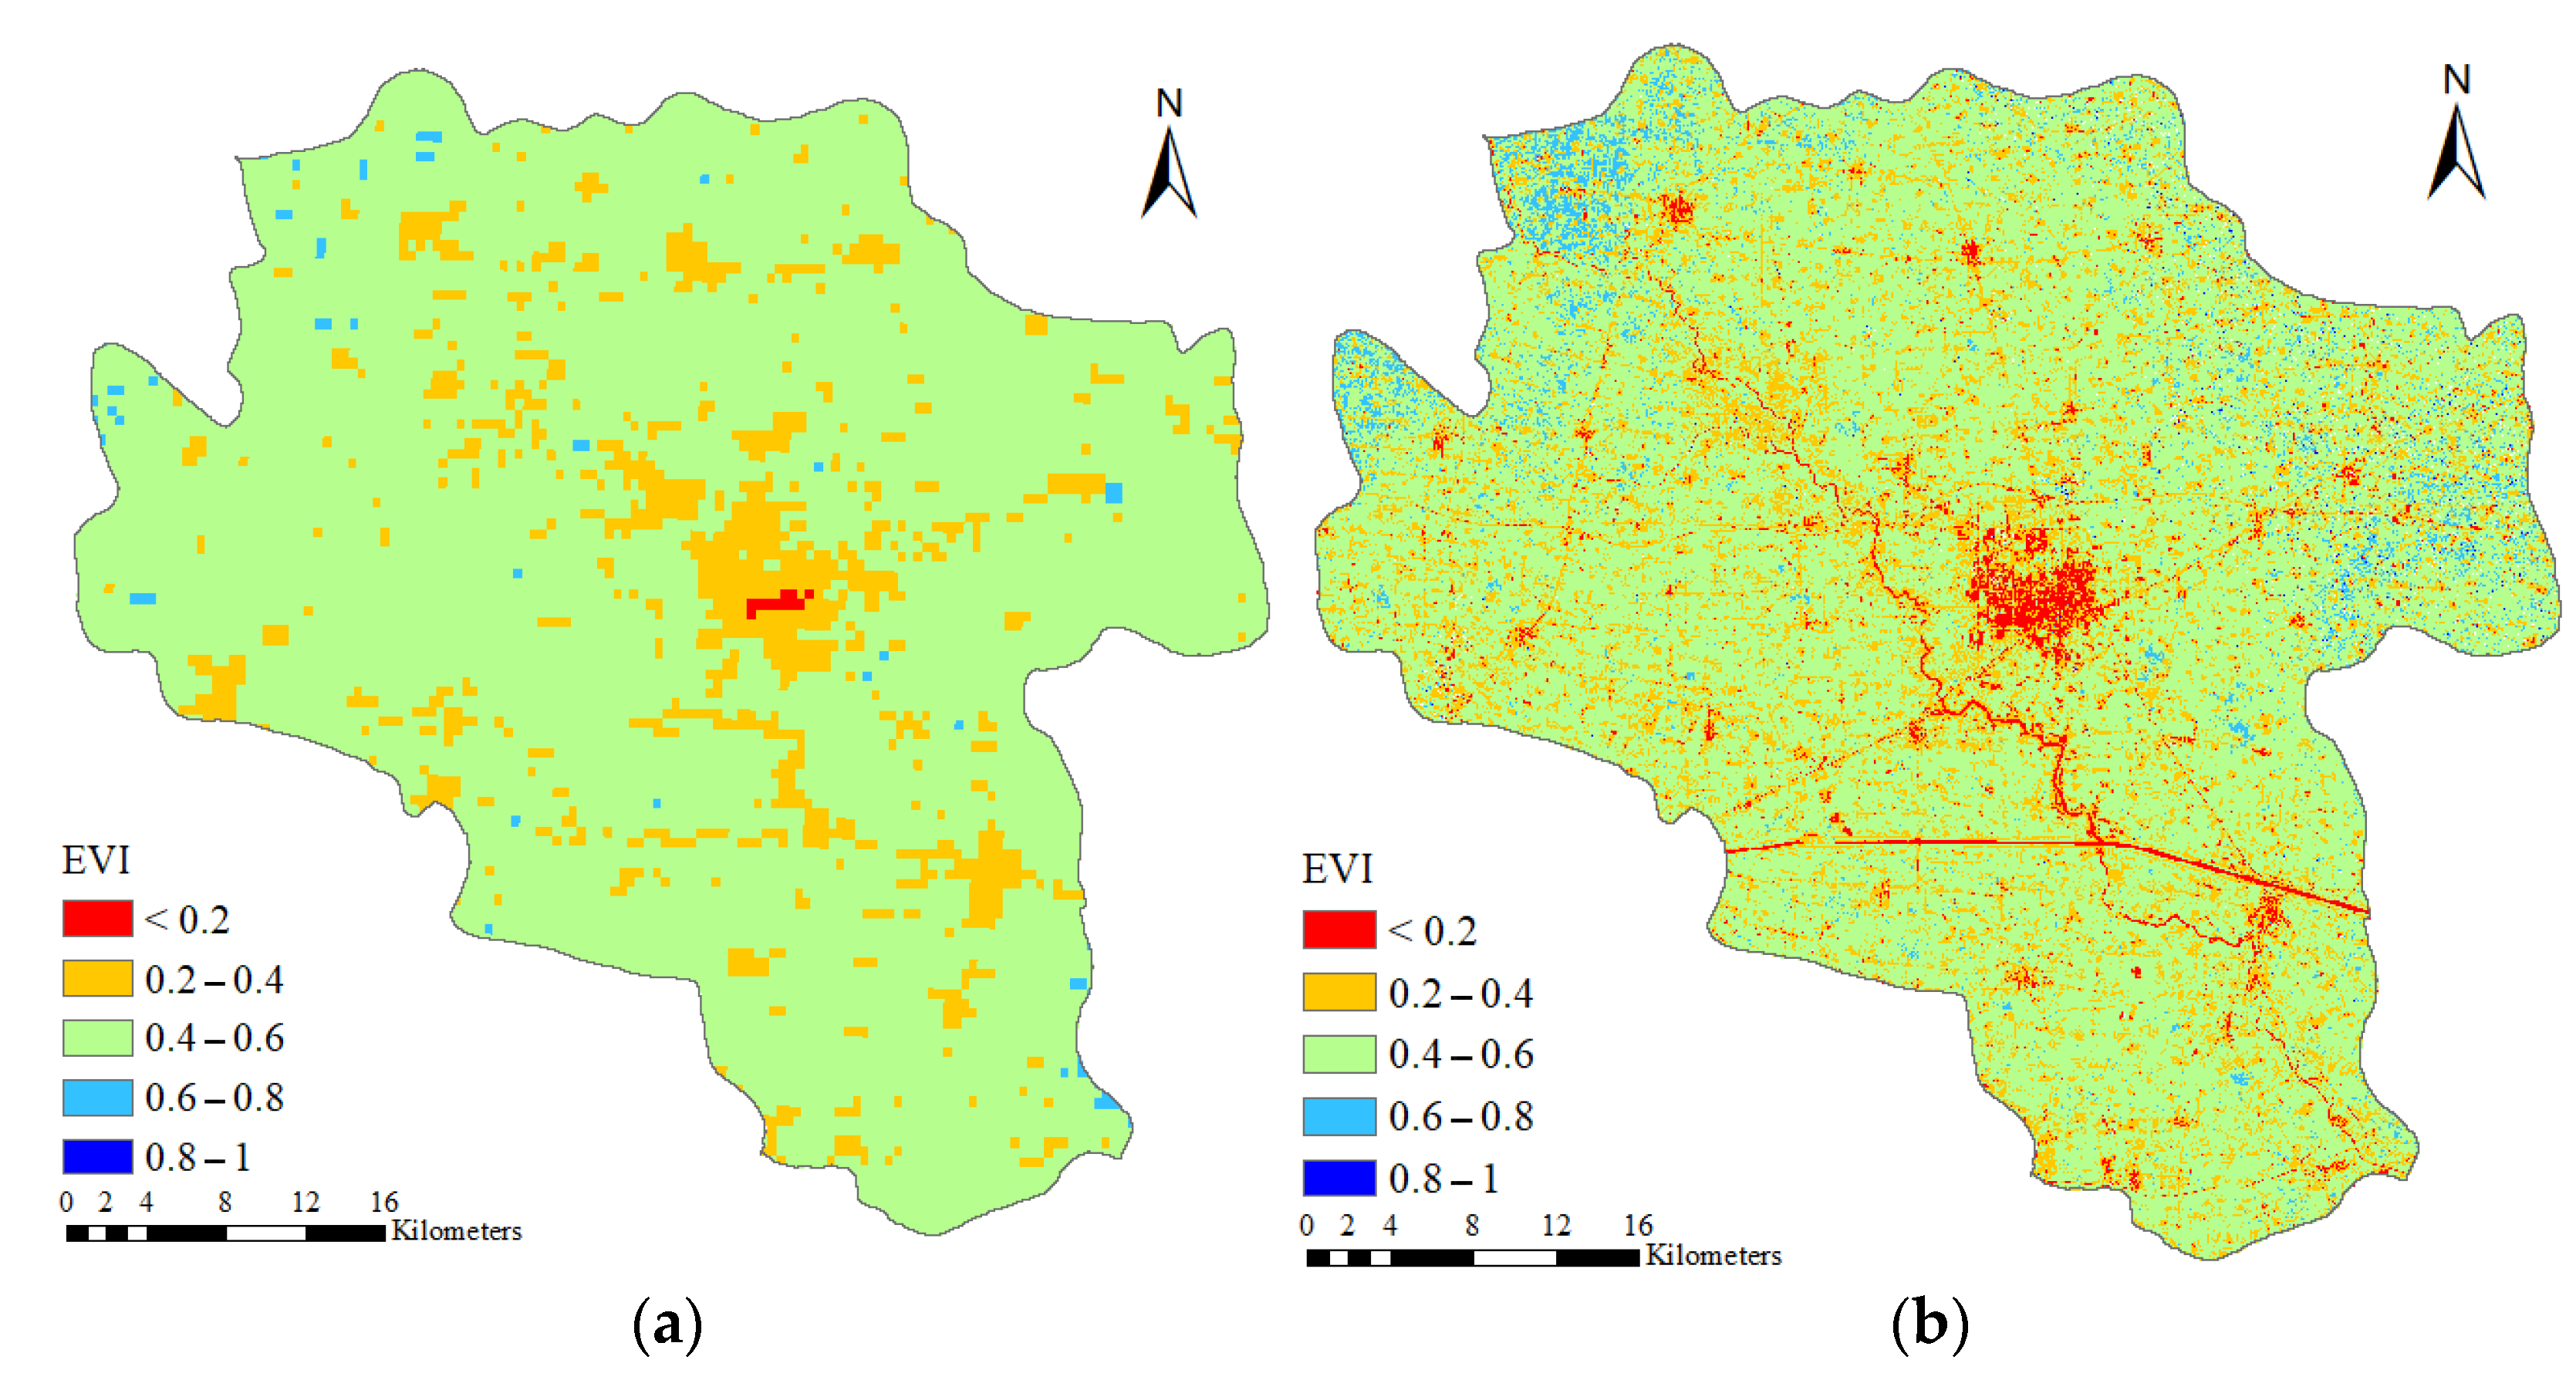
The data fusion effect is shown in Figure 4. Figure 4a presents the MOD09A1-EVI data image on 5 September 2020 as an example, and the image effect is shown in Figure 4. The spatial resolution of the MODIS image before fusion is 500 m, and the features of the image are vague due to the mixed pixels (Figure 4a). After fusing with all the available Sentinel-2 images, the features become clear (Figure 4b).
The EVI time series curves are extracted from the fusion data of MODIS and Sentinel-2. However, noise exists in the EVI curves, and irregular fluctuations in the EVI curve are not conducive to detecting phonological characteristics [32,33]. To obtain the smooth EVI time series curves, the EVI data are interpolated using the cubic spline method and reconstructed using the S-G filtering method.
3.1.2. Crop Phenological Period Detection
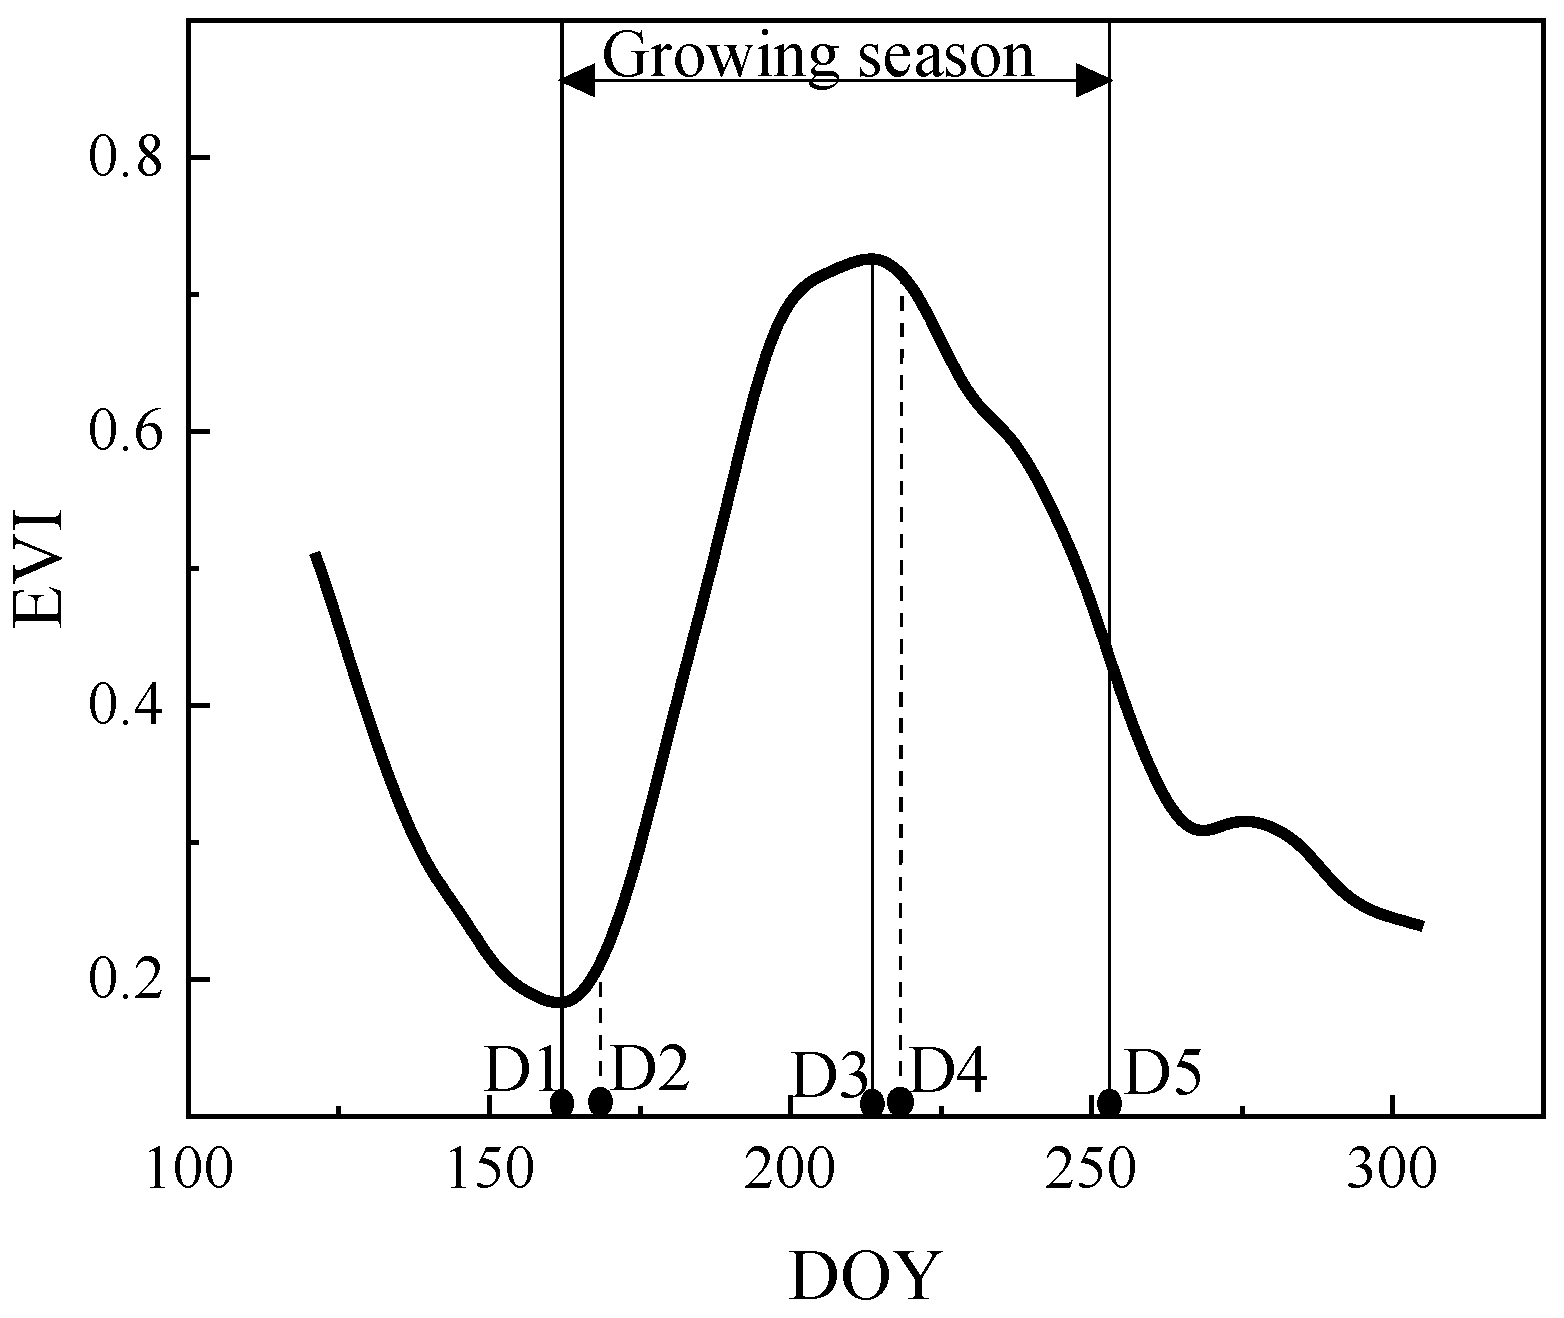
On the basis of crop classification maps, phenological periods of wheat and maize are detected in the crop-planting regions. The crop phenological periods are classified into sowing (D1), emergence (D2), heading (D3), anthesis (D4), and maturity (D5) periods. Figure 5 shows an example of the EVI time series curve and the metrics for detecting phenological periods. The sowing, heading, and maturity periods are feature points in EVI time series curves, so they are detected using the slope method from the curves [34,35]. The emergence and anthesis periods were detected according to other studies [36,37]. The approaches for detecting phenological periods can be expressed as:
Sowing period (): The cultivated land is generally bare after harvesting the previous crop, so the EVI curve witnesses a downward trend. After sowing, the EVI curve witnesses an upward trend. Therefore, the lowest point of the EVI curve is identified as the sowing period. Specifically, the slope of the point is zero and changes from negative to positive, i.e., and .
Emergence period (): In this paper, one week after the sowing period is identified as the emergence period [36], i.e., .
Heading period (): The growth and development of vegetative organs tend to be complete. At the same time, the EVI value of the crop peaks at this time, with the slope of the curve being 0 and the slope changing from positive to negative. Therefore, the period corresponding to the maximum EVI is identified as the heading period, i.e., and .
Anthesis (): Wheat anthesis starts after the heading period of one week, i.e., ; maize anthesis starts after the heading period 3 days when the bracts are exposed from the filaments of the female ears [37], i.e., .
Maturity period (): When crops reach maturity, the leaves begin to gradually senesce and turn yellow because of the decrease in chlorophyll content. At the same time, the EVI decreases at the fastest rate, so the point when the first-order derivative reaches the minimum is judged as the maturity period, i.e., .
Figure 5 shows an example of the EVI time series curve and the metrics for detecting phenological periods. The X-axis indicates the day of year (DOY). The Y-axis indicates the value of EVI. The length of the crop growing season is the duration between the sowing () and maturity () periods.
3.2. Crop ET
The discrete ET24-hour images for the study area are calculated by the SEBAL model. ETc at the weather station point is calculated by combining the P-M model and crop phenological periods. Daily ET (ETdaily) images for the study area are estimated according to point ETc and ETRS images. Crop seasonal ETseason is equal to the sum of ETdaily images from the sowing period to the maturity period.
3.2.1. Twenty-four-Hour ET (ET24-hour)
In the SEBAL model, ET is computed from satellite images and weather data using the surface energy balance. Since the satellite image provides information for the overpass time only, SEBAL computes an instantaneous ET (ETinst) flux for the image time. The ET flux is calculated for each pixel of the image as a “residual” of the surface energy budget equation [38]:
where Rn is the net radiation flux at the surface, G is the soil heat flux, H is the sensible heat flux, and λETinst is the latent heat flux .
Net radiation flux (Rn) is estimated using albedo, transmittance, and long wave emission. Albedo is calculated by integrating surface reflectivity from bands, and weighting coefficients are applied to each band when estimating albedo. Soil heat flux (G) is predicted using vegetation indices and net radiation. Sensible heat flux (H) is calculated from several factors: surface temperature, wind speed, surface roughness, and surface-to-air temperature differences [38].
The instantaneous evaporation rate ( can be expressed as:
G for 24 h periods is assumed to be nearly zero due to the canceling effect of positive G during daylight and negative G during nighttime. SEBAL computes the ET24-hour by assuming that the instantaneous evaporation rate (Λ) is the same as the 24 h average. can be expressed as.
where λ is the latent heat of vaporization (); is the daily net radiation; and is the daily soil heat flux.
3.2.2. Daily ET (ETdaily)
For the days without accessible remote sensing images, ETdaily images of the study area can be estimated by applying the conversion coefficient (P) to the field crop ET (ETc). ETc can be obtained using the P-M equation and Kc. P is the ratio of ET24-hour to ETc [39,40].
- ETC at the weather station point based on the Penman–Monteith equation.
is calculated by using ET0 and the Kc. The daily crop reference ET (ET0) is calculated using the P-M equation recommended by FAO. The Penman–Monteith equation is as follows [41]:
where is the reference crop ET (); is the well-watered crop ET (); is the net radiation flux at the surface ; is the soil heat flux ; is the average daily temperature at an altitude of 2 m (°C); is the wind speed at a height of 2 m ; is the actual water vapor pressure ; is the saturated water vapor pressure ; is the slope of the curve of saturated water vapor pressure versus temperature ; is the hygrometer constant 0.066 ; and is the crop coefficient.
Generally, the in Equation (8) is obtained from field trials. The Kc for this study is taken from Hua et al. and Wang et al. [42,43]. The values for Kc are summarized in Table 3.
- 2.
- ETdaily images based on ET24-hour images and ETc at the weather station
ETdaily images are calculated by interpolating between two consecutive remote sensing images. P is calculated as the ratio of ET24-hour from Equation (5) to ETc from Equation (7). The approach assumes that the ET24-hour for the study area changes in proportion to the change in ETc.
The ETdaily is calculated as follows:
The P between remote sensing image dates is calculated by linearly interpolating the P on the satellite image date. The units for ETdaily will be expressed in mm, whereas ETc is expressed in mm/day.
3.2.3. Seasonal ET (ETseason)
The ETseason during the growing season is calculated as follows:
where is the sowing period and is the maturity period. ETdaily is the daily ET during the growing season.
3.3. Crop Yield
The crop yield is estimated using the dry biomass–harvest index method [44]. The following is the yield estimation formula with remote sensing.
where Y is the crop yield (kg/ha) and Biomass is the accumulated above-ground dry biomass during the growing season (kg/ha). HI is the harvest index.
The accumulation of biomass is calculated by the following formula:
where is the light use efficiency (g/MJ). is the absorbed photosynthetic active radiation. From Section 3.1.2, and are the sowing period and the maturity period, respectively.
The absorbed photosynthetically active radiation (APAR) is calculated using the ratio of photosynthetically active radiation (PAR) to the fraction of photosynthetically active radiation (FPAR). The FPAR and simple ration vegetation index are linearly related. The light use efficiency (ε) is calculated from three factors: soil moisture, the limit of the low temperature, and the influence of the difference between the environmental temperature and optimum temperature [12,45].
The conversion of biomass into crop yield is achieved through HI. Considering the negative environmental effects, is predicted using the average NDVI values from the pre-anthesis to post-anthesis stages [19]. The equations are expressed as:
where is the optimal value of HI (here chosen to be equal to 0.48); is the possible range of HI (here chosen to be equal to 0.18); is the mean value of NDVI from emergence to anthesis period; is the mean value of NDVI from anthesis period to maturity period; and , , and are the emergence, anthesis, and maturity periods, respectively.
3.4. CWP
Crop water productivity (CWP) is the ratio of crop yield to its evapotranspiration during the growing season, and its unit is (kg/m3). The formula can be expressed as:
where is the crop yield (kg/ha) and is the accumulated crop daily ET during the growing period (mm).
4. Results
4.1. Crop Phenological Period
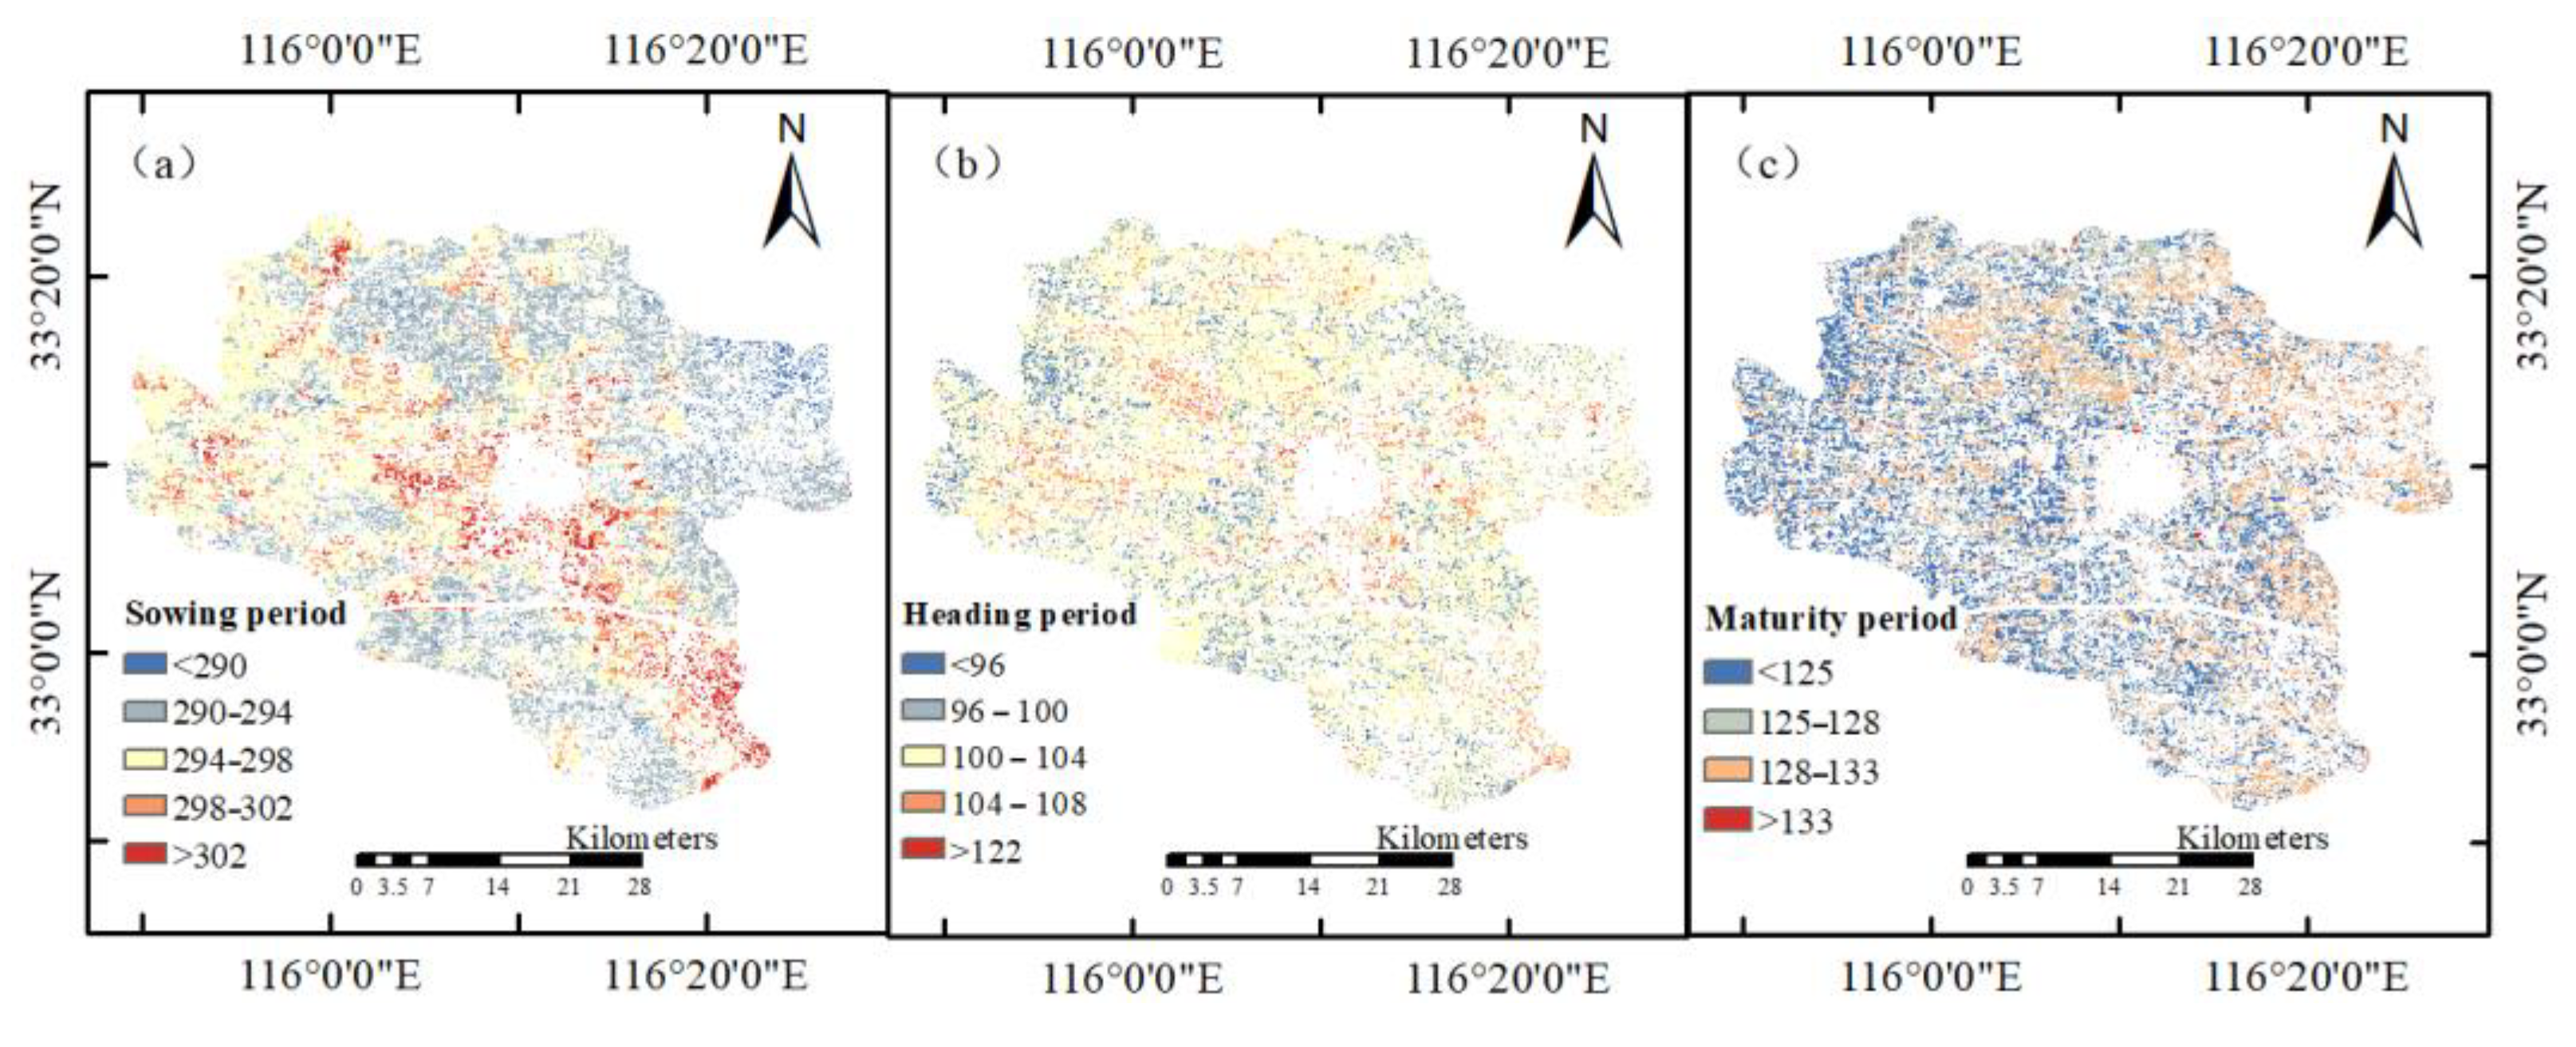
The sowing, heading, and maturity periods of winter wheat and summer maize are detected from EVI time series curves. Figure 6 shows the spatial distribution of wheat phenological periods in Lixin County. The dates of the sowing period are mainly from 16 to 31 October 2020 (DOY: 290–305), with an average of 296 (22 October 2020). In the northern region, the sowing period is earlier than that in the middle region. The dates of the heading period are mainly from 3 to 15 April 2021 (DOY: 93–105), with an average of 102 (12 April 2021). The spatial distribution of the heading period is similar to that of the sowing period. The dates of the maturity period are mainly from 3 to 21 May 2021 (DOY: 123–131), with an average of 127 (7 May 2021). The wheat in the eastern region matures later than that in the other regions.
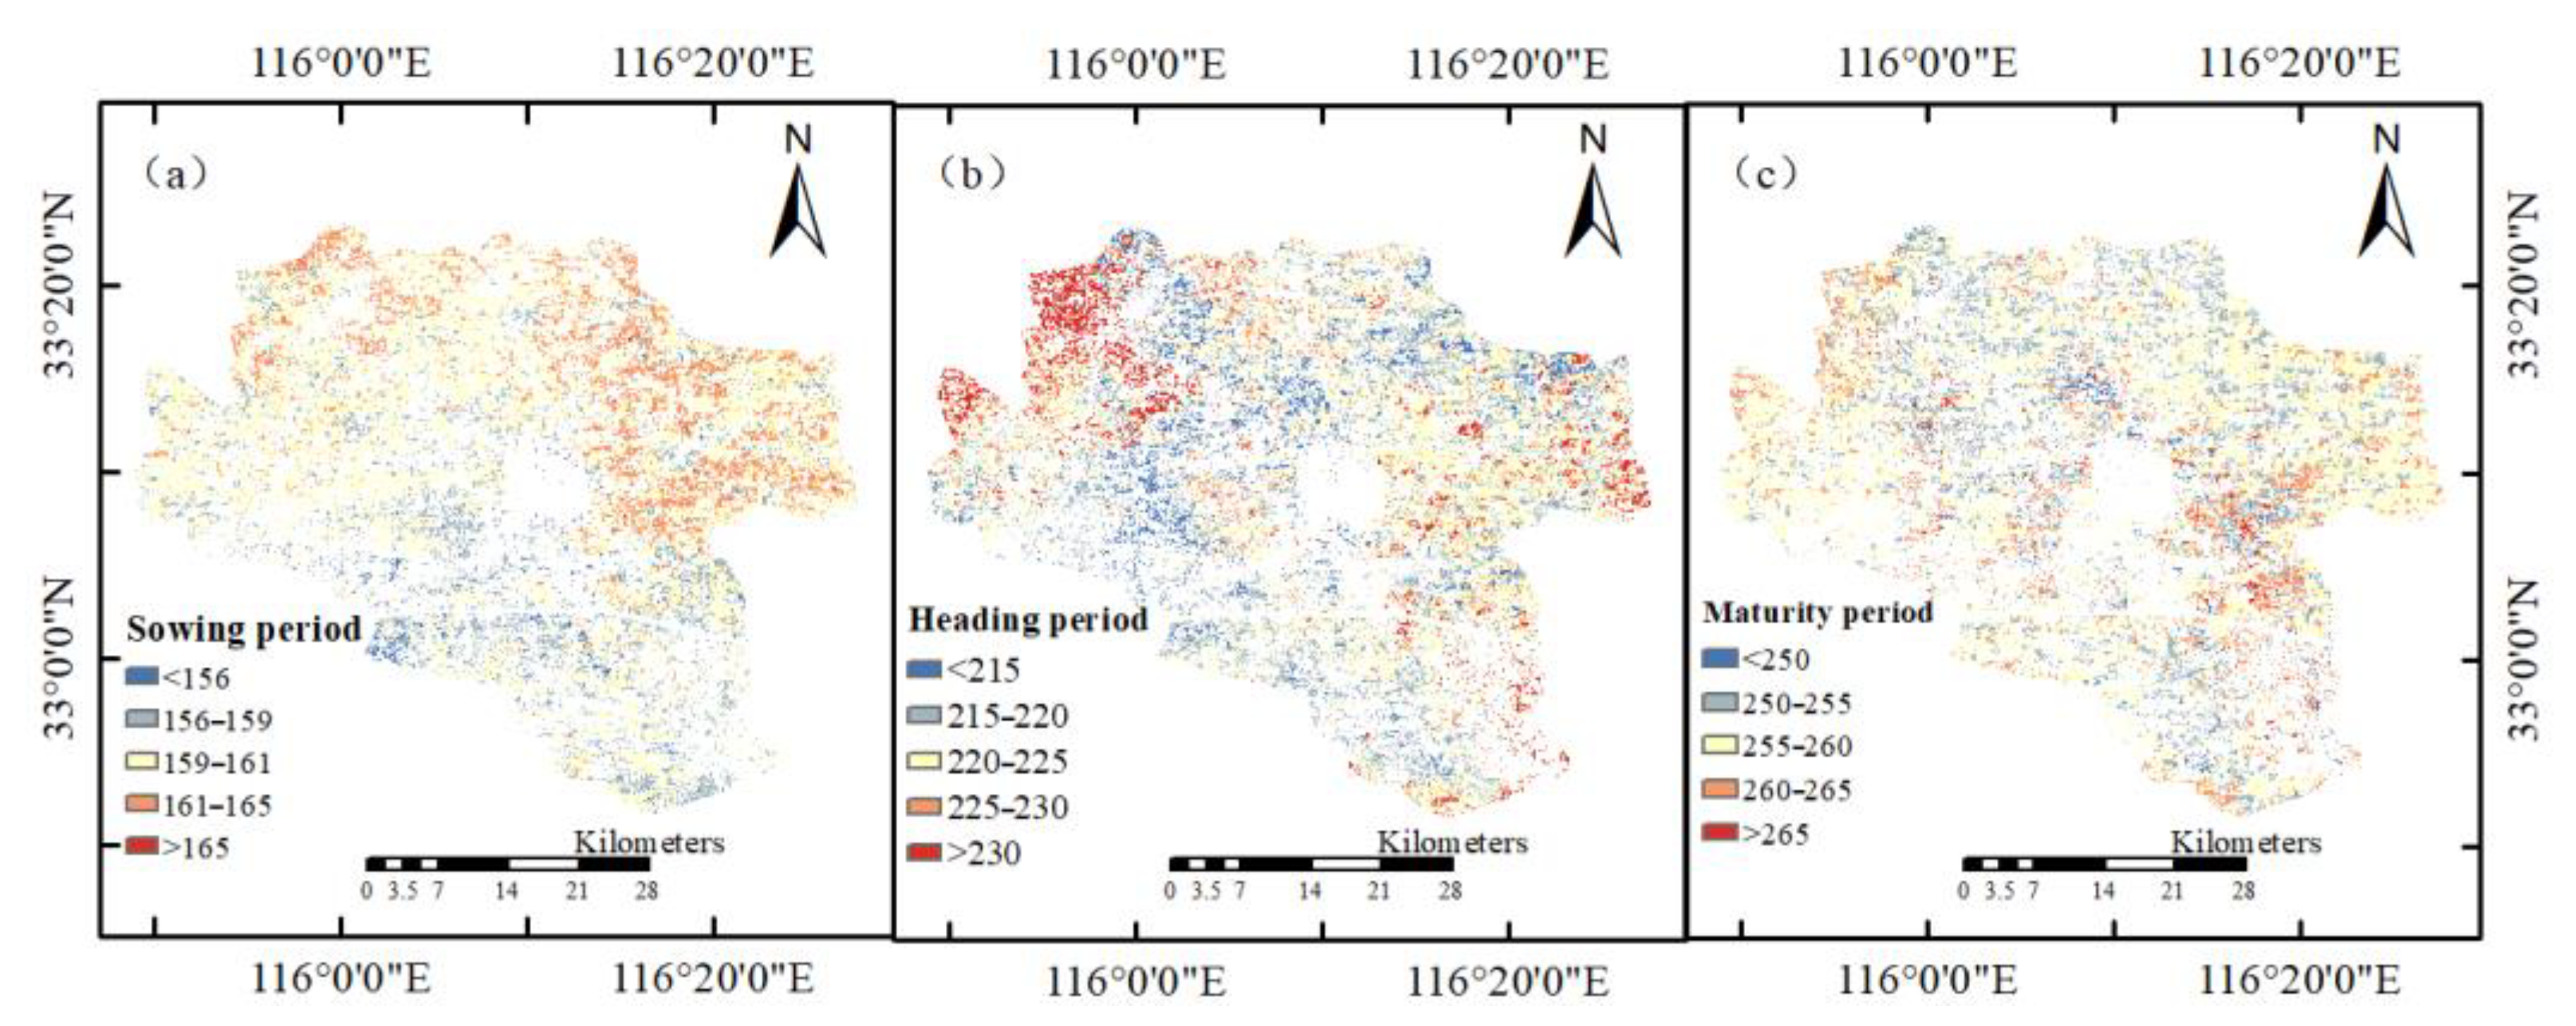
The spatial distribution of maize phenological periods is shown in Figure 7. The dates of the sowing period are mainly from 6 to 12 June 2021 (DOY: 157–163), with an average of 160 (9 June). The sowing period in the northern region is later than that in the south. The dates of the heading period are mainly from 30 July to 16 August 2021 (DOY: 212–228), with an average of 223 (11 August). The heading period of maize in the northwest is later than that in other regions. The dates of the maturity period are mainly from September 8 to 22 (DOY: 251–265), with an average of 257 (14 September).
4.2. Crop ET
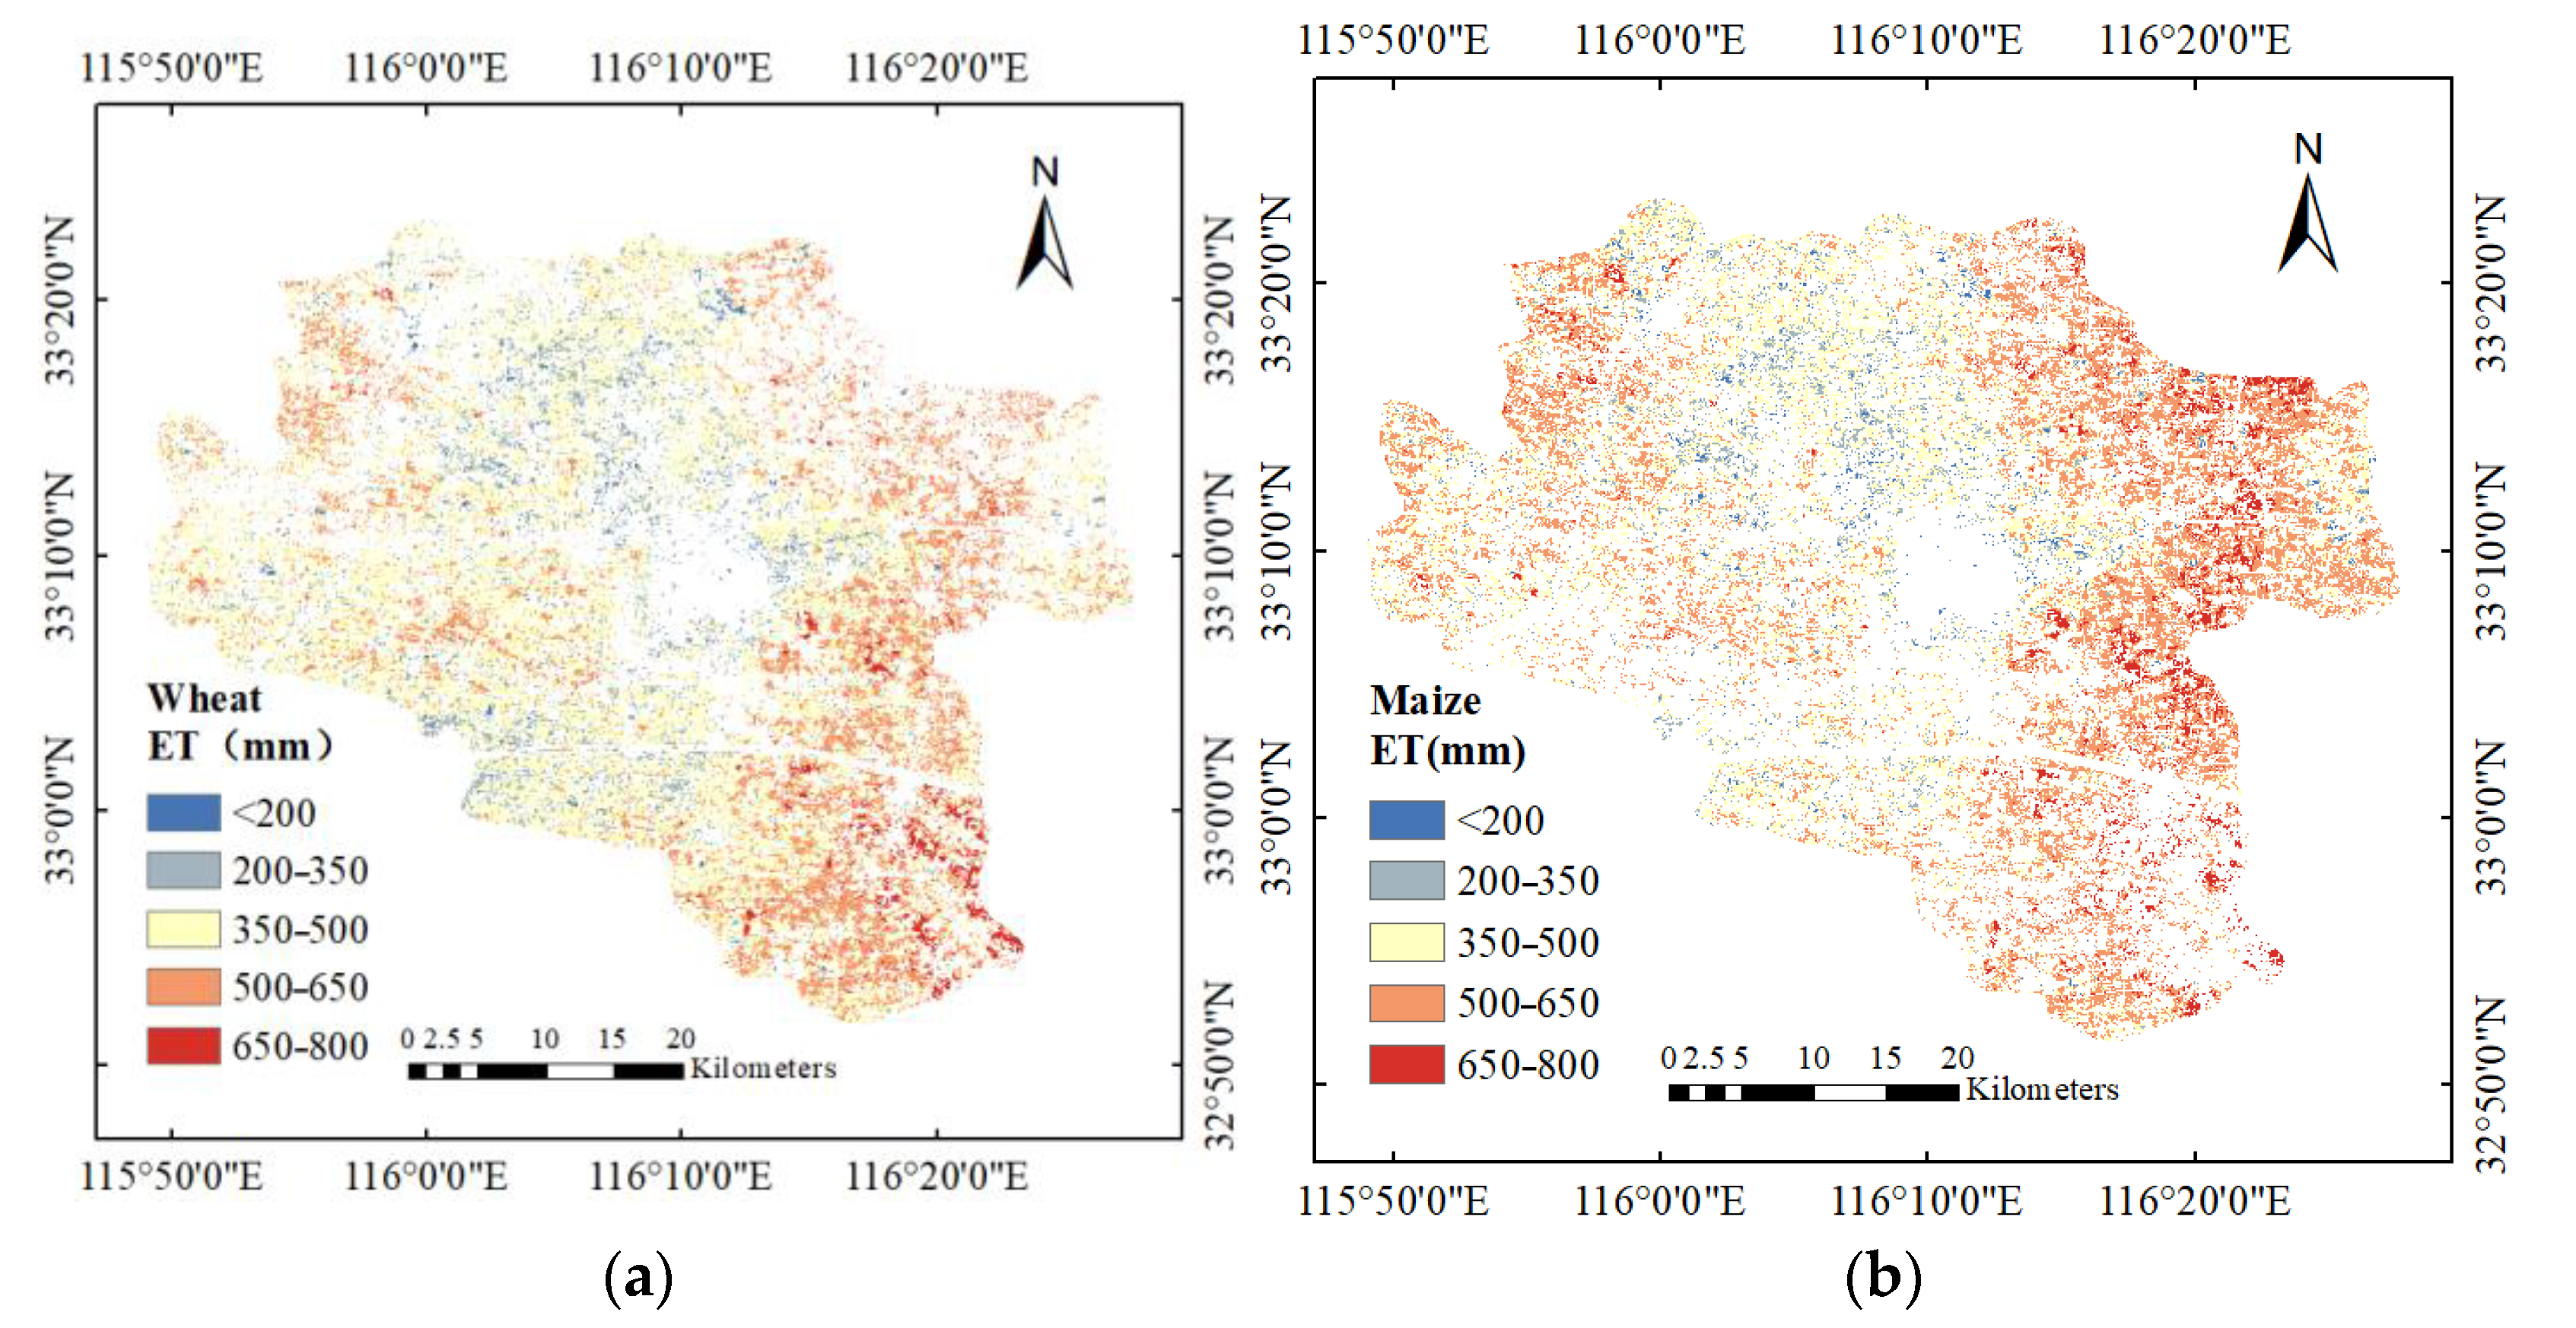
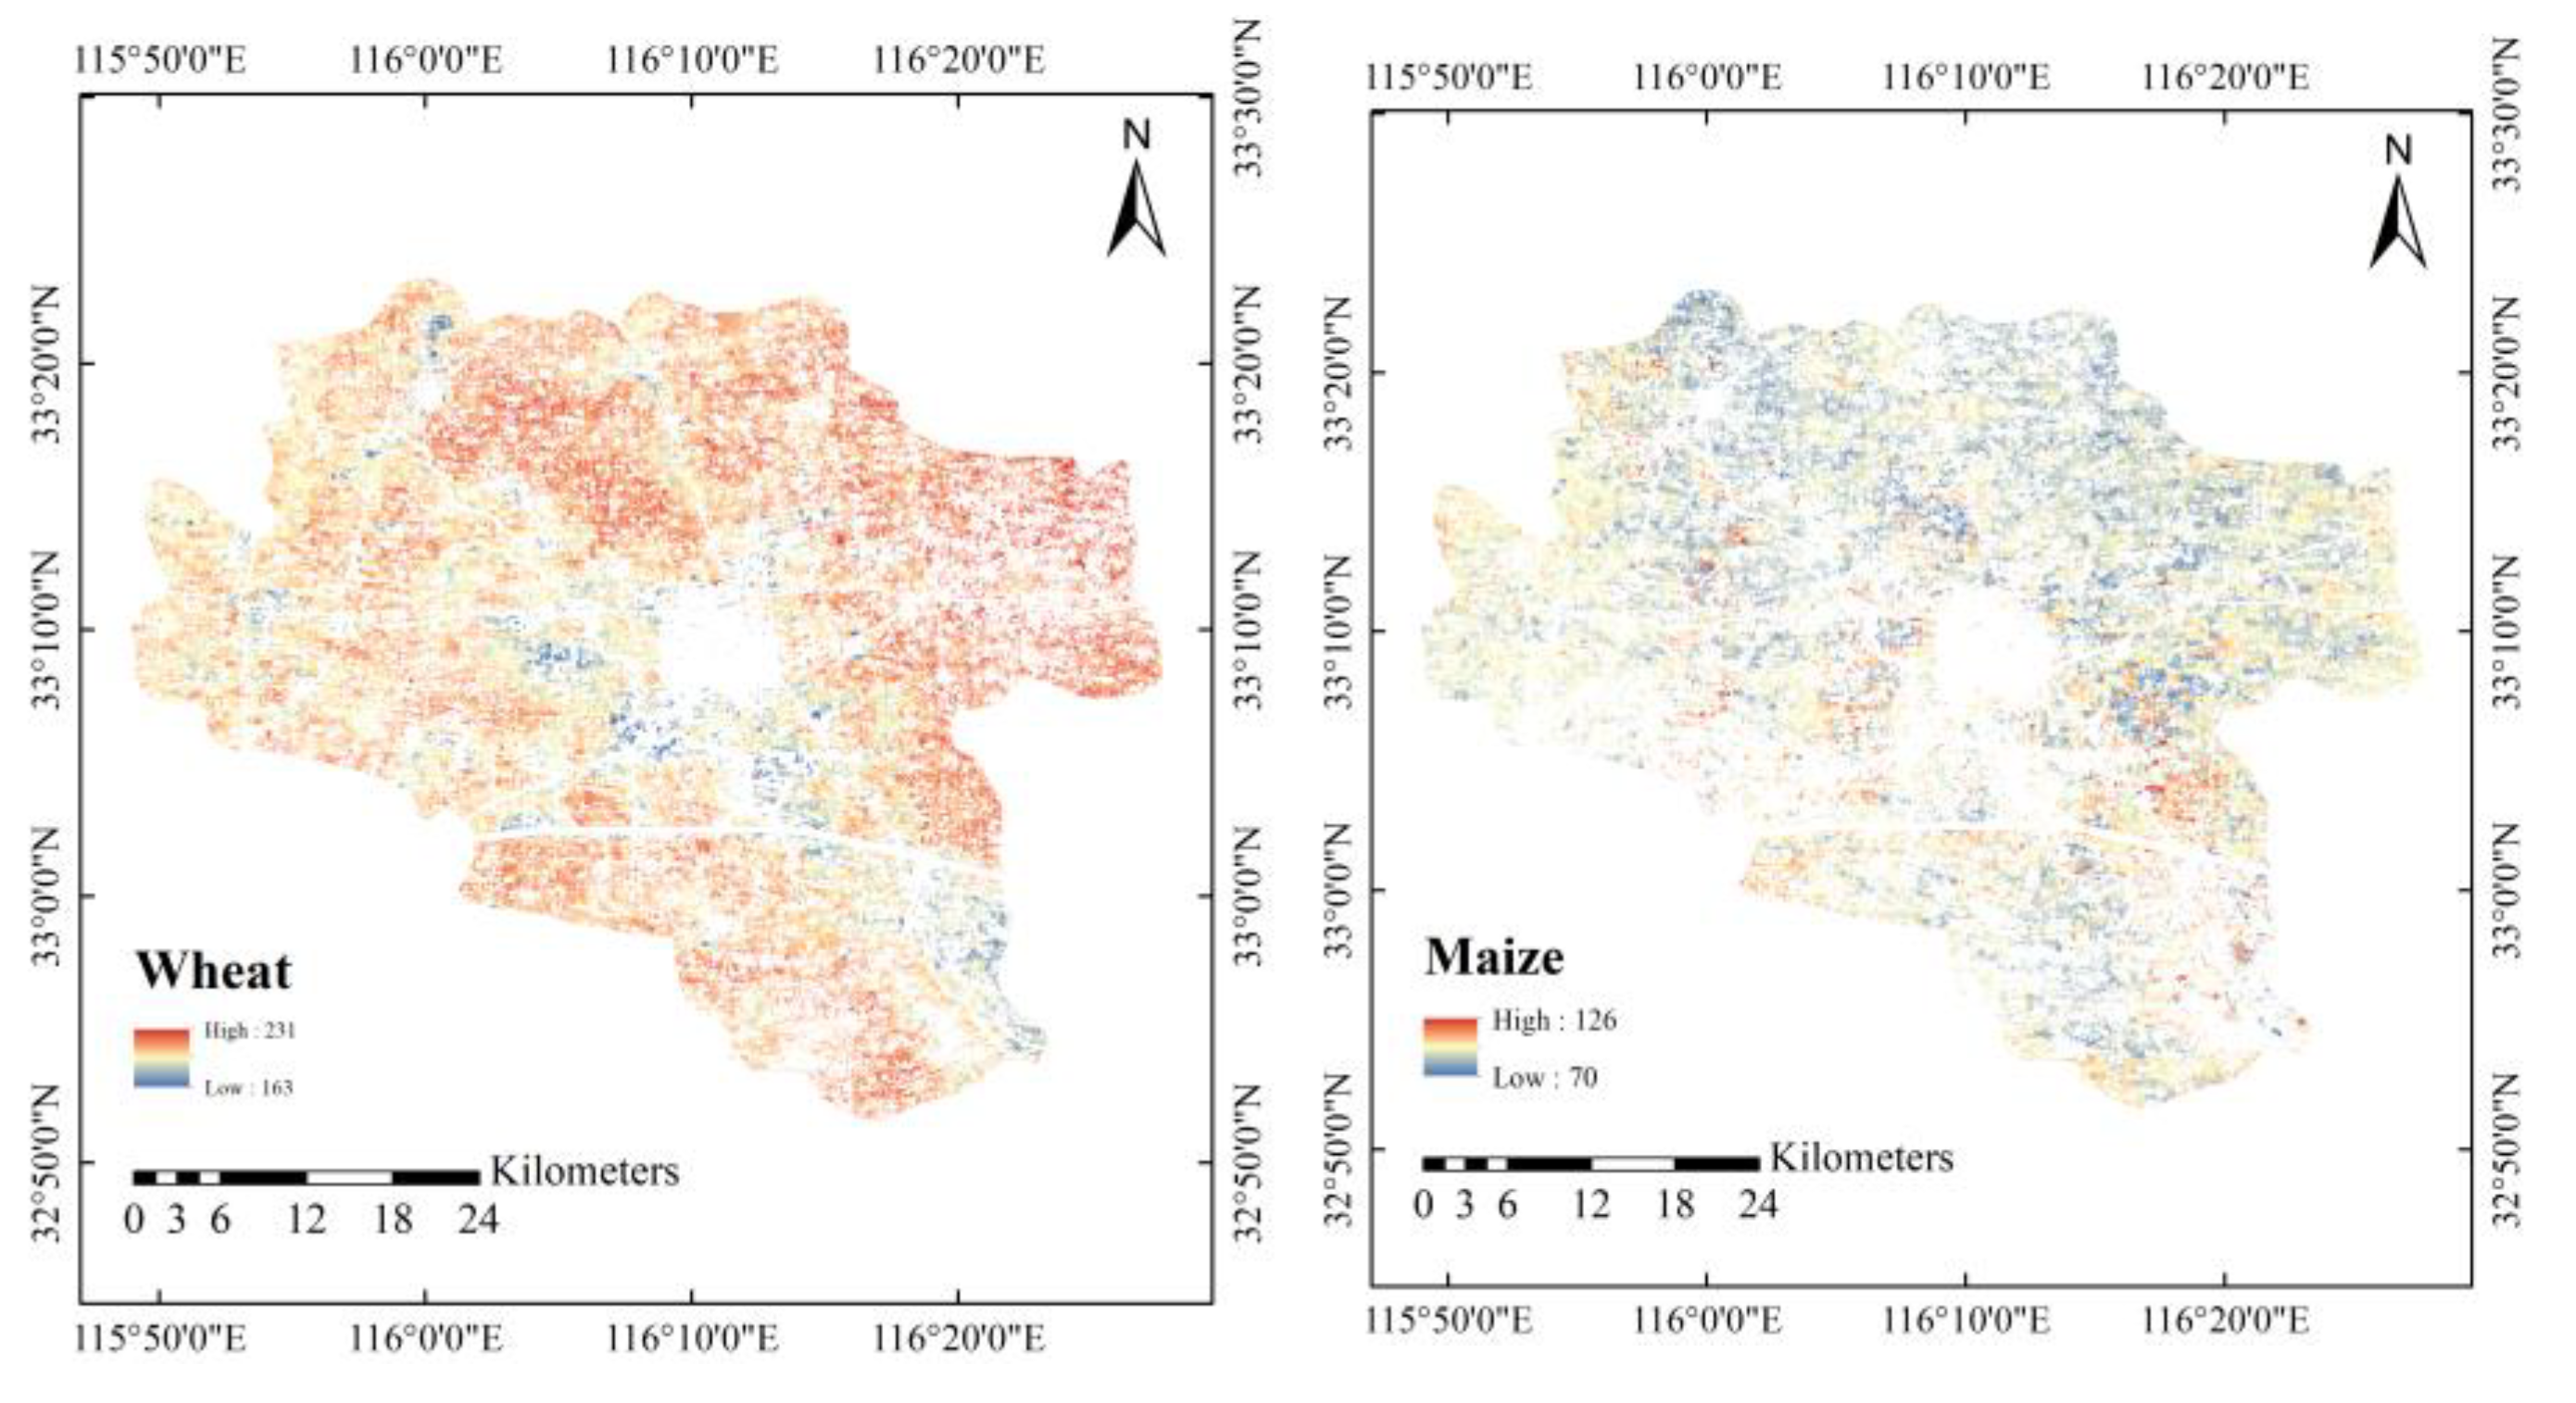
The crop ET in the study area is estimated using the SEBAL model and P-M equation. Figure 8 shows the spatial distribution of the crop ET. In Figure 8a, the ETseason of wheat mainly ranges from 350 to 580 mm, with an average of 428.51 mm. The ETseason in the central and northern regions is lower than that in the eastern and southern regions, with some areas less than 200 mm. In Figure 8b, the ETseason of maize mainly ranges from 400 to 570 mm, with an average of 422.85 mm. The ETseason in the eastern region is higher than that in other regions. The ETseason in the central and northern regions is low. This is because the farmland in these areas is close to the construction land, which influences the estimated ET values in the mixed pixels.
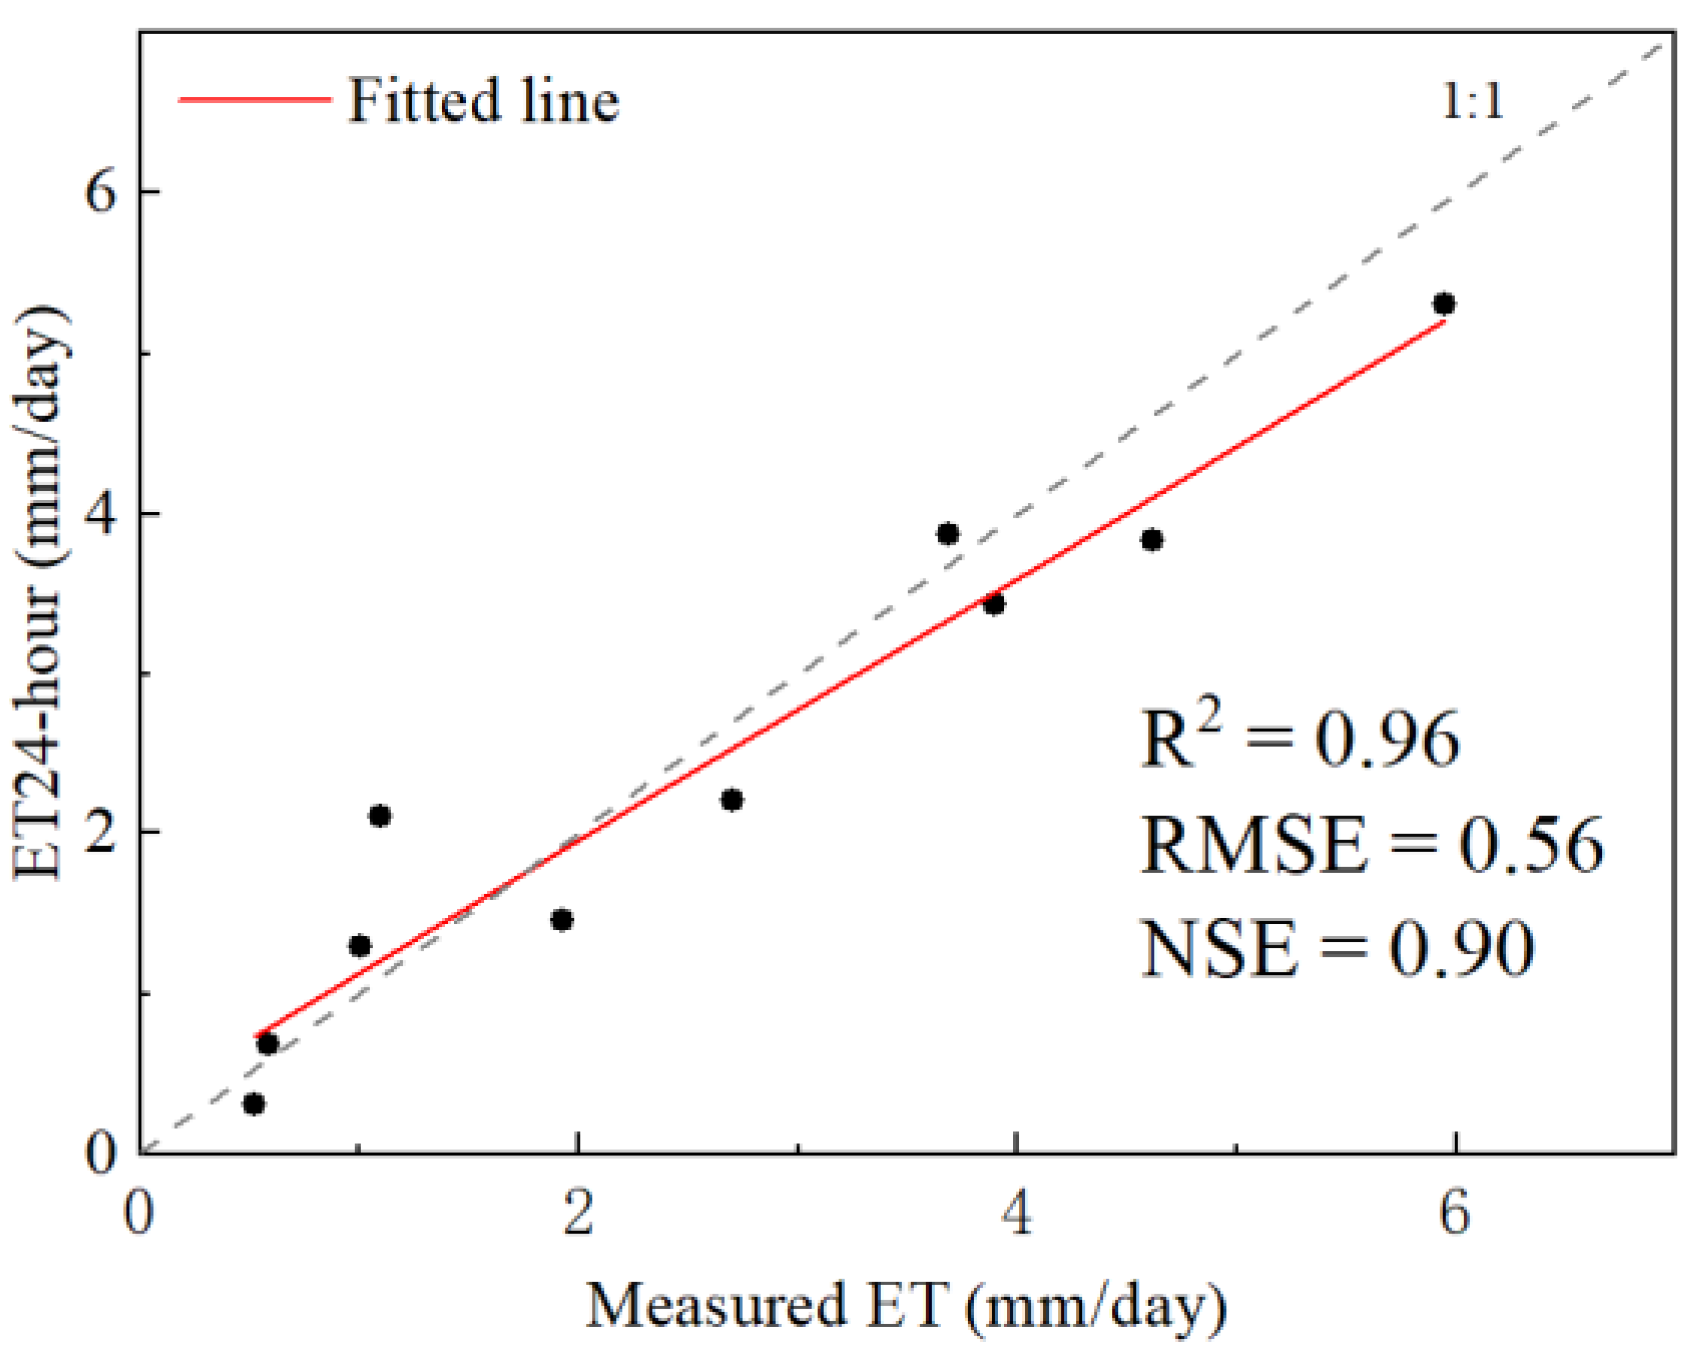
To evaluate the prediction accuracy, the coefficient of determination (R2), root mean square error (RMSE), and Nash–Sutcliffe efficiency coefficient (NSE) are chosen to analyze the ET. The ET24-hour estimated by the SEBAL model and the measured ET obtained on the basis of the smart soil moisture monitoring instrument are shown in Figure 9. The RMSE is 0.56 mm/d, the R2 is 0.96, and the NSE is 0.90. Figure 9 shows that the estimated ET24-hour results are consistent with the observed values.
4.3. Crop Yield
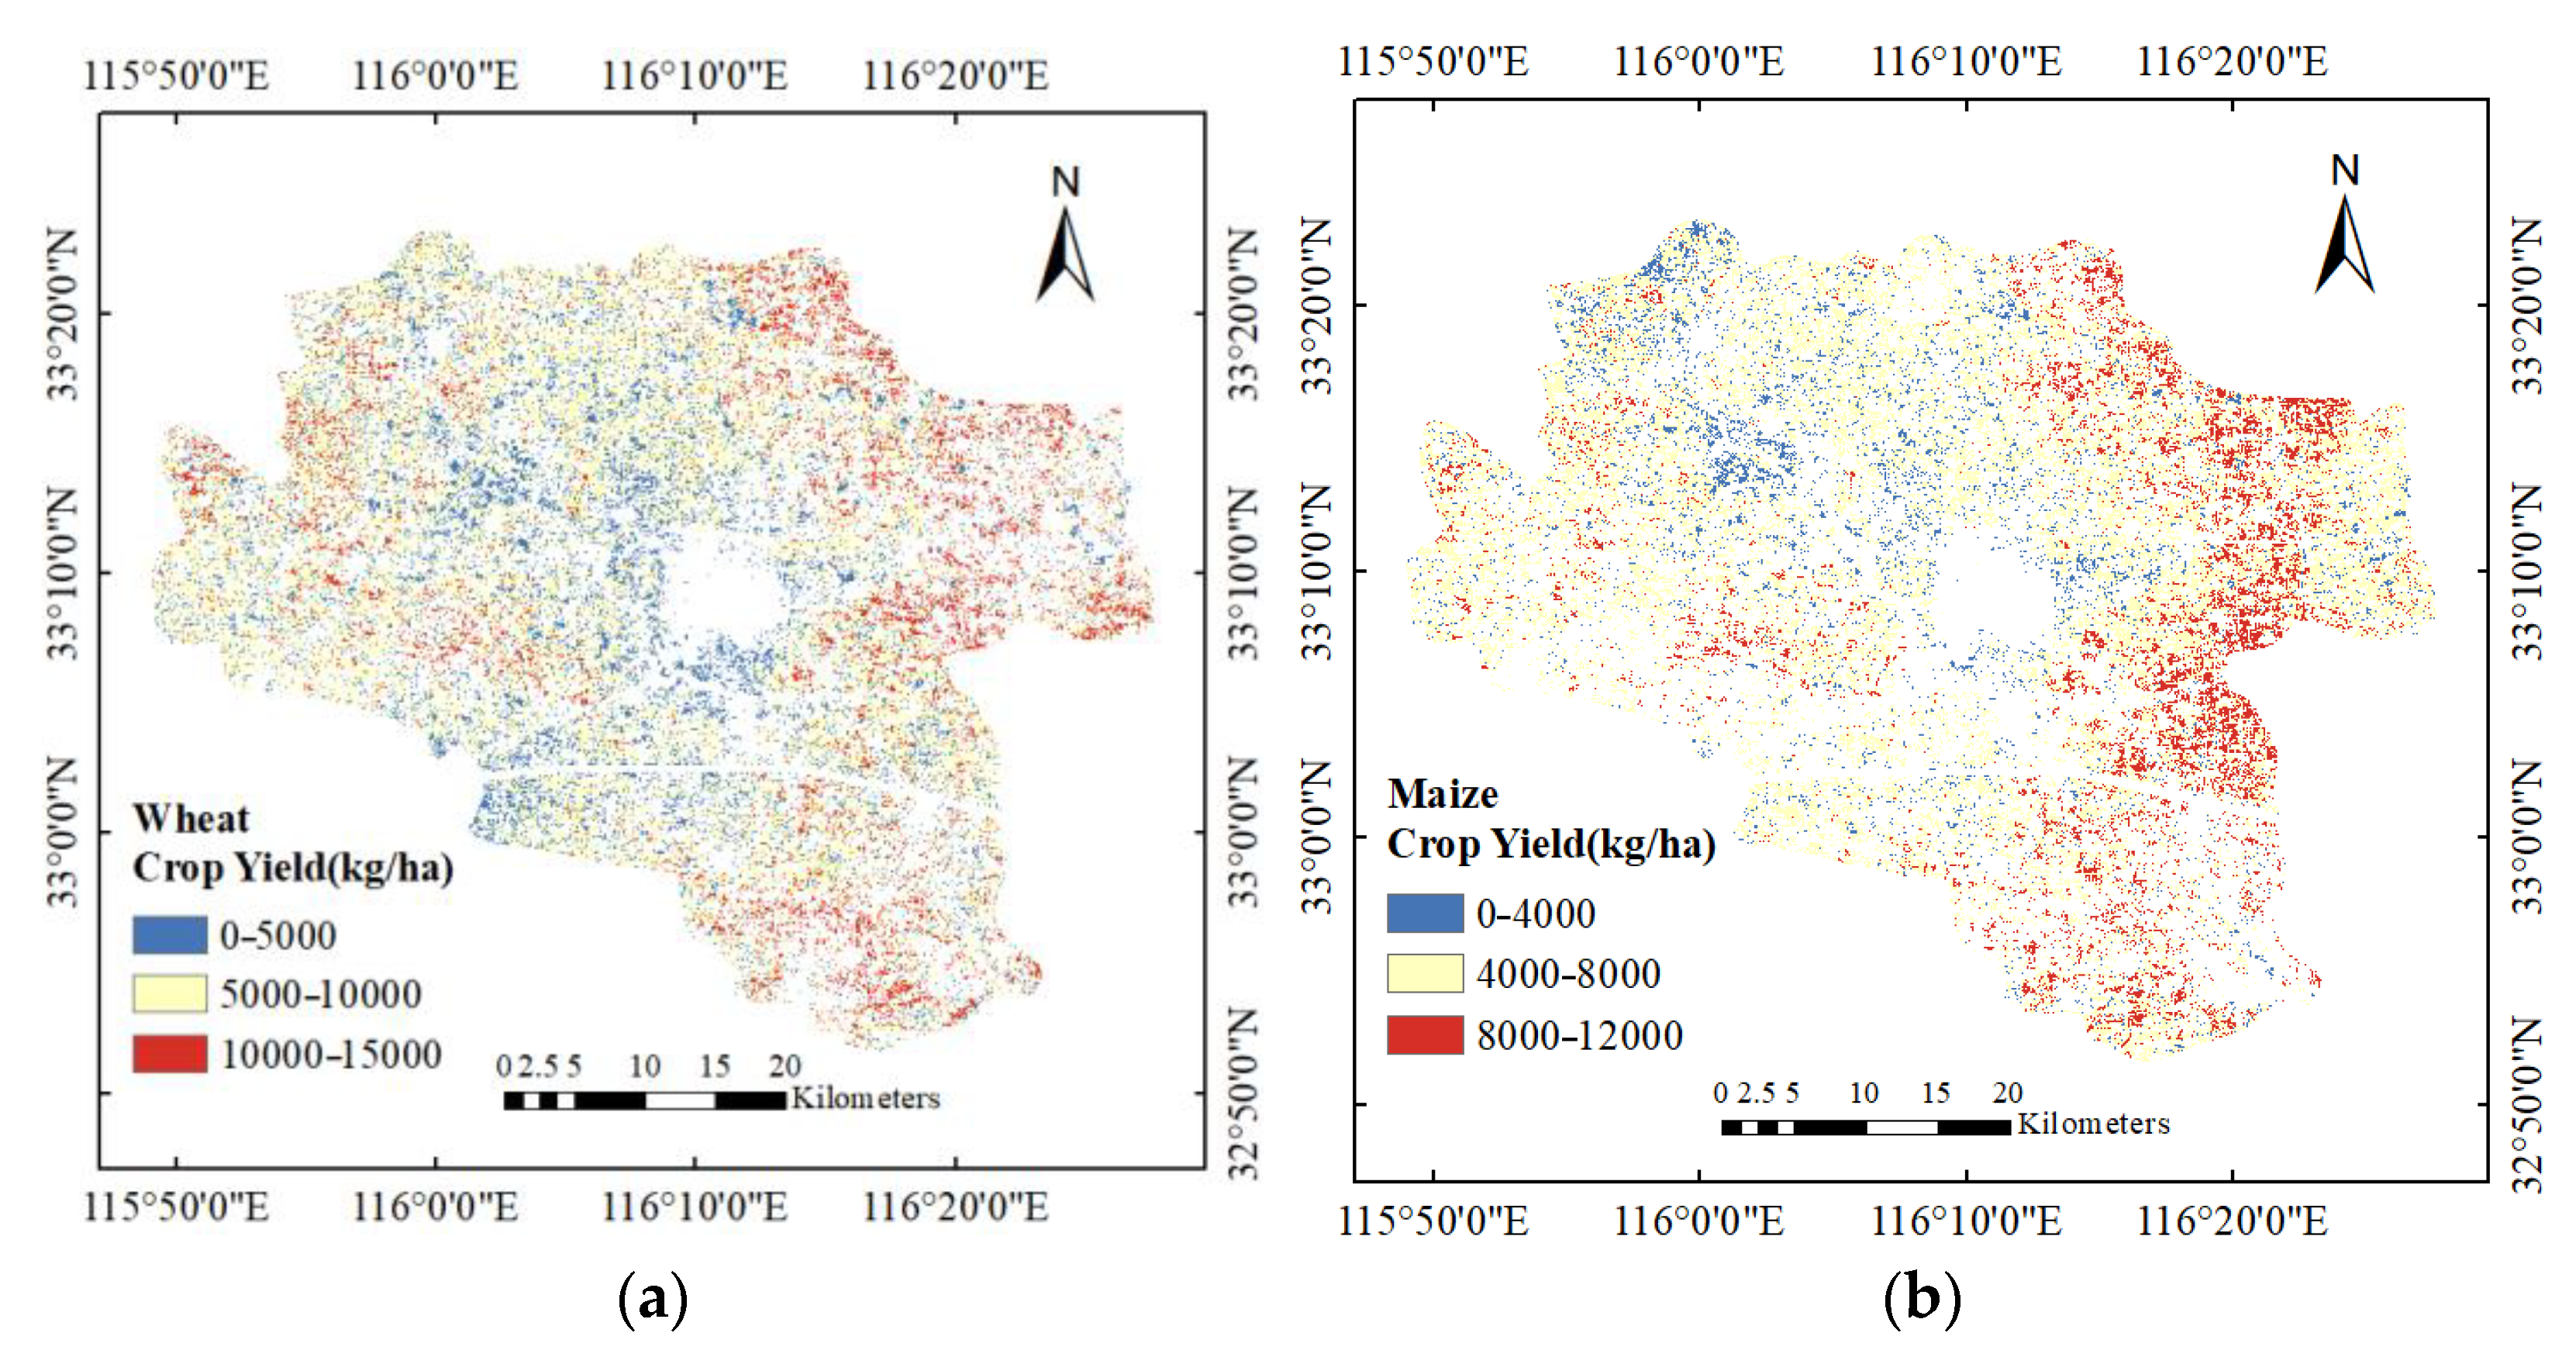
The crop yield is estimated using the dry biomass–harvest index method. Figure 10 shows the spatial distribution of winter wheat and summer maize in Lixin County, 2021. In Figure 10a, the yield of wheat ranges mainly between 5000 and 10,000 kg/ha, with an average of 7169 kg/ha. The yield in the eastern and southern regions is higher than that in the central region. This is because the wheat planted in the central region is close to construction land, which is not conducive to uniform agricultural management. Meanwhile, the estimation of wheat yield is influenced by the mixed pixels. There are many varieties of wheat in Lixin County, including Huai Mai 28 and Huai Mai 22. Varieties of wheat with different resistances to frost and disease lead to the spatial variability in yields. In Figure 10b, the yield of maize ranges mainly between 4000 and 8000 kg/ha, with an average yield of 6081 kg/ha. The yield in the eastern region is higher than that in the northern region.
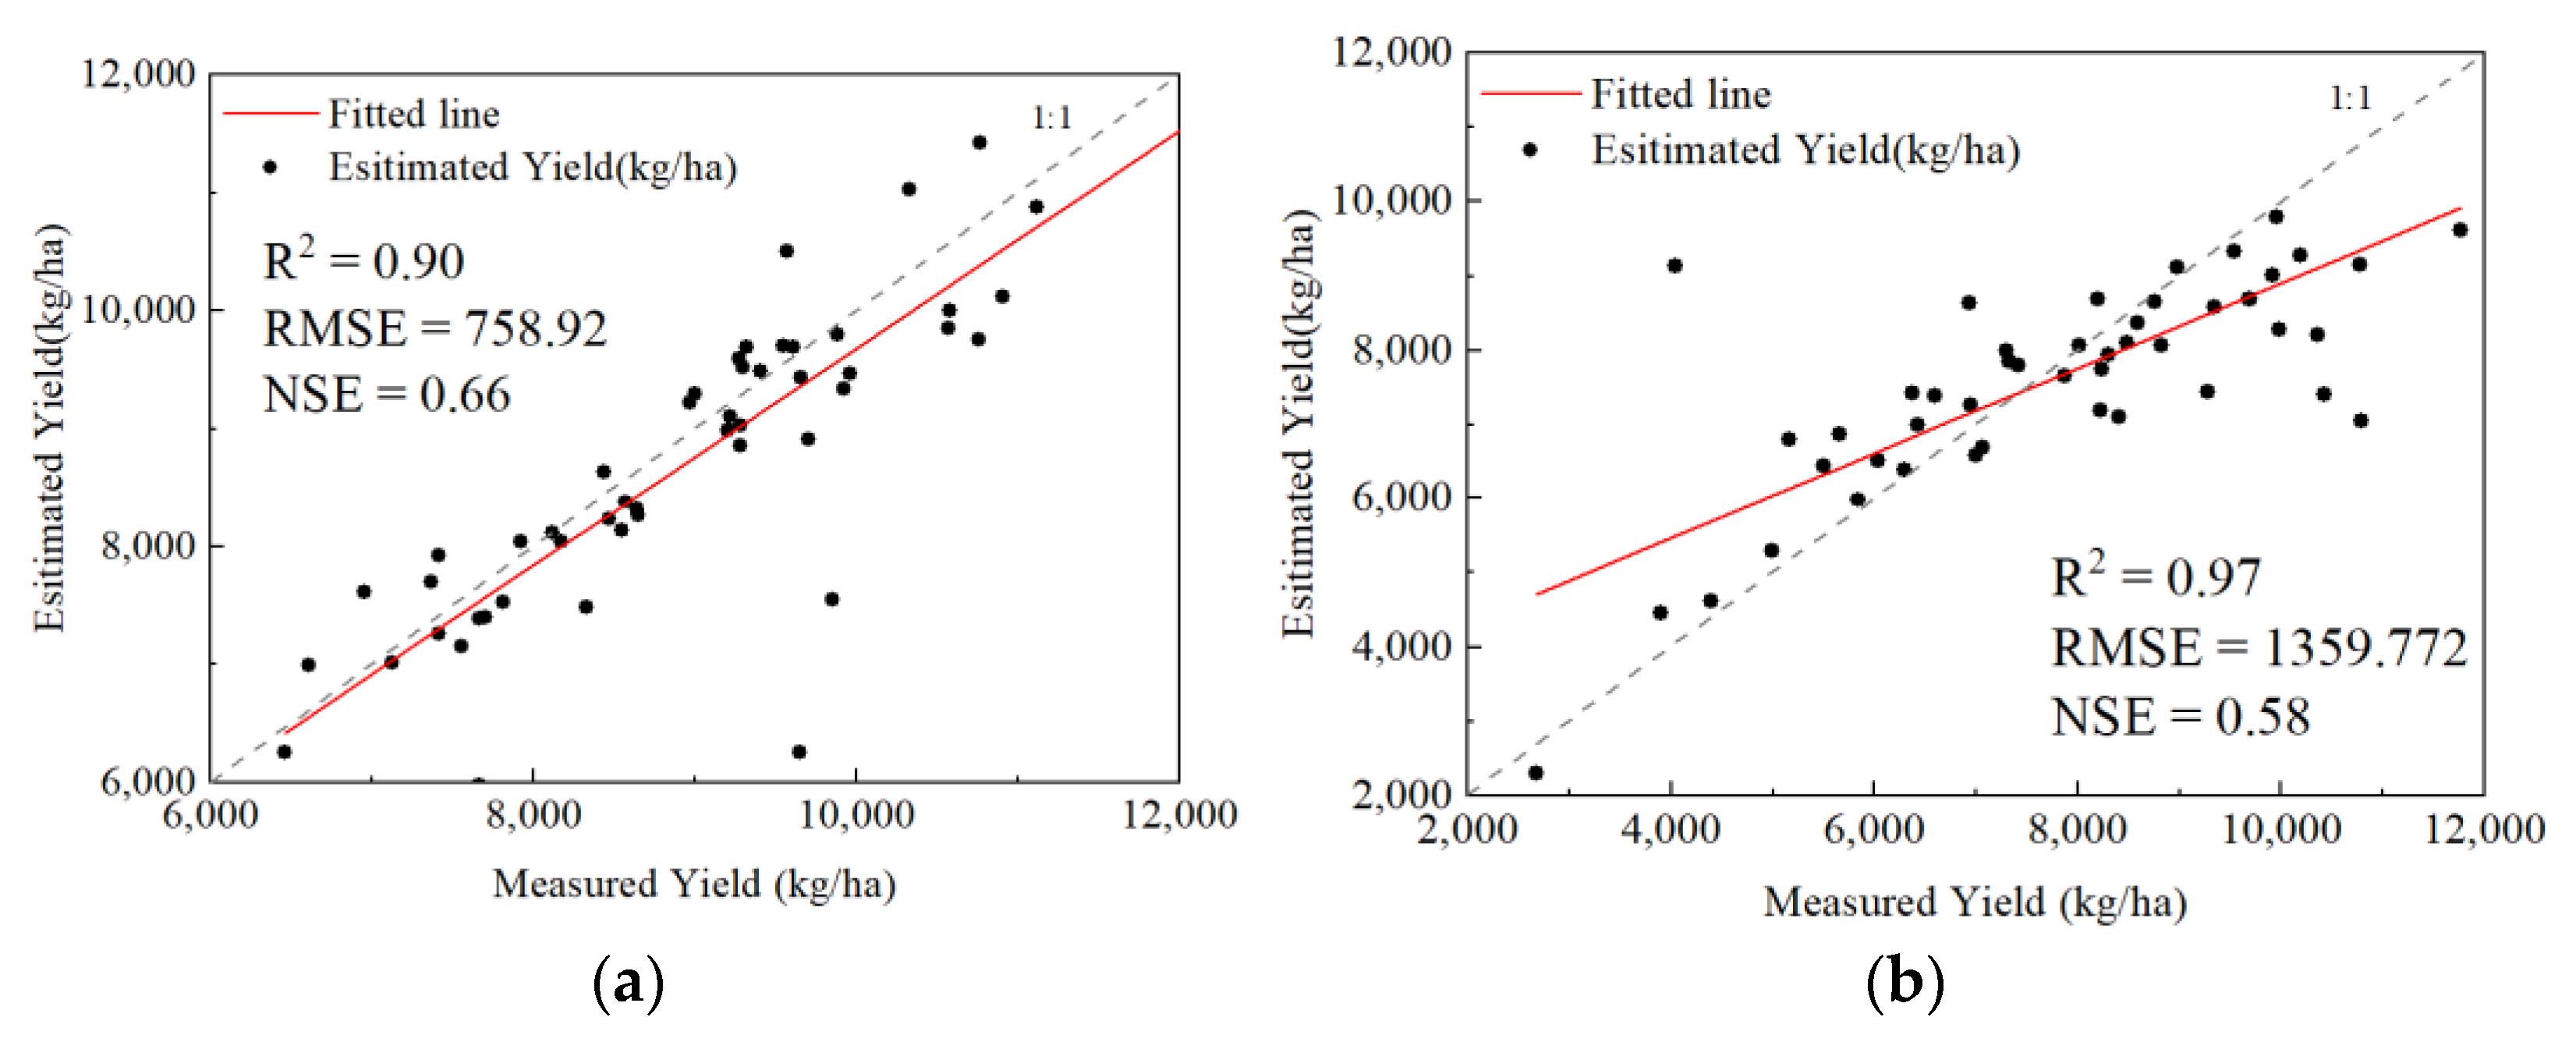
The crop yield estimated from remote sensing images and the measured yield obtained at the sampling points in the study area are shown in Figure 11. The RMSE of wheat is 758.92 kg/ha, the R2 is 0.90, and the NSE is 0.66. The RMSE of maize is 1359.77 kg/ha, the R2 is 0.97, and the NSE is 0.58. Figure 11 shows that the estimated yield results are consistent with the measured values.
4.4. CWP
On the basis of Equation (16), crop ET and yield estimated by remote sensing images were used to calculate the CWP. Figure 12 shows the spatial distribution of wheat and maize. The CWP of wheat ranges mainly from 1.0 to 2.0 kg/m3, with an average of 1.6 kg/m3. The regions with low CWP (less than 1.0 kg/m3) are distributed mainly in the center and south. The regions with high CWP (more than 2.0 kg/m3) are distributed mainly in the north. The CWP of maize ranges mainly from 0.9 to 1.5 kg/m3, with an average of 1.39 kg/m3. The regions with CWP less than 1.0 kg/m3 are distributed in the east and north, and there are fewer regions with CWP greater than 2.0 kg/m3.
5. Discussion
5.1. Analysis of Phenological Period Results
Many scholars have studied crop phenological periods on the Huaibei Plain [46,47]. Table 3 shows the crop phenological periods detected by remote sensing, the measured results from Xinmaqiao Agricultural and Water Comprehensive Experimental Station, and the multiyear average of wheat obtained from Yang et al. [46] and maize obtained from Li et al. [47]. Xinmaqiao Agricultural and Water Comprehensive Experimental Station is located in Xinmaqiao Town, Bengbu City, Anhui Province, and this station is affiliated with the Anhui and Huaihe River Institute of Hydraulic Research. The crop phenological periods at Xinmaqiao Station were obtained from 2015–2016. The ranges of crop phenological periods in this paper, presented in Table 4, are from minimum to maximum values. The crop phenological periods predicted in this paper are in good agreement with other results.
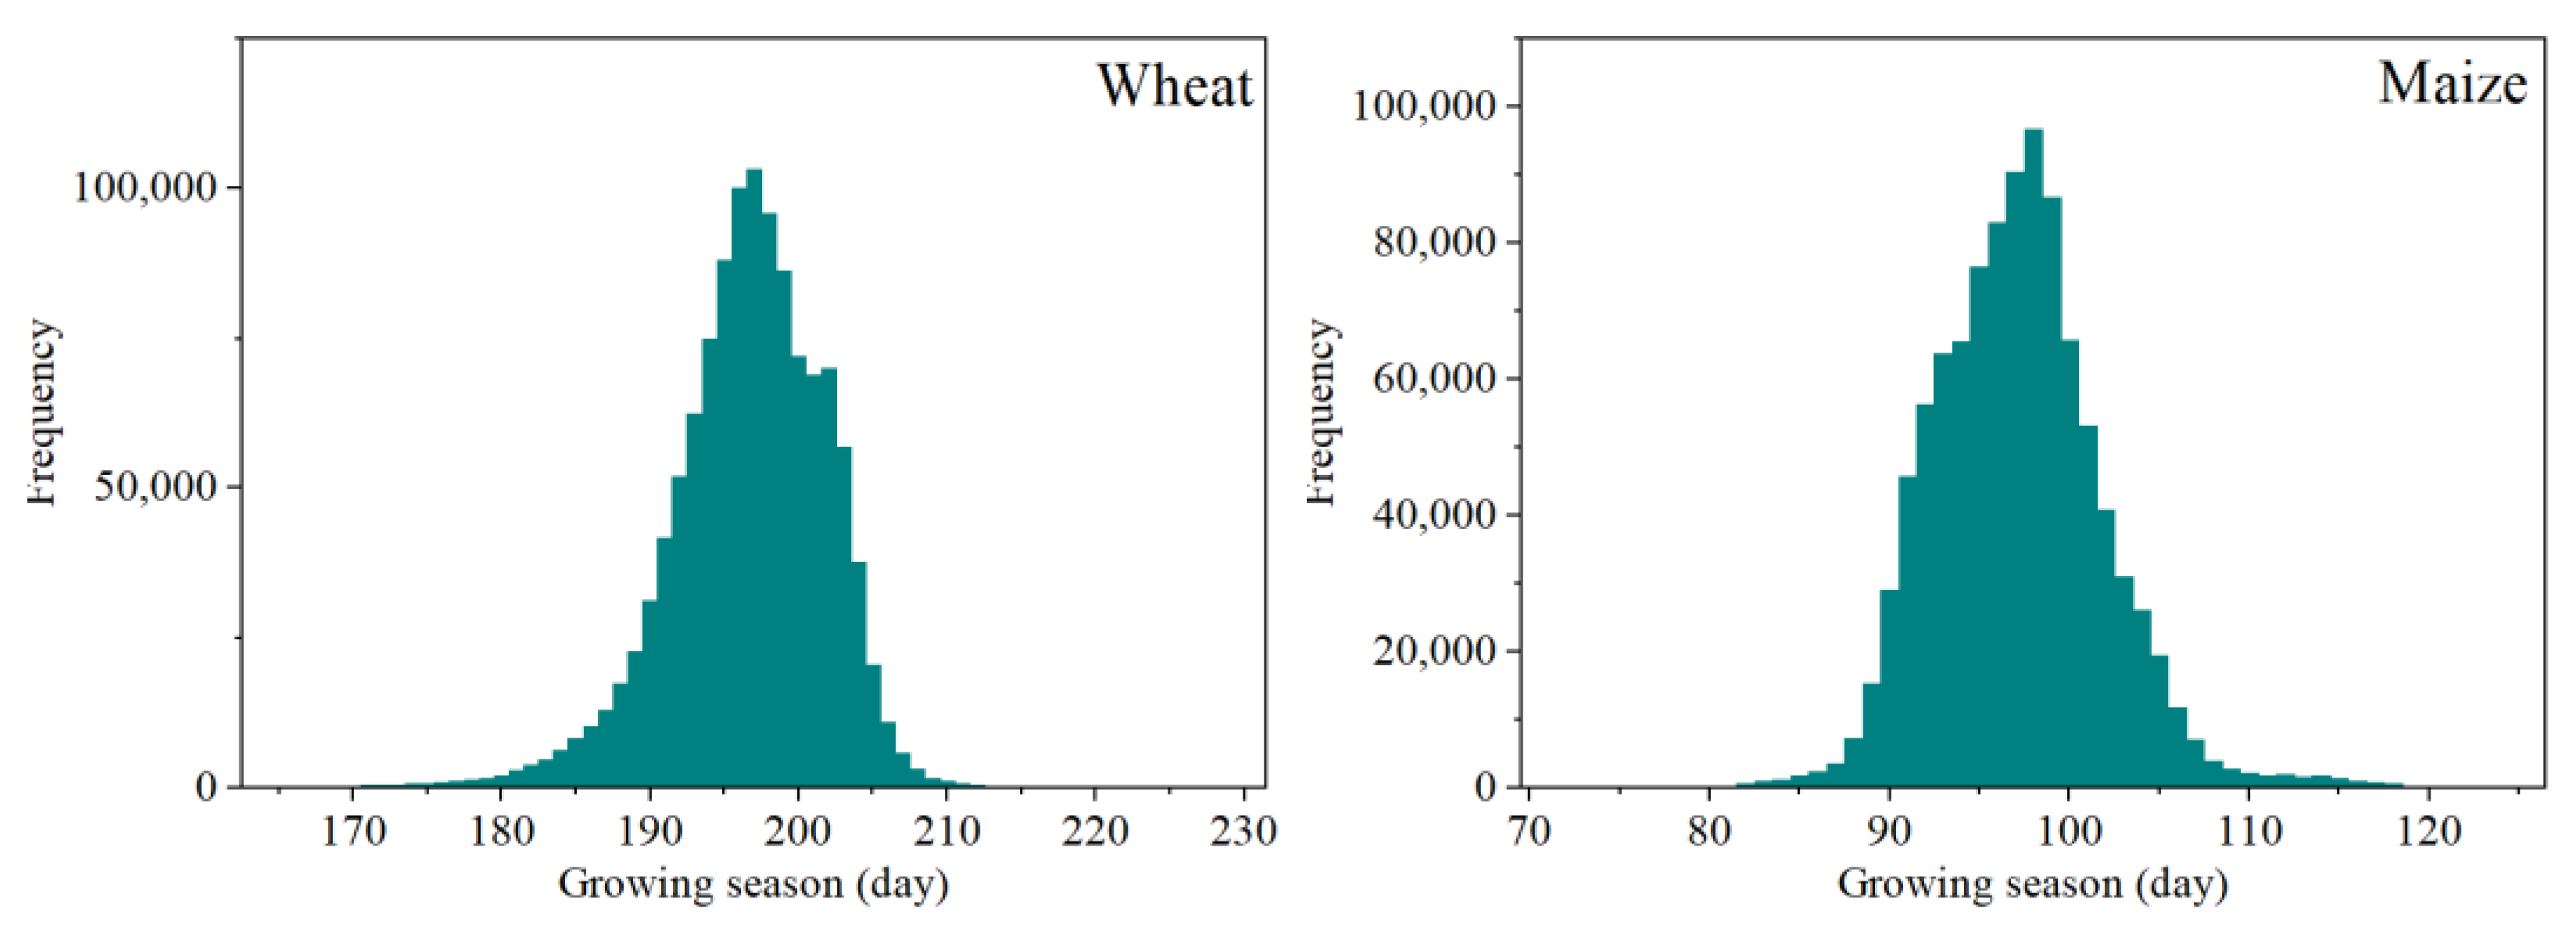
Figure 13 and Figure 14 show the growing season frequency distribution and spatial distribution of wheat and maize. The duration of the wheat growing season ranged mainly from 187 to 206 days, with an average of 197 days. In the western region, the wheat growing season is shorter than that in the northern and southern regions. The spatial distribution of the wheat growing season is opposite of that of the wheat sowing period and is similar to that of the wheat maturity period. The inverse relation indicates that early-sown wheat matured later than others. The duration of the maize growing season ranged mainly from 89 to 106 days, with an average of 97 days. In the northern region, the maize growing season is shorter than that in the southern region. Similar to the relationship among the growing season, sowing period, and maturity period of wheat, earlier-sown maize matured later.
5.2. Analysis of ET Results Based on Phenology Results
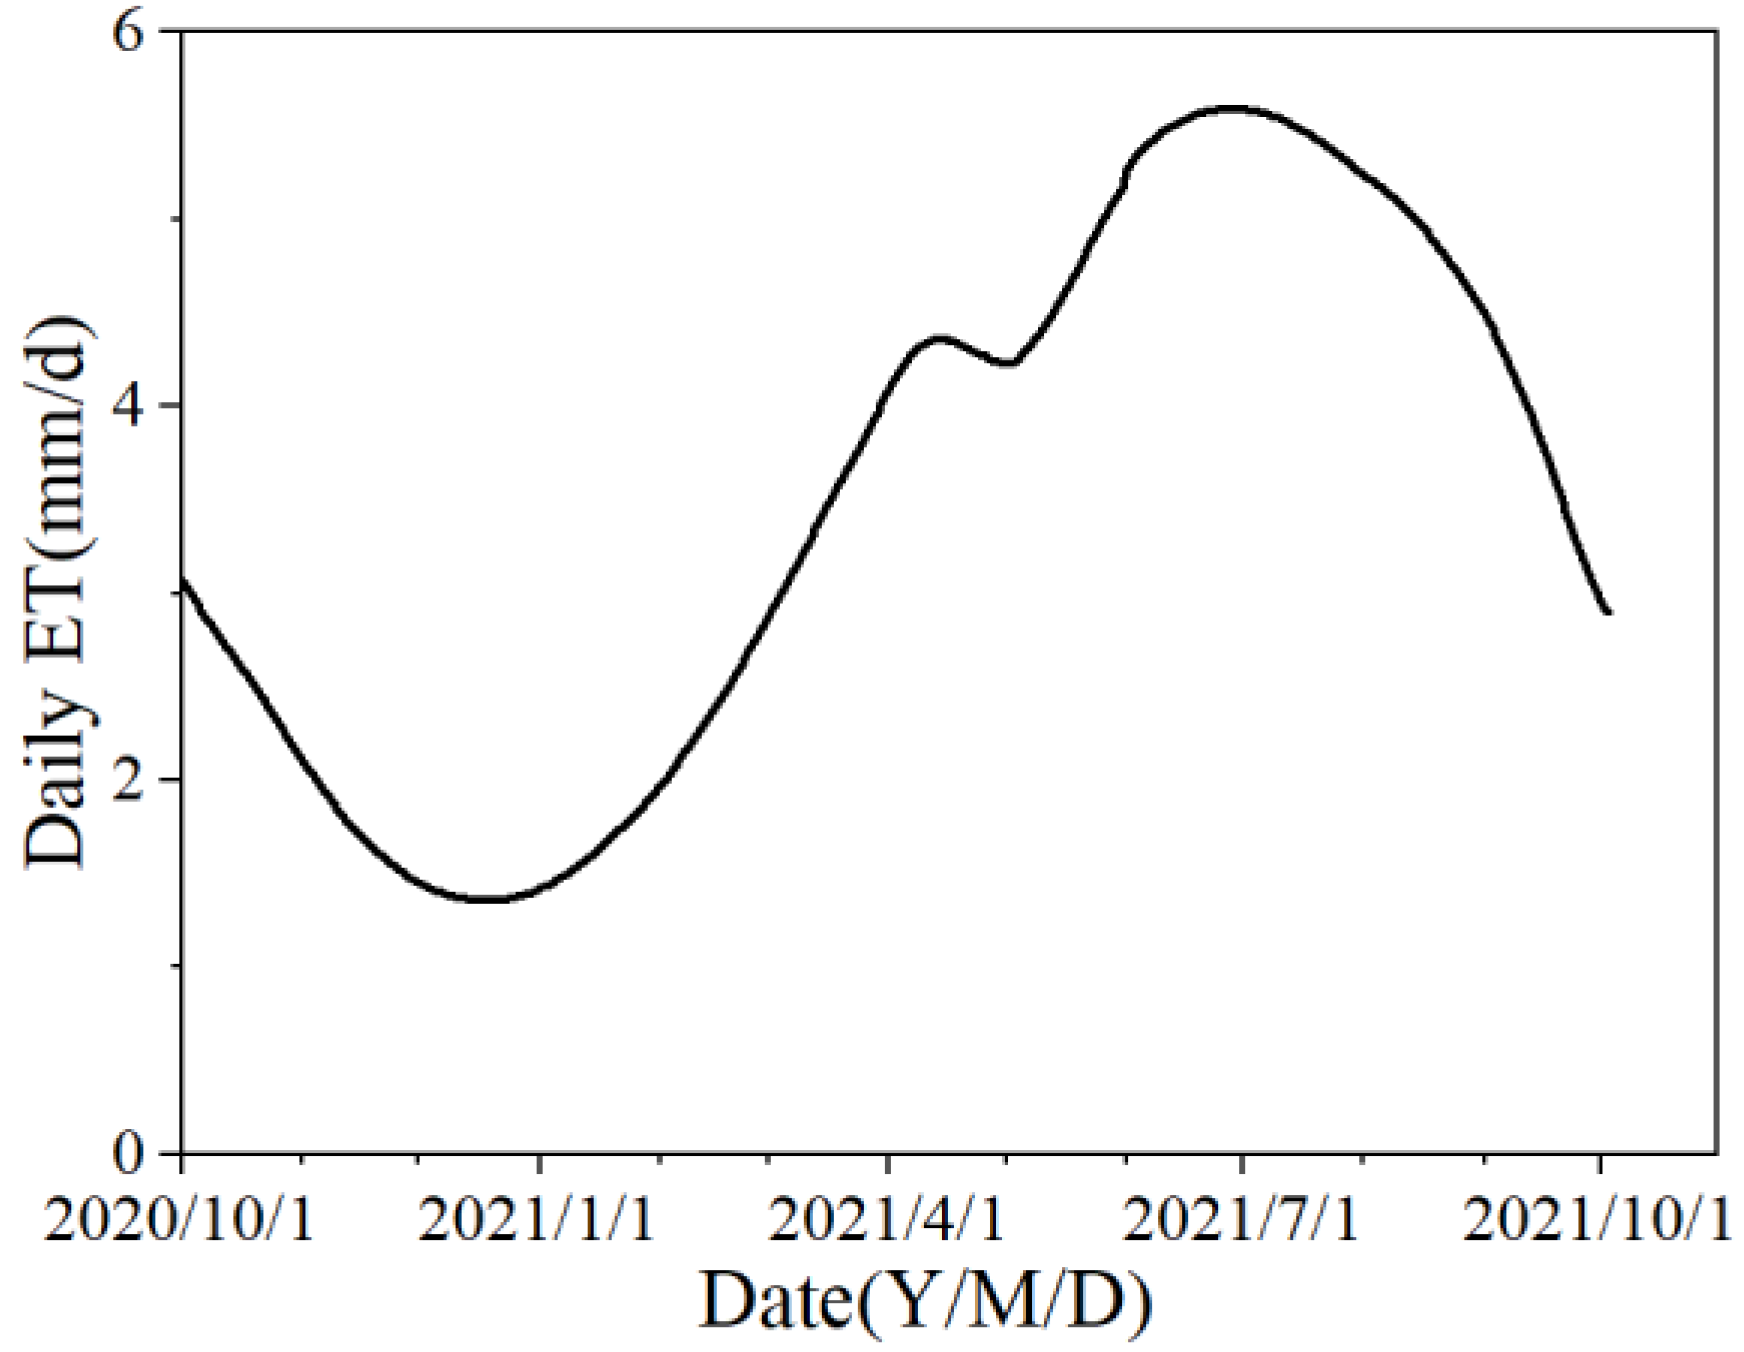
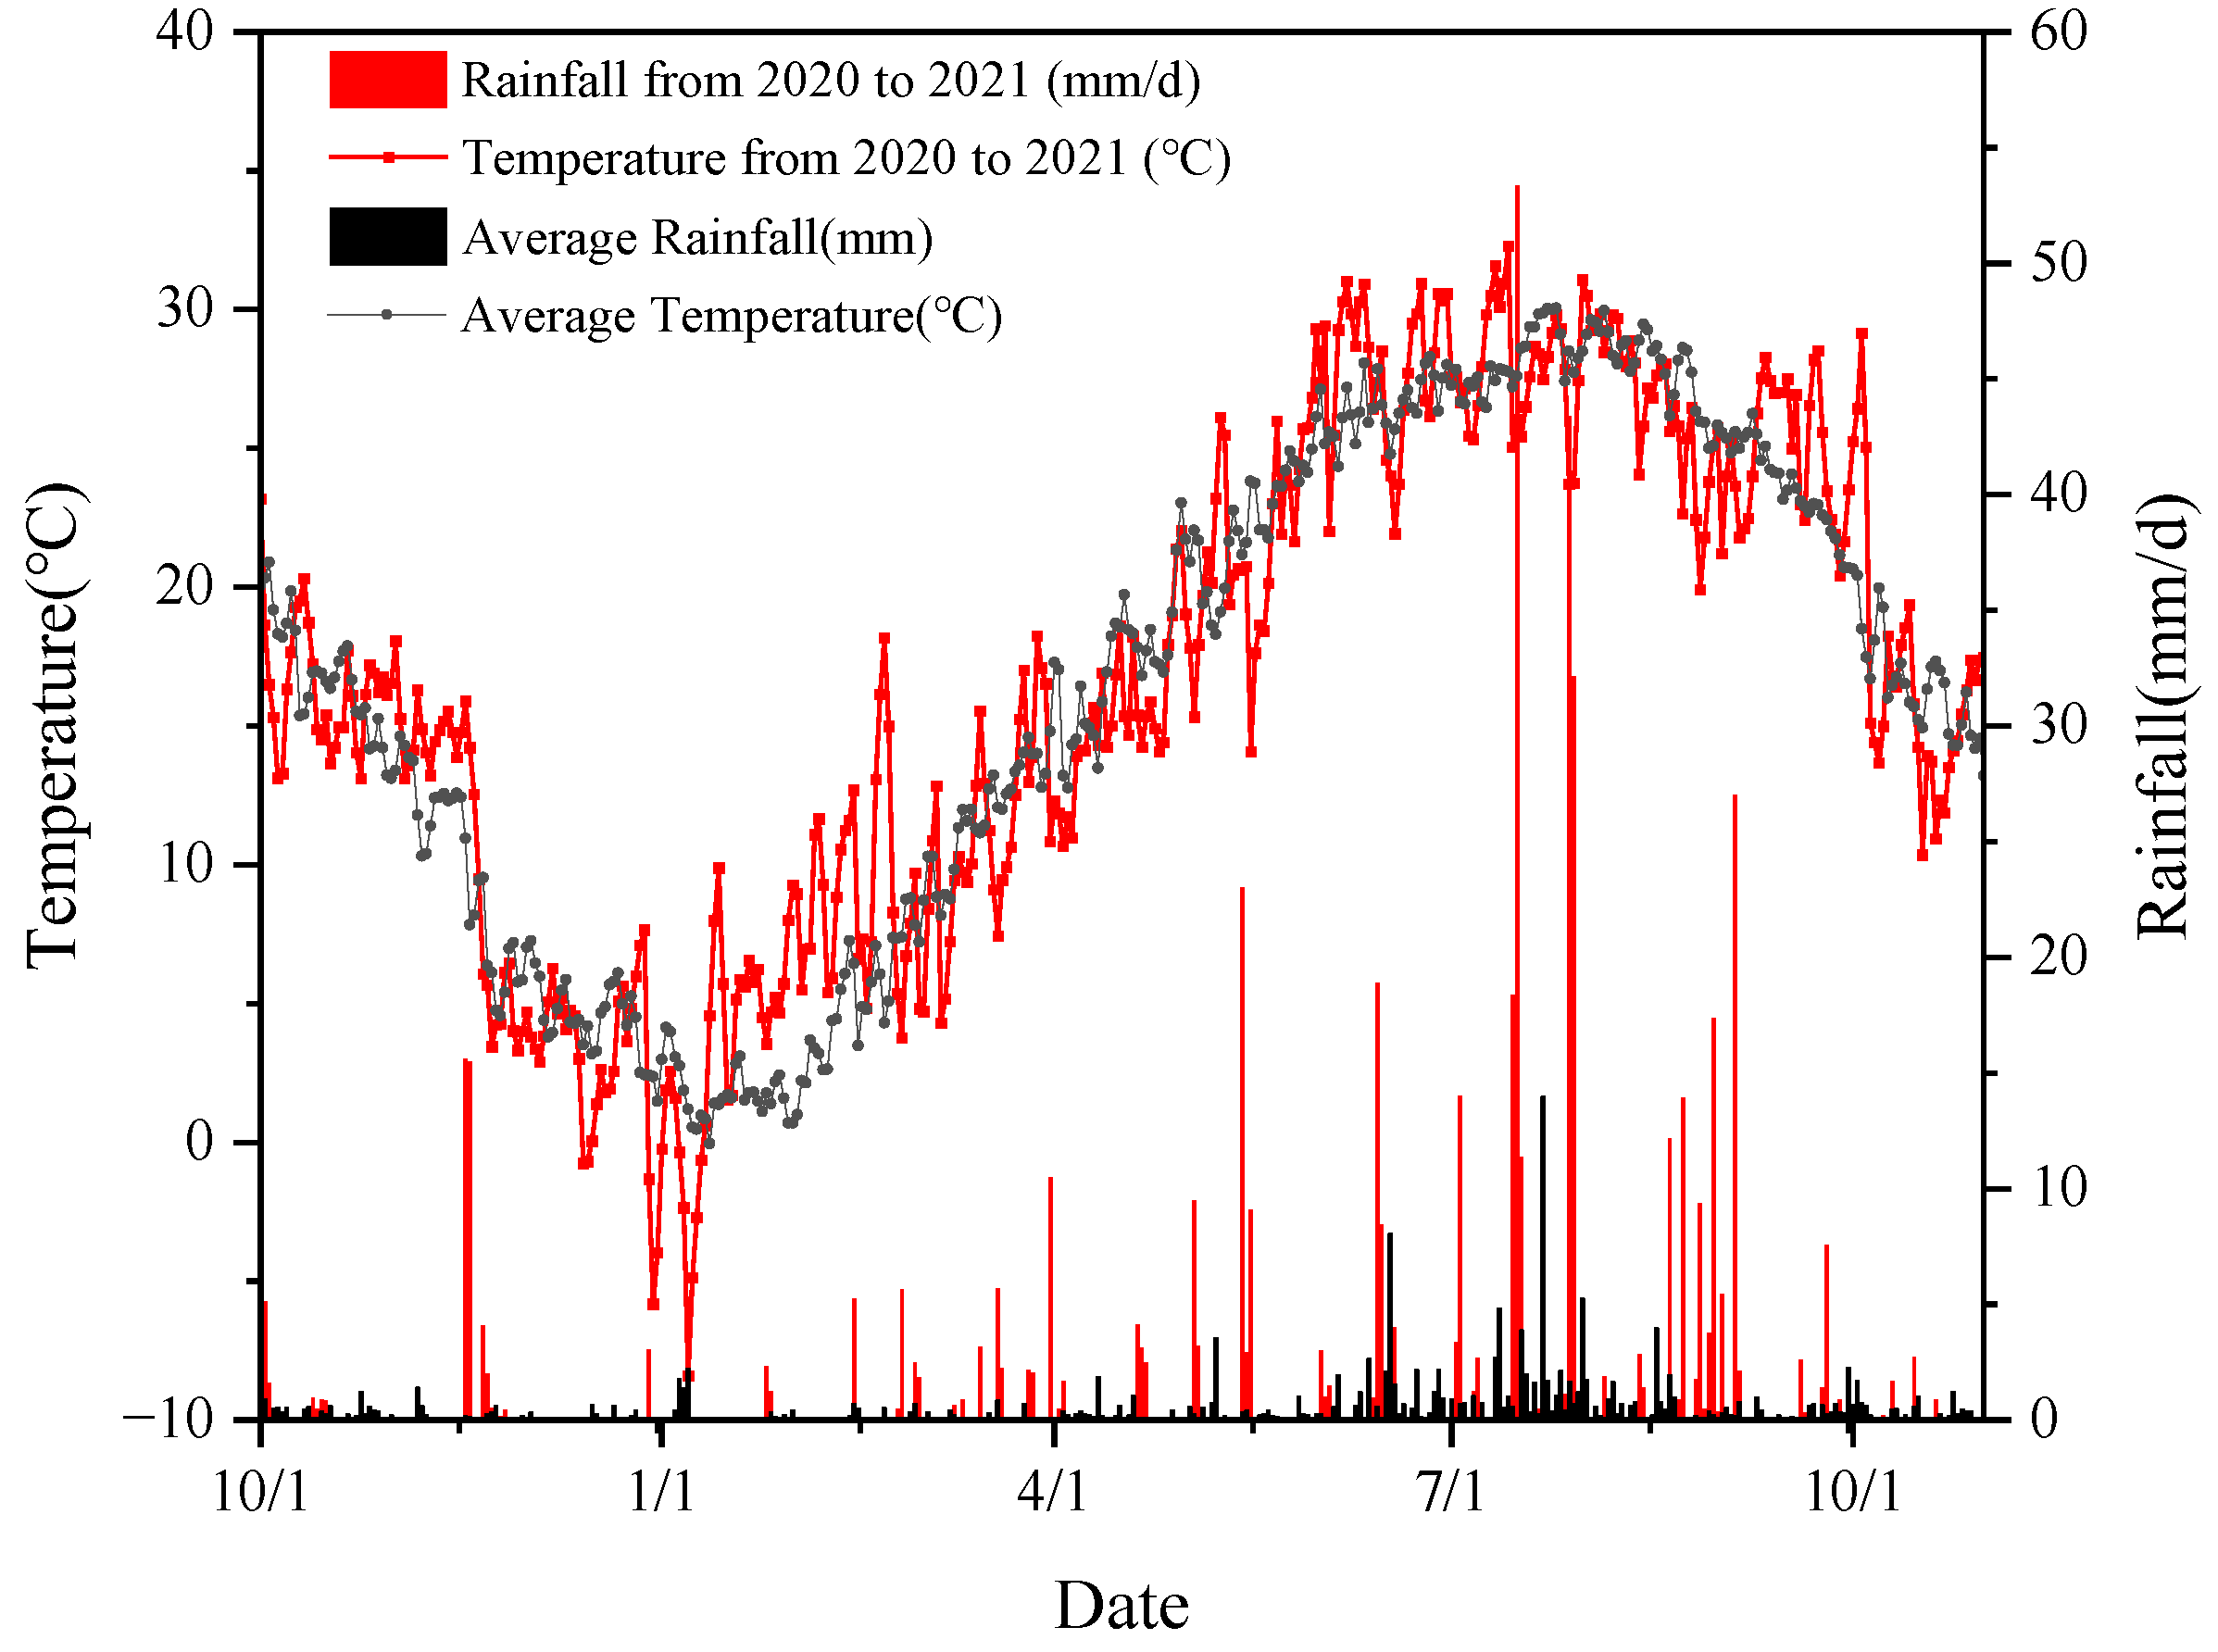
Figure 15 and Figure 16 show the variation in daily ET as well as the comparison between the rainfall and temperature in 2021 and the average of the last five years. Winter wheat and summer maize rotation is the main cropping pattern in Lixin County. The variation in daily ET exhibits an M shape, and the peaks appear at the heading period of wheat and maize. From November 2020 to February 2021, the temperature and daily ET were low. After the period of seedling establishment, the daily ET increases reached the peak value in the heading period of wheat. In the maturity period of wheat and the sowing period of maize, the daily ET was low. In the heading period of maize, the temperature was high, the rainfall was copious, and the daily ET reached the other value peak. In the maturity period of maize, the temperature began to fall, the daily ET also gradually decreased.
In this paper, the ETseason of wheat and maize were similar, which was caused by abnormal precipitation. As Figure 16 shows, the rainfall in the heading period of maize was above the average of the last five years. In the heading period, maize was sensitive to moisture, and its growth was fast [48]. Therefore, the ETseasn of maize is above the multiyear average.
Figure 17 shows the variation in the ratio of actual to potential ET for different phenological periods. The ratios in the heading period were higher than those in the other periods. In the heading and maturity periods of wheat and maize, rainfall was abundant, and the actual ET was high. Especially in the heading period of maize, rainfall was sufficient to meet the needs of crops.
5.3. Relationships among CWP, Yield, and ET
It is very important in water-saving agriculture to understand the relationship among CWP, crop yield, and ET. By comparing the spatial distribution of yield and CWP, it was found that some areas have high yield but low CWP, and some areas have low yield but high CWP. For agriculture, saving water increases CWP but does not decrease crop yield.
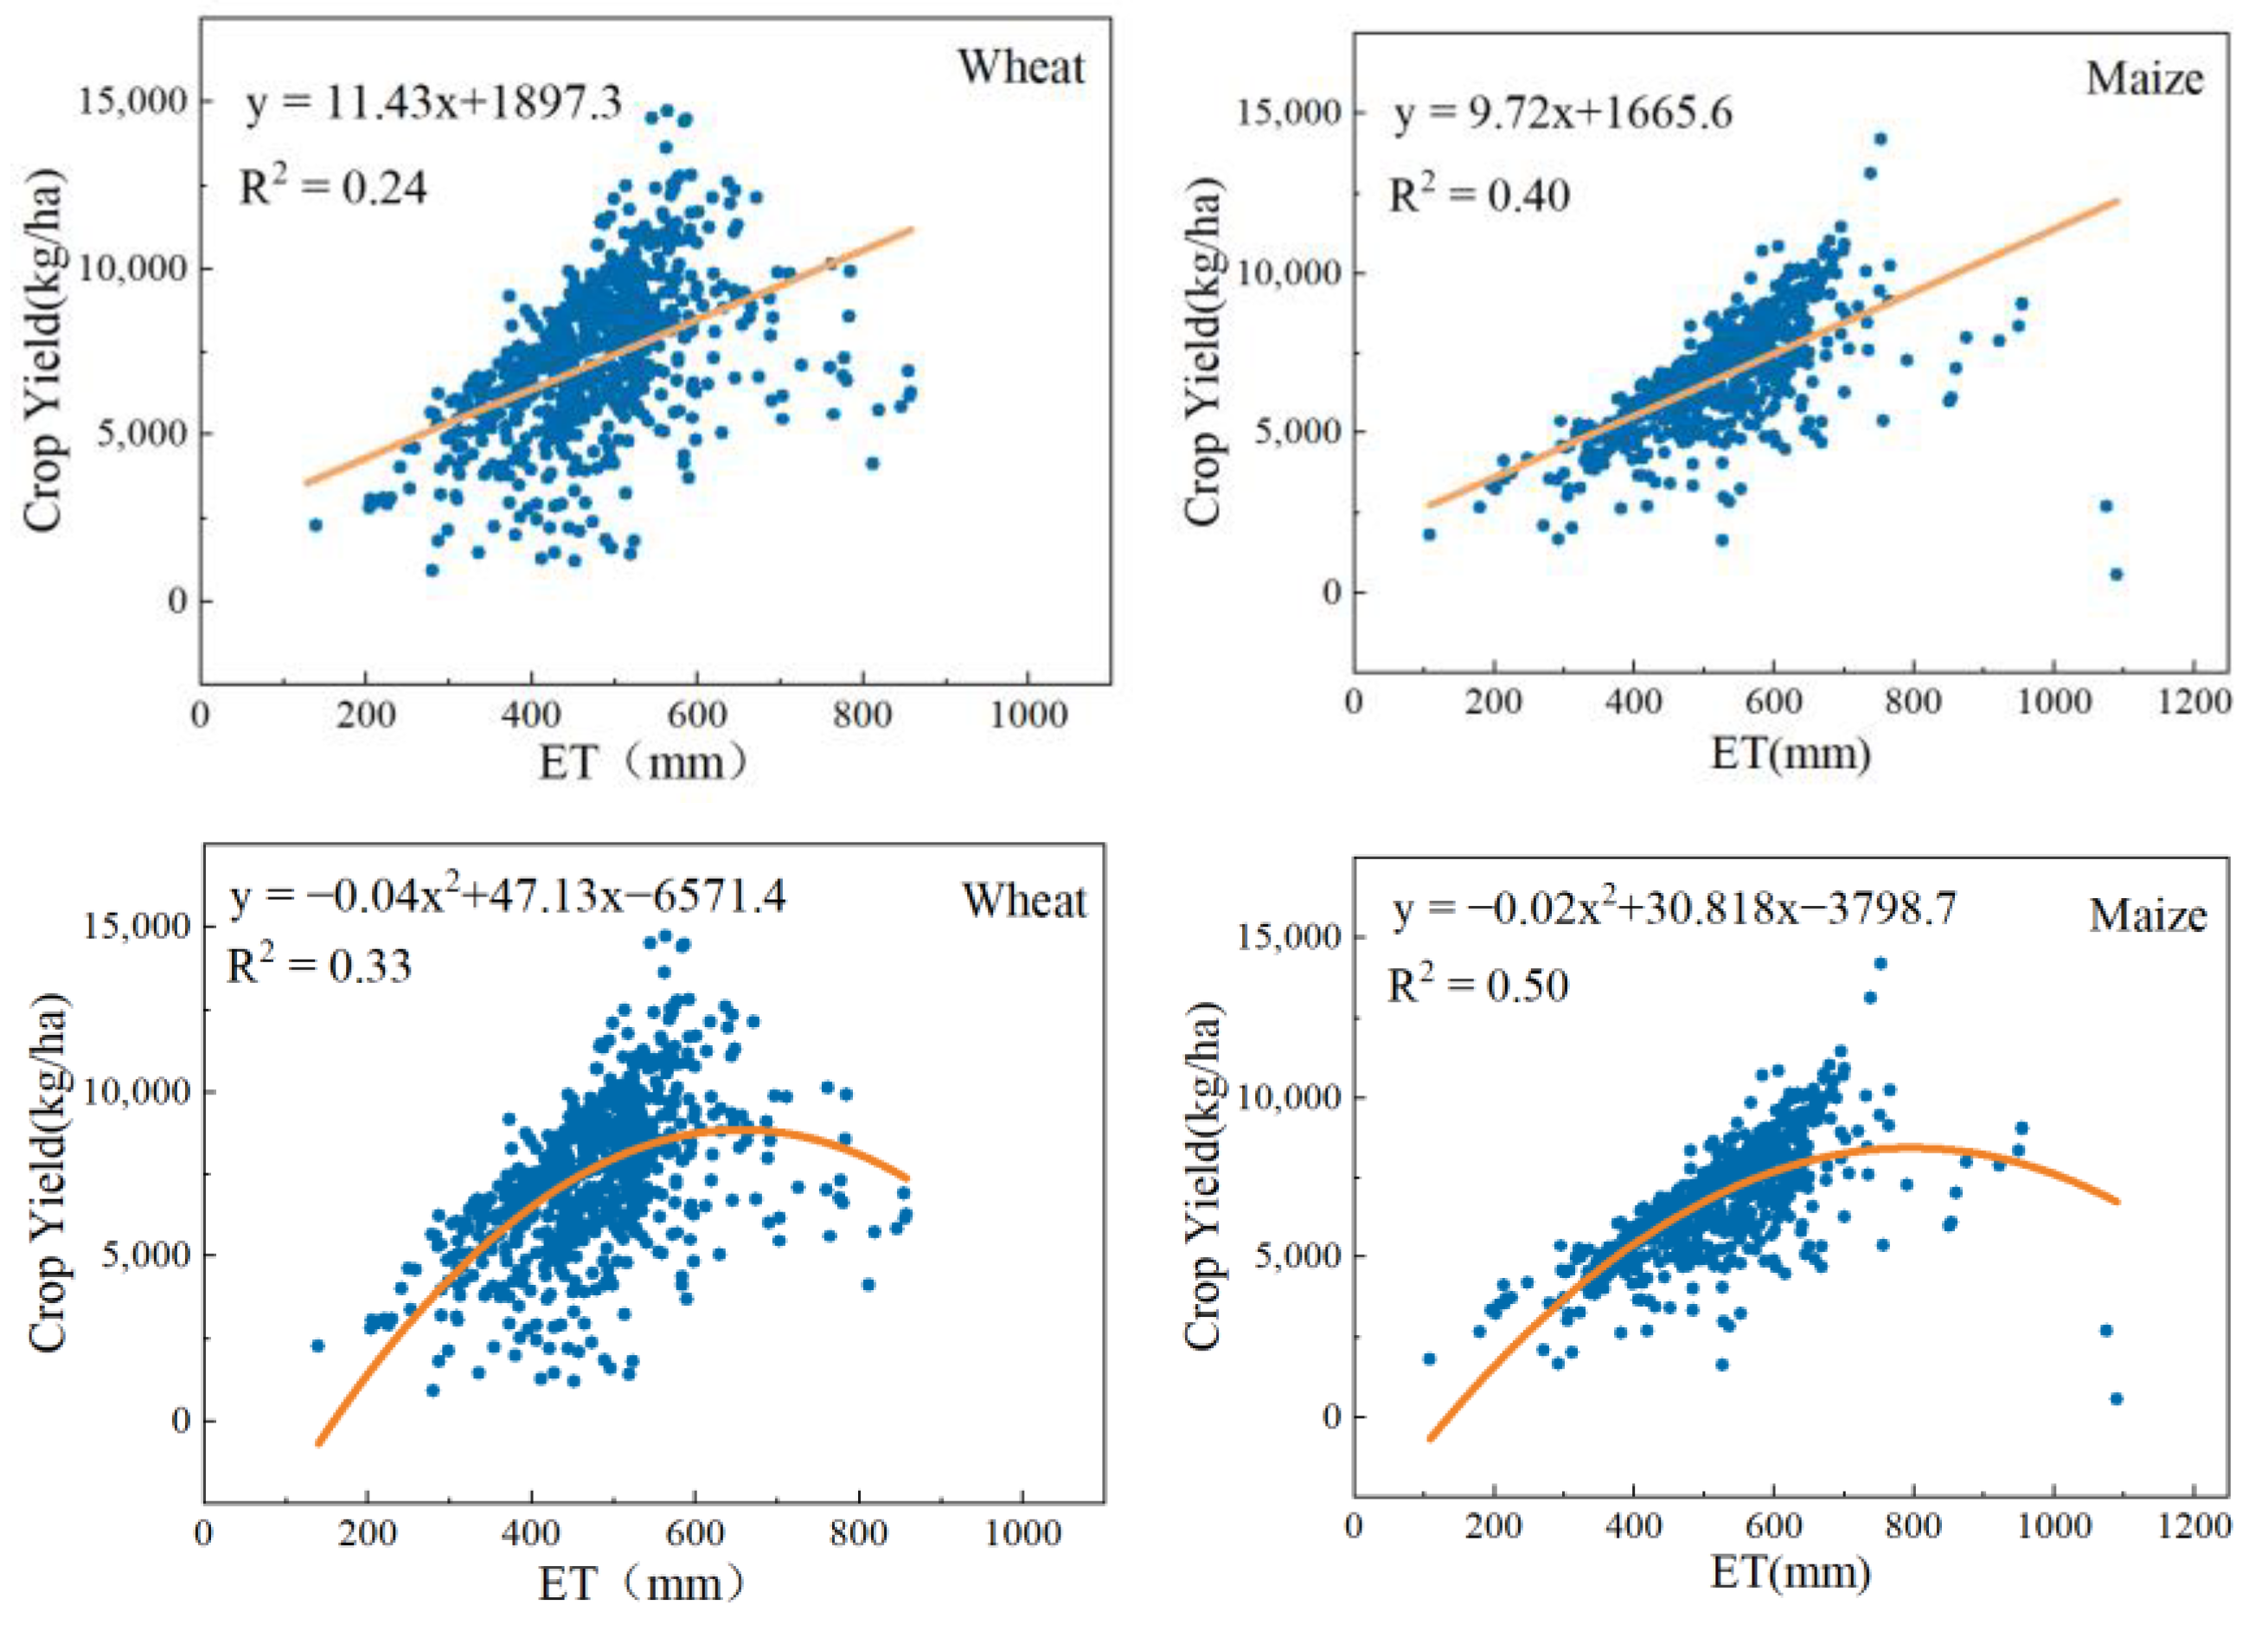
Figure 18 illustrates diagrams between crop yield and ET required to achieve that yield. The linear fitting curves show that the relationship between yield and ET is positive. Compared with the linear fitting method, the polynomial fitting method is better. The polynomial fitting curves show that there is a negative parabolic relationship between the crop yield and ET. The crop yield increases before reaching the peak and then drops as the ET increases. This means that more irrigation does not necessarily result in a higher yield [6]. Therefore, high crop yield, supported by high water supply, will not lead to high CWP.
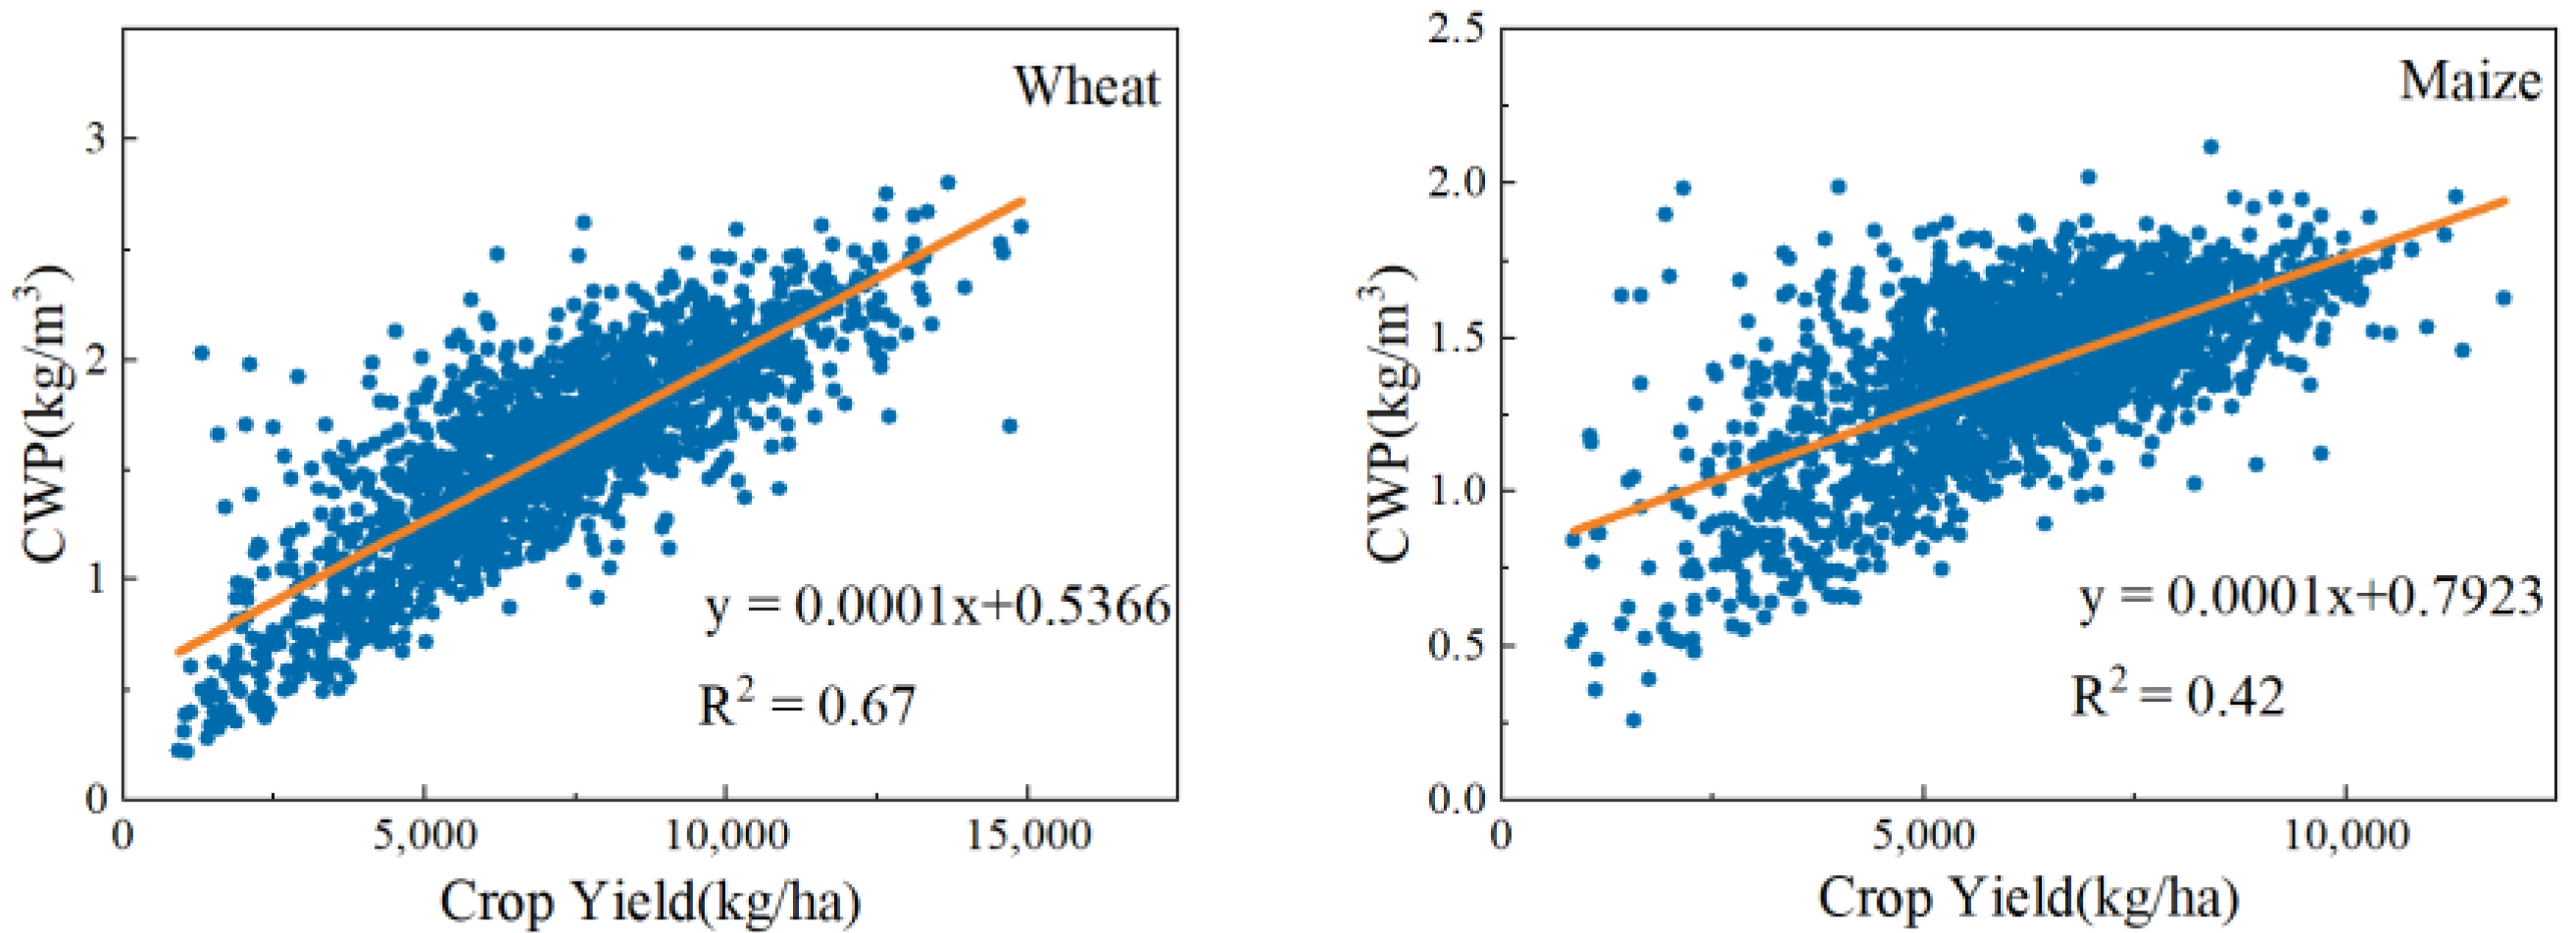
In Figure 19, there is a close linear relationship between CWP and crop yield. The CWP generally increases as crop yield increases. This conclusion is similar to the study results of Li et al. [6]. Therefore, an important direction of CWP development is to improve the yield in Lixin County.
Improving crop yield is an important research direction to improve CWP in Lixin County. According to a local field investigation, there is little irrigation of wheat in Lixin County, rainfall is concentrated mostly in summer, and adequate irrigation is necessary in the heading period. The variety of wheat is an important factor affecting the final crop yield. According to the investigation, the wheat yield of Woyang 101 is higher than that of other varieties, but many farmers are not familiar with the varieties of wheat. Hence, the crop yield and CWP can be increased by promoting the fine varieties of wheat. Due to the abundant rainfall during the maize growing season, preventing waterlogging is an important factor increasing maize yield. According to statistics, the yield of maize affected by waterlogging is half that of the others.
6. Conclusions
In this paper, the crop phenological periods were detected from EVI curves based on MODIS and Sentinel-2 data. The SEBAL model and P-M equation were applied to estimate the daily ET and accumulated ET during the growing season of winter wheat and summer maize in Lixin County. The crop yields of wheat and maize were estimated using the dry biomass–harvest index method. The CWP of wheat and maize was calculated as the ratio of crop yield to the accumulated ET during the growing season. The main conclusions are as follows:
- The phenological periods detected from remote sensing images are in good agreement with other studies. The average duration of the growing season for wheat and maize were 197 days and 97 days, respectively.
- The daily ET estimated by the SEBAL model and P-M equation is consistent with the measured ET, with R2, NSE, and RMSE values of 0.96, 0.90, and 0.56 mm/day, respectively. The average ETseason of wheat and maize from 2020 to 2021 were 428.51 mm and 422.85 mm, respectively.
- The average yields of wheat and maize were 7169 kg/ha and 6081 kg/ha, respectively, and the yield estimated by the dry mass–harvest index was consistent with the measured yield. Based on the analysis of yield and ETseason, there is a negative parabolic relationship between crop yield and ETseason.
- The average CWPs of wheat and maize were 1.6 kg/m3 and 1.39 kg/m3, respectively, and there was a close linear relationship between CWP and crop yield.
In this paper, the detection of crop phenological periods has been effectively applied in the estimation of CWP in Lixin County. However, the conditions of crop growth are complex. Research on Kc and HI needs further study, which will improve the accuracy of the CWP estimated by remote sensing methods.
Author Contributions
Conceptualization, H.G. and X.Z.; methodology, X.Z., H.G. and X.W.; software, H.G. and X.Z.; validation, X.Z. and H.G.; formal analysis, X.Z. and H.G.; investigation, X.Z. and H.G.; resources, X.Z., H.G., X.W. and Y.Z.; data curation, X.Z. and H.G.; writing—original draft preparation, X.Z. and H.G.; writing—review and editing, X.Z. and H.G.; visualization, X.Z. and H.G.; supervision, X.Z. and Y.Z.; project administration, X.Z. and X.W.; funding acquisition, X.Z. and X.W. All authors have read and agreed to the published version of the manuscript.
Funding
This research was funded by the National Key Research and Development Program of China (2018YFC1508302 and 2018YFC1508301) and Hubei Natural Science Foundation (2019CFB507).
Data Availability Statement
Data are not available due to non-disclosure agreements.
Conflicts of Interest
The authors declare no conflict of interest.
References
- Bastiaanssen, W.G.M.; Steduto, P. The water productivity score (WPS) at global and regional level: Methodology and first results from remote sensing measurements of wheat, rice and maize. Sci. Total Environ. 2017, 575, 595–611. [Google Scholar] [CrossRef] [PubMed]
- Hellegers, P.; Soppe, R.; Perry, C.J.; Bastiaanssen, W.G.M. Combining remote sensing and economic analysis to support decisions that affect water productivity. Irrig. Sci. 2009, 27, 243–251. [Google Scholar] [CrossRef]
- Ali, M.H.; Talukder, M.S.U. Increasing water productivity in crop production—A synthesis. Agric. Water Manag. 2008, 95, 1201–1213. [Google Scholar] [CrossRef]
- Zwart, S.J.; Bastiaanssen, W.G.M. Review of measured crop water productivity values for irrigated wheat, rice, cotton and maize. Agric. Water Manag. 2004, 69, 115–133. [Google Scholar] [CrossRef]
- Xu, F.; Gai, Y.; Xu, Z.; Wang, W. A Review of Evaluation Methods of Crop Water Productivity. J. Glaciol. Geocryol. 2013, 35, 156–163. [Google Scholar]
- Li, H.; Zheng, L.; Lei, Y.; Li, C.; Liu, Z.; Zhang, S. Estimation of water consumption and crop water productivity of winter wheat in North China Plain using remote sensing technology. Agric. Water Manag. 2008, 95, 1271–1278. [Google Scholar] [CrossRef]
- Cai, X.L.; Sharma, B.R. Integrating remote sensing, census and weather data for an assessment of rice yield, water consumption and water productivity in the Indo-Gangetic river basin. Agric. Water Manag. 2010, 97, 309–316. [Google Scholar] [CrossRef]
- Zwart, S.J.; Bastiaanssen, W.G.M.; de Fraiture, C.; Molden, D.J. A global benchmark map of water productivity for rainfed and irrigated wheat. Agric. Water Manag. 2010, 97, 1617–1627. [Google Scholar] [CrossRef]
- Yan, N.N.; Wu, B.F. Integrated spatial-temporal analysis of crop water productivity of winter wheat in Hai Basin. Agric. Water Manag. 2014, 133, 24–33. [Google Scholar] [CrossRef]
- Wei, G.; Cao, J.; Xie, H.; Xie, H.; Yang, Y.; Wu, C.; Cui, Y.; Luo, Y. Spatial-Temporal Variation in Paddy Evapotranspiration in Subtropical Climate Regions Based on the SEBAL Model: A Case Study of the Ganfu Plain Irrigation System, Southern China. Remote Sens. 2022, 14, 1201. [Google Scholar] [CrossRef]
- Monfreda, C.; Ramankutty, N.; Foley, J.A. Farming the planet: 2. Geographic distribution of crop areas, yields, physiological types, and net primary production in the year 2000. Glob. Biogeochem. Cycle 2008, 22. [Google Scholar] [CrossRef]
- Field, C.B.; Randerson, J.T.; Malmstrom, C.M. Global Net Primary Production—Combining Ecology and Remote-Sensing. Remote Sens. Environ. 1995, 51, 74–88. [Google Scholar] [CrossRef] [Green Version]
- Monteith, J.L. Solar Radiation and Productivity in Tropical Ecosystems. J. Appl. Ecol. 1972, 9, 747–766. [Google Scholar] [CrossRef] [Green Version]
- Blatchford, M.L.; Mannaerts, C.M.; Zeng, Y.; Nouri, H.; Karimi, P. Status of accuracy in remotely sensed and in-situ agricultural water productivity estimates: A review. Remote Sens. Environ. 2019, 234, 111413. [Google Scholar] [CrossRef]
- Yuan, W.; Chen, Y.; Xia, J.; Dong, W.; Magliulo, V.; Moors, E.; Olesen, J.E.; Zhang, H. Estimating crop yield using a satellite-based light use efficiency model. Ecol. Indic. 2016, 60, 702–709. [Google Scholar] [CrossRef] [Green Version]
- Kalma, J.D.; McVicar, T.R.; McCabe, M.F. Estimating Land Surface Evaporation: A Review of Methods Using Remotely Sensed Surface Temperature Data. Surv. Geophys. 2008, 29, 421–469. [Google Scholar] [CrossRef]
- Löw, F.; Biradar, C.; Fliemann, E.; Lamers, J.P.A.; Conrad, C. Assessing gaps in irrigated agricultural productivity through satellite earth observations—A case study of the Fergana Valley, Central Asia. Int. J. Appl. Earth Obs. Geoinf. 2017, 59, 118–134. [Google Scholar] [CrossRef]
- Zhao, N.; Liu, Y.; Cai, J. Calculation of crop coefficient and water consumption of summer maize. J. Hydraul. Eng. 2010, 41, 953–959+969. [Google Scholar] [CrossRef]
- Moriondo, M.; Maselli, F.; Bindi, M. A simple model of regional wheat yield based on NDVI data. Eur. J. Agron. 2007, 26, 266–274. [Google Scholar] [CrossRef]
- Yu, B.; Shang, S. Multi-Year Mapping of Maize and Sunflower in Hetao Irrigation District of China with High Spatial and Temporal Resolution Vegetation Index Series. Remote Sens. 2017, 9, 855. [Google Scholar] [CrossRef] [Green Version]
- Fan, H.; Lv, P.; Wang, P.; Hu, T.; Xu, J.; Zhang, D. Rice Phenological Variation Characteristics in Hangjiahu Plain Based on Remote Sensing Data. J. Hangzhou Norm. Univ. (Nat. Sci. Ed.) 2019, 18, 636–641. [Google Scholar]
- Huete, A.; Didan, K.; Miura, T.; Rodriguez, E.P.; Gao, X.; Ferreira, L.G. Overview of the radiometric and biophysical performance of the MODIS vegetation indices. Remote Sens. Environ. 2002, 83, 195–213. [Google Scholar] [CrossRef]
- Tateishi, R.; Ebata, M. Analysis of phenological change patterns using 1982–2000 Advanced Very High Resolution Radiometer (AVHRR) data. Int. J. Remote Sens. 2004, 25, 2287–2300. [Google Scholar] [CrossRef]
- White, J.D.; Running, S.W.; Nemani, R.; Keane, R.E.; Ryan, K.C. Measurement and remote sensing of LAI in Rocky Mountain montane ecosystems. Can. J. For. Res.-Rev. Can. Rech. For. 1997, 27, 1714–1727. [Google Scholar] [CrossRef]
- Lloyd, D. A Phenological Classification of Terrestrial Vegetation Cover Using Shortwave Vegetation Index Imagery. Int. J. Remote Sens. 1990, 11, 2269–2279. [Google Scholar] [CrossRef]
- Liu, X.; Zhou, L.; Shi, H.; Wang, S.; Chi, Y. Phenological characteristics of temperate coniferous and broad-leaved mixed forests based on multiple remote sensing vegetation indices, chlorophyll fluorescence and CO2 flux data. Acta Ecol. Sin. 2018, 38, 3482–3494. [Google Scholar]
- Huete, A.; Justice, C.; Van Leeuwen, W. MODIS vegetation index (MOD13). Algorithm Theor. Basis Doc. 1999, 3. [Google Scholar]
- Bolton, D.K.; Friedl, M.A. Forecasting crop yield using remotely sensed vegetation indices and crop phenology metrics. Agric. For. Meteorol. 2013, 173, 74–84. [Google Scholar] [CrossRef]
- Zhong, L.H.; Gong, P.; Biging, G.S. Phenology-based Crop Classification Algorithm and its Implications on Agricultural Water Use Assessments in California’s Central Valley. Photogramm. Eng. Remote Sens. 2012, 78, 799–813. [Google Scholar] [CrossRef]
- Li, J.; Roy, D.P. A Global Analysis of Sentinel-2A, Sentinel-2B and Landsat-8 Data Revisit Intervals and Implications for Terrestrial Monitoring. Remote Sens. 2017, 9, 902. [Google Scholar] [CrossRef] [Green Version]
- Liu, B.; Guo, S.; Li, Z.; Xie, Y.; Zhang, K.; Liu, X. Sampling survey of hydraulic erosion in China. Soil Water Conserv. 2013, 10, 26–34. [Google Scholar] [CrossRef]
- Dong, T.; Meng, L.; Zhang, W. Analysis of the application of MODIS shortwave infrared water stress index in monitoring agricultural drought. Natl. Remote Sens. Bull. 2015, 19, 319–327. [Google Scholar]
- Chen, J.; Liu, Y.; Yu, X. Planting Information Extraction of Winter Wheat Based on the Time-Series MODIS-EVI. Chin. Agric. Sci. Bull. 2011, 27, 446–450. [Google Scholar]
- Liu, J.; Li, M.; Wang, P.; Huang, J. Monitoring of phenology by reconstructing LAI time series data for winter wheat. Trans-Actions Chin. Soc. Agric. Eng. 2013, 29, 120–129. [Google Scholar]
- Xu, Y. Inverse the Phenology of Rice Spatial and Temporal Variations Based on MODIS Data in Northeast China. Master’s Thesis, Chinese Academy of Meteorological Sciences, Beijing, China, 2012. [Google Scholar]
- Li, S.; Chen, J.; Chen, F.; Li, L.; Zhang, H. Characteristics of Growth and Development of Winter Wheat under Zero-tillage in North China Plain. Acta Agron. Sin. 2008, 34, 290–296. [Google Scholar] [CrossRef]
- Zhang, M. Study on the Method of Crop Phenology Detection and Crop Types Discrimination Based on Modis Data. Ph.D. Thesis, Huazhong Agricultural University, Wuhan, China, 2006. [Google Scholar]
- Bastiaanssen, W.G.M.; Menenti, M.; Feddes, R.A.; Holtslag, A.A.M. A remote sensing surface energy balance algorithm for land (SEBAL)—1. Formulation. J. Hydrol. 1998, 212, 198–212. [Google Scholar] [CrossRef]
- Teixeira, A.; Bastiaanssen, W.G.M.; Ahmad, M.D.; Bos, M.G. Reviewing SEBAL input parameters for assessing evapotranspiration and water productivity for the Low-Middle Sao Francisco River basin, Brazil Part B: Application to the regional scale. Agric. For. Meteorol. 2009, 149, 477–490. [Google Scholar] [CrossRef]
- Bastiaanssen, W.G.M.; Ahmad, M.U.D.; Chemin, Y. Satellite surveillance of evaporative depletion across the Indus Basin. Water Resour. Res. 2002, 38. [Google Scholar] [CrossRef]
- Allen, R.; Pereira, L.; Raes, D.; Smith, M.; Allen, R.G.; Pereira, L.S.; Martin, S. Crop Evapotranspiration: Guidelines for Computing Crop Water Requirements; FAO Irrigation and Drainage Paper 56; FAO: Roma, Italy, 1998. [Google Scholar]
- Wang, Z.; Liu, Z.; Lv, H.; Ding, J.; Lu, Y.; Wang, Y. Estimation of Summer Maize Crop Coefficient and Evapotranspiration Based on Modified Genetic Algorithm. Ecol. Environ. Sci. 2021, 30, 108–116. [Google Scholar] [CrossRef]
- Hua, J.; Zhu, Y.; Wang, Z.; Lv, H. Spatiotemporal Variation of Crop Coefficient of Winter Wheat in Huaibei Plain. J. Irrig. Drain. 2021, 40, 118–124. [Google Scholar] [CrossRef]
- Bastiaanssen, W.G.M.; Ali, S. A new crop yield forecasting model based on satellite measurements applied across the Indus Basin, Pakistan. Agric. Ecosyst. Environ. 2003, 94, 321–340. [Google Scholar] [CrossRef]
- Potter, C.S.; Randerson, J.T.; Field, C.B.; Matson, P.A.; Vitousek, P.M.; Mooney, H.A.; Klooster, S.A. Terrestrial Ecosystem Production—A Process Model-Based on Global Satellite and Surface DATA. Glob. Biogeochem. Cycle 1993, 7, 811–841. [Google Scholar] [CrossRef]
- Yang, M.; Wang, Z.; Lv, H.; Hu, Y.; Zhu, Y.; Gu, N. Simulation of Phreatic Evaporation in Wheat and Soybean during Growth Period in Huaibei Plain. J. China Hydrol. 2019, 39, 63–67. [Google Scholar] [CrossRef]
- Li, D.; Qi, H.; Ma, X. The Climate Index and Assessment about Drought and Flood in Maize’s Key Growth Stage in Huaibei Plain in Anhui Province. Chin. Agric. Sci. Bull. 2013, 29, 208–216. [Google Scholar]
- Wang, T.; Li, X.; Li, Q.; Wang, H.; Guan, X. Preliminary Study on Evapotranspiration of Winter Wheat and Summer Maize Cropping System. Acta Agric. Boreali-Sin. 2014, 29, 218–222. [Google Scholar]
Figure 1.
Study area. (a) Location of Lixin County; (b) Location of the smart soil moisture monitoring instrument (SSMMI); (c) Crop classification map of wheat; (d) Crop classification map of maize.
Figure 1.
Study area. (a) Location of Lixin County; (b) Location of the smart soil moisture monitoring instrument (SSMMI); (c) Crop classification map of wheat; (d) Crop classification map of maize.

Figure 2.
Location of yield sample points.

Figure 3.
Flow chart of methods.

Figure 4.
The data fusion effect. (a) MOD09A1-EVI image before fusion on 5 September 2020; (b) EVI image after data fusion.
Figure 4.
The data fusion effect. (a) MOD09A1-EVI image before fusion on 5 September 2020; (b) EVI image after data fusion.

Figure 5.
Five crop phenological periods. D1 is the sowing period; D2 is the emergence period; D3 is the heading period; D4 is the anthesis period; D5 is the maturity period.
Figure 5.
Five crop phenological periods. D1 is the sowing period; D2 is the emergence period; D3 is the heading period; D4 is the anthesis period; D5 is the maturity period.

Figure 6.
Spatial distribution of wheat phenological periods in Lixin County, 2020–2021. (a) Sowing period; (b) Heading period; (c) Maturity period.
Figure 6.
Spatial distribution of wheat phenological periods in Lixin County, 2020–2021. (a) Sowing period; (b) Heading period; (c) Maturity period.

Figure 7.
Spatial distribution of maize phenological periods in Lixin County, 2021. (a) Sowing period; (b) Heading period; (c) Maturity period.
Figure 7.
Spatial distribution of maize phenological periods in Lixin County, 2021. (a) Sowing period; (b) Heading period; (c) Maturity period.

Figure 8.
Spatial distribution of crop evapotranspiration. (a) Winter wheat; (b) Summer maize.

Figure 9.
Validation of the estimated ET24-hour.

Figure 10.
Crop yield. (a) Winter wheat; (b) Summer maize.

Figure 11.
Validation of the estimated crop yield. (a) Winter wheat; (b) Summer maize.

Figure 12.
Crop water productivity. (a) Winter wheat; (b) Summer maize.

Figure 13.
Frequency distribution of crop phenological periods.

Figure 14.
Spatial distribution of the crop growing season.

Figure 15.
Variation in daily ET during the crop-growing season.

Figure 16.
Variation in rainfall and temperature during the crop-growing season.

Figure 17.
Variation in the ratio of actual to potential ET for different phenological periods.

Figure 18.
Relationship between crop yield and ETseason.

Figure 19.
Relationship between CWP and crop yield.


Table 1.
Information of satellite data.
| Datasets | Source | Path, Row/Tile | Spatial Resolution | Time Resolution |
|---|---|---|---|---|
| MODIS(MOD09A1) | https://ladsweb.modaps.eosdis.nasa.gov/ (accessed on 9 December 2021) | h27v05 | 500 m and 250 m | 8 d |
| Landsat7 and 8 | https://earthexplorer.usgs.gov/ (accessed on 15 December 2021) | 122,037 | 30 m | 16 d |
| Sentinel-2 | https://scihub.copernicus.eu/ (accessed on 17 December 2021) | T50SLB and T50SMB | 10 m | 5 d |
Table 2.
Acquisition times of Landsat7 and 8 and Sentinel-2, represented by day of year (DOY).
| Datasets | 2020 | 2021 |
|---|---|---|
| Landsat7 | 249,297,313 | 123,155,251 |
| Landsat8 | 177,241 | 019,051,083,099,211,243,275,307 |
| Sentinel-2 | 315,320,335,355,365 | 009,014,019,029,049,084,094,099,109,124,129,184,254,264,274,279,304,314 |
Table 3.
Values of Kc for wheat and maize.
| Phenological Period | Sowing–Emergence | Emergence–Heading | Heading–Maturity | Growing Season |
|---|---|---|---|---|
| Kc (wheat) | 0.67 | 0.75 | 0.92 | 0.75 |
| Growing Season | 0~18% | 18~54% | 54~86% | 86~100% |
| Kc (maize) | 0.1 | 1.1 | 1.2 | 0.6 |
Table 4.
Statistics of crop phenological periods.
| Other Studies | Xinmaqiao Station | Predicted Value | ||||
|---|---|---|---|---|---|---|
| Wheat | Maize | Wheat | Maize | Wheat | Maize | |
| Sowing period | 10.13 | 6.01 | 10.12–11.3 | 6.6–7.4 | 10.10–11.20 | 5.31–6.31 |
| Heading period | 4.21 | 8.10 | 4.8–4.24 | 7.31–8.15 | 4.2–5.2 | 7.26–8.16 |
| Maturity period | 5.31 | 9.30 | 4.25–5.25 | 8.16–9.21 | 5.2–5.31 | 8.31–10.5 |
Disclaimer/Publisher’s Note: The statements, opinions and data contained in all publications are solely those of the individual author(s) and contributor(s) and not of MDPI and/or the editor(s). MDPI and/or the editor(s) disclaim responsibility for any injury to people or property resulting from any ideas, methods, instructions or products referred to in the content. |
© 2023 by the authors. Licensee MDPI, Basel, Switzerland. This article is an open access article distributed under the terms and conditions of the Creative Commons Attribution (CC BY) license (https://creativecommons.org/licenses/by/4.0/).
Share and Cite
MDPI and ACS Style
Gao, H.; Zhang, X.; Wang, X.; Zeng, Y. Phenology-Based Remote Sensing Assessment of Crop Water Productivity. Water 2023, 15, 329. https://doi.org/10.3390/w15020329
AMA Style
Gao H, Zhang X, Wang X, Zeng Y. Phenology-Based Remote Sensing Assessment of Crop Water Productivity. Water. 2023; 15(2):329. https://doi.org/10.3390/w15020329
Chicago/Turabian StyleGao, Hongsi, Xiaochun Zhang, Xiugui Wang, and Yuhong Zeng. 2023. "Phenology-Based Remote Sensing Assessment of Crop Water Productivity" Water 15, no. 2: 329. https://doi.org/10.3390/w15020329
Note that from the first issue of 2016, this journal uses article numbers instead of page numbers. See further details here.