
Time-Lapse ERT, Moment Analysis, and Numerical Modeling for Estimating the Hydraulic Conductivity of Unsaturated Rock
by
 , ,
, ,
Lorenzo De Carlo
1,* ,
,
Mohammad Farzamian
2,3 ,
,
Antonietta Celeste Turturro
1 and
Maria Clementina Caputo
1 1
Water Research Institute, National Research Council of Italy, 70132 Bari, Italy
2
Instituto Nacional de Investigação Agrária e Veterinária, 2780-157 Oeiras, Portugal
3
Centre of Geographical Studies (CEG), IGOT, Universidade de Lisboa, 1600-276 Lisbon, Portugal
*
Author to whom correspondence should be addressed.
Water 2023, 15(2), 332; https://doi.org/10.3390/w15020332
Submission received: 29 November 2022
/
Revised: 29 December 2022
/
Accepted: 6 January 2023
/
Published: 12 January 2023
(This article belongs to the Special Issue Unsaturated Zone: Advances in Experimental and Theoretical Investigations)
Abstract
:In recent years, geophysical techniques have been increasingly used to monitor flow and transport processes in the Earth critical zone (ECZ). Among these, electrical resistivity tomography (ERT) is a powerful tool used to predict hydrological parameters and state variables that influence the mentioned processes in the vadose zone because of the strong correlation between electrical and hydrological properties of the filtering medium. There have been many field tests considering geophysical prospecting in soils, where point scale hydrological sensors measurements are typically collected through sensors for geophysical data validation; on the contrary, when the unsaturated zone is made of hard rocks, the installation of such sensors is not a trivial issue owing to the extreme difficulties to guarantee contact between sensors and the surrounding medium. In this context, the geophysical data combined with appropriate numerical analysis techniques can effectively overcome the lack of information of the unsaturated subsurface, which is otherwise unpredictable with traditional methods. In the proposed case study, hydrogeophysical data were collected to provide a quantitative estimation of the hydraulic conductivity of sandstone through an integrated approach based on the moment analysis technique and numerical modeling.
1. Introduction
Hydraulic conductivity is the key parameter for the knowledge and understanding of the flow and transport processes that take place in the unsaturated zone. Many processes that involve groundwater management and protection, i.e., the evaluation of the aquifer recharge rate or the assessment of aquifer vulnerability from toxic substances, are strictly related to the hydraulic conductivity of the filtering medium. At the same time, the agricultural management practices depend on the accurate knowledge of the hydraulic properties of the soil.
As known, the hydraulic conductivity of an unsaturated medium is a function of the water content or the water potential [1]. Few direct measurements of hydraulic conductivity function are carried out in a laboratory. The steady-state method was performed using a permeameter [2], while the hydraulic conductivity function was determined using the transient method [3].
In field conditions, natural processes such as ponded infiltration, copious rainfall, or irrigation lead to a near-saturated state owing to the air trapped in a significant fraction of the pore space, involving the field-saturated hydraulic conductivity, Kfs [4].
Infiltrometer tests were tested on both soils and rocks to provide a reliable estimation of such a parameter. Different types of infiltrometers were used on soil to measure Kfs [5,6,7,8], while several criticisms increase the difficulties in performing such tests on rocks [9,10,11] because of the gap effect between the fragile probes and the rigid medium that could affect the uncertainty of the measurements.
However, such experimental approaches do not take into account the wide spatial variability of the hydrological properties, assuming small-scale areas as representative of the investigated medium, as well as disturbances and errors that can affect the measurements.
In some cases, unconventional large infiltrometer apparatus have been used to include as far as possible the heterogeneities of the subsurface [12] but, as a matter of fact, the problem of hydraulic characterization over large area still remains a great challenge for the scientific community.
In the last decade, non-invasive geophysical techniques are increasingly used for hydrological issues because they have proven to be reliable, as well as relatively quick, inexpensive, and capable of investigating large areas with high data density sampling.
Among geophysical techniques, electrical resistivity tomography (ERT) allows for imaging static electrical structures in the subsurface through resistance measurements collected on the ground surface or boreholes. A wide range of applications concern the use of ERT in the environmental [13], hydrological [14,15,16], and agricultural context [17,18].
In recent years, ERT surveys performed in time-lapse mode, i.e., repeating resistivity data collection along the same profiles or area at different temporal steps, have been revealed as a powerful tool for monitoring hydrological processes.
The basic conceptual analogy between hydrological and electrical models led to the implementation of hydro-geophysical approaches, typically uncoupled and/or coupled, in order to constrain the hydrological model with geophysical data and to provide a quantitative estimation of the hydraulic conductivity and state variables [19,20,21,22,23,24,25,26]. The ERT-derived hydrological state variables are used to calibrate and constrain a hydrological model, thus identifying the corresponding governing parameters (i.e., hydraulic conductivity) with a wide range of numerical approaches, both stochastic and/or deterministic.
Prediction of flow and solute transport was defined in terms of probabilistic properties of concentration [27]. In hydrology, several case studies considered the moment analysis approach to provide a measure of plume condition, as well as to evaluate forecasting scenarios in a long-term monitoring program [28,29]. In environmental features, geophysical datasets were increasingly used as input parameters for stochastic moment analysis [30,31], owing to the high capability to integrate hydrological data in areas not investigated with traditional measurements.
In the proposed case study, a hydrogeophysical dataset, based on falling head infiltration measurements combined with a time-lapse ERT survey, was processed through a combined stochastic and deterministic approach in order to provide an initial accurate estimation of the saturated hydraulic conductivity, Ks, of rock in unsaturated conditions. Quantitative information about the water mass and the movement of the center mass of the water plume were extracted from ERT-derived water content observations by performing the moment analysis technique. At the same time, water content distribution in the unsaturated zone during the infiltration test has been predicted through several simulation runs of the falling head test by constraining the water head and varying the Ks value. The moment analysis was performed for each simulation and compared with the ERT-derived calculations, in order to provide an accurate estimation of Ks. The goals of this paper are as follows: (1) to evaluate the ability of the geophysical tool to gain quantitative information of the dynamics occurring in the unsaturated rock at field scale, otherwise unpredictable with traditional observations; (2) to verify the reliability of stochastic techniques, such as moment analysis, in the monitoring of unsaturated flow; and (3) to reduce the uncertainty of such predictions by integrating geophysical datasets into stochastic and deterministic approaches.
2. Materials and Methods
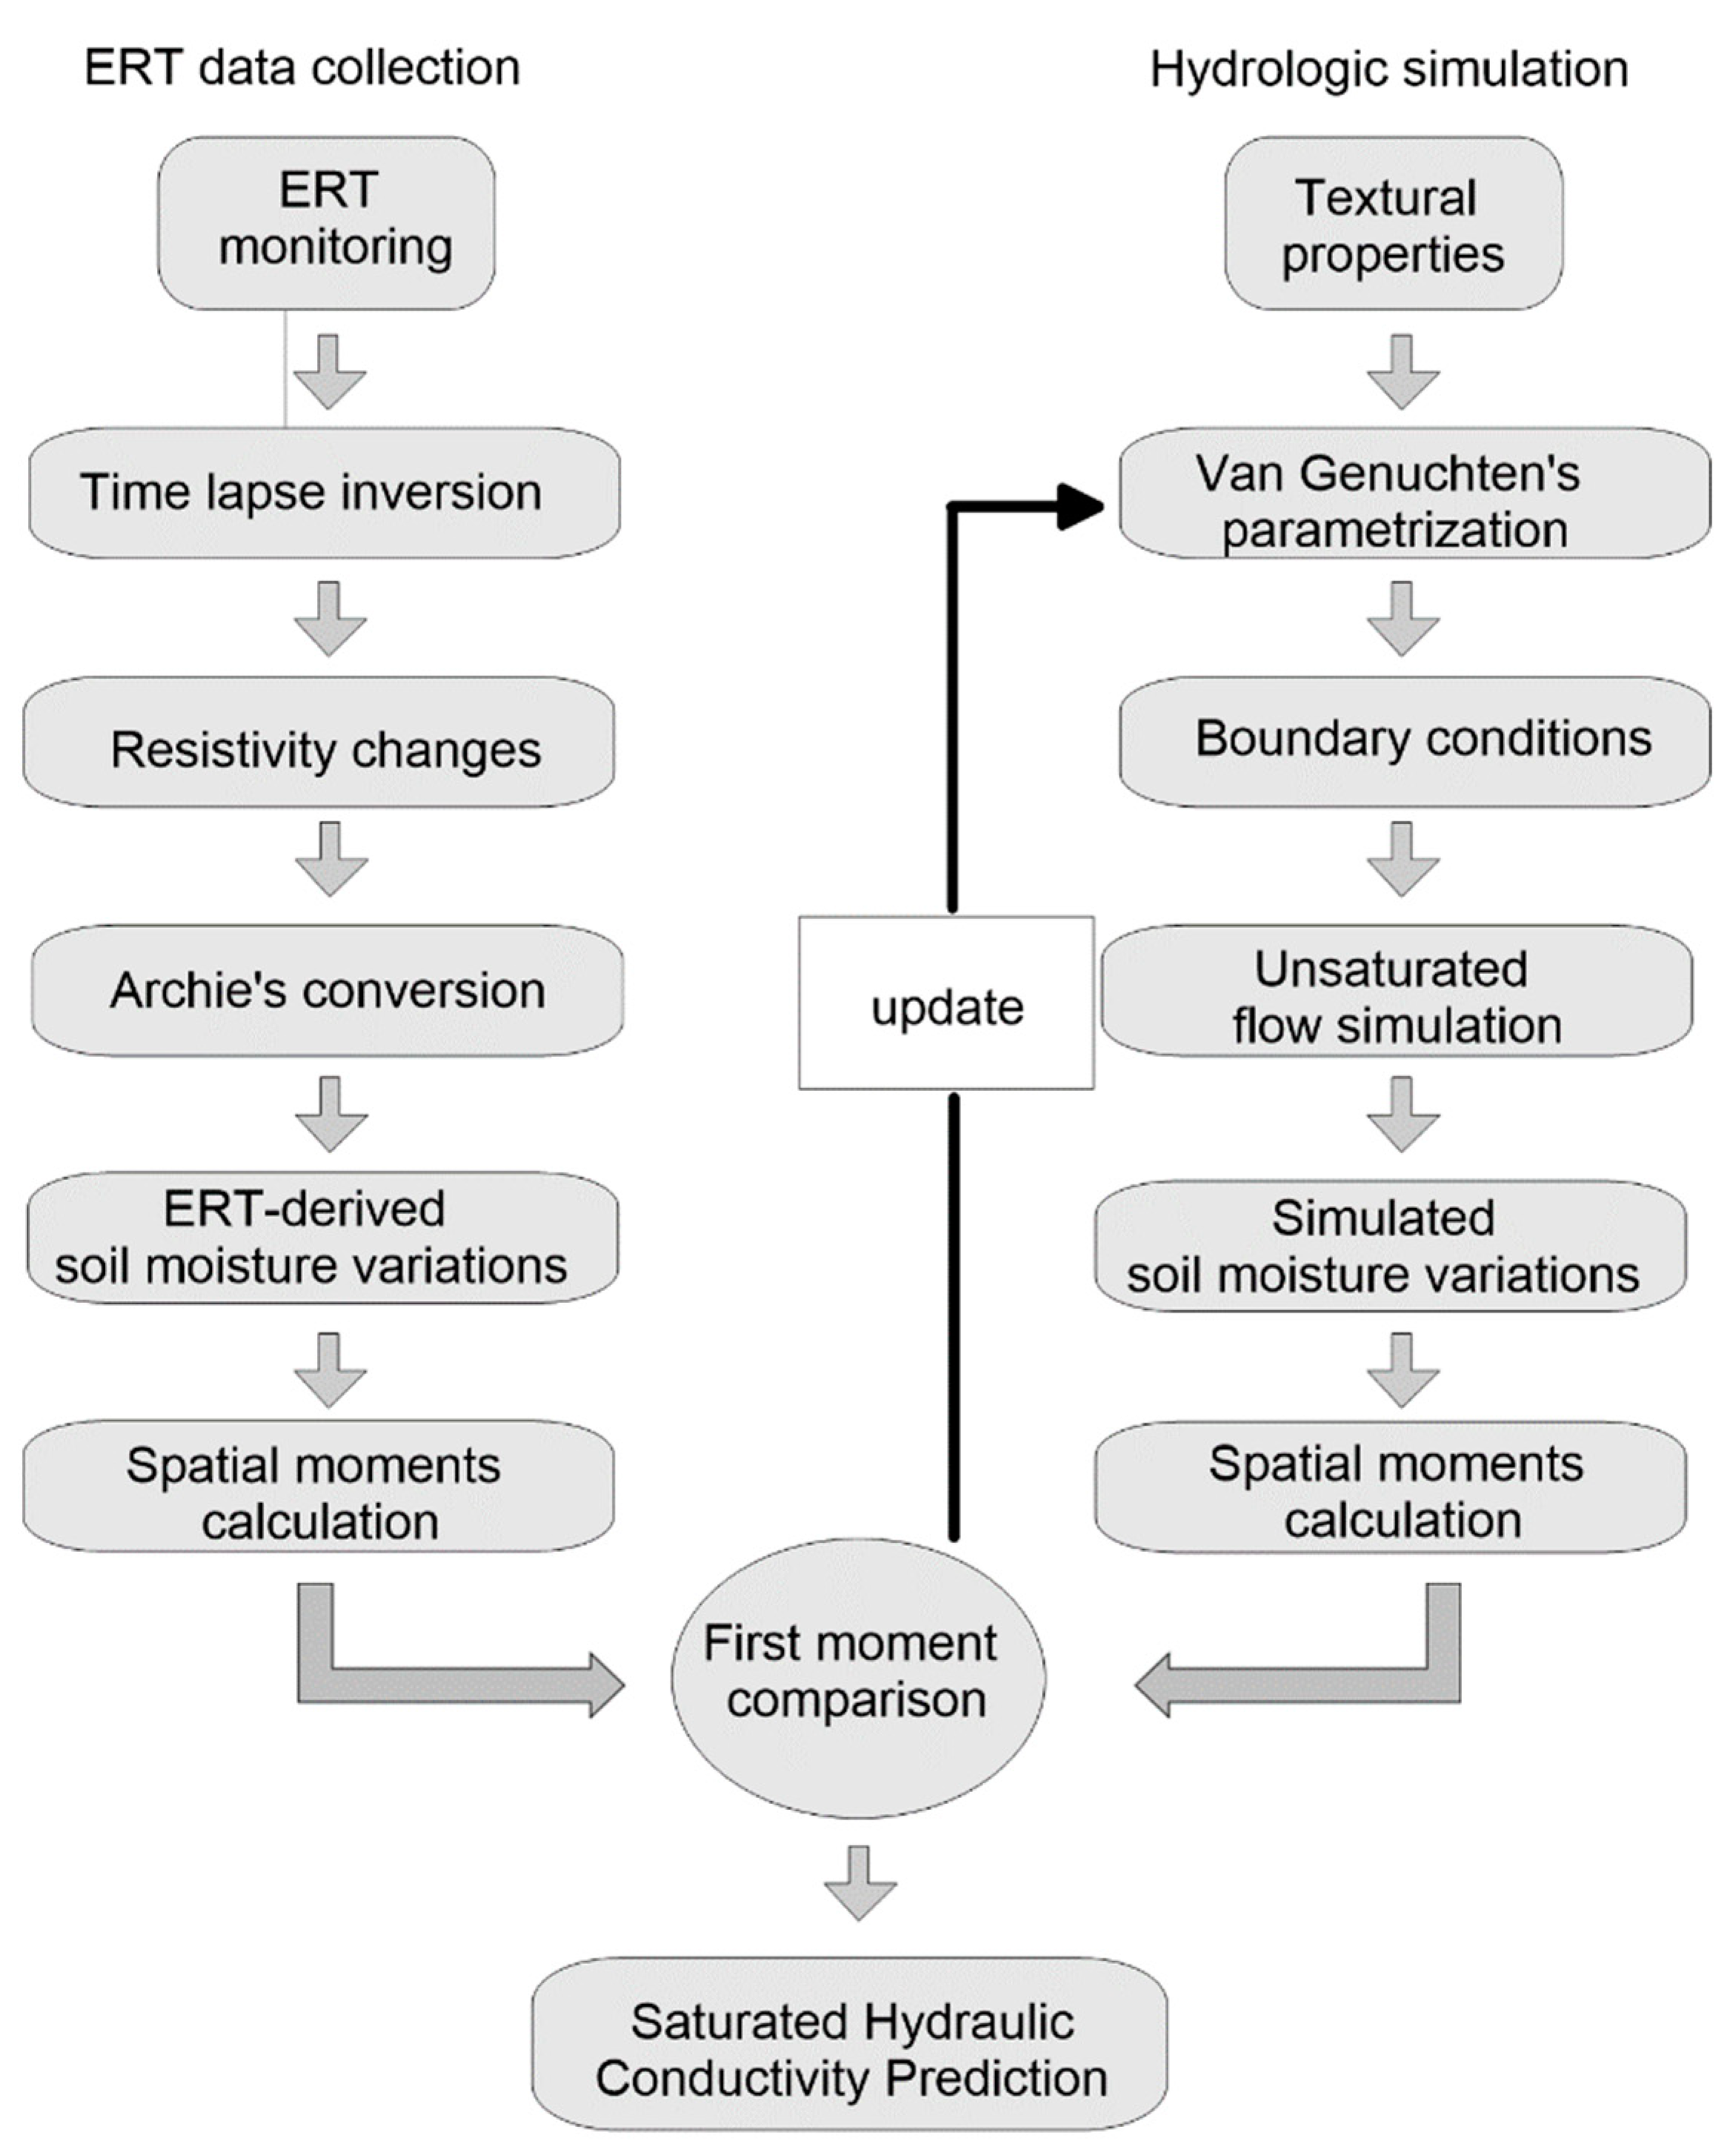
The approach used in the present paper combines a stochastic and deterministic processing of a hydrogeophysical dataset for estimating the Ks parameter in the unsaturated zone. On one hand, the time-lapse ERT datasets collected during the infiltration test were used to image the resistivity variations of the subsurface that, in turn, were converted into water content through Archie’s parameters calibrated in the laboratory. On the other hand, the unsaturated flow of the infiltration dynamics was simulated to predict the water content distribution in the rocky subsurface.
The moment analysis calculated on both the ERT-derived water content dataset and the simulated one was used for connecting the two different approaches in order to provide an estimation of the Ks. The conceptual scheme of the proposed approach is described in the flowchart shown in Figure 1.
2.1. Properties of the Investigated Rock
The rock considered in the case study is a Pleistocenic calcarenite, a sedimentary carbonatic porous sandstone of marine origin, widespread in the Mediterranean unsaturated zone. In terms of hydraulic properties, the rock is well characterized, mainly in laboratory activities, as described by an extensive literature.
Caputo and Nimmo [32] provided accurate estimations of water retention and hydraulic conductivity functions of calcarenite samples collected in different rock quarries. Turturro et al. [33] tested the Darcy–Buckingham law in the centrifugal field on porous rock media by demonstrating experimentally the direct proportionality between flux density and different centrifugal forces maintaining constant the water content. Turturro et al. [34] derived the whole retention curves of calcarenite rocks by a mercury intrusion porosimetry test for most of the mercury content range, filling the gaps exhibited by the retention curves obtained using the standard procedures. Caputo et al. [35] tested several laboratory methods for the prediction of the WRCs parameters critical for the numerical simulation of the unsaturated flow. Andriani et al. [36] conducted falling head infiltration tests at bench scale on regularly shaped calcarenitic rocks with the aim to define the hydraulic behavior of calcarenites with different textures in unsaturated conditions.
2.2. The Hydrogeophysical Test
The experimental test considered in the present paper concerns a 4D time-lapse ERT monitoring of infiltration measurements performed at falling head on the bottom of a calcarenite quarry. Details of the experimental set up of the hydrogeophysical test, as well as elaborations of the infiltration test and geophysical results, were described in detail in [21]. The test consisted of a double injection of about 7 L of water in two different temporal steps into an infiltrometer ring of 0.50 m in diameter sealed to the outcropped rock. During the test, the decreasing of water level was measured with a pressure transductor (PTX DRUCK LTD, Stoke Prior, Bromsgrove, UK) and the deepening of the wetting front was monitored by 4D time-lapse ERT surveys. Twenty-five partial hydraulic heads, defined as recharge periods in the code, measured at specific times points during the infiltrometer test, were used as constrained boundary conditions for the simulations.
Table 1 reports the main information of the infiltration test, including time of the start and stop of the two injections, hydraulic heads, and ERT observation. For simplicity, only ten hydraulic heads are mentioned, corresponding to the values measured at the start and stop of the injections, and those observed at six ERT observations.
In this paper, the geophysical outputs are embedded into a stochastic and deterministic scheme, as part of the integrated data processing described in Figure 1.
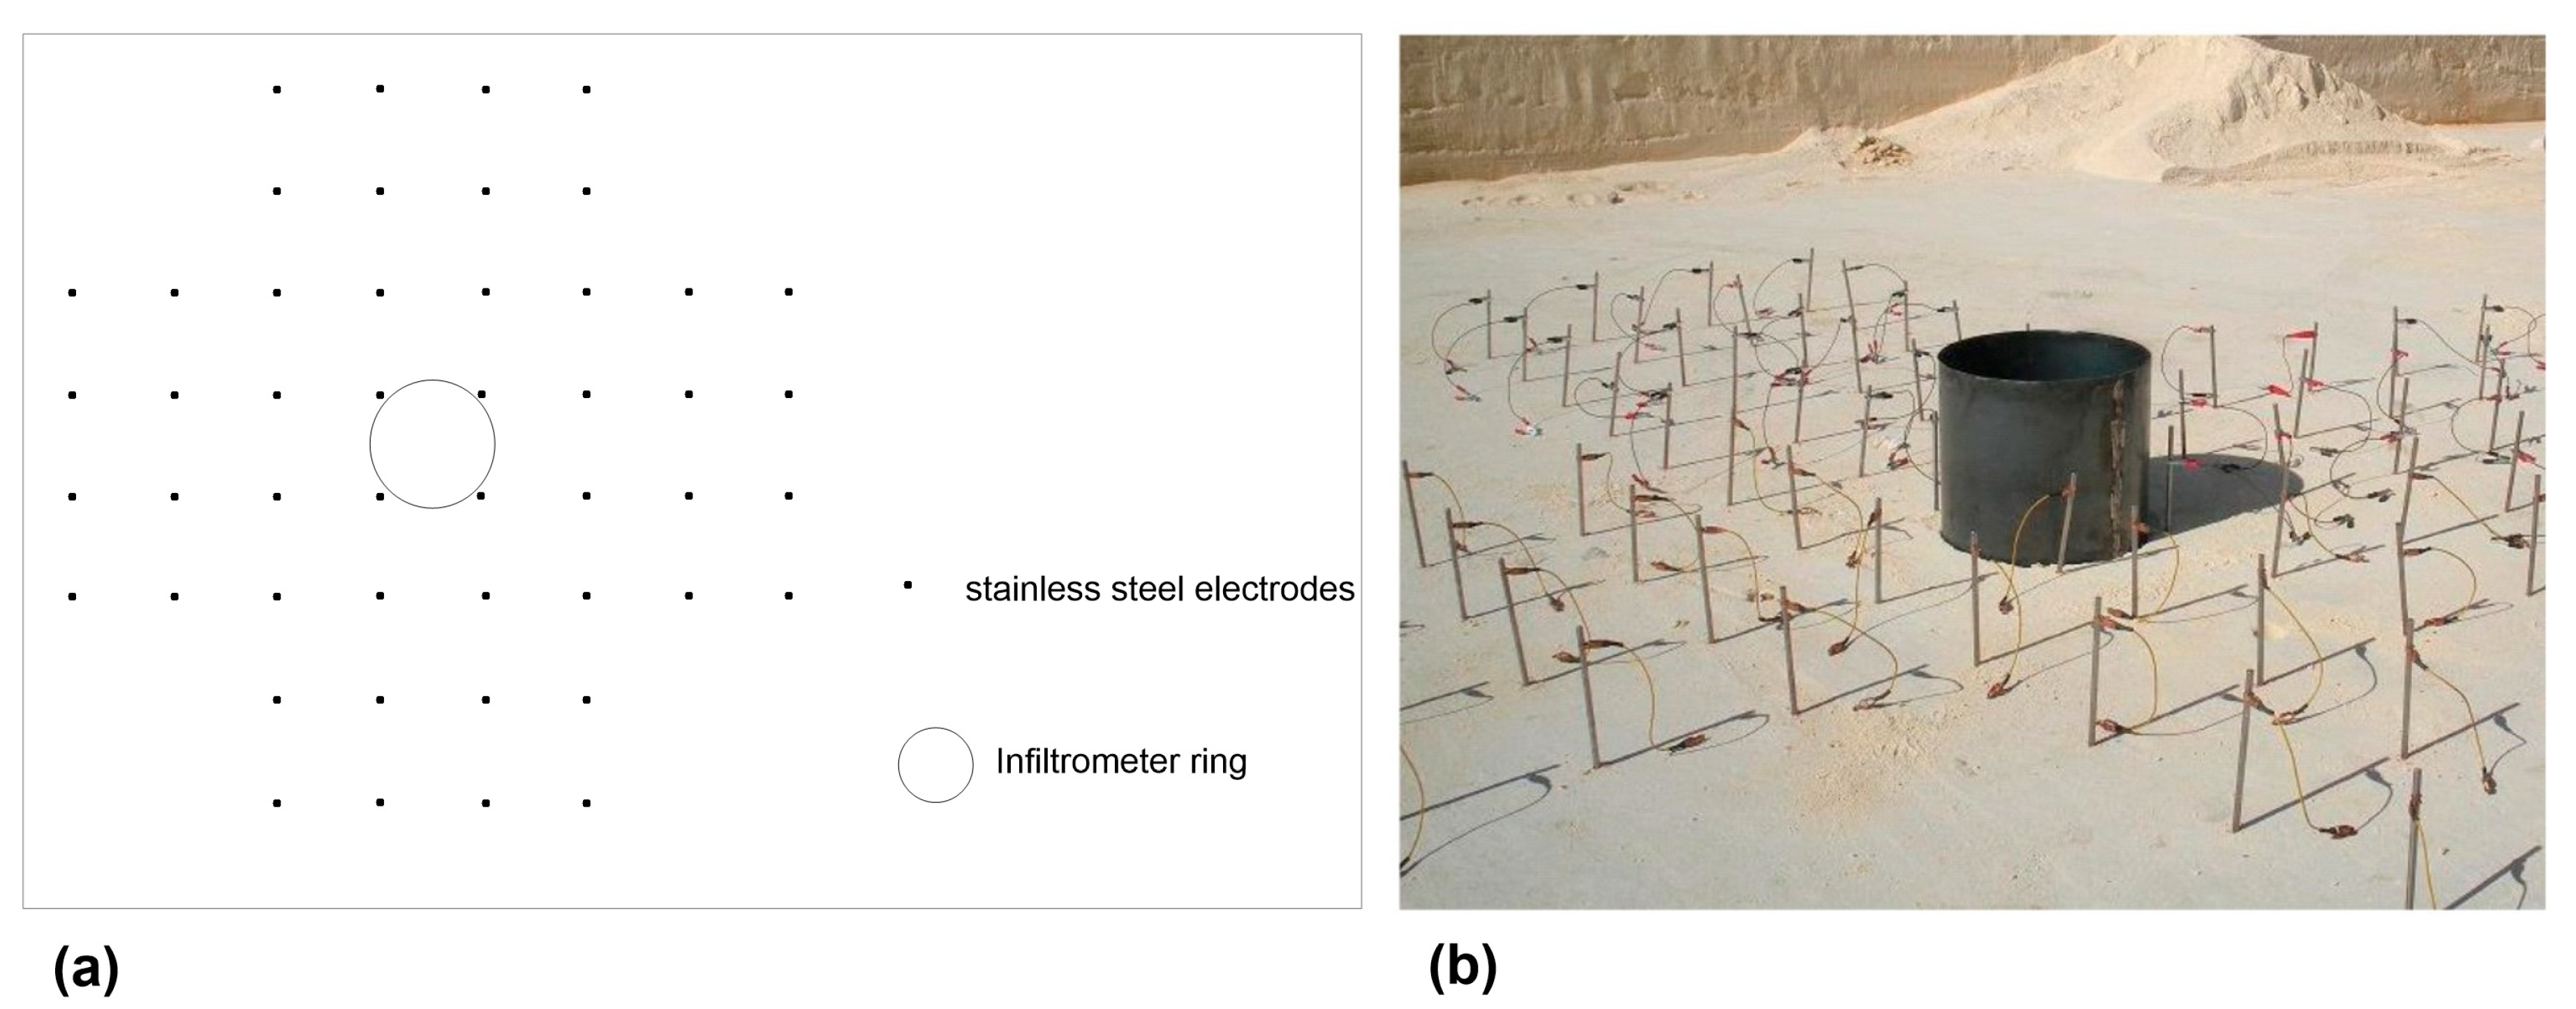
The experimental set up of the hydrogeophysical test is shown in Figure 2.
Forty-eight stainless steel electrodes were placed around the ring with 0.40 m inter-electrodes spacing to collect about 1200 dipole–dipole resistivity data points with Syscal Pro Switch 48 (Iris Instruments) resistivity-meter. The data collection was repeated 15 times over 4.5 h in order to detect changes in resistivity caused by water content variations. Each acquisition time took about 15 min. ERTLab commercial software (Multi-Phase Technologies, LLC, in collaboration with GeoStudi Astier s.r.l.) was used for the inversion process. According to [25], a convenient formulation of Archie’s law was used to convert the inverted resistivity into saturation degree.
where ρ(t0) and ρ(t1) are the resistivities of the rock (Ω∙m) at times t0 and t1, respectively, and Sw (t0) and Sw (t1) are the saturation degrees at times t0 and t1, respectively. This approach allows the simplification of Archie’s equation, as the “n” saturation index is the only unknown parameter to be calibrated. Archie’s calibration was performed in a laboratory on calcarenite core samples. In the laboratory, starting from the saturation condition, the resistivity–water content curve was recorded every five minutes during the drying process.
2.3. Forward Hydrological Modeling: Richards’ Equation
VS2DRTI code [37,38] was used for simulating the falling head infiltration experiment. The code solves the two-dimensional approximation of Richards’ equation over time using the finite-difference method, in both cartesian and radial coordinates, thus providing a quasi-three-dimensional model of an isotropic system, assuming angular symmetry.
The 3D Richards’ equation for variably saturated flow in a homogenous rigid porous medium [2] is expressed in the following form:
where z is the elevation, t is time, θ is the volumetric water content, h is the water potential, θ(h) is the water retention function, K(h) is the hydraulic conductivity function, and S is a sink term representing root water uptake.
According to the van Genuchten model [39], the soil hydraulic properties were described as follows:
where θ is the water content (m3·m−3); θr is the residual water content (m3·m−3); θs is the saturated water content (m3·m−3); h is water potential (kPa); α is a scale parameter inversely proportional to mean pore diameter (cm−1); and n and m are the shape parameters of soil water characteristic, m = 1 − 1/n, 0 < m < 1. According to [35], van Genuchten’s parameters were set as reported in Table 2.
Other parameters are required to be set in the VS2DRTI code, such as the anisotropy ratio Khh/Kzz (dimensionless), the specific storage Ss (m−1), the effective porosity φ (m3·m−3), and the initial moisture θ content (m3·m−3).
For the present study, Khh/Kzz and Ss were set equal to 1 and 1.6 × 10⁻⁴ m−1, respectively, although small variations do not cause significant changes in the model output. Moreover, effective porosity φ was set equal to 0.45 on the basis of previous tests performed on core samples and the initial content θ to 0.22 m3·m−3, as estimated from the ERT-derived value from Archie’s conversion.
Therefore, once the van Genuchten’s parameters have been set in VS2DRTI for all simulation runs, the only unknown variable is the saturated hydraulic conductivity Ks. Several simulations scenarios were run with Ks ranging from 0.1 cm·min−1 to 1 cm·min−1 (Table 2), according to the expected values reported in the literature.
A 2D flow domain of 7 × 1 m (length × depth) was built with a constant grid spacing in the vertical direction, equal to 0.02 m, and variable grid spacing in the horizontal direction, ranging from 0.062 m to 0.143 m below the infiltrometer ring. Thus, the domain was discretized into 2912 nodal points. A no-flow boundary condition (Dirichlet condition) was imposed along the lateral faces of the domain and top surface outside the infiltrometer ring, while a free drainage boundary condition was used at the bottom. Simulation output times correspond to the ERT observations, i.e., t1 = 20 min, t4 = 50 min, t8 = 100 min, t12 = 153 min, t13 = 173 min, t14 = 196 min, and t15 = 256 min after the start of the first injection, as reported in Table 1.
2.4. Moment Analysis
The basics of the moment analysis is the following equation:
The zeroth and first spatial moments correspond to i + j + k = 0 and 1, respectively.
Δθ is the water content changes based on the resistivity changes estimation inferred from the time-lapse ERT model, after removing the background water content. Γ is the volume of interest.
Assuming angular symmetry of the monitored infiltration dynamics, a 2D modeling was analyzed in this case study to simplify the calculation of the moment analysis.
The 2D section considered for the moments calculation crosses the ring through its center and, for a precise comparison of the different datasets, it corresponds to the same cross section where the ERT-derived water content was estimated.
Therefore, the zeroth moment, M00, is the changes in water mass within the domain respect to the background (Equation (5)) and represents the water storage along the reference section, expressed in m3 m−3.
The first moment, M01 normalized by the mass M00, defines the vertical center of mass of the plume at a given time, z, expressed by Equation (6).
3. Results
3.1. ERT-Derived Water Content Outputs
Figure 3 shows the ERT-derived water content distribution during the infiltration test inferred at several time points.
The background water content (Figure 3a) highlights a narrow water content range in the subsurface, from 0.20 to 0.22 m3·m−3 estimated from Archie’s conversion, by denoting an almost homogeneous initial condition of the subsurface, as expected. When the first injection starts, water infiltrates below the ring, deepening over time until the end of the first injection (Figure 3b–d). The water content observed in the background conditions can be attributed to copious precipitation some days before the test, leading to high values of water content in the upper portion of the subsurface soon after the starting of the first injection.
As shown in Figure 3e–h, the second injection increases the subsurface water content in the deeper layers of the subsurface (green fill turns yellow and then red).
3.2. Moment Analysis Derived from the ERT Dataset
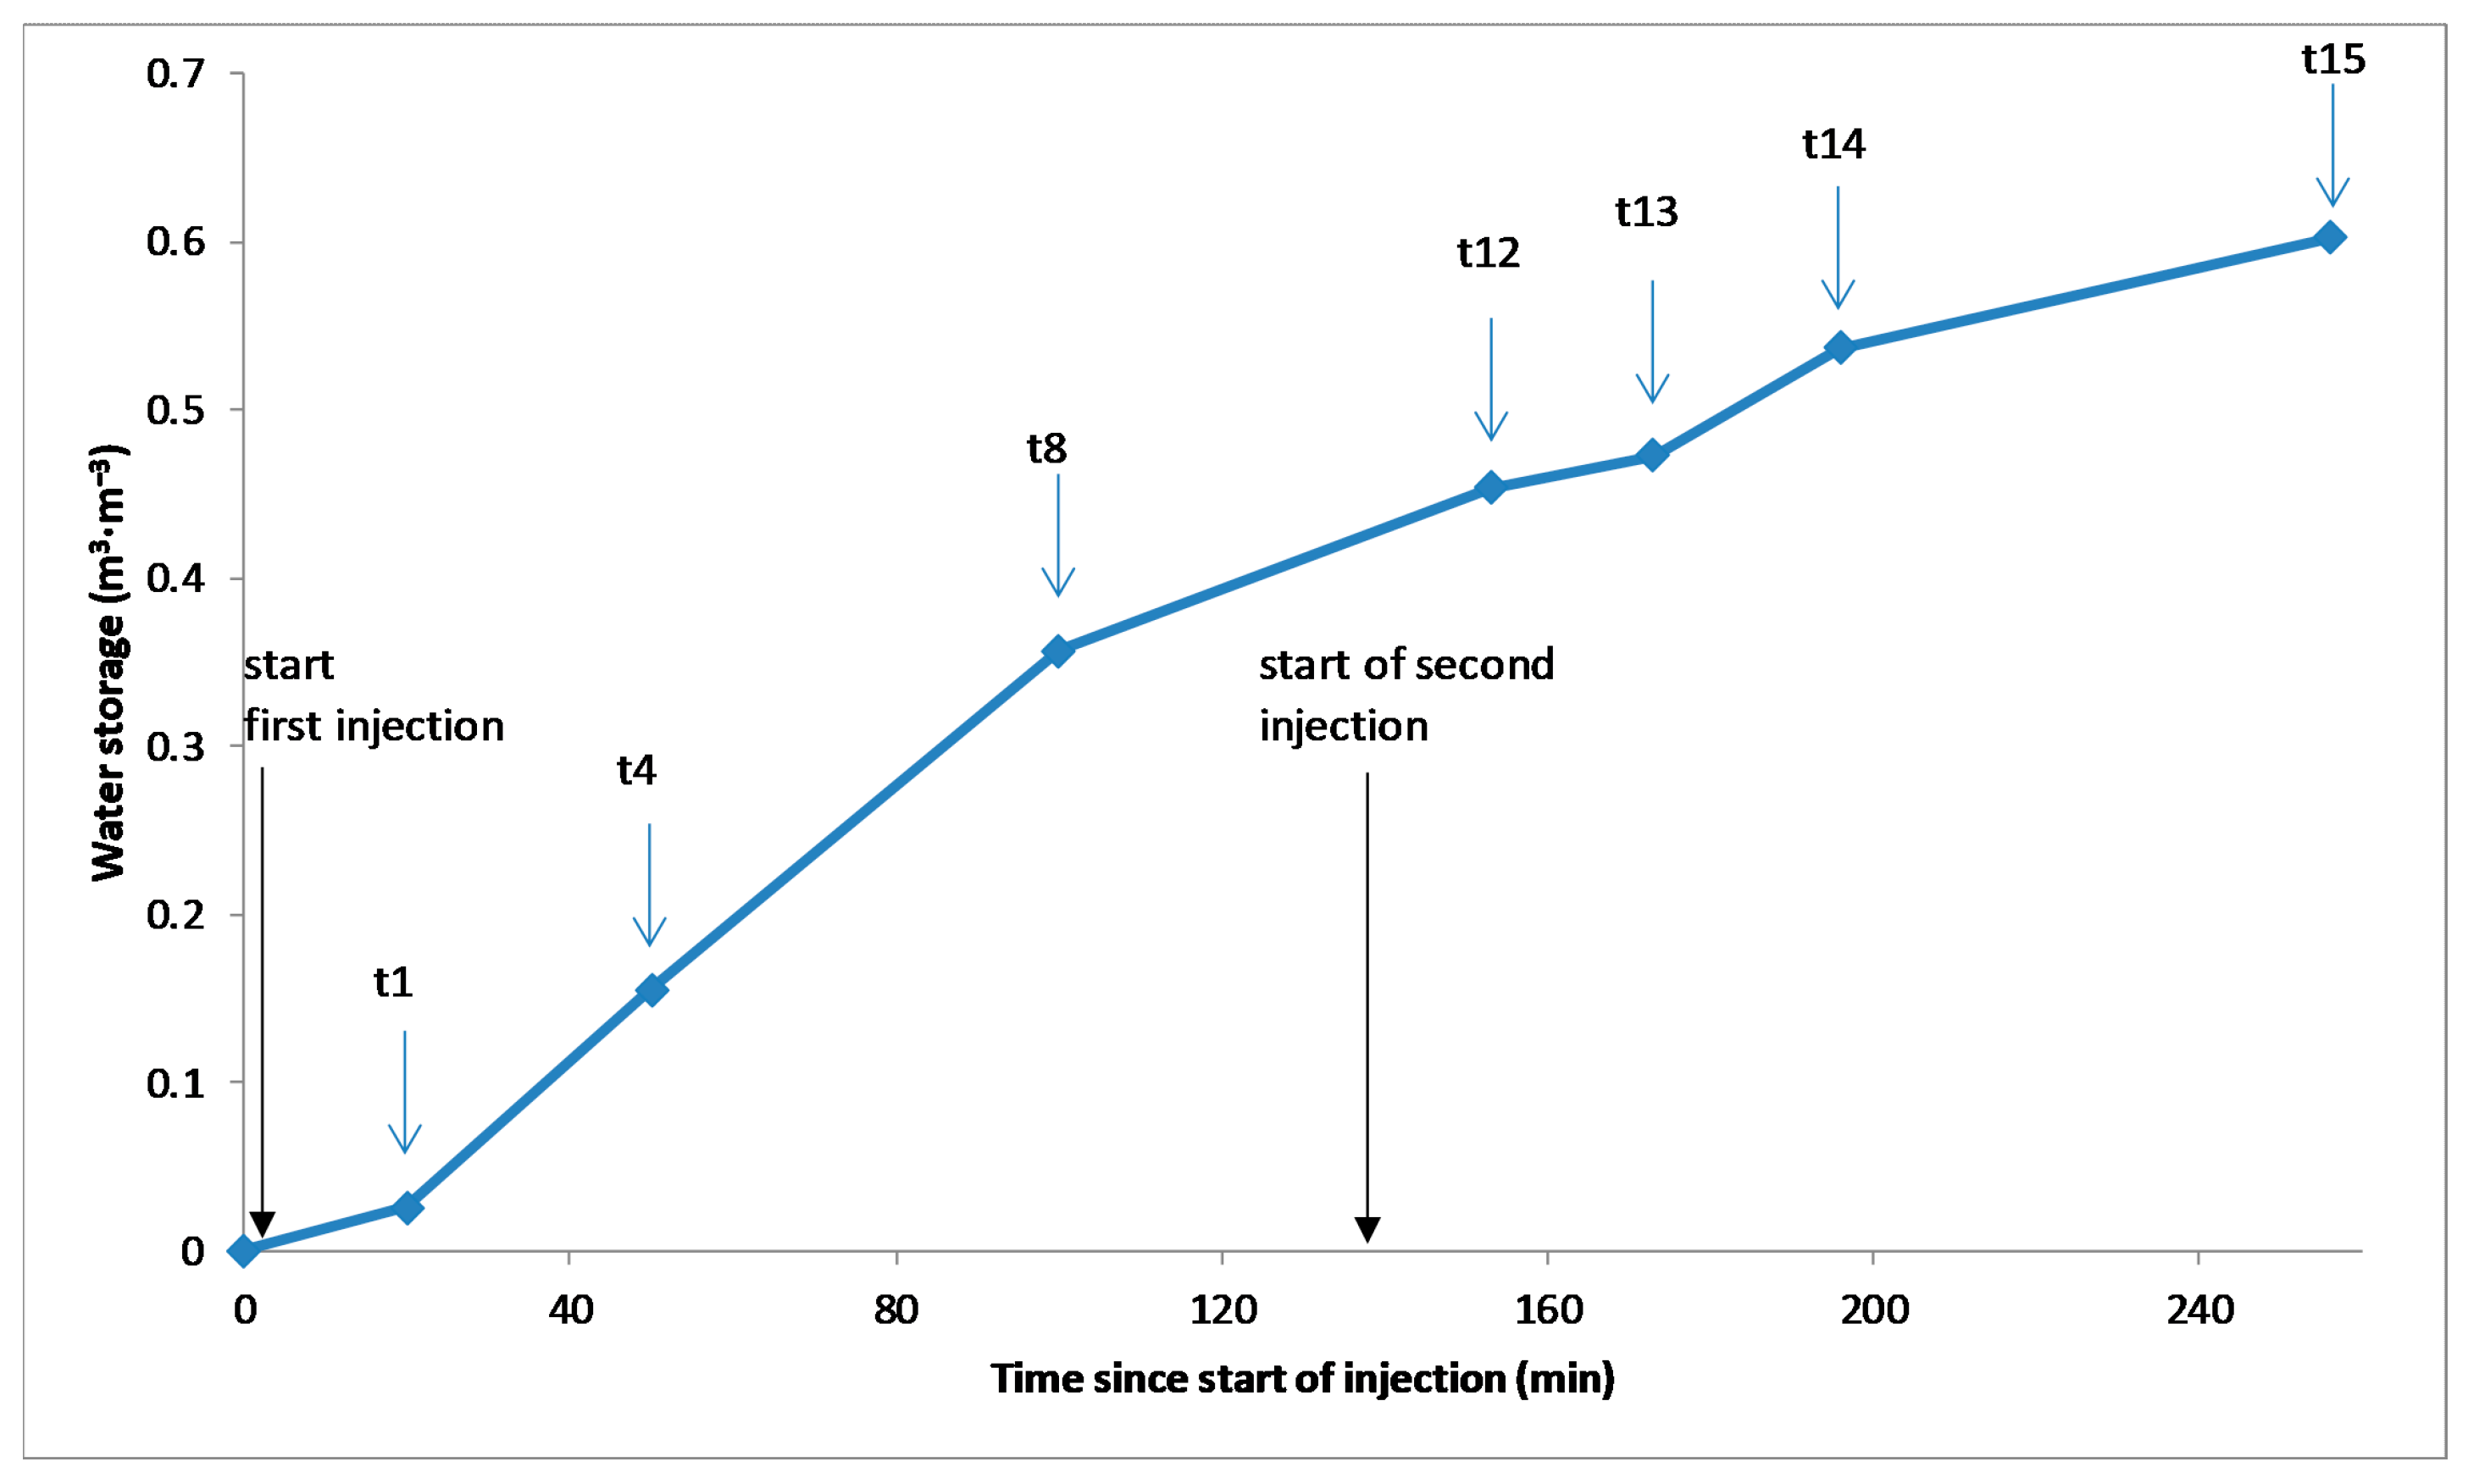
The zeroth moment, calculated from the ERT-derived water content outputs inferred along the 2D reference cross section, is shown in Figure 4.
Soon after the first injection, the increase in water content below the infiltrometric ring, which leads to an increase in water storage, can be observed. As expected, the water storage gradually increases over time owing to the double injection.
No significant difference in the slope of the curve can be observed after the second injection, probably because of the small change in water content below the infiltrometer ring and the short temporal window between the two injections.
Figure 5 shows the prediction of the movement of the mass center calculated using the water content values inferred from the time-lapse ERT outputs. No information can be observed within the first 0.20 m, which is about the spatial resolution of the ERT images. After the first injection, the mass center of the water bulb moves downward, reaching a maximum depth of 0.44 m from ground surface at time point t8. After the second injection, the added infiltrated mass water causes a rise in the mass center, as clearly observed in the shape of the curve, reaching a value of 0.35 m at time t15.
3.3. Numerical Simulations
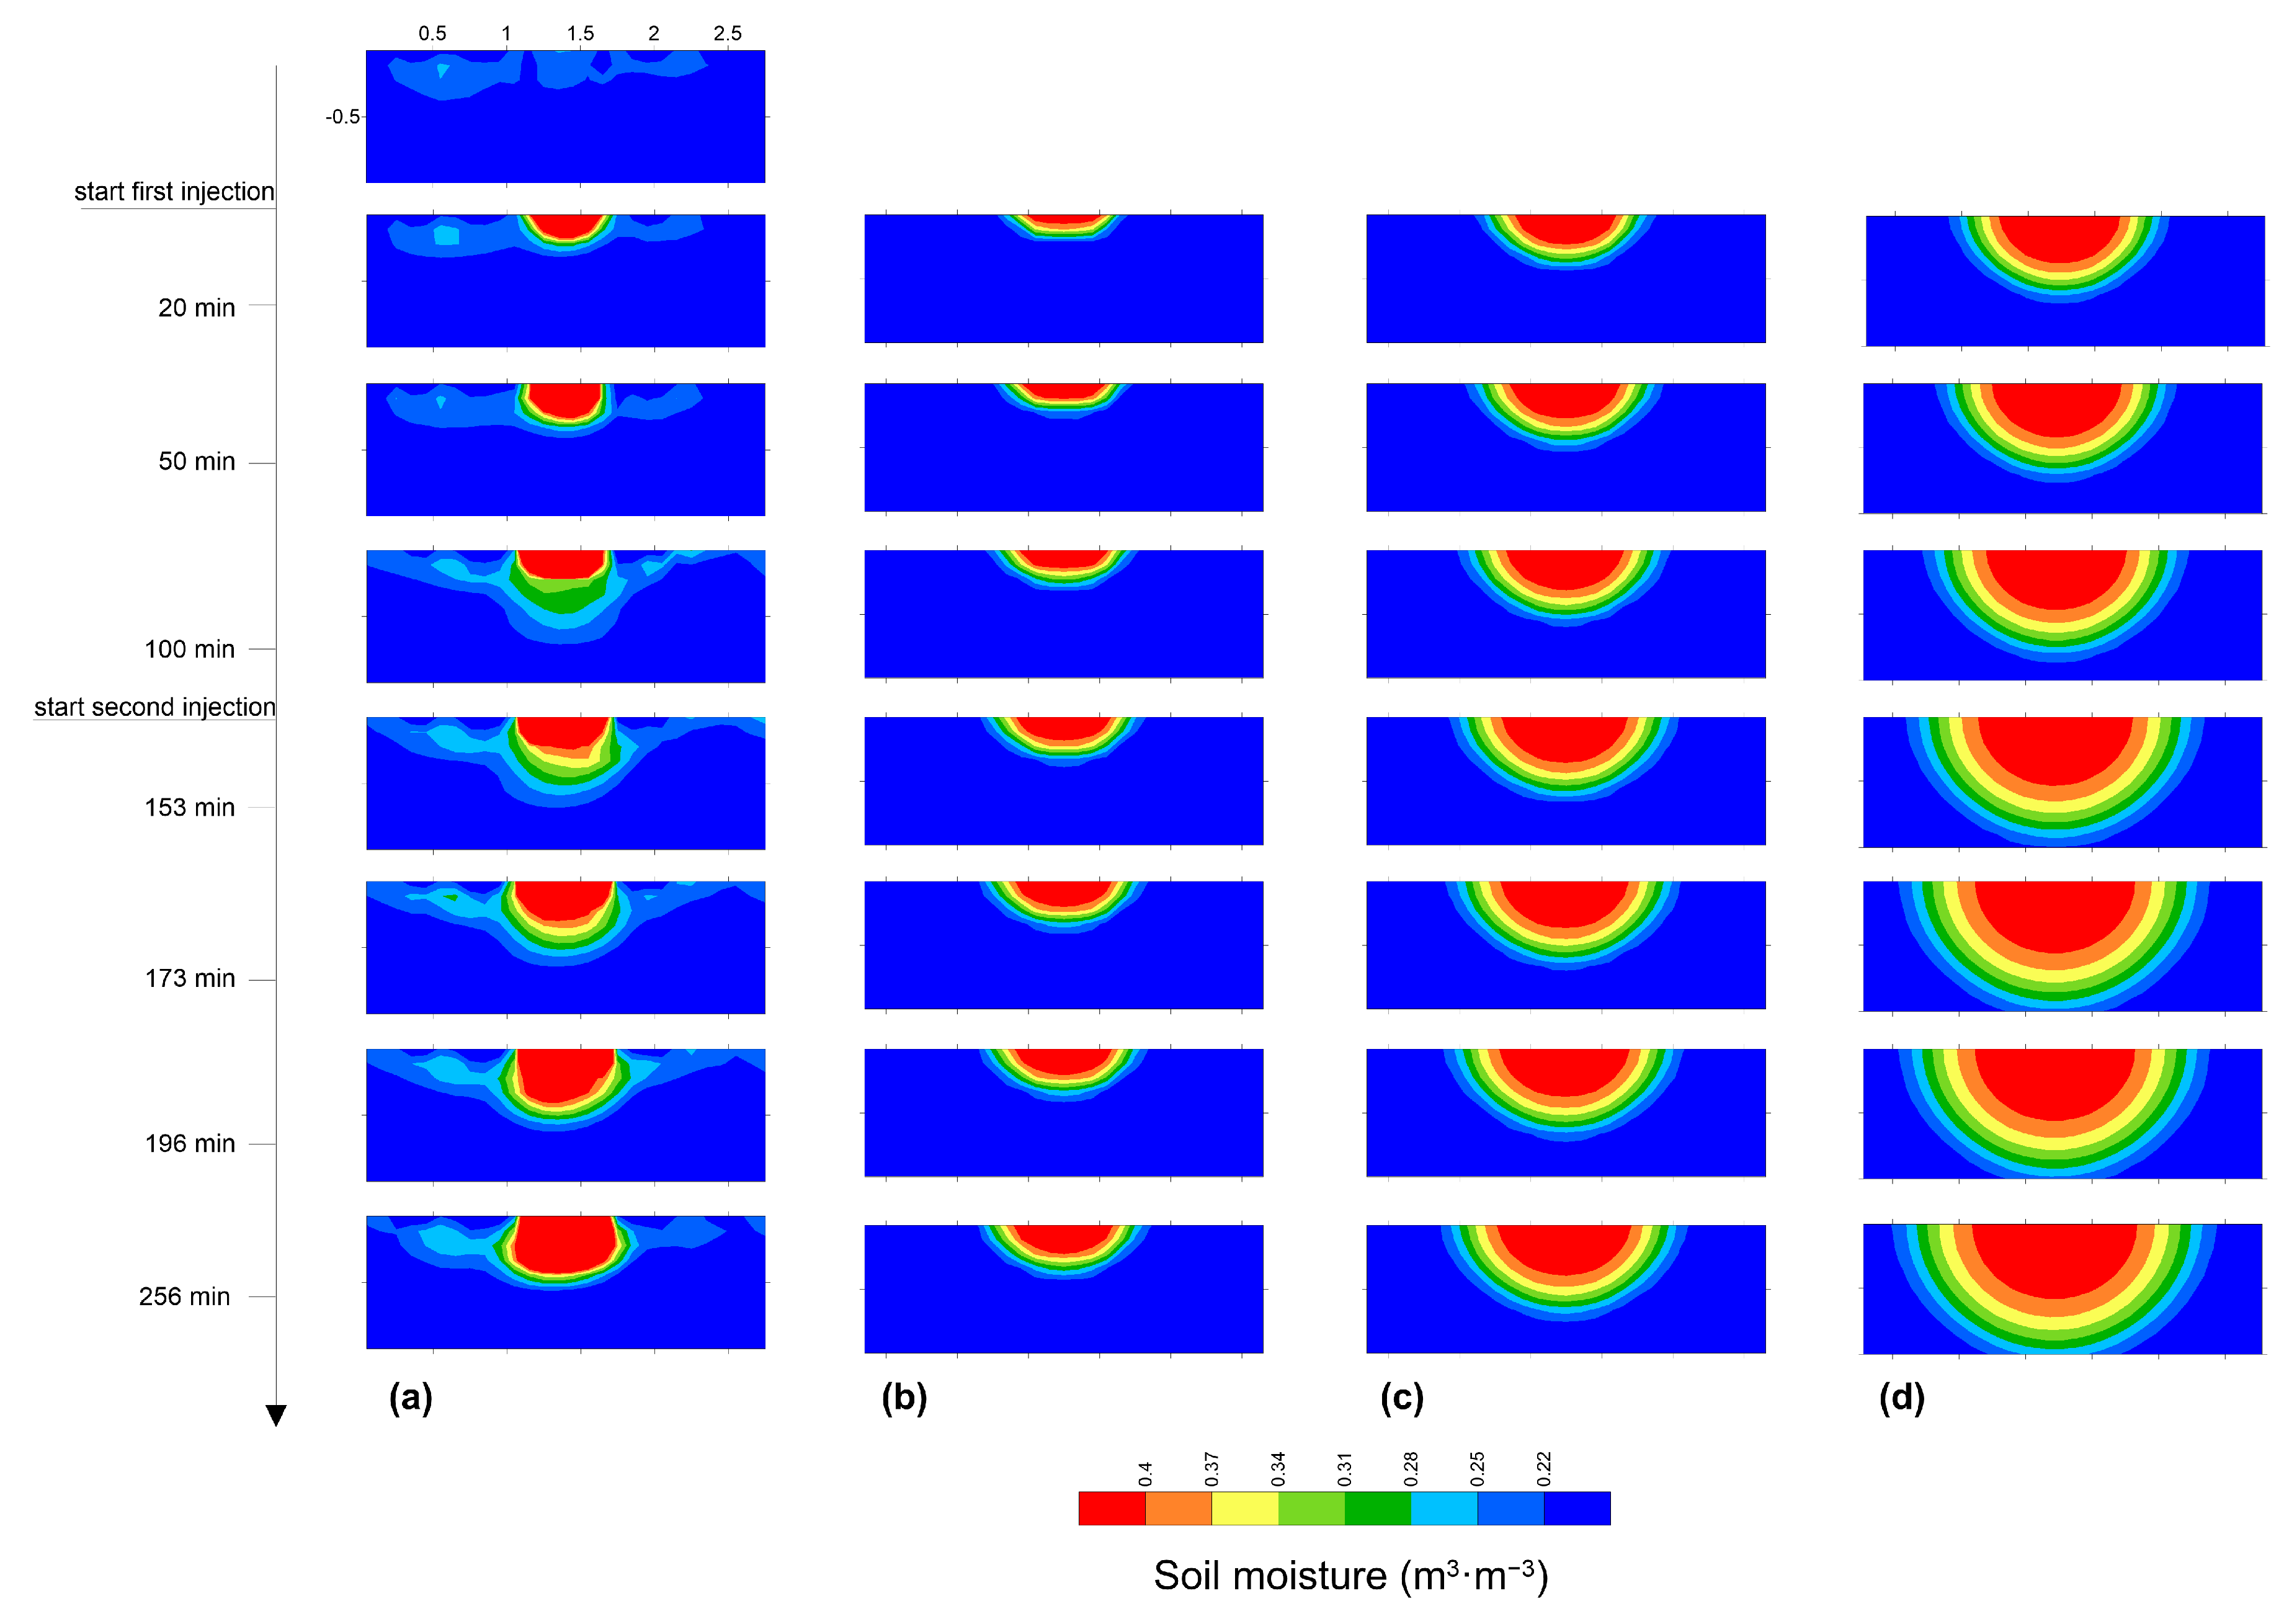
Figure 6 shows the comparison between the ERT-derived water content (Figure 6a) and three different scenarios selected among five simulation runs. Particularly, scenario A underestimates the Ks (Figure 6b), scenario E overestimates the Ks (Figure 6d), and scenario C approximates the true distribution of soil moisture (Figure 6c).
In order to provide a quantitative estimation of Ks, the moment analysis for each simulation scenario was calculated for all five scenarios.
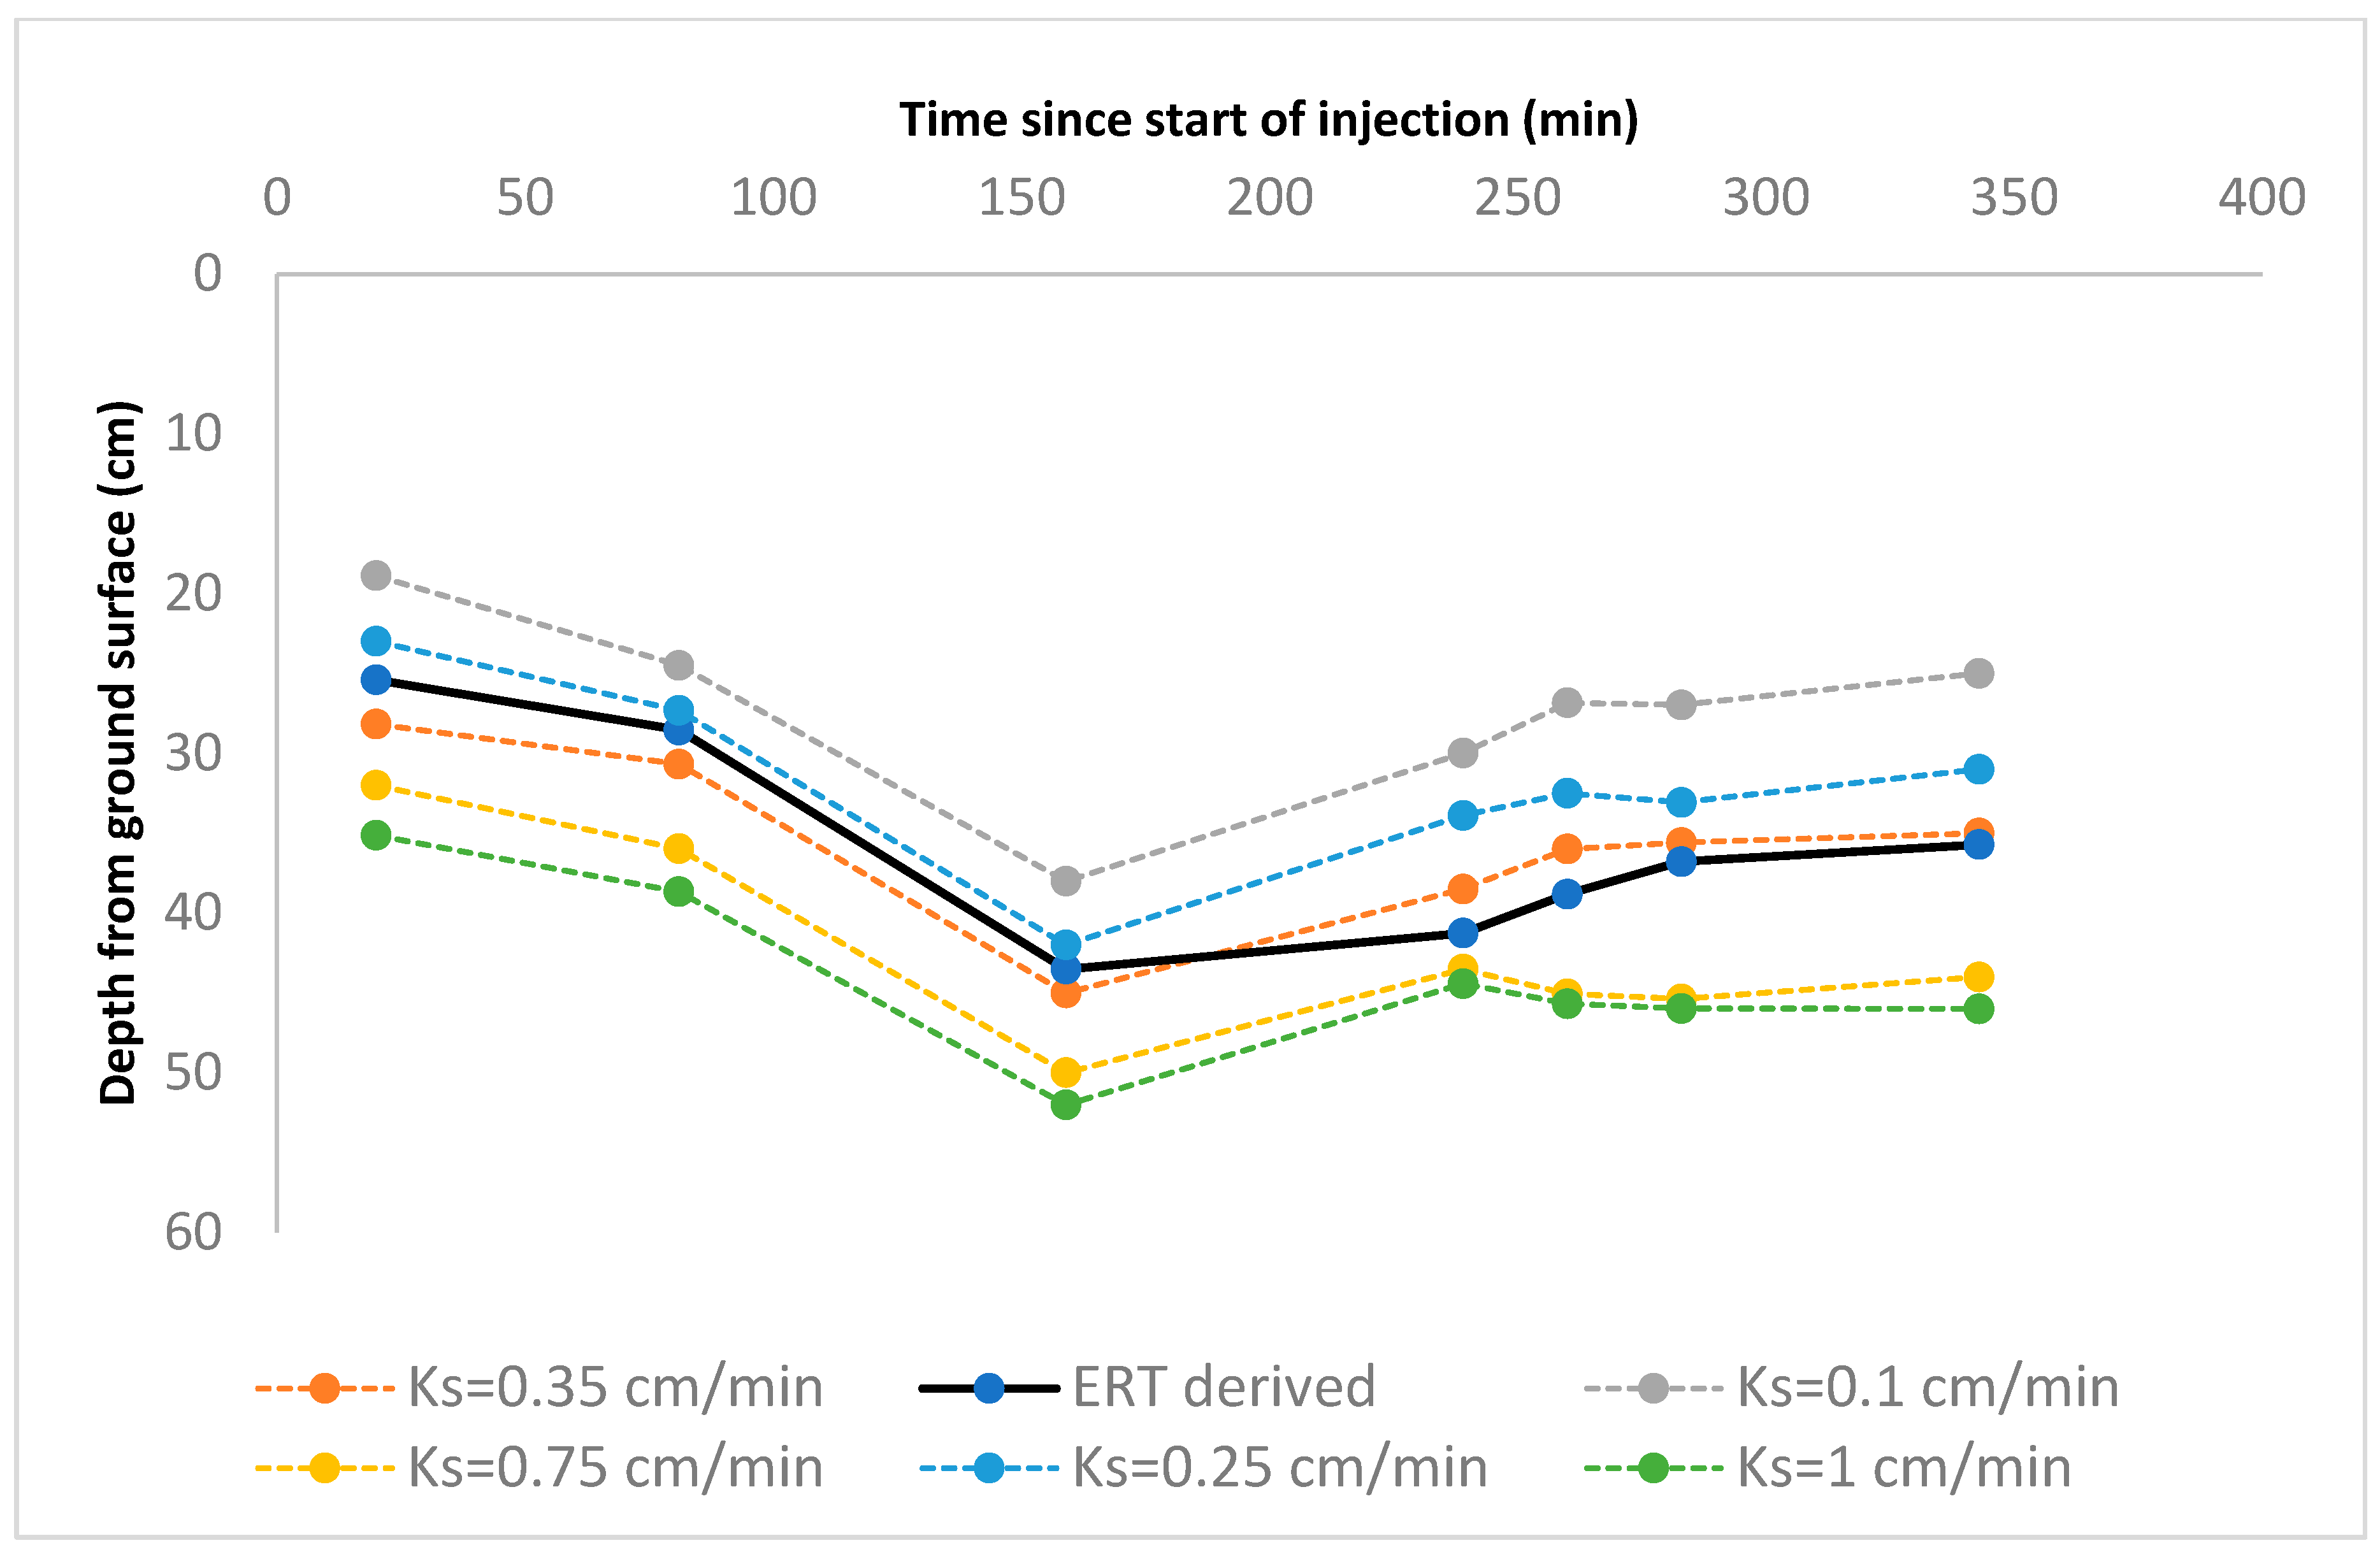
The comparison between the depth of the mass center estimated from the geophysical and numerical approaches shows that the ERT-derived Ks value fits well the simulated one in the range 0.25 < Ks < 0.35 cm∙min−1 (Figure 7).
4. Discussion and Conclusions
This paper presented an integrated approach based on hydrogeophysical data embedded into a stochastic and deterministic model scheme in order to provide quantitative hydraulic information on an unsaturated porous rocky subsurface. The understanding of the flow and transport processes in the unsaturated zone is an exciting scientific challenge and the prediction of hydraulic properties from geophysical data is an open question still to be fully solved. The added value pointed out in this manuscript is based on the capability of the integrated approach to infer unsaturated hydrological properties in a complex domain, when data are lacking, or where data collection is extremely difficult or affected by disturbances and errors. In this paper, the achievement of the objectives is obtained through a multi-step elaboration process.
The first step is based on the geophysical data processing, which revealed the great potential of ERT in the characterization and monitoring of the unsaturated flow processes in the rocky subsurface, as shown in Figure 3. The ERT-derived water content cross sections showed a fast infiltration soon after the first injection (Figure 3b–d), followed by a slow increase in water content after the second injection (Figure 3e–h), owing to the high saturation degree of the rocky subsurface.
Geophysical measurements alone can lead to misinterpretation, artifacts, or multiple models, being based on the intrinsic non-uniqueness of the geophysical solution. Therefore, in order to produce a robust hydrogeophysical model, in the second step, the geophysical outcomes were treated with a stochastic approach, based on the moment analysis technique, with the aim to track the movement of the injected water mass.
In particular, the depth of the mass center was monitored during the infiltration dynamics (Figure 5). The geophysical tool is capable of detecting variations in the depth of the mass center: soon after the first injection, it increases up to about 0.40 m below ground surface (bgs), then it moves slightly upward after the second injection, reaching a depth of 0.35 m bgs at the end of the test.
Changing of the mass center depth over time pointed out a detailed response of the unsaturated domain, which cannot be obtained using other traditional methods. This is a crucial point in water flow prediction through the unsaturated zone that is firmly grounded in process understanding. In fact, the unsaturated zone plays an important role in the processes involved in the water percolation towards groundwater. It creates a filter for contamination containment [40,41], causes absorption of some heavy metal species [42,43], gives bacteria time to perform aerobic biodegradation [44], and manages the travel time and arrival of pollutants in groundwater [45,46]. Traditional point measurements, where they can be collected, are not always able to capture the flow dynamics, owing to the strong heterogeneities of the rocks and the poor spatio-temporal resolution as a function of the distance between such points. In addition, the limitation of repeated measurements over time makes the prediction of reliable forecasting scenarios extremely difficult.
As a result of the lack of well-distributed data in the unsaturated zone, it is impossible to detect and monitor the spread of contamination plumes before they reach the underlying aquifer. Consequently, most groundwater pollution monitoring programs rely on information obtained from groundwater [47].
With these considerations in mind, this study emphasizes how geophysical data can be valuable for time-lapse estimations of soil moisture in the unsaturated zone. In turn, geophysical data were combined with numerical and stochastic modeling in an embedded robust data processing, which is the third step of the elaboration process.
The integrated approach allowed to understand and quantify the dynamics of the unsaturated flow by providing reliable estimations of Ks values (0.25 < Ks < 0.35 cm∙min−1), which are consistent with those values measured in the laboratory on samples of the same rock. Specifically, the authors of [36] found a Ks value ranging from 0.26 cm∙min−1 and 0.43 cm∙min−1 in constant head conditions, and 0.31 and 0.47 cm∙min−1 in falling head conditions. Moreover, the authors of [32,33] obtained a Ks of about 0.48 and 0.3 cm∙min−1, respectively, by considering the maximum value of the experimentally measured hydraulic conductivity function.
The results of the proposed study encourage the use of geophysical data as a routine monitoring technique for providing essential information for the comprehension of the processes occurring in the unsaturated zone. The integration between such data and numerical and/or stochastic approaches can be strategic in the development of predictive models of flow and transport, making them an effective real-time alert tool in the context of water and environmental emergency management.
As geophysical techniques have certain limitations in terms of resolution [48] and inverse nonlinear solutions, a regularization procedure that imposes additional constraints (e.g., smoothing) causes additional uncertainty in hydro-geophysical modeling [49,50].
The integration of different geophysical datasets, as reported in several studies [51,52,53], can minimize such uncertainty.
At the same time, incorporating such datasets into a joint inversion coupled hydro-geophysical framework and testing innovative numerical approaches (i.e., machine learning) is the key to future research for obtaining a better quality model.
Author Contributions
Conceptualization, L.D.C. and M.C.C.; methodology, L.D.C. and M.F.; validation, L.D.C. and M.C.C.; formal analysis, L.D.C. and M.F.; investigation, L.D.C. and M.C.C.; resources, L.D.C. and M.C.C., data curation, L.D.C. and M.F.; writing—original draft preparation, L.D.C., M.C.C., A.C.T. and M.F.; writing—review and editing, L.D.C., M.C.C., A.C.T. and M.F.; visualization, L.D.C., M.C.C., A.C.T. and M.F.; supervision, M.C.C.; project administration, M.C.C.; funding acquisition, M.C.C. All authors have read and agreed to the published version of the manuscript.
Funding
This research received no external funding.
Institutional Review Board Statement
Not applicable.
Informed Consent Statement
Not applicable.
Data Availability Statement
Not applicable.
Conflicts of Interest
The authors declare no conflict of interest.
References
- Richards, L.A. Capillary conduction of liquids in porous mediums. Physics 1931, 1, 318–333. [Google Scholar] [CrossRef]
- Klute, A. Laboratory measurement of hydraulic conductivity of saturated soil. In Methods of Soil Analysis: Part 1 Physical and Mineralogical Properties, Including Statistics of Measurement and Sampling; John Wiley & Sons: Hoboken, NJ, USA, 1965; Volume 9, pp. 210–221. [Google Scholar]
- Hamilton, J.M.; Daniel, D.E.; Olson, R.E. Measurement of hydraulic conductivity of partially saturated soils. In Permeability and Groundwater Contaminant Transport; Zimmie, T.F., Riggs, C.O., Eds.; American Society for Testing and Materials: Baltimore, MD, USA, 1981; pp. 182–196. [Google Scholar]
- Nimmo, J.R.; Schmidt, K.M.; Perkins, K.S.; Stock, J.D. Rapid Measurement of Field-Saturated Hydraulic Conductivity for Areal Characterization. Vadose Zone J. 2009, 8, 142–149. [Google Scholar] [CrossRef]
- Angulo-Jaramillo, R.; Vandervaere, J.P.; Roulier, S.; Thony, J.L.; Gaudet, J.P.; Vauclin, M. Field measurement of soil surface hydraulic properties by disc and ring infiltrometers: A review and recent developments. Soil Tillage Res. 2000, 55, 1–29. [Google Scholar] [CrossRef]
- Reynolds, W.D.; Elrick, D.E.; Youngs, E.G.; Amoozegar, A.; Booltink, H.W.G.; Bouma, J. Saturated and field-saturated water flow parameters. In Methods of Soil Analysis. Part 4. Physical Methods; Dane, J.H., Topp, G.C., Eds.; Wiley SSSA: Madison, WI, USA, 2002; pp. 797–878. [Google Scholar]
- Bouwer, H. Rapid field measurement of air entry value and hydraulic conductivity of soil as significant parameters in flow system analysis. Water Resour. Res. 1966, 2, 729–738. [Google Scholar] [CrossRef]
- Youngs, E.G. Estimating hydraulic conductivity values from ring infiltrometer measurements. J. Soil Sci. 1987, 38, 623–632. [Google Scholar] [CrossRef]
- Bogena, H.R.; Huisman, J.A.; Oberdosrster, C.A.; Vereecken, H. Evaluation of a Low-Cost Soil Water Content Sensor for Wireless Network Application. J. Hydrol. 2007, 344, 32–42. [Google Scholar] [CrossRef]
- Kizito, F.; Campbell, C.G.; Cobos, D.R.; Teare, B.L.; Carter, B.; Hopmans, J.W. Frequency, Electrical Conductivity and Temperature Analysis of a Low-Cost Capacitance Soil Moisture Sensor. J. Hydrol. 2008, 352, 367–378. [Google Scholar] [CrossRef]
- Caputo, M.C.; De Carlo, L. Field measurement of hydraulic conductivity of rocks. In Hydraulic Conductivity—Issues, Determination and Applications; Elango, L., Ed.; Intech Open: London, UK, 2011; pp. 285–306. [Google Scholar] [CrossRef]
- Caputo, M.C.; De Carlo, L.; Masciopinto, C.; Nimmo, J.R. Measurement of field-saturated hydraulic conductivity on fractured rock outcrops near Altamura (Southern Italy) with an adjustable large ring infiltrometer. Environ. Earth Sci. 2010, 60, 583–590. [Google Scholar] [CrossRef]
- Masciopinto, C.; Liso, S.I.; Caputo, M.C.; De Carlo, L. An Integrated Approach Based on Numerical Modelling and Geophysical Survey to Map Groundwater Salinity in Fractured Coastal Aquifers. Water 2017, 9, 875. [Google Scholar] [CrossRef]
- Furman, A.; Ferré, T.P.A.; Warrick, A.W. Optimization of ERT Surveys for Monitoring Transient Hydrological Events Using Perturbation Sensitivity and Genetic Algorithms. Vadose Zone J. 2004, 3, 1230–1239. [Google Scholar] [CrossRef]
- Perri, M.T.; De Vita, R.; Masciale, R.; Portoghese, I.; Chirico, G.B.; Cassiani, G. Time-lapse Mise-à-la-Masse measurements and modelling for tracer test monitoring in a shallow aquifer. J. Hydrol. 2018, 561, 461–477. [Google Scholar] [CrossRef]
- Daily, W.; Ramirez, A.; LaBrecque, D.; Nitao, J. Electrical resistivity tomography of vadose water movement. Water Resour. Res. 1992, 28, 1429–1444. [Google Scholar] [CrossRef]
- Garré, S.; Hyndman, D.; Mary, B.; Werban, U. Geophysics conquering new territories: The rise of “agrogeophysics”. Vadose Zone J. 2021, 20, e20115. [Google Scholar] [CrossRef]
- De Carlo, L.; Battilani, A.; Solimando, D.; Caputo, M.C. Application of time-lapse ERT to determine the impact of using brackish wastewater for maize irrigation. J. Hydrol. 2019, 582, 124465. [Google Scholar] [CrossRef]
- Camporese, M.; Cassiani, G.; Deiana, R.; Salandin, P. Assessment of local hydraulic properties from electrical resistivity tomography monitoring of a three-dimensional synthetic tracer test experiment. Water Resour. Res. 2011, 47, W12508. [Google Scholar] [CrossRef]
- Binley, A.; Kemna, A. DC resistivity and induced polarization methods. In Hydrogeophysics; Rubin, Y., Hubbard, S.S., Eds.; Springer: Dordrecht, The Netherlands, 2005; Volume 50, pp. 129–156. [Google Scholar]
- De Carlo, L.; Berardi, M.; Vurro, M.; Caputo, M.C. Geophysical and hydrological data assimilation to monitor water content dynamics in the rocky unsaturated zone. Environ. Monit. Assess. 2018, 190, 310. [Google Scholar] [CrossRef]
- Camporese, M.; Cassiani, G.; Deiana, R.; Salandin, P.; Binley, A. Coupled and uncoupled hydrogeophysical inversions using ensemble Kalman filter assimilation of ERT-monitored tracer test data. Water Resour. Res. 2015, 51, 3277–3291. [Google Scholar] [CrossRef]
- Ferrè, T.P.A.; Bentley, L.; Binley, A.; Linde, N.; Kemna, A.; Singha, K.; Holliger, K.; Huisman, J.A.; Minsley, B. Critical steps for the continuing advancement of hydrogeophysics. Eos 2009, 90, 200. [Google Scholar] [CrossRef] [Green Version]
- Mboh, C.; Huisman, J.; Gaelen, N.; Rings, J.; Vereecken, H. Coupled hydrogeophysical inversion of electrical resistances and inflow measurements for topsoil hydraulic properties under constant head infiltration. Near Surf. Geophys. 2012, 10, 413–426. [Google Scholar] [CrossRef]
- Rossi, M.; Manoli, G.; Pasetto, D.; Deiana, R.; Ferraris, S.; Strobbia, C.; Putti, M.; Cassiani, G. Coupled inverse modeling of a controlled irrigation experiment using multiple hydro-geophysical data. Adv. Water Resour. 2015, 82, 150–165. [Google Scholar] [CrossRef]
- Camporese, M.; Paniconi, C.; Putti, M.; Salandin, P. Comparison of data assimilation techniques for a coupled model of surface and subsurface flow. Vadose Zone J. 2009, 8, 837–845. [Google Scholar] [CrossRef] [Green Version]
- Kitanidis, P.K. Prediction by the method of moments of transport in a heterogeneous formation. J. Hydrol. 1988, 102, 453–473. [Google Scholar] [CrossRef]
- Govindaraju, R.S.; Das, B.S. Moment Analysis for Subsurface Hydrologic Applications; Springer: Dordrecht, The Netherlands, 2007; p. 296. [Google Scholar] [CrossRef]
- Ye, M.; Khaleel, R.; Yeh, T.-C.J. Stochastic analysis of moisture plume dynamics of a field injection experiment. Water Resour. Res. 2005, 41, W03013. [Google Scholar] [CrossRef] [Green Version]
- Farzamian, M.; Monteiro Santos, F.A.; Khalil, M.A. Estimation of unsaturated hydraulic parameters in sandstone using electrical resistivity tomography under a water injection test. J. Appl. Geophys. 2015, 121, 71–83. [Google Scholar] [CrossRef]
- Singha, K.; Gorelick, S.M. Saline tracer visualized with three-dimensional electrical resistivity tomography: Field-scale spatial moment analysis. Water Resour. Res. 2005, 41, W05023. [Google Scholar] [CrossRef]
- Caputo, M.C.; Nimmo, J. Quasi-steady centrifuge method of unsaturated hydraulic properties. Water Resour. Res. 2005, 41, W11504. [Google Scholar] [CrossRef] [Green Version]
- Turturro, A.C.; Caputo, M.C.; Perkins, K.S.; Nimmo, J.R. Does the Darcy-Buckingham Law Apply to Flow Through Unsaturated Porous Rock? Water 2020, 12, 2668. [Google Scholar] [CrossRef]
- Turturro, A.C.; Caputo, M.C.; Gerke, H.H. Mercury Intrusion Porosimetry and Centrifuge Methods for Extended-Range Retention Curves of Soil and Porous Rock Samples. Vadose Zone J. 2021, 21, e20176. [Google Scholar] [CrossRef]
- Caputo, M.C.; De Carlo, L.; Turturro, A.C. HYPROP FIT to Model Rock Water Retention Curves Estimated by Different Methods. Water 2022, 14, 3443. [Google Scholar] [CrossRef]
- Andriani, G.F.; Pastore, N.; Giasi, C.I.; Parise, M. Hydraulic properties of unsaturated calcarenites by means of a new integrated approach. J. Hydrol. 2021, 602, 126730. [Google Scholar] [CrossRef]
- Lappala, E.G.; Healy, R.W.; Weeks, E.P. Documentation of Computer Program VS2D to Solve the Equations of Fluid Flow in Variably Saturated Porous Media; Water Resources Investigations Report 83-4099; USGS: Denver, CO, USA, 1987; p. 193.
- Hsieh, P.A.; Wingle, W.; Healy, R.W. VS2DI—A Graphical Software Package for Simulating Fluid Flow and Solute or Energy Transport in Variably Saturated Porous Media; Water-Resources Investigations Report 99-4130; USGS: Lakewood, CO, USA, 2000; p. 20.
- Van Genuchten, M.T. A closed-form equation for predicting the hydraulic conductivity of unsaturated soils. Soil Sci. Soc. Am. J. 1980, 44, 892–898. [Google Scholar] [CrossRef] [Green Version]
- Rivett, M.O.; Wealthall, G.P.; Dearden, R.A.; McAlary, T.A. Review of unsaturated-zone transport and attenuation of volatile organic compound (VOC) plumes leached from shallow source zones. J. Contam. Hydrol. 2011, 123, 130–156. [Google Scholar] [CrossRef] [PubMed]
- Troldborg, M.; Binning, P.; Nielsen, S.; Kjeldsen, P.; Christensen, A. Unsaturated zone leaching models for assessing risk to groundwater of contaminated sites. J. Contam. Hydrol. 2009, 105, 28–37. [Google Scholar] [CrossRef]
- Jacques, D.; Šimůnek, J.; Mallants, D.; van Genuchten, M.T. Modelling coupled water flow, solute transport and geochemical reactions affecting heavy metal migration in a podzol soil. Geoderma 2008, 145, 449–461. [Google Scholar] [CrossRef]
- Shentu, J.; Li, X.; Han, R.; Chen, Q.; Shen, D.; Qi, S. Effect of site hydrological conditions and soil aggregate sizes on the stabilization of heavy metals (Cu, Ni, Pb, Zn) by biochar. Sci. Total Environ. 2022, 802, 149949. [Google Scholar] [CrossRef] [PubMed]
- Motz, E.C.; Cey, E.; Ryan, M.C. Vadose Zone Microbial Transport Below At-Grade Distribution of Wastewater Effluent. Water Air Soil Pollut. 2012, 223, 771–785. [Google Scholar] [CrossRef]
- Sousa, M.R.; Jones, J.P.; Frind, E.O.; Rudolph, D.L. A simple method to assess unsaturated zone time lag in the travel time from ground surface to receptor. J. Contam. Hydrol. 2013, 144, 138–151. [Google Scholar] [CrossRef]
- Jeong, J.; Park, E.; Han, W.S.; Kim, K.Y.; Oh, J.; Ha, K.; Yoon, H.; Yun, S.T. A method of estimating sequential average unsaturated zone travel times from precipitation and water table level time series data. J. Hydrol. 2017, 554, 570–581. [Google Scholar] [CrossRef]
- Dahan, O. Vadose Zone Monitoring as a Key to Groundwater Protection. Front. Water 2020, 2, 599569. [Google Scholar] [CrossRef]
- Day-Lewis, F.D.; Singha, K.; Binley, A.M. Applying petrophysical models to radar travel time and electrical resistivity tomograms: Resolution-dependent limitations. J. Geophys. Res. 2005, 110, B08206. [Google Scholar] [CrossRef] [Green Version]
- Cassiani, G.; Ursino, N.; Deiana, R.; Vignoli, G.; Boaga, J.; Rossi, M.; Perri, M.T.; Blaschek, M.; Duttmann, R.; Meyer, S.; et al. Noninvasive monitoring of soil static characteristics and dynamic states: A case study highlighting vegetation effects on agricultural land. Vadose Zone J. 2012, 11, vzj2011.0195. [Google Scholar] [CrossRef] [Green Version]
- Farzamian, M.; Autovino, D.; Basile, A.; De Mascellis, R.; Dragonetti, G.; Monteiro Santos, F.; Binley, A.M.; Coppola, A. Assessing the dynamics of soil salinity with time-lapse inversion of electromagnetic data guided by hydrological modelling. Hydrol. Earth Syst. Sci. 2021, 25, 1509–1527. [Google Scholar] [CrossRef]
- Looms, M.C.; Jensen, K.H.; Binley, A.M.; Nielsen, L. Monitoring unsaturated flow and transport using cross-borehole geophysical methods. Vadose Zone J. 2008, 8, 227–237. [Google Scholar] [CrossRef] [Green Version]
- Dragonetti, G.; Farzamian, M.; Coppola, A.; Basile, A.; Monteiro Santos, F. In-situ estimation of soil hydraulic and hydrodispersive properties by inversion of Electromagnetic Induction measurements and soil hydrological modeling. Hydrol. Earth Syst. Sci. 2022, 26, 5119–5136. [Google Scholar] [CrossRef]
- Binley, A.M.; Hubbard, S.S.; Huisman, J.A.; Revil, A.; Robinson, D.A.; Singha, K.; Slater, L.D. The emergence of hydrogeophysics for improved understanding of subsurface processes over multiple scales. Water Resour. Res. 2015, 51, 3837–3866. [Google Scholar] [CrossRef]
Figure 1.
Workflow diagram describing the integrated hydrogeophysical approach used in the present case study for estimating saturated hydraulic conductivity, Ks.
Figure 1.
Workflow diagram describing the integrated hydrogeophysical approach used in the present case study for estimating saturated hydraulic conductivity, Ks.

Figure 2.
Experimental set up of the infiltrometer test: (a) technical drawing of the experimental set up in a plan view; (b) picture of 3D electrodes’ configuration arrangement.
Figure 2.
Experimental set up of the infiltrometer test: (a) technical drawing of the experimental set up in a plan view; (b) picture of 3D electrodes’ configuration arrangement.

Figure 3.
ERT-derived water content at different time points: (a) before the starting of the first injection; (b) 20 min; (c) 50 min; (d) 100 min after the first injection; (e) 25 min; (f) 45 min; (g) 68 min; (h) 128 min after the second injection.
Figure 3.
ERT-derived water content at different time points: (a) before the starting of the first injection; (b) 20 min; (c) 50 min; (d) 100 min after the first injection; (e) 25 min; (f) 45 min; (g) 68 min; (h) 128 min after the second injection.

Figure 4.
Water storage estimated through the zeroth moment M00.

Figure 5.
Depth of the mass center reached after two injections.

Figure 6.
Comparison of the ERT-derived water content (a) and the simulated one for three different scenarios: (b) scenario A; (c) scenario C; and (d) scenario E.
Figure 6.
Comparison of the ERT-derived water content (a) and the simulated one for three different scenarios: (b) scenario A; (c) scenario C; and (d) scenario E.

Figure 7.
Comparison between the depth of the mass center estimated from ERT and simulations.


Table 1.
Time points of the infiltrometer test and ERT data collection.
| Infiltration Test | Time Point (hh:mm) | Hydraulic Head (cm) | ERT Observation |
|---|---|---|---|
| 11:20 | t0 | ||
| Start first injection | 11:43 | 3.1 | |
| 12:03 | 2.0 | t1 | |
| 12:33 | 1.0 | t4 | |
| Stop infiltration measurements | 12:43 | 0.8 | |
| 13:23 | t8 | ||
| Start second injection | 14:01 | 3.3 | |
| 14:16 | 2.5 | t12 | |
| 14:36 | 2.1 | t13 | |
| 14:59 | 1.6 | t14 | |
| Stop infiltration measurements | 15:09 | 1.3 | |
| 15:59 | 0.2 | t15 |
Table 2.
Parametrization of the model domain.
| Parameter | Scenario A | Scenario B | Scenario C | Scenario D | Scenario E |
|---|---|---|---|---|---|
| Saturated Khh (cm·min−1) | 0.1 | 0.25 | 0.35 | 0.75 | 1 |
| Khh/Kzz | 1 | ||||
| Specific storage, Ss (m−1) | 1.6 × 10⁻⁴ | ||||
| Effective porosity, φ | 0.45 | ||||
| θ, initial moisture content (m3·m−3) | 0.22 | ||||
| θr, residual moisture content (m3·m−3) | 0.02547 | ||||
| α (cm−1) | 0.07721 | ||||
| n | 1.7541 |
Disclaimer/Publisher’s Note: The statements, opinions and data contained in all publications are solely those of the individual author(s) and contributor(s) and not of MDPI and/or the editor(s). MDPI and/or the editor(s) disclaim responsibility for any injury to people or property resulting from any ideas, methods, instructions or products referred to in the content. |
© 2023 by the authors. Licensee MDPI, Basel, Switzerland. This article is an open access article distributed under the terms and conditions of the Creative Commons Attribution (CC BY) license (https://creativecommons.org/licenses/by/4.0/).
Share and Cite
MDPI and ACS Style
De Carlo, L.; Farzamian, M.; Turturro, A.C.; Caputo, M.C. Time-Lapse ERT, Moment Analysis, and Numerical Modeling for Estimating the Hydraulic Conductivity of Unsaturated Rock. Water 2023, 15, 332. https://doi.org/10.3390/w15020332
AMA Style
De Carlo L, Farzamian M, Turturro AC, Caputo MC. Time-Lapse ERT, Moment Analysis, and Numerical Modeling for Estimating the Hydraulic Conductivity of Unsaturated Rock. Water. 2023; 15(2):332. https://doi.org/10.3390/w15020332
Chicago/Turabian StyleDe Carlo, Lorenzo, Mohammad Farzamian, Antonietta Celeste Turturro, and Maria Clementina Caputo. 2023. "Time-Lapse ERT, Moment Analysis, and Numerical Modeling for Estimating the Hydraulic Conductivity of Unsaturated Rock" Water 15, no. 2: 332. https://doi.org/10.3390/w15020332
Note that from the first issue of 2016, this journal uses article numbers instead of page numbers. See further details here.