
River Diatoms Reflect Better Past than Current Environmental Conditions


Diatom Lab, La Serna 58, 24007 León, Spain
*
Author to whom correspondence should be addressed.
Water 2023, 15(2), 333; https://doi.org/10.3390/w15020333
Submission received: 5 December 2022
/
Revised: 9 January 2023
/
Accepted: 11 January 2023
/
Published: 12 January 2023
(This article belongs to the Special Issue Freshwater and/or Brackish Diatoms: Ecology and Bioindication)
Abstract
:The time required for diatom assemblages to integrate the abiotic variables of the aquatic environment has been subject of discussion for many years, with contrasting opinions as shown by field observations and experiments. Numerous diatom-based water quality indices are being used in the bioassessment of freshwaters; one of the most widely used (Specific Polluosensitivity Index or SPI) is compared in this study with water quality status as measured by the Water Quality Index (WQI) obtained from limnological parameters measured at 37 fluvial stations belonging to the Duero Basin (NW Spain). The correlation existing between both metrics was determined using different time lags between water and diatom sample collection. Results show that the correlation coefficient increases as the time gap decreases, but is maximal when comparing WQI scores measured one month before diatom sampling. We thus confirm the initial hypothesis that diatom indices actually indicate past (1 month ago) and not current water conditions in rivers. The practical consequences of this finding are briefly discussed.
1. Introduction
Diatoms are an extremely diversified group of microscopic algae, widely distributed in both marine and continental aquatic ecosystems. Conservative estimations consider the presence of 105 extant taxa [1]—with approximately 400 new additions yearly—each with specific ecological requirements that allow them to develop under certain environmental conditions. Diatoms play an essential role in the trophic web of aquatic ecosystems, and their population development is determined by the physical and chemical characteristics of the water (particularly pH and nutrient levels) which in turn depend on the hydraulic conditions of the environment, seasonal fluctuations and anthropogenic impacts (pollutant discharge, eutrophication, etc.). Diatom assemblages respond rapidly to these environmental changes, reflecting overall water quality, this being the basis for the development of ecological indices which have proven effective worldwide.
The use of diatoms as ecological indicators of water quality has been subject of growing interest for several decades, and currently tens of studies support the efficacy of diatom-based metrics for water quality monitoring, mainly in lotic environments [2,3,4,5]. At present, one the most commonly used diatom indices is the Specific Polluosensitivity Index (SPI [6]) based on the relative abundance of each of the taxa present in the sample, their overall sensitivity to pollution and their environmental optimum.
Temporal variation in diatom assemblages is still insufficiently addressed, and studies are urgently needed over large temporal and spatial scales [7]. In most field surveys, diatom and water samples are taken simultaneously for comparative purposes, although river biofilm does not reflect immediate water quality status but rather the average of the last ~10 weeks, since benthic diatoms assemblages require some time to adapt to environmental conditions. This time varies according to different authors, e.g., Iserentant and Blancke [8] demonstrated in translocation experiments that diatom communities were still different 45 days after translocation, while Wendker [9] observed stable communities after only three to seven days. Lavoie et al. [10] reported that the “integration period” of diatom indices varies from two to five weeks depending on the trophic status, whereas other studies note that this depends on the index used [11] or the habitat [12]. Thus, a fundamental—yet unresolved—aspect of river biomonitoring is the frequency and time intervals before and during diatom sampling at which water chemistry samples should be collected [13].
This study assesses the relationship between benthic diatom assemblages (measured as SPI values) and time fluctuations in river abiotic parameters mirrored as Water Quality Index (WQI) scores. Particularly, we contrast the hypothesis that metrics based on river diatoms reflect better past than current environmental conditions.
2. Materials and Methods
2.1. Study Area
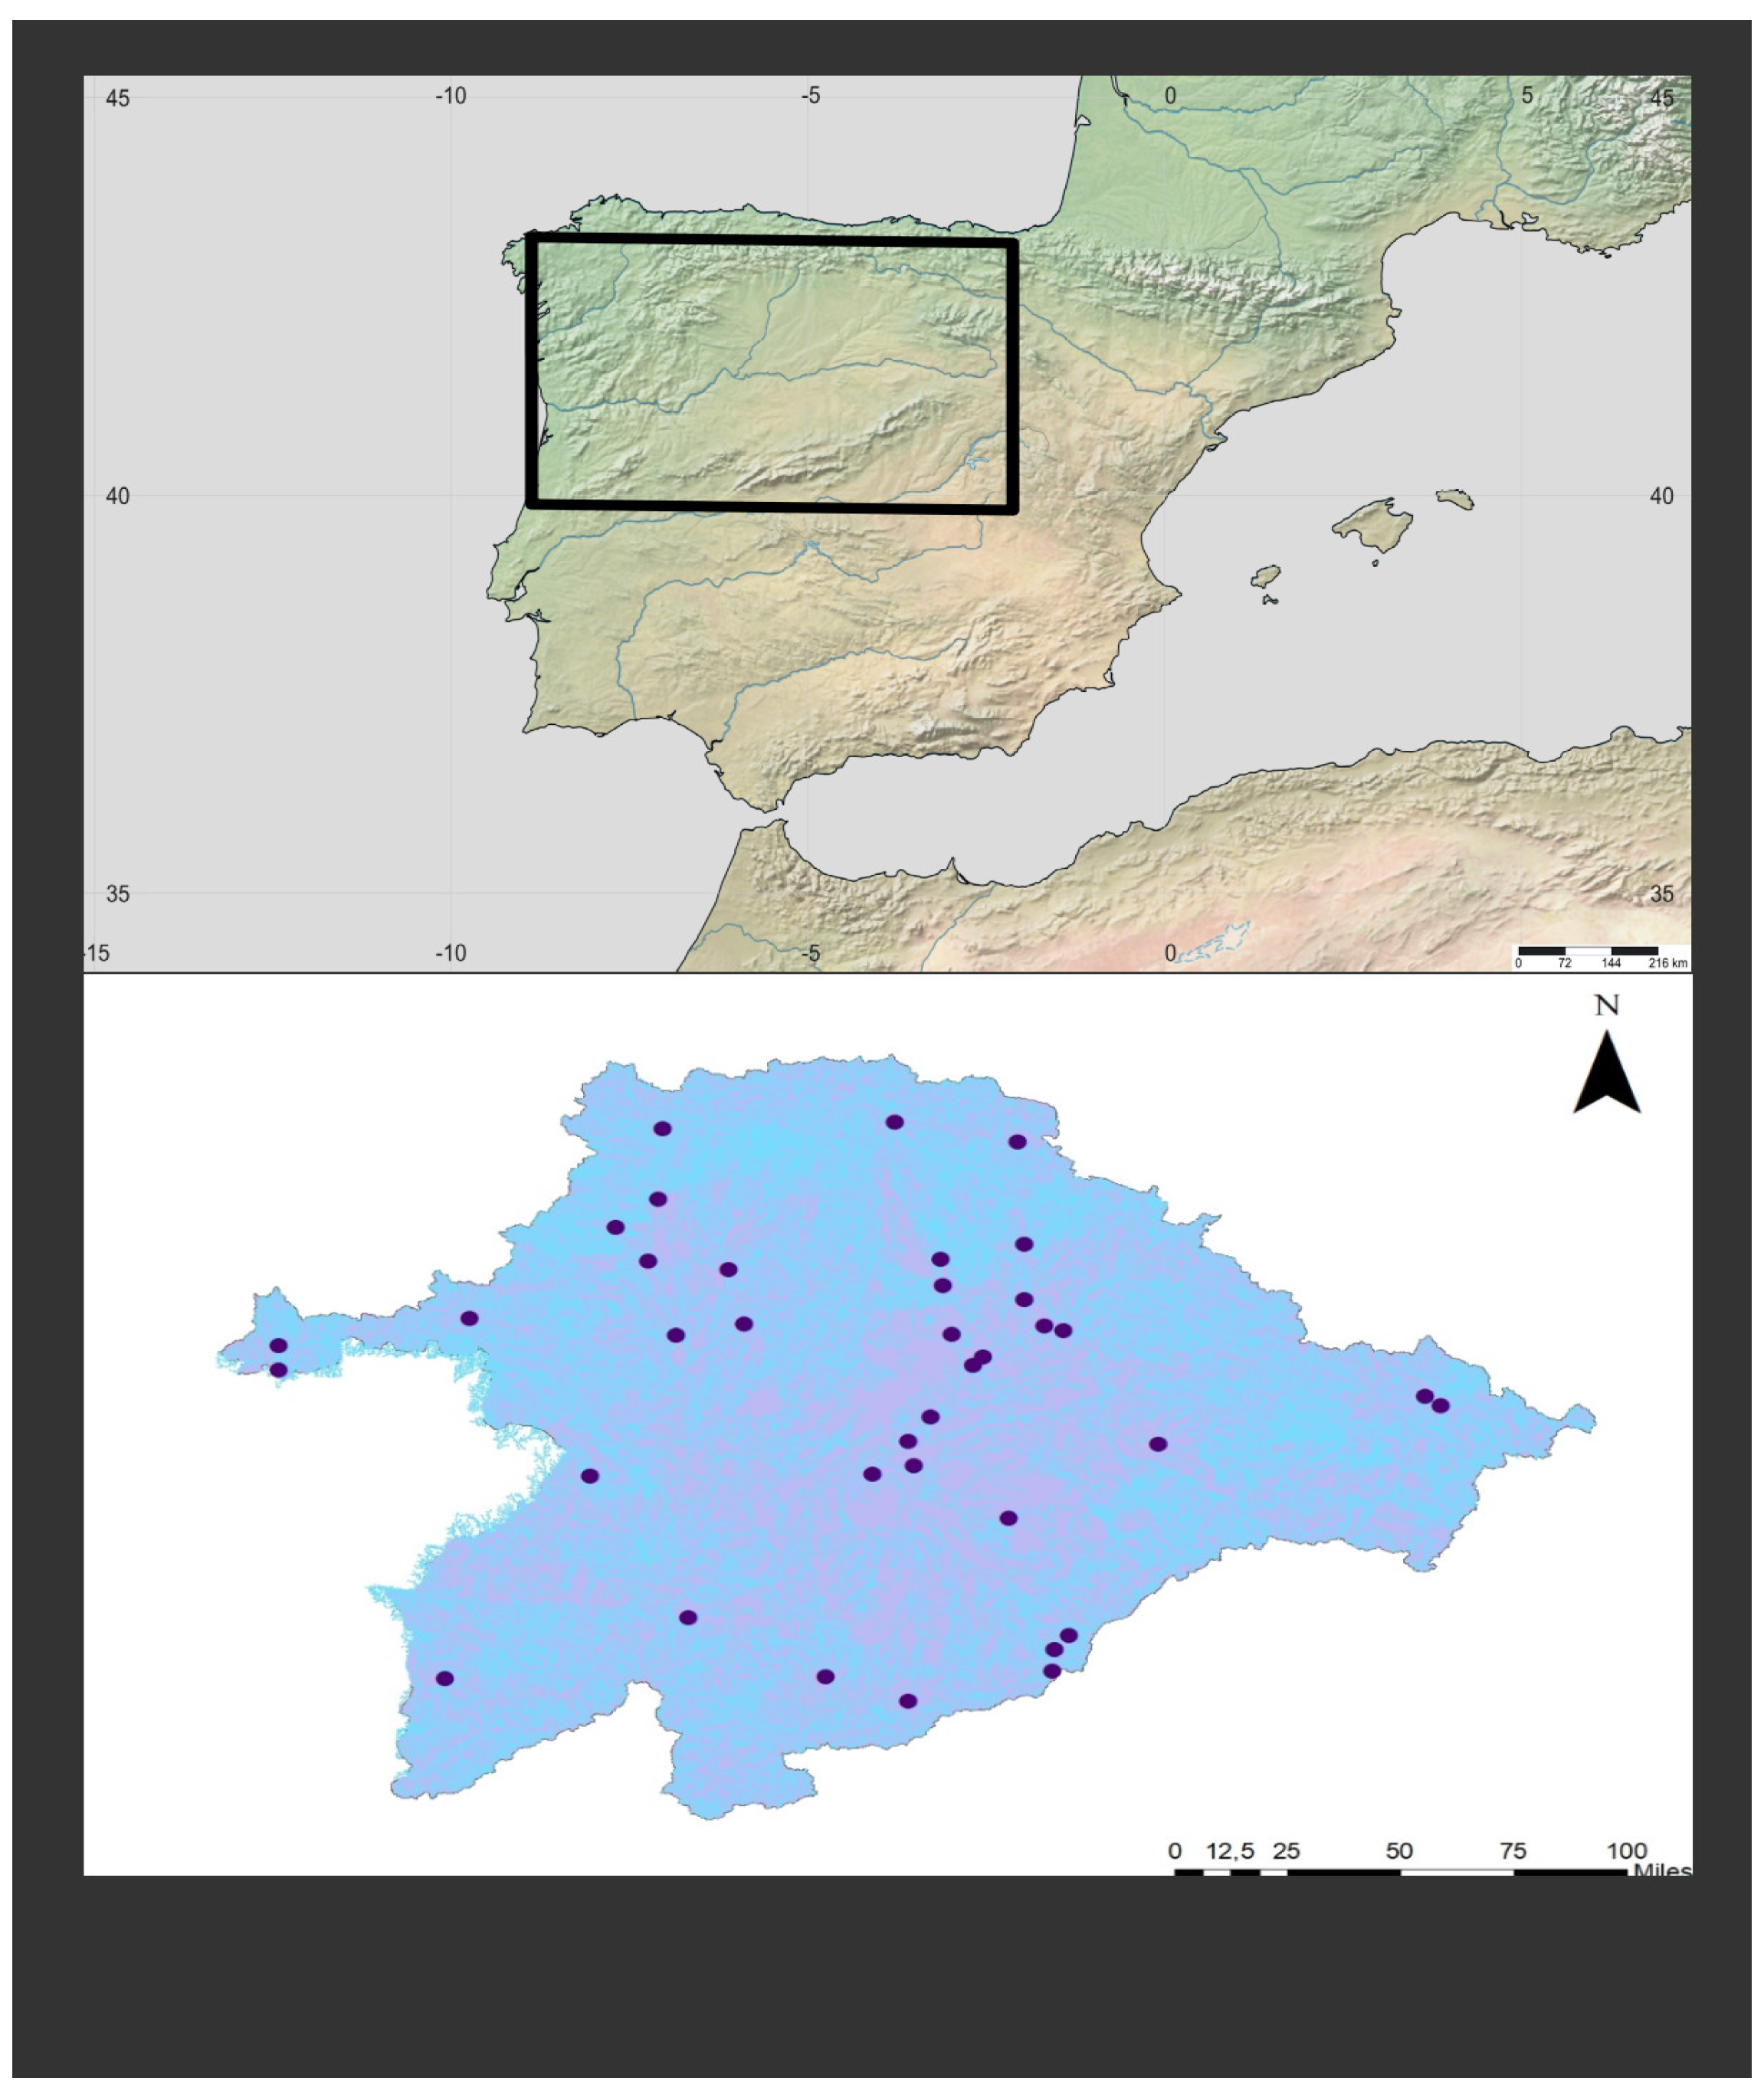
Sampling stations were located in the Duero river basin (NW Spain); it is the largest hydrographic basin on the Iberian Peninsula (98,073 km2, Figure 1). Most of the basin is located under a Mediterranean bioclimate characterized by a strong continentality, with severe winters and relatively warm summers, as well as an endorheic rainfall regime. A network of 80 large dams regulates water flow. Main land uses are agriculture and farming, industrial activities being of less importance. The population density is one of the lowest in Europe (26 inhab·km−2), although aquatic ecosystems have historically suffered intense anthropogenic impacts [14].
2.2. SPI Calculation
Epilithic diatom samples were collected and processed according to EU standards (UNE EN 13946 and UNE EN 14407) during summer 2004. We selected this year because both diatom and water parameters (see below) datasets were the most complete in terms of sample size. Resulting species counting were used to compute SPI values using Omnidia software [15]. For a given sampling station, SPI score is the average of diatom taxa i sensitivity values (Si), weighted by their relative abundance in the sample (Ai) and their indicator value (Vi), that is,
where S values range between 1 (taxa tolerant to pollution) and 5 (intolerant taxa), whereas V varies between 1 and 3, this last value indicative of a restricted ecological valence and thus typical of good indicator species. The resulting SPI is rescaled to the [1,2,3,4,5,6,7,8,9,10,11,12,13,14,15,16,17,18,19,20] range, these values representing the lowest and highest possible biological quality statuses, respectively, for a given location.
2.3. WQI Calculation
Local measurements of limnological parameters were obtained by a network of automatic water analysis stations and extracted from the Basin Authority webpage (www.chduero.es, accessed 1 June 2022). Sampling stations are geographically coincident with those used for diatom collection (see above). Firstly, 137 locations with available diatom data were considered, but 95 lacking some parameter measurements were discarded, leaving a total of 42 stations, from which five more containing outlier data (Grubb test) were subsequently deleted leaving a total of n = 37. Physical and chemical parameters (Table 1 were used to calculate the Water Quality Index (WQI) according to Mitchell et al. [16], which is a globally accepted method of estimating chemical quality in rivers (e.g., [17]). WQI values range from 0 to 100, this score being directly proportional to water quality at a given location. WQI was calculated on a monthly basis, using data from the closest date available with respect to diatom collection and the 1 to 6 prior months. In cases where a specific value was lacking for a certain date, this was back-calculated using a smoothing spline interpolation between the closest pair of data [18]. Turbidity was estimated from the concentration of total suspended solids using the equations of Al-Yaseri et al. [19].
3. Results
Main limnological characteristics are shown in Table 1. The water is neutral throughout the catchment, with some tendency to alkalinity in the northern areas. The highest conductivity values correspond to chalky substrate rivers in the northeastern part, not necessarily associated with high pollutant levels. Oxygenation is for the most part close to saturation; the lowest values are due to the inflow of wastewater or lower reservoir water. Parameters indicating eutrophication (nutrients concentration, organic matter) are also highly variable. The least nutrient-rich sites are located in high mountain rivers, while internal, downstream sites are generally more polluted and become eutrophic or even hyper-eutrophic.

Table 1.
Descriptive statistics of the limnological parameters measured in sampling stations.
| Parameter | Units | Min | Max | Mean |
|---|---|---|---|---|
| BOD5 | mg O2·L−1 | 0.00 | 5.70 | 1.22 |
| Fecal coliforms | 100 mL−1 | 0 | 104 | 1106 |
| Nitrates | ppm | 0.00 | 18.98 | 4.44 |
| O2 | % saturation | 33 | 145 | 88 |
| pH | 5.50 | 9.32 | 7.86 | |
| Phosphates | ppm | 0.00 | 1.90 | 0.41 |
| T | °C | 0.0 | 24.50 | 9.70 |
| Total solids | ppm | 0.00 | 93.30 | 8.99 |
| Turbidity | NTU | 0.77 | 56.42 | 6.13 |
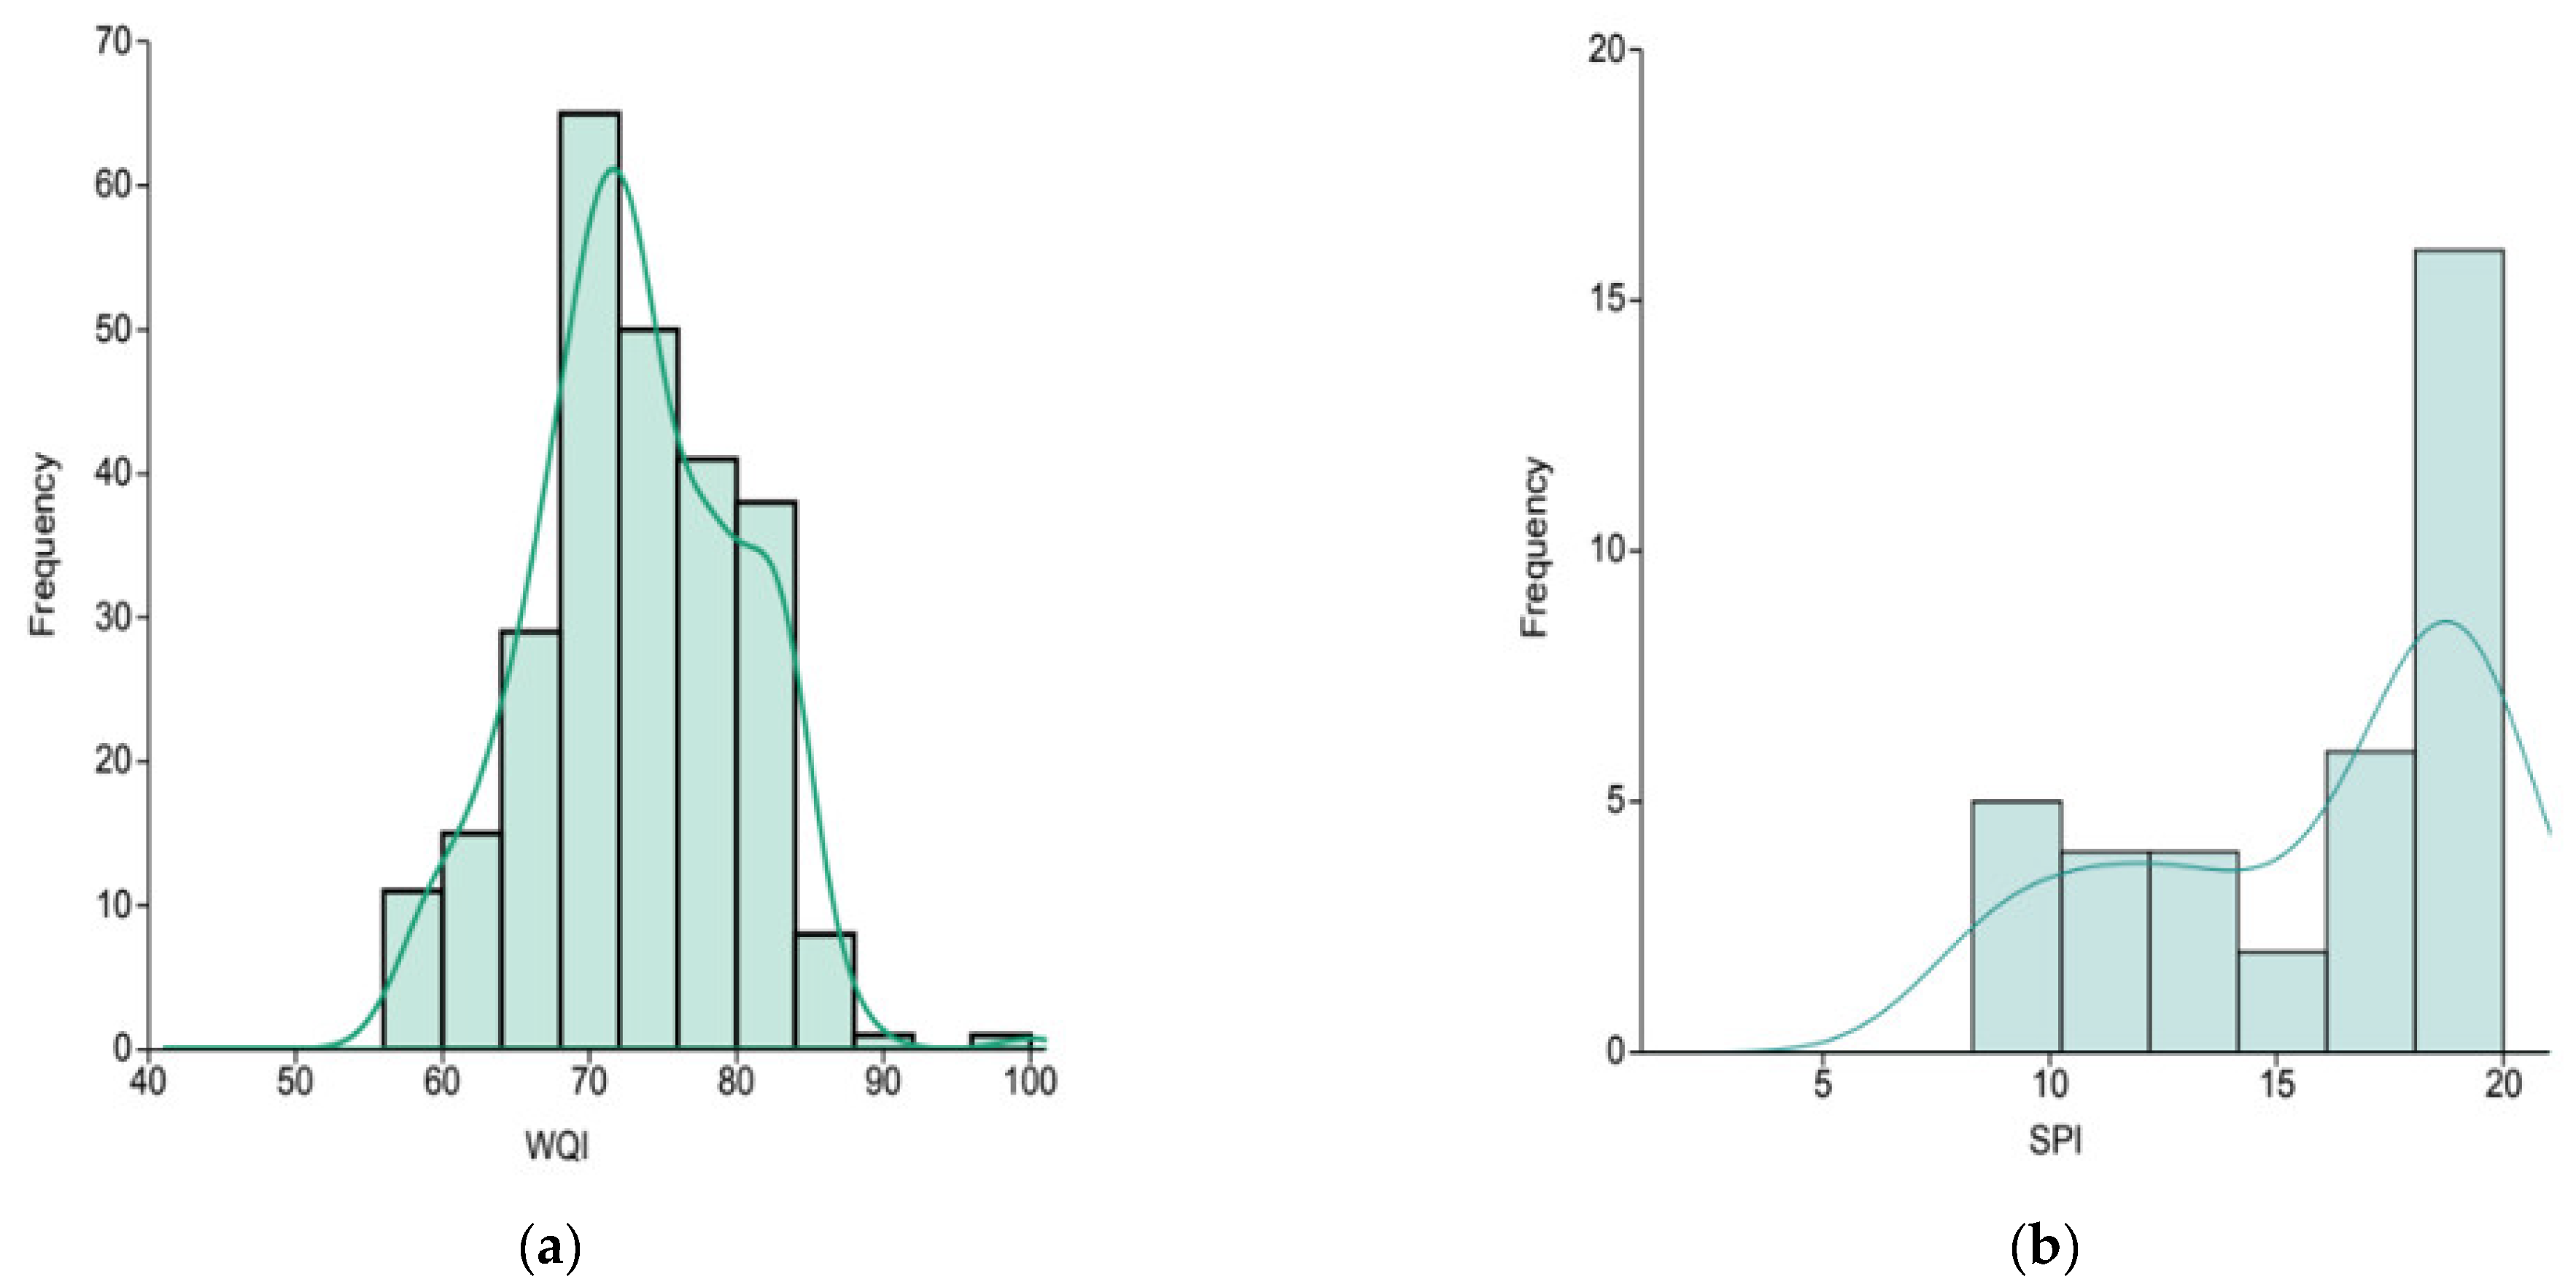
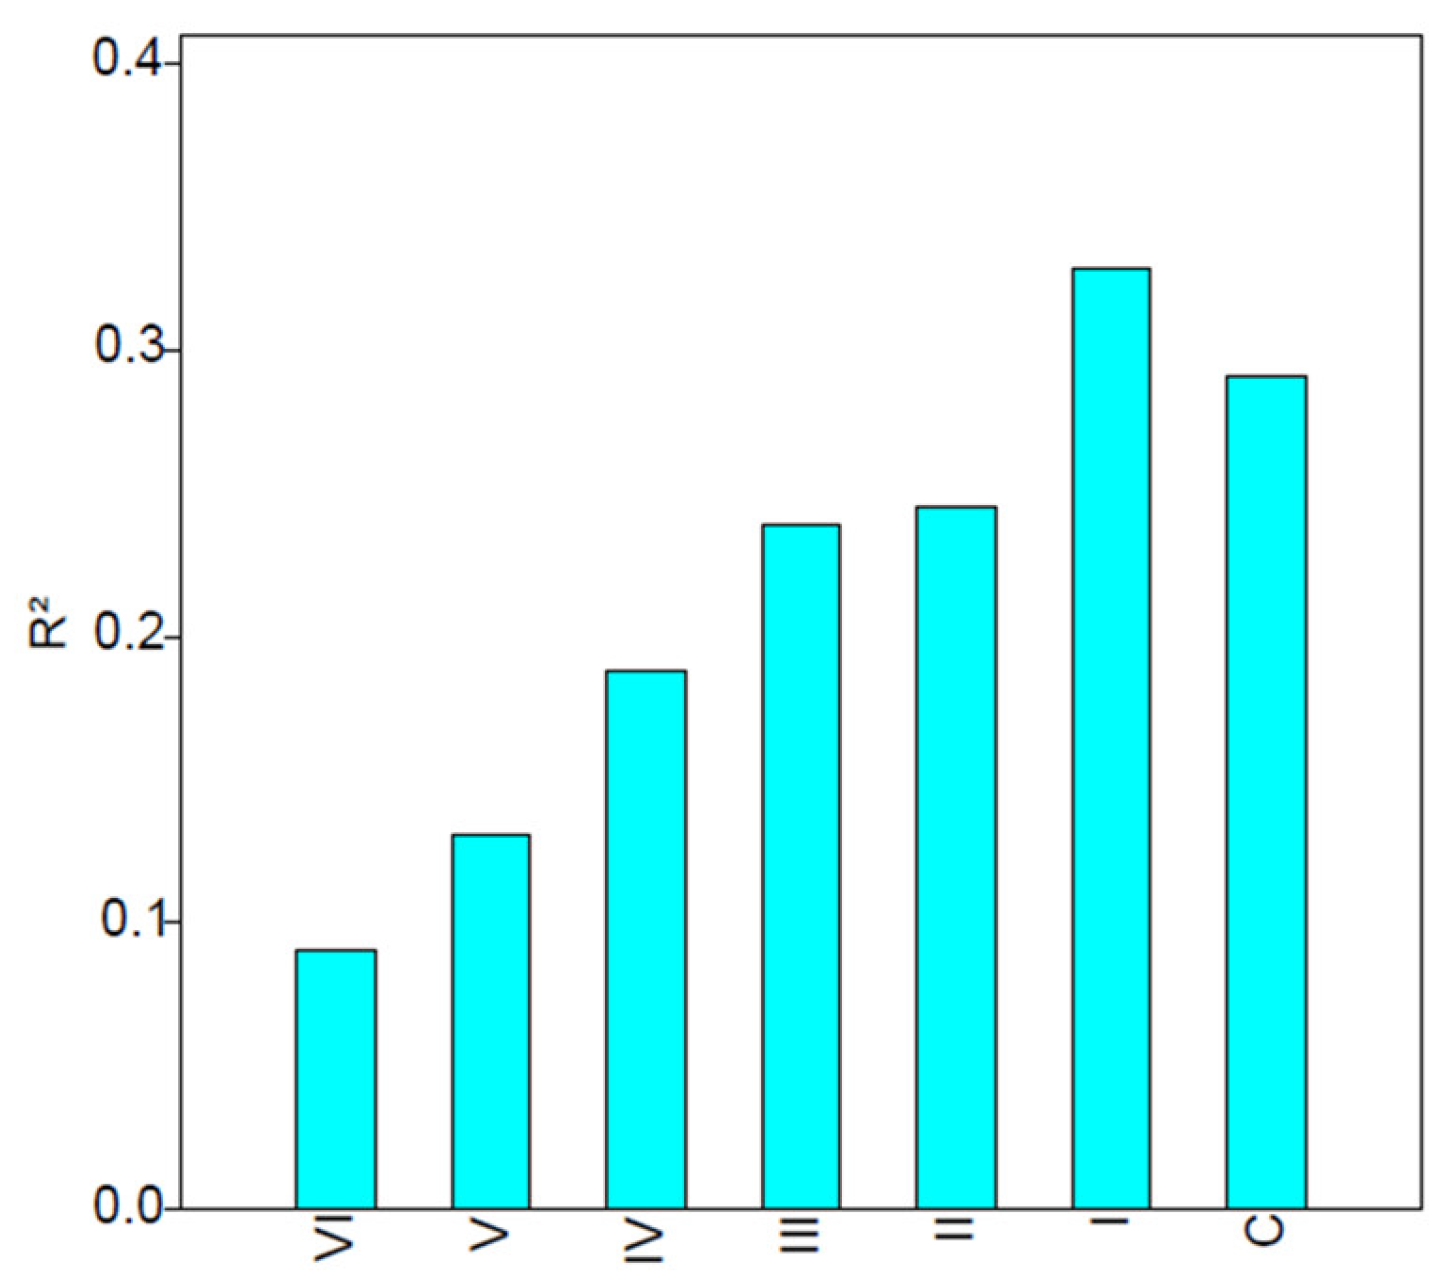
The worst water chemical condition occurred in the Duero River as it passes through the locality of Villamarciel, with a WQI score of only 56, whereas Porma River (Vegaquemada) reaches 100 points in this metric. Most sampling stations showed moderate–good WQI levels [mode (70–75), Figure 2a]. Correlation analysis evidenced that the coefficient of determination R2 increases monotonically as the water and diatom sampling dates approach (Figure 3), but correlation is better when SPI is compared with WQI values measured one month before diatom collection. This trend is also in the correlation’s p values over time (Table 2). Only the penultimate value is considered highly significant.
SPI ranged from 8.3 to 20.0, with an average score of 15.7 which corresponds to a “good” water quality status according to EU standards. According to the results provided by the index, most of the study stations achieved “good” or “high” water quality levels, particularly in the stations located in the northern rivers. On the contrary, only three stations showed low (<10) SPI scores (Figure 2b). These moderately polluted waters are related to untreated municipal inflows, or to industrial or farm wastewater. The diatom communities at these sites are species-poor, with taxa typical of average to high nutrient levels.
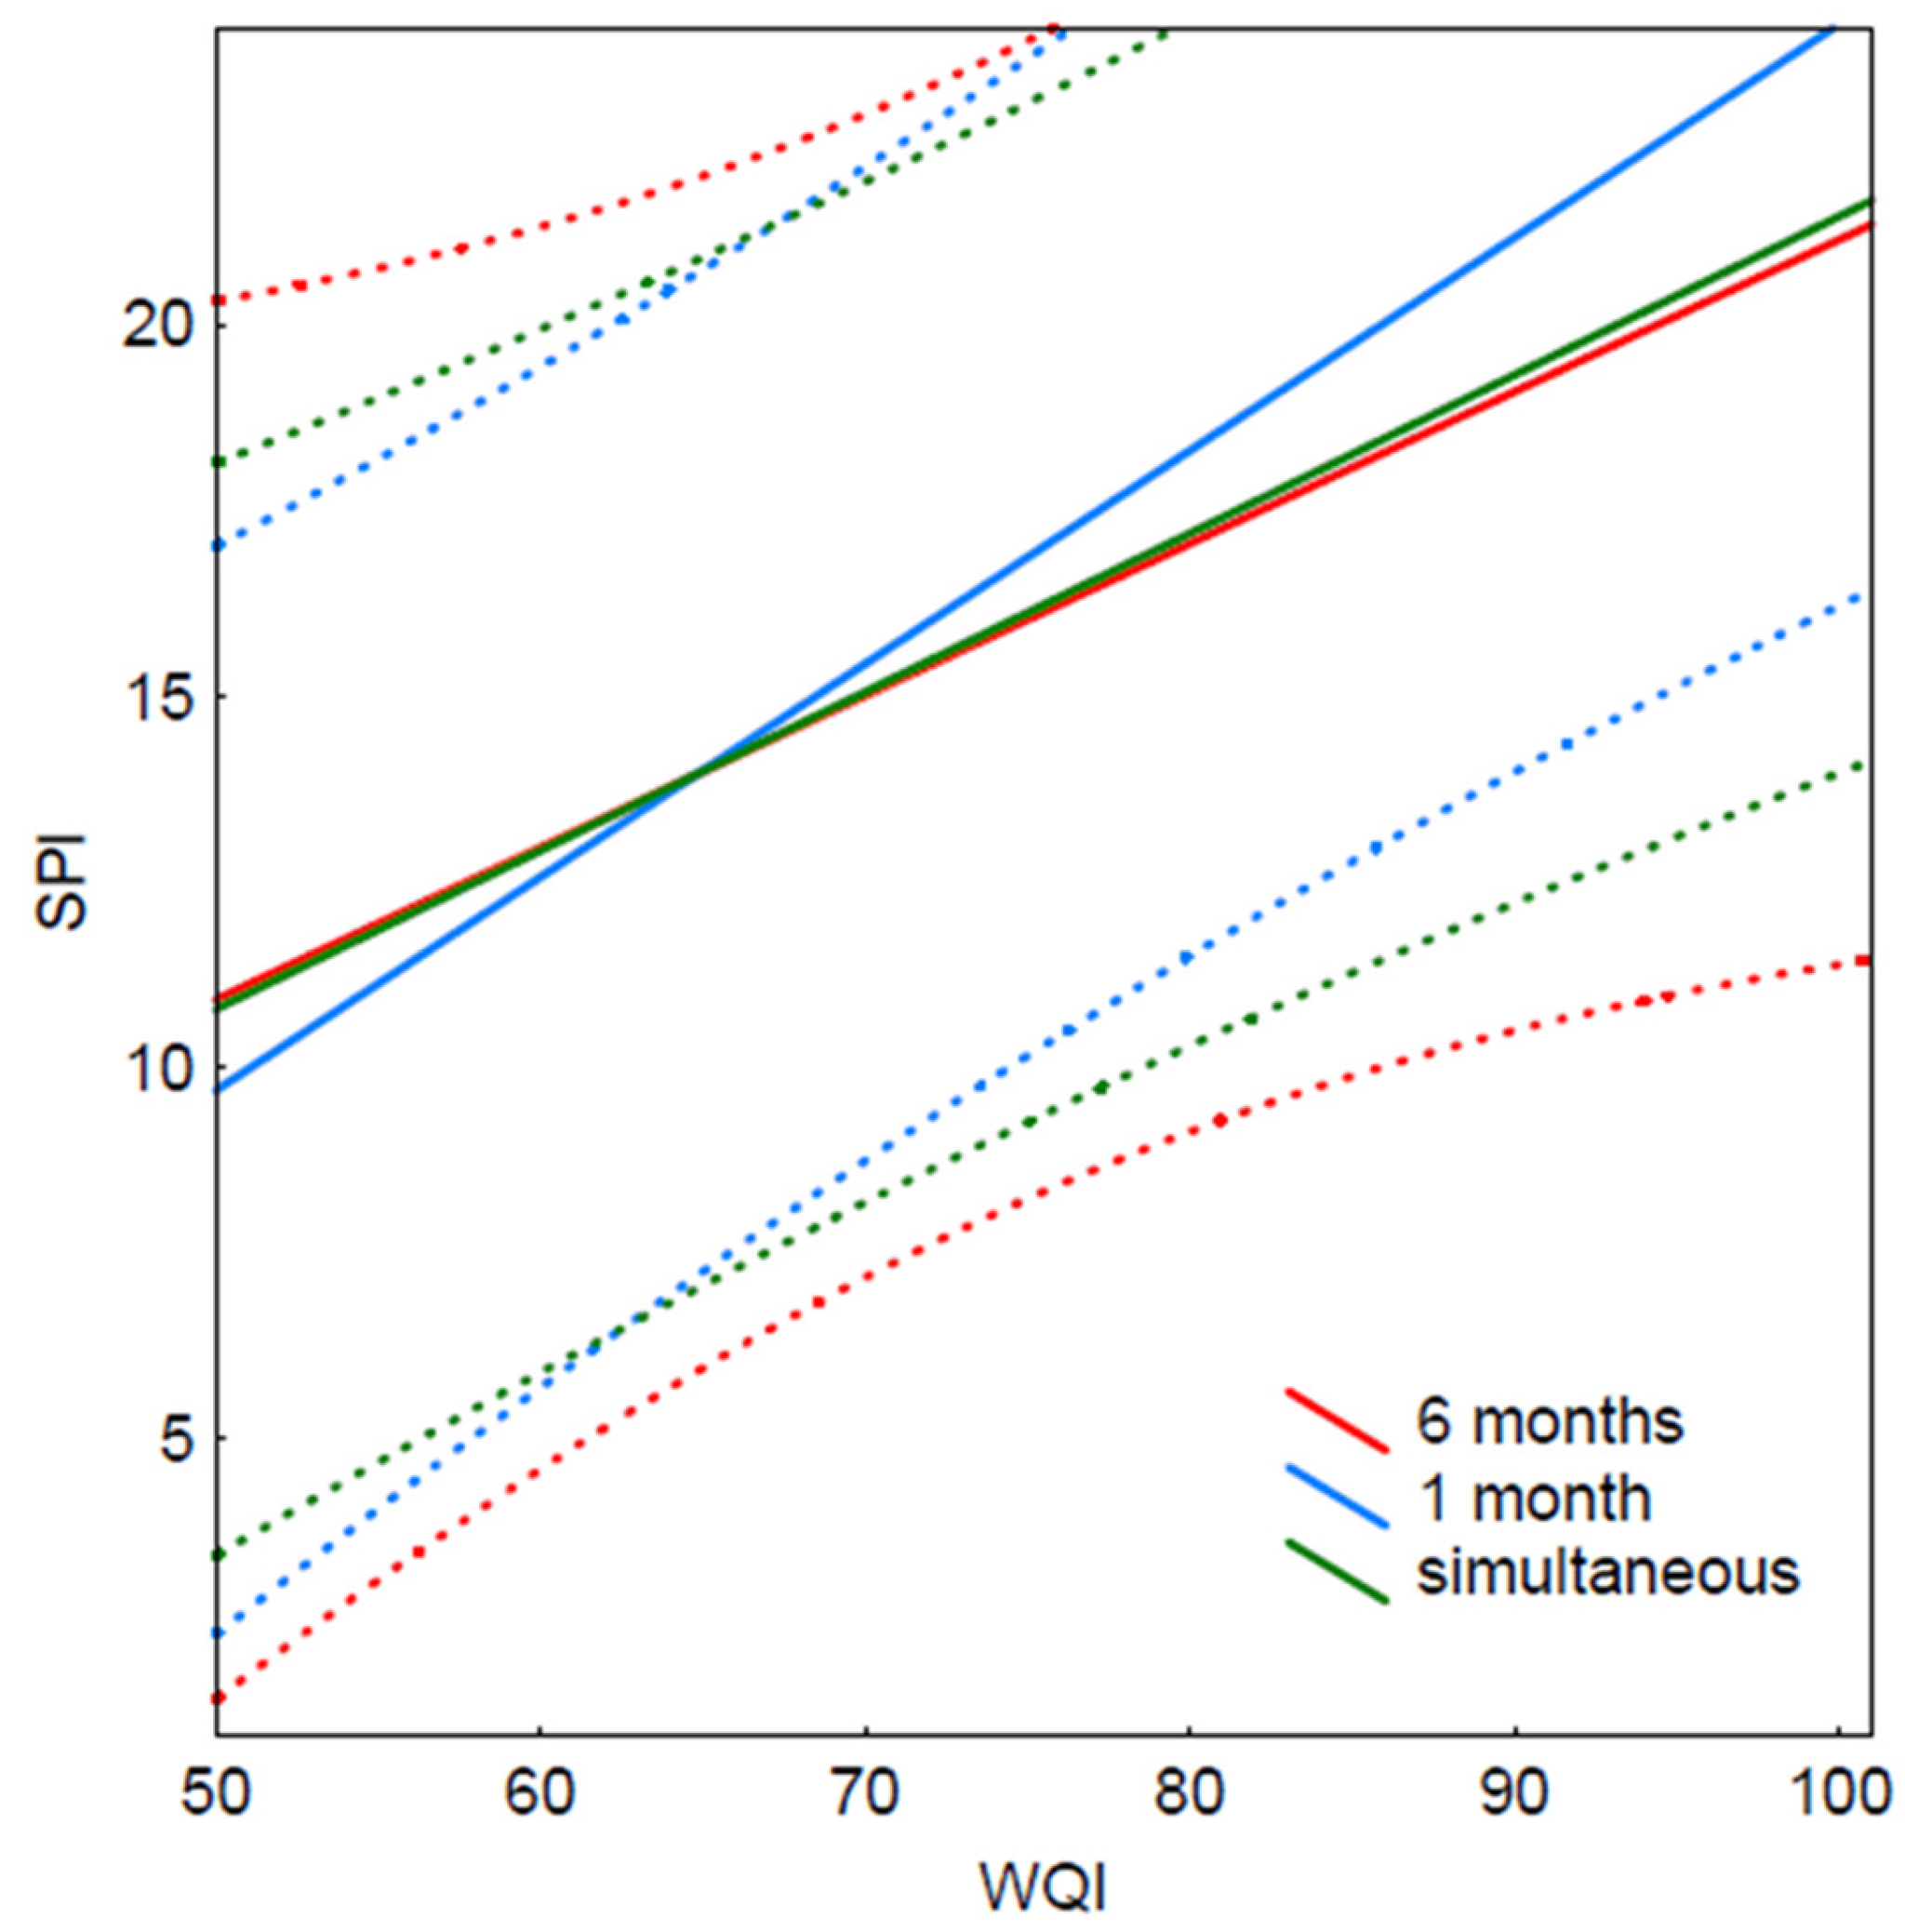
As can be seen in Figure 4, the widest prediction band corresponds to data collected with a time lag of six months, while the narrowest one corresponds to a one-month span.
4. Discussion
Blanco et al. [14] already showed that the SPI was the most suitable index for diatom-based biological monitoring in Duero watercourses, as demonstrated also in other European basins. The results presented there indicated that this diatom-based metric reflects the overall water quality during the three months before diatom sampling. However, the actual timescale on which diatoms integrate river limnological parameters is not well known. As purely physico-chemical analyses do not accurately reflect the real water quality status—as it can be affected by pollutants introduced just before sampling [22]—biofilm response time after a change in environmental conditions has not been explicitly addressed [10].
The results obtained in our study indicate that diatom-based metrics are a better reflection of past (one month prior) conditions in a river than present conditions. These findings therefore corroborate our initial hypothesis, as the further we moved away from the diatom collection date, the correlation with water quality becomes worse. However, we note that the SPI indicates better water chemistry when compared to data collected one month before. This fact, so far ignored in similar studies published to date, has important implications for the application of water quality assessment methods.
This issue had already been investigated for the first time by Prygiel and Coste [23], who showed that for the SPI, the best correlations are obtained using a three-month average of chemical data, while for other indices, the best correlations are obtained with water sampling performed just before diatom collection. Other studies suggest, however, integration periods of three [24,25], five [26] or up to six [27] weeks. Several other comparative studies use different periods of integration of limnological variables, e.g., Bottin et al. [28] average the data obtained during 60 days around the phytobenthos sampling date, up to the 12 months used by Tibby [29] or Gottschalk and Kahlert [30]. A study by Taylor et al. [27] suggested that diatom-based indices in general have a better correlation with chemical data averaged over a month, starting six weeks prior to diatom sampling. Finally, in a similar study on the Duero Basin diatoms, Blanco et al. [14] determined that the correlation coefficient peaks when a time-weighted average of the physical and chemical variables during the two previous months is considered.
According to Lacoursière et al. [31], substrate colonization by diatoms takes place over a period of four weeks, which allows the establishment of a mature assemblage. Experimental results obtained by Rimet et al. [11] indicate that in situ substrate colonization and the establishment of the epilithic diatom assemblage in equilibrium with the environment can require even more than two months. Thus, in order to assess the effectiveness of a diatom index in mirroring water status, succession in the epilithic community should be left to develop for at least one month. In any case, the results presented here showed that the SPI reflects the general water quality status during the month before diatom sampling.
The use of bioindicators allows reducing sampling effort over time, taking into account the seasonality of the assemblages associated with certain river stretches. However, as Hirst et al. [32] point out, the period required may vary between stream types and other water chemistry variables. In this regard, the time required for a diatom assemblage to reflect changing environmental conditions depends not only on its “reaction time” to shifts in water chemistry, but also on assemblage structure and dominant life forms [33]. An aspect to be investigated in future works is thus the relationship between the “integration capacity” of biotic indices and the natural variability of aquatic ecosystems. For instance, it is known that the IDEC diatom index integrates this variability over a period of time that depends on the trophic status of the river and the variability of nutrient concentrations, with diatom assemblages being less sensitive to nutrient fluctuations in eutrophic rivers, whose characteristics are more slowly integrated into index scores [31].
Therefore, in order to increase the reliability of diatom-based biomonitoring programs, we propose to avoid the simultaneous collection of water and diatom samples but to consider instead the record of limnological parameters over a period of ≥1 month in each station.
Author Contributions
Conceptualization, R.V. and S.B.; writing—original draft preparation, R.V.; writing—review and editing, S.B. All authors have read and agreed to the published version of the manuscript.
Funding
This research was funded by UNIVERSITY OF LEON (Spain) thanks to a training grant from the Vice-Rectorate for Research and Transfer.
Data Availability Statement
Not applicable.
Acknowledgments
Lab staff is gratefully acknowledged for their support during the study.
Conflicts of Interest
The authors declare no conflict of interest.
References
- Round, F.E.; Crawford, R.M.; Mann, D.G. Diatoms: Biology and Morphology of the Genera; Cambridge University Press: Cambridge, UK, 1990. [Google Scholar]
- Atazadeh, I.; Sharifi, M.; Kelly, M.G. Evaluation of the Trophic Diatom Index for Assessing Water Quality in River Gharasou, Western Iran. Hydrobiologia 2007, 589, 165–173. [Google Scholar] [CrossRef]
- Kalyoncu, H.; Çİcek, N.L.; Akkoz, C.; Yorulmaz, B. Comparative Performance of Diatom Indices in Aquatic Pollution Assessment. Afr. J. Agric. Res. 2009, 4, 1032–1040. [Google Scholar]
- Zalack, J.T.; Smucker, N.J.; Vis, M.L. Development of a Diatom Index of Biotic Integrity for Acid Mine Drainage Impacted Streams. Ecol. Indic. 2010, 10, 287–295. [Google Scholar] [CrossRef]
- Oeding, S.; Taffs, K.H. Developing a Regional Diatom Index for Assessment and Monitoring of Freshwater Streams in Sub-Tropical Australia. Ecol. Indic. 2017, 80, 135–146. [Google Scholar] [CrossRef]
- Coste, M. Etude Des Methods Biologique Quantitatives d’appreciation de La Qualite Des Eaux; Cemagref: Lyon, France, 1982. [Google Scholar]
- Korhonen, J.J.; Köngäs, P.; Soininen, J. Temporal Variation of Diatom Assemblages in Oligotrophic and Eutrophic Streams. Eur. J. Phycol. 2013, 48, 141–151. [Google Scholar] [CrossRef] [Green Version]
- Iserentant, R.; Blancke, D. A Transplantation Experiment in Running Water to Measure the Response Rate of Diatoms to Changes in Water Quality. In Proceedings of the 8th Diatom Symposium, Paris, France, 27 August–1 September 1984; Volume 27, pp. 347–354. [Google Scholar]
- Wendker, S. Diatom Community Response to Translocation in a Small Softwater Stream. Nova Hedwig. 1992, 55, 397–406. [Google Scholar]
- Lavoie, I.; Campeau, S.; Darchambeau, F.; Cabana, G.; Dillon, P.J. Are Diatoms Good Integrators of Temporal Variability in Stream Water Quality? Freshw. Biol. 2008, 53, 827–841. [Google Scholar] [CrossRef]
- Rimet, F.; Cauchie, H.-M.; Hoffmann, L.; Ector, L. Response of Diatom Indices to Simulated Water Quality Improvements in a River. J. Appl. Phycol. 2005, 17, 119–128. [Google Scholar] [CrossRef]
- Soininen, J.; Eloranta, P. Seasonal Persistence and Stability of Diatom Communities in Rivers: Are There Habitat Specific Differences? Eur. J. Phycol. 2004, 39, 153–160. [Google Scholar] [CrossRef]
- Charles, D.F.; Acker, F.W.; Hart, D.D.; Reimer, C.W.; Cotter, P.B. Large-Scale Regional Variation in Diatom-Water Chemistry Relationships: Rivers of the Eastern United States. In Advances in Algal Biology: A Commemoration of the Work of Rex Lowe; Stevenson, R.J., Pan, Y., Kociolek, J.P., Kingston, J.C., Eds.; Developments in Hydrobiology; Springer: Dordrecht, The Netherlands, 2006; pp. 27–57. ISBN 978-1-4020-5070-1. [Google Scholar]
- Blanco, S.; Bécares, E.; Cauchie, H.-M.; Hoffmann, L.; Ector, L. Comparison of Biotic Indices for Water Quality Diagnosis in the Duero Basin (Spain). Large Rivers 2007, 17, 267–286. [Google Scholar] [CrossRef]
- Lecointe, C.; Coste, M.; Prygiel, J. “Omnidia”: Software for Taxonomy, Calculation of Diatom Indices and Inventories Management. Hydrobiologia 1993, 269, 509–513. [Google Scholar] [CrossRef]
- Mitchell, M.K.; Stapp, W.B.; Beebe, A. Field Manual for Water Quality Monitoring: An Environmental Education Program for Schools; Thomson-Shore: Dexter, MI, USA, 1994. [Google Scholar]
- Sahu, P.; Sikdar, P.K. Hydrochemical Framework of the Aquifer in and around East Kolkata Wetlands, West Bengal, India. Environ. Geol. 2008, 55, 823–835. [Google Scholar] [CrossRef]
- de Boor, C. A Practical Guide to Splines; Springer: New Yourk, NY, USA, 1978. [Google Scholar]
- Al-Yaseri, I.; Morgan, S.; Retzlaff, W. Using Turbidity to Determine Total Suspended Solids in Storm-Water Runoff from Green Roofs. J. Environ. Eng. 2013, 139, 822–828. [Google Scholar] [CrossRef]
- Hammer, Ø.; Harper, D.A.T.; Ryan, P.D. Past: Paleontological Statistics Software Package for Education and Data Analysis. Palaeontol. Electron. 2001, 4, 9. [Google Scholar]
- StatSoft Statistica. Version 13.0, Data Analysis Software System. Available online: https://statistica.software.informer.com/13.0/ (accessed on 4 December 2022).
- Szczepocka, E.; Szulc, B. The use of benthic diatoms in estimating water quality of variously polluted rivers. Oceanol. Hydrobiol. Stud. 2009, 38, 17–26. [Google Scholar] [CrossRef]
- Prygiel, J.; Coste, M. The Assessment of Water Quality in the Artois-Picardie Water Basin (France) by the Use of Diatom Indices. Hydrobiologia 1993, 269, 343–349. [Google Scholar] [CrossRef]
- Tudesque, L.; Tisseuil, C.; Lek, S. Scale-Dependent Effects of Land Cover on Water Physico-Chemistry and Diatom-Based Metrics in a Major River System, the Adour-Garonne Basin (South Western France). Sci. Total Environ. 2014, 466–467, 47–55. [Google Scholar] [CrossRef]
- Larras, F.; Coulaud, R.; Gautreau, E.; Billoir, E.; Rosebery, J.; Usseglio-Polatera, P. Assessing Anthropogenic Pressures on Streams: A Random Forest Approach Based on Benthic Diatom Communities. Sci. Total Environ. 2017, 586, 1101–1112. [Google Scholar] [CrossRef]
- Lavoie, I.; Hamilton, P.B.; Wang, Y.-K.; Dillon, P.J.; Campeau, S. A Comparison of Stream Bioassessment in Québec (Canada) Using Six European and North American Diatom-Based Indices. Nova Hedwig. 2009, 135, 37–56. [Google Scholar]
- Taylor, J.C.; van Vuuren, M.J.; Pieterse, A.J.H. The Application and Testing of Diatom-Based Indices in the Vaal and Wilge Rivers, South Africa. Water SA 2007, 33, 51–60. [Google Scholar] [CrossRef] [Green Version]
- Bottin, M.; Soininen, J.; Ferrol, M.; Tison-Rosebery, J. Do Spatial Patterns of Benthic Diatom Assemblages Vary across Regions and Years? Freshw. Sci. 2014, 33, 402–416. [Google Scholar] [CrossRef]
- Tibby, J. Development of a Diatom-Based Model for Inferring Total Phosphorus in Southeastern Australian Water Storages. J. Paleolimnol. 2004, 31, 23–36. [Google Scholar] [CrossRef]
- Gottschalk, S.; Kahlert, M. Shifts in Taxonomical and Guild Composition of Littoral Diatom Assemblages along Environmental Gradients. Hydrobiologia 2012, 694, 41–56. [Google Scholar] [CrossRef]
- Lacoursiere, S.; Lavoie, I.; Rodriguez, M.A.; Campeau, S. Modeling the Response Time of Diatom Assemblages to Simulated Water Quality Improvement and Degradation in Running Waters. Can. J. Fish. Aquat. Sci. 2011, 68, 487–498. [Google Scholar] [CrossRef]
- Hirst, H.; Chaud, F.; Delabie, C.; Jüttner, I.; Ormerod, S.J. Assessing the Short-Term Response of Stream Diatoms to Acidity Using Inter-Basin Transplantations and Chemical Diffusing Substrates. Freshw. Biol. 2004, 49, 1072–1088. [Google Scholar] [CrossRef]
- Rimet, F. Benthic Diatom Assemblages and Their Correspondence with Ecoregional Classifications: Case Study of Rivers in North-Eastern France. Hydrobiologia 2009, 636, 137–151. [Google Scholar] [CrossRef]
Figure 1.
Map of the Duero River Basin within the Iberian Peninsula, showing the points corresponding to the hydrographic stations used in this study.
Figure 1.
Map of the Duero River Basin within the Iberian Peninsula, showing the points corresponding to the hydrographic stations used in this study.

Figure 2.
Histogram of WQI (a) and SPI (b) values obtained. Data fitted to a kernel density estimator.
Figure 2.
Histogram of WQI (a) and SPI (b) values obtained. Data fitted to a kernel density estimator.

Figure 3.
Evolution of the coefficient of determination between WQI and SPI as the water and diatom sampling dates approach, from water samples taken 6 months before diatoms (VI) to the nearest sampling date (C).
Figure 3.
Evolution of the coefficient of determination between WQI and SPI as the water and diatom sampling dates approach, from water samples taken 6 months before diatoms (VI) to the nearest sampling date (C).

Figure 4.
SPI/WQI correlation for water samples taken six months earlier vs. one month earlier vs. simultaneously with respect to diatom sampling. Dots (omitted) fitted to linear regression lines and 95% linear prediction bands.
Figure 4.
SPI/WQI correlation for water samples taken six months earlier vs. one month earlier vs. simultaneously with respect to diatom sampling. Dots (omitted) fitted to linear regression lines and 95% linear prediction bands.

Table 2.
Evolution of p values over time from C (date closest to the date of diatom sampling) to VI (6 months before this date).
Table 2.
Evolution of p values over time from C (date closest to the date of diatom sampling) to VI (6 months before this date).
| Month | p Value |
|---|---|
| VI | 1.000 |
| V | 0.778 |
| IV | 0.205 |
| III | 0.060 |
| II | 0.052 |
| I | 0.006 |
| C | 0.016 |
Disclaimer/Publisher’s Note: The statements, opinions and data contained in all publications are solely those of the individual author(s) and contributor(s) and not of MDPI and/or the editor(s). MDPI and/or the editor(s) disclaim responsibility for any injury to people or property resulting from any ideas, methods, instructions or products referred to in the content. |
© 2023 by the authors. Licensee MDPI, Basel, Switzerland. This article is an open access article distributed under the terms and conditions of the Creative Commons Attribution (CC BY) license (https://creativecommons.org/licenses/by/4.0/).
Share and Cite
MDPI and ACS Style
Viso, R.; Blanco, S. River Diatoms Reflect Better Past than Current Environmental Conditions. Water 2023, 15, 333. https://doi.org/10.3390/w15020333
AMA Style
Viso R, Blanco S. River Diatoms Reflect Better Past than Current Environmental Conditions. Water. 2023; 15(2):333. https://doi.org/10.3390/w15020333
Chicago/Turabian StyleViso, Raquel, and Saúl Blanco. 2023. "River Diatoms Reflect Better Past than Current Environmental Conditions" Water 15, no. 2: 333. https://doi.org/10.3390/w15020333
Note that from the first issue of 2016, this journal uses article numbers instead of page numbers. See further details here.