
Prevalence of Antibiotic-Resistant Bacteria in Domestic Water Storage Tanks in Sidon, Lebanon
by
Jamilah Borjac
1,†,
Wafaa Zeino
1,†,
Alaa Matar
2,†,
Salwa Khawaja
3,
Maxime Merheb
4 and
Rachel Matar
4,* 1
Department of Biological Sciences, Faculty of Science, Beirut Arab University, Chouf P.O. Box 11-5020, Lebanon
2
Department of Medical Laboratory Technology, Jinan University, Tripoli P.O. Box 818, Lebanon
3
Department of Microbiology, Azm Center for Biotechnology and its applications., Tripoli P.O. Box 5, Lebanon
4
Department of Biotechnology, American University of Ras Al Khaimah, Ras Al Khaimah P.O. Box 10021, United Arab Emirates
*
Author to whom correspondence should be addressed.
†
These authors have equally contributed to this work.
Water 2023, 15(2), 335; https://doi.org/10.3390/w15020335
Submission received: 18 November 2022
/
Revised: 9 January 2023
/
Accepted: 10 January 2023
/
Published: 13 January 2023
(This article belongs to the Section Water Quality and Contamination)
Abstract
:Safe, accessible, and good water quality are essential characteristics for reducing various waterborne diseases. Since domestic water is the water most consumed by Lebanese people, cleaning household water tanks is important to prevent their exposure to pathogenic microorganisms. Generally, all the stages of the value chain of the Lebanese water sector are still imperfect. Thus, the domestic water should be regularly tested, especially in the impoverished landmarks where water quality is the worst. The aim of this study is to evaluate the physicochemical parameters and microbiological quality of the water in the storage tanks of homes in Sidon, Lebanon. Fifty water samples were collected aseptically from domestic water storage tanks. The microbiological assessment was performed using basic plating techniques. Identification of isolated bacteria was performed using MALDI-TOF-MS. Physicochemical parameters were assessed using titration, pH, and conductivity measurements. Antibiotic-susceptibility testing was performed using antibiotic disks. Screening for virulence genes in bacteria was carried out via polymerase chain reaction (PCR). Most of the physicochemical parameters were within the permissible limits of the World Health Organization (WHO) for drinking water. The heterotrophic plate count (HPC) varied between the water samples. The total coliform, fecal coliform, and Escherichia coli (E. coli) contaminate was 54%, 20%, and 16% in each of the samples, respectively. Other bacteria isolated from household water included intestinal Enterococcus faecalis (E. faecalis) (68%), Staphylococcus aureus (S. aureus) (68%), and Pseudomonas aeruginosa (P. aeruginosa) (22%). Other predominant isolates recovered from the samples were also identified. The bacterial isolates showed a prevalence of resistance and intermediate resistance against the tested antibiotic agents. Multi-resistant Staphylococcus aureus (MRSA) was detected in 21% of the collected S. aureus, using cefoxitin agent and mecA gene detection. A prevalence of virulence genes in both P. aeruginosa and S. aureus was also noticed. Our data show that Sidon domestic water is not suitable for either drinking or home applications.
1. Introduction
Biological life depends on various necessities, especially water, which constitutes around 60% of an adult human body and up to 75% of a child’s organism [1]. Rivers, lakes, streams, ponds, reservoirs, springs, and wells are the sources of water in Lebanon [2]. They are used for different domestic purposes and are therefore defined as household water according to the World Health Organization (WHO). Water is distributed via pipeline to reach the houses in Lebanon. However, due to the continuous shortage of domestic water in Lebanon and the constant worry about its scarcity, people save water in storage tanks. The inappropriate control of water systems, the external water supply, the age of materials used, and the contact intervals may affect the quality of water, resulting in microbial contamination and potential chemical-substance liberation that can cause serious illness [3]. In addition, treated, pure water can be altered during storage and upon circulation via pipelines [4]. Excreta-related diseases, transmitted by low water quality, contribute to the high burden of childhood mortality worldwide. In 2010, the WHO denoted that the precise disinfection of water reduces the burden of illness in the world by 9.15% and the death rate by 6.3% [5]. Based on this, the examination of microbial contamination and the analysis of water quality outline the safety limits that should be followed before human consumption [6]. The evaluation of water quality involves physical, chemical, and microbiological parameters [7,8]. The WHO and other regulatory agencies set the exposure limits of these parameters [7]. The main physicochemical parameters measured to assess the quality of water include the total dissolved solutes (TDS), pH, hardness, total alkalinity, electrical conductivity (EC), and the presence of other non-toxic elements [9]. In Lebanon, the standard values of the physicochemical properties of water are set by “Libnor” according to ISO 10523:1994. Total dissolved solutes are the measurement of inorganic salts and dissolved organic substances in water [10,11]. Measuring both TDS and pH tracks the pollution’s access to water. Thus, an increase in TDS levels and a decrease in pH are indicators of the presence of harmful contaminants. Industrial wastes, dissolved rocks, salts, base residues, certain plant activities, and mud provide water with anions that can be evaluated by measuring its alkalinity [12]. Hardness refers to the calcium carbonate concentration in water.
The United States Environmental Protection Agency (USEPA) identified over 500 waterborne pathogens that may inhabit potable water and affect human health [13]. A matrix-assisted laser desorption/ionization-time of flight (MALDI-TOF) mass spectrometer was recently used for the identification of the genus and species of a wide range of Gram-negative and Gram-positive bacteria [14].
Escherichia coli (E. coli), Pseudomonas aeruginosa (P. aeruginosa), Staphylococcus aureus (S. aureus), and total fecal coliforms are among the most susceptible bacterial species. Their growth affects the quality and safety of water, causing illness including diarrheal diseases [15,16].
Generally, all the stages of the Lebanese water-sector value chain are still imperfect [17]. Thus, potable water quality is variable. The general water quality status in Sidon required improvement due to noted contamination according to a study done in 2010 [18]. After the rehabilitation of the main pumping facilities, drinking water sources, and networks using plastic pipes in the city [19], domestic water storage tanks were exposed to several pathogens that deteriorated their quality. Therefore, it is of the utmost importance to regularly test the domestic water quality in this impoverished region.
The aim of this study is to evaluate the physicochemical parameters of water in the storage tanks of Sidon homes to assess its microbiological quality, check the resistance pattern of bacterial isolates to different antibiotics, and to screen for the presence of virulence genes in some isolates.
2. Materials and Methods
2.1. Survey
A questionnaire was filled out by the participants prior to the sample collection from their tanks. The survey included information related to various water parameters. Among these parameters were: the disinfection history, size and number of water tanks connected to each home, and the probability of the lack of water.
2.2. Sample Collection
All collection bottles were washed with detergents, followed by concentrated HCl (10.2 M). They were finally washed again with deionized water. Sodium thiosulfate (833 μL, 3%) was added to each 1 L sterile glass storage bottle to neutralize chlorine in order to prevent bactericidal effect during transportation. The bottles were then autoclaved for 15 min at 121 °C [20].
Following the protocol for aseptic sampling technique (ISO 5667-21, 2010) [21], 50 water samples from domestic storage tanks in Sidon were collected during the winter of 2019. Samples were kept on ice for bacteriological analysis during transportation to Beirut Arab University laboratories.
2.3. Analysis of Water Samples
2.3.1. Physical Parameters
Physical parameters including the pH, electrical conductivity (EC), and TDS were measured. The pH of water samples was determined using a pH meter (Mi 151 Bench pH Meter, STARTER3100C- OHAUS) [22]. EC was measured using an EDT- BA-380 conductivity meter (Mi 170 Bench Meter—Martini, catalog number 970,808 kk), and TDS was calculated as parts per million using the following formula [23]:
TDS = conductivity (mS/cm) × 0.65
2.3.2. Chemical Parameters
The chemical parameters measured were calcium, chloride, and total alkalinity levels. The titration of water samples (25 mL) was performed using EDTA (0.01 M), silver nitrate (0.01 M), and sulfuric acid (0.02 N) solutions in order to determine the concentrations of calcium, chloride, and total alkalinity, respectively [24]. The concentration of each chemical was calculated as follows:
where C is the concentration of CaCO3 or Cl or the total alkalinity (mol/L), Vtitr represents the total volume of titrant needed to reach the inflection point (mL), Ctitr represents the titrant concentration (mol/L), Vsmp represents the sample volume (mL), and M is the molar mass of the chemical (g/moL).
2.3.3. Bacteriological Analysis
Media
Culture media are described below. All media were prepared using distilled water according to manufacturer instructions and sterilized via autoclaving for 45 min at 121 °C under a pressure of 6900 Pa. A cetrimide agar base (Himedia, Mumbai, India, 46.7 g/L + 1% glycerol), eosin methylene blue agar (Himedia, Mumbai, India, 35.96 g/L), Slanetz and Bartley agar (Himedia, Mumbai, India, 46.50 g/L) and mannitol salt agar (Oxoid Ltd., Cheshire, UK, 111 g/L) were used to detect P. aeruginosa, E. coli, Enterococcus faecalis (E. faecalis) and S. aureus, respectively. Bile esculin agar base (Conda, Torrejon de Ardoz, Madrid, 64.5 g/L) was used to confirm the detection of E. feacalis. Chromogenic coli/coliform (39.7 g/L) was used to detect E. coli, total coliforms, and fecal coliforms. Nutrient agar slants (28 g/L) and a nutrient broth (14 g/L) (Oxoid Ltd., Cheshire, UK) were used to preserve bacterial isolates. Purified bacteria were maintained on nutrient agar slants stored at 4 °C with regular transfer at monthly intervals. Mueller Hinton agar (Oxoid Ltd., Cheshire, UK, 38 g/L) was used for antibiotic susceptibility testing.
Bacterial Isolation and Storage
A membrane filtration technique was used for the isolation of bacteria according to the ISO standard 7704:1985 [25]. Water samples were filtered through a 0.45 μm membrane filter (Merck Millipore, Darmstadt, Germany). The membranes were then placed on selected media and incubated at a specific temperature for a selected period of time, after which the number of colonies formed (CFU: colony forming units) on each plate was enumerated. Colonies were purified on the same selected media.
Isolated bacteria were stored in glycerol following the cryopreservation method. Isolates were grown overnight in brain–heart infusion broth. The broth culture was then added to sterile, 50% glycerol (1:1) in a cryo-vial glass. The vials were mixed gently, and the stock cultures were stored immediately at −80 °C [26].
Heterotrophic Plate Count
Water samples were diluted ten-fold in a broth containing 0.1% peptone water. Diluted samples were added to R2A agar using the pour plate method and incubated at 37 °C. Plates with approximately 25–250 colonies were selected for counting. The CFU/100 mL was calculated according to the following equation:
CFU/100 mL = (number of colonies × dilution factor)/1
Bacterial Detection in Water Samples
- 1.
- Detection of E. coli and coliform bacteria
Water samples (250 mL) were filtered through the membrane filter. Membranes were placed over Liofilchem Chromatic Coli Coliform Agar, then incubated at 44 ± 1 °C for 24 ± 2 h or/and at 30 ± 1 °C for 24/48 h to identify fecal coliform bacteria and total coliform, respectively. Chromogenic media was used to differentiate between E. coli and other coliform bacteria or other bacteria that provided typical colonies with green, mauve, and colorless colors, respectively. The identification of colorless colonies was performed via Gram staining, potassium hydroxide, and MALDI-TOF-MS. Membrane filters were also placed over eosin methylene blue agar and incubated at 37 °C for 24/48 h to confirm the presence/absence of all E. coli strains that the chromogenic medium cannot identify. Colonies that were purple with black centers or green metallic sheen colonies revealed the presence of E. coli.
- 2.
- Detection of P. aeruginosa
Membrane filters were placed on cetrimide agar and then incubated at 36 °C for 44 ± 4 h. A growth of bacteria over the medium with a change of color to green indicated the presence of Pseudomonas. Confirmations of P. aeruginosa colonies were performed using the oxidase test and a MALDI-TOF-MS analysis.
- 3.
- Detection of intestinal Enterococcus
Membranes were placed on Slanetz and Bartley agar and the plates were incubated at 36 ± 2 °C for 44 ± 4 h. Further necessary confirmatory tests were performed after the preliminary identification, including the confirmation of black or brown color formation on bile esculin agar after incubation at 44 °C for 2 h, the negative catalase activity test, and a MALDI-TOF-MS analysis.
- 4.
- Detection of S. aureus
Membrane filters were placed on mannitol salt agar and incubated at 35 °C for 24 h. The growth of yellow/white colonies surrounded by yellow zones revealed the presence of S. aureus. Additional confirmation tests were performed, including the coagulase and catalase tests.
- 5.
- Bacterial identification via matrix-assisted laser desorption ionization–time of flight mass spectrometry (MALDI-TOF-MS)
Single colonies of each isolate obtained from an agar plate were deposited as a single spot on a target slide and allowed to dry at room temperature. E. coli ATCC8739 was used as a standard for calibration. One microliter of cyano-4-hydroxycinnamic acid matrix solution (a saturated solution of a cyano-4-hydroxycinnamic acid in 50% acetonitrile) was added to the samples in the dark. MALDI-TOF-MS analysis was performed on a VITEK MS instrument with a nitrogen laser (337 nm). Bacterial species were identified using the VITEK MS automation control and analyzed using Myla software according to the manufacturer’s specifications.
2.3.4. Antibacterial Susceptibility Testing
Inoculum Preparation
The standardized inoculum was used for susceptibility testing following McFarland standards. Bacterial isolates, sub-cultured to grow on nutrient agar, were suspended in nutrient broth (14 g/L) (Oxoid Ltd., Cheshire, UK). The suspensions were incubated overnight at 37 °C and 30 °C to reach a 0.5 McFarland standard (~equivalent to 1.5 × 10⁸ CFU/mL) [27].
Kirby–Bauer Disk Diffusion Method
The 0.5 McFarland test cultures were spread evenly over the entire surface of a Mueller–Hinton agar plate by streaking, using sterile cotton swabs in three different directions with a 60° plate rotation. Within 15 min of the inoculation, a total number of 12 tested antibiotic discs (Oxoid, UK) were used conveniently on the 100 mm plate, placed 24 mm apart. The plates were then inverted and incubated at 35 °C ± 2 °C at the times specified in Table 1. Interpretive criteria breakpoints were performed after recording the zone of inhibition according to the clinical and laboratory standards institute (CLSI, M100-S24).
Detection of Methicillin Resistance in Staphylococcus spp.
Cefoxitin was tested as a surrogate for oxacillin to detect methicillin resistance in staphylococcus spp. A cefoxitin screening test was performed by swabbing the tested isolates on a Mueller–Hinton agar plate and then adding the cefoxitin discs. The plates were incubated at 35 °C ± 2 °C for twenty-four hours. S. aureus isolates were reported as methicillin-resistant to cefoxitin. This was re-confirmed by the presence of the mecA gene.
2.4. Virulence Genes Detection
2.4.1. DNA Extraction
Genomic DNA was isolated from bacterial suspension cultures using a QIAamp® DNA Mini Kit (QIAGEN, cat # 56304) according to the manufacturer’s instructions. The absorbance of extracted DNA was measured at 260 and 280 nm using a spectrophotometer (UV-Visible)/Aqua Quest (CECIL) in order to assess its concentration and purity. DNA was used to amplify the virulence genes via PCR.
2.4.2. PCR Assay
Polymerase chain reaction (PCR) amplifications of clumping factor A (clfA), toxic shock syndrome toxin-1 (tsst-1), methicillin resistance gene (mecA), pseudolysin (lasB), and exotoxin A (toxA) genes were carried out in 25 μL volumes containing 1 μL of the DNA template, 1 μL of each forward and reverse primer (10 pmol/µL), 12.5 μL of Red Taq Ready Mix PCR reaction mix with MgCl2 (1.5 units of Taq DNA polymerase, 10 mM of tris-HCl, 50 mM of KCl, 1.5 mM of MgCl2, and 0.2 mM of dNTP), and deionized water to make up the volume. Amplifications were carried out in a Bio-Rad DNA thermal cycler (C1000TM/BioRAD C1000TM). After amplification, PCR products were subjected to electrophoresis on a 2% agarose gel containing ethidium bromide at 100 V for ~30 min along with 2 μL of a 100 bp DNA ladder. Bands were visualized using a UV trans-illuminator. Specific primers used for the amplification of the Staphylococcus aureus and Pseudomonas aeruginosa virulence genes, along with the amplicon size and annealing temperature, are shown in Table 2.
2.5. Statistical Analysis
Data entry, descriptive statistics, and statistical analysis were performed using IBM SPSS (Statistical Package for the Social Sciences) Ver. 24. A student t-test was performed for means comparison. A p-value ≤ 0.05 was considered significant.
3. Results
3.1. Analysis of Water Samples
The tested water samples were collected from 50 household tanks in the old city of Sidon, Lebanon. The household water tank profiles (water tank size, water tank type, and disinfection average/year, etc.) were collected. Approximately 16% of the houses were connected to one tank only, whereas 84% of the houses were connected to two tanks. The size of the storage tanks varied, with only 14% classified as small-size tanks and 86% classified as large ones. The majority of the lids were closed, with only 12% being open tanks. The water from these tanks came from a governmental source; unfortunately, the water was not supplied as regularly as it should have been, causing a high probability of occasionally having empty tanks during the year. Moreover, only 6% of the participating houses disinfected their tanks once per year. In most cases, the tap water received was used mainly for bathing, washing dishes, and, in a few cases, for drinking without filtration.
3.2. Physicochemical Assessment of Sampled Water
The mean pH of the tested water samples was 7.80 ± 0.27. The pH range was between 7.26 and 8.46, as is shown in Table 3. However, the average TDS of the water samples was 531.21 ± 66.55 mg/L, with values ranging between 249 and 683 mg/L. The mean chloride level in the collected samples was 77.27 ± 39.14 mg/L, with values between 28 and 163 mg/L. All the values of pH, TDS, and chloride levels fell within the WHO-recommended guidelines.
The mean EC was 817.24 ± 102.38 μS/cm, with an EC range between 383 μS/cm and 1051 μS/cm. However, the mean of the total alkalinity was 195.24 ± 36.52 mg/L, with values ranging between 120 and 286 mg/L. The mean level of the calcium hardness was 181.52 ± 37.29 mg/L and was therefore considered as hard according to WHO guidelines. Physicochemical parameters including the pH, EC, TDS, total alkalinity, and calcium hardness showed no significant difference within the samples in opposition to the chloride level.
3.3. Microbiological Assessment of Water Samples
The total number and the type of isolated bacteria were determined.
The results are summarized in Table 4.
A heterotrophic plate count was performed on all collected water samples. An average of 1.29 × 10⁹ CFU/100 mL was obtained, with a minimum of 30 CFU and a maximum of 64 × 109 CFU. The results were highly skewed, with a skewness of 7.07.
The total coliform number (n = 27/50, 54%) was isolated from the collected samples with a mean of 10.14 ± 17.24 CFU/100 mL. Thermotolerant coliforms (n = 10/50, 20%) were also detected, with a mean of 1.90 ± 5.25 CFU/100 mL. In addition, E. coli (n = 32/50, 16%) was detected in the samples and accounted for around three quarters of the positive thermo-tolerant coliform samples. The mean count of E. coli was 0.28 ± 0.78 CFU/100 mL, exceeding the WHO-recommended guidelines, which state that coliforms should not be detected in potable water. A significant variation was detected in the count of total coliforms, thermo-tolerant coliforms, and E. coli within all samples (%CV > 10).
A MALDI-TOF-MS analysis was used to identify the isolated coliform colonies. Leliottia amnigena (L. amnigena) and Serratia marescens (S. marescens) were detected as total coliforms, whereas Klebsiella oxytoca (K. oxytoca) and Raoultella orthinolytica (R. orthinolytica) were among the identified fecal coliform bacteria from the thermo-tolerant coliforms.
An additional microbial load was also detected. Intestinal Enterococcus and Staphylococcus (n = 34/50, 68%) were the most prevalent bacteria in the samples, with a mean of 14.12 ± 32.20 CFU/50 mL) and 8.50 ± 16.85 CFU/100 mL, respectively. Staphylococcal spp. that were also identified included Staphylococcus equorum (S. equorum) and Staphylococcus pasteuri (S. pasteuri). P. aeruginosa (n = 11/50, 22%) was found to be contaminating the tested water storage tanks with a mean of 4.78 ± 15.69 CFU/250 mL. A significant variation was detected in the count of intestinal Enterococcus, S. aureus, and P. aeruginosa within all samples (%CV > 10).
Moreover, different bacteria were detected via MALDI-TOF-MS analysis and were related to Pseudomonas spp. These included Pseudomonas putida (P. putida), Pseudomonas flourescens, Delftia acidovorans (D. acidovorans), and Stenotrophomonas maltophilia (S. maltophilia). Furthermore, Acinetobacter johnsonii (A. johnsonii) (n = 14/50, 28%) was identified in the collected samples.
3.4. Determination of Antibiotic Susceptibility Patterns
The appropriate antibiotics were used for each isolate according to the Clinical and Laboratory Standards Institute (CLSI). The resistance and intermediate resistance of bacterial isolates against the specified antibiotics were observed. Staphylococcus spp. (50% of the isolates), A. johnsonii (50%), and S. maltophilia (100%) were mostly resistant to trimethoprim-sulfamethoxazole. Intestinal enterococcus (40%) and E. coli (29%) were resistant to ampicillin, while P. aeruginosa isolates mostly resisted the aztreonam agent (18%). All Enterobacteriacaea isolates resisted cefoxitin, including K. oxytoca, S. marescens, and L. amnigena. Table 5 represents the percentage of antibiotic resistance and intermediate and sensitive isolates.
The number of antibiotics used for each bacterium was not constant. Bacteria were considered multi-drug resistant when they survived on three or more anti-bacterial agents. Half of the E. coli isolates and 18% of the A. johnsonii isolates were multi-drug resistant.
3.5. Screening Virulence Genes
Four virulence genes (clfA, tsst-1, lasB, and toxA) besides mecA were amplified in the studied Staphylococcus and Pseudomonas samples. Found in bacterial cells, mecA is a gene which allows bacteria to be resistant to antibiotics such as methicillin, penicillin, and other penicillin-like antibiotics. Exotoxins tsst-1 and may be expressed in S. aureus and P. aeruginosa, respectively. Both fibrinogen-binding protein (clfA) and zinc metalloprotease (lasB), which promote biofilm formation, can also exist in S. aureus and P. aeruginosa, respectively.
3.5.1. Methicillin-Resistant Staphylococcus Aureus (MRSA) and Virulence S. aureus Genes Detection
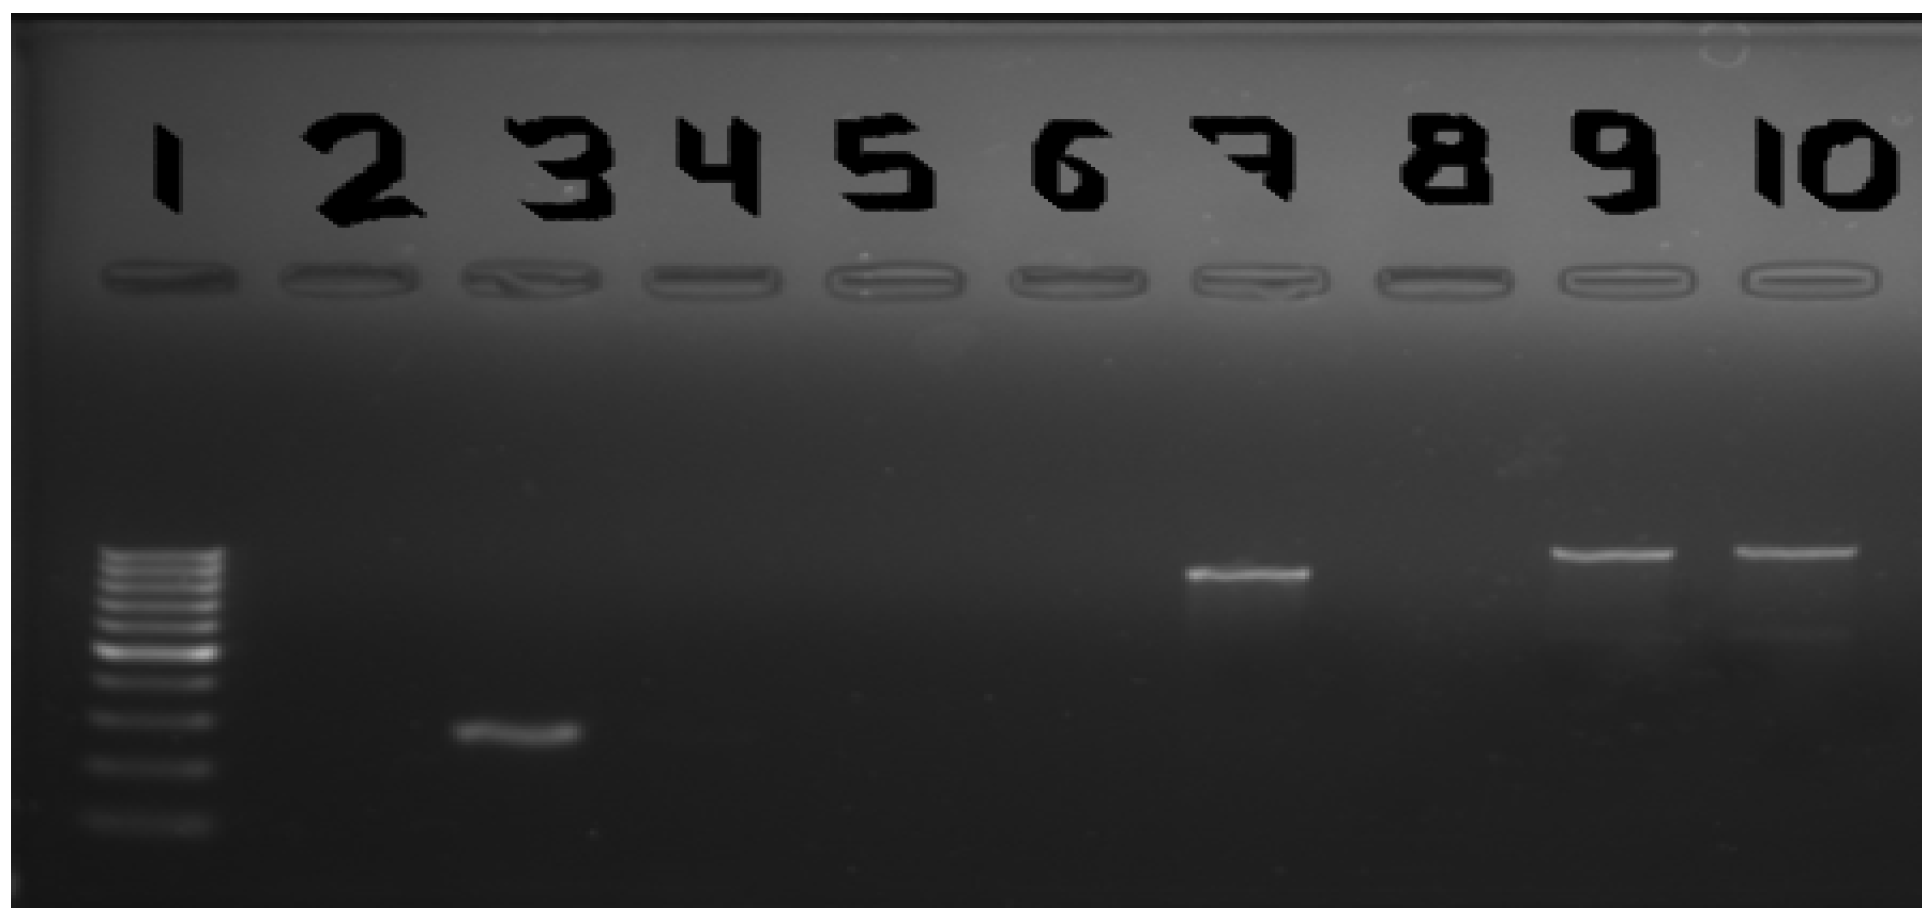
MRSA is the most common bacteria strain known to carry the mecA gene, which is a resistance gene consisting of 855 bp. Of the detected S. aureus samples, 21% were resistant to the cefoxitin agent. Moreover, all cefoxitin-resistant S. aureus isolates were assayed for the mecA gene by polymerase chain reaction (PCR). The tsst-1 gene, a virulence factor of 271 bp and clfA gene with a 980 bp clumping factor, was assayed in all the isolated S. aureus. Figure 1 shows the amplified mecA, tsst-1, and clfA genes in representative samples. Around 79.3% of the samples were mecA-negative and 20.7% were mecA-positive, confirming the cefoxitin disc test. The presence or absence of the mecA gene was correlated with the cefoxitin-susceptibility of S. aureus. The tsst-1 and clfA genes were found in 93.1% and 17.2% of the samples, respectively.
3.5.2. Virulence P. aeruginosa Genes Detection
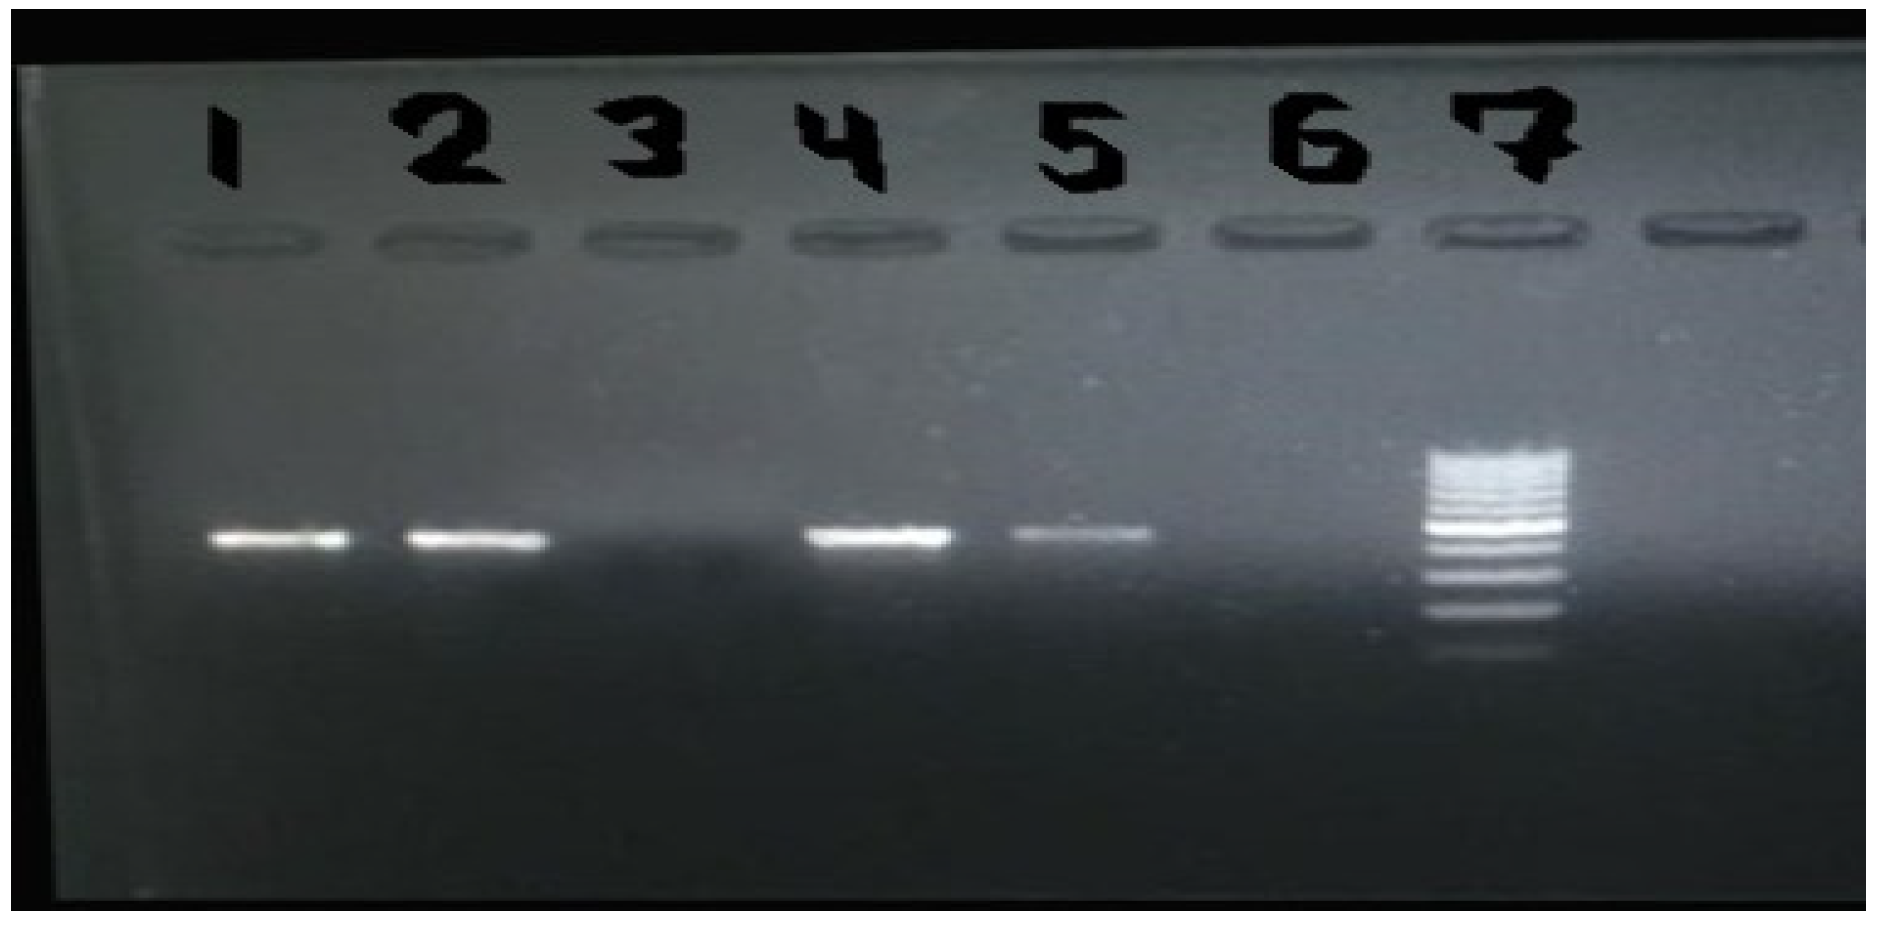
More than half (63.64%) of the P. aeruginosa isolates (n = 11) expressed the 454 bp toxA virulence gene. However, the 433 bp lasB virulence gene was found in only 36.36% of the isolates when compared to the toxA gene.
3.6. Correlation between Bacterial Levels and Type of Storage Tanks
A statistically significant difference was observed only between storage tank size and material with respect to bacterial contamination.
Large storage tanks had statistically significantly fewer Pseudomonas spp. contamination (3.09 ± 1.24 CFU/250 mL) when compared to small storage tanks (15.14 ± 14.15 CFU/250 mL), [t (48) =−1.936, p = 0.003, d = −0.78].
Iron tanks had statistically significantly higher E. coli contamination (1.00 ± 1.00 CFU/100 mL) when compared to plastic tanks (0.23 ± 0.10 CFU/100 mL), [t (48) =1.671, p = 0.008, d = 1].
4. Discussion
Water is essential to life and is recognized as a human right [31]. This study aimed to assess water quality in Sidon, Lebanon, by studying the physicochemical parameters, microbiological profiles, and their resistance patterns in domestic water that is stored in tanks and reaches homes through pipes with a high risk of deterioration. A structured questionnaire was used to gather information on socio-dynamics and the sanitary conditions of water storage tanks, comparable to a study performed in the Eastern Himalayan State [32].
As Lebanon suffers from high levels of water pollution, many studies have been conducted to assess the microbiological quality of water in rivers, such as the Litani river basin, and in wells [2,33]. However, few studies have been performed on domestic water, including assessing the demand, access, and institutional aspects of domestic water, such as the studies performed in the Bekaa valley and in the Beirut Shatila Refugee Camp [31,34]. No related studies were performed in Sidon, a Lebanese city located on the Mediterranean coast in south Lebanon that is comprised of several landmarks, including Chakrieh.
In this study, the average pH was found to fall within the WHO-recommended guidelines. The values were similar to those collected from both wells and municipality water sources in Beirut [35], from the storage tanks of developing countries [36], and from different sources in southeast Ethiopia [37].
Regarding EC, which is not associated with health standards, the average value was higher than that obtained from assessing drinking water in Beirut [35].
The mean TDS in this study slightly exceeded the USEPA limits (500 mg/L) but is considered less than the maximum allowable limit (1000 mg/L) recommended by the WHO. It is relatively lower than in tap water samples from southwest Ethiopia [37] and is also found in lower levels than in the domestic water in Beirut [35]. Water taste is altered when TDS levels exceed the WHO standards. TDS, indicating chloride levels and hardness, is not a health concern at the levels found in the drinking water, but it may affect the acceptability of the water [3]. Additionally, a recent study mentioned that elevated TDS levels can hide pathogenic microorganisms due to a reduction in water clarity [38].
Despite the absence of maximum permissible limits for total alkalinity, the mean of the total alkalinity was higher than that of the Beirut study [35]. Similarly, no significant difference in total alkalinity within the sampled water was obtained, unlike the significant difference presented among water sources [39]. Excess alkalinity is linked to a bitter taste of water and may trigger eye irritation, despite its regional inoffensive impact on humans [11].
The mean calcium hardness of the samples in this study exceeded the calcium hardness of Beirut’s water samples (181.52 mg/L vs. 135 mg/L) [35]. Thus, according to the WHO guidelines, water samples in Sidon can be classified as harder than those in Beirut [40].
Although there are no health standards concerning chloride in drinking water, USEPA and the WHO both set the secondary contaminant limits as 250 mg/L, based on a resulting unfavorable flavor and the possibility of boosting the corrosion of pipeline networks [41,42]. Thus, the chloride average was acceptable and was less than the average obtained by Korfali and Jurdi [35].
On the other hand, the microbial analysis of the household water tank samples showed that 46 out of 50 household water tanks were unsafe for consumption due to bacterial contaminants. Similar results are found in Dubai and the United Kingdom [19,43].
In this study, the heterotrophic bacterial count ranged between 30 and 64 × 109 CFU/mL, slightly more than a study performed in Ilorin with a range between 2.1 × 101 and 1.6 × 10⁸ CFU/mL [44]. Total coliforms were found in 54% of the examined storage tank samples. This result is similar to the result of samples taken from storage tanks in the urban cities of developing countries [36]. However, it is more than the total coliform amount found in wells upon assessing the domestic water quality in Beirut [35], tap water stored in storage tanks in Palestine [45], and water stored in household poly tanks in student hotels at the Korle-Bu teaching hospital in Ghana [46]. This confirms the vitality of regular inspection for the microbiological quality of drinking water and also alerts water consumers to the risk of illness that is associated with pathogenic microbial existence, such as intestinal infections.
S. marcescens and L. amnigena, which are total coliform bacteria, were identified using MALDI-TOF-MS analysis. Both bacteria were also identified in studies during the identification of coliform bacteria isolated from drinking water reservoirs and other sources of potable water [47,48].
Storage containers of all sizes were contaminated with total coliform and other bacteria. This result contradicts that of Chalchisa et al., who studied the effect of tank size on the quality of stored water [36]. They related the presence of total coliforms with the long storage times rather than to large storage tanks. This study also shows that the contamination of large storage tanks by Pseudomonas was less than the small tanks. This is related to the observed miserable status of the older small tanks used with respect to the large tanks. The measurement of physicochemical parameters can determine water quality.
Guidelines for Drinking-Water Quality (4th edition), published by the WHO, recommended thermo-tolerant coliforms or E. coli as a fecal indicator that should not be detected in drinking water [36,49]. Thus, the presence of thermo-tolerant coliforms in 20% of the studied samples reveals the deterioration of the water quality. Some studies recorded similar results upon testing positive results in 21% of household poly tank water samples [46]. Others noted the presence in 25.4% of the well water samples in the U.S.A. [37], and others found lesser extent of 15.3% [50], whereas all the water samples from storage tanks were positive in Ghana [51] and Bahir Dar [52].
The MALDI-TOF-MS analysis was able to discriminate K. oxytoca and R. ortninolytica from the isolated thermos-tolerant coliforms. K. oxytoca was previously detected when isolating Enterobacteriaceae from drinking water by 23 global laboratories [47]. On the other hand, R. orthinolytica, considered a pathogen, was detected in well-water samples in a recent study [53]. Furthermore, the isolated Enterobacteriacaea showed multi-drug resistance, in which the most-resisted agent was cefoxitin.
In the current study, E. coli was present in 16% of the samples, similar to the amounts in Ghana (17%) and Delhi (4–18%) [46,54].
Intestinal Enterococcus were the most predominant bacteria, contaminating 68% of the sampled storage tanks. This result exceeds the percentage of Enterococcal contamination of all household container samples from a study performed in Ecuador (17%) [55]. It is noted that Enterococci are not ubiquitous as coliforms. However, they can survive for a longer duration than fecal coliforms and have a higher resistance to drying and chlorination [3,56]. The resistance of Enterococci to ampicillin was detected at a similar level to the recorded high resistance from the study by Schwartz et al. [57].
P. aeruginosa was found in 25% of the collected samples. The current finding is relatively similar to the percentage detected in household water-tank samples in Dubai [15]. An aztreonam agent was mostly resisted by the pseudomonas isolates in our study. This agent was also mostly resisted in another study [58].
P. aeruginosa is a Gram-negative bacterium able to express virulence factors in both clinical and environmental isolates, contrary to other environmental bacteria [59]. Exotoxin A is an extracellular product important to host defense and is produced by 90% of P. aeruginosa. In response, toxA was screened in all isolated P. aeruginosa isolates (n = 11). This factor is the most toxic virulent factor in Pseudomonas [60]. Moreover, more than half of the isolates (63.64%) expressed the toxA gene, whereas the Las B gene, considered to be the most important virulence factor in P. aeruginosa [61], was expressed in only 36.36% of P. aeruginosa samples.
Although the study focused on enumerating the indicator organisms, the MALDI-TOF-MS analysis identified additional bacteria based on protein sequences. A. johnsonii was detected in 22% of the water samples. This genus, which belongs to Pseudomonadales order, was previously detected as an opportunistic pathogen in drinking water [62].
Several Pseudomonas spp. were also detected, including P. putida, P. fluorescens, and D. acidovorans, as well as S. maltophilia. D. acidovorans and Pseudomonas putida, which are not pathogenic in general [63]. S. maltophilia was one of the predominant bacteria found in home shower heads [54]. S. maltophilia and A. johnsonii isolates mostly resisted trimethoprim-sulfamethoxazole.
S. aureus was one of the predominant bacteria, detected in 68% of the collected samples. Its presence in large quantities in drinking water and its resistance to antibiotics probably increase its risk of affecting human health upon consumption. Only 20.7% of the isolated S. aureus in this study resisted cefoxitin and expressed the mecA gene. Hence, less than a quarter of the isolates are methicillin-resistant S. aureus.
Toxic shock syndrome toxin-1 (tsst-1) was found in 93.1% of the Gram-positive S. aureus isolates. The presence of this virulence gene may cause toxic shock syndrome if expressed [29]. It is diagnosed by fever, rash, hypotension, and other symptoms. The high prevalence shows the presence of tsst-1 in both MRSA and MSSA. Similar results were obtained by Koosha et al. [29].
Another virulence factor was monitored among the S. aureus isolates known as clfA. Clumping factor A is also recognized as an essential adhesion factor. The clfA gene was present in 17.2% of both isolated MRSA and MSSA. Similarly, a recent study showed that both MRSA and MSSA expressed clfA, causing human infection [64].
Two coagulase-negative staphylococci were also detected in our study. They were identified via MALDI-TOF-MS as S. pasteuri and S. equorum. S. pasteuri is known to contaminate drinking water [65,66]. Additionally, these two staphylococci can be found in wastewater [67]. Recently, SXT was used in treating staphylococcus-associated skin and soft-tissue infections [68]. However, 50% of the isolated Staphylococcus spp. resisted SXT.
As previously mentioned, the resistance of bacterial isolates to antibiotics was detected in this study. However, regardless of multi-drug resistant bacteria, sensitivity to drugs was dominant. Hence, these antibiotics can be used in treating bacterial infections.
5. Conclusions
In conclusion, this study shows that sampled water from the storage tanks in Sidon homes is of low quality, confirmed by the high bacterial loads. Most samples were contaminated with at least one bacterial indicator. This water should not be used either for drinking or domestic applications. While no health issues were detected concerning physiochemical parameters, an alteration of the water taste could result, according to the WHO guidelines for drinking water. Fortunately, there was a prevalence of sensitivity against tested antibiotics on bacterial isolates. However, virulence genes were detected in both Gram-positive (S. aureus) and Gram-negative bacteria (P. aeruginosa), inferring that this contaminated domestic water can lead to adverse health effects.
Author Contributions
Conceptualization: J.B., W.Z.; Methodology: W.Z.; Software: W.Z.; Validation: J.B., R.M.; Formal analysis: J.B., W.Z.; Investigation: S.K., M.M.; Resources: A.M.; Data curation: W.Z., S.K., M.M.; Writing-original draft preparation: A.M.; Writing-review and editing: R.M., A.M., M.M.; Visualization: J.B., A.M.; Supervision: J.B.; Project administration: J.B.; Funding acquisition: W.Z., R.M. All authors have read and agreed to the published version of the manuscript.
Funding
This research received no external funding.
Data Availability Statement
Data is unavailable due to privacy or ethical restrictions.
Conflicts of Interest
The authors reported no conflict of interest.
References
- Liska, D.; Mah, E.; Brisbois, T.; Barrios, P.L.; Baker, L.B.; Spriet, L.L. Narrative review of hydration and selected health outcomes in the general population. Nutrients 2019, 11, 70. [Google Scholar] [CrossRef] [Green Version]
- Houri, A.; El Jeblawi, S.W. Water quality assessment of Lebanese coastal rivers during dry season and pollution load into the Mediterranean Sea. J. Water Health 2007, 5, 615–623. [Google Scholar] [CrossRef]
- WHO. Guidelines for Drinking-Water Quality: Fourth Edition Incorporating First Addendum, 4th ed.; WHO: Geneva, Switzerland, 2017; Available online: https://apps.who.int/iris/handle/10665/254637 (accessed on 2 February 2020).
- Kilb, B.; Lange, B.; Schaule, G.; Flemming, H.C.; Wingender, J. Contamination of drinking water by coliforms from biofilms grown on rubber-coated valves. Int. J. Hyg. Environ. Health 2003, 206, 563–573. [Google Scholar] [CrossRef]
- Prüss-Üstün, A.; Bos, R.; Gore, F.; Bartram, J. Safer Water, Better Health: Costs, Benefits and Sustainability of Interventions to Protect and Promote Health; World Health Organization: Geneva, Switzerland, 2008. [Google Scholar]
- Shakoor, S.; Ahmed, I.; Mukhtiar, S.; Ahmed, I.; Hirani, F.; Sultana, S.; Hasan, R. High heterotrophic counts in potable water and antimicrobial resistance among indicator organisms in two peri-urban communities of Karachi, Pakistan. BMC Res. Notes 2018, 11, 1–6. [Google Scholar] [CrossRef]
- Akter, T.; Jhohura, F.T.; Akter, F.; Chowdhury, T.R.; Mistry, S.K.; Dey, D. Water Quality Index for measuring drinking water quality in rural Bangladesh: A crosssectional study. J. Health Popul. Nutr. 2016, 35, 4. [Google Scholar] [CrossRef] [Green Version]
- Mulamattathil, S.G.; Bezuidenhout, C.; Mbewe, M. Analysis of physico-chemical and bacteriological quality of drinking water in Mafikeng, South Africa. J. Water Health 2015, 13, 1143–1152. [Google Scholar] [CrossRef] [Green Version]
- Kulinkina, A.V.; Plummer, J.D.; Chui, K.K.H.; Kosinski, K.C.; Adomako-Adjei, T.; Egorov, A.I.; Naumova, E.N. Physicochemical parameters affecting the perception of borehole water quality in Ghana. Int. J. Hyg. Environ. Health 2017, 220, 990–997. [Google Scholar] [CrossRef]
- Nielsen, D.L.; Brock, M.A.; Rees, G.N.; Baldwin, D.S. Effects of increasing salinity on freshwater ecosystems in Australia. Aust. J. Bot. 2003, 51, 655–665. [Google Scholar] [CrossRef]
- Mahato, S.; Mahato, A.; Karna, P.K.; Balmiki, N. Investigating aquifer contamination and groundwater quality in eastern Terai region of Nepal. BMC Res. Notes 2018, 11, 321. [Google Scholar] [CrossRef] [Green Version]
- Lawson, E.O. Physico-Chemical Parameters and Heavy Metal Contents of Water from the Mangrove Swamps of Lagos Lagoon, Lagos, Nigeria. Adv. Biol. Res. 2011, 5, 8–21. [Google Scholar]
- Ashbolt Nicholas, J. Microbial Contamination of Drinking Water and Human Health from Community Water Systems. Curr. Environ. Health Rep. 2015, 2, 95–106. [Google Scholar] [CrossRef]
- Anwer, R.; Almarri, F.; Albogami, M.; Alahadib, F. MALDi-TOF MS for Rapid Analysis of Bacterial Pathogens Causing Urinary tract Infections in the Riyadh Region. Diseases 2022, 10, 78. [Google Scholar] [CrossRef]
- Khan, M.; AlMadani, A. Assessment of microbial quality in household water tanks in Dubai, United Arab Emirates. Environ. Eng. Res. 2017, 22, 55–60. [Google Scholar] [CrossRef] [Green Version]
- Adesoji, A.T.; Onuh, J.P.; Bagu, J.; Itohan, S.A. Prevalence and antibiogram study of Staphylococcus aureus isolated from clinical and selected drinking water of Dutsin-Ma, Katsina state, Nigeria. Afr. Health Sci. 2019, 19, 1385–1392. [Google Scholar] [CrossRef] [Green Version]
- Government of Lebanon, & United Nations. Lebanon Crisis Response Plan 2017-2020(2019 update) (Vol. 2020). 2019. Available online: https://www.unhcr.org/lb/wp-content/uploads/sites/16/2019/04/LCRP-EN-2019,pdf (accessed on 30 March 2020).
- Massoud, M.A.; Al-Abady, A.; Jurdi, M.; Nuwayhid, I. The challenges of sustainable access to safe drinking water in rural areas of developing countries: Case of Zawtar El-Charkieh, Southern Lebanon. J. Environ. Health 2010, 72, 24–30. [Google Scholar]
- CDR. Basic Services: Potable Water Supply. 2014. Available online: http://www.cdr.gov.lb/eng/progress_reports/pr102014/Ewater.pdf (accessed on 21 March 2020).
- Tran, T. Standard Methods For the Examination of Water and Wastewater, 23nd ed.; Rodger, B., Andrew, E., Eugene, R., Eds.; American Public Health Association, American Water Works Association, Water Environment Federation: Washington, DC, USA, 2017; Available online: https://www.academia.edu/38769108/Standard_Methods_For_the_Examination_of_Water_and_Wastewater_23nd_edition (accessed on 13 January 2020).
- 5667-21:2010; Water Quality—Sampling—Part 21: Guidance on Sampling of Drinking Water Distributed by Tankers or Means Other than Distribution Pipes. International Organization for Standardization: Geneva, Switzerland, 2010.
- 10523:1994; Water Quality—Determination of pH. International Organization for Standardization: Geneva, Switzerland, 1994.
- 7708:1985; Water Quality—Evaluation of Membrane Filters Used for Microbiological Analyses. International Organization for Standardization: Geneva, Switzerland, 1995.
- Sanaa, S.; Fosu Samuel Sebiawu, G.; Jackson, N.; Karikari, T. Assessment of the quality of groundwater for drinking purposes in the Upper West and Northern regions of Ghana. SpringerPlus 2016, 5, 2001. [Google Scholar] [CrossRef] [Green Version]
- Department of Water Affairs and Forestry. South African Water Quality Guidelines, 2nd ed.; Department of Water Affairs and Forestry: Cape Town, South Africa, 1996; Volume 1. [Google Scholar]
- Guo, N.; Wei, Q.; Xu, Y. Optimization of cryopreservation of pathogenic microbial strains. J. Biosaf. Biosecurity 2020, 2, 66–70. [Google Scholar] [CrossRef]
- Bayot, M.; Bragg, B. Antimicrobial Susceptibility Testing; StatPearls Publishing: Treasure Island, FL, USA, 2022. Available online: https://www.ncbi.nlm.nih.gov/books/NBK539714/ (accessed on 9 March 2020).
- Elsayed, M.S.; El-Bagoury, A.E.M.; Dawoud, M.A. Phenotypic and genotypic detection of virulence factors of Staphylococcus aureus isolated from clinical and subclinical mastitis in cattle and water buffaloes from different farms of Sadat City in Egypt. Vet. World 2015, 8, 1051–1058. [Google Scholar] [CrossRef] [Green Version]
- Koosha, R.Z.; Hosseini, H.M.; Aghdam, E.M.; Fooladi, A.A.I.; Tajandareh, S.G. Distribution of tsst-1 and mecA genes in Staphylococcus aureus isolated from clinical specimens. Jundishapur J. Microbiol. 2016, 9. [Google Scholar] [CrossRef] [Green Version]
- Morales-Espinosa, R.; Soberón-Chávez, G.; Delgado-Sapién, G.; Sandner-Miranda, L.; Méndez, J.L.; González-Valencia, G.; Cravioto, A. Genetic and phenotypic characterization of a Pseudomonas aeruginosa population with high frequency of genomic islands. PLoS ONE 2012, 7. [Google Scholar] [CrossRef]
- WHO/UNICEF. UN-Water Global Analysis and Assessment of Sanitation and Drinking-water (GLAAS)-Lebanon. 2015. Available online: www.who.int (accessed on 15 January 2022).
- Singh, A.K.; Das, S.; Singh, S.; Pradhan, N.; Gajamer, V.R.; Kumar, S.; Tiwari, H.K. Physicochemical parameters and alarming coliform count of the potable water of Eastern Himalayan state Sikkim: An indication of severe fecal contamination and immediate health risk. Front. Cell Dev. Biol. 2019, 7, 174. [Google Scholar] [CrossRef] [Green Version]
- Haydar, C.; Nehme, N.; Awad, S.; Koubayssi, B.; Fakih, M.; Yaacoub, A.; Hamieh, T. Physiochemical and Microbial Assessment of Water Quality in the Upper Litani River Basin, Lebanon. J. Environ. Earth Sci. 2014, 4, 87–97. [Google Scholar]
- Machayekhi, D.; Pierpaoli, M.; Cancelliere, G. Domestic Water in the Bekaa Valley, Lebanon Demand, Access and Institutional Aspects. 2017. Available online: http://pubs.iied.org/10179 (accessed on 23 January 2020).
- Korfali, S.I.; Jurdi, M. Assessment of domestic water quality: Case study, Beirut, Lebanon. Environ. Monit. Assess. 2007, 135, 241–251. [Google Scholar] [CrossRef] [PubMed]
- Chalchisa, D.; Megersa, M.; Beyene, A. Assessment of the quality of drinking water in storage tanks and its implication on the safety of urban water supply in developing countries. Environ. Syst. Res. 2018, 6, 1–6. [Google Scholar] [CrossRef] [Green Version]
- Yasin, M.; Ketema, T.; Bacha, K. Physico-chemical and bacteriological quality of drinking water of different sources, Jimma zone, Southwest Ethiopia. BMC Res. Notes 2015, 8, 541. [Google Scholar] [CrossRef] [Green Version]
- Bisi-Johnson, M.A.; Adediran, K.O.; Akinola, S.A.; Popoola, E.O.; Okoh, A.I. Comparative physicochemical and microbiological qualities of source and stored householdwaters in some selected communities in southwestern Nigeria. Sustainability 2017, 9, 454. [Google Scholar] [CrossRef] [Green Version]
- Sila, O.N. Physico-chemical and bacteriological quality of water sources in rural settings, a case study of Kenya, Africa. Sci. Afr. 2019, 2, e00018. [Google Scholar] [CrossRef]
- World Health Organization. Hardness in Drinking-Water: Background Document for Development of Who Guidelines for Drinking-Water Quality; World Health Organization: Geneva, Switzerland, 2010. [Google Scholar]
- Kumar, M.; Puri, A. A review of permissible limits of drinking water. Indian J. Occup. Environ. Med. 2012, 16, 40–44. [Google Scholar] [CrossRef]
- Wang, Y.; Yu, R.; Zhu, G. Evaluation of physicochemical characteristics in drinking water sources emphasized on fluoride: A case study of Yancheng, China. Int. J. Environ. Res. Public Health 2019, 16, 30. [Google Scholar] [CrossRef] [Green Version]
- Peter, A.; Routledge, E. Present-day monitoring underestimates the risk of exposure to pathogenic bacteria from cold water storage tanks. PLoS ONE 2018, 13, e0195635. [Google Scholar] [CrossRef]
- Sule, I.O.; Agbabiaka, T.O.; Akomolafe, A.V. Bacteriological Quality of Water Stored Exteriorly in Storage Tanks. Res. J. Environ. Sci. 2011, 5, 603–610. [Google Scholar] [CrossRef] [Green Version]
- Zaqoot, H.A.; Hamada, M.; El-Tabash, M.A. Investigation of drinking water quality in the kindergartens of Gaza Strip Governorates. J. Tethys 2016, 4, 88–99. [Google Scholar]
- Pesewu, G.; Norshie, V.; Boakye, N.; Olu-Taiwo, M.; Adjei, D.; Mills-Robertson, F.; Ayeh-Kumi, P. Bacteriological Assessment of the Quality of Water Stored in Household Poly Tanks in Student Hostels in the Korle-Bu Teaching Hospital, Accra, Ghana. Val. Int. J. 2014, 1, 194–202. [Google Scholar]
- Gavini, F.; Leclerc, H.; Mossel, D.A.A. Enterobacteriaceae of the “Coliform Group” in Drinking Water: Identification and Worldwide Distribution. Syst. Appl. Microbiol. 1985, 6, 312–318. [Google Scholar] [CrossRef]
- Kämpfer, P.; Nienhüser, A.; Packroff, G.; Wernicke, F.; Mehling, A.; Nixdorf, K.; Esser, M. Molecular identification of coliform bacteria isolated from drinking water reservoirs with traditional methods and the Colilert-18 system. Int. J. Hyg. Environ. Health 2008, 211, 374–384. [Google Scholar] [CrossRef]
- Bain, R.; Cronk, R.; Wright, J.; Yang, H.; Slaymaker, T.; Bartram, J. Fecal Contamination of Drinking-Water in Low- and Middle-Income Countries: A Systematic Review and Meta-Analysis. PLoS Med. 2014, 11, e1001644. [Google Scholar] [CrossRef] [Green Version]
- Murray, R.T.; Rosenberg Goldstein, R.E.; Maring, E.F.; Pee, D.G.; Aspinwall, K.; Wilson, S.M.; Sapkota, A.R. Prevalence of microbiological and chemical contaminants in private drinking water wells in maryland, usa. Int. J. Environ. Res. Public Health 2018, 15, 1686. [Google Scholar] [CrossRef] [PubMed] [Green Version]
- Akuffo, I.; Cobbina, S.J.; Alhassan, E.H.; Nkoom, M. Assessment Of The Quality Of Water Before And After Storage In The Nyankpala Community Of The Tolon-Kumbungu District, Ghana. Int. J. Sci. Technol. Res. 2013, 2, 221–227. [Google Scholar]
- Tabor, M.; Kibret, M.; Abera, B. Bacteriological and Physicochemical Quality of Drinking Water and Hygiene- Sanitation Practices of the Consumers in Bahir Dar City, Ethiopia. Ethiop. J. Health Sci. 2011, 21, 19. [Google Scholar] [CrossRef] [PubMed] [Green Version]
- Zou, H.; Berglund, B.; Xu, H.; Chi, X.; Zhao, Q.; Zhou, Z. Genetic characterization and virulence of a carbapenem-resistant Raoultella ornithinolytica isolated from well water carrying a novel megaplasmid containing blaNDM-1. Environ. Pollut. 2020, 260, 114041. [Google Scholar] [CrossRef]
- Yadav, N.; Singh, S.; Goyal, S.K. Effect of Seasonal Variation on Bacterial Inhabitants and Diversity in Drinking Water of an Office Building, Delhi. Air Soil Water Res. 2019, 12, 117862211988233. [Google Scholar] [CrossRef] [Green Version]
- Levy, K.; Nelson, K.L.; Hubbard, A.; Eisenberg, J.N.S. Rethinking indicators of microbial drinking water quality for health studies in tropical developing countries: Case study in northern coastal Ecuador. Am. J. Trop. Med. Hyg. 2012, 86, 499–507. [Google Scholar] [CrossRef] [PubMed]
- Mote, B.L.; Turner, J.W.; Lipp, E.K. Persistence and growth of the fecal indicator bacteria enterococci in detritus and natural estuarine plankton communities. Appl. Environ. Microbiol. 2012, 78, 2569–2577. [Google Scholar] [CrossRef] [Green Version]
- Schwartz, T.; Kohnen, W.; Jansen, B.; Obst, U. Detection of antibiotic-resistant bacteria and their resistance genes in wastewater, surface water, and drinking water biofilms. FEMS Microbiol. Ecol. 2003, 43, 325–335. [Google Scholar] [CrossRef]
- Ullah, A.; Durrani, R.; Ali, G.; Ahmed, S.H. Prevalence of antimicrobial resistant Pseudomonas aeruginosa in fresh water spring contaminated with domestic sewage. J. Biol. Food Sci. Res. 2012, 1, 19–22. [Google Scholar]
- Mena, K.D.; Gerba, C.P. Risk assessment of pseudomonas aeruginosa in water. Rev. Environ. Contam. Toxicol. 2009, 201, 71–115. [Google Scholar] [CrossRef]
- Wolf, P.; Elsässer-Beile, U. Pseudomonas exotoxin A: From virulence factor to anti-cancer agent. Int. J. Med. Microbiol. 2009, 299, 161–176. [Google Scholar] [CrossRef] [PubMed]
- Faraji, F.; Mahzounieh, M.; Ebrahimi, A.; Fallah, F.; Teymournejad, O.; Lajevardi, B. Molecular detection of virulence genes in Pseudomonas aeruginosa isolated from children with Cystic Fibrosis and burn wounds in Iran. Microb. Pathog. 2016, 99, 1–4. [Google Scholar] [CrossRef]
- Pindi, P.K.; Yadav, P.R.; Shanker, A.S. Identification of Opportunistic Pathogenic Bacteria in Drinking Water Samples of Different Rural Health Centers and Their Clinical Impacts on Humans. BioMed Res. Int. 2013, 2013, 348250. [Google Scholar] [CrossRef] [PubMed] [Green Version]
- Scales, B.S.; Dickson, R.P.; Lipuma, J.J.; Huffnagle, G.B. Microbiology, genomics, and clinical significance of the Pseudomonas fluorescens species complex, an unappreciated colonizer of humans. Clin. Microbiol. Rev. 2014, 27, 927–948. [Google Scholar] [CrossRef] [Green Version]
- McCarthy, H.; Rudkin, J.K.; Black, N.S.; Gallagher, L.; O’Neill, E.; O’Gara, J.P. Methicillin resistance and the biofilm phenotype in Staphylococcus aureus. Front. Cell. Infect. Microbiol. 2015, 5, 1. [Google Scholar] [CrossRef] [PubMed] [Green Version]
- Becker, K.; Heilmann, C.; Peters, G. Coagulase-negative staphylococci. Clin. Microbiol. Rev. 2014, 27, 870–926. [Google Scholar] [CrossRef] [PubMed] [Green Version]
- Faria, C.; Vaz-Moreira, I.; Serapicos, E.; Nunes, O.C.; Manaia, C.M. Antibiotic resistance in coagulase negative staphylococci isolated from wastewater and drinking water. Sci. Total Environ. 2009, 407, 3876–3882. [Google Scholar] [CrossRef] [PubMed]
- Gómez, P.; Lozano, C.; Benito, D.; Estepa, V.; Tenorio, C.; Zarazaga, M.; Torres, C. Characterization of staphylococci in urban wastewater treatment plants in Spain, with detection of methicillin resistant Staphylococcus aureus ST398. Environ. Pollut. 2016, 212, 71–76. [Google Scholar] [CrossRef]
- Bowen, A.C.; Carapetis, J.R.; Currie, B.J.; Fowler, V., Jr.; Chambers, H.F.; Tong, S.Y.C. Sulfamethoxazole-Trimethoprim (Cotrimoxazole) for Skin and Soft Tissue Infections Including Impetigo, Cellulitis, and Abscess. Open Forum Infect Dis. 2017, 4, ofx232. [Google Scholar] [CrossRef]
Figure 1.
DNA gel electrophoresis showing the mecA and virulence tsst-1 and the ClfA genes of S. aureus. Lane 1 represents a 100 bp DNA ladder; Lane 2 shows the negative control of tsst-1; Lane 3 shows an isolate expressing the 271 bp tsst-1 gene; Lanes 4 and 5 show two isolates that are tsst-1-negative.; Lane 6 shows the negative control of the mecA gene; Lane 7 shows an isolate expressing the amplified 855 bp mecA gene; Lane 8 shows the negative control of the Clf-A; and Lanes 9 and 10 show the amplified 980 bp ClfA gene from two isolates.

Figure 2.
DNA gel electrophoresis showing virulence gene bands of P. aeruginosa. Lanes 1 and 2 show two isolates expressing the 433 bp lasB gene; Lane 3 shows the negative control; Lanes 4 and 5 show two isolates expressing the 454 bp toxA gene; Lane 6 shows the toxA negative control; and Lane 7 shows a 100 bp DNA ladder.


Table 1.
Incubation conditions of bacterial isolates.
| Bacteria | Incubation Temperature | Incubation Period |
|---|---|---|
| Staphylococcus aureus | 35 °C ± 2 °C | 16–18 h; 24 h (CoNS and cefoxitin) |
| Enterococcus faecalis | 35 °C ± 2 °C | 16–18 h |
| Pseudomonas aeruginosa | 35 °C ± 2 °C | 16–18 h |
| Escherichia coli | 35 °C ± 2 °C | 16–18 h |
| Acinetobacter | 35 °C ± 2 °C | 20–24 h |
| Stenotrophomonas maltophilia | 35 °C ± 2 °C | 20–24 h |
| Enterobacteriaceae | 35 °C ± 2 °C | 16–18 h |
Table 2.
Characteristics of Screened Virulence Genes; F: forward, R: reverse, bp: base pair.
| Bacteria | Staphylococcus aureus | Pseudomonas aeruginosa | ||||
|---|---|---|---|---|---|---|
| Virulence gene | clfA | tsst-1 | mecA | lasB | toxA | |
| Amplicon Size | 980 bp | 271 bp | 855 bp | 433 pb | 454 pb | |
| Annealing temperature | 57 °C | 50.9 °C | 57 °C | 65 °C | 66.1 °C | |
| Primer sequence | F | 5′GGC TTCATGCTTAGG-3′ | 5′CTGGTATAGTAGTGGGTCTG3′ | 5′TGAGTTGAACCTGGTGAAGTT-3′ | 5′ACTGTCGCGGCCGCATTTCGTCAT3′ | 5′TCAGGGCGCACGAGAGCAACGAGA3′ |
| R | 5′TTTTCAGGGTCAATATAAGC3′ | 5′AGGTAGTTCTATTGGAGTAGG3′ | 5′TGGTATGTGGAAGTTAGATTGG-3′ | 5′CATCGCCGTGCCGTCCCAGTAGG3′ | 5′GACAGCCGCGCCGCCAGGTAGAGG3′ | |
| Reference | [28] | [29] | [29] | [30] | [30] | |
Table 3.
Physicochemical parameters of collected water samples.
| Minimum | Maximum | Mean ± SD | % Coefficient of Variation | WHO Guidelines | |
|---|---|---|---|---|---|
| pH | 7.26 | 8.46 | 7.80 ± 0.27 | 3.44 | 6.5–8.5 |
| TDS (mg/L) | 249 | 683 | 531.21 ± 66.55 | 12.97 | 1000 |
| Chloride (mg/L) | 28 | 163 | 77.27 ± 39.14 | 50.65 | 250 |
| EC (µs/cm) | 383 | 1051 | 817.24 ± 102.38 | 12.53 | - |
| Total alkalinity (mg/L) | 120 | 286 | 195.24 ± 36.52 | 18.71 | - |
| Calcium hardness (mg/L) | 88 | 244 | 181.52 ± 37.29 | 20.54 | 0–17: soft 17–60: slightly hard 60–120: moderately hard 120–180: hard >180: very hard |
Note: “–“ indicates no recommended maximum permissible values. pH, TDS, and EC stand for potential hydrogen, total dissolved solids, and electrical conductivity, respectively. SD: Standard deviation. The number of samples is 50.
Table 4.
Descriptive statistics of the enumerated bacterial isolates.
| Total Coliform (CFU/100 mL) | Fecal Coliform (CFU/100 mL) | E. coli (CFU/100 mL) | Enterococcus (CFU/50 mL) | Staphylococcus (CFU/100 mL) | Pseudomonas (CFU/250 mL) | |
|---|---|---|---|---|---|---|
| Mean | 10.14 | 1.90 | 0.28 | 14.12 | 8.50 | 4.78 |
| SD | 17.24 | 5.25 | 0.78 | 32.20 | 16.85 | 15.69 |
| %Coefficient of variation | 170 | 276 | 280 | 229 | 198 | 329 |
Table 5.
Percentages of antibiotic resistance, intermediate and sensitive (susceptible) isolates.
| Antibiotic Agent | % If Resistant | % If Sensitive | % If Intermediate | |
|---|---|---|---|---|
| Enterococcus faecalis (n = 35) | Ampicillin | 40% | 60% | 0% |
| E. coli (n = 8) | CEFEPIME (FEP) | 0% | 100% | 0% |
| CEFOXITIN (FOX) | 14% | 86% | 0% | |
| AMPICILLIN (AMP) | 29% | 43% | 29% | |
| CEFTAZIDIME (CAZ) | 14% | 86% | 0% | |
| AZTREONAM (ATM) | 14% | 86% | 0% | |
| TETRACYCLINE (TET) | 0% | 86% | 14% | |
| CEFPODXIME (CPD) | 0% | 86% | 14% | |
| MEROPENEM (MEM) | 0% | 100% | 0% | |
| CEFTRIAXONE (CRO) | 0% | 100% | 0% | |
| GENTAMICIN (GMN) | 0% | 100% | 0% | |
| CEFOTAXIME (CTX) | 0% | 100% | 0% | |
| TRIMETHOPRIM-SULFAMETHOXAZOLE (SXT) | 0% | 86% | 14% | |
| Staphylococcus spp.: S. aureus + S. pasteuri + S. equorum (n = 31) | CEFOXITIN (FOX) | 29% | 71% | 0% |
| TETRACYCLINE (TET) | 4% | 61% | 36% | |
| GENTAMYCIN (GMN) | 4% | 82% | 14% | |
| TRIMEYHOPRIM-SULFAMETHOXAZOLE (SXT) | 50% | 36% | 14% | |
| Pseudomonas aeruginosa (n = 11) | CEFEPIME (FEP) | 9% | 82% | 0% |
| CEFTAZIDIME (CAZ) | 9% | 73% | 18% | |
| AZTREONAM (ATM) | 18% | 73% | 9% | |
| GENTAMICIN (GMN) | 0% | 91% | 9% | |
| Acinetobacter johnsonii (n = 11) | CEFEPIME (FEP) | 29% | 36% | 36% |
| CEFTAZIDIME (CAZ) | 36% | 21% | 43% | |
| TETRACYCLINE (TET) | 0% | 86% | 14% | |
| MEROPENEM (MEM) | 0% | 93% | 7% | |
| CEFTRIAXONE (CRO) | 7% | 57% | 36% | |
| GENTAMICIN (GMN) | 0% | 93% | 7% | |
| CEFOTAXIME (CTX) | 21% | 36% | 43% | |
| TRIMEYHOPRIM-SULFAMETHOXAZOLE (SXT) | 50% | 43% | 7% | |
| Other Enterobacteriaceae (n = 5) | CEFEPIME (FEP) | 20% | 60% | 20% |
| CEFOXITIN (FOX) | 100% | 0% | 0% | |
| AMPICILLIN (AMP) | 60% | 40% | 0% | |
| CEFTAZIDIME (CAZ) | 40% | 40% | 20% | |
| AZTREONAM (ATM) | 20% | 60% | 20% | |
| TETRACYCLINE (TET) | 0% | 80% | 20% | |
| CEFPODXIME (CPD) | 80% | 20% | 0% | |
| MEROPENEM (MEM) | 0% | 100% | 0% | |
| CEFTRIAXONE (CRO) | 60% | 40% | 0% | |
| GENTAMICIN (GMN) | 0% | 80% | 20% | |
| CEFOTAXIME (CTX) | 20% | 40% | 40% | |
| TRIMEYHOPRIM-SULFAMETHOXAZOLE (SXT) | 40% | 40% | 20% | |
| Stenotrophomonas maltophilia (n = 1) | TRIMEYHOPRIM-SULFAMETHOXAZOLE (SXT) | 100% | 0% | 0% |
Disclaimer/Publisher’s Note: The statements, opinions and data contained in all publications are solely those of the individual author(s) and contributor(s) and not of MDPI and/or the editor(s). MDPI and/or the editor(s) disclaim responsibility for any injury to people or property resulting from any ideas, methods, instructions or products referred to in the content. |
© 2023 by the authors. Licensee MDPI, Basel, Switzerland. This article is an open access article distributed under the terms and conditions of the Creative Commons Attribution (CC BY) license (https://creativecommons.org/licenses/by/4.0/).
Share and Cite
MDPI and ACS Style
Borjac, J.; Zeino, W.; Matar, A.; Khawaja, S.; Merheb, M.; Matar, R. Prevalence of Antibiotic-Resistant Bacteria in Domestic Water Storage Tanks in Sidon, Lebanon. Water 2023, 15, 335. https://doi.org/10.3390/w15020335
AMA Style
Borjac J, Zeino W, Matar A, Khawaja S, Merheb M, Matar R. Prevalence of Antibiotic-Resistant Bacteria in Domestic Water Storage Tanks in Sidon, Lebanon. Water. 2023; 15(2):335. https://doi.org/10.3390/w15020335
Chicago/Turabian StyleBorjac, Jamilah, Wafaa Zeino, Alaa Matar, Salwa Khawaja, Maxime Merheb, and Rachel Matar. 2023. "Prevalence of Antibiotic-Resistant Bacteria in Domestic Water Storage Tanks in Sidon, Lebanon" Water 15, no. 2: 335. https://doi.org/10.3390/w15020335
Note that from the first issue of 2016, this journal uses article numbers instead of page numbers. See further details here.