
The Impact of Tidal Straining and Advection on the Stratification in a Partially Mixed Estuary

1
College of Hydraulic Science and Engineering, Yangzhou University, Yangzhou 225000, China
2
Institute of Estuarine and Coastal Research, School of Marine Engineering and Technology, Sun Yat-sen University, Guangzhou 510275, China
*
Author to whom correspondence should be addressed.
Water 2023, 15(2), 339; https://doi.org/10.3390/w15020339
Submission received: 14 July 2022
/
Revised: 9 December 2022
/
Accepted: 11 January 2023
/
Published: 13 January 2023
(This article belongs to the Section Oceans and Coastal Zones)
Abstract
:Stratification and mixing of the water column is an important dynamic process in the estuary, which plays a significant role in the estuarine circulation, mass transport and energy exchange. Based on the multi-station synchronous observation data from 26 February to 6 March in 2011 during dry season in the North Channel of the Changjiang Estuary, the Richardson number, the Simpson number and the potential energy anomaly of water were calculated to analyze the tidal variation of the mixing and stratification processes. The roles of the depth-mean straining, longitudinal advection, non-mean straining and tidal stirring in the processes of mixing and stratification of the water column were analyzed by calculating the contribution terms of the time-derivative of potential energy anomaly. The results show that the mixing and stratification of the water column in the North Channel have significant spatiotemporal variation. Stability of the stratification gradually decreases from neap tide to spring tide. In the reaches of salt wedge migration, permanent stratification develops during neap and mean tide, with stability increasing on the flood and decreasing on the ebb, which is dominated by longitudinal advection. During spring tide, periodic stratification develops, with development of stratification on the flood and its breakdown on the ebb, which is dominated by longitudinal advection and tidal stirring. In the main reaches of saltwater intrusion, permanent stratification develops during neap tide, with stability increasing on the ebb and decreasing on the flood, which is dominated by depth-mean tidal straining. During mean and spring tide, periodic stratification occurs, with development of stratification on the ebb and its breakdown on the flood, which is controlled by depth-mean tidal straining and assisted by tidal stirring. In the North Channel, tidal advection is the main stratifying agent in the salt wedge migration reaches, and tidal straining is the main stratifying agent in the main reaches of saltwater intrusion.
1. Introduction
Stratification and mixing of the water column are important physical processes in estuaries, which have important effects on the exchange and transport of various substances, e.g., salt, sediments, nutrients and pollutant. Unravelling the subtle balance of forces in estuarine dynamics and mixing remains a major challenge for estuarine oceanographers [1].
Estuarine stratification caused by vertical salinity difference was first found in the Tay estuary in 1816 [2]. The phenomenon and driving mechanisms of salt-induced stratification in tidal estuaries have been intensively studied during the past decades [3,4,5,6]. Gravitational circulation could enhance stratification of the estuary, which drives low-density surface water moving towards the ocean and high-density bottom water moving towards the river. Moreover, tidal straining acts on the horizontal density gradient in a way that tends to produce periodic stratification with stability increasing on the ebb and decreasing on the flood [3]. Simpson and Britter found that shear instability was the main physical mechanism of mixing when they studied the properties of gravitational circulation [4]. Wind could strengthen the vertical momentum exchange of water column and weaken both stratification and gravitational circulation [5]. The tidal stirring was the main force that promotes mixing of the water column in tidal estuaries [6].
Potential energy anomaly (Φ) was proposed by Simpson to quantify the stability of the water column, defined as the amount of mechanical energy required to instantaneously homogenize the water column [7]. Further, a universal law of estuarine mixing for long-term averaged estuaries based on isohaline volumes was derived by Hans Burchard [8]. As a convenient measure, potential energy anomaly was widely used to quantify stability of the water column from field measurements [9,10,11].
Furthermore, many scholars have derived dynamic equations for Φ to unravel the main physical mechanisms that caused stratification and de-stratification processes in the estuary. Simpson derived a longitudinal one-dimensional Φ-equation, including tidal straining, gravitational circulation and tidal stirring [3]. Pu et al. unraveled river effects from tidal straining term by decomposing the flow into tidal flow and river flow when analyzing the stratification of the North Passage in the Changjiang estuary based on Simpson’s Φ-equation [12]. Recently, the Simpson’s Φ-equation was extended by taking into account the vertical difference of the horizontal density gradient, including depth-mean straining, advection, non-mean straining and tidal stirring [13]. Additionally, a three-dimensional Φ-equation was derived based on the dynamic equations for potential temperature and salinity, the continuity equation and an equation of state for the potential density, which provides a tool for numerically quantifying all terms relevant for generation and destruction of stratification [1,14].
Studies on the stratification of the Changjiang Estuary mainly focused on the North Passage [12,13], and the main driving mechanisms are tidal advection, tidal straining, river effects and tidal stirring. There are few studies on the stratification of the other three outlets of the Changjiang Estuary. The research area of this study is the North Channel of the Changjiang Estuary. The North channel is greatly affected by saltwater intrusion, upstream of which is located the Qingcaosha reservoir, the main drinking water source of Shanghai. The main objective of this paper is to illustrate the characteristics of tidal and fortnightly variation of the mixing and stratification processes and unravel the main physical mechanisms controlling the mixing and stratification processes, with emphasis on the tidal straining and tidal advection. This research can add knowledge to understanding the characteristics and mechanisms of the tidal and fortnightly cycle of stratification in partially mixed estuaries. In addition, the research has great significance for understanding the characteristics of saltwater intrusion in the study area and ensuring the water supply safety of Shanghai. When the discharge of Datong station, which is the upstream tidal limit of the estuary, is less than 18,000 m3/s in the dry season, Qingcaosha Reservoir may be threatened by saline intrusion [15], so this study focuses on the dry season.
This paper is organized as follows. First, the research area, field observation data and research methods are introduced in the second section. Afterwards, the characteristics of tidal current and salt intrusion are described in Section 3.1 and Section 3.2. In Section 3.3, the characteristics of tidal and fortnightly variation of the mixing and stratification process are discussed by analyzing the gradient Richardson number (Ri), Simpson number (Si) and Φ of the water column. In Section 3.4, the main physical mechanisms controlling the mixing and stratification processes are unraveled by analyzing the main contribution terms of the time-derivative of Φ, including depth-mean straining, advection, non-mean straining and tidal stirring. Finally, the discussion is presented in Section 4 and the conclusion is given in Section 5.
2. Research Area and Research Methods
2.1. Research Area
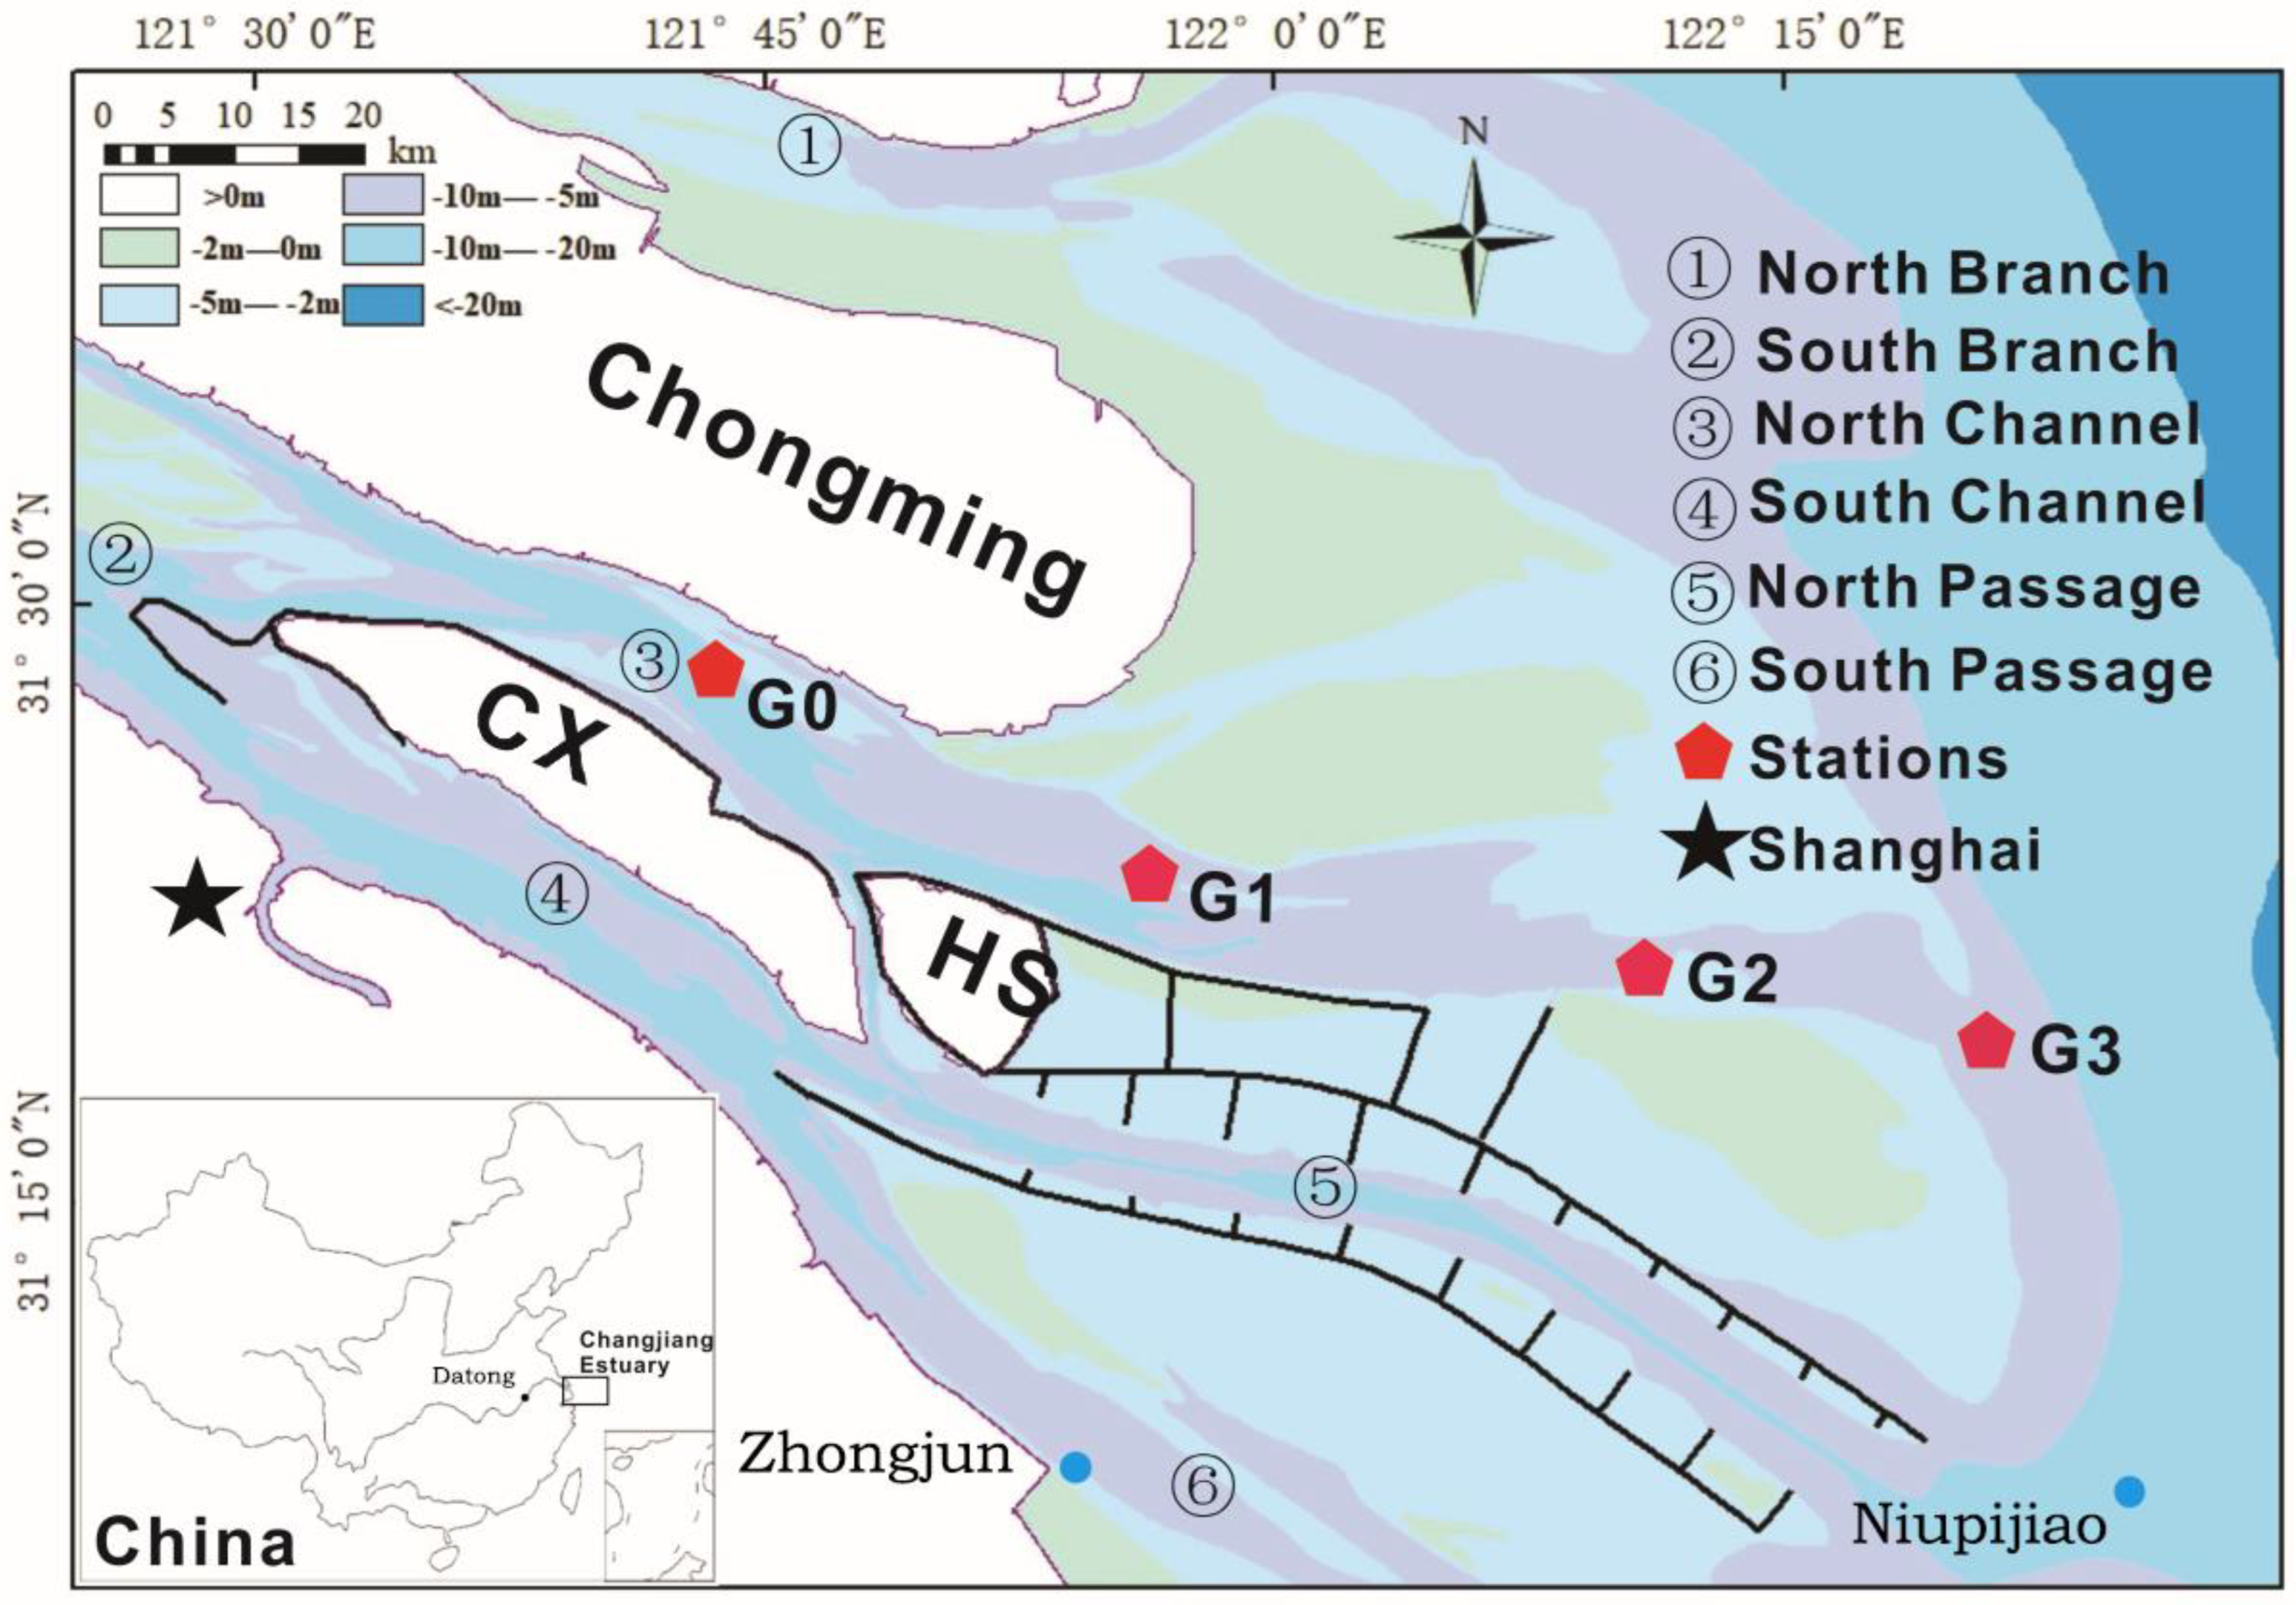
The Changjiang Estuary is the seaward end of the Changjiang River, with a length of 120 km and a width of 90 km at its outer limit [16]. It is a triple-bifurcation four-outlet system, including the North Branch, South Branch, North Channel, South Channel, North Passage, and South Passage [17]. The North Channel is the second-order braided channel of the Changjiang Estuary, located in the lower reaches of the Southern Branch, to the north of Changxing Island, Hengsha Island and East Beach of Hengsha, to the south of Chongming Island and Chongming east shoal (Figure 1).
The Changjiang Estuary had an annual mean freshwater discharge of 28,300 m3/s (Datong gauging station) from 1950 to 2010 [18]. The monthly averaged discharge of the Changjiang River varies from 104 m3/s during the dry season (from May to October) to 4 × 10⁴ m3/s during the wet season (from November to April) [17]; 51.03% of the Yangtze River fresh water is exported from the North Channel [19]. Tides are irregular semidiurnal, with a mean and maximum tidal range of about 2.67 m and 4.62 m at Zhongjun station [20]. The main tidal constituents are O1, K1, M2 and S2, with amplitudes of 0.2 m, 0.3 m, 1.3 m and 0.6 m at Niupijiao station [21]. The average flood and ebb duration are 5 and 7.5 h, respectively [22]. The salinity of the North Channel increases from the river to the sea. The North Channel is greatly affected by saltwater intrusion and is characterized as a partially stratified estuary [23].
2.2. Research Data
In this paper, the synchronous observation data of 4 stations (G0, G1, G2 and G3) were collected in the North Channel of the Changjiang Estuary during the dry season, from 26 February to 6 March in 2011 (Figure 1). The data included water depth, current velocity and direction, and salinity. The measurements were taken by the Changjiang Estuary Waterway Administration Bureau, Ministry of Transport of China. An Acoustic Doppler Current Profiler (ADCP) was used to measure the vertical velocity profile and water depth, and water samples were collected at six locations with relative depth to sea surface of 0, 0.2, 0.6, 0.8 and 1 per hour at each station to analyze the salinity in the lab.
2.3. Data Analysis
Based on the measured data above, the Gradient Richardson Number (Ri), Simpson Number (Si) and Potential Energy Anomaly (Φ) of the water column were calculated to analyze the tidal and fortnightly variation of the stratification. Following Wang et al. [13], the extended Simpson’s one-dimensional Φ equation was used to analyze the driving mechanism of mixing and stratification processes, by calculating the contribution terms of the time derivative of Φ.
2.3.1. Gradient Richardson Number (Ri)
Bowden [24] first applied Ri to the study of mixing and stratification in estuaries. Ri is a comparison of the stabilizing forces of the density stratification to the destabilizing influences of velocity shear and is defined by
where is the gravitational acceleration, z is the vertical coordinate, is the vertical density profile over the water column, is the reference density of water column, is the vertical density gradient, is the vertical velocity gradient. When < 0.25, the water column is unstable, which implies that the stratification breaks down. When > 0.25, the water column is stable, and stratification remains [25].
2.3.2. Simpson Number (Si)
Simpson et al. [3] proposed that the condition for the occurrence of strain-induced periodic stratification (SIPS) is that the average input of time derivative of Φ by tidal straining over the ebb half-cycle is larger than the mean tidal stirring power over the same period. Monismith and Fong [26] derived the dimensionless parameter Si to measure the equilibrium between tidal straining and turbulent mixing:
where is the frictional velocity, Cd = 0.0025 is the drag coefficient, Ubottom is amplitude of bottom tidal current velocity, is the depth-mean density, is the longitudinal gradient of depth-mean density, and h is the water depth. According to the evaluation criteria of Becherer et al., ≤ 0.088 represents a completely mixed state, 0.088 < < 0.84 represents SIPS state, and ≥ 0.84 represents permanently stratified [27].
2.3.3. Potential Energy Anomaly (Φ)
The Φ (J/m3) is the amount of energy per unit volume required to instantaneously homogenize the water column with a given density stratification [3]:
where is the vertical density profile, is the depth-mean density, h is the water column depth, is the water surface fluctuation, z is the vertical coordinate, and g is the gravitational acceleration.
Following Wang et al.’s approach [13], the time derivative of Φ () can be written as
where Sx is the depth-mean straining term, Ax is the longitudinal advection term, Nx is the non-mean straining term, Tx is the tidal stirring term, t is the time, is the depth-mean horizontal velocity, is the deviation from the depth-mean horizontal velocity, and is the deviation from the longitudinal gradient of depth-mean density. The parameter ε = 0.004 is related to the mixing efficiency, and is the amplitude of the depth-mean velocity. If the contribution term Sx, Ax, Nx, or Tx is positive, it indicates that this mechanism induces the increase in and stabilization of the stratification. On the contrary, if the contribution term is negative, it indicates that this mechanism drives water mixing.
3. Results
3.1. Characteristics of Tides
During observation periods, the mean tidal ranges of neap, mean and spring tides in the North Channel are 1.48 m, 2.33 m, and 3.50 m, respectively (Table 1). The mean tidal range gradually decreases from sea to land. The tidal amplitude attenuations of neap, mean and spring tides from lower end to upper end of the North Channel are 29.4%, 46.7% and 44.2%, respectively. Mean flood durations in neap, mean and spring tides are 7 h, 5.5 h and 5 h, respectively. The along-channel variation of flood duration is not significant, and the decrease in flood duration is obvious only between the G3 and G2 station during spring tide. The mean flood current velocities of neap, mean and spring tides are 0.33 m/s, 0.66 m/s and 0.68 m/s, respectively, while the mean ebb current velocities are 0.34 m/s, 0.80 m/s and 0.98 m/s; the latter is 1.0, 1.2, 1.4 times the former, respectively. The tidal mean velocities of flood and ebb tide in spring tide are 2.1 and 2.9 times of that in neap tide. The flood mean velocity increases from the G3 to the G2 station and then decreases from the G2 to the G0 station, while the ebb mean velocity increases from the G0 to the G1 station and then decreases from the G1 to the G3 station.
Generally, the tidal current in the middle reaches is stronger than that of the upper and lower reaches, and the tidal dynamics in spring tide are much stronger than those in neap tide. The ebb mean velocity is greater than flood mean velocity, indicating ebb-dominated dynamics. The lateral velocity is much smaller than the longitudinal velocity, indicating the dominance of longitudinal dynamics.
3.2. Characteristics of Salinity
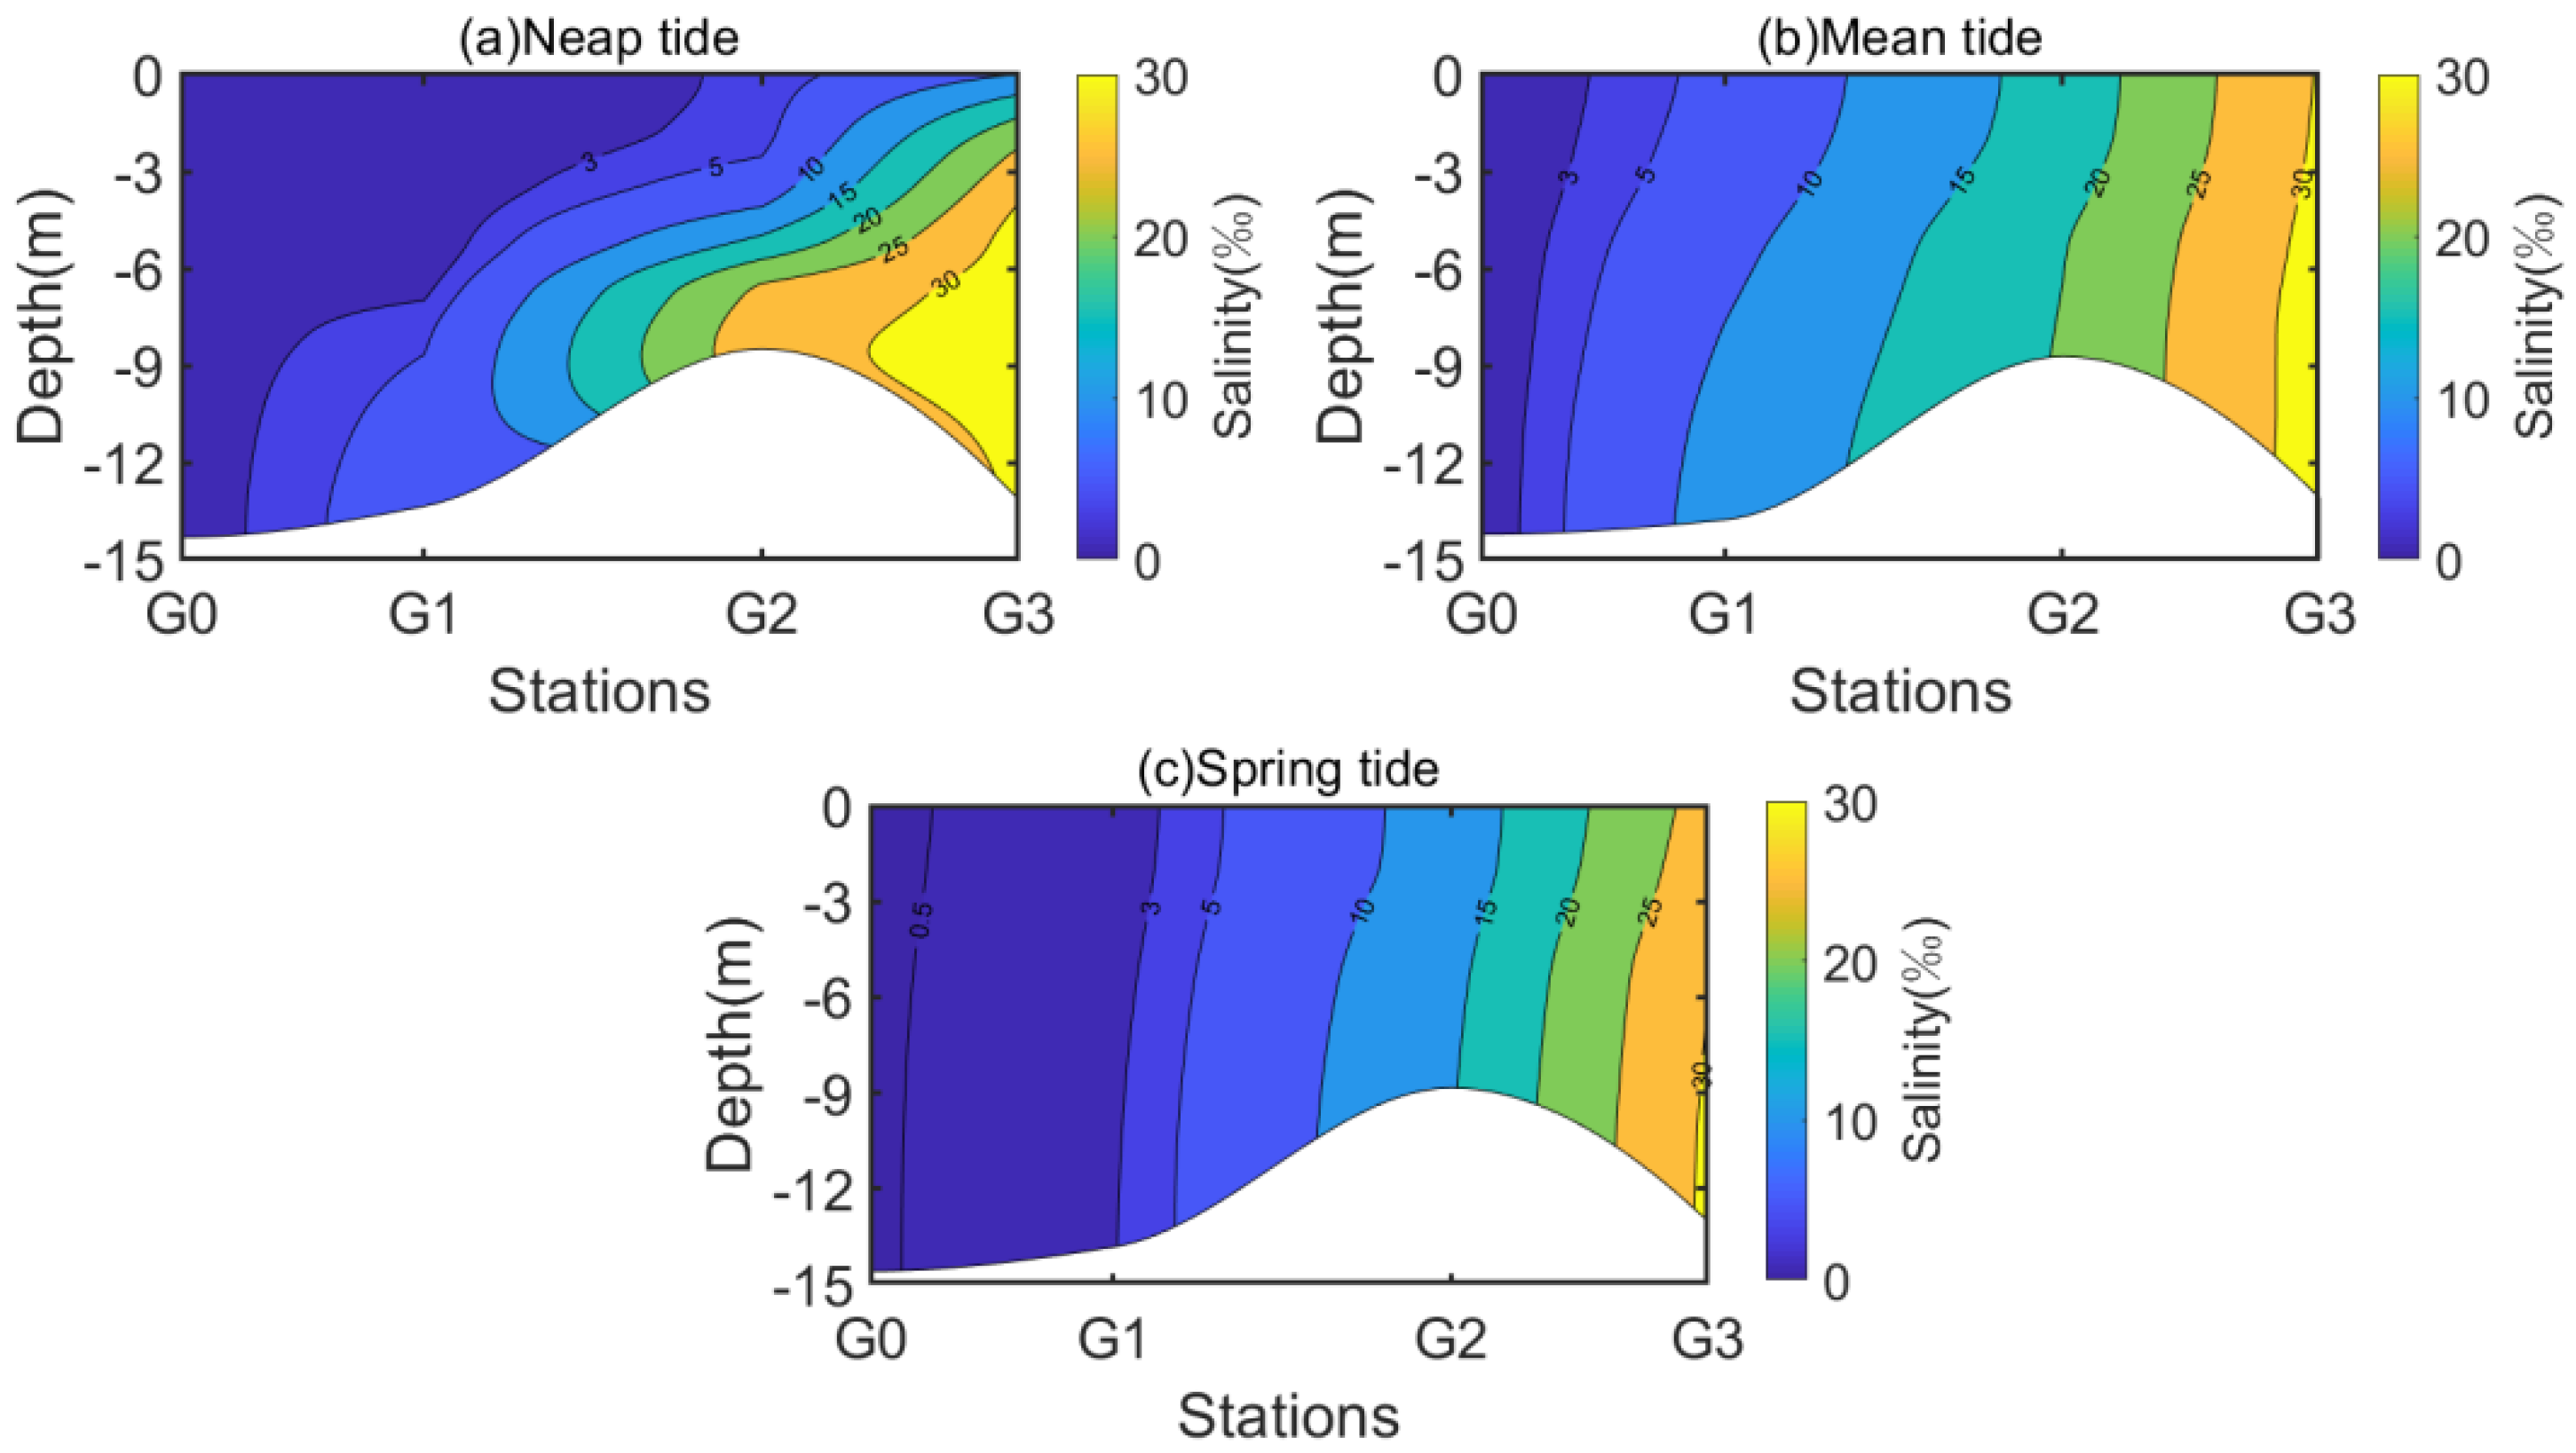
According to the spatial distribution of the tidal mean salinity, during neap tide, the salinity difference between the surface and bottom layer is significant, and the distribution of salinity is characterized by a highly stratified estuary (Figure 2). During mean and spring tide, there are vertical and longitudinal gradients of the salinity, but the vertical salinity gradient is much smaller than that in the neap tide; the distribution of salinity is characterized as a partially mixed estuary.
The mean vertical salinity gradients are 1.71 kg/m4, 0.33 kg/m4, 0.23 kg/m4 during the neap, mean and spring tide, respectively, which is the largest in neap tide and the smallest in spring tide, and the former is 7.43 times that of the latter (Table 2). The mean longitudinal salinity gradients are 0.31 × 10⁻³ kg/m4, 0.49 × 10⁻³ kg/m4, and 0.62 × 10⁻³ kg/m4 during the neap, mean and spring tide, respectively, which is the largest in spring tide and the smallest in neap tide.
According to the depth mean salinity, flood-mean salinity is slightly lower than ebb-mean salinity during spring tide, while flood-mean salinity is larger than ebb-mean salinity during mean and neap tide. Tidal mean salinity shows significant fortnightly variation, characterized by the largest salinity in mean tide followed by spring and neap tide (Table 3).
During spring tide, the G0 station is located in the freshwater zone, with tidal mean salinity less than 0.5‰, while during neap and mean tide, it is located around the upstream limit of saline water intrusion with a tidal mean salinity less than 1.5‰ (Table 3). Hence, the stratification and mixing is negligible at the G0 station. The G1 station and reaches below G1 are greatly affected by the saline water intrusion, with tidal mean salinity much larger than 0.5‰, so analysis of mixing and stratification processes are based on the G1, G2 and G3 stations.
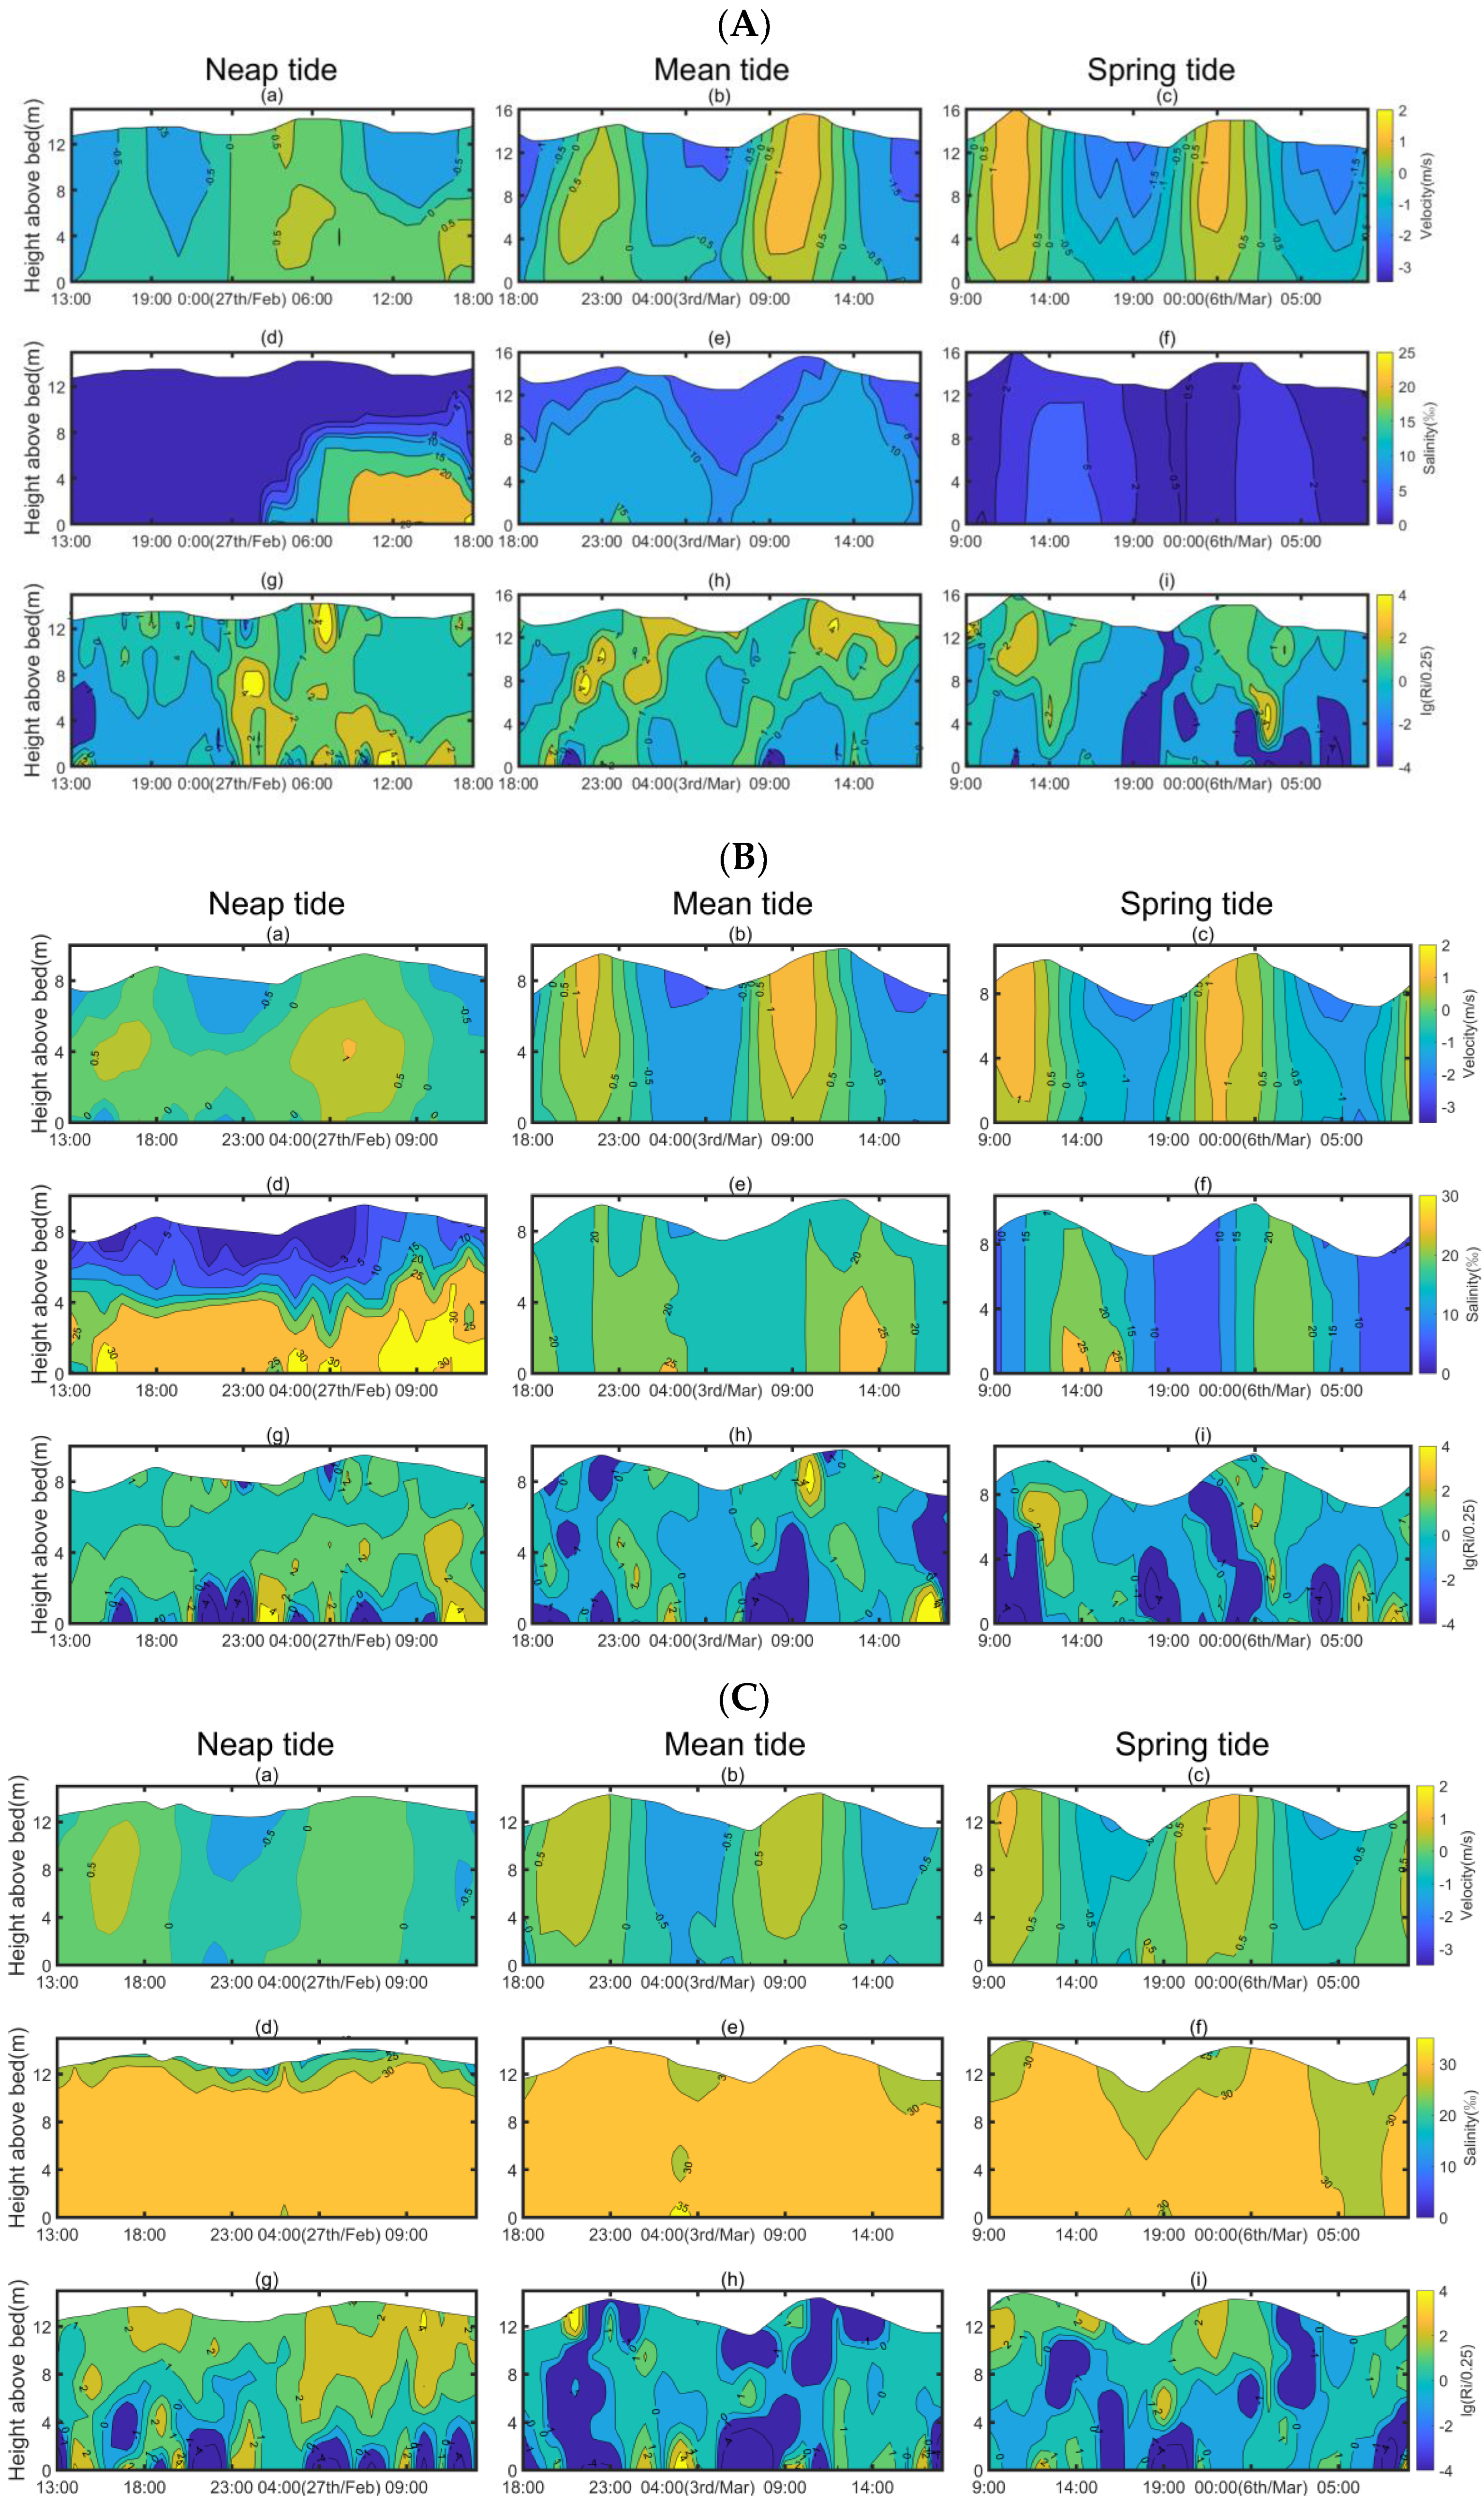
At the G1 station in the upper reaches, there is evident salt wedge movement during neap tide (Figure 3A). The saline wedge moves upstream on the flood and early ebb. The salinity increases on the flood and decreases on the ebb. The mean salinity difference between the surface and bottom layers is the largest in neap tide, followed by mean tide and spring tide. The maximum salinity of the surface and bottom layers is 1.12‰ and 22.53‰, respectively. The salt wedge retreats during the middle and late ebb, and withdraws completely at low water slack. During mean and spring tide, the salinity isolines of 8–15‰ and 5–7‰ migrate at the bottom of this station with the tide, respectively. The G1 station can be considered as a typical station in active reaches of the saline wedge.
In the middle reaches, the salinity of the G2 station is significantly higher than that of the G1 station, and the bottom salinity reaches the maximum around high water slack (Figure 3B). In the tidal cycle, the salinity increases during middle and late flood and early ebb, and decreases during middle and late ebb and early flood. The mean salinity difference between the surface and bottom layers is the largest in neap tide, followed by mean tide and spring tide. The bottom salinity in neap tide is greater than that in mean and spring tide. During neap tide, the maximum salinity of the surface and bottom layers is 11.01‰ and 30.59‰, respectively, and the salinity isolines of 5–30‰ go through the bottom. During mean tide, the maximum salinity of the surface and bottom layers is 21.61‰ and 26.06‰, respectively, and the salinity isolines of 10–26‰ go through the bottom layer. During spring tide, the maximum salinity of the surface and bottom layers is 20.98‰ and 25.96‰, respectively, and the salinity isolines of 10–25‰ go through the bottom layer. The G2 station is a typical station of saltwater intrusion in the middle reaches.
In the lower reaches, the salinity of the G3 station is slightly higher than that of the G2 station, with the salinity of the middle and lower layers greater than 30‰ in most periods of the tidal cycle. In the tidal cycle, the salinity increases on the flood and decreases on the ebb (Figure 3C). The mean salinity difference between the surface and bottom layers is the largest in neap tide, followed by spring tide and mean tide. During neap tide, the maximum salinity of the surface and bottom layers is 16.9‰ and 33.40‰, respectively, and the salinity isolines of 5–30‰ go through the bottom layer. During mean tide, the maximum salinity of the surface and bottom layers is 32.85‰ and 32.94‰, respectively, and the salinity isolines of 30–35‰ go through the bottom layer. During spring tide, the maximum salinity of the surface and bottom layers is 31.58‰ and 31.67‰, respectively, and the salinity isolines of 20–31‰ go through the bottom layer. The G3 station is a typical station for the main reaches of saltwater intrusion with high salinity.
3.3. Characteristics of Mixing and Stratification
3.3.1. Characteristics of Mixing and Stratification Indicated by Ri
As mentioned in Section 2.3.1, for < 0.25, the stratification is unstable, which implies that the stratification breaks down; for > 0.25, the stratification is stable.
At the G1 station in the upper reaches, in neap tide, > 0.25 during the whole tidal cycle, and increases from low water slack to high water slack, indicating that stratification stability increased on the flood, while decreases on the ebb, indicating that stratification stability decreases (Figure 3A). The water column is stratified during saltwater intrusion; variation of stratification stability is related to the movement of the saline wedge tip. In the upper layer of the mean tide, the stratification remains during the whole tidal cycle with > 0.25, and increases on the flood and decreases on the ebb, which reaches its maximum around the slack water, indicating that the stratification stability increases on the flood and decreases on the ebb. In the lower layer of the mean tide, < 0.25 on the early flood, > 0.25 during other periods, and the stratification is stable except for the early flood. During spring tide, < 0.25 on the ebb, > 0.25 on the flood, and the stratification is stable on the flood and breaks down on the ebb.
At the G2 station in the middle reaches, during neap tide, > 0.25, and the stratification remains over almost the whole tidal cycle, except for the temporary mixing in the bottom layer (Figure 3B). During mean and spring tide, > 0.25 during the middle–late flood and early ebb, and the water column is stratified; < 0.25 during the middle–late ebb tide and early flood, and the stratification breaks down; the water column represents stratification when there is high-salinity salt water intrusion. The stratification is stable at the upper and middle layers, the mixing occurs in the bottom layer, and the mixing duration is slightly longer in spring tide than that in mean tide.
At the G3 station in the lower reaches, during neap tide, > 0.25, and the stratification endures over almost the entire tidal cycle, except for the temporary mixing in the bottom layer (Figure 3C). During mean and spring tide, > 0.25 on the ebb, and the water column is stably stratified; < 0.25 on the flood, and stratification breaks down. In spring tide, the stratification sustains from the ebb to the early flood, the stratification is stable at the upper and middle layers, and the mixing occurs in the bottom layer.
At the head of the saltwater intrusion, the stratification stability in neap tide is much higher than that in mean and spring tide. During neap and mean tide, the water column is permanently stratified when there is saltwater intrusion. During spring tide, the water column is stratified on the ebb and mixed on the flood.
In the main reaches of the saltwater intrusion, during neap tide, the water column is generally stratified except for the temporary mixing in the bottom layer. During mean and spring tide, the water column presents mixing and stratification alternately in the upper and middle layers, and presents mixing in the bottom layer.
3.3.2. Characteristics of Mixing and Stratification Indicated by Φ
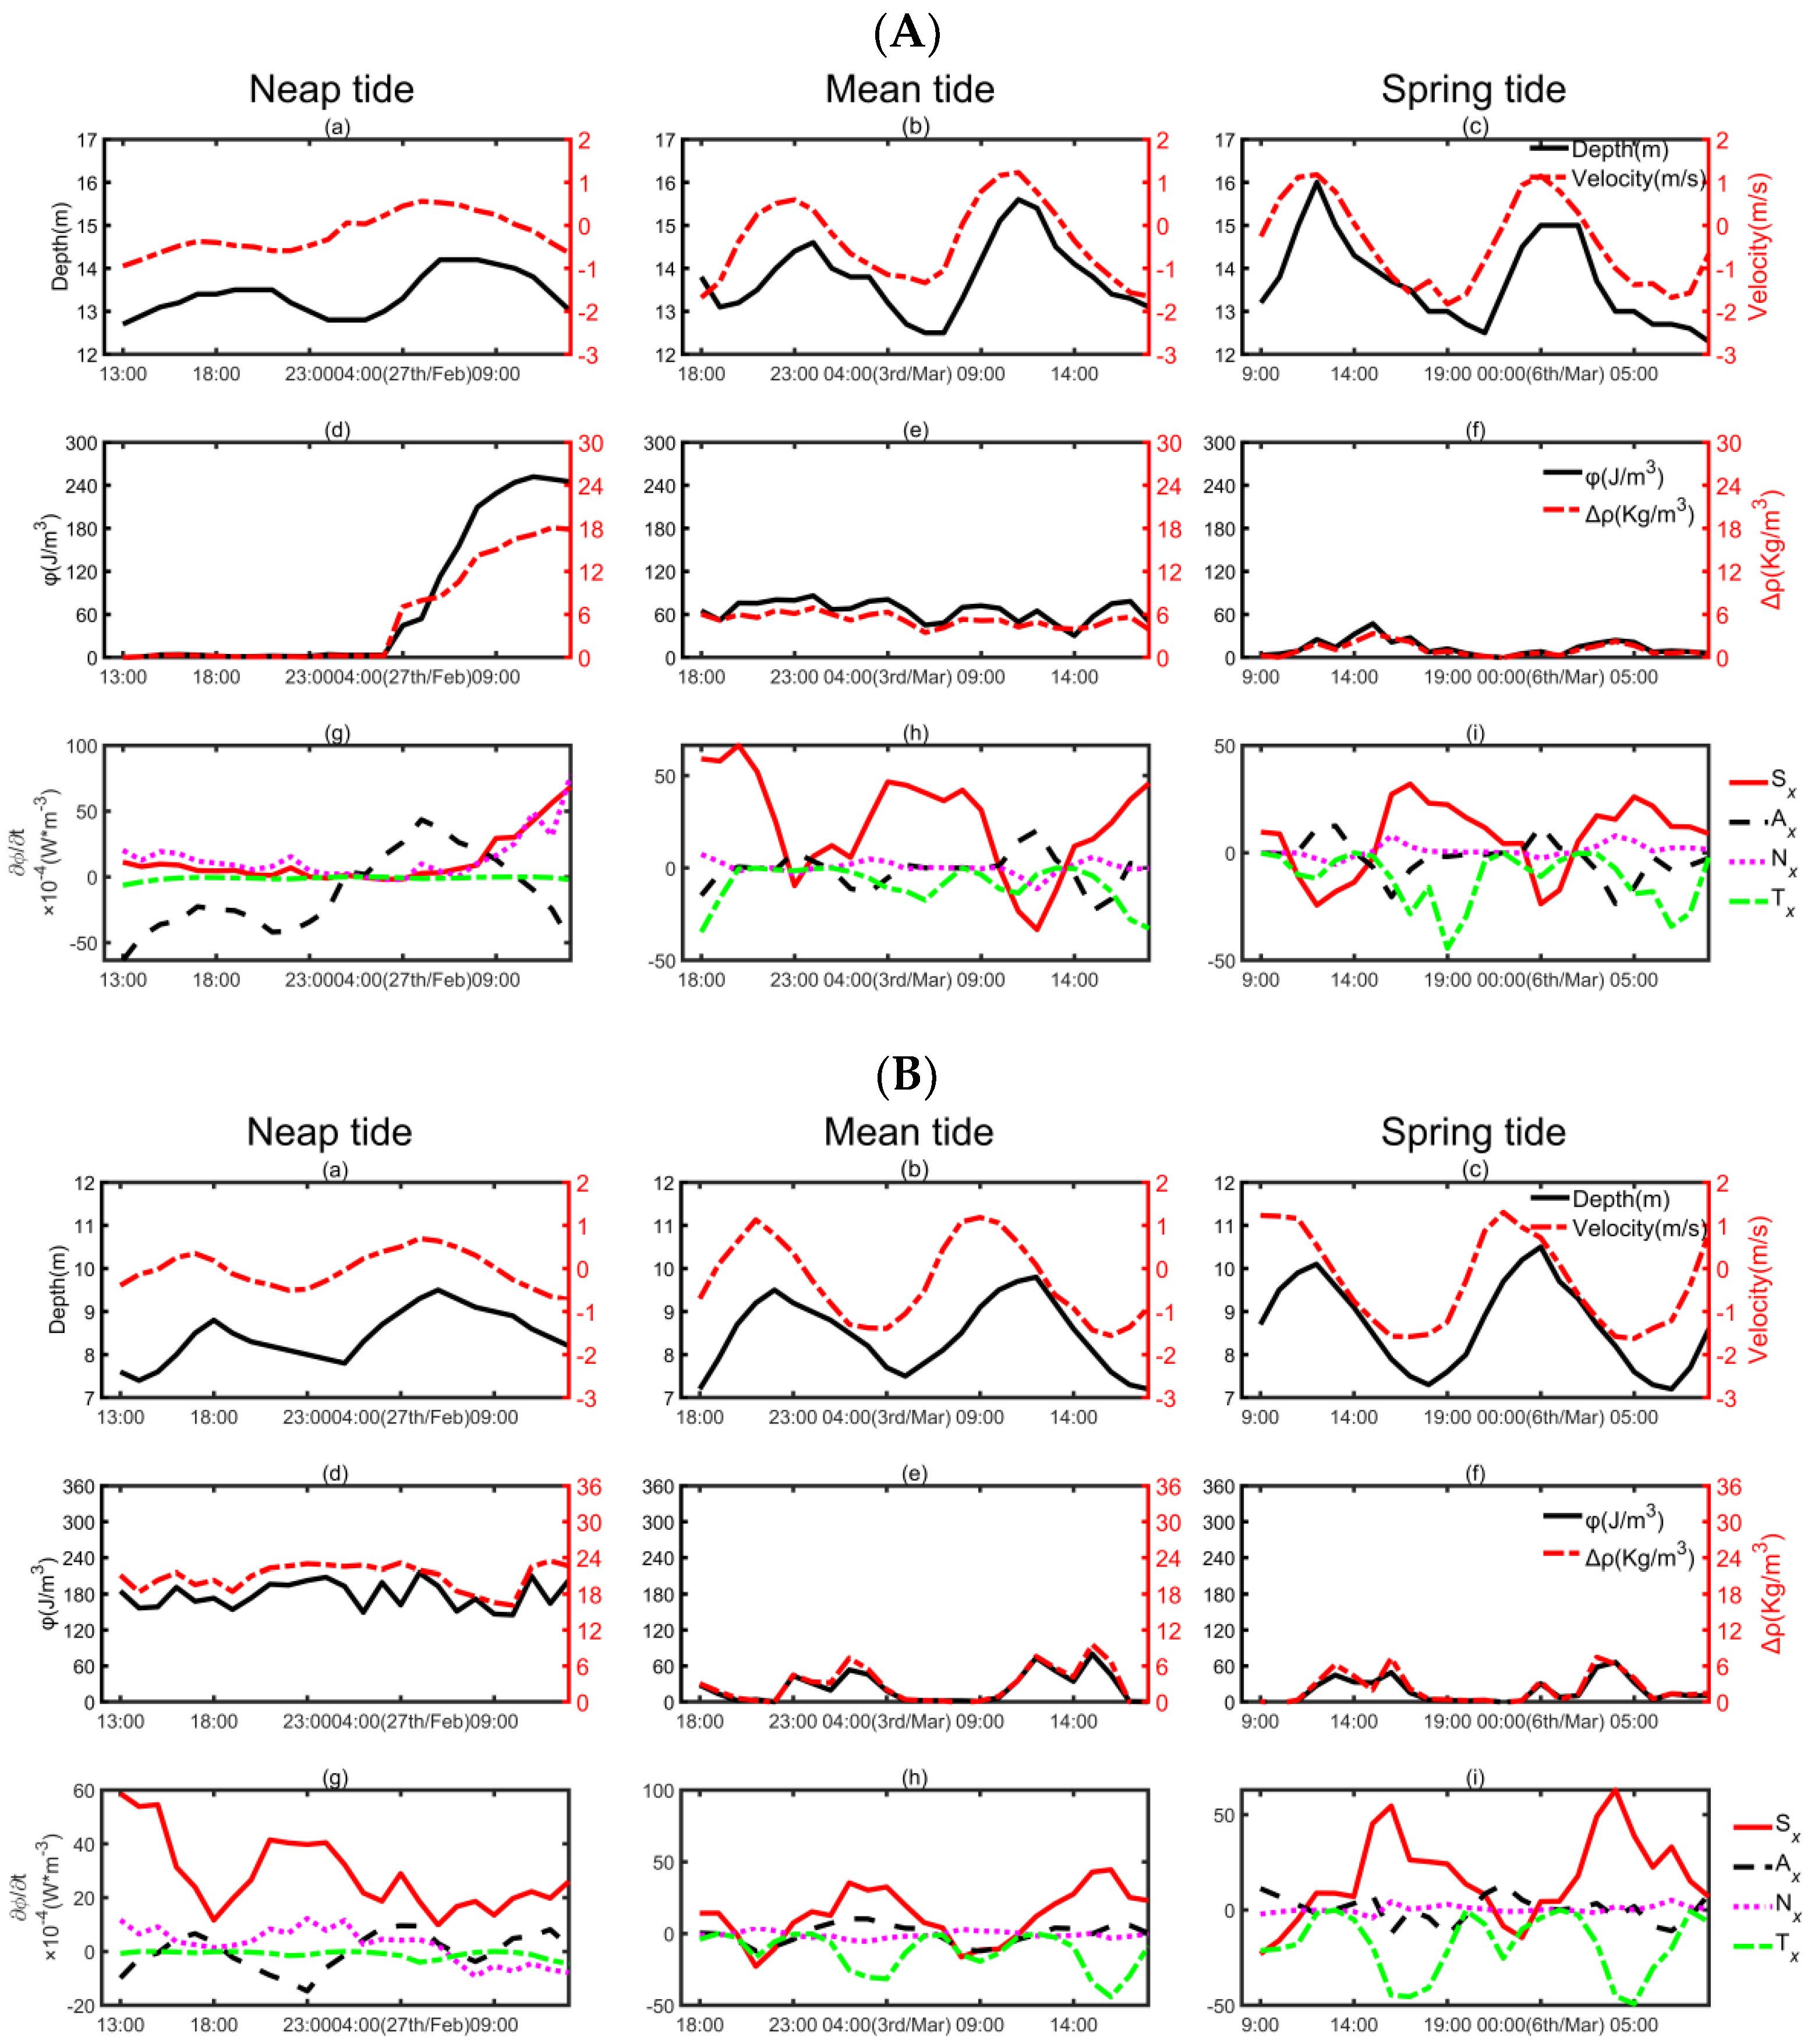
At the G1 station in the upper reaches, in neap and spring tide, the surface–bottom salinity difference and Φ increases gradually on the flood and decreases on the ebb (Figure 4A). In neap tide, as long as there is salt water intrusion, and Φ are greater than 0, indicating stratification, while in spring tide, and Φ decrease to 0 at ebb peak, and remain 0 during late ebb, indicating water mixing. During mean tide, and Φ are greater than 0 and have slight fluctuations over the tidal cycle, with larger values at flood peak and ebb peak, and smaller values at slack water, indicating stratification over the tidal cycle.
At the G2 station in the middle reaches, during neap tide, and Φ are far greater than 0 and have slight fluctuations over the tidal cycle with minimum values at slack water, indicating stratification (Figure 4B). During mean and spring tide, from flood peak to middle–late ebb, and Φ are greater than 0 and have two increase–decrease cycles, with peaks at high water slack and ebb peak, indicating stratification; from middle–late ebb to flood peak, and Φ are very close to 0, indicating complete mixing.
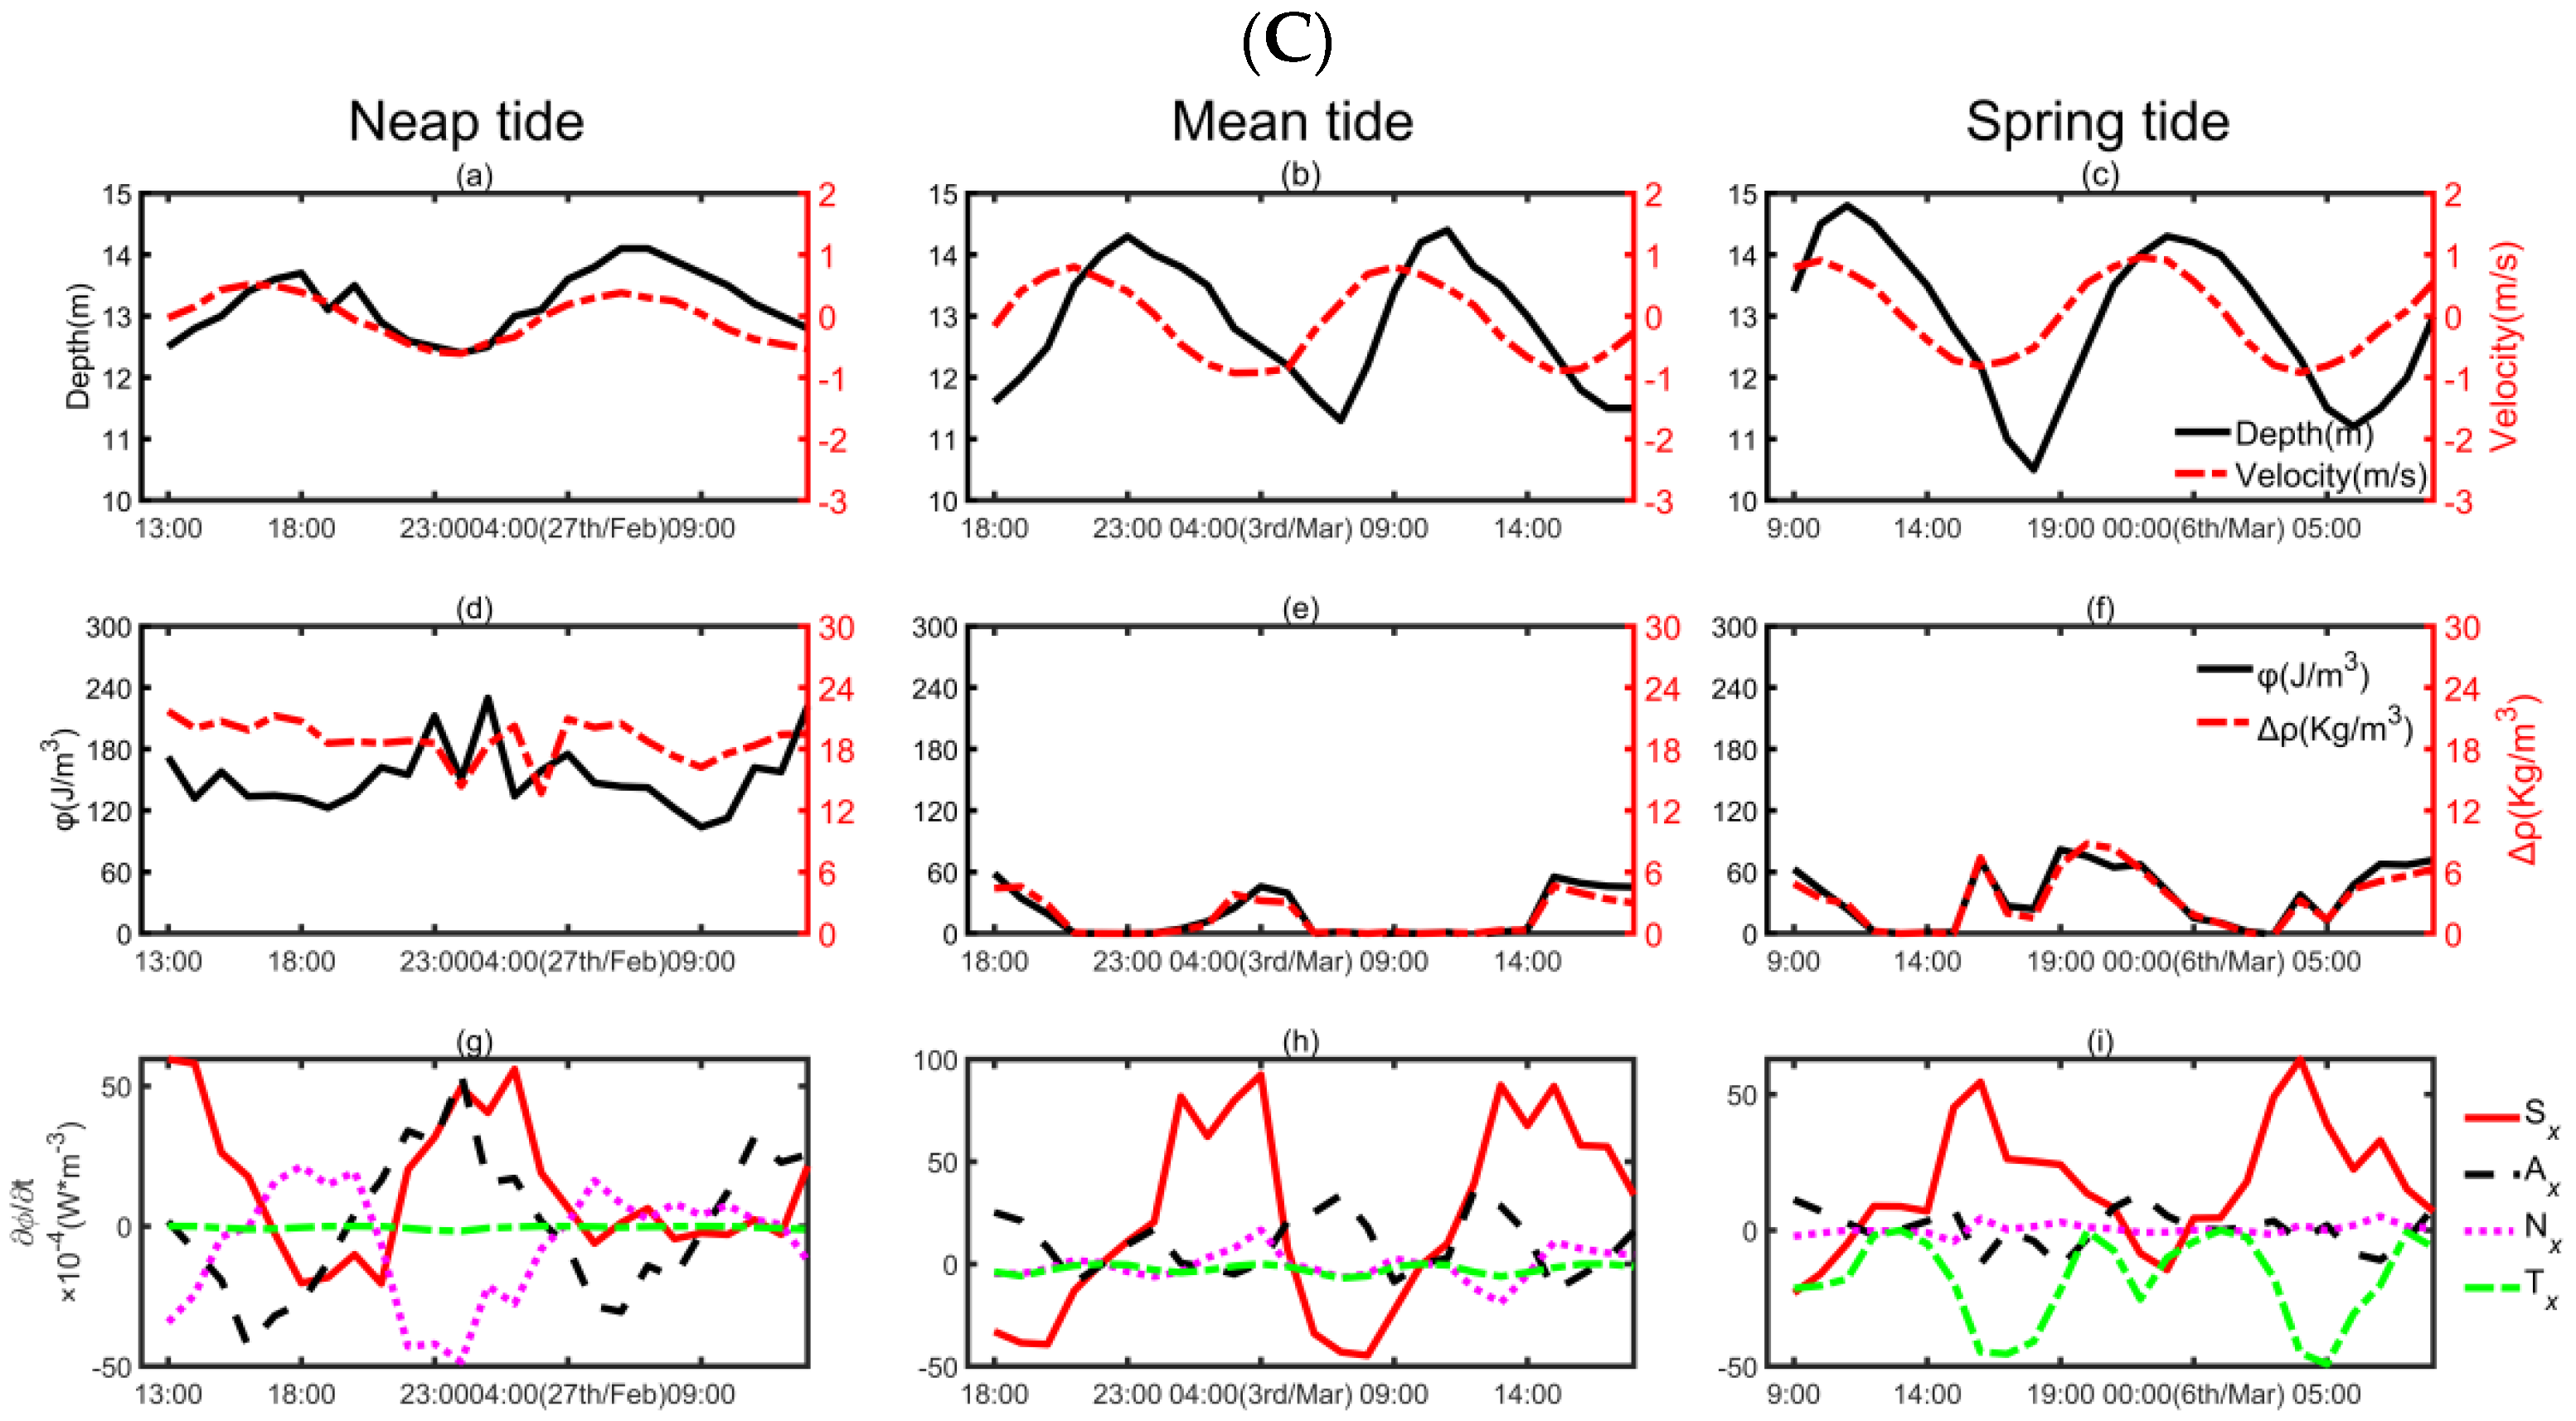
At the G3 station in the lower reaches, during neap tide, and Φ are far greater than 0 and have slight fluctuations over the tidal cycle, with larger values on the ebb and smaller values on the flood, indicating stratification (Figure 4C). During mean tide, the water column is stratified on the ebb, with peak values of and Φ at ebb peak, and the water column is mixed on the flood, with values of and Φ close to 0. During spring tide, and Φ increase on the ebb and decrease on the flood, with maximum values around low water slack and secondary maximum values around ebb peak, and the minimum values are close to 0 around high water slack, indicating that the stratification is developed on the ebb and gradually eliminated on the flood, with a short period of mixing state around high water slack.
From neap tide to spring tide, and Φ of each station all decrease, indicating that the duration and stability of stratification gradually decrease. At the head of the saltwater intrusion, during neap tide, the water column is stratified as long as there is salt water intrusion, with and Φ increasing on the flood and decreasing on the ebb; during mean tide, the water column is stratified over the tidal cycle, with larger values of and Φ at current peaks and smaller values at slack water; during spring tide, the water column is mixed during late ebb and stratified during other periods, with and Φ increasing on the flood and decreasing on the ebb. In the main reaches of the saltwater intrusion, during neap tide, the water column is stratified over the tidal cycle, with various tidal fluctuations of and Φ in different reaches; in mean and spring tide, the water column is stratified during the middle and late flood and early ebb at the G2 station of middle reaches, and stratified on the ebb at the G3 station of lower reaches, with values of and Φ having one or two increase–decrease cycles in a semidiurnal tide.
3.3.3. Characteristics of Mixing and Stratification Indicated by Si
At the head of the saltwater intrusion, during neap and mean tide, Si > 0.84 at the G1 station, and the permanent stratification occurs; during spring tide, 0.088 < Si < 0.84, and the periodic stratification occurs (Table 4). In the main reaches of the saltwater intrusion, during neap tide, Si > 0.84 at the G2 and G3 stations, indicating permanent stratification; during mean and spring tide, 0.088 < Si < 0.84, indicating periodic stratification. The results of Si are basically consistent with .
Combined with the three indicators of mixing and stratification above, the stratification has the highest stability during neap tide, followed by mean tide and spring tide. At the G1 station around the head of the saltwater intrusion, during neap and mean tide, there is permanent stratification in the processes of saltwater intrusion; during spring tide, there is periodic stratification, with the water column stratified on the flood and mixed on the ebb. At the G2 and G3 stations in the main reaches of saltwater intrusion, the water column is stably stratified during neap tide, and periodically stratified during mean and spring tide. In different reaches, the periodic stratification occurs in different tidal periods; stratification occurs during the middle and late flood and early ebb at the G2 station, while stratification occurs on the ebb at the G3 station.
3.4. Physical Mechanisms of Mixing and Stratification Processes
The main mechanisms of mixing and stratification are determined by calculating the main contribution terms of time derivative of Φ at each station, including the depth-mean straining term Sx, the longitudinal advection term Ax, the non-mean straining term Nx and the tidal stirring term Tx. As mentioned in Section 2.3.3, if the contribution term is positive, it indicates that this mechanism increases the time derivative of Φ and promotes stratification. To the contrary, if the contribution term is negative, it indicates that this mechanism drives water mixing.
At the G1 station in the upper reaches, during neap tide and mean tide, stratification and mixing are dominated by advection, supplemented by depth-mean straining and non-mean straining (Figure 4A). During the flood period, the increase in stratification stability is dominated by advection, supplemented by depth-mean straining and non-mean straining, while during the ebb period, the decrease in stratification stability is caused by the mixing produced by advection. In spring tide, the stratification and mixing are dominated by advection, supplemented by depth-mean straining and non-mean straining. During the flood period, the water column presents stratification, the enhancement of stratification is dominated by advection, and depth-mean straining and non-mean straining contribute to the mixing of the water column. During the ebb period, the stratification is dominated by depth-mean straining and supplemented by non-mean straining term, while mixing is dominated by advection and the mixing force is slightly greater than the stratifying agencies, so the water column presents mixing. The tidal stirring term promotes mixing, and the mixing effect is much more significant on the ebb during spring tide.
At the G2 station in the middle reaches, during neap tide, stratification is mainly maintained by depth-mean straining (Figure 4B). During mean and spring tide, stratification occurs during the middle and late flood and the early ebb, while mixing occurs during the middle and later ebb and the early flood. The former is mainly caused by depth-mean straining promoting stratification, while the latter is caused by both tidal stirring and the depth-mean straining promoting mixing. The Φ increases and decreases twice in a semidiurnal tide. The increase from flood peak to high water slack is caused by depth-mean straining, advection and non-mean straining that promotes stratification; the decrease from high water slack to early ebb is caused by tidal stirring that promotes mixing; and the increase and decrease from early ebb to ebb peak and to low water slack is caused by depth-mean straining and tidal stirring, with the former promoting stratification and the latter promoting mixing.
In the lower reaches of the G3 station, during neap tide, stratification and mixing are mainly operated by advection, depth-mean straining and non-mean straining (Figure 4C). On the ebb, advection and depth-mean straining promote stratification, while non-mean straining promotes mixing; the former two terms are bigger than the latter, and the water column presents stratification. On the flood, advection and depth-mean straining promote mixing and non-mean straining promotes stratification; the latter is bigger, and the water column presents stratification. During mean and spring tide, stratification and mixing are mainly maintained by depth-mean straining. On the ebb, the depth-mean straining term is positive and promotes stratification, so the water column presents stratification. On the flood, the depth-mean straining term is negative and promotes mixing, so the water column presents mixing. The value of the tidal stirring term is larger on the ebb during spring tide and promotes mixing significantly. During spring tide, Φ increases and decreases twice in a semidiurnal tide. The increase in Φ from high water slack to ebb peak is caused by depth-mean straining that promotes stratification; the decrease in Φ from low water slack to the middle and later flood is mainly related to tidal stirring that promotes mixing. The increase and decrease in Φ from middle and late ebb to low water slack and to high water slack is caused by the combined effects of depth-mean straining, advection and tidal stirring.
At the head of the saltwater intrusion, during neap and mean tide, the water column is stably stratified. The increase in the stratification stability on the flood is mainly maintained by advection, supplemented by depth-mean straining and non-mean straining. The decrease in the stratification stability on the ebb is mainly maintained by advection that promotes mixing. During spring tide, the water column presents periodic stratification. The stratification on the flood is mainly maintained by advection that promotes stratification; the mixing on the ebb is mainly maintained by advection and tidal stirring. In the main reaches of the saltwater intrusion, at the G2 station in the middle reaches, during neap tide, the water column presents periodic stratification; development of stratification on the ebb and breakdown of stratification on the flood are mainly operated by depth-mean straining. During mean and spring tide, stratification occurs from middle and late flood tide to early ebb tide, and mixing occurs from middle and late ebb tide to early flood tide; the former is maintained by advection that promotes stratification, and the latter is maintained by tidal stirring and depth-mean straining that promote mixing. At the G3 station in the lower reaches, during neap tide, stable stratification is mainly maintained by advection. During mean and spring tide, the water column is periodically stratified, which is stratified on the ebb and mixed on the flood. The former is mainly maintained by advection that promotes stratification on the ebb, and the latter is mainly driven by depth-mean straining and tidal stirring that promote mixing.
4. Discussion
In this study, tidal variation of the stratification and the main driving mechanisms in the North Channel were analyzed by field data evaluation and one-dimensional Φ-equation. In the active reaches of the saline wedge, stratification stability increases on the flood and decreases on the ebb, which is dominated by longitudinal advection and tidal stirring. In the main reaches of saltwater intrusion, from upstream to downstream, the stratification characteristics are gradually transformed so that the stratification stability increases on the ebb and decreases on the flood, which is dominated by depth-mean straining and tidal stirring.
The results of this paper are consistent with that of North Passage presented by Wang et al. [13]. In the active reaches of the saline wedge, due to the periodic movement of tidal flow, the mixing and stratification are mainly dominated by longitudinal advection and tidal stirring. In the main reaches of saltwater intrusion, the mixing and stratification are dominated by depth-mean straining and tidal stirring. Analysis of the terms affecting the evolution of stratification in the Rhine River Plume also highlighted the important role of cross-shore tidal straining in the downstream coastal current region of the plume as well as the important role of cross-shore advection in the region of the bulge near the river mouth [1]. Therefore, both tidal advection and tidal straining play important roles in the processes of stratification in the estuary. The former is the main driving force in the active reaches of saline wedge, and the latter plays a dominant role in both the main reaches of saltwater intrusion and the coastal areas affected by freshwater. Periodic stratification in the estuary can be driven not only by tidal straining but also by tidal advection. Periodic stratification driven by tidal advection is characterized by stratification on the flood and mixing on the ebb.
As mentioned in Section 3.1, in the North Channel, the lateral velocity is much smaller than the longitudinal velocity, so the stratification is assumed to be dominated by longitudinal dynamics. Therefore, the mechanisms of the mixing and stratification were analyzed by the longitudinal one-dimensional Φ equation, considering the longitudinal advection of salt and tidal stirring, neglecting the lateral advection and diffusion process. For further research, the numerical simulation results can be analyzed based on the driving forces of stratification proposed by Hans Burchard [14] to systematically study the mechanisms of stratification in the Changjiang Estuary, including advection, depth-mean straining, non-mean straining, vertical advection, vertical mixing, surface and bottom density fluxes, inner sources of density and the horizontal divergence of horizontal turbulent density fluxes.
5. Conclusions
The processes of stratification and mixing in the North Channel have remarkable spatiotemporal variation. The stratification stability decreases from neap tide to spring tide. At the head of the saltwater intrusion, during neap and mean tide, the water column is basically in a permanent stratification state, with stratification stability increasing on the flood and decreasing on the ebb; during spring tide, the water column presents periodic stratification, which is stratified on the flood and mixed on the ebb. In the main reaches of saltwater intrusion, during neap tide, the water column is basically in a permanent stratification state, with stratification stability increasing on the ebb and decreasing on the flood. In the main reaches of saltwater intrusion, during mean and spring tide, the water column presents periodic stratification; in the middle reaches, stratification occurs from flood peak to early ebb, while mixing occurs from the ebb peak to early flood; in the lower reaches, stratification occurs on the ebb, while mixing occurs on the flood.
At the head of the saltwater intrusion, the permanent stratification during neap and mean tide is mainly maintained by tidal advection, and the periodic stratification during spring tide is induced by tidal advection and opposed by tidal stirring. In the main reaches of saltwater intrusion, the permanent stratification during neap tide is mainly maintained by depth-mean straining, and the periodic stratification during mean and spring tide is operated by depth-mean straining and opposed by tidal stirring. Tidal advection is the main stratifying agent in the migration reaches of the saline wedge, and the tidal straining is the main stratifying force in the main reaches of saltwater intrusion.
Author Contributions
Conceptualization, C.J. and L.C.; methodology, C.J. and L.C; software, Y.W.; validation, J.Z.; formal analysis, J.Z.; investigation, J.Z.; resources, C.J.; data curation, J.Z.; writing—original draft preparation, J.Z.; writing—review and editing, J.Z.; visualization, Y.W.; supervision, C.J. and L.C.; project administration, C.J.; funding acquisition, C.J. All authors have read and agreed to the published version of the manuscript.
Funding
This research was supported by projects granted by the National Natural Science Foundation of China (Grants No. 41806104); international (regional) cooperation and exchange program of National Natural Science Foundation of China (No. 51761135023); the Priority Academic Program Development of Jiangsu Higher Education Institutions (PAPD).
Data Availability Statement
The datasets used and analysed during the current study are available from the corresponding author on reasonable request.
Conflicts of Interest
The authors declare no conflict of interest.
References
- De Boer, G.J.; Pietrzak, J.D.; Winterwerp, J.C. Using the potential energy anomaly equation to investigate tidal straining and advection of stratification in a region of freshwater influence. Ocean. Model. 2008, 22, 1–11. [Google Scholar] [CrossRef]
- Fleming, J., XXIII. Observations on the Junction of the Fresh Water of Rivers with the Salt Water of the Sea. Trans. R. Soc. Edinb. 1818, 13, 125–132. [Google Scholar] [CrossRef] [Green Version]
- Simpson, J.H.; Brown, J.; Matthews, J.; Allen, G. Tidal straining, density currents, and stirring in the control of estuarine stratification. Estuaries 1990, 13, 125–132. [Google Scholar] [CrossRef]
- Simpson, J.E.; Bitter, R.E. The dynamics of the head of a gravity current advancing over a horizontal surface. J. Fluid Mech. 1979, 94, 477–495. [Google Scholar] [CrossRef]
- Van de Kreeke, J.; Robaczewska, K. Effect of wind on the vertical circulation and stratification in the Volkerak Estuary. Neth. J. Sea Res. 1989, 23, 239–253. [Google Scholar] [CrossRef]
- Linden, P.F.; Simpson, J.E. Modulated mixing and frontogenesis in shallow seas and estuaries. Cont. Shelf Res. 1988, 8, 1107–1127. [Google Scholar] [CrossRef]
- Simpson, J.H.; Bowers, D.B. Models of stratification and frontal movement in shelf seas. Deep. Sea Res. Part A Oceanogr. Res. Pap. 1981, 28, 727–738. [Google Scholar] [CrossRef]
- Burchard, H. A universal law of estuarine mixing. J. Phys. Oceanogr. 2020, 50, 81–93. [Google Scholar] [CrossRef]
- Sharples, J.; Simpson, J.H.; Brubaker, J.M. Observations and modelling of periodic stratification in the Upper York River Estuary, Virginia. Estuar. Coast. Shelf Sci. 1994, 38, 301–312. [Google Scholar] [CrossRef]
- Stacey, M.T.; Monismith, S.G.; Burau, J.R. Observations of turbulence in a partially stratified estuary. J. Phys. Oceanogr. 1999, 29, 1950–1970. [Google Scholar] [CrossRef]
- Nepf, H.M.; Geyer, W.R. Intratidal variations in stratification and mixing in the Hudson estuary. J. Geophys. Res. Ocean. 1996, 101, 12079–12086. [Google Scholar] [CrossRef]
- Pu, X.; Shi, J.Z.; Hu, G.D.; Xiong, L.B. Circulation and mixing along the North Passage in the Changjiang River estuary, China. J. Mar. Syst. 2015, 148, 213–235. [Google Scholar] [CrossRef]
- Wang, Y.; Jiang, C.; Cheng, H.; Li, W.; Teng, L. Characteristics and Driving Mechanisms of Mixing and Stratification in the North Passage of the Changjiang Estuary, China. J. Coast. Res. 2021, 38, 140–153. [Google Scholar] [CrossRef]
- Burchard, H.; Hofmeister, R. A dynamic equation for the potential energy anomaly for analysing mixing and stratification in estuaries and coastal seas. Estuar. Coast. Shelf Sci. 2008, 77, 679–687. [Google Scholar] [CrossRef]
- Zhu, Y.P. Analysis of the characteristics of the Qingcaosha Reservoir direct saltwater intrusion from the open sea in the Changjiang Estuary. J. East China Norm. Univ. 2021, 2, 21–29. [Google Scholar]
- Chen, J.Y.; Yun, C.X.; Xu, H.G.; Dong, Y.F. The developmental model of the Changjiang River estuary during last 2000 years. Acta Oceanol. Sin. 1979, 1, 103–111.s. [Google Scholar]
- Yang, Z.; Cheng, H.; Li, J. Nonlinear advection, Coriolis force, and frictional influence in the South Channel of the Yangtze Estuary, China. Sci. China Earth Sci. 2015, 58, 429–435. [Google Scholar] [CrossRef]
- Jiang, C.; Li, J.; de Swart, H.E. Effects of navigational works on morphological changes in the bar area of the Yangtze Estuary. Geomorphology 2012, 139, 205–219. [Google Scholar] [CrossRef]
- Wang, J.; de Swart, H.E.; Dijkstra, Y.M. Dependence of tides and river water transport in an estuarine network on river discharge, tidal forcing, geometry and sea level rise. Cont. Shelf Res. 2021, 225, 104476. [Google Scholar] [CrossRef]
- Zhang, M.; Townend, I.; Zhou, Y.; Cai, H. Seasonal variation of river and tide energy in the Yangtze estuary, China. Earth Surf. Process. Landf. 2016, 41, 98–116. [Google Scholar] [CrossRef]
- Guo, L.C.; Zhu, C.Y.; He, Q.; Wang, Z.B.; Wang, Y.Y. Examination of tidal wave properties in the Yangtze River estuary. Mar. Sci. Bull. 2017, 36, 652–661. [Google Scholar]
- Zhang, E.F.; Savenije, H.H.G.; Chen, S.L.; Mao, X.H. An analytical solution for tidal propagation in the Yangtze Estuary, China. Hydrol. Earth Syst. Sci. 2012, 16, 3327–3339. [Google Scholar] [CrossRef] [Green Version]
- Li, L.; Wu, H.; Liu, J.T.; Zhu, J. Sediment transport induced by the advection of a moving salt wedge in the Changjiang estuary. J. Coast. Res. 2015, 31, 671–679. [Google Scholar] [CrossRef]
- Bowden, K.F. The mixing processes in a tidal estuary. Int. J. Air Water Pollut. 1963, 7, 343–356. [Google Scholar]
- Dyer, K.R. Estuaries: A Physical Introduction, 2nd ed.; Wiley: Chichester, UK, 1997. [Google Scholar]
- Monismith, S.G.; Fong, D.A. A simple model of mixing in stratified tidal flows. J. Geophys. Res. 1996, 101, 28583–28595. [Google Scholar] [CrossRef]
- Becherer, J.; Burchard, H.; Flser, G.; Mohrholz, V.; Umlauf, L. Evidence of tidal straining in well-mixed channel flow from micro-structure observations. Geophys. Res. Lett. 2011, 38, L17611. [Google Scholar] [CrossRef]
Figure 1.
Sketch of the Changjiang Estuary and observation stations in the North Channel. CX and HS denote Changxing Island and Hengsha Island, respectively.
Figure 1.
Sketch of the Changjiang Estuary and observation stations in the North Channel. CX and HS denote Changxing Island and Hengsha Island, respectively.

Figure 2.
Longitudinal–vertical distribution of tidal mean salinity during neap tide (a), mean tide (b), spring tide (c) in the North Channel.
Figure 2.
Longitudinal–vertical distribution of tidal mean salinity during neap tide (a), mean tide (b), spring tide (c) in the North Channel.

Figure 3.
Time variation of velocity (a–c), salinity (d–f), and Ri (g–i) at (A) G1, (B) G2 and (C) G3 stations in the North Channel.
Figure 3.
Time variation of velocity (a–c), salinity (d–f), and Ri (g–i) at (A) G1, (B) G2 and (C) G3 stations in the North Channel.

Figure 4.
Time series of water depth and depth mean velocity (a–c), Φ (d–f), and surface–bottom density difference Δρ, and forcing terms in the Φ−equation (g–i) at (A) G1, (B) G2 and (C) G3 stations in the North Channel.
Figure 4.
Time series of water depth and depth mean velocity (a–c), Φ (d–f), and surface–bottom density difference Δρ, and forcing terms in the Φ−equation (g–i) at (A) G1, (B) G2 and (C) G3 stations in the North Channel.


Table 1.
Characteristic values of tides at each measuring station.
| Station | Tide | Water Depth (m) | Tidal Range (m) | Flood Tide | Ebb Tide | |||||
|---|---|---|---|---|---|---|---|---|---|---|
| Duration (h) | Mean Longitudinal Velocity (m/s) | Mean Lateral Velocity (m/s) | Maximum Longitudinal Velocity (m/s) | Mean Longitudinal Velocity (m/s) | Mean Lateral Velocity (m/s) | Maximum Longitudinal Velocity (m/s) | ||||
| G0 | Neap | 14.31 | 1.20 | 7.00 | 0.27 | 0.05 | 0.42 | 0.23 | 0.06 | 0.40 |
| G1 | 13.35 | 1.40 | 7.00 | 0.41 | 0.02 | 0.56 | 0.46 | 0.04 | 0.59 | |
| G2 | 8.49 | 1.60 | 7.00 | 0.41 | 0.16 | 0.69 | 0.33 | 0.12 | 0.51 | |
| G3 | 13.14 | 1.70 | 7.00 | 0.24 | 0.21 | 0.38 | 0.34 | 0.29 | 0.61 | |
| G0 | Mean | 14.22 | 1.60 | 5.50 | 0.70 | 0.07 | 1.19 | 0.64 | 0.02 | 1.09 |
| G1 | 13.78 | 2.10 | 5.50 | 0.70 | 0.05 | 1.23 | 0.93 | 0.99 | 1.34 | |
| G2 | 8.73 | 2.60 | 5.50 | 0.74 | 0.15 | 1.19 | 0.92 | 0.11 | 1.39 | |
| G3 | 13.10 | 3.00 | 5.50 | 0.49 | 0.27 | 0.80 | 0.70 | 0.19 | 0.93 | |
| G0 | Spring | 14.58 | 2.40 | 4.50 | 0.61 | 0.05 | 1.17 | 0.98 | 0.04 | 1.42 |
| G1 | 13.82 | 3.50 | 4.50 | 0.75 | 0.05 | 1.18 | 1.27 | 0.09 | 1.83 | |
| G2 | 8.84 | 3.80 | 4.50 | 0.79 | 0.21 | 1.30 | 1.03 | 0.14 | 1.58 | |
| G3 | 13.01 | 4.30 | 6.50 | 0.56 | 0.27 | 0.96 | 0.63 | 0.26 | 0.81 | |
Table 2.
Vertical and longitudinal salinity gradient at each station (units: kg/m4).
| Station | Vertical Gradient of Salinity | Longitudinal Gradient of Salinity | ||||
|---|---|---|---|---|---|---|
| Neap Tide | Mean Tide | Spring Tide | Neap Tide | Mean Tide | Spring Tide | |
| G1 | 0.48 | 0.45 | 0.09 | 0.30 × 10⁻³ | 0.42 × 10⁻³ | 0.31 × 10⁻³ |
| G2 | 2.93 | 0.38 | 0.29 | 0.55 × 10⁻³ | 0.51 × 10⁻³ | 0.62 × 10⁻³ |
| G3 | 1.71 | 0.14 | 0.31 | 0.69 × 10⁻³ | 0.65 × 10⁻³ | 0.83 × 10⁻³ |
Table 3.
Characteristic values of salinity at each measuring station (units:‰).
| Station | Neap Tide | Mean Tide | Spring Tide | |||||||||||||||
|---|---|---|---|---|---|---|---|---|---|---|---|---|---|---|---|---|---|---|
| Flood- Mean | σ | Ebb- Mean | σ | Tidal Mean | σ | Flood- Mean | σ | Ebb- Mean | σ | Tidal Mean | σ | Flood- Mean | σ | Ebb- Mean | σ | Tidal Mean | σ | |
| G0 | 1.43 | 0.06 | 1.34 | 0.12 | 1.40 | 0.10 | 0.87 | 0.43 | 0.84 | 0.33 | 0.84 | 0.38 | 0.05 | 0.03 | 0.18 | 0.22 | 0.12 | 0.18 |
| G1 | 4.97 | 3.00 | 0.89 | 0.07 | 1.85 | 2.78 | 9.55 | 1.73 | 8.84 | 2.45 | 9.16 | 2.17 | 1.13 | 0.53 | 3.38 | 1.78 | 2.68 | 1.91 |
| G2 | 15.13 | 4.11 | 12.18 | 1.00 | 12.27 | 1.90 | 19.48 | 1.21 | 18.03 | 2.29 | 18.16 | 2.36 | 12.80 | 4.66 | 14.79 | 5.39 | 14.18 | 5.52 |
| G3 | 28.53 | 0.65 | 27.07 | 0.87 | 27.46 | 1.07 | 32.15 | 1.02 | 30.87 | 0.82 | 31.82 | 1.13 | 29.40 | 1.32 | 29.65 | 1.23 | 29.62 | 1.29 |
Note: The salinity values in the table are vertical mean salinity, and σ indicates standard deviation.
Table 4.
Simpson number at G1, G2 and G3 stations in the North Channel.
| Station | Neap Tide | Mean Tide | Spring Tide |
|---|---|---|---|
| G1 | 1.21 | 1.07 | 0.78 |
| G2 | 1.02 | 0.59 | 0.53 |
| G3 | 1.31 | 0.79 | 0.74 |
Disclaimer/Publisher’s Note: The statements, opinions and data contained in all publications are solely those of the individual author(s) and contributor(s) and not of MDPI and/or the editor(s). MDPI and/or the editor(s) disclaim responsibility for any injury to people or property resulting from any ideas, methods, instructions or products referred to in the content. |
© 2023 by the authors. Licensee MDPI, Basel, Switzerland. This article is an open access article distributed under the terms and conditions of the Creative Commons Attribution (CC BY) license (https://creativecommons.org/licenses/by/4.0/).
Share and Cite
MDPI and ACS Style
Zhang, J.; Cheng, L.; Wang, Y.; Jiang, C. The Impact of Tidal Straining and Advection on the Stratification in a Partially Mixed Estuary. Water 2023, 15, 339. https://doi.org/10.3390/w15020339
AMA Style
Zhang J, Cheng L, Wang Y, Jiang C. The Impact of Tidal Straining and Advection on the Stratification in a Partially Mixed Estuary. Water. 2023; 15(2):339. https://doi.org/10.3390/w15020339
Chicago/Turabian StyleZhang, Jin, Li Cheng, Yajun Wang, and Chenjuan Jiang. 2023. "The Impact of Tidal Straining and Advection on the Stratification in a Partially Mixed Estuary" Water 15, no. 2: 339. https://doi.org/10.3390/w15020339
Note that from the first issue of 2016, this journal uses article numbers instead of page numbers. See further details here.