
Ecological Health Assessment with the Combination Weight Method for the River Reach after the Retirement and Renovation of Small Hydropower Stations

Abstract
:1. Introduction
2. Methods
2.1. Index System
2.2. Index Classification Standard
2.3. Determination of Weight
2.3.1. Analytic Hierarchy Process Determines Subjective Weight
- (1)
- Construct judgment matrixThe ecological health assessment of the river section after the retirement and renovation of the small hydropower station is divided into three levels. The target layer is the ecological health of the river reach (A). The criterion layer includes hydrological characteristics (B1), water quality characteristics B2, biological characteristics B3, and morphological structure characteristics B4, and the index layer includes the flow reduction degree C11, change degree of water area C12, and other indicators as shown in Table 1.
- (2)
- Determine the weight vector and consistency check:where A is the judgment matrix, is the largest characteristic root, and is a feature vector.
- (a)
- Calculate the numerical product of each row of the judgment matrix A to determine M and calculate the eigenvector :
- (b)
- Calculate the maximum eigenvalue according to the feature vector :
- (c)
- Define the consistency indicators :
- (d)
- Introduce the random consistency index :
- (e)
- Compare with the random consistency index to obtain the test coefficient . When ≤ 0.1, the consistency is good:
2.3.2. Entropy Weight Method Determines Objective Weight
- (1)
- Form the original data matrix and normalize to determine :where represents the proportion of the index j to the sample i and represents the original value of the evaluation indicator j for the sample i.
- (2)
- Calculate the entropy of index :where represents the entropy value and represents the proportion of the index j to the sample i.
- (3)
- The weight of indicators is calculated:where represents the weight of the index j.
2.4. Combination Weighting Method
- (1)
- is used to represent a basic set of weight vectors, and linearly combine these n vectors into a possible set of weights:where | is a basic weight vector set, represents a possible weight vector of the possible weight vector set, represents the weight coefficient, and represents the weight vector.
- (2)
- The most satisfactory weight vector was found to optimize to minimize the deviation between and each :
- (3)
- According to the differential property of the matrix, the first derivative condition of Equation (16) optimization is:
- (4)
- Equation (17) was converted into the following set of linear equations:
- (5)
- The set is obtained and normalized as:
- (6)
- Determine the combined weight:
2.5. Fuzzy Comprehensive Assessment
- (1)
- Determine the evaluation set:where represents the criteria of the level () comment set corresponding to the target layer, criterion layer, and index layer, including five states of very healthy, healthy, subhealthy, unhealthy, and morbid. The comment set specifies the scope of the description of the evaluation results.
- (2)
- Determination of membershipWhen the standard value and weight value of each index are known, the trapezoidal distribution membership function can determine the fuzzy membership of the index layer, criterion layer, and index layer:The membership function of the smaller and better index is:The membership function of the larger and better index is:where is the critical value of each evaluation factor, and are the critical values classification of each evaluation factor, and is the membership expression corresponding to each level of the evaluation set.
- (3)
- According to the characteristics of each index, the membership function of each index is drawn up, and the membership matrix is established. Then, the comprehensive evaluation model is:where is the membership matrix of the I criterion layer, which represents the number of indicators contained in the I criterion layer.
- (4)
- Multilevel fuzzy comprehensive evaluationThe river health ecological assessment system is composed of three structural levels: the target layer, the index layer, and the criterion layer. It can be divided into an index layer reflecting the criterion layer and criterion layer reflecting the two-level fuzzy comprehensive assessment of the target layer.
- (a)
- The fuzzy evaluation of the indicator layer reflecting the criterion layer is:where is the fuzzy evaluation result of the criterion layer of level ().
- (b)
- The recursion to the criterion layer to reflect the fuzzy evaluation of the target layer is:where () is the membership degree of the grade comment i, is the combined weight of the criterion layer relative to the target layer, is the combined weight of the index layer relative to the criterion layer, and “” is a fuzzy composition operator.
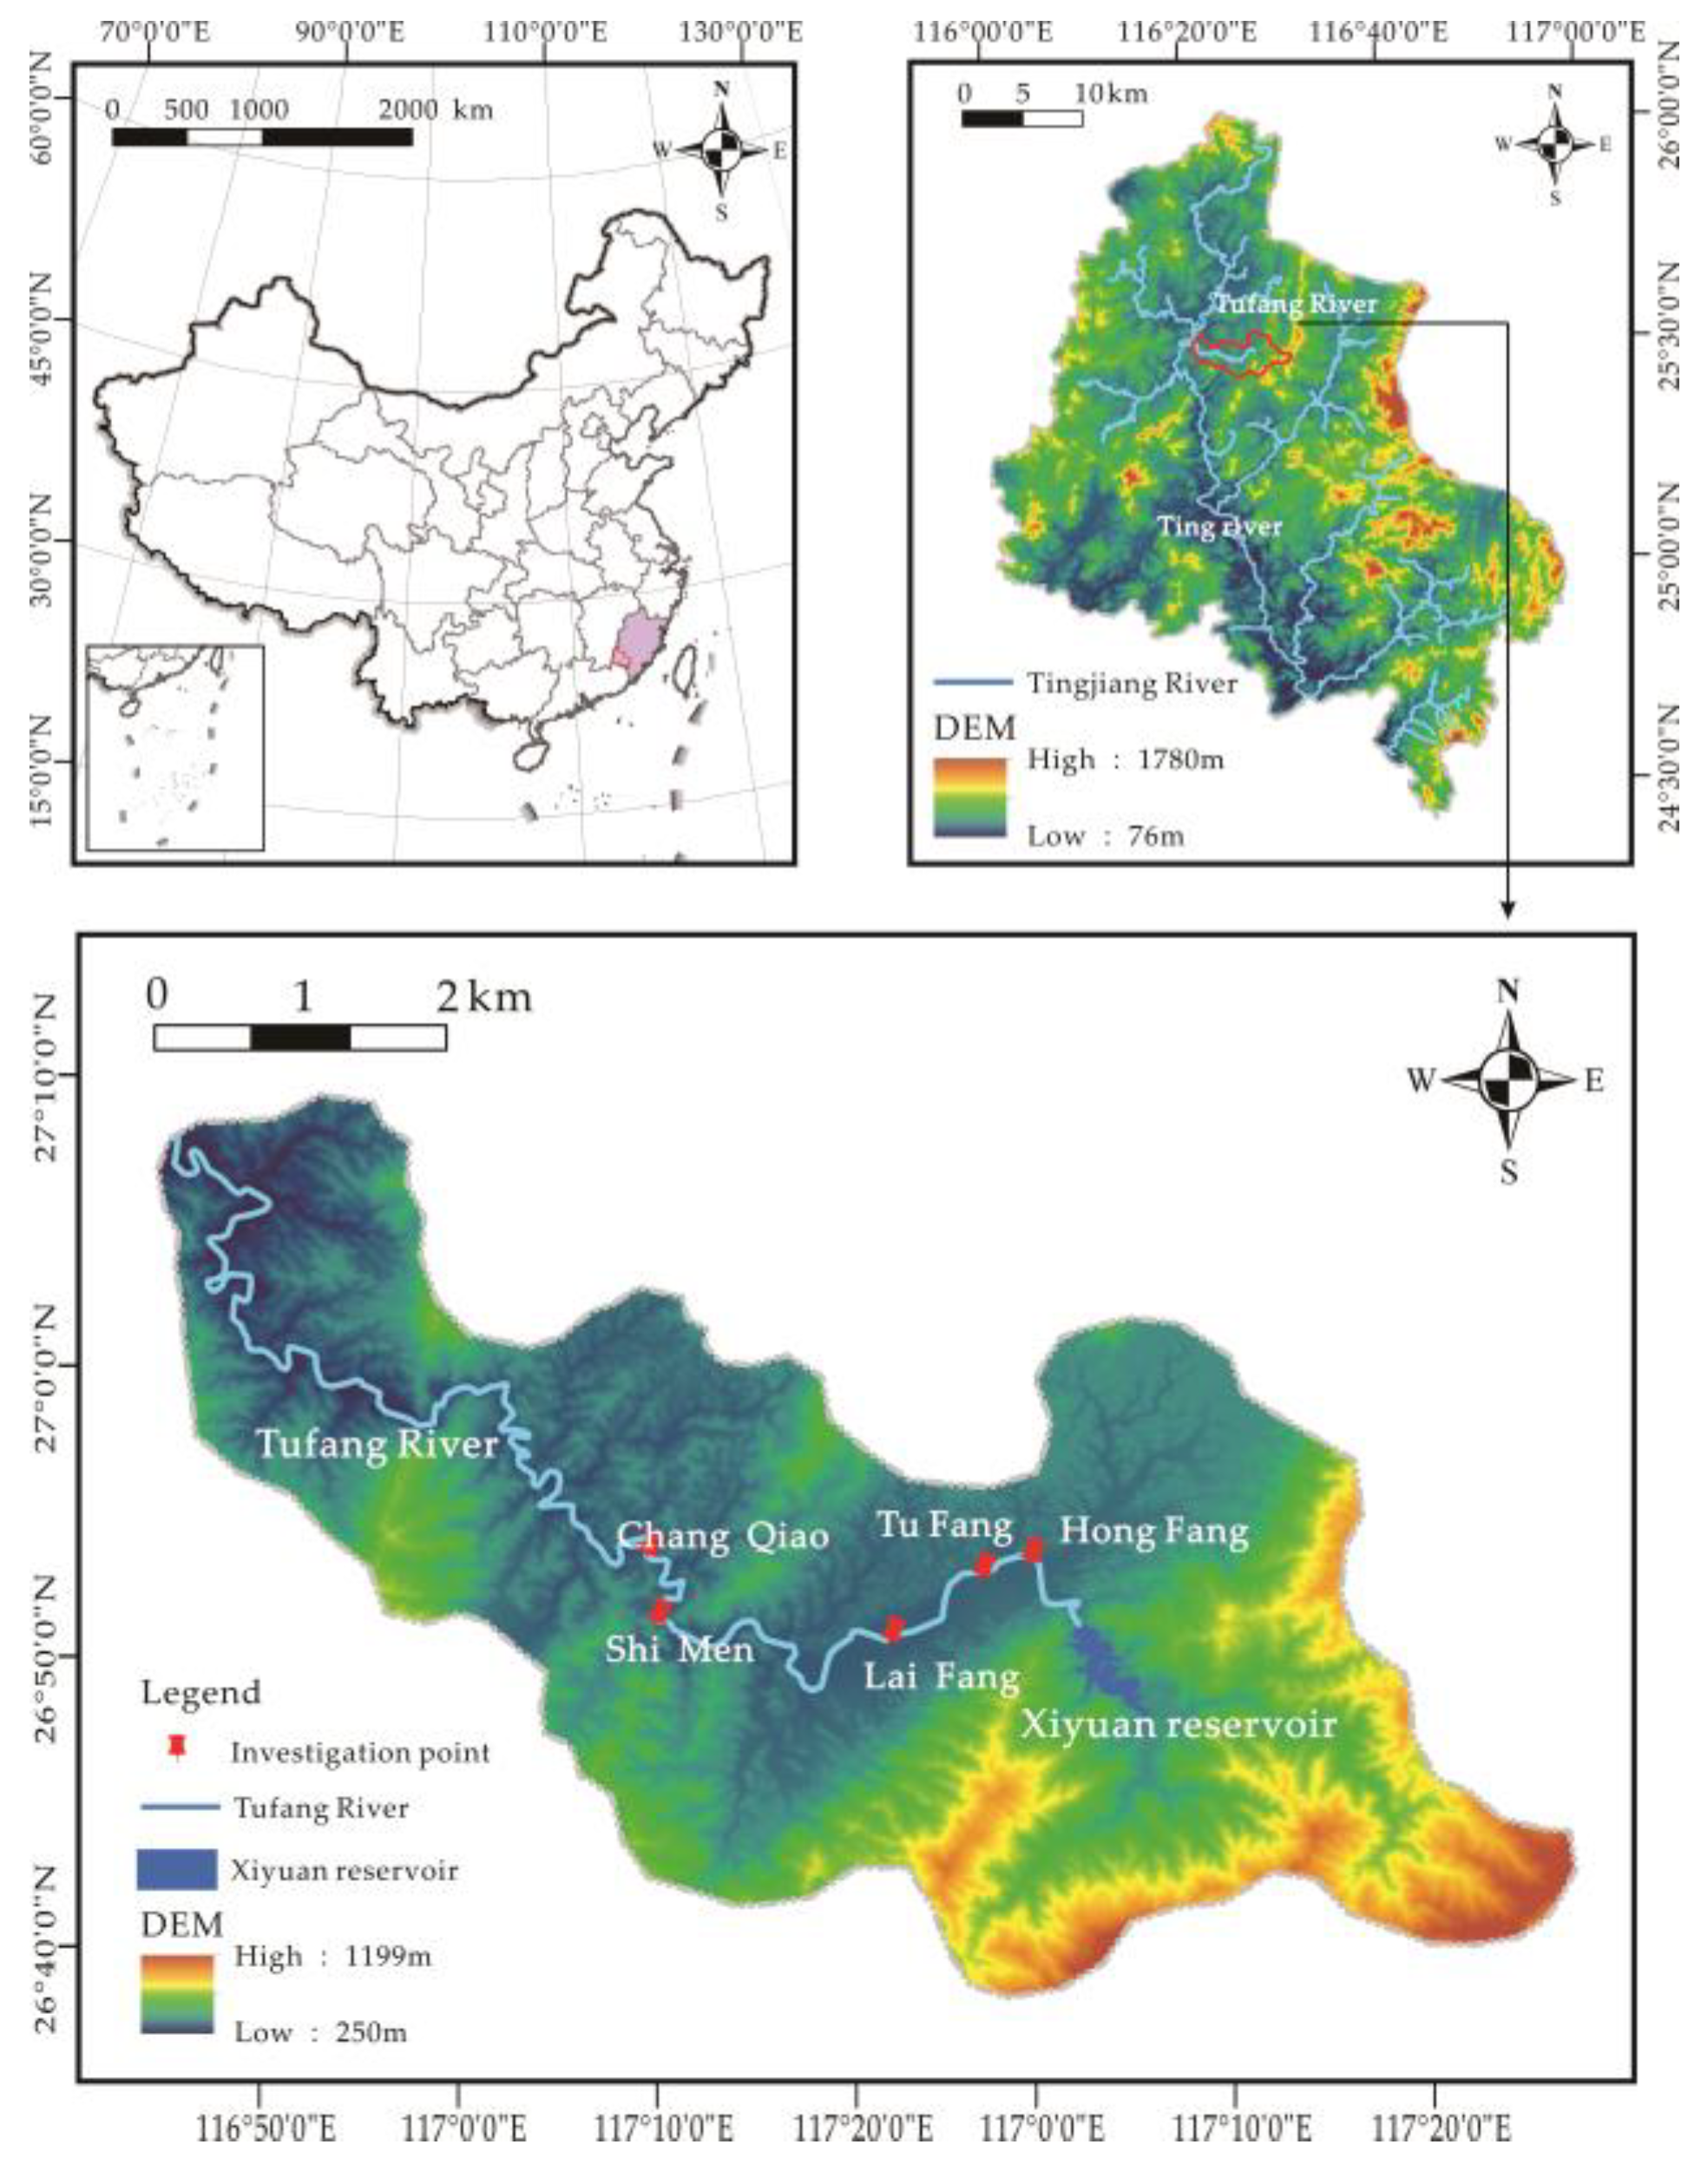
3. Study Region
4. Results
4.1. Weight Consistency Test
4.2. Assessment Index Weight
4.2.1. Weight Calculation by the AHP
4.2.2. Weight Calculation using the Entropy Method
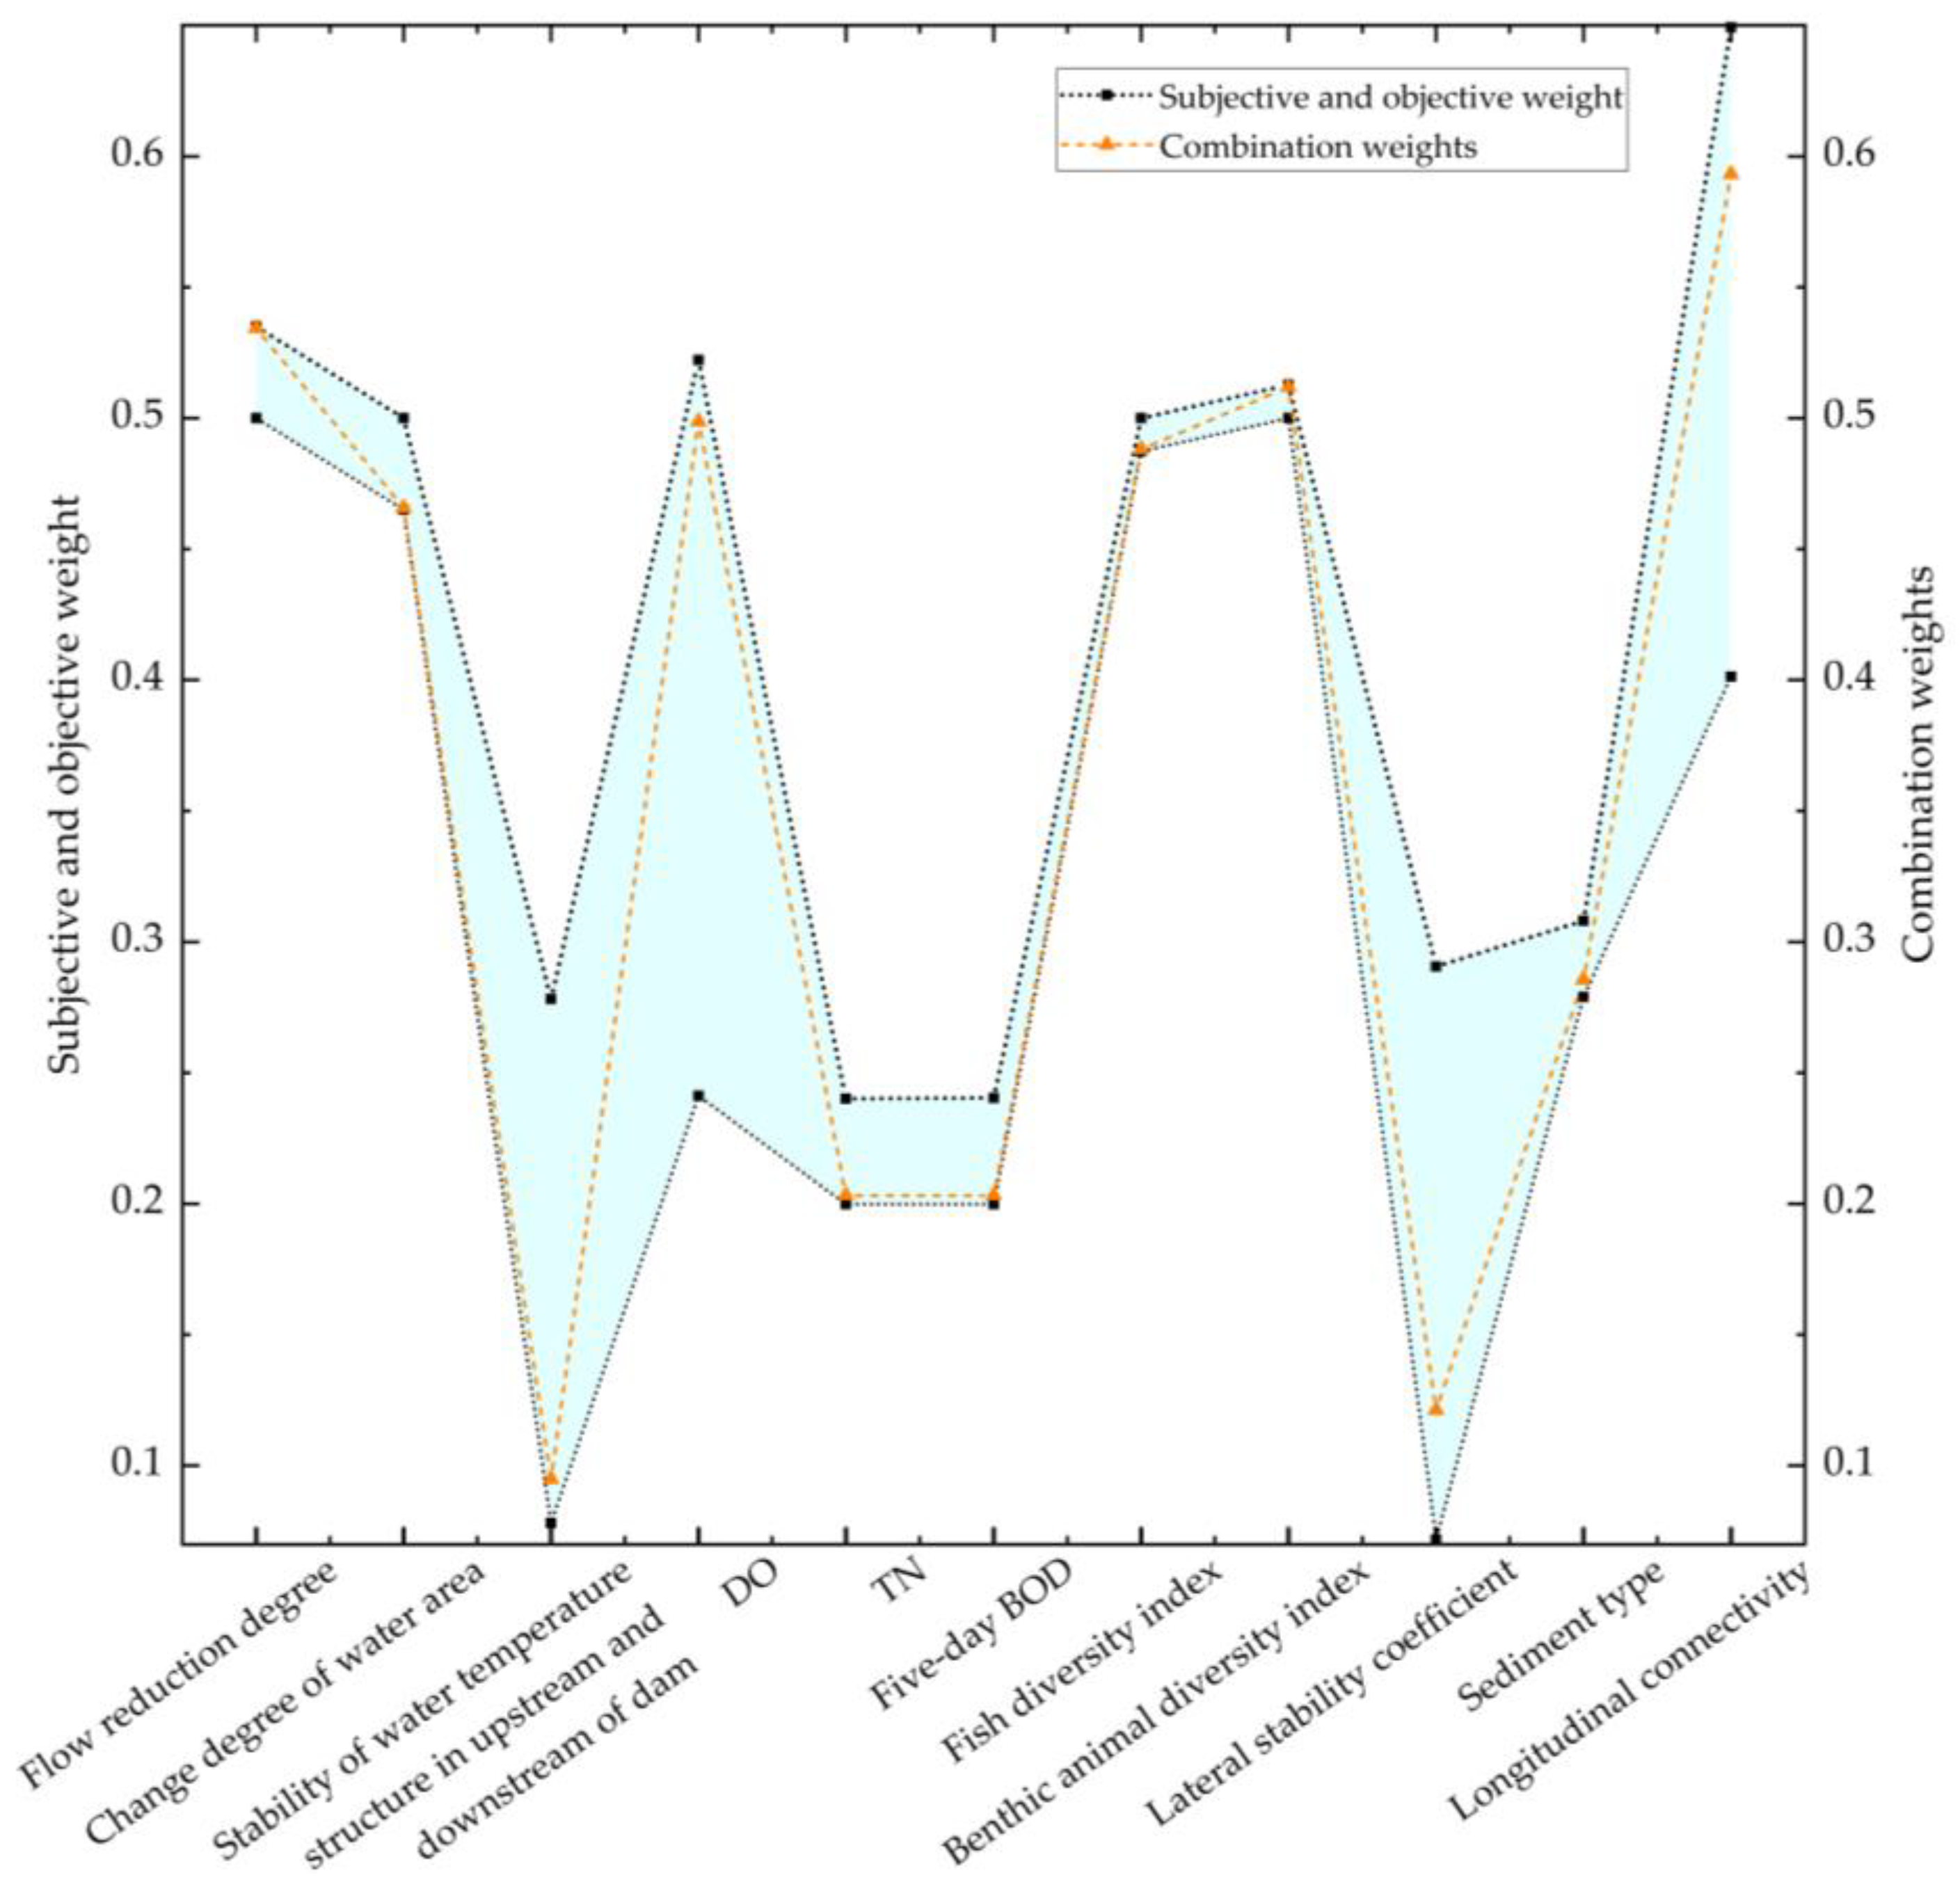
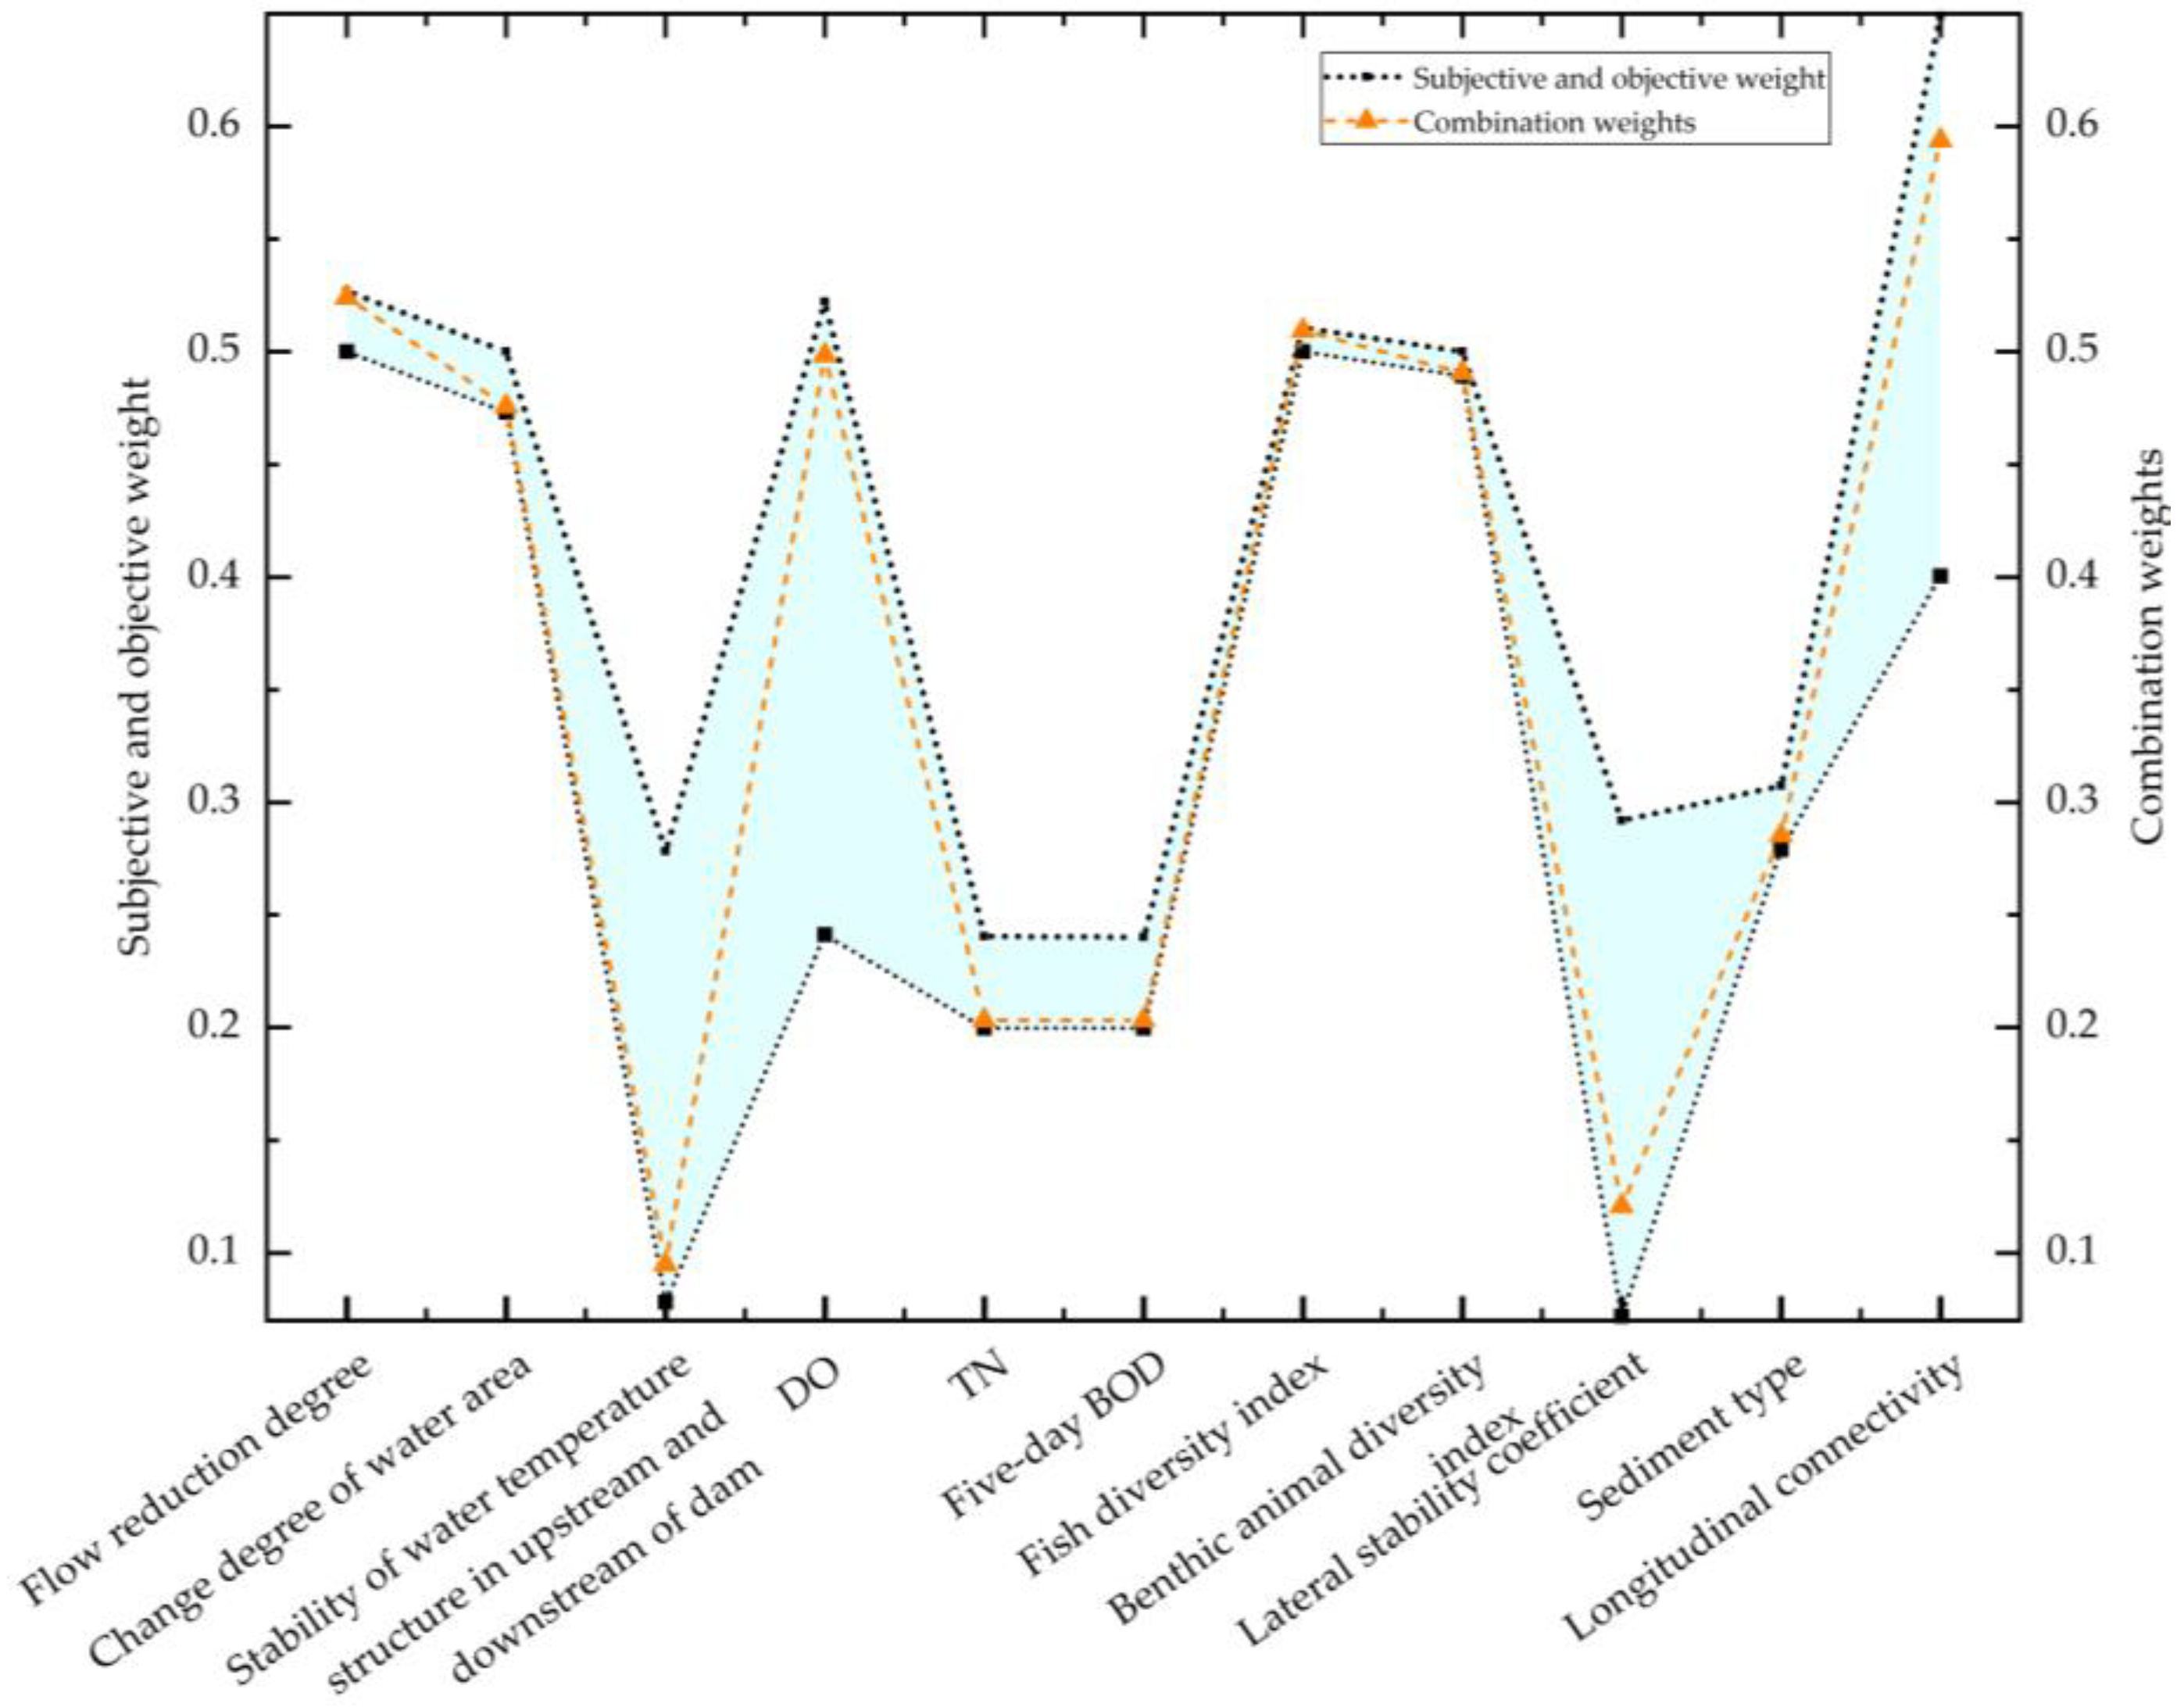
4.2.3. Weight Calculation Results
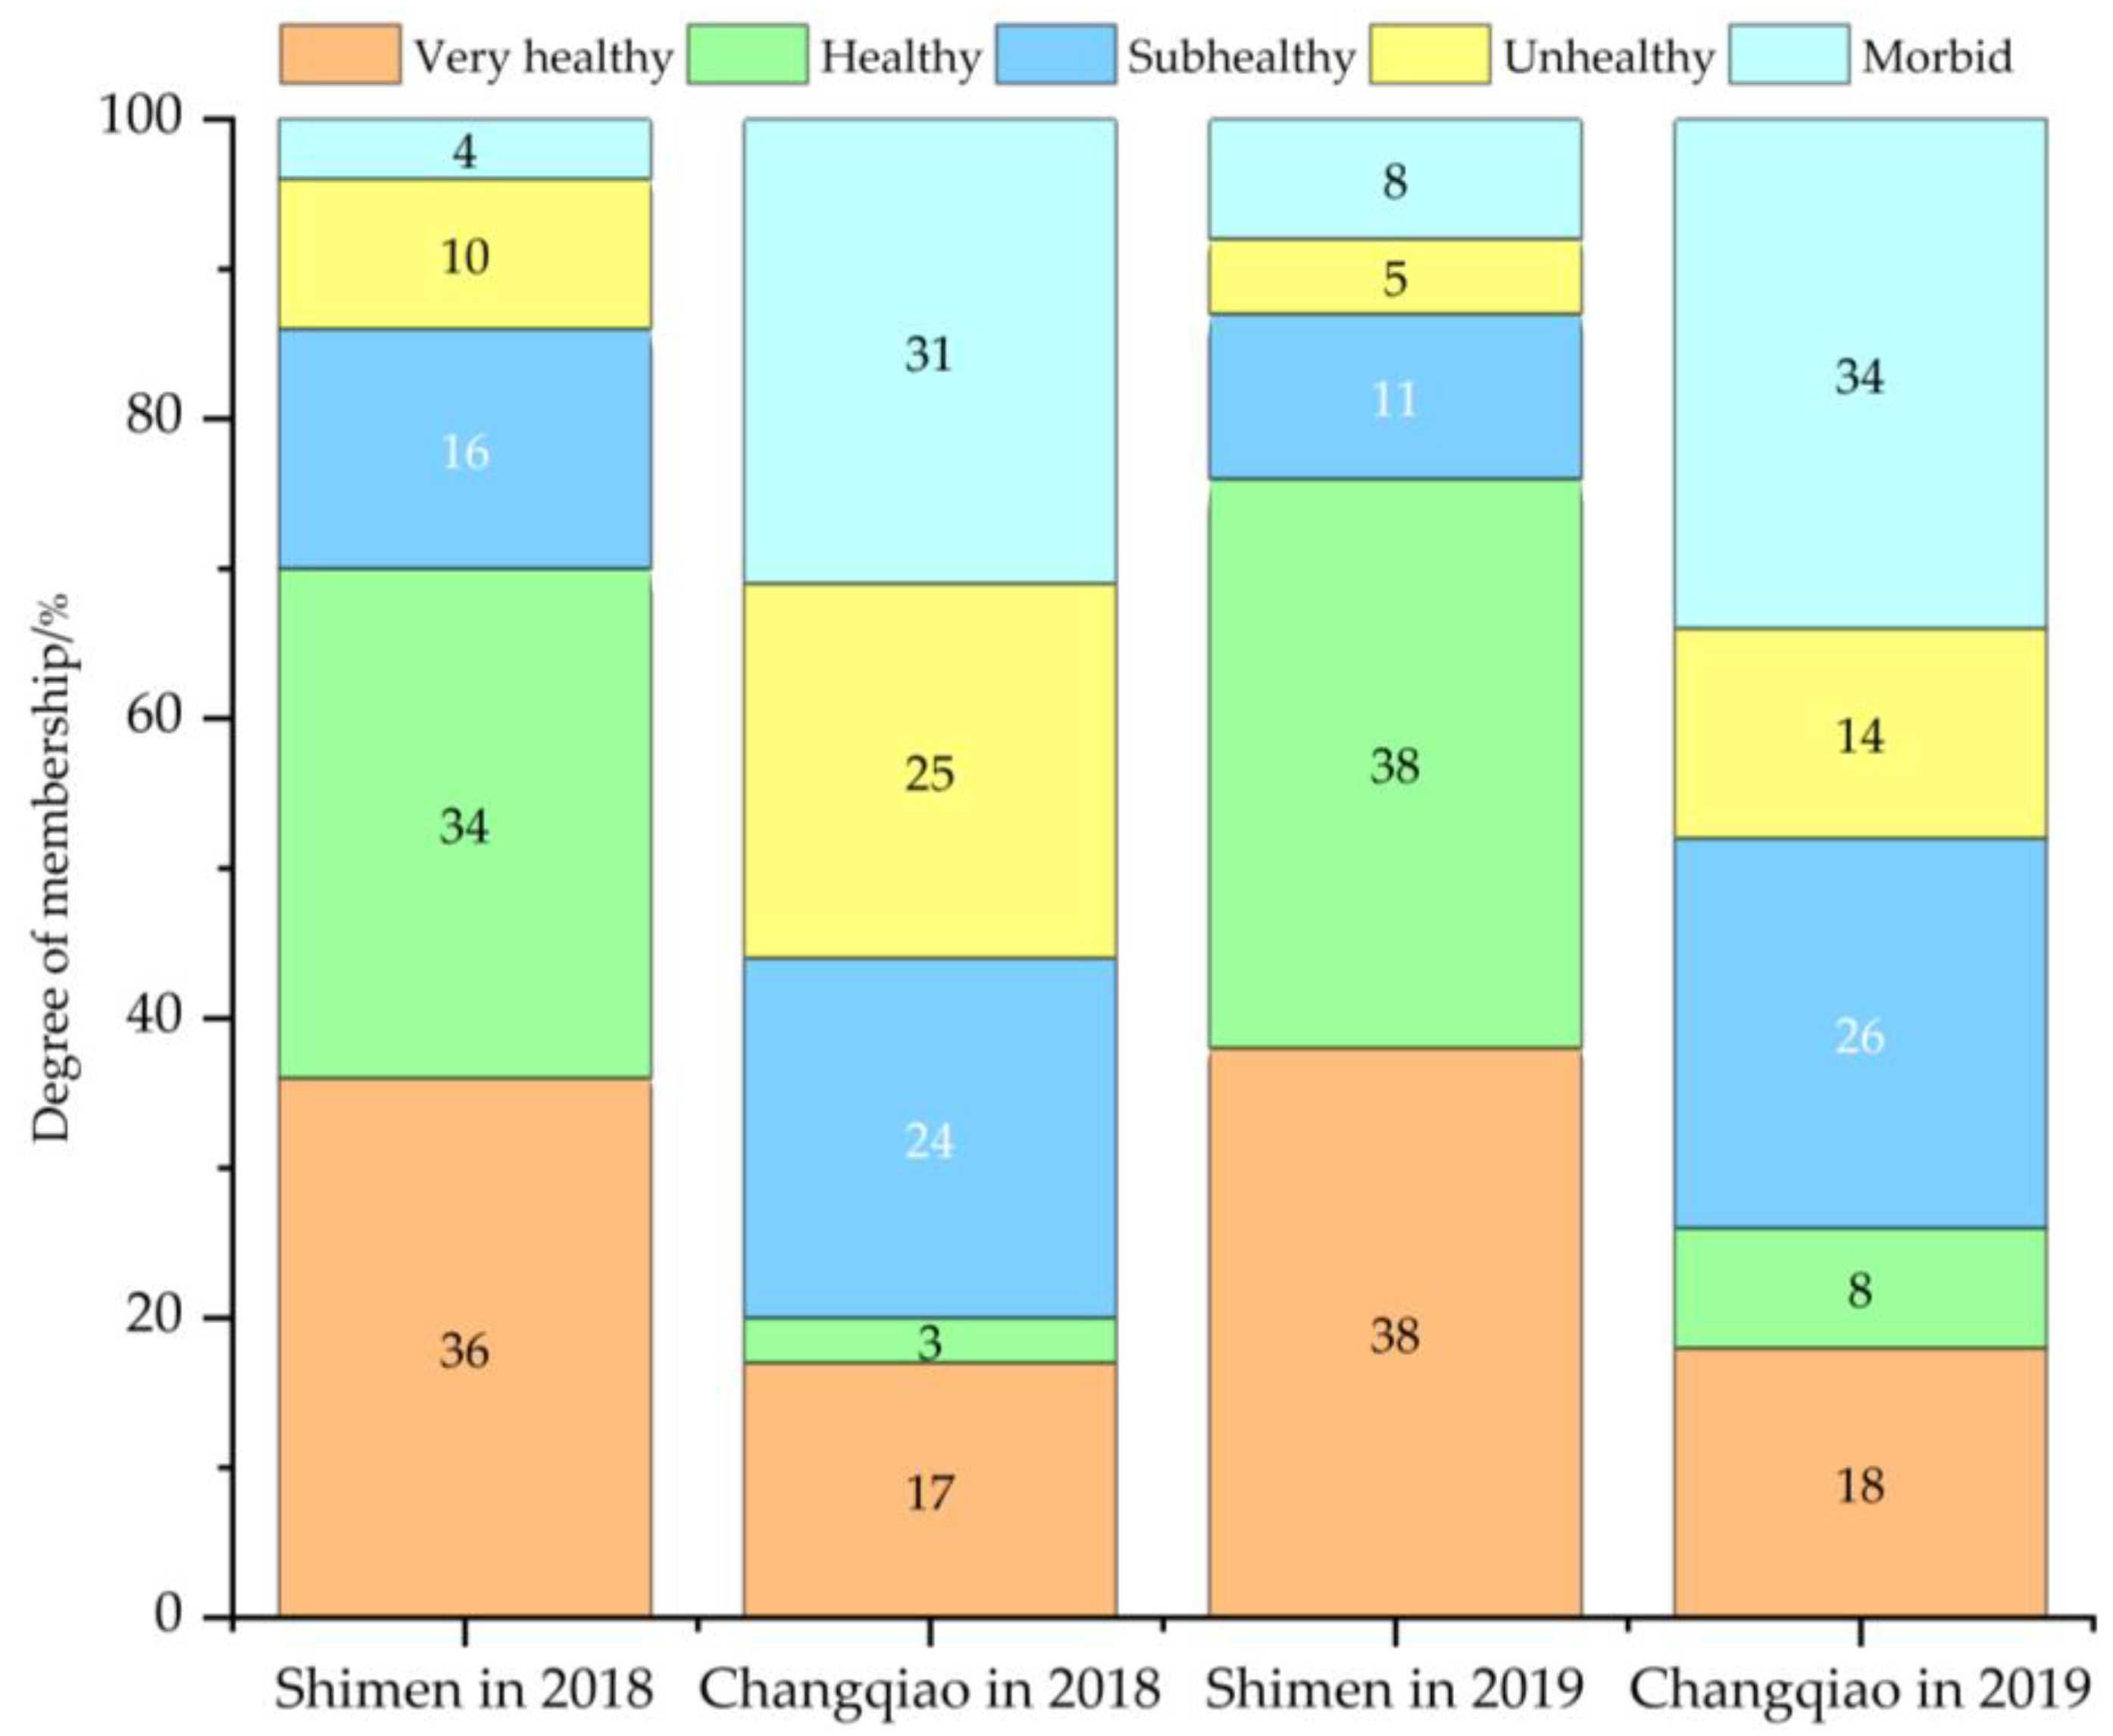
4.3. Calculation Results of Fuzzy Evaluation
5. Discussion
6. Conclusions
Author Contributions
Funding
Data Availability Statement
Acknowledgments
Conflicts of Interest
References
- Xrz, A.; Drz, B.; Yuan, D.C. An environmental flow method applied in small and medium-sized mountainous rivers. Water Sci. Eng. 2021, 14, 323–329. [Google Scholar] [CrossRef]
- Serhat, K. Environmental risk assessment of small hydropower (SHP) plants: A case study for Tefen SHP plant on Filyos River. Energy Sustain. Dev. 2014, 19, 102–110. [Google Scholar] [CrossRef]
- Ding, Z.Y.; Fang, G.H.; Huang, X.F.; Yuan, Y. Optimized operation of diversion-type hydropower reservoir to alleviate ecological degradation of the de-watered river reach. Arab. J. Geosci. 2019, 12, 623. [Google Scholar] [CrossRef]
- Liao, T.T. Discussion on rural small hydropower exit and transformation and upgrading pilot in Fujian province. Hydraul. Sci. Technol. 2016, 3, 53–56. (In Chinese) [Google Scholar]
- Nagayama, S.; Ishiyama, N.; Seno, T.; Kawai, H.; Kawaguchi, Y.; Nakano, D.; Nakamura, F. Time Series Changes in Fish Assemblages and Habitat Structures Caused by Partial Check Dam Removal. Water 2020, 12, 3357. [Google Scholar] [CrossRef]
- Lu, B.; Gu, H.B.; Jiang, H. Brief Analysis on Environmental Assessment for Dam Removal of Small Hydropower Project. J. Hydroelectr. Eng. 2019, 45, 12–16. (In Chinese) [Google Scholar]
- Song, L.; Alfredo, H.; Jamie, C.; Gao, S.C.; Yu, Q.; Meng, X.Y.; Qi, J.Y.; Zhang, R.R.; Wang, Q.F. Assessing the Impact of Extreme Droughts on Dryland Vegetation by Multi-Satellite Solar-Induced Chlorophyll Fluorescence. Remote Sens. 2022, 14, 1581. [Google Scholar] [CrossRef]
- Wu, X.P.; Zhang, R.R.; Virgílio, A.B.; Song, L.; Qi, J.Y.; Zeng, J.Y.; Wang, Q.F. The Effect of Drought on Vegetation Gross Primary Productivity under Different Vegetation Types across China from 2001 to 2020. Remote Sens. 2022, 14, 4658. [Google Scholar] [CrossRef]
- Wang, Q.; Zeng, J.; Qi, J.; Zhang, X.; Cong, J.A. multi-scale daily SPEI dataset for drought characterization at observation stations over mainland China from 1961 to 2018. Earth Syst. Sci. Data 2021, 13, 331–341. [Google Scholar] [CrossRef]
- Wang, Q.H.; Peng, Y.; Fan, M.; Zhang, Z.; Cui, Q.T. An improved daily standardized precipitation index dataset for mainland China from 1961 to 2018. Sci. Data 2022, 9, 124. [Google Scholar] [CrossRef]
- Yang, T.; Liu, J.L.; Chen, Q.Y. Assessment of plain river ecosystem function based on improved gray system model and analytic hierarchy process for the Fuyang River, Haihe River Basin, China. Ecol. Model. 2013, 268, 37–47. [Google Scholar] [CrossRef]
- Mrozińska, N.; Glińska-Lewczuk, K.; Burandt, P.; Kobus, S.; Gotkiewicz, W.; Szymańska, M.; Bąkowska, M.; Obolewski, K. Water Quality as an Indicator of Stream Restoration Effects—A Case Study of the Kwacza River Restoration Project. Water 2018, 10, 1249. [Google Scholar] [CrossRef]
- Bhutiani, R.; Khanna, D.R.; Dipali, B.K. Assessment of Ganga river ecosystem at Haridwar, Uttarakhand, India with reference to water quality indices. Water 2014, 6, 107–113. [Google Scholar] [CrossRef] [Green Version]
- Higgisson, W.P.; Downey, P.O.; Dyer, F.J. Changes in Vegetation and Geomorphological Condition 10 Years after Riparian Restoration. Water 2019, 11, 1252. [Google Scholar] [CrossRef] [Green Version]
- Xue, C.Y.; Shao, C.F.; Chen, S.H. SDGs-Based River Health Assessment for Small- and Medium-Sized Watersheds. Sustainability 2020, 12, 1846. [Google Scholar] [CrossRef] [Green Version]
- Zhao, W.; Guo, W.; Zhao, L.; Li, Q.; Cao, X.; Tang, X. Influence of Different Types of Small Hydropower Stations on Macroinvertebrate Communities in the Changjiang River Basin, China. Water 2019, 11, 1892. [Google Scholar] [CrossRef] [Green Version]
- HaRa, J.; Mamun, M.; An, K.G. Ecological River Health Assessments Using Chemical Parameter Model and the Index of Biological Integrity Model. Water 2019, 11, 1729. [Google Scholar] [CrossRef] [Green Version]
- Yao, N.; Feng, B.; Zhang, M.; He, L.; Zhang, H.; Liu, Z. Impact of Industrial Production, Dam Construction, and Agriculture on the Z-IBI in River Ecosystems: A Case Study of the Wanan River Basin in China. Water 2021, 13, 123. [Google Scholar] [CrossRef]
- Česonienė, L.; Dapkienė, M.; Punys, P. Assessment of the Impact of Small Hydropower Plants on the Ecological Status Indicators of Water Bodies: A Case Study in Lithuania. Water 2021, 13, 433. [Google Scholar] [CrossRef]
- Kim, J.Y.; An, K.G. Integrated Ecological River Health Assessments, Based on Water Chemistry, Physical Habitat Quality and Biological Integrity. Water 2015, 7, 6378–6403. [Google Scholar] [CrossRef] [Green Version]
- Fu, X.Q.; Zou, Z.H. Water Quality Evaluation of the Yellow River Basin Based on Gray Clustering Method. In Proceedings of the IOP Conference Series: Earth and Environmental Science, Yogyakarta, Indonesia, 11–12 October 2018; Volume 128. [Google Scholar] [CrossRef] [Green Version]
- Hong, T.T.K.; Giao, N.T. Analysis of Surface Water Quality in Upstream Province of Vietnamese Mekong Delta Using Multivariate Statistics. Water 2022, 14, 1975. [Google Scholar] [CrossRef]
- Ge, Y.; Wu, J.; Zhang, D.; Jia, R.; Yang, H. Uncertain Analysis of Fuzzy Evaluation Model for Water Resources Carrying Capacity: A Case Study in Zanhuang County, North China Plain. Water 2021, 13, 2804. [Google Scholar] [CrossRef]
- Zhang, J.; Li, Y.; Liu, C.; Qu, Z.; Li, F.; Yang, Z.; Jiang, L.; Fu, J. Application of Set Pair Analysis in a Comprehensive Evaluation of Water Resource Assets: A Case Study of Wuhan City, China. Water 2019, 11, 1718. [Google Scholar] [CrossRef] [Green Version]
- Ren, B.; Zhang, Q.; Ren, J.; Ye, S.; Yan, F. A Novel Hybrid Approach for Water Resources Carrying Capacity Assessment by Integrating Fuzzy Comprehensive Evaluation and Analytical Hierarchy Process Methods with the Cloud Model. Water 2020, 12, 3241. [Google Scholar] [CrossRef]
- Gui, C.; Fan, D.H.; Zhong, F.G.; Yan, P.Y. A hybrid fuzzy evaluation method for curtain grouting efficiency assessment based on an AHP method extended by D numbers. Expert Syst. Appl. 2016, 44, 289–303. [Google Scholar] [CrossRef]
- Zhao, W.; Xiao, C.; Chai, Y.; Feng, X.; Liang, X.; Fang, Z. Application of a New Improved Weighting Method, ESO Method Combined with Fuzzy Synthetic Method, in Water Quality Evaluation of Chagan Lake. Water 2021, 13, 1424. [Google Scholar] [CrossRef]
- Song, P.; Wang, X.; Wang, C.; Lu, M.; Chen, L.; Kong, L.; Lei, X.; Wang, H. Analysis of Agricultural Water Use Efficiency Based on Analytic Hierarchy Process and Fuzzy Comprehensive Evaluation in Xinjiang, China. Water 2020, 12, 3266. [Google Scholar] [CrossRef]
- Liu, Z.; Zhu, H.; Cui, X.; Wang, W.; Luan, X.; Chen, L.; Cui, Z.; Zhang, L. Groundwater Quality Evaluation of the Dawu Water Source Area Based on Water Quality Index (WQI): Comparison between Delphi Method and Multivariate Statistical Analysis Method. Water 2021, 13, 1127. [Google Scholar] [CrossRef]
- Ye, X.; Zhou, Y.; Lu, Y.; Du, X. Hydrochemical Evolution and Quality Assessment of Groundwater in the Sanjiang Plain, China. Water 2022, 14, 1265. [Google Scholar] [CrossRef]
- Giao, N.T.; Dan, T.H.; Ni, D.V.; Anh, P.K.; Nhien, H.T.H. Spatiotemporal Variations in Physicochemical and Biological Properties of Surface Water Using Statistical Analyses in Vinh Long Province, Vietnam. Water 2022, 14, 2200. [Google Scholar] [CrossRef]
- Chen, J.; Zhao, M.; Zhou, H. Application of Fuzzy Comprehensive Evaluation Method in Evaluation of Water Quality Based Game Theory. Water Resour. Power 2019, 37, 32–35. (In Chinese) [Google Scholar]
- Yang, B.; Lai, C.; Chen, X.; Wu, X.; He, Y. Surface Water Quality Evaluation Based on a Game Theory-Based Cloud Model. Water 2018, 10, 510. [Google Scholar] [CrossRef]
- Lai, C.; Chen, X.; Chen, X.; Wang, Z.; Wu, X.; Zhao, S.W. A fuzzy comprehensive evaluation model for flood risk based on the combination weight of game theory. Nat. Hazards 2015, 77, 1243–1259. [Google Scholar] [CrossRef]
- Yu, F.; Liu, F.; Xia, Z.; Lin, P.; Xu, C.; Wang, J.; Hou, M.; Zou, X. Classification and Assessment Methods for Mountain Channel Habitats in the Chishui River Basin, China. Water 2022, 14, 515. [Google Scholar] [CrossRef]
- Bednarek, A.T. Undamming rivers: A review of the ecological impacts of dam removal. Env. Manag. 2001, 27, 803–814. [Google Scholar] [CrossRef] [PubMed]
- Wang, L.L. Study on the Evaluation System of Medium and Small Rivers Health and Its Application to Majinxi River. Master’s Thesis, Zhejiang University, Hangzhou, China, 2017. (In Chinese). [Google Scholar]
- Zhang, K.; Shen, J.; Han, H. Urban River Health Analysis of the Jialu River in Zhengzhou City Using the Improved Fuzzy Matter-Element Extension Model. Water. 2019, 11, 1190. [Google Scholar] [CrossRef] [Green Version]
- Wei, J.F. Ecology of Benthic Macroinvertebrates in Nanxi River. Master’s Thesis, Yunnan Nomal University, Kunming, China, 2021. (In Chinese). [Google Scholar]
- Bao, L.L.; Li, X.Y.; Zhi, S.J. Effects of Damming and Channel Hardening on River Ecosystem health in Zhangjiakou City. J. Hydroecol. 2021, 42, 1–9. (In Chinese) [Google Scholar]
- Ma, L.; Wang, H.; Qi, C.; Zhang, X.; Zhang, H. Characteristics and Adaptability Assessment of Commonly Used Ecological Flow Methods in Water Storage and Hydropower Projects, the Case of Chinese River Basins. Water 2019, 11, 2035. [Google Scholar] [CrossRef] [Green Version]
- Tullos, D.D.; Finn, D.S.; Walter, C. Geomorphic and ecological disturbance and recovery from two small dams and their removal. PLoS ONE 2017, 9, e108091. [Google Scholar] [CrossRef]
- Xiang, Y.; Sheng, J.B.; Yang, M. Impacts on ecological environment due to dam removal or decommissioning. Chin. J. Geotech. Eng. 2008, 11, 1758–1764. (In Chinese) [Google Scholar]
- Ministry of Water Resources of China. Technical Guidelines for River and Lake Health Assessment (SL/T 793-2020); Ministry of Water Resources of China: Beijing, China, 2020. [Google Scholar]
- Li, P.; Li, D.; Sun, X.; Chu, Z.; Xia, T.; Zheng, B. Application of Ecological Restoration Technologies for the Improvement of Biodiversity and Ecosystem in the River. Water 2022, 14, 1402. [Google Scholar] [CrossRef]
- State Environmental Protection Administration. State Environmental Protection Administration. Environmental Quality Standards for Surface Water(GB3838-2002); State Environmental Protection Administration: Beijing, China, 2002. [Google Scholar]
- Sun, J.; Han, Y.; Li, Y.; Zhang, P.; Liu, L.; Cai, Y.; Li, M.; Wang, H. Construction of a Near-Natural Estuarine Wetland Evaluation Index System Based on Analytical Hierarchy Process and Its Application. Water 2021, 13, 2116. [Google Scholar] [CrossRef]
- Sun, C.; Chen, W. Fuzzy comprehensive model based on combination weighting in watershed application of ecological health assessment. In Proceedings of the IOP Conference Series: Earth and Environmental Science, Leuven, Belgium, 20–22 March 2019; Volume 227, p. 52009. [Google Scholar] [CrossRef]
- Shan, C.J.; Dong, Z.C.; Lu, D.B.; Xu, C.D.; Wang, H.; Ling, Z.; Liu, Q. Study on river health assessment based on a fuzzy matter-element extension model. Ecol. Indic. 2021, 127, 107742. [Google Scholar] [CrossRef]
- Shan, W.; Cai, S.; Liu, C. A New Comprehensive Evaluation Method for Water Quality: Improved Fuzzy Support Vector Machine. Water 2018, 10, 1303. [Google Scholar] [CrossRef]


| Target Layer | Criterion Layer | Index Layer |
|---|---|---|
| Ecological health of river reach A | Hydrological characteristics B1 | Flow reduction degree C11 |
| Change degree of water area C12 | ||
| Water quality characteristic B2 | Stability of water temperature structure in upstream and downstream of dam C21 | |
| DO C22 | ||
| Total nitrogen (TN) C23 | ||
| BOD5 C24 | ||
| Biological characteristics B3 Morphological structure characteristics B4 | Fish diversity index C31 | |
| Benthic animal diversity index C32 | ||
| Lateral stability C41 | ||
| Sediment type C42 | ||
| Longitudinal connectivity C43 |
| Index Layer | Very Healthy | Healthy | Subhealthy | Unhealthy | Morbid |
|---|---|---|---|---|---|
| Quantitative index score | (80–100) | (60–80) | (40–60) | (20–40) | (0–20) |
| Qualitative index score *1 | 100 | 80 | 60 | 40 | 20 |
| Flow reduction degree C11 | The dam is completely removed, and the water is fully restored to the natural river channel | The dam is not demolished, and the discharge from bottom hole is carried out to restore the water to the river | The dam is not removed, the water-retaining gate is opened, and the water flow is discharged from the gate in the dry season, with diversion in the diversion channel | The ecological renovation is carried out by adding drainage channels and ecological units to maintain the discharge of ecological flow | Diversion power station without ecological flow renovation |
| Change degree of water area C12 | <15 | [15, 30) | [30, 45) | [45, 60) | ≥60 |
| Stability of water temperature Structure in upstream and downstream of dam *2 C21 | The water temperature structure of upstream and down-stream reaches of dam is the same as that of the natural river, stable and without obvious water temperature stratification | The overall water temperature structure of upstream and downstream of dam is less affected by the dam, close to the natural river state | Reservoir section transports water to downstream of dam through surface overflow, and there is difference in water temperature structure between upstream and downstream of dam | The reservoir section transports the bottom water temperature to the downstream through drainage channels and facilities, and the water temperature structure in upstream and downstream of dam is different and unstable | There is no discharge flow in the reservoir area and no water temperature structure in the downstream of dam |
| DO [46] C22 | ≥6 | [5, 6) | [3, 5) | [2, 3) | [0, 2) |
| TN [46] C23 | 0.5 | [0.5, 1) | [1, 1.5) | [1.5, 2) | ≥2 |
| BOD5 [46] C24 | 3 | [3, 4) | [4, 6) | [6, 10) | ≥10 |
| Fish diversity index [38] C31 | ≥2 | [1.5, 2) | [1, 1.5) | [0.5, 1) | <0.5 |
| Benthic animal diversity index [39] C32 | ≥3 | [2, 3) | [1, 2) | [0, 1) | 0 |
| Lateral stability coefficient [37] C41 | ≥1.5 | [1.2, 1.5) | [1, 1.2) | [0.8, 1) | <0.8 |
| Sediment type [40] C42 | Bedrock, cobble and gravel, sand, clay of 4 categories appear | Bedrock, cobble and gravel, sand, clay appear in 3 categories | Bedrock, cobble and gravel, sand, clay appear in 2 categories | Bedrock, cobble and gravel, sand, clay appear in 1 categries | Riverbed is hardened without containing any of the above components |
| Longitudinal connectivity C43 | The dam is completely removed without retaining the dam foundation. At the same time, the river channel is cleared, which does not affect the normal migration of fish | The dam is re-moved, the dam foundation is retained, and the water is restored to the natural river channel, which has a small impact on fish migration | The dam is not removed, and the bottom hole discharge is carried out to restore the water to the river, which has a partial impact on fish migration | The water-retaining gate is opened, and the water flows from the gate in the dry season, so the fish cannot migrate correctly | The ecological transformation is carried out by adding drainage channels and ecological units to maintain the discharge of ecological flow, and fish cannot migrate normally |
| Water Quality | Stability of Water Temperature Structure in Upstream and Downstream of Dam | DO | TN | BOD5 | Weight Value ψ | Parameter Value |
|---|---|---|---|---|---|---|
| Stability of water temperature structure in upstream and downstream of dam | 1 | 1/5 | 1/3 | 1/3 | 0.078 | = 4 CR = 3.33 × 10⁻¹⁶ |
| DO | 5 | 1 | 3 | 3 | 0.522 | |
| TN | 3 | 1/3 | 1 | 1 | 0.2 | |
| BOD5 | 3 | 1/3 | 1 | 1 | 0.2 | |
| Biology | Fish diversity index | Benthic animal diversity index | Weight value ψ | Parameter value | ||
| Fish diversity index | 1 | 1 | 0.5 | = 2 CR = 0 < 0.1 | ||
| Benthic animal diversity index | 1 | 1 | 0.5 | |||
| River Reach | Stability of Water Temperature Structure in Upstream and Downstream of Dam | DO | TN | BOD5 | ||||
| Actual Value | Actual Value | Actual Value | Actual Value | |||||
| Shimen | 100 | 0.24 | 8 | 0.33 | 1.29 | 0.35 | 7.26 | 0.35 |
| Changqiao | 40 | 0.36 | 6.9 | 0.36 | 1.38 | 0.34 | 7.4 | 0.35 |
| 0.60 | 0.69 | 0.69 | 0.69 | |||||
| 1.67 | 1.45 | 1.44 | 1.44 | |||||
| 0.28 | 0.24 | 0.24 | 0.24 | |||||
| River Reach | Fish Diversity Index | Benthic Animal Diversity Index | ||||||
| Actual Value | Actual Value | |||||||
| Shimen | 1.81 | 0.20 | 1.17 | 0.33 | ||||
| Changqiao | 1.15 | 0.37 | 1.02 | 0.36 | ||||
| 0.67 | 0.69 | |||||||
| 1.50 | 1.45 | |||||||
| 0.51 | 0.49 | |||||||
Disclaimer/Publisher’s Note: The statements, opinions and data contained in all publications are solely those of the individual author(s) and contributor(s) and not of MDPI and/or the editor(s). MDPI and/or the editor(s) disclaim responsibility for any injury to people or property resulting from any ideas, methods, instructions or products referred to in the content. |
© 2023 by the authors. Licensee MDPI, Basel, Switzerland. This article is an open access article distributed under the terms and conditions of the Creative Commons Attribution (CC BY) license (https://creativecommons.org/licenses/by/4.0/).
Share and Cite
Cai, F.; Hu, Z.; Jiang, B.; Ruan, W.; Cai, S.; Zou, H. Ecological Health Assessment with the Combination Weight Method for the River Reach after the Retirement and Renovation of Small Hydropower Stations. Water 2023, 15, 355. https://doi.org/10.3390/w15020355
Cai F, Hu Z, Jiang B, Ruan W, Cai S, Zou H. Ecological Health Assessment with the Combination Weight Method for the River Reach after the Retirement and Renovation of Small Hydropower Stations. Water. 2023; 15(2):355. https://doi.org/10.3390/w15020355
Chicago/Turabian StyleCai, Feng, Zhinan Hu, Beihan Jiang, Weifang Ruan, Shujuan Cai, and Huiling Zou. 2023. "Ecological Health Assessment with the Combination Weight Method for the River Reach after the Retirement and Renovation of Small Hydropower Stations" Water 15, no. 2: 355. https://doi.org/10.3390/w15020355