
Multi-Site Calibration of Hydrological Model and Spatio-Temporal Assessment of Water Balance in a Monsoon Watershed


Department of Civil and Environmental Engineering, Dongguk University, Seoul 04620, Republic of Korea
*
Author to whom correspondence should be addressed.
Water 2023, 15(2), 360; https://doi.org/10.3390/w15020360
Submission received: 7 December 2022
/
Revised: 6 January 2023
/
Accepted: 10 January 2023
/
Published: 15 January 2023
(This article belongs to the Section Hydrology)
Abstract
:Understanding hydrological processes using hydrological model parameters can improve the management of water resources in a watershed. This research uses the Soil and Water Assessment Tool (SWAT) model in examining the water balance in the Yeongsan River Basin, South Korea. Summer monsoon dominates the region, accounting for about 60–70% of the rain between June to September. The basin is facing significant challenges in water management due to the limited availability of water and the high demand for agricultural water due to the construction of two weirs on the river. To this end, a new multi-site calibration approach-based SWAT hydrological model that can accurately reproduce the hydrological trend and average discharges of the Yeongsan basin for 42 years (1980–2021) was developed. Some statistical matrices (such as Nash–Sutcliffe model efficiency) were utilized in calibrating and validating the model. Results show that the performance indicators for the four investigated stream flow stations were satisfactory. In addition, the water balance study revealed that the highest precipitation and evapotranspiration occurred in August, whereas the highest water yield, lateral flow, and surface flow occurred in July. Further, the model revealed that the Yeongsan river basin receives the majority of its water from the rains during the monsoon season. The model developed in this study can aid planners in managing water resources in the Yeongsan river basin.
1. Introduction
Hydrological models are extensively employed in water resource planning and management research for simulating hydrological processes owing to their cost-effectiveness and efficient time utilization [1,2]. Under a variety of input watershed conditions, such as climatic water availability, and distribution scenarios using hydrological simulation, models can reliably estimate water yield and availability in a basin [3]. Calibration is important for building a consistent and representative river basin-scale model. A common calibration strategy is calibrating a hydrological model at the watershed outlet [4]. This calibration technique is mostly effective for small watersheds. Accordingly, numerous scholars have proposed the use of multi-site calibration to calibrate complex hydrological models of bigger watersheds to achieve significantly enhanced model performance, as this approach effectively represents the spatial variability within the watersheds [5,6,7]. Moreover, relative to calibrating a single-site, multi-site calibration enables more parameter flexibility [8].
The East Asian monsoon that extends from China to Japan is clearly differentiated by having two subsystems: a winter and a summer component [9]. The summer monsoon (rainy season) that occurs yearly from June to September is referred as ‘Mei-yu’ in China, ‘Jangma’ in Korea, and ‘Baiu’ in Japan [10]. Annual precipitation in South Korea in 1939 was 754 mm and in 2003 was 1756 mm, with more frequent severe flooding and drought events [11]. Since June through September receives the majority of the region’s precipitation (68% of the total), any significant changes to the region’s precipitation patterns may indicate a greater vulnerability to drought and/or flooding [12]. In Korea, owing to deteriorating hydro-meteorological conditions and droughts, the consumption of river water for agricultural purposes has increased [13]. Furthermore, the Yeongsan River Basin in South Korea is facing significant challenges in water management due to the limited availability of water and the high demand for agricultural water, resulting from the construction of two weirs on the Yeongsan river [14]. This has resulted in water scarcity in the region, with potentially negative impacts on both the environment and the agricultural sector. Research on water balance can play a crucial role in helping to solve significant challenges in water management by providing the data and insights needed to develop effective solutions for planning and management.
Several complex and conceptual hydrological models have been utilized to simulate a basin’s hydrology in recent years. It is important to carefully consider the appropriateness of a hydrological model when conducting an inter-comparison between conceptual and distributed models. There are a number of factors that should be considered when selecting a hydrological model, including the complexity of the catchment being modeled and the availability of data [15,16]. Physically based distributed models (PBDMs) continue to be widely used and regarded as valuable tools for simulating hydrology due to their ability to accurately represent the physical processes that govern water movement in the environment. PBDMs are able to more accurately represent the complex physical processes that occur within a catchment, such as infiltration, evapotranspiration, and runoff generation [17], resulting in more accurate predictions of water balances and flow regimes. PBDMs are able to capture the spatial and temporal variability of hydrological processes [18], which is important for understanding the variability of water balances and flows within a catchment. PBDMs can be easily modified and customized to represent specific catchments or to incorporate new data and the understanding of physical processes [19]. PBDMs can account for changes in land use and land cover which is important for understanding the impacts of human activities on water balances and flows [18]. Previously reported hydrological models include the Soil and Water Assessment Tool [20], Hydrological Simulation Program Fortran [21], Topographic Model [22], and MIKE SHE [23]. Using a spatial discretization that is either distributed or semi-distributed, these models are able to accurately capture spatial-temporal heterogeneity [24]. The SWAT model is extensively utilized owing to its accessibility and user-friendliness [20]. In the past 30 years, the model experience of the SWAT model has been continuously enhanced by the United States Department of Agriculture–Agricultural Research Service (USDA-ARS) [25,26]. The SWAT model is suitable for this study due to the availability of data to more accurately represent the complex physical processes that occur within the catchment.
Investigations in hydrology for water balance and climate change of many river basins throughout the world have proven effective when using the SWAT model [5,6]. In the Karnali-Mohana Basin of Western Nepal, Pandey et al. [5] evaluated water availability in terms of spatial-temporal distribution using a multi-site approach, which found that evapotranspiration (ET) accounts for 34% of total yearly precipitation loss and compared to the Mountains, the Tarai and Hills are comparatively wetter. In the Betwa river basin of central India, Desae et al. [6] assessed water balance with multi-site streamflow data and found that the basin is rain-fed with 95.3% of runoff during the monsoon season, indicating that the basin can be used for suitable water conservation techniques, such as check dams and farms ponds, to store water for usage in the non-monsoon season. In the northwestern Himalayas, Malik et al. [27] simulated multi-site streamflow calibration for high-altitude catchments and found that when creating a reliable hydrological model, it is crucial to thoroughly understand the hydrological processes within the basin as well as proficiency in a significant number of factors.
Several SWAT model studies in South Korea have focused on the use of a single-site calibration technique for hydrological and climate change modelling [28,29,30,31]; however, no studies have employed the multi-site calibration technique in Korea. In the Yeongsan River watershed, a few studies have employed the SWAT model to investigate the inter-basin water transfer [32] to evaluate agricultural water supply [14] and the implications of various land use scenarios in the Gwanju sub-basin [33], but no studies have employed water balance analysis to provide a better understanding on hydrology using multi-site calibration technique for the Yeongsan river basin, indicating that decision-makers need more studies on the availability of water resources in making decisions on water management. This study aimed to develop a multi-site calibration approach-based SWAT hydrological model for Yeongsan river basin, conduct sensitivity and uncertainty analysis, and then apply the results to seasonal and annual balance across the basin.
2. Area of Study
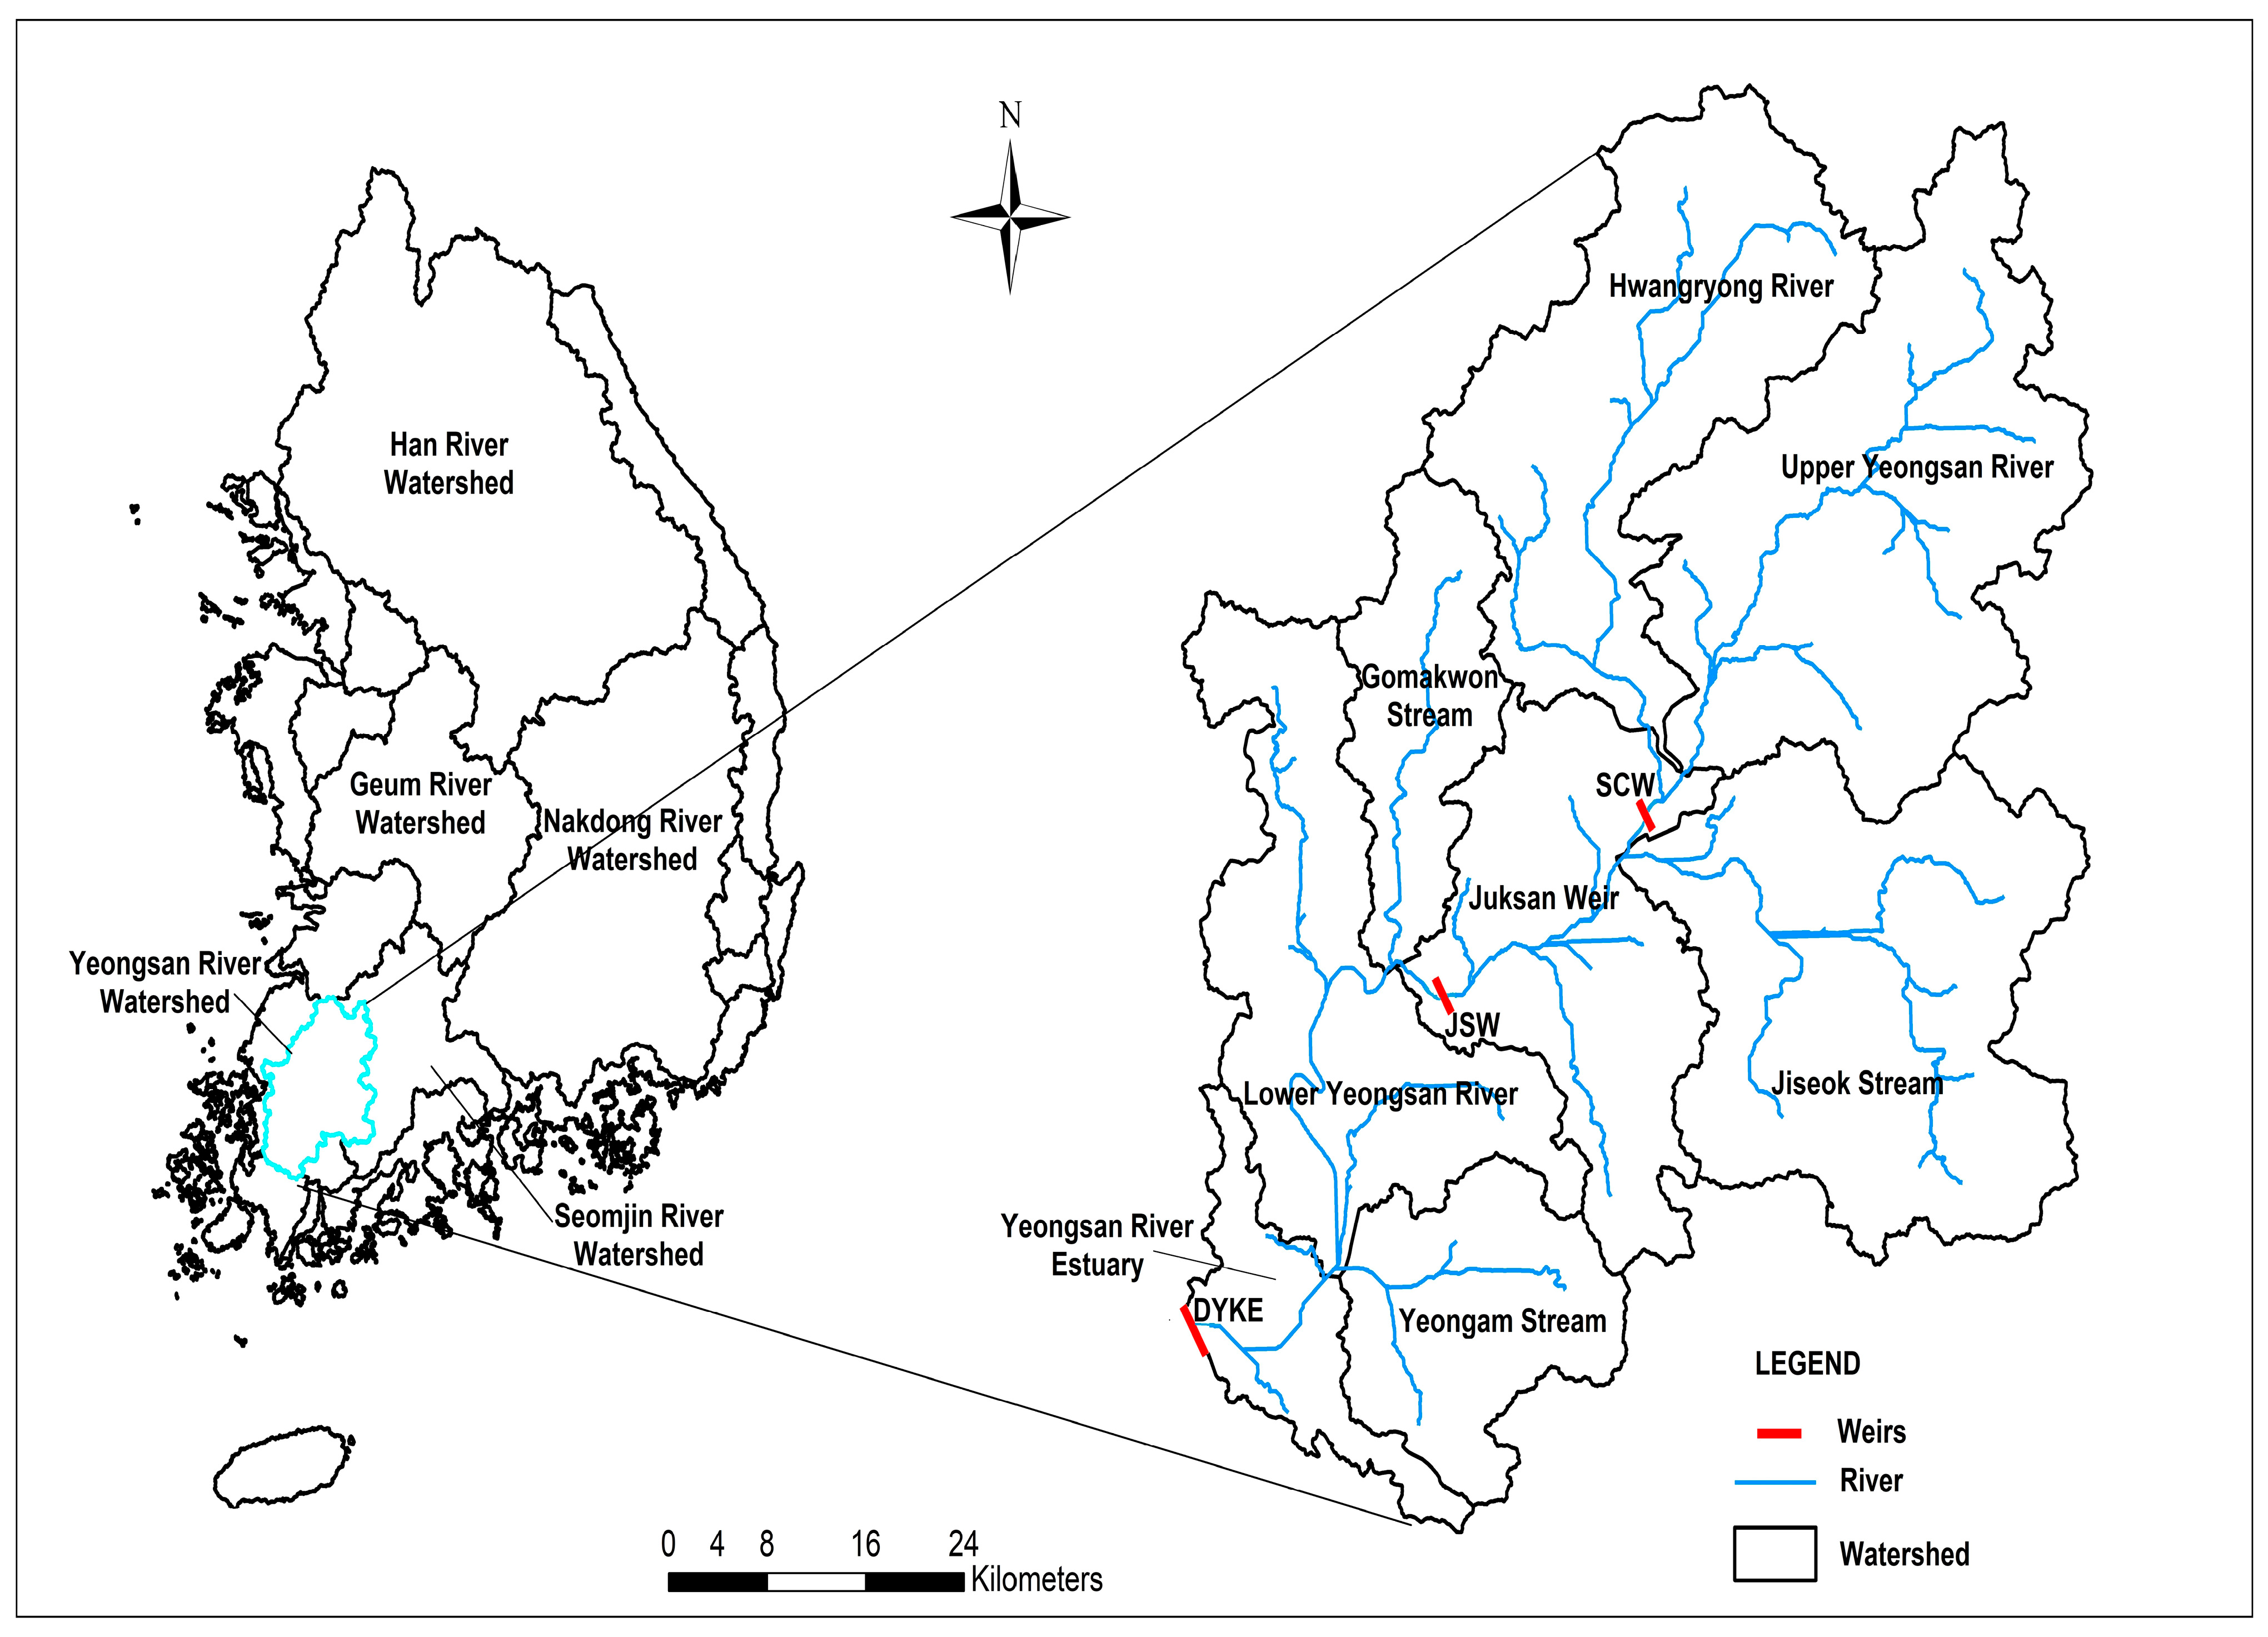
Yeongsan River flows through South Korea’s southwest region and is 129.5 km long with a basin area of 3441.09 km2 (Figure 1). The Yeongsan River is South Korea’s fourth-largest river. Major tributary streams that enter the Yeongsan River watershed include the Hwangnyong River (45 km2), Jiseok Stream (34.5 km2), Gomakwon Stream (21.4 km2), Hampyeong Stream (15 km2) and Gwangju Stream (11.8 km2). These tributaries join the Yeongsan River’s main channel, forming a bigger river.
In the Yeongsan River basin, where almost two million people reside, 13 wastewater treatment facilities are used to treat residential sewage or wastewater from homes; industries; and commercial, industrial, and agricultural operations before the cleaned waters are released back into the main river [34]. Within its drainage catchment, the Yeongsan River contains 169 streams, 1102 dams and reservoirs, an estuary dike, and two weirs. In Four Major Rivers Restoration Project, the two weirs were recently built (Yeongsan river Environmental Management Office, 2018). In the monsoon watershed, there is 1391 mm of annual precipitation and a temperature of 14 °C. Summer monsoon rains from June to September contribute to roughly 60–70% of total runoff. Mountains and steep slopes are characterized by mixed land use areas [14,35,36]. The Yeongsan river basin has the largest proportion of land dedicated to agriculture. Of the land, 5% is used for urban purposes, 32% is used for rice paddies, 18% is used for upland crops, 34% is used for forests, 1% is used for grasslands, 2% is used as bare fields, and 6% is used as water areas. The watershed has an annual average of 3 billion m3 of water resources, which is 3.9% of South Korea’s total water resources of 75.3 billion m3 [37]. The geology of the Yeongsan river basin is characterized by a variety of rock types, including Precambrian gneiss, metasedimentary rocks of the Pyongan System, gneissic granite, Silla sedimentary rocks, and Kyungsang System volcanic rocks. Mesozoic Bulguksa granites can be found in the main rivers, while the upper parts of the high mountains contain Cretaceous volcanic rocks, such as rhyolite, andesite, dacite, and tuff [38,39].
3. Materials and Methods
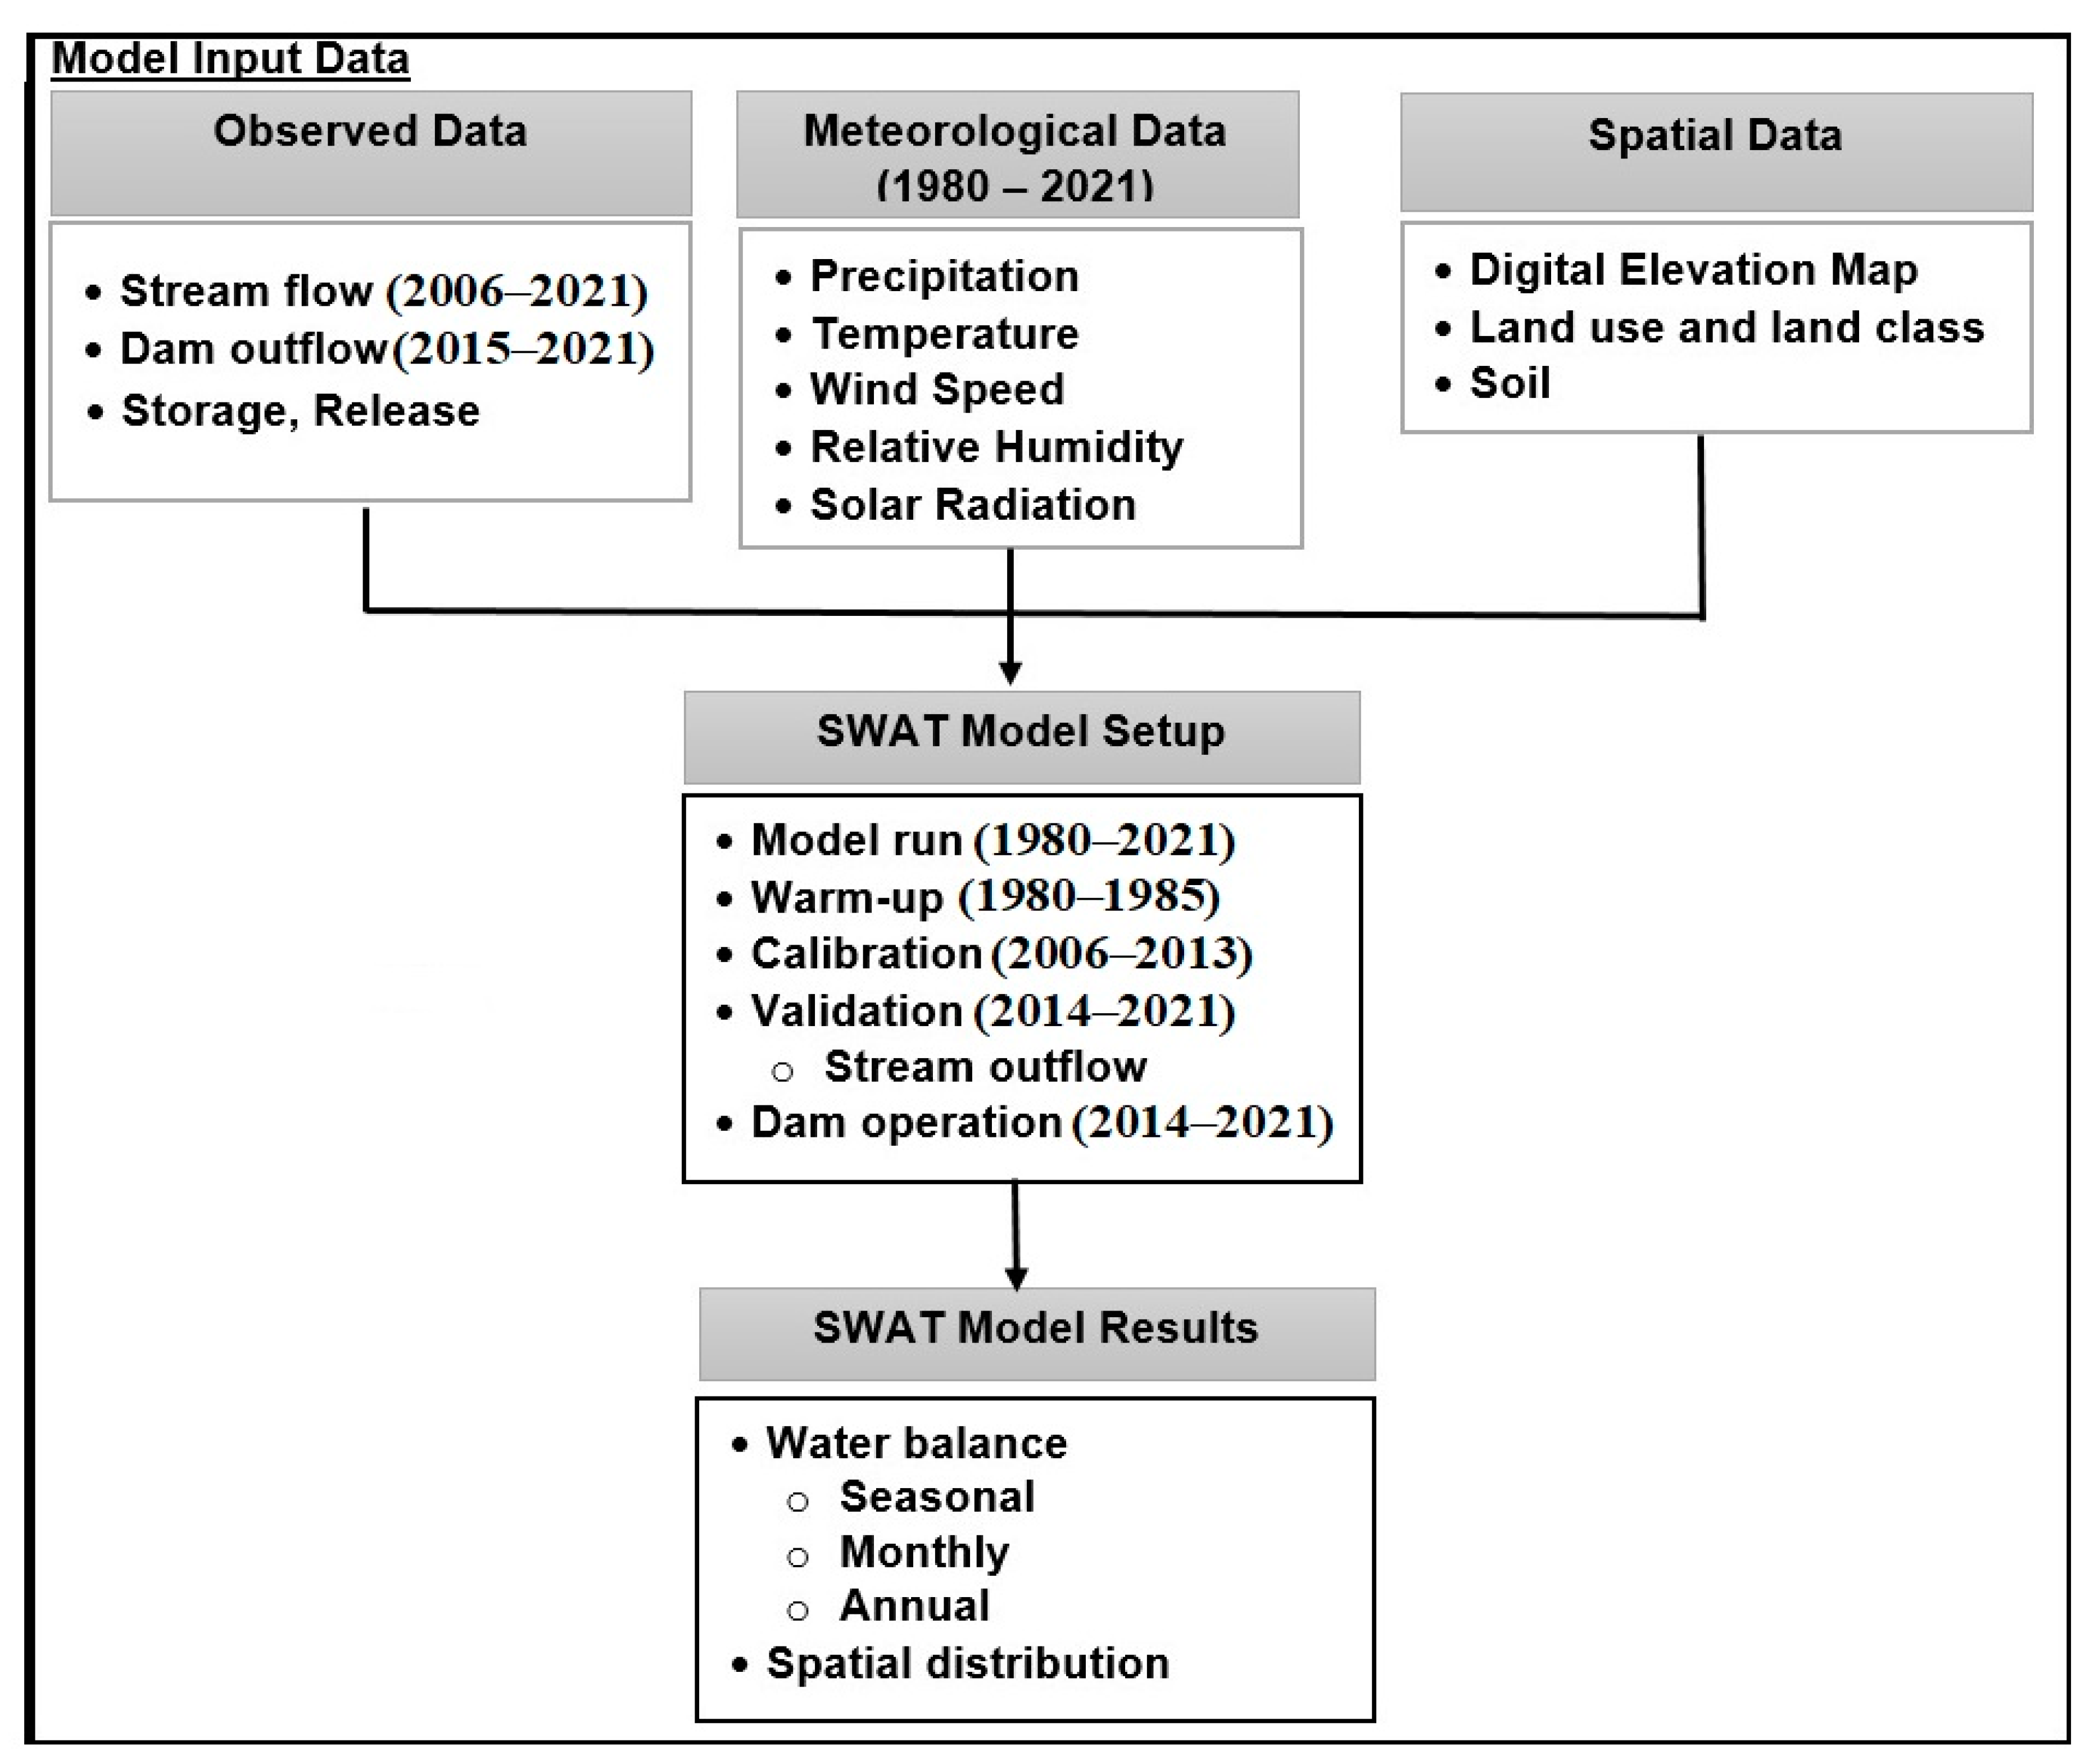
Figure 2 shows a framework of the modelling procedures.
3.1. Hydrological Model
SWAT is a continuous physical-based model for predicting watershed hydrology [40]. SWAT conceptually separates a watershed into sub-basins and further divides it into Hydrologic Response Units (HRUs). Slope, land use, and soil type are all uniquely combined in each HRU. The sub-basins are connected using a stream channel. Equation (1) shows the water balance equation [40]:
Expression details are discussed by Ashu and Lee [30]
3.2. SWAT Input Data
When constructing a SWAT model, spatial and temporal data, including topography, land use, soil, streamflow, reservoir, and streamflow, are utilized.
3.2.1. Digital Elevation Model (DEM)
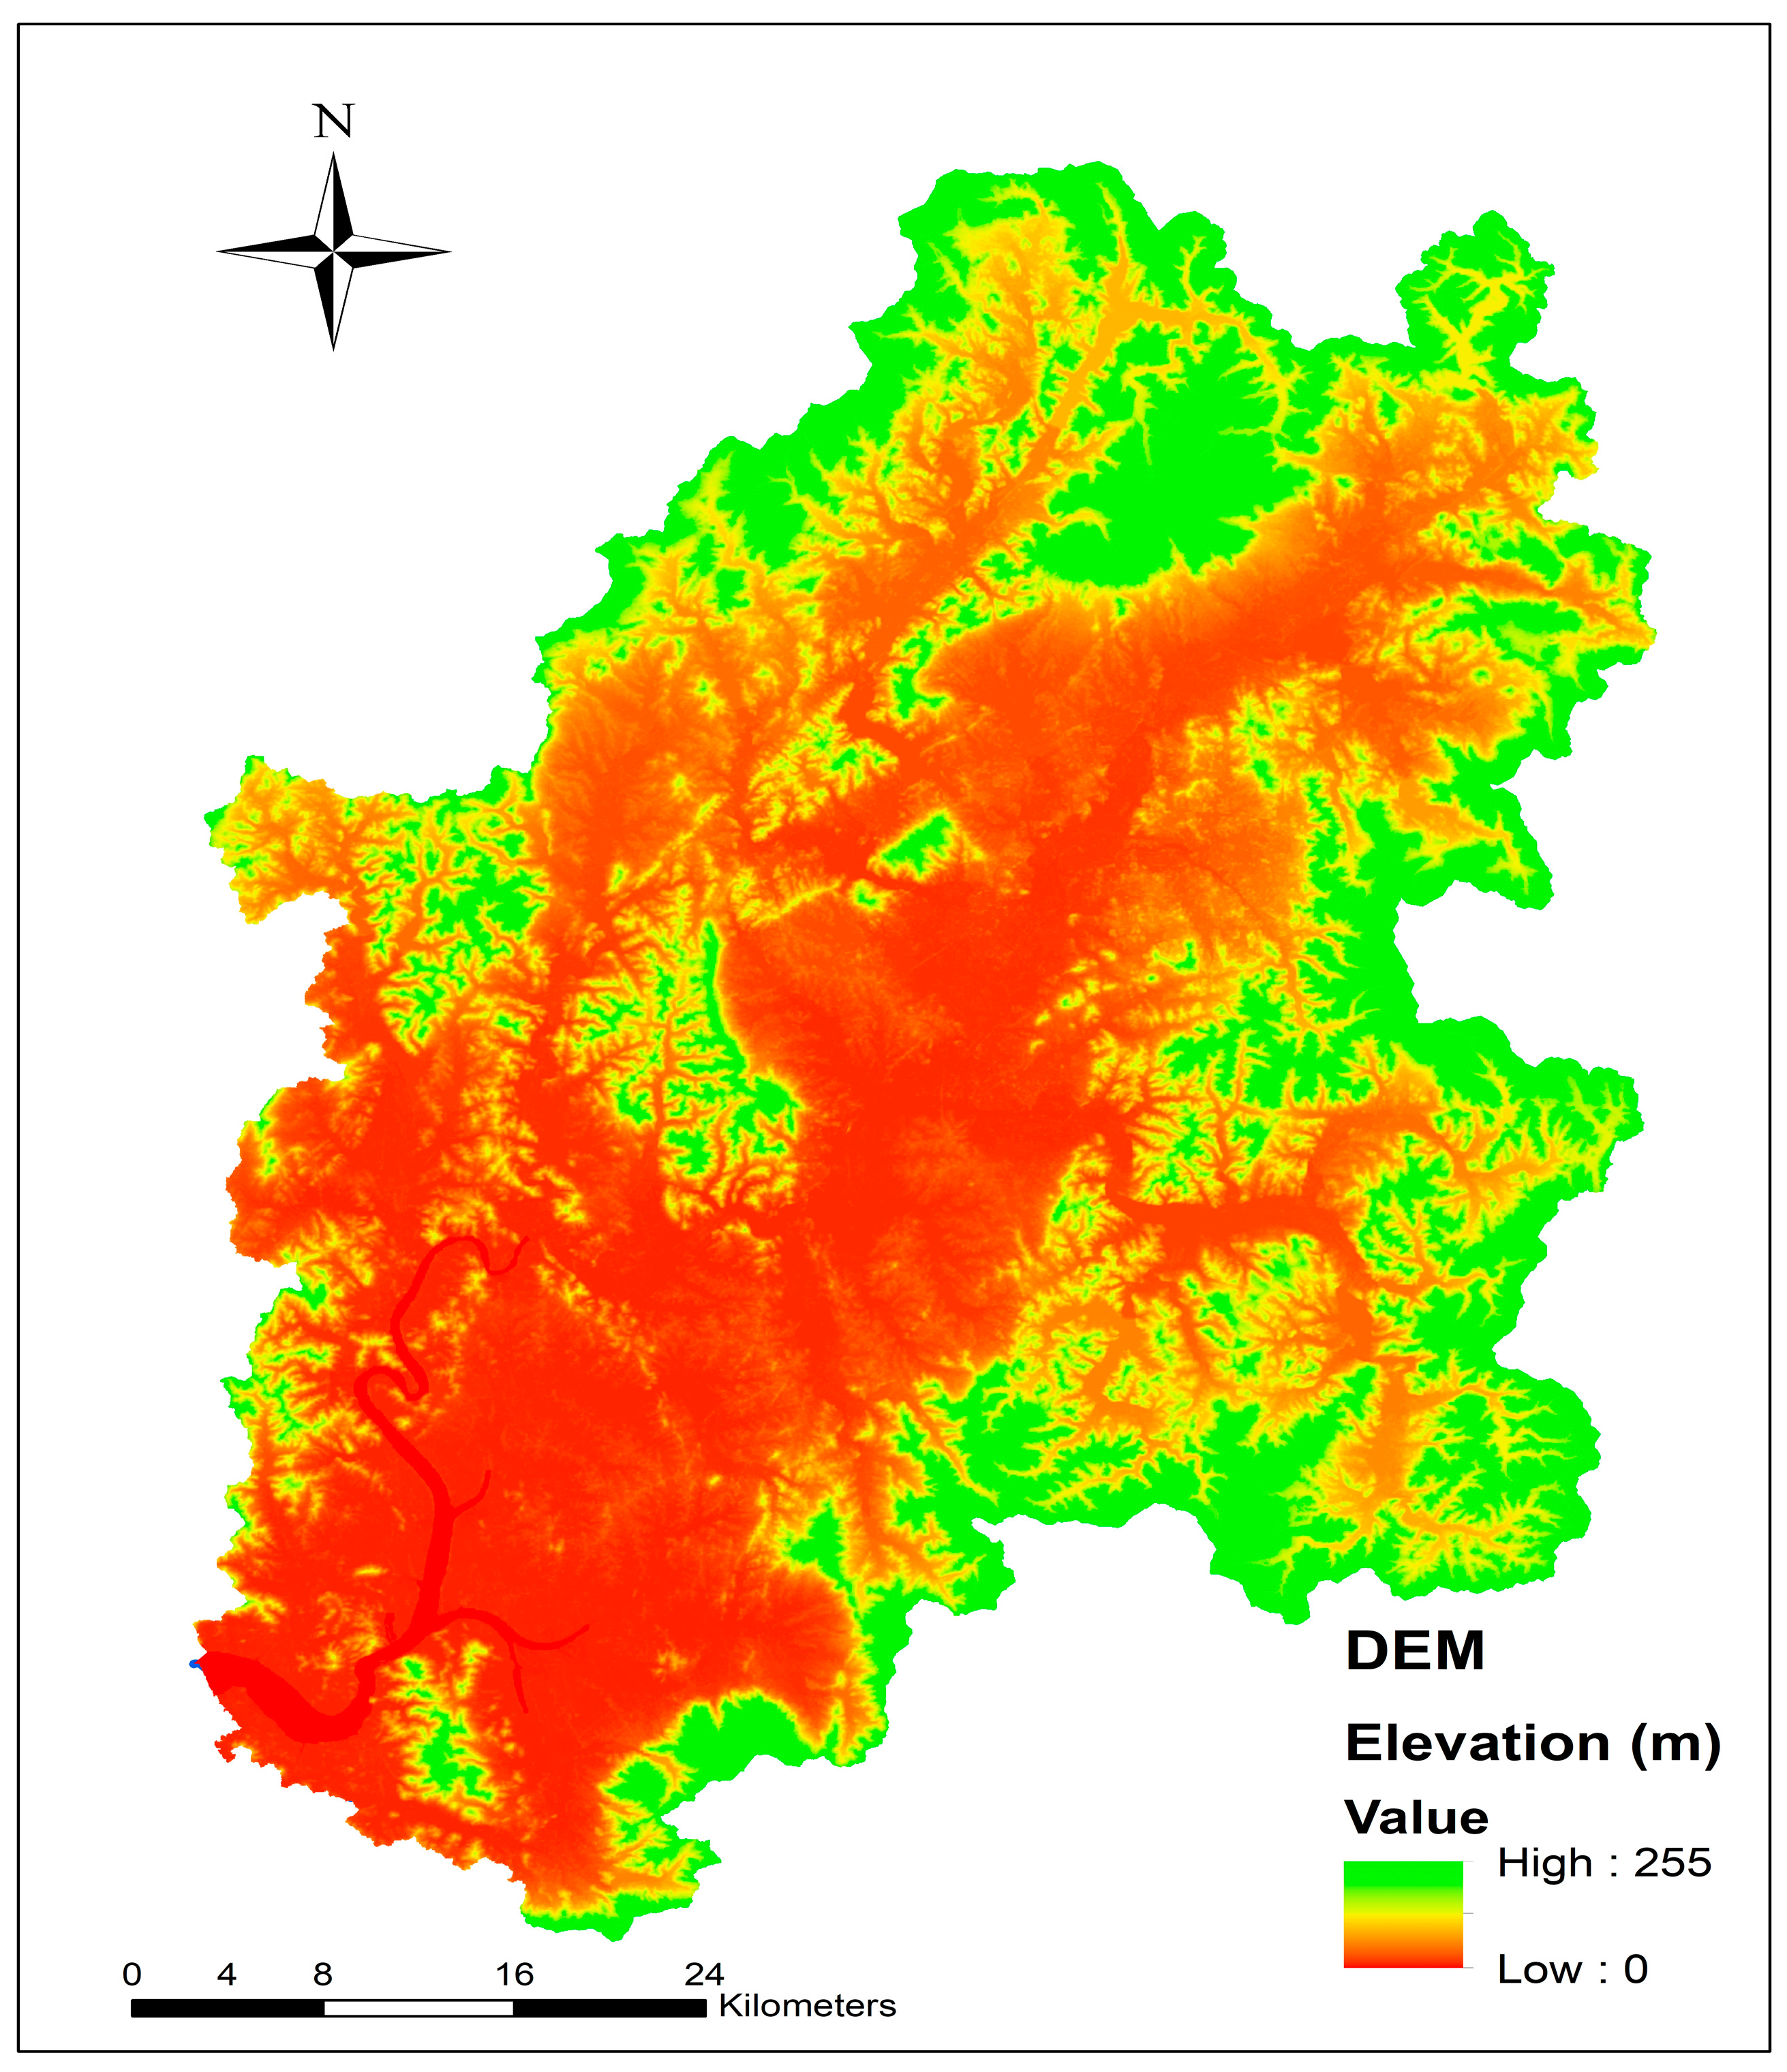
This study made use of the ASTER Global Digital Elevation Model (GDEM) of 30 × 30 m resolution DEM data (https://earthexplorer.usgs.gov/, accessed on 10 May 2022). Using ArcGIS, four ASTER GDAM grids were combined in creating a new raster. A universal transverse Mercator (UTM)-52N projection system was used. Sub-basins and stream networks were delineated using the DEM. The details of the DEM of the basin are given in Figure 3.
3.2.2. Soil Map
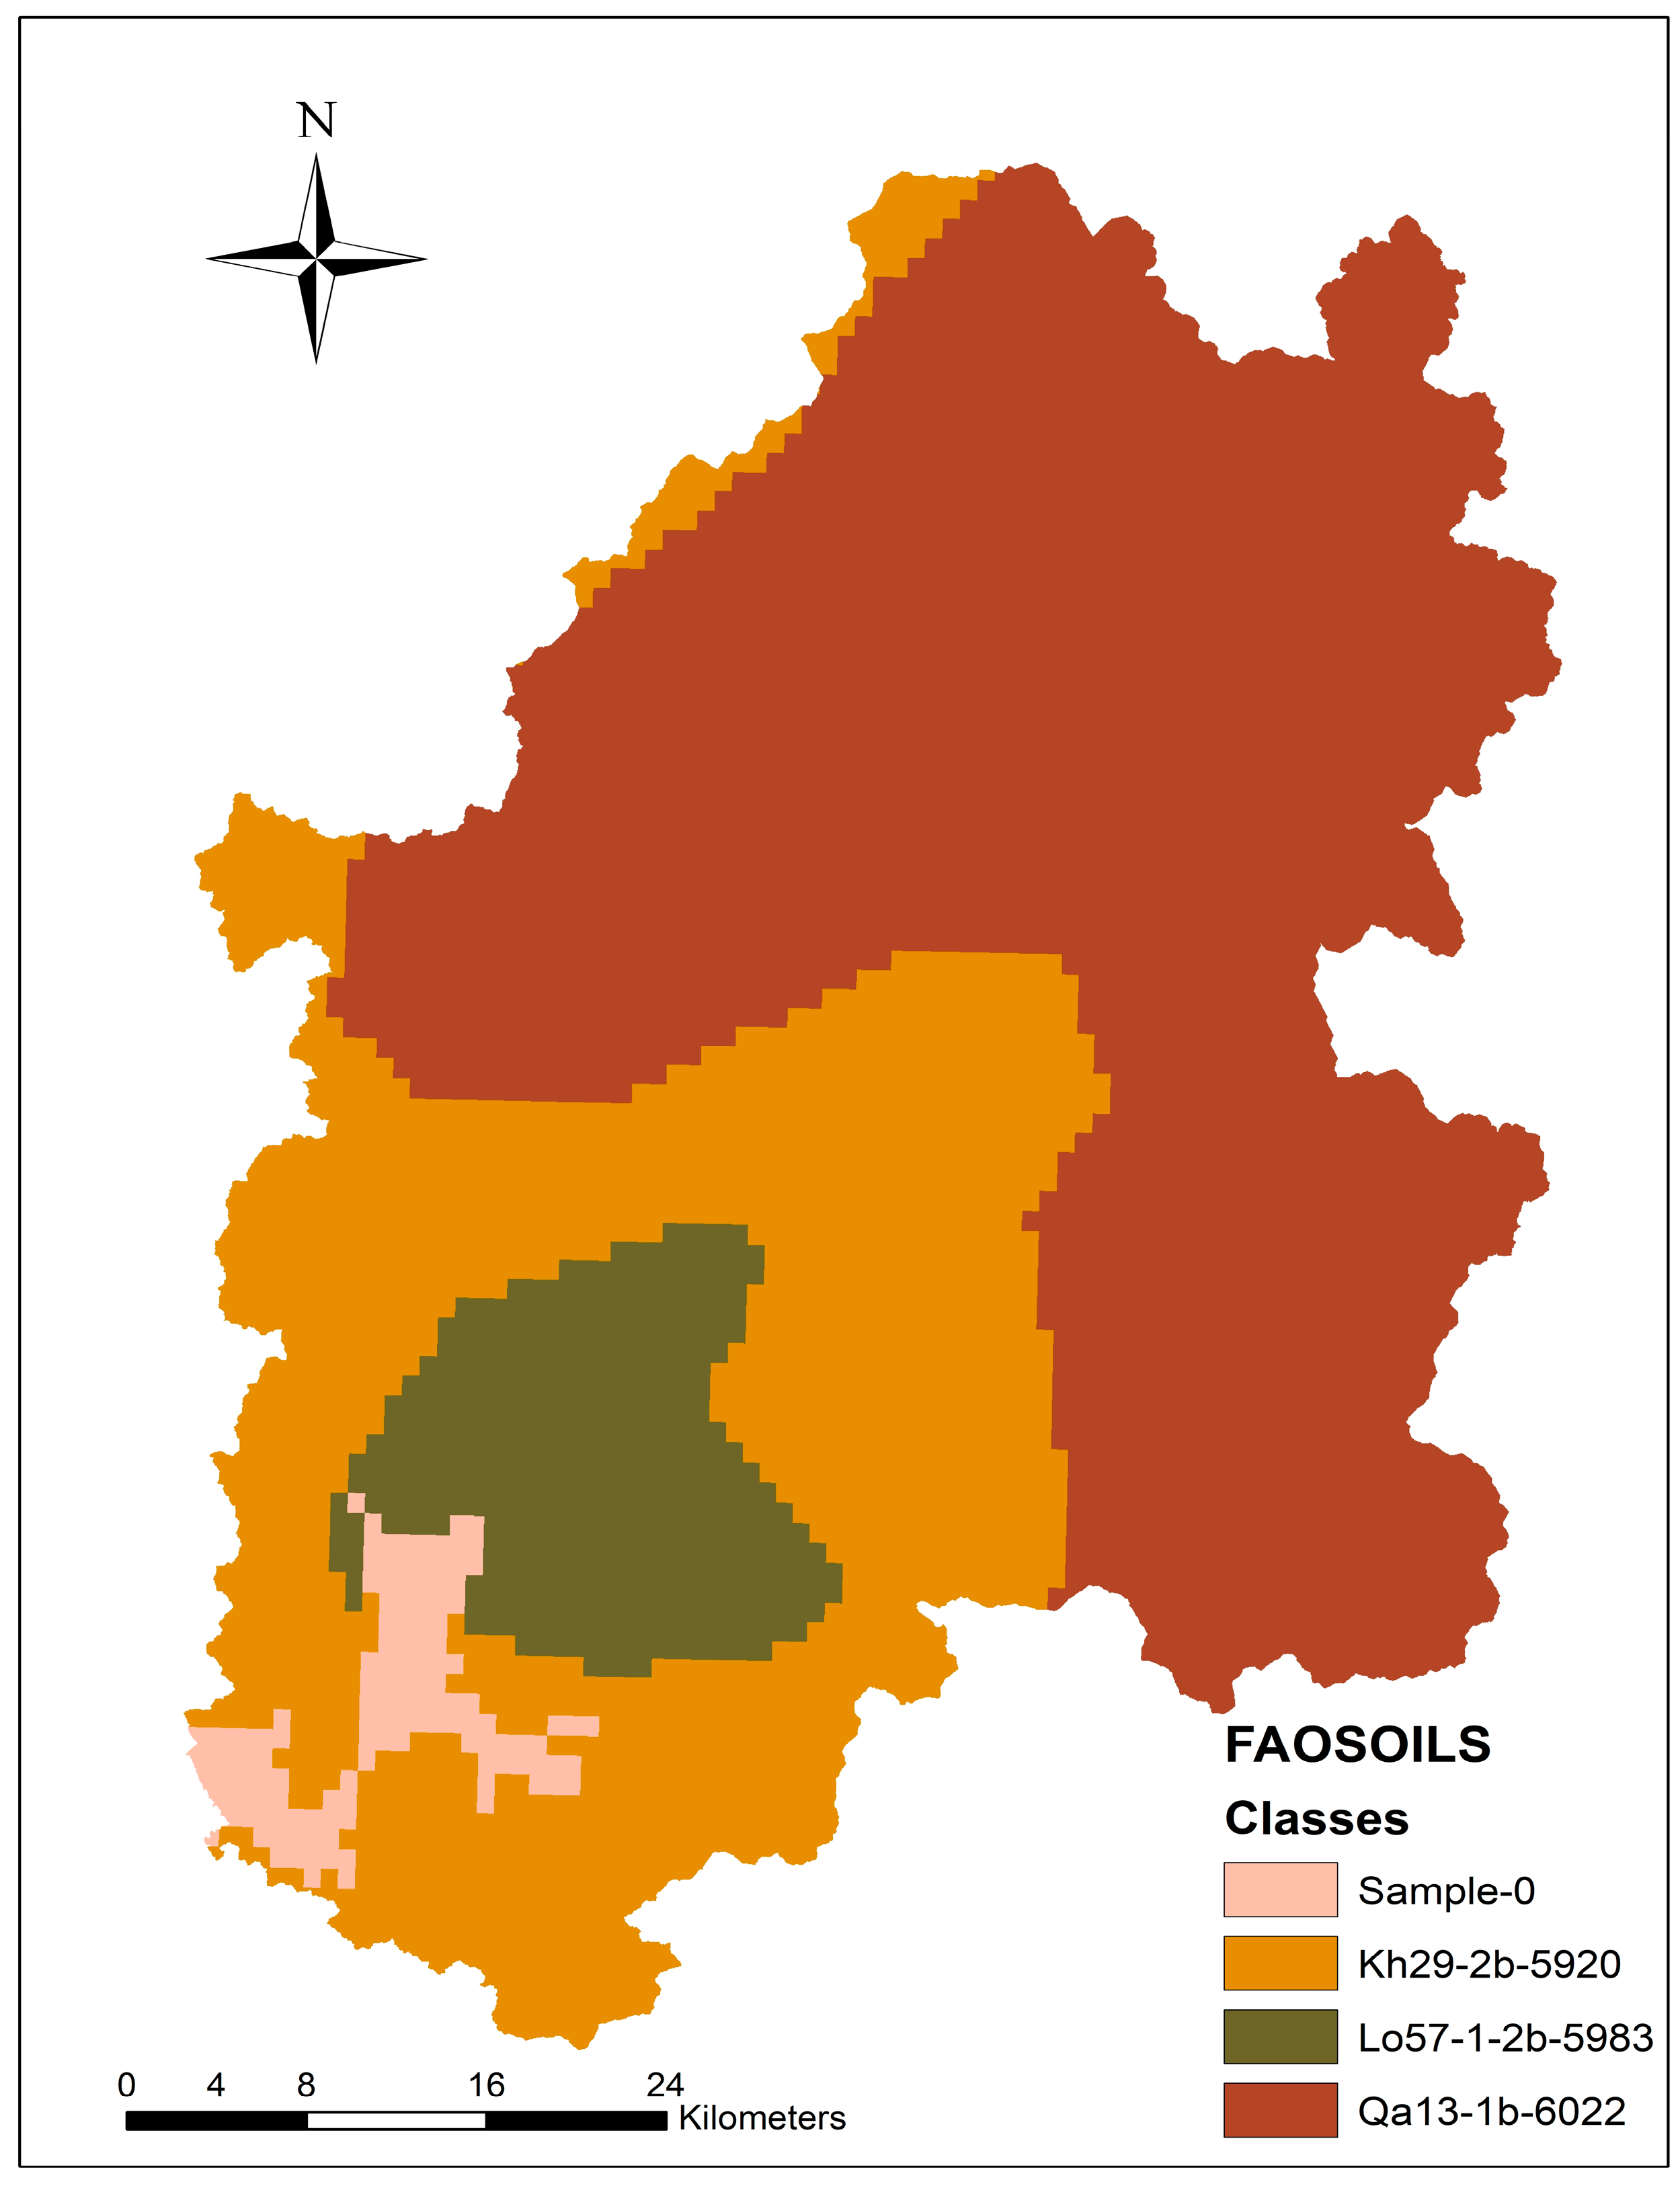
Based on the Harmonized World Soil Database (HWSD v121), the soil map of the Yeongsan river basin has a resolution of approximately 1 km (30 arc seconds) consisting of a topsoil layer (30 cm) and a subsoil layer (70 cm). The UTM-52N-projected soil map of various soil classifications and their corresponding SWAT codes on Table 1. Figure 4 depicts a map of the Yeongsan basin’s soil types with SWAT codes for various soil classifications.
3.2.3. Land Use and Land Cover
Yeongsan river basin’s land use map (approximately 400 resolutions) was extracted from the USGS EROS Archive—Land Cover Products—Global Land Cover Characterization (GLCC) map (https://swat.tamu.edu/data/, accessed on 12 May 2022).
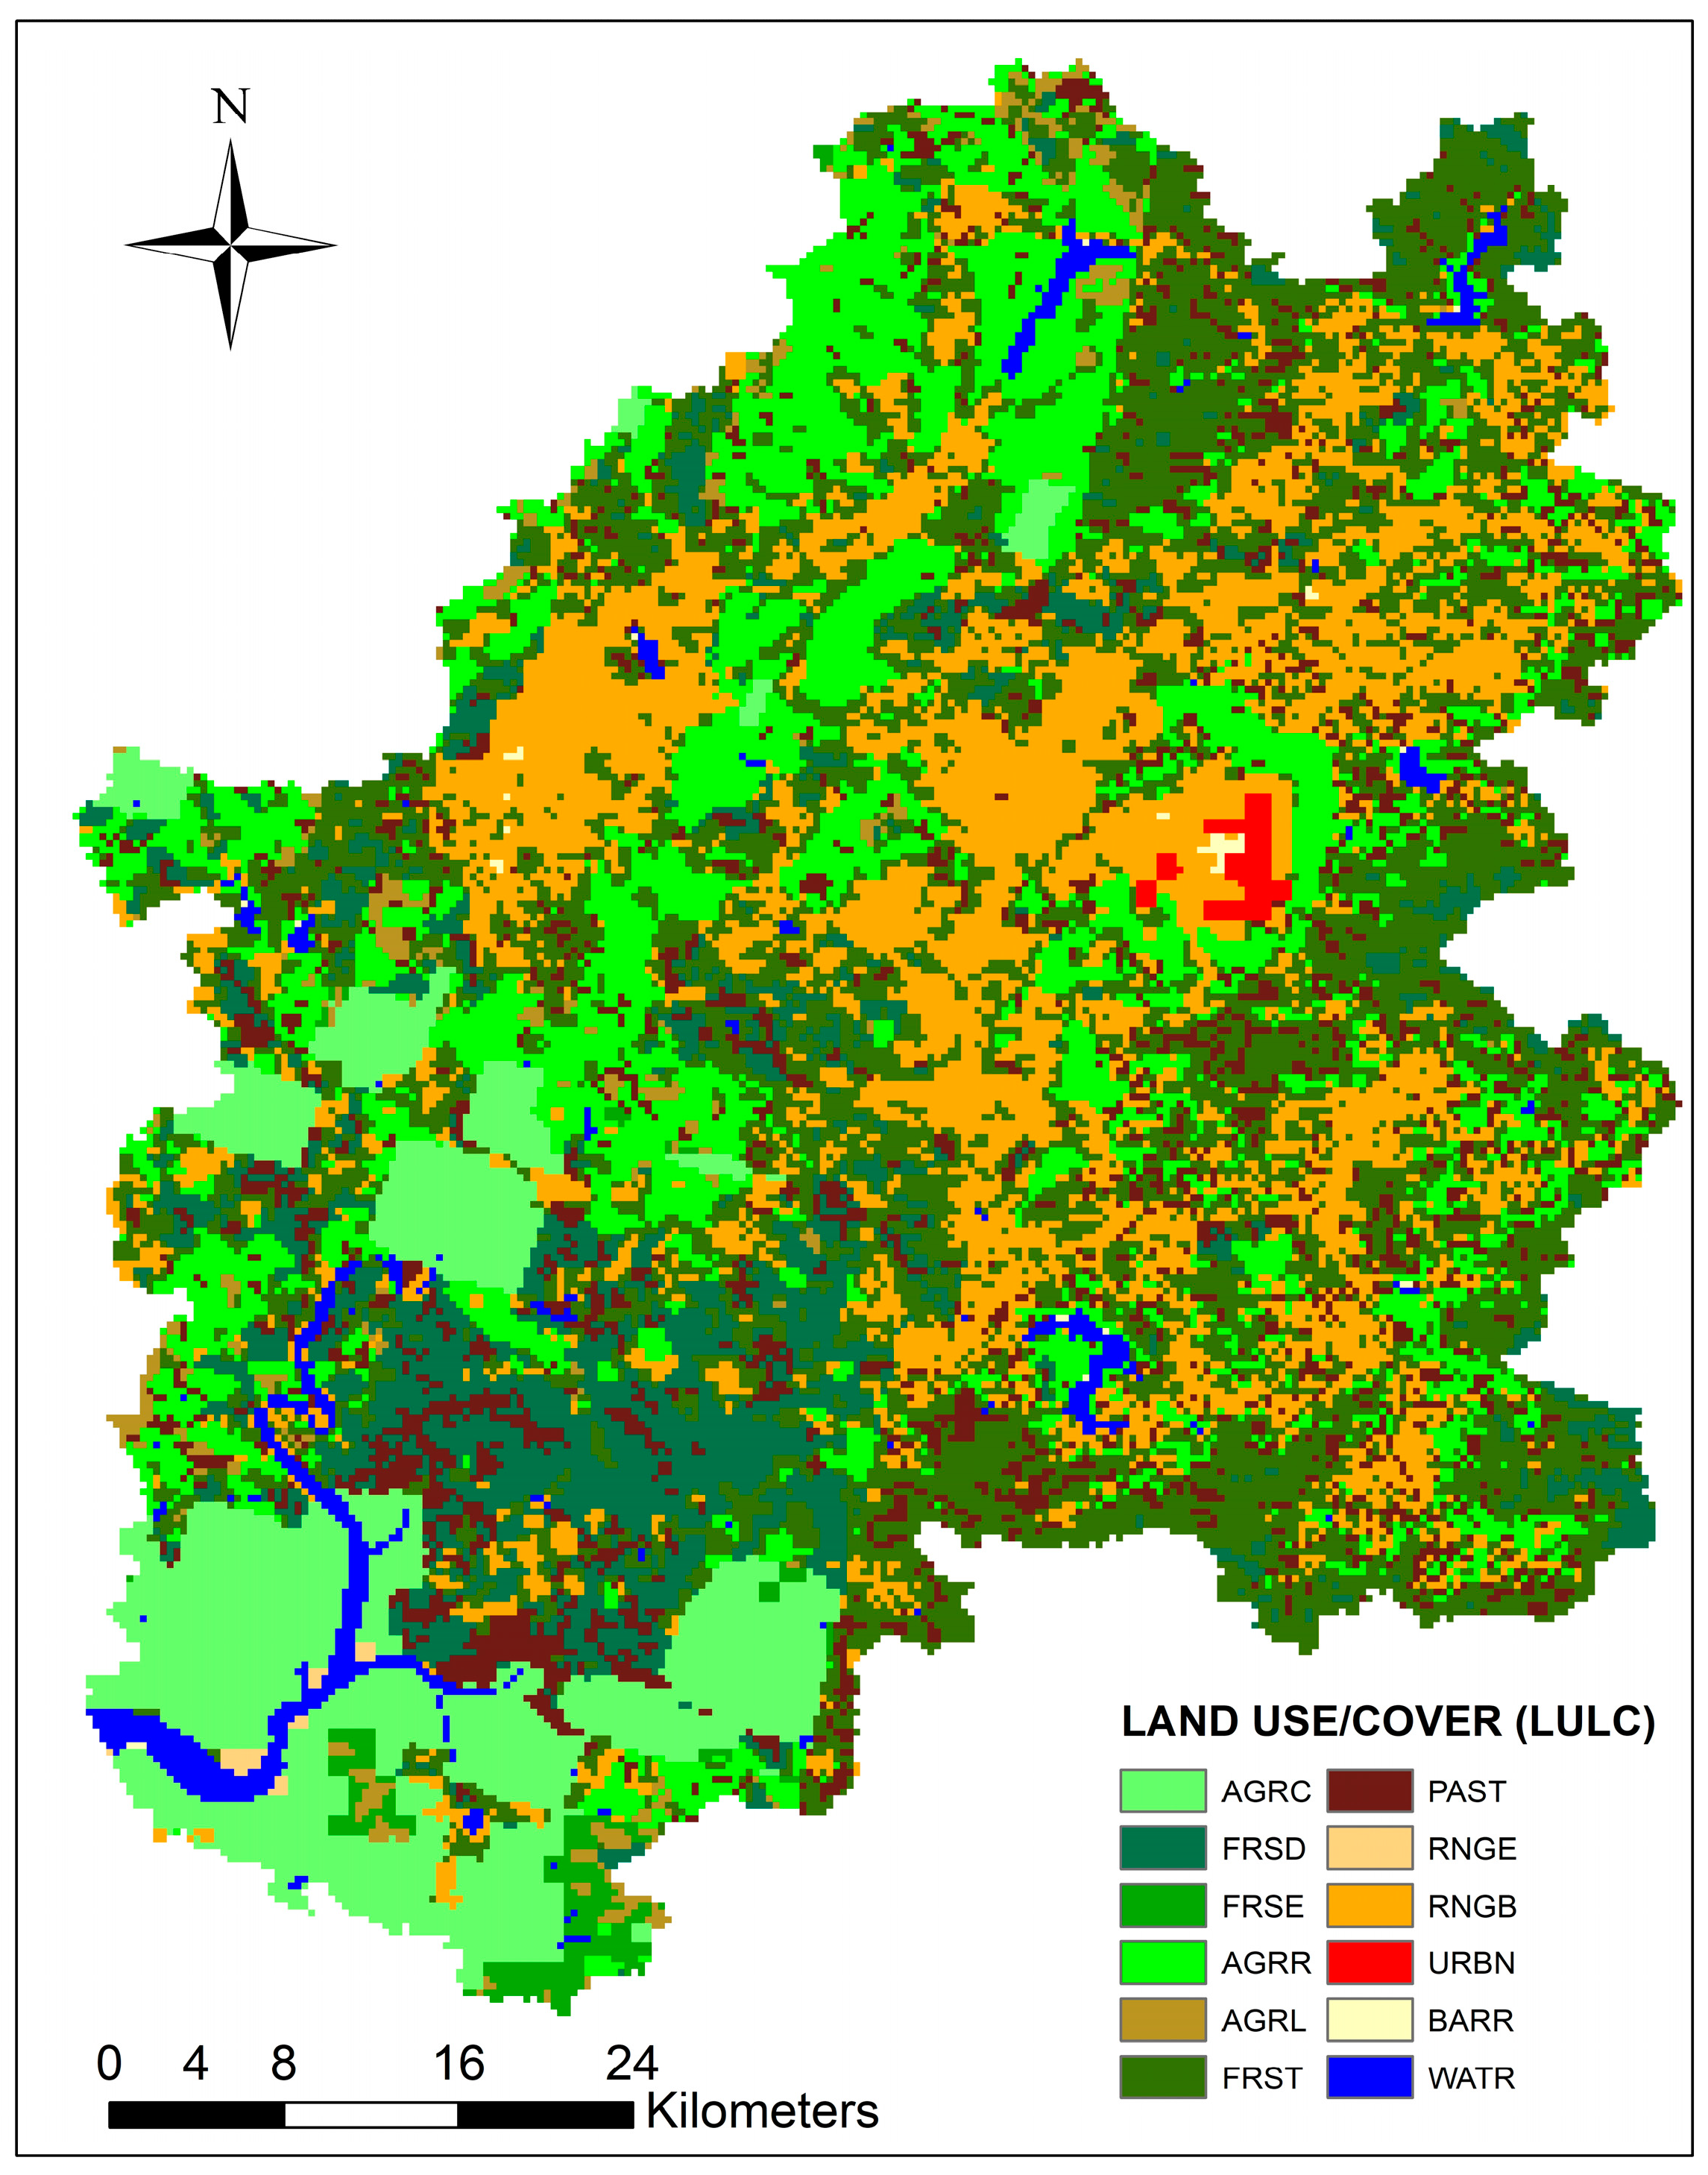
The UTM-52N projection system was utilized to better define HRU using the map of land use/cover. Figure 5 depicts 12 land use classes. Forestry and agricultural areas, which make up 79.4% of the basin, were the main land use type, followed by residential land (9.9%). For each land use class, Table 2 details the SWAT codes.
3.2.4. Weather Data
The daily weather data from 1980–2021 (https://data.kma.go.kr/, accessed on 15 June 2022) for eight weather stations in the watershed were obtained via the Korean Meteorological Administration (KMA). Weather stations provided the SWAT model with the wind speed, rainfall, lowest temperature, highest temperature, and sunshine on a daily basis (Table 3 and Figure 5).
3.2.5. Streamflow Data
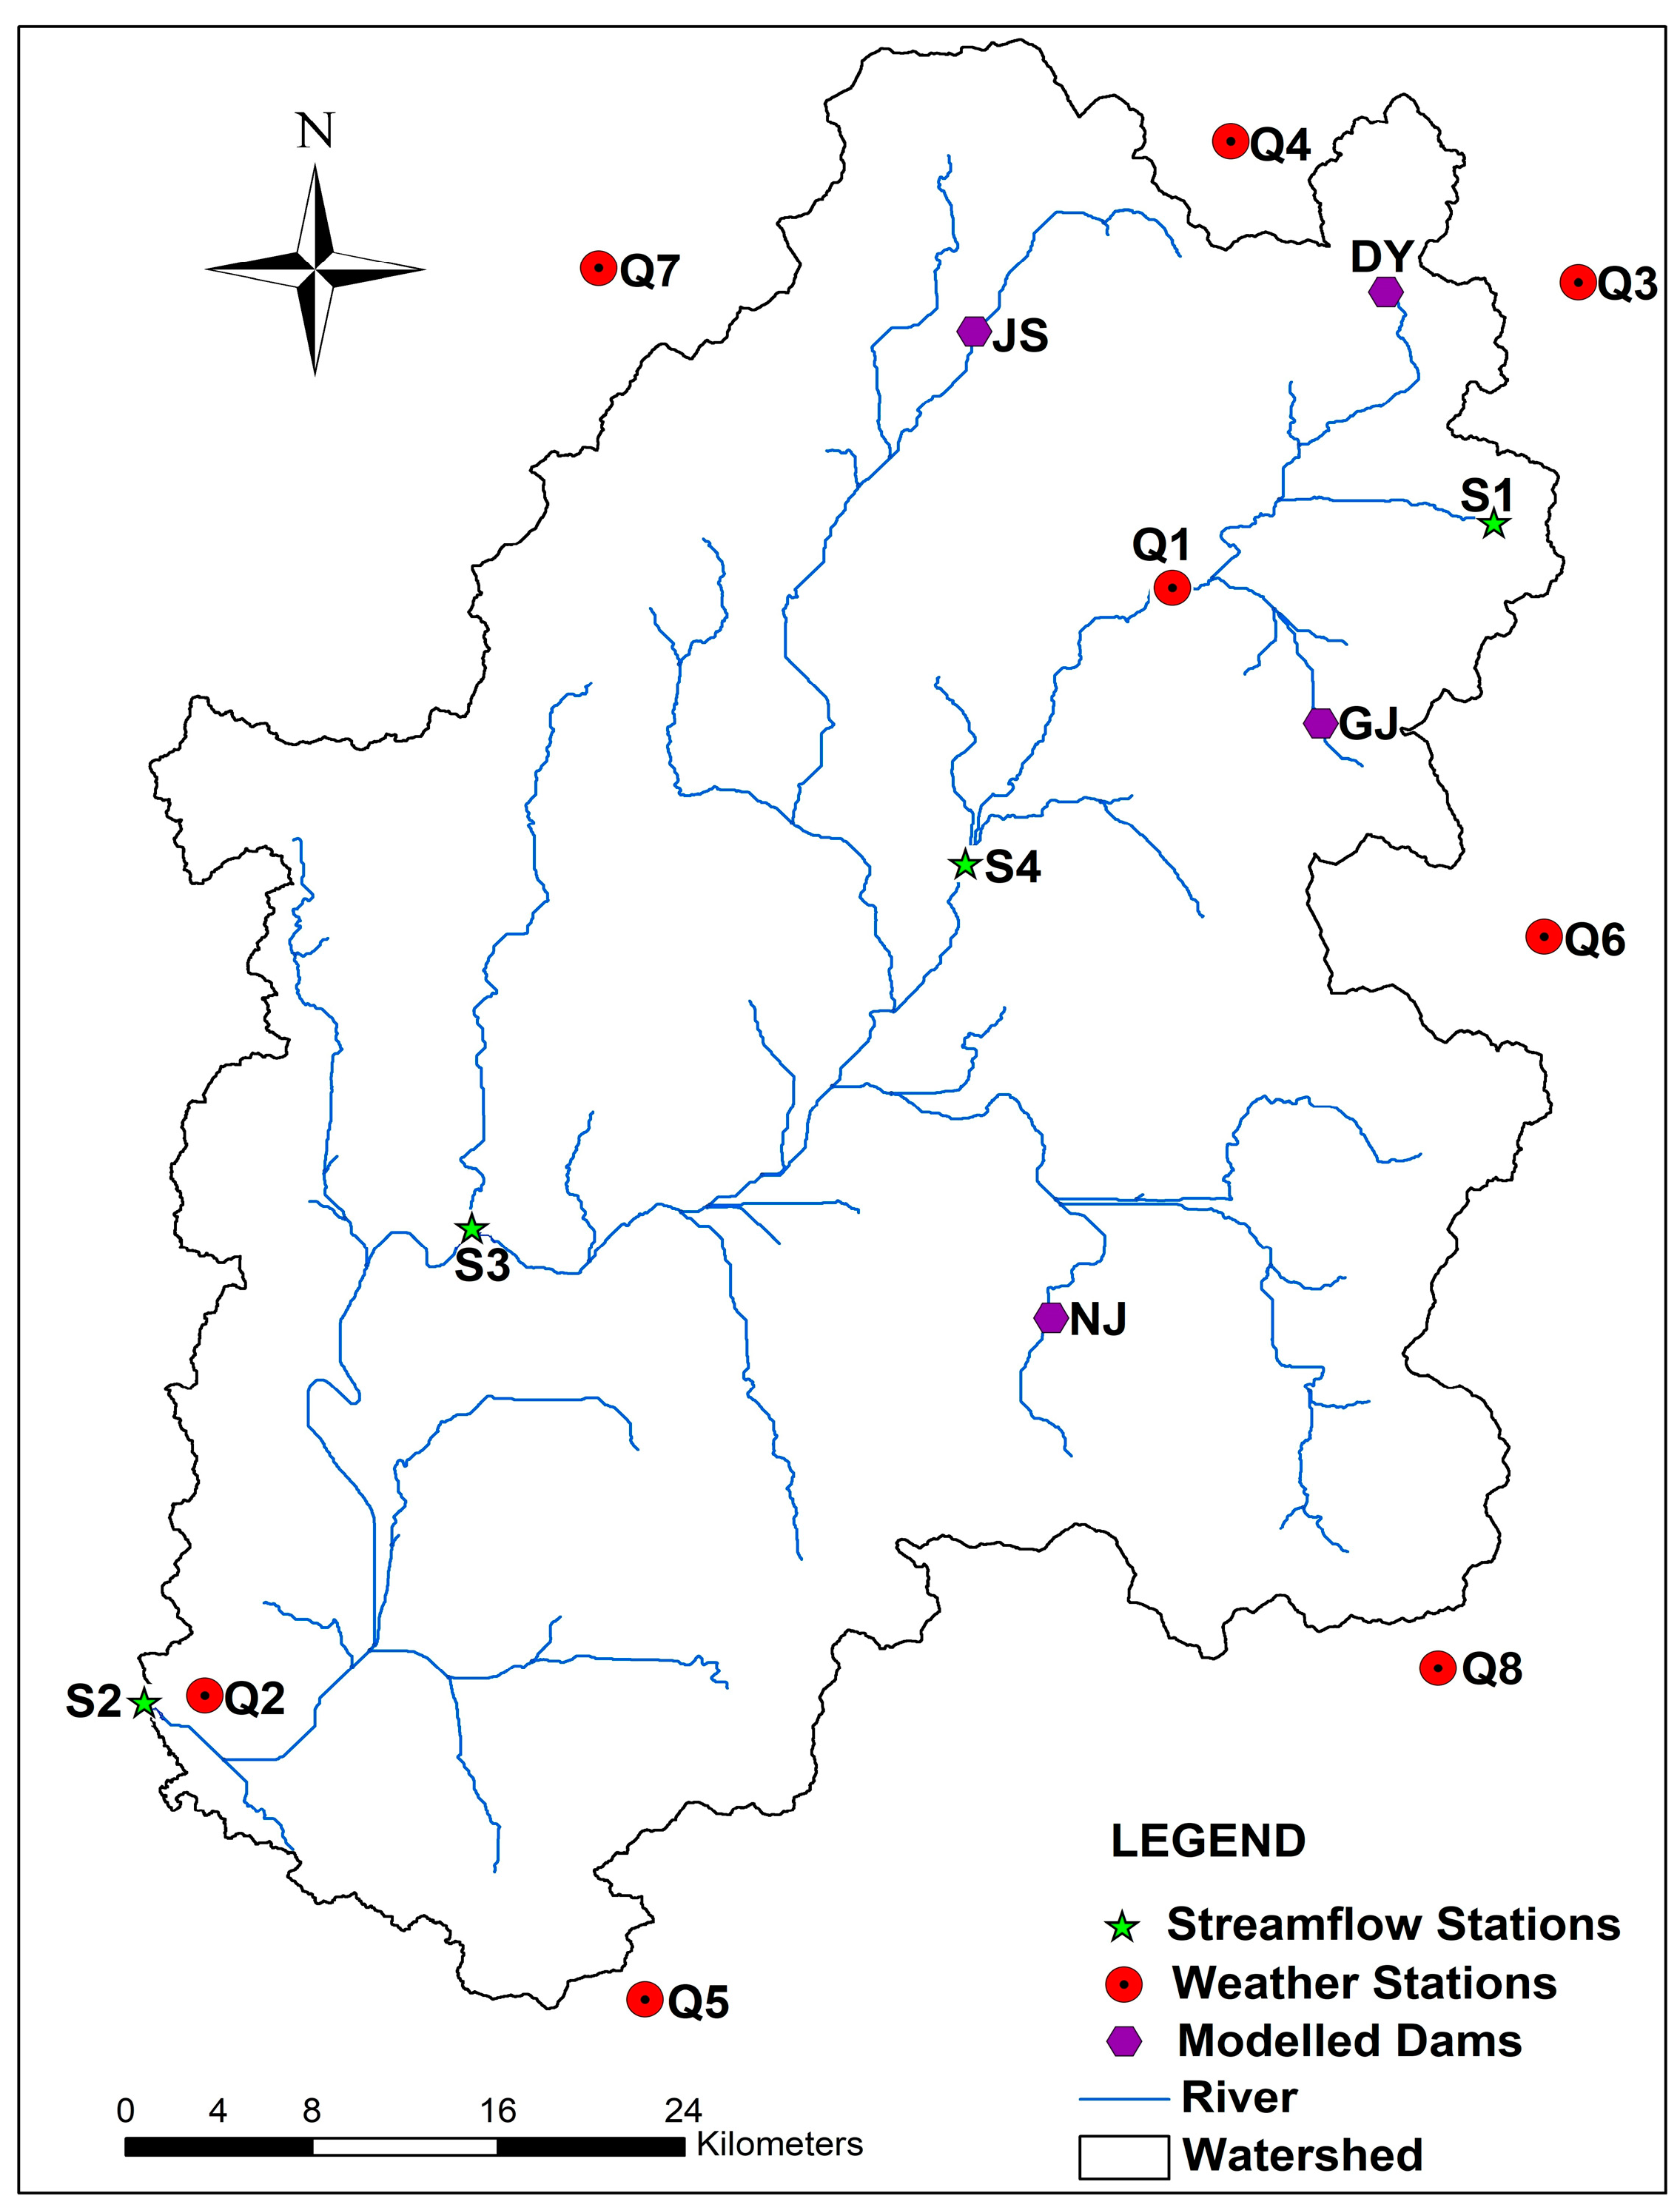
The Korean government operates a Water Resource Management Information System (WAMIS) site that provided 16 years (2006–2021) of daily streamflow data (http://www.wamis.go.kr/, accessed on 1 June 2022). The Yeongsan watershed has 39 gauging stations with 14 on the river and 25 on its tributaries. Four gauging stations, namely Deokyonggyo (S1), Hwangryonggyo 2 (S2), Yeongsugyo (S3), and Najudaegyo (S4), were utilized for calibrating and validating our model, as they provided the best basin representation (Figure 6).
3.2.6. Dams Inflow and Outflow Data
The Yeongsan river has four agricultural dams, namely Gwangju (GJ), Damyang (DY), Naju (NJ), and Jangsung (JS) dams, and an estuary dike within its drainage watershed (Figure 6). The details of the characteristics of the agricultural dam are shown in Table 4 [41]. In addition, the watershed consists of two weirs, namely Juksan and Seungchon, mainly for flood control, one water supply dam (Pyeongrim) and two sewage treatment plants [36]. Data on the dam storage, water storage percentage, agricultural water usage, and gate discharge (dam outflow for 7 years) were collected from WAMIS. The dams were constructed in 1970 with the aim of providing irrigation water in the event of severe droughts. The Four Major Rivers Restoration Project boosted the four study reservoirs’ combined effective storage capacity from 256 Mm3 to 304 Mm3 by enhancing the dam heights by an average of 2 m [42].
3.3. Model Setup
ArcSWAT 2012 revision 681 was utilized in building the SWAT model in the ArcGIS 10.5 interface. The river network generation threshold area was set to 2500 m, and the Yeongsan basin was delineated into 83 sub-basins and 502 HRUs to represent the watershed. The basin’s elevation varied from 0 to 255 m, with a mean elevation of 94.99 m. Five categories: 0–5, 5–10, 10–15, 15–50, and >50% were used to categorize the slope map. While creating the HRUs, multiple HRUs options were selected and the thresholds were set for land use at 10%, soil at 10%, and slope maps at 15%. The daily curve number was calculated as a function of soil moisture, and the SCS curve number approach was utilized in predicting surface runoff. In estimating potential ET, the Penman–Monteith approach was employed, and the route channel flow using the Muskingum method. In the model setup, irrigation projects and point source discharge were not included as water abstraction points. Cropping patterns were not allocated. Five elevation bands were created during the setup to account for the orographic precipitation. The SWAT model simulated soil moisture at two depths within the root zone, with each depth being 300 mm to account for vegetation heterogeneity.
3.4. SWAT Model Evaluation
3.4.1. Sensitivity Evaluation
The Sequential Uncertainty Fitting Version 2 (SUFI-2) method was utilized for sensitivity and uncertainty analysis in SWAT calibration and uncertainty program (SWAT-CUP). A semi-automated technique includes calibration, uncertainty, and sensitivity assessments as part of the decision-making framework [43]. The Latin hypercube sample’s average output uncertainty was measured using the cumulative distribution rate at 97.5 and 2.5%, which is utilized in calculating 95% prediction uncertainty (95PPU). The manual has further information [44,45].
3.4.2. Model Calibration and Validation
To properly depict the Yeongsan river basin, multi-variable and multi-site calibration techniques were utilized. SWAT-CUP was utilized for calibrating and validating our SWAT model. At monthly time-steps, modelling inputs were measured and simulated. SWAT-CUP utilized generalized likelihood uncertainty estimation [46] in identifying parameters sensitive to streamflow [47]. Through trial and error, calibration entails comparing the outcomes of the model’s simulations with those of the monthly observations until they were in conformity [48,49].
The watershed’s observed data was split into two datasets: calibration (2006–2013) and validation (2014–2021). The handbook shows the input/output details of the hydrological parameters [50]. A number of statistical indicators were taken into account, including the r-factor, percent bias (PBIAS), Nash–Sutcliffe model efficiency (NSE), p-factor, and root-mean-square error (R2). The details of these methods are available in [46,51,52,53,54]. To stabilize the model’s initial circumstances, a five-year warm-up phase (1980–1985) was considered prior to the model simulation.
4. Results
4.1. Model Evaluation
Four hydrological stations in the Yeongsan river basin were employed for calibrating and validating our SWAT model (Figure 5). Data on monthly streamflow from 2006 to 2013 were utilized in calibrating the model, and data from 2014 to 2021 were utilized in validating it. Generalized likelihood uncertainty estimates were utilized in identifying the extremely sensitive parameters in SWAT-CUP (GW_DELAY, CN, SOL_AWC, ALPHA_BF, and CH_K2) that directly influenced streamflow (Table 5). While the range (in Table 5) denotes the boundaries of parameters that were changed in SWATCUP, the model modification type is indicated by the parameter identifier. Trial and error were used to acquire the fitted value until the simulated and observed values were consistent.
Table 6 and Table 7 display the results of the Yeongsan river basin calibration and validation. If RSR ≤ 0.7, PBIAS < 15%, R2 > 0.6, and NSE > 0.5, the monthly or daily model statistics were regarded as satisfactory based on the discharge simulations [42]. Monthly streamflow statistics for R2 were divided into the following categories: unsatisfying (≤0), poor (0–0.24), fair (0.25–0.49), satisfying (0.05–0.74), better (0.75–0.89), and best (≥0.90) [45].
In the Deokyonggyo station, the PBIAS, r-factor, p-factor, R2, RSR, and NSE were 7.5, 0.40, 0.64, 0.83, 0.50, and 0.75, respectively, for calibration, and −19.5, 0.72, 0.71, 0.86, 0.40, and 0.84, respectively, for validation. The PBIAS values indicate a good reproduction of the average flow conditions. Additionally, NSE and R2 values for calibrating and validating the model were above 0.8, except for the NSE calibration period, which was 0.75, indicating the enhanced simulation of low and average flow compared to high flow. The RSR values were below 0.7. In addition, the performance indicators in the Deokyonggyo station were satisfactory.
At the Hwangryonggyo 2 station, calibrating values for p-factor and r-factor were 0.63 and 0.43, respectively, and 0.75 and 0.77, respectively, during validation. P and r-factors values are acceptable where the p-factor is close to 1 and the r-factor is close to 0 at a point simulated and observed are correlated. The PBIAS for average flow simulation was 19.3 and −13.5% for calibration and validation, respectively. The high calibration value may be due to the underestimation of higher flows owing to cumulative errors, whereas the validation value was within the acceptable range. The calibrating values for R2, NSE, and RSR were 0.88, 0.79, and 0.45 and 0.92, 0.91, and 0.30 for validating values, respectively. The validation values in this station were better than the calibration values, indicating the underestimation of high flows.
The p-factor and r-factor values at Yeongsugyo station during calibrating period were 0.51 and 0.17, respectively, and 0.60 and 0.26, respectively, during validation, which is within the acceptable range. The values for calibrating and validating PBIAS were 11.6 and 2.1%, respectively, demonstrating that long-term flows are underestimated slightly. The calibrating values for R2 and NSE were 0.88 and 0.91, respectively, and the validating values were 0.65 and 0.60, respectively. However, average flows as compared to high flows are simulated better. The calibrating and validating values for RSR were 0.59 and 0.63, respectively. These results indicate the model performed best at evaluating average flow than low and high flows.
In the Najudaegyo station, the calibrating values for the p-factor were 0.51 and 0.35, and the validating values were 0.54 and 0.53, respectively. Both calibrating and validating values for R2 and NSE were above 0.85. The PBAIS for calibration was 14.9%, indicating a slight overestimation for long-term average flow, whereas average flow was underestimated by -0.9% for validation. The RSR values were within suitable ranges. The results demonstrated the model’s capacity to reproduce both high and average flow conditions at the Najudaegyo station.
Moriasi et al. [51] suggested criteria show that calibration and validation might be assessed as “satisfactory to very good” for the model’s overall performance. Overall, the model performance was satisfactory on a monthly time step for the Yeongsan river basin using a multi-site calibration technique.
4.2. Water Balance of the Yeongsan River Basin
The Yeongsan river basin’s monthly, seasonal, and annual water balances were examined during the period 1980–2021 (42 years). The Korean Meteorological Administration (KMA) has identified four different seasons: winter is from January to February, pre-monsoon is from March to May, monsoon is from June to September, and post-monsoon is from October to December. These seasons were utilized in examining seasonal water balance in the basin.
4.2.1. Seasonal Water Balance
Table 8 below shows the average seasonal balance of the Yeongsan river basin. Results revealed that the maximum rainfall of approximately 853.89 mm (63.9%) occurred during the monsoon season, contributing to an annual surface runoff of approximately 382.21mm (74.7%), resulting in a high water yield of 514.12 mm (66.6%). The maximum potential ET (58.4% (316.8 mm)) also occurred during the monsoon season, which could be attributed to the availability of water for evaporation. The watershed has several reservoirs, dams, and dikes, which are used to store water for use during the non-monsoon seasons for irrigation. Lower rainfall during the pre-monsoon season led to minimal surface runoff and base flow, but the second-highest potential ET contribution was recorded during this time, at 23.1%, which was likely caused by the comparatively higher temperatures in April and May.
4.2.2. Annual Water Balance
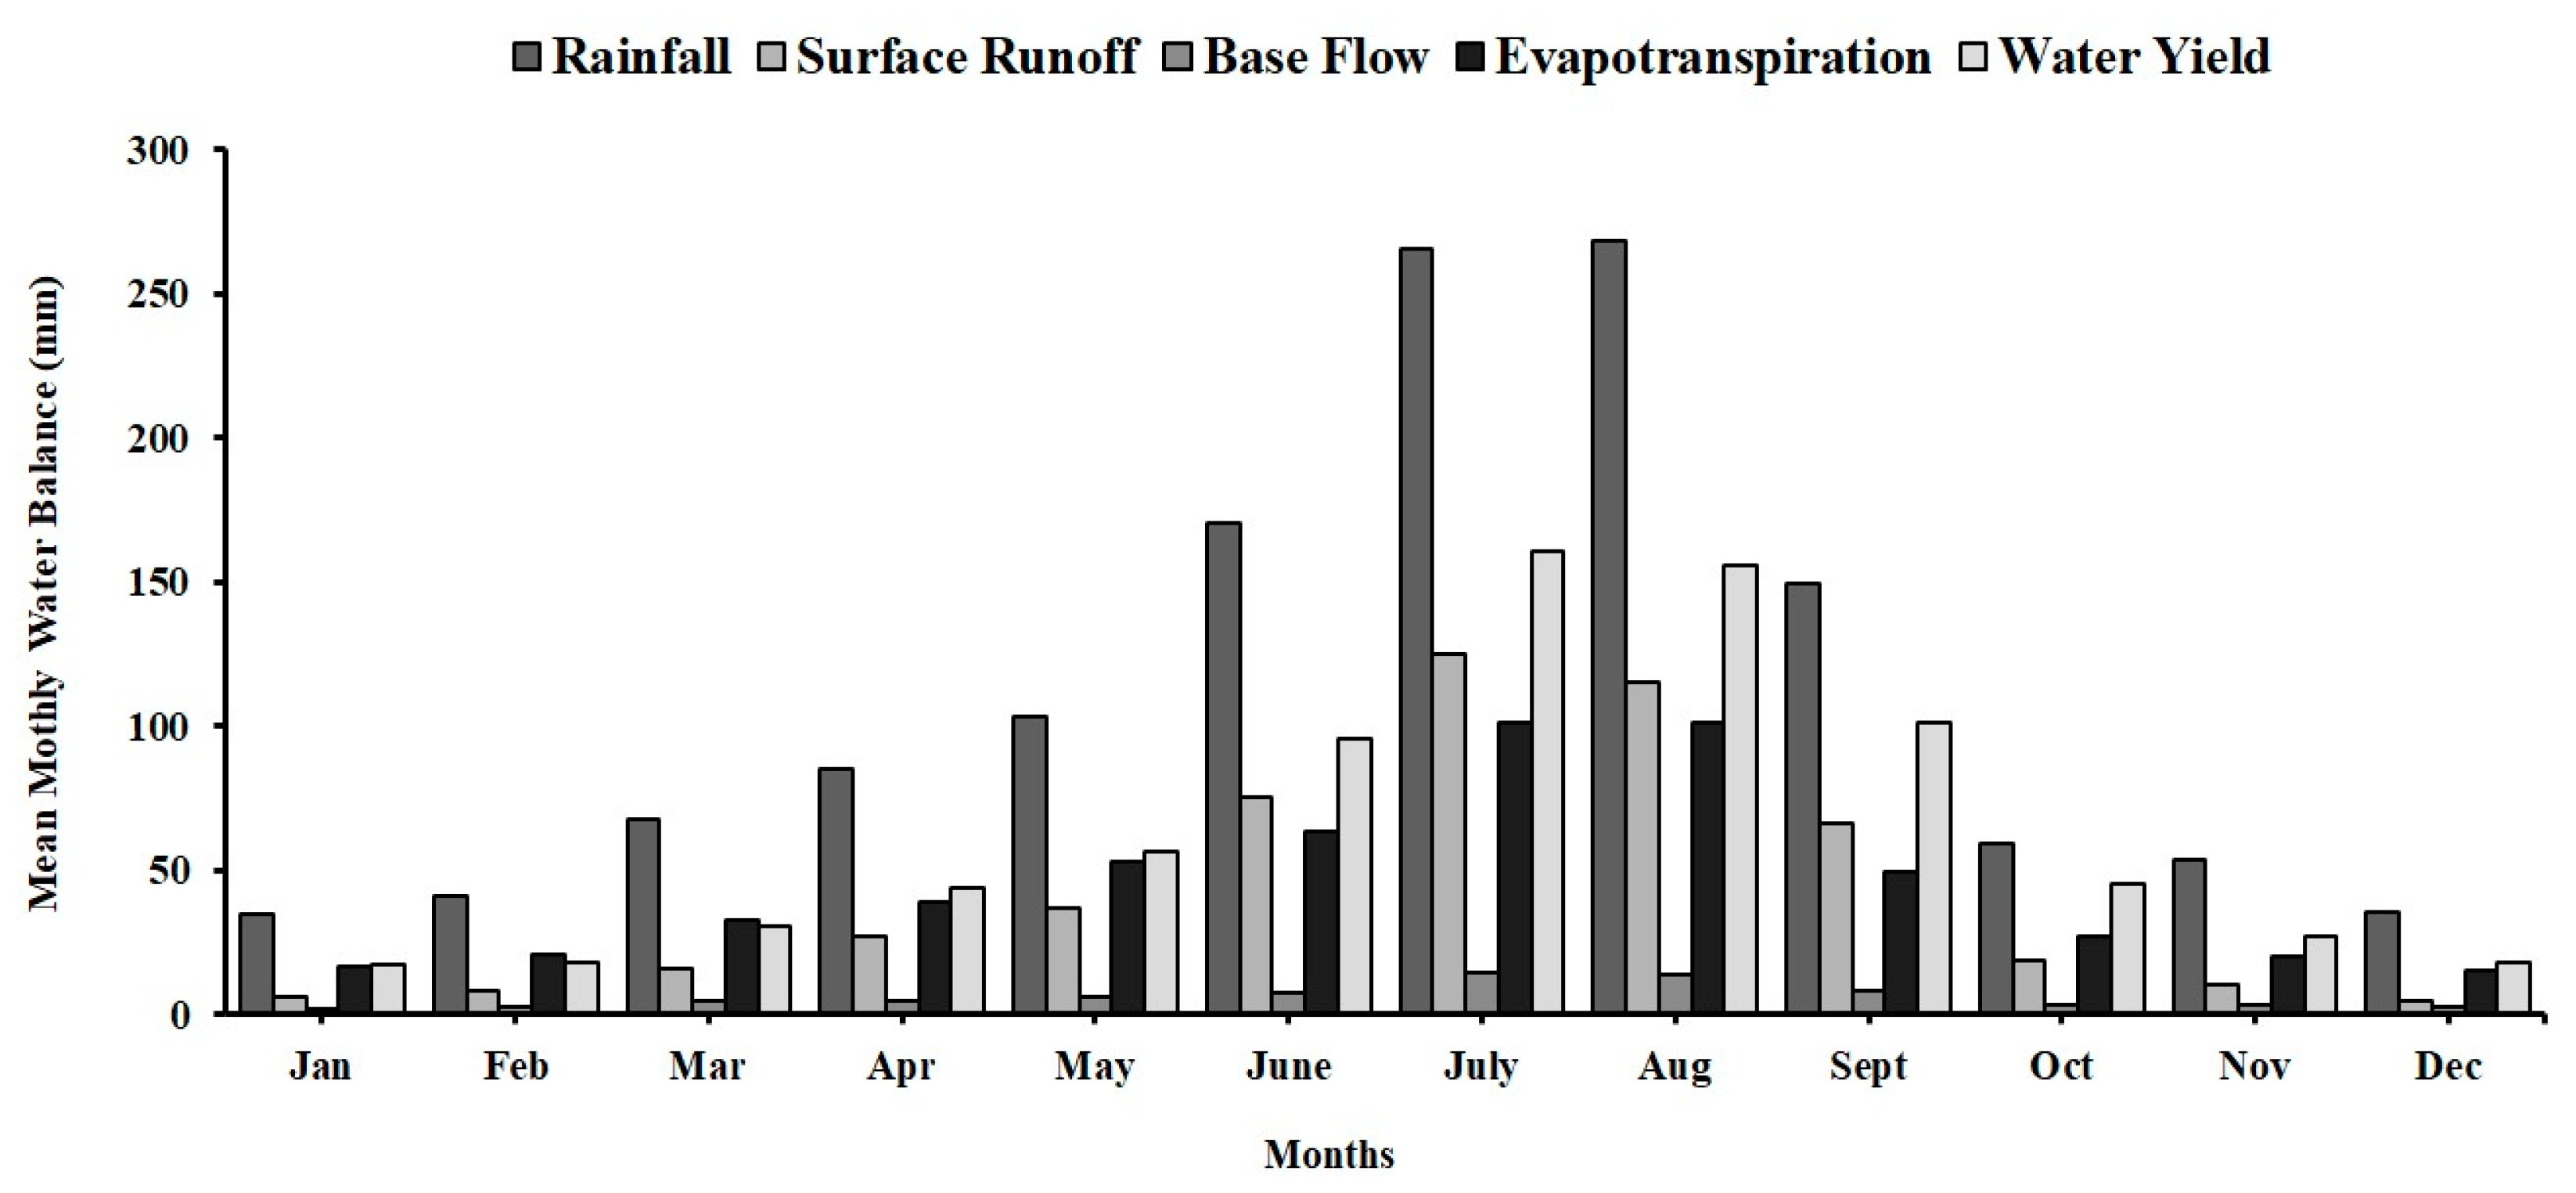
Figure 7 displays the Yeongsan river basin’s typical annual balance for the 42-year period between 1980 and 2021. The average annual rainfall, water yield, base flow, surface runoff, and potential ET in the watershed were 1336.07, 772.28, 75.49, 510.29, and 542.76 mm, respectively. On an average monthly basis, the results indicate that precipitation and ET were highest in August with 268.4 and 101.65 mm, respectively, whereas the surface flow, lateral flows, and water yield were highest in July with 124.89,14.33, and 160.53 mm, respectively.
4.3. Spatial Distribution of Water Balance
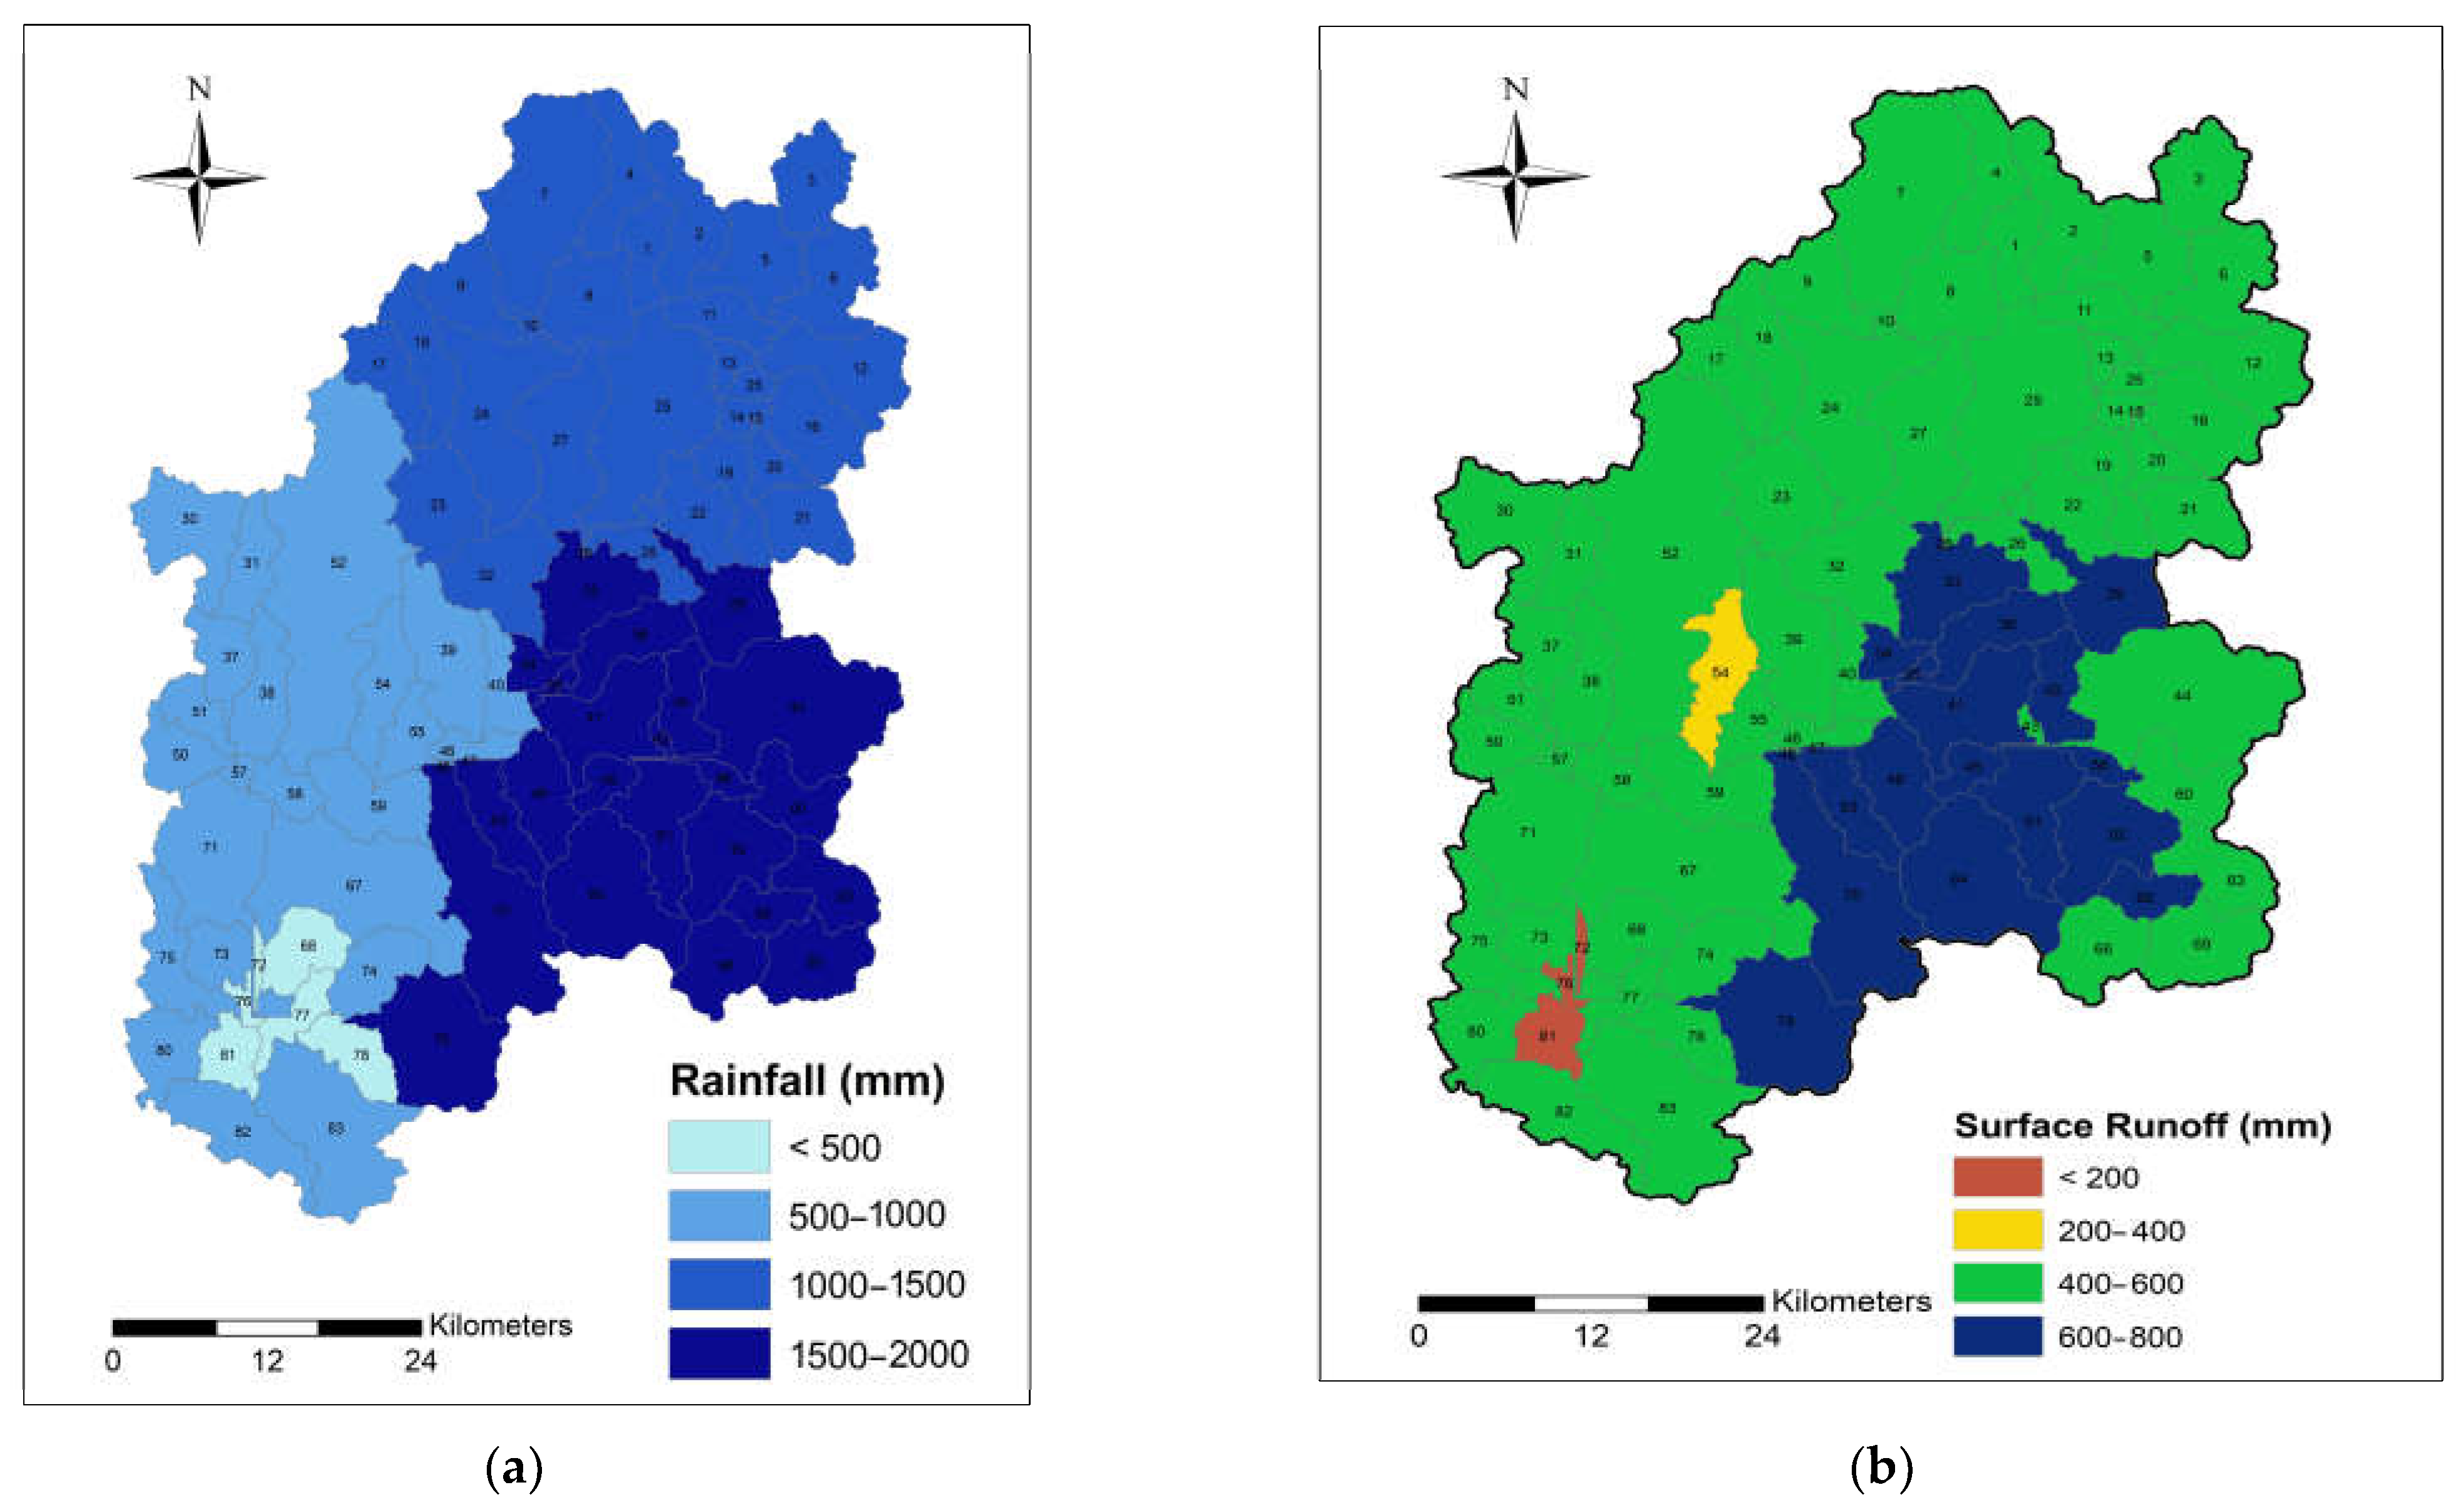
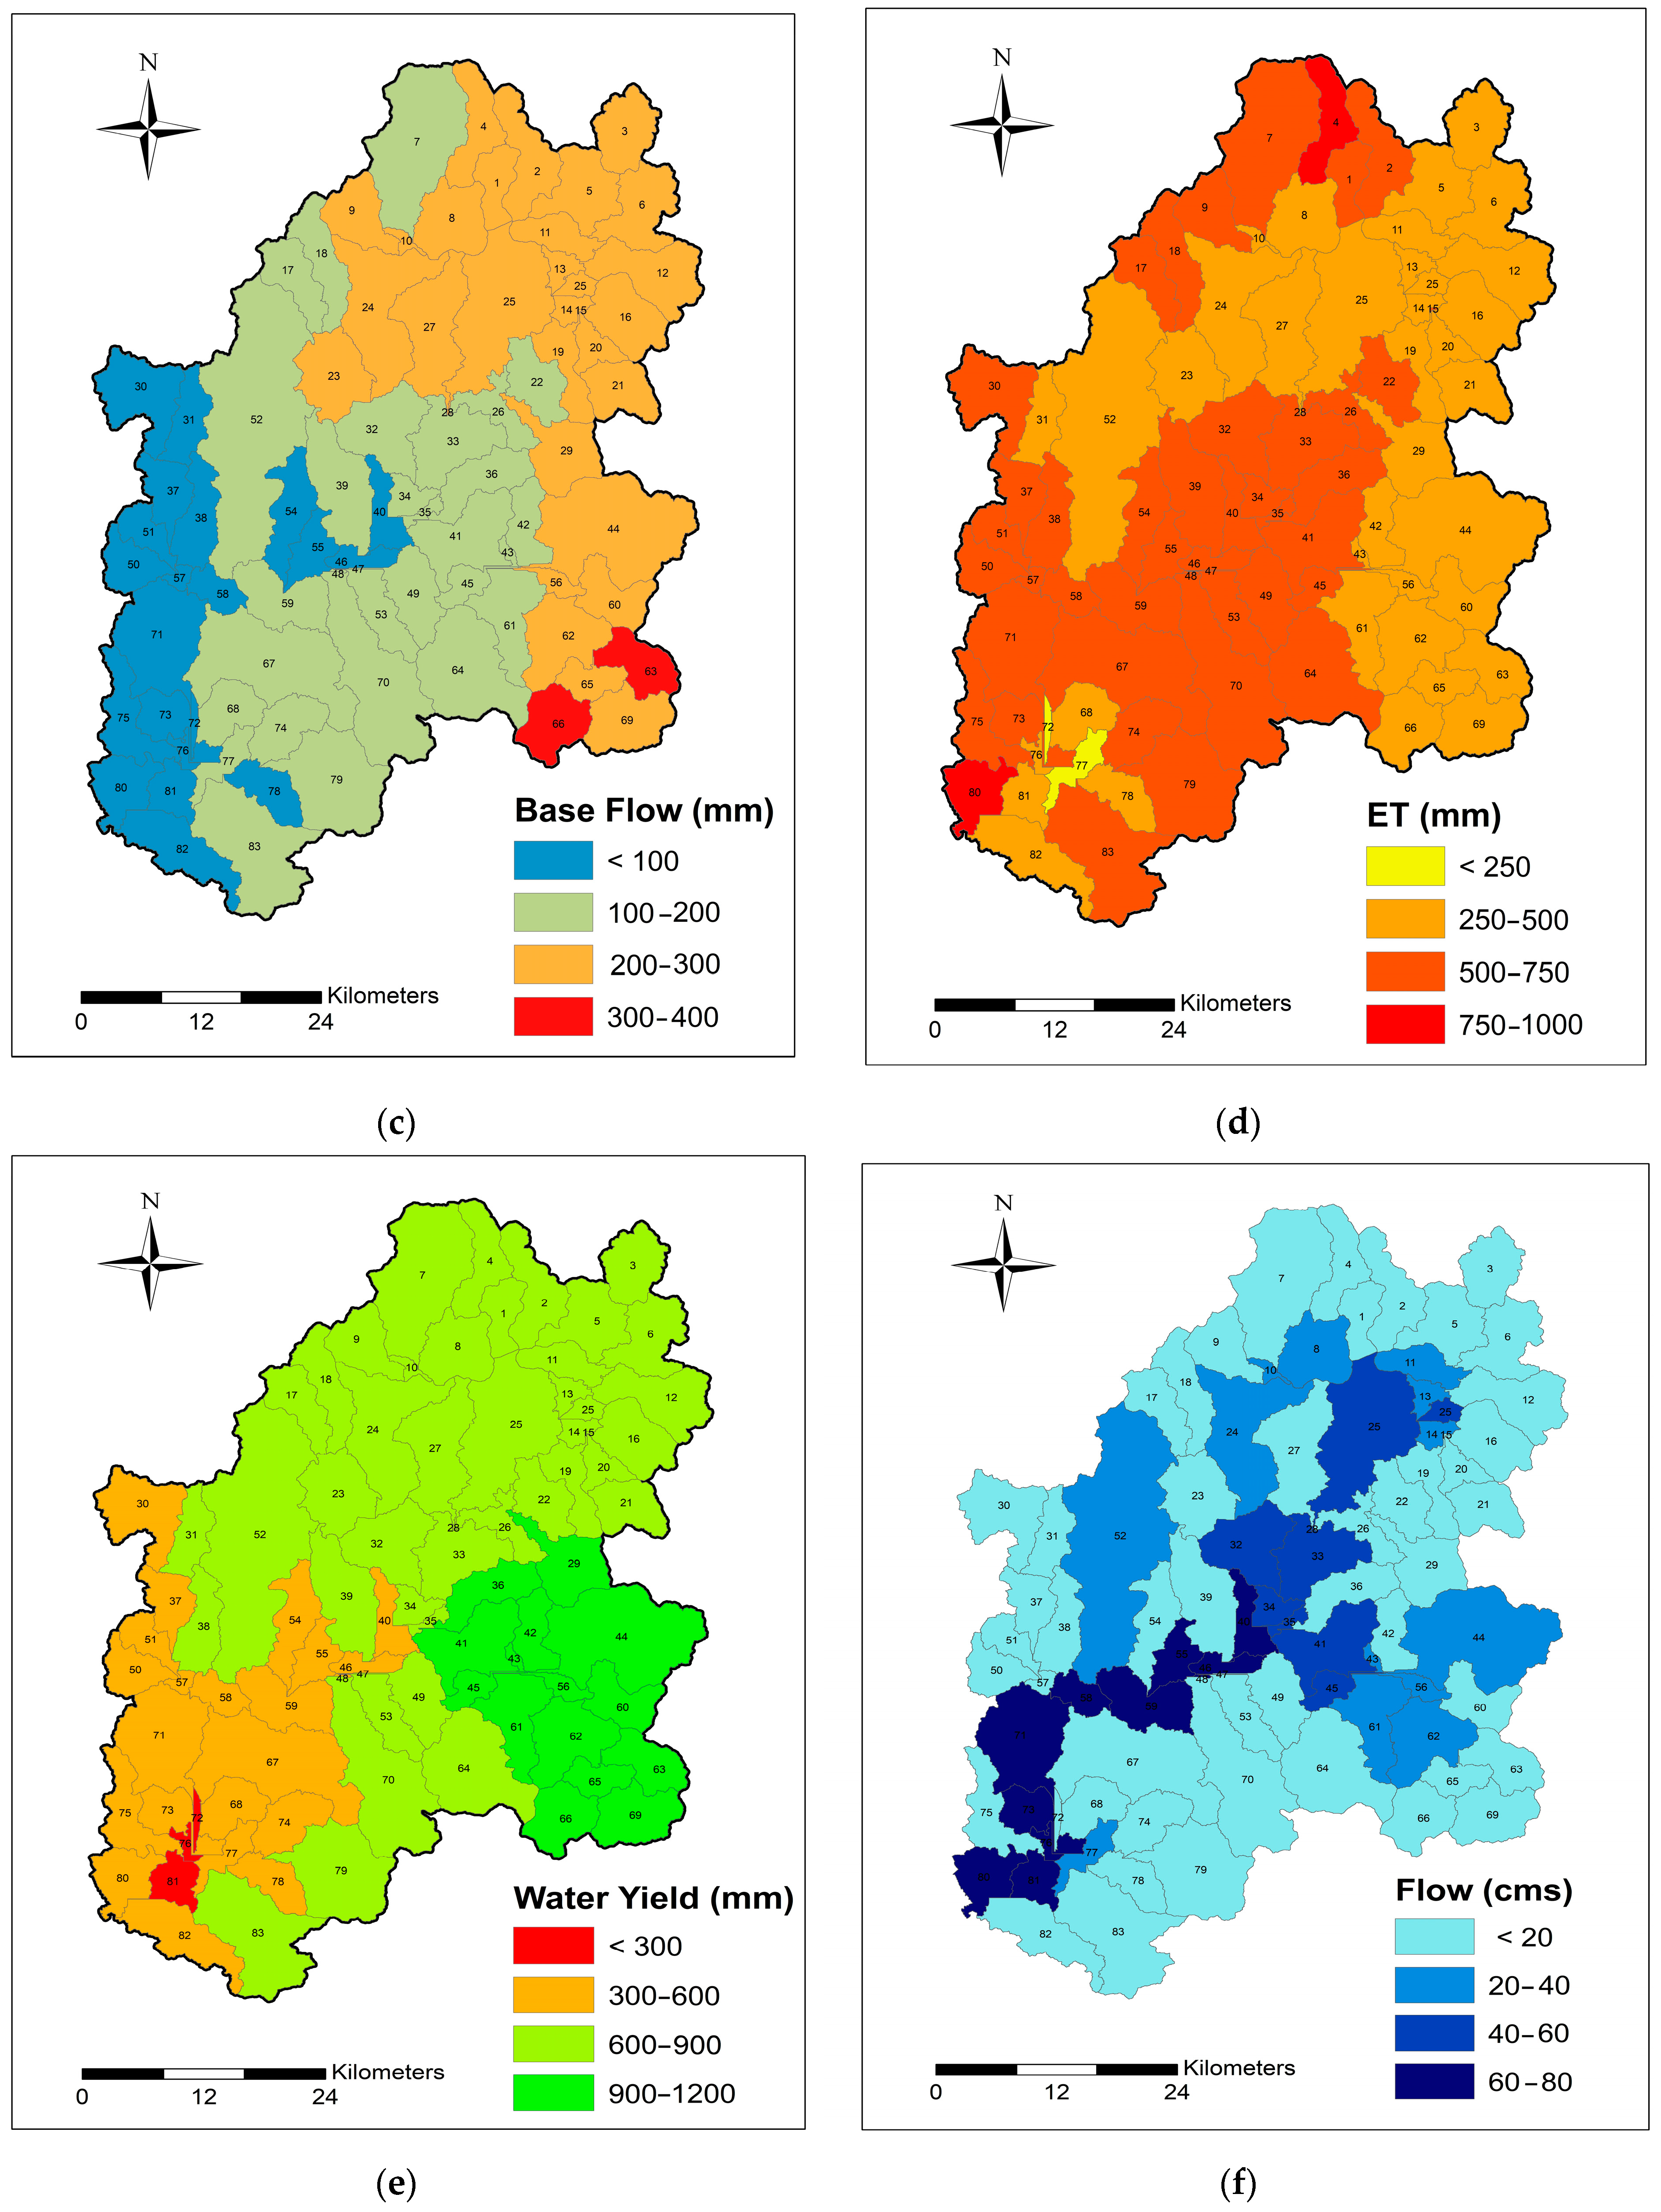
Spatial distribution of water balance across the sub-basins within the Yeongsan river watershed for rainfall, surface runoff, base flow, potential ET, and water yield was simulated from 1980–2021. Average annual rainfall ranged from 25.24 to 1573.92 mm, with the maximum level observed in the Jiseok stream sub-basin, the lower part of the upper Yeongsan river sub-basin, part of the Juksan weir sub-basin, and part of the Yeongam stream sub-basin, whereas the minimum rainfall occurred in the lower Yeongsan river sub-basin, parts of Yeongam stream sub-basin, and Yeongsan river estuary sub-basins (Figure 8a). Runoff and water availability are unevenly distributed in the sub-basins as a result of the variance in rainfall in the various sub-basins. The surface runoff contribution made up 38% of the basin’s total annual rainfall. Comparable to rainfall, the mid-sub-basins had the highest levels of surface runoff, while portions of the downstream sub-basins saw the lowest levels, with runoff values ranging from 490 to 730 mm (Figure 8b).
The distribution pattern of the surface runoff indicated that major surface runoff contribution occurred in the mid-sub-basins, which are dominated by agriculture. The annual values of the base flow varied from 122 to 318 mm at the sub-basin scale with the Jiseok stream sub-basin and lower Yeongsan river and Yeongsan River Estuary sub-basins exhibiting the highest and lowest values, respectively (Figure 8c). The base flow was higher in sub-basins with dams, whereas it was lower for sub-basin without dams, thus the dams contribute to base flow due to impounding reservoirs.
Figure 8d indicates that the average annual ET varied from 12 mm to 883 mm among the sub-basins. In the Yeongsan river basin, ET was higher in sub-basins with agriculture and forest covers and low in urban sub-basins. At the sub-basin scale, water yield varied from less than 300 to 1022 mm (Figure 8e). Water yield exhibited a similar pattern to rainfall due to factors, including land use/cover patterns, soil characteristics, and rainfall intensity. Figure 8f shows that the average stimulated streamflow is 0 m3/s to 70.63 m3/s throughout the sub-basins. Higher streamflows followed the same pattern as the Yeongsan river flow with the highest flows from the mid- to low-level basins.
5. Discussion
Based on the observations and results on hydrological variables, a spatio-temporal assessment was performed in the Yeongsan river basin using a multi-site approach. Understanding the spatio-temporal distribution of water balance using a multi-site calibration technique can help to inform water resource management decisions and mitigate the impacts of drought and flooding.
The calibration, validation, sensitivity, and uncertainty analysis of the SWAT model was assessed at four hydrological stations. Based on the criteria recommended by Moriasi et al. [51], the overall performance of the model could be rated as “very good to satisfactory” for the calibration and validation period (Table 6 and Table 7). The multi-site calibration of the SWAT model revealed satisfactory model performance at monthly time points for the Yeongsan river basin. Similar to our study, other research has also demonstrated the effectiveness of multi-site calibration in improving the accuracy of water balance models in monsoon watershed [5,6,7,8].
The monthly, seasonal, and annual water balance of the Yeongsan river basin was analyzed for 1980–2021 (42 years). The seasonal water balance was analyzed for four distinct seasons, namely winter, pre-monsoon, monsoon, and post-monsoon. Results show that rainfall, surface runoff, base flow, potential ET, and water yield were highest during the monsoon season (Table 8). Summer monsoon brings heavy rainfall, which leads to an increase in total annual rainfall. The increased rainfall during the summer monsoon can lead to increased surface runoff, particularly in areas with steep slopes or poor infiltration rates. This can cause flooding and erosion, as well as contribute to the base flow of streams and rivers [55]. Furthermore, the increased surface runoff during the monsoon season can lead to an increase in base flow, which can be beneficial for irrigation and other water uses [56]. The increased rainfall and humidity during the monsoon season can lead to an increase in ET, which can have implications for water resources and agriculture. Additionally, the increased rainfall and surface runoff during the monsoon season can lead to an increase in water yield, which can be beneficial for irrigation and other water uses [57].
Annual water balance reveals that the maximum rainfall and ET were observed in August, the maximum surface runoff, base flow, and water yield were observed in July (Figure 7), which could be attributed to the initial abstraction losses in the form of soil absorption and evaporation from the basin, thereby reducing runoff contribution. The highest ET was observed in the month of August, which could be attributed to higher evaporation demands owing to higher soil moisture availability. Transpiration plays a key role in the water cycle, especially in our area of study, which is predominantly made up of cultivated crops and forest cover [30].
The temporal distribution of water balance in the Yeongsan river watershed indicates that the water balance can vary significantly over the course of a year and across sub-basins. During the non-monsoon season, there may be little or no precipitation, resulting in low or negligible runoff and streamflow. As the monsoon season approaches, the amount of precipitation increases, leading to increased runoff and streamflow. After the monsoon season ends, the amount of precipitation decreases and the water balance returns to a drier state. These results are in conformity with studied carried out in monsoon watershed [58,59].
The spatial distribution of water balance in the Yeongsan river basin indicts that the Jiseok stream sub-basin receives the maximum rainfall and Yeongam stream sub-basin receives the lower rainfall (Figure 8a). Similar to rainfall, surface runoff and water yield follow the pattern. These sub-basins are dominated by agriculture due to the availability of water as paddy rice farming is the primary crop grown in this region. Base flow was higher in sub-basins with dams, whereas it was lower for sub-basin without dams, thus the dams contribute to base flow due to impounding reservoirs. Similar results found that dams can significantly increase base flow in a river or stream by releasing water from the reservoir during dry period [60,61]. ET is higher in areas with agriculture and forest covers, and lower in urban areas. This is because agriculture and forests have a higher density of vegetation, which transpires more water to the atmosphere. In contrast, urban areas tend to have fewer plants and more paved surfaces, which results in lower ET rates [62,63]. Simulated streamflow in the Yeongsan river basin reflects the amount of water that is being added to or removed from the system through the movement of water over the land surface. This information can be used to identify areas where there may be a surplus or deficit of water and to identify potential sources of water for irrigation or other purposes. It can also help to inform water management decisions and to develop strategies for managing water resources in a sustainable way.
Although the Yeongsan river basin receives a lot of rainfall, especially during the summer monsoon period, the region suffers from severe water deficit during the remaining months of the year as the majority of the rainfalls either flows as surface runoff or is lost through ET; thus, droughts may occur from short summer monsoon season [64]. In South Korea, precipitation is normally concentrated in the summer, when 70% of precipitation usually occurs. Therefore, the water supply in South Korea is managed through the operation of reservoirs or dams; the government agencies responsible for responding to agricultural and hydrological droughts assess and mitigate droughts based on the observed storage levels in these agricultural reservoirs and dams. Accordingly, an analysis of agricultural reservoir and dam storage levels based on precipitation deficits is required to understand the propagation of different types of droughts [65]. The water balance studies revealed that the Yeongsan river basin has sufficient water availability only the during monsoon season.
6. Conclusions
The study evaluates the temporal and spatial distribution of water balance for the Yeongsan river basin located in South Korea. SWAT model was developed and simulated from 1980 to 2021 using a multi-site calibration technique. Streamflow data (2006 to 2021) from four stations were deployed in SWAT-CUP to calibrate and validate the model. A monthly time step showed that the SWAT model ran successfully using six statistic metrics. The annual average rainfall of the Yeongsan river basin is estimated as 1336.07 mm, and potential ET (PET) is 40% (approximately) of the rainfall but with a large spatio-temporal heterogeneity. The water balance study revealed that the maximum precipitation and potential ET occurred in August, whereas the highest water yield, lateral flows, and surface flow occurred in July. Seasonally, rainfall varies from 148.79 mm (post-monsoon) to 853.89 mm (monsoon), PET from 37.94 mm (winter) to 316.8 mm (monsoon), and water yield from 35.74 mm (winter) to 514.12 mm (monsoon). The monsoon season contribution is 63.9%, 58.4%, and 66.6% in the average annual rainfall, PET, and water yield, respectively, at the Yeongsan river basin outlet. Furthermore, the Yeongsan river basin is rain-fed during the monsoon season, providing the highest streamflow. Water conservation mechanisms, such as dams and reservoirs, can be used to store more water for drought periods during the monsoon season when high runoff and rainfall occur. Water resource managers and planners can use the model results to create site-specific plans for the sustainable use of water resources.
Author Contributions
A.B.A. and S.-I.L. developed the methodology and prepared the manuscript. A.B.A. conducted the research under the supervision of S.-I.L. All authors have read and agreed to the published version of the manuscript.
Funding
This work was supported by the National Research Foundation of Korea (NRF), grant funded by the Korean government (MSIT) (2021R1A2C2011193).
Institutional Review Board Statement
Not applicable.
Informed Consent Statement
Not applicable.
Data Availability Statement
Not applicable.
Acknowledgments
The authors are thankful for the dam operation data provided by the Korea Rural Community Corporation.
Conflicts of Interest
The authors declare no conflict of interest.
References
- Musyoka, F.K.; Strauss, P.; Zhao, G.; Srinivasan, R.; Klik, A. Multi-Step Calibration Approach for SWAT Model Using Soil Moisture and Crop Yields in a Small Agricultural Catchment. Water 2021, 13, 2238. [Google Scholar] [CrossRef]
- Dakhlalla, A.O.; Parajuli, P.B. Assessing model parameters sensitivity and uncertainty of streamflow, sediment, and nutrient transport using SWAT. Inf. Process. Agric. 2019, 6, 61–72. [Google Scholar] [CrossRef]
- Thapa, B.R.; Ishidaira, H.; Pandey, V.P.; Shakya, N.M. A multi-model approach for analysing water balance dynamics in Kathmandu Valley, Nepal. J. Hydrol. Reg. Stud. 2017, 9, 162. [Google Scholar] [CrossRef]
- Wang, S.; Zhang, Z.; Sun, G.; Strauss, P.; Guo, J.; Tang, Y.; Yao, A. Multi-site calibration, validation, and sensitivity analysis of the MIKE SHE Model for a large watershed in northern China. Hydrol. Earth Syst. Sci. 2012, 16, 4621–4632. [Google Scholar] [CrossRef] [Green Version]
- Pandey, V.P.; Dhaubanjar, S.; Bharati, L.; Thapa, B.R. Spatio-temporal distribution of water availability in Karnali-Mohana Basin, Western Nepal: Hydrological model development using multi-site calibration approach (Part-A). J. Hydrol. Reg. Stud. 2020, 29, 100690. [Google Scholar] [CrossRef]
- Desai, S.; Singh, D.K.; Islam, A.; Sarangi, A. Multi-site calibration of hydrological model and assessment of water balance in a semi-arid river basin of India. Quatern. Inter. 2021, 571, 136–149. [Google Scholar] [CrossRef]
- Serur, A.B.; Adi, K.A. Multi-site calibration of hydrological model and the response of water balance components to land use land cover change in a rift valley Lake Basin in Ethiopia. Sci. Afr. 2022, 15, e01093. [Google Scholar] [CrossRef]
- Shrestha, M.K.; Recknagel, F.; Frizenschaf, J.; Meyer, W. Assessing SWAT models based on single and multi-site calibration for the simulation of flow and nutrient loads in the semi-arid Onkaparinga catchment in South Australia. Agric. Water Manag. 2016, 175, 61–71. [Google Scholar] [CrossRef]
- Lau, K.-M. East Asian Summer Monsoon Rainfall Variability and Climate Teleconnection. J. Meteorol. Soc. Japan. Ser. II 1992, 70, 211–242. [Google Scholar] [CrossRef] [Green Version]
- Kim, B.-J.; Kripalani, R.H.; Oh, J.-H.; Moon, S.-E. Summer monsoon rainfall patterns over South Korea and associated circulation features. Theor. Appl. Clim. 2002, 72, 65–74. [Google Scholar] [CrossRef]
- Ministry of Land, Infrastructure and Transport. Nation-Wide River Basins Investigation Report; MOLIT: Seoul, Republic of Korea, 2012.
- Ministry of Land, Infrastructure and Transport. The 4th Long-Term Comprehensive Plan of Water Resources (2001–2020); 3rd Revision; K-Water; MOLIT: Seoul, Republic of Korea, 2016.
- Kwak, J.W. A study on estimation of agricultural water usage in river consider hydrological condition. J. Korean Soc. Water Res. 2021, 54, 311–320. (In Korean) [Google Scholar] [CrossRef]
- Kim, S.; Lee, J.; Kim, J.; Kim, Y.; Shin, H.; Song, I.; Kim, S. Evaluation of Agricultural Water Supply and Selection of Deficient Districts in Yeongsan River Basin of South Korea Considering Supply Priority. Water 2022, 14, 298. [Google Scholar] [CrossRef]
- Kumari, N.; Srivastava, A.; Sahoo, B.; Raghuwanshi, N.S.; Bretreger, D. Identification of Suitable Hydrological Models for Streamflow Assessment in the Kangsabati River Basin, India, by Using Different Model Selection Scores. Nat. Resour. Res. 2021, 30, 4187–4205. [Google Scholar] [CrossRef]
- Darbandsari, P.; Coulibaly, P. Inter-comparison of lumped hydrological models in data-scarce watersheds using different precipitation forcing data sets: Case study of Northern Ontario, Canada. J. Hydrol. Reg. Stud. 2020, 31, 100730. [Google Scholar] [CrossRef]
- Islam, Z. A review of physically based distributed hydrological models. Ph.D. Thesis, University of Alberta, Edmonton, AB, Canada, May 2011. [Google Scholar]
- Lees, M.; O’Connell, P.E. Modeling distributed hydrological processes using physically based models. In Handbook of Hydrology; Maidment, D., Ed.; McGraw-Hill: New York, NY, USA, 1993; pp. 901–932. [Google Scholar]
- Gupta, H.V.; Sorooshian, S. Evaluation of artificial neural networks and multivariate adaptive regression splines for predicting soil moisture. Water Resour. Res. 1997, 33, 1485–1500. [Google Scholar]
- Arnold, J.G.; Srinivasan, R.; Muttiah, R.S.; Williams, J.R. Large area hydrologic modelling and assessment part I: Model development. J. Am. Water Resour. Assoc. 1998, 34, 73–89. [Google Scholar] [CrossRef]
- Johanson, R.C.; Imhoff, J.C.; Kittle, J.L.; Donigian, A.S. Hydrological Simulation Program-FORTRAN (HSPF): User’s Manual for Release 8.0: EPA-600/3-84-066; USEPA: Athens, GA, USA, 1984.
- Ambroise, B.; Beven, K.; Freer, J. Toward a generalization of the TOPMODEL concepts: Topographic indices of hydrological similarity. Water Resour. Res. 1996, 32, 2135–2145. [Google Scholar] [CrossRef]
- Refsgaard, J.C.; Storm, B. Computer models of watershed hydrology. In Mike She; Singh, V.P., Ed.; Water Resources Publications: Littleton, CO, USA, 1995; pp. 809–846. [Google Scholar]
- Malagó, A.; Bouraoui, F.; Vigiak, O.; Grizzetti, B.; Pastori, M. Modelling water and nutrient fluxes in the Danube River Basin with SWAT. Sci. Total Environ. 2017, 603–604, 196–218. [Google Scholar] [CrossRef] [PubMed]
- Gassman, P.W.; Reyes, M.R.; Green, C.H.; Arnold, J.G. The Soil and Water Assessment Tool: Historical Development, Applications, and Future Research Directions. Trans. ASABE 2007, 50, 1211–1250. [Google Scholar] [CrossRef] [Green Version]
- Williams, J.R.; Arnold, J.G.; Kiniry, J.R.; Gassman, P.W.; Green, C.H. History of model development at Temple, Texas. Hydrol. Sci. J. 2008, 53, 948–960. [Google Scholar] [CrossRef] [Green Version]
- Malik, M.A.; Dar, A.Q.; Jain, M.K. Modelling streamflow using the SWAT model and multi-site calibration utilizing SUFI-2 of SWAT-CUP model for high altitude catchments, NW Himalaya’s. Model. Earth Syst. Environ. 2022, 8, 1203–1213. [Google Scholar] [CrossRef]
- Tegegne, G.; Kim, Y.O. Modelling ungauged catchments using the catchment runoff response similarity. J. Hydrol. 2018, 564, 452–466. [Google Scholar] [CrossRef]
- Seong, Y.J.; Lee, S.H.; Jung, Y. Assessment of the uncertainty in the SWAT parameters based on formal and informal likelihood measure. J. Korea Water Resour. Assoc. 2019, 52, 931–940. (In Korean) [Google Scholar] [CrossRef]
- Ashu, A.B.; Lee, S.-I. Assessing Climate Change Effects on Water Balance in a Monsoon Watershed. Water 2020, 12, 2564. [Google Scholar] [CrossRef]
- Chung, I.-M.; Kim, Y.J.; Kim, N.W. Estimating the temporal distribution of groundwater recharge by using the transient water table fluctuation method and watershed hydrologic model. Appl. Eng. Agric. 2021, 37, 95–104. [Google Scholar] [CrossRef]
- Kim, Y.W.; Lee, J.W.; Woo, S.Y.; Kim, S.J. Inter-basin water transfer modeling from Seomjin river to Yeongsan river using SWAT. J. Korea Water Resour. Assoc. 2020, 53, 57–70. (In Korean) [Google Scholar] [CrossRef]
- Jolejole, M.E.; Kim, B.J.; Jeon, D.J.; Cayetano, M.; Kim, J.H. Scenario study of the effect of different land use to a sub-basin in Yeongsan River basin using SWAT model. Desalination Water Treat. 2018, 120, 198–204. [Google Scholar] [CrossRef]
- Cha, S.M.; Ki, S.J.; Cho, K.H.; Choi, H.; Kim, J.H. Effect of environmental flow management on river water quality: A case study at Yeongsan River, Korea. Water Sci. Technol. 2009, 59, 2437–2446. [Google Scholar] [CrossRef]
- Shin, J.K.; Kang, B.G.; Hwang, S.J. Limnological study on springbloom of a green algae, Eudorina elegans and weirwater pulsed flows in the midstream (Seungchon Weir Pool) of the Yeongsan River, Korea. Korean J. Ecol. Environ. 2016, 49, 320–333. [Google Scholar] [CrossRef]
- Lee, K.-H.; Kang, T.-W.; Ryu, H.-S.; Hwang, S.-H.; Kim, K. Analysis of spatiotemporal variation in river water quality using clustering techniques: A case study in the Yeongsan River, Republic of Korea. Environ. Sci. Pollut. Res. 2020, 27, 29327–29340. [Google Scholar] [CrossRef]
- MOLIT. Water Resources Long-Term Comprehensive Plan Report (2001–2020); Ministry of Land, Infrastructure and Transport: Sejong-si, Republic of Korea, 2016. (In Korean)
- Lee, B.J.; Kim, J.C.; Kim, Y.B.; Cho, D.L.; Choi, H.I.; Jeon, H.Y.; Kim, B.C. Explanatory note of the 1:250,000 Geological Map of Gwangju sheet; Korea Institute of Geoscience and Mineral Resources: Gwanju, Republic of Korea, 1997; pp. 1–82. (In Korean) [Google Scholar]
- Im, Y.S. Evaluation of Suspended Sediment Sources in the Yeongsan River. Ph.D. Thesis, Seoul National University, Seoul, Republic of Korea, February 2016. [Google Scholar]
- Neitsch, S.L.; Arnold, J.G.; Kiniry, J.R.; Williams, J.R.; King, K.W. Soil and Water Assessment Tool. Theoretical Documentation, Version 2005; Soil and Water Research Laboratory, Agricultural Research Service: Temple, TX, USA, 2005.
- Choi, H.C.; Kim, J.H.; Yun, K.H.; Kim, T.G. A Management Plan for River-Stream Maintenance Flow to Improve Water Quality in Yeongsan River; Ministry of Environment, National Institute of Environmental Research: Seoul, Republic of Korea, 2006.
- Yoon, K.-S.; Jo, Y.-J.; Yoo, S.-H.; Her, Y. Assessing agricultural reservoirs as the sources of environmental flow: Case study in Korea. In Proceedings of the 3rd World Irrigation Forum (WIF3), Bali, Indonesia, 1–7 September 2019. [Google Scholar]
- Abbaspour, K.C. SWAT-CUP 2012, SWAT Calibration and Uncertainty Program—A User Manual, Eawag; Swiss Federal Institute of Aquatic Science and Technology: Duebendorf, Switzerland, 2013. [Google Scholar]
- Schuol, J.; Abbaspour, K.C.; Sarinivasan, R.; Yang, H. Estimation of freshwater availability in the West African sub-continent using the SWAT hydrologic model. J. Hydrol. 2008, 352, 30–49. [Google Scholar] [CrossRef]
- Yang, J.; Reichert, P.; Abbaspour, K.C.; Yang, H. Comparing uncertainty analysis techniques for a SWAT application to Chaohe Basin in China. J. Hydrol. 2008, 358, 1–23. [Google Scholar] [CrossRef]
- Abbaspour, K.C.; Yang, J.; Maximov, I.; Siber, R.; Bogner, K.; Mieleitner, J.; Zobrist, J.; Srinivasan, R. Modelling hydrology and water quality in the pre-alpine/alpine Thur watershed using SWAT. J. Hydrol. 2007, 333, 413–430. [Google Scholar] [CrossRef]
- Beven, K.; Binley, A. The future of distributed models: Model calibration and uncertainty prediction. Hydrol. Process. 1992, 6, 279–298. [Google Scholar] [CrossRef]
- Refsgaard, J.C. Parameterization, calibration and validation of distributed hydrological models. J. Hydrol. 1997, 198, 69–97. [Google Scholar] [CrossRef]
- Santhi, C.; Arnold, J.G.; Williams, J.R.; Dugas, W.A.; Srinivasan, R.; Hauck, L.M. Validation of the swat model on a large river basin with point and nonpoint sources. J. Am. Water Resour. Assoc. 2001, 37, 1169–1188. [Google Scholar] [CrossRef]
- Neitsch, S.L.; Arnold, J.G.; Kiniry, J.R.; Williams, J.R. Soil and Water Assessment Tool Theoretical Documentation Version 2009, Texas Water Resources Institute Report No. 406; Texas A & M University: College Station, TX, USA, 2011. [Google Scholar]
- Moriasi, D.N.; Gitau, M.W.; Pai, N.; Daqqupati, P. Hydrologic and Water Quality Models: Performance Measures and Evaluation Criteria. Trans. ASABE 2015, 58, 1763–1785. [Google Scholar] [CrossRef] [Green Version]
- Nash, J.E.; Sutcliffe, J.V. River flow forecasting through conceptual model. Part 1—A discussion of principles. J. Hydrol. 1970, 10, 282–290. [Google Scholar] [CrossRef]
- Gupta, H.V.; Sorooshian, S.; Yapo, P.O. Status of Automatic Calibration for Hydrologic Models: Comparison with Multilevel Expert Calibration. J. Hydrol. Eng. 1999, 4, 135–143. [Google Scholar] [CrossRef]
- Sorooshian, S.; Duan, Q.; Gupta, V.K. Calibration of rainfall-runoff models: Application of global optimization to the Sacramento Soil Moisture Accounting Model. Water Resour. Res. 1993, 29, 1185–1194. [Google Scholar] [CrossRef]
- Kim, H. Impact of monsoon on the hydrological cycle in Korea. J. Hydrol. 2007, 333, 50–62. [Google Scholar]
- Lee, J.H.; Lee, J.Y. Effects of the Asian summer monsoon on the water balance of the Han River basin in South Korea. Hydrol. Proc. 2012, 26, 3027–3038. [Google Scholar]
- Lee, J.Y.; Kim, H. Impacts of the Asian summer monsoon on the water balance of the Nakdong River basin in Korea. Hydrol. Proc. 2006, 20, 2143–2155. [Google Scholar]
- Hossain, F.; Yusoff, I. An analysis of the water balance of a monsoon-dominated catchment in Malaysia. J. Hydrol. Sci. 2016, 61, 1109–1121. [Google Scholar]
- Thakur, R.K.; Singh, R. Hydrological aspects of monsoon in India. In Hydrological Processes of Monsoon Asia; Springer: Berlin/Heidelberg, Germany, 2012; pp. 1–18. [Google Scholar]
- Rhea, K.R.; Conklin, M.M. Impoundment regulation of base flow in two catchments in the eastern United States. Hydrol. Earth Sys. Sci. 2011, 15, 1729–1743. [Google Scholar]
- Hunt, R.H.; Newbold, J.D. 2014. Hydrologic response to dam removal in four catchments in the eastern United States. Water Resour. Res. 2014, 50, 6168–6182. [Google Scholar]
- Jimenez, J.A.; Vautard, R.J.; Kilsby, C. Spatiotemporal variability of actual evapotranspiration in Europe. Agri. For. Meteorol. 2010, 150, 1042–1053. [Google Scholar]
- Chen, J.; Liu, Y.; Liu, Y. Comparison of actual evapotranspiration between urban and rural areas in China. Environ. Moni. Ass. 2018, 190, 576. [Google Scholar]
- Zhang, L.; Zhou, T. Drought over East Asia: A review. J. Clim. 2015, 28, 3375–3399. [Google Scholar] [CrossRef]
- Bae, H.; Ji, H.; Lim, Y.J.; Ryu, Y.; Kim, M.H.; Kim, B.J. Characteristics of drought propagation in South Korea: Relationship between meteorological, agricultural, and hydrological droughts. Nat. Hazards 2019, 99, 1–16. [Google Scholar] [CrossRef]
Figure 1.
Yeongsan river basin’s location.

Figure 2.
Flowchart of the study.

Figure 3.
The Yeongsan river basin DEM.

Figure 4.
Yeongsan river basin soil map.

Figure 5.
Yeongsan river basin’s land use/cover.

Figure 6.
Locations of weather station, streamflow station, and dams in the Yeongsan river basin.

Figure 7.
Mean monthly water balance in the Yeongsan basin from 1980 to 2021.

Figure 8.
Spatial distribution of water balance: (a) rainfall; (b) surface runoff; (c) base flow; (d) potential evapotranspiration; (e) water yield; and (f) simulated streamflow in the Yeongsan river basin.
Figure 8.
Spatial distribution of water balance: (a) rainfall; (b) surface runoff; (c) base flow; (d) potential evapotranspiration; (e) water yield; and (f) simulated streamflow in the Yeongsan river basin.


Table 1.
The Yeongsan river basin’s soil classifications.
| Soil Class | SWAT Code | Area (km2) | % of Watershed Area |
|---|---|---|---|
| Loam | Kh29-2b-5920 | 1083.62 | 31.49 |
| Sandy Loam | Lo57-1-2b-5983 | 297.57 | 8.65 |
| Sandy Loam | Qa13-1b-6022 | 2027.45 | 58.92 |
| Lfs-Lfs-S | Sample-0 | 32.46 | 0.94 |
Table 2.
The Yeongsan river basin’s land use classifications.
| Land Use | SWAT Code | Area (km2) | % of Watershed Area |
|---|---|---|---|
| Agricultural Land—Close-grown | AGRC | 675.14 | 19.62 |
| Forest—Deciduous | FRSD | 498.61 | 14.49 |
| Forest—Evergreen | FRSE | 547.48 | 15.91 |
| Agricultural Land—Row Crops | AGRR | 262.56 | 7.63 |
| Agricultural Land—Generic | AGRL | 49.9 | 1.45 |
| Forest—Mixed | FRST | 698.54 | 20.3 |
| Pasture | PAST | 110.46 | 3.21 |
| Range—Grasses | RNGE | 25.46 | 0.74 |
| Range—Brush | RNGB | 35.79 | 1.04 |
| Residential | URBN | 340.6 | 9.9 |
| Barren | BARR | 83.37 | 2.51 |
| Water | WATR | 110 | 3.20 |
Table 3.
Weather station used in the SWAT model.
| ID | Station | Latitude (Decimal Degree) | Longitude (Decimal Degree) | Elevation (m) |
|---|---|---|---|---|
| 156 | Gwanju (Q1) | 35.17294 | 126.89156 | 70 |
| 165 | Mokpo (Q2) | 34.81732 | 126.38151 | 45 |
| 174 | Suchon (Q3) | 35.0204 | 127.3694 | 165 |
| 244 | Imsil (Q4) | 35.61225 | 127.28554 | 247 |
| 245 | Jeongeup (Q5) | 35.56337 | 126.83904 | 69 |
| 247 | Namwon (Q6) | 35.42129 | 127.39651 | 133 |
| 260 | Jangheung (Q7) | 34.68886 | 126.91951 | 44 |
| 261 | Haenam (Q8) | 34.55375 | 126.56907 | 16 |
Table 4.
Detailed dam characteristics.
| Dam Characteristics | JS | DY | GJ | NJ | Dike |
|---|---|---|---|---|---|
| Dam ID | 5002410 | 5001420 | 5001410 | 5003410 | - |
| Watershed area (ha) | 12,280 | 6560 | 4130 | 10,470 | - |
| Surface Area (ha) | 742 | 443 | 217 | 779 | 270 |
| Total storage capacity (103 m3) | 103,883 | 77,608 | 23,256 | 107,810 | 253.6 |
| Dead storage capacity (103 m3) | 99,707 | 76,670 | 21,086 | 106,544 | - |
| Mandatory discharge amount (m3/s) | 0.78 | 0.4 | 0.18 | 0.3 | - |
| Length (m) | 603 | 316 | 505 | 496 | 4300 |
| Height (m) | 36 | 46 | 25 | 31 | 20 |
Table 5.
Calibrated values of the SWAT parameters in the Yeongsan river basin.
| Data | Description | Range | Reference |
|---|---|---|---|
| CN2.mgt | SCS runoff curve number | 0.1–0.5 | 0.2 |
| ALPHA_BF.gw | Baseflow alpha factor | 0–1 | 0.09 |
| GW_DELAY.gw | Groundwater delay | 10–30 | 24 |
| CH_K2.rte | Alluvium main channel hydraulic conductivity | 30–150 | 88 |
| SOL_AWC.sol | The capacity of water available | ±0.025 | −0.08 |
| GWQMN.gw | Shallow aquifer water threshold depth | 1000–3500 | 1591 |
| GW_REVAP.gw | Coefficient of groundwater “revap” | ±0.036 | −0.01 |
| ESCO.bsn | Compensation soil evaporation | 0–1 | 0.69 |
| REVAPMN.gw | Shallow aquifer water depth threshold | 1–30 | 13 |
| SOL_Z.sol | Soil surface to bottom layer depth | ±0.025 | 0.04 |
| SOL_K.sol | Saturated hydraulic conductivity | ±0.025 | 0.03 |
| EPCO.bsn | Compensation plant uptake factor | 0–1 | 0.72 |
| OV_N.hru | Overland flow for Manning’s number | ±10 | −1.23 |
| RCHRG_DP.gw | Deep aquifer percolation fraction | 0–1 | 0.51 |
Table 6.
Monthly streamflow calibration statistics.
| Station | P-factor | PBIAS | NSE | R-factor | R2 | RSR |
|---|---|---|---|---|---|---|
| Najudaegyo | 0.51 | 14.9 | 0.85 | 0.35 | 0.87 | 0.39 |
| Yeongsugyo | 0.51 | 11.6 | 0.65 | 0.17 | 0.88 | 0.59 |
| Hwangryonggyo 2 | 0.63 | 19.3 | 0.79 | 0.43 | 0.88 | 0.45 |
| Deokyonggyo | 0.64 | 4.5 | 0.75 | 0.40 | 0.83 | 0.50 |
Table 7.
Monthly streamflow validation statistics.
| Station | P-factor | PBIAS | NSE | R-factor | R2 | RSR |
|---|---|---|---|---|---|---|
| Najudaegyo | 0.54 | −0.9 | 0.89 | 0.53 | 0.89 | 0.33 |
| Yeongsugyo | 0.60 | 2.1 | 0.60 | 0.26 | 0.91 | 0.63 |
| Hwangryonggyo 2 | 0.75 | −13.5 | 0.91 | 0.77 | 0.92 | 0.30 |
| Deokyonggyo | 0.71 | −19.5 | 0.84 | 0.72 | 0.86 | 0.40 |
Table 8.
Yeongsan river basin seasonal water balance.
| Seasons | Rainfall | Surface Runoff | Base Flow | Evapotranspiration | Water Yield | |||||
|---|---|---|---|---|---|---|---|---|---|---|
| mm | % | mm | % | mm | % | mm | % | mm | % | |
| Winter | 76.49 | 5.7 | 14.45 | 2.8 | 8.89 | 6.5 | 37.94 | 7 | 35.74 | 4.6 |
| Pre-monsoon | 256.9 | 19.2 | 80.08 | 15.7 | 15.84 | 21 | 125.39 | 23.1 | 131.05 | 17 |
| Monsoon | 853.89 | 63.9 | 382.21 | 74.7 | 44.54 | 59 | 316.8 | 58.4 | 514.12 | 66.6 |
| Post-monsoon | 148.79 | 11.1 | 33.55 | 6.6 | 10.22 | 13.5 | 62.63 | 11.5 | 91.37 | 11.8 |
| Average Annual | 1336.07 | 100 | 510.29 | 100 | 75.49 | 100 | 542.76 | 100 | 772.28 | 100 |
Disclaimer/Publisher’s Note: The statements, opinions and data contained in all publications are solely those of the individual author(s) and contributor(s) and not of MDPI and/or the editor(s). MDPI and/or the editor(s) disclaim responsibility for any injury to people or property resulting from any ideas, methods, instructions or products referred to in the content. |
© 2023 by the authors. Licensee MDPI, Basel, Switzerland. This article is an open access article distributed under the terms and conditions of the Creative Commons Attribution (CC BY) license (https://creativecommons.org/licenses/by/4.0/).
Share and Cite
MDPI and ACS Style
Ashu, A.B.; Lee, S.-I. Multi-Site Calibration of Hydrological Model and Spatio-Temporal Assessment of Water Balance in a Monsoon Watershed. Water 2023, 15, 360. https://doi.org/10.3390/w15020360
AMA Style
Ashu AB, Lee S-I. Multi-Site Calibration of Hydrological Model and Spatio-Temporal Assessment of Water Balance in a Monsoon Watershed. Water. 2023; 15(2):360. https://doi.org/10.3390/w15020360
Chicago/Turabian StyleAshu, Agbortoko Bate, and Sang-Il Lee. 2023. "Multi-Site Calibration of Hydrological Model and Spatio-Temporal Assessment of Water Balance in a Monsoon Watershed" Water 15, no. 2: 360. https://doi.org/10.3390/w15020360
Note that from the first issue of 2016, this journal uses article numbers instead of page numbers. See further details here.