
Patterns of Recent Changes in Channel Morphology and Flows in the Upper and Middle Odra River
by
 ,
,
Ádám Nádudvari
1,
Agnieszka Czajka
1,*,
Bartłomiej Wyżga
2,
Marcin Zygmunt
3 and
Marcin Wdowikowski
4
1
Institute of Earth Sciences, Faculty of Natural Sciences, University of Silesia in Katowice, Będzińska 60, 41-200 Sosnowiec, Poland
2
Institute of Nature Conservation, Polish Academy of Sciences, al. Mickiewicza 33, 31-120 Kraków, Poland
3
Faculty of Science and Technology, University of Silesia, Bankowa 14, 40-007 Katowice, Poland
4
Department of Water Supply and Sewerage Systems, Faculty of Environmental Engineering, Wroclaw University of Science and Technology, Wybrzeże Wyspiańskiego 27, 50-370 Wrocław, Poland
*
Author to whom correspondence should be addressed.
Water 2023, 15(2), 370; https://doi.org/10.3390/w15020370
Submission received: 21 December 2022
/
Revised: 11 January 2023
/
Accepted: 13 January 2023
/
Published: 16 January 2023
(This article belongs to the Special Issue Monitoring of Immediate and Long-Term Effects of River Restoration Projects)
Abstract
:Our research introduces the river regulation effects on three sections of the upper and middle Odra River (south-western Poland), with differently channelized parts. In the upper and lower reaches, the river was straightened, narrowed, and trained with groins, whereas in the middle section, it was also impounded by numerous barrages. The discharge duration (DD) and water stage duration (WSD) curves for water-gauge stations from these river sections were analyzed to recognize changes in river flows and channel morphology since the mid-20th century. This analysis is supplemented by an examination of repeated surveys of the gauge cross sections of the river, annual precipitation totals in its catchment, and their relationship to the variation of the North Atlantic Oscillation (NAO) index. Our findings provide new hydrological insights for the region. The three river sections exhibited different patterns of the adjustment of the channel morphology to the river channelization: upper section was typified by channel incision, middle section by channel stability, and lower section by channel incision in its upper part and vertical stability of the channel bed in the lower part. Barrages in the middle section stabilized water stages in a wide range of hydrological conditions. Annual precipitation totals and river run-off did not change systematically over the study period. The variation in precipitation totals was inversely related to annual values of the NAO index. The study confirms the usefulness of DD/WSD curves to analyze changes in river run-off and the vertical position of the channel bed.
1. Introduction
River morphodynamics is a complex issue because rivers are characterized by a continuous variation in physical conditions along their length, accompanied by complexity and fluctuations of conditions in the catchment. Any direct or indirect human influence, such as channel regulation or land use change, may potentially induce adjustment of the river morphology. Although mostly predictable, river responses to a variety of overlapping long-term affecting factors are usually delayed, making the explanation of changes in river morphodynamics a challenging task [1,2,3].
In the Anthropocene, channel regulation seems to have had a decisive impact on the functioning of rivers. To choose the most efficient method of future river management, active fluvial processes and consequences of any engineering works need to be known and understood in detail [4]. Water stage duration/discharge duration (WSD/DD) curves are a useful tool for evaluating the hydrological characteristics of the river regime and flow variability [5,6,7]. These curves show the link between streamflow and the respective exceedance frequencies, but their use and reliability depend on the availability of measured data [8]. WSD/DD curves can also provide information about the catchment response to rainfall events, ranging from low-volume events to events of flood magnitude, and are particularly useful for low-flow regime characterization [9,10,11,12]. A WSD/DD curve represents the relationship between the magnitude and frequency of daily, weekly, and monthly (or any other time interval) streamflow for a particular river basin, providing an estimate of the proportion of the time a given water stage or discharge was equaled or exceeded in a given record period [5,13,14]. These curves are useful tools for appraising the geological characteristics of drainage basins, with the lower end of a flow duration curve giving valuable information about the effect of geology on groundwater run-off into a river [5]. The shapes of flow duration curves for low-water stages provide information on the hydrological behavior of a river and the vertical movement of a channel bed [15].
Bed degradation and channel incision result from the loss of the geomorphic equilibrium of a river. In general, incision remodels the channel from a wide and shallow one to a narrow and deep one. It is typical of Anthropocene landscapes [16]; such river channel evolution was documented for numerous rivers worldwide, e.g., [17,18,19,20,21,22]. Channel incision may be induced by numerous factors reducing sediment supply—such as in-channel gravel mining [23,24,25,26,27], river impoundment by a dam [28,29,30], and catchment reforestation [31]—or increasing river transport capacity as a result of channelization [4,32,33,34,35,36]. Such changes induce an imbalance between a river’s transport capacity and the amount of material available for fluvial transport [27,37]. The effects of channel incision are visible as undermined embankment structures, bridges, and pipelines, as well as exposed banks and water intakes. Incision-caused lowering of a channel bed entails a decrease in water stages both within the channel and on the floodplain [22] and may eventually cause disconnection of the channel from its floodplain. Incision often leads to lateral channel instability in formerly stable reaches [27,35,38,39] because of facilitated undermining of excessively high banks [34,40] and increased channel slope [41,42]. A lowering of the channel bed of a stem river decreases the base level of tributaries, increasing their slope and triggering upstream-progressing erosion [27].
The evolution of a river channel is influenced by numerous direct and indirect factors operating on local, catchment, regional, and/or global scales, the continuously changing mosaic of which induces different hydrological and morphological responses. In our study, we considered the North Atlantic Oscillation (NAO) because [43] demonstrated its strong influence on the run-off volume of Polish rivers, with above-average annual run-off occurring at a negative NAO phase and below-average run-off occurring at a positive phase. This approach allows us to distinguish between global and local influences on the channel geometry of the Odra River and the position of water stages in the channel.
In this study, we explore the implications of river engineering works for the hydrological and morphological discontinuity of the Odra River, also considering climatic fluctuations as an additional factor affecting the river dynamics. The study has two main aims: (i) to demonstrate river adjustments to engineering works and (ii) to identify periods with differing amounts of river run-off driven by climate variability.
2. Materials and Methods
2.1. Study Area
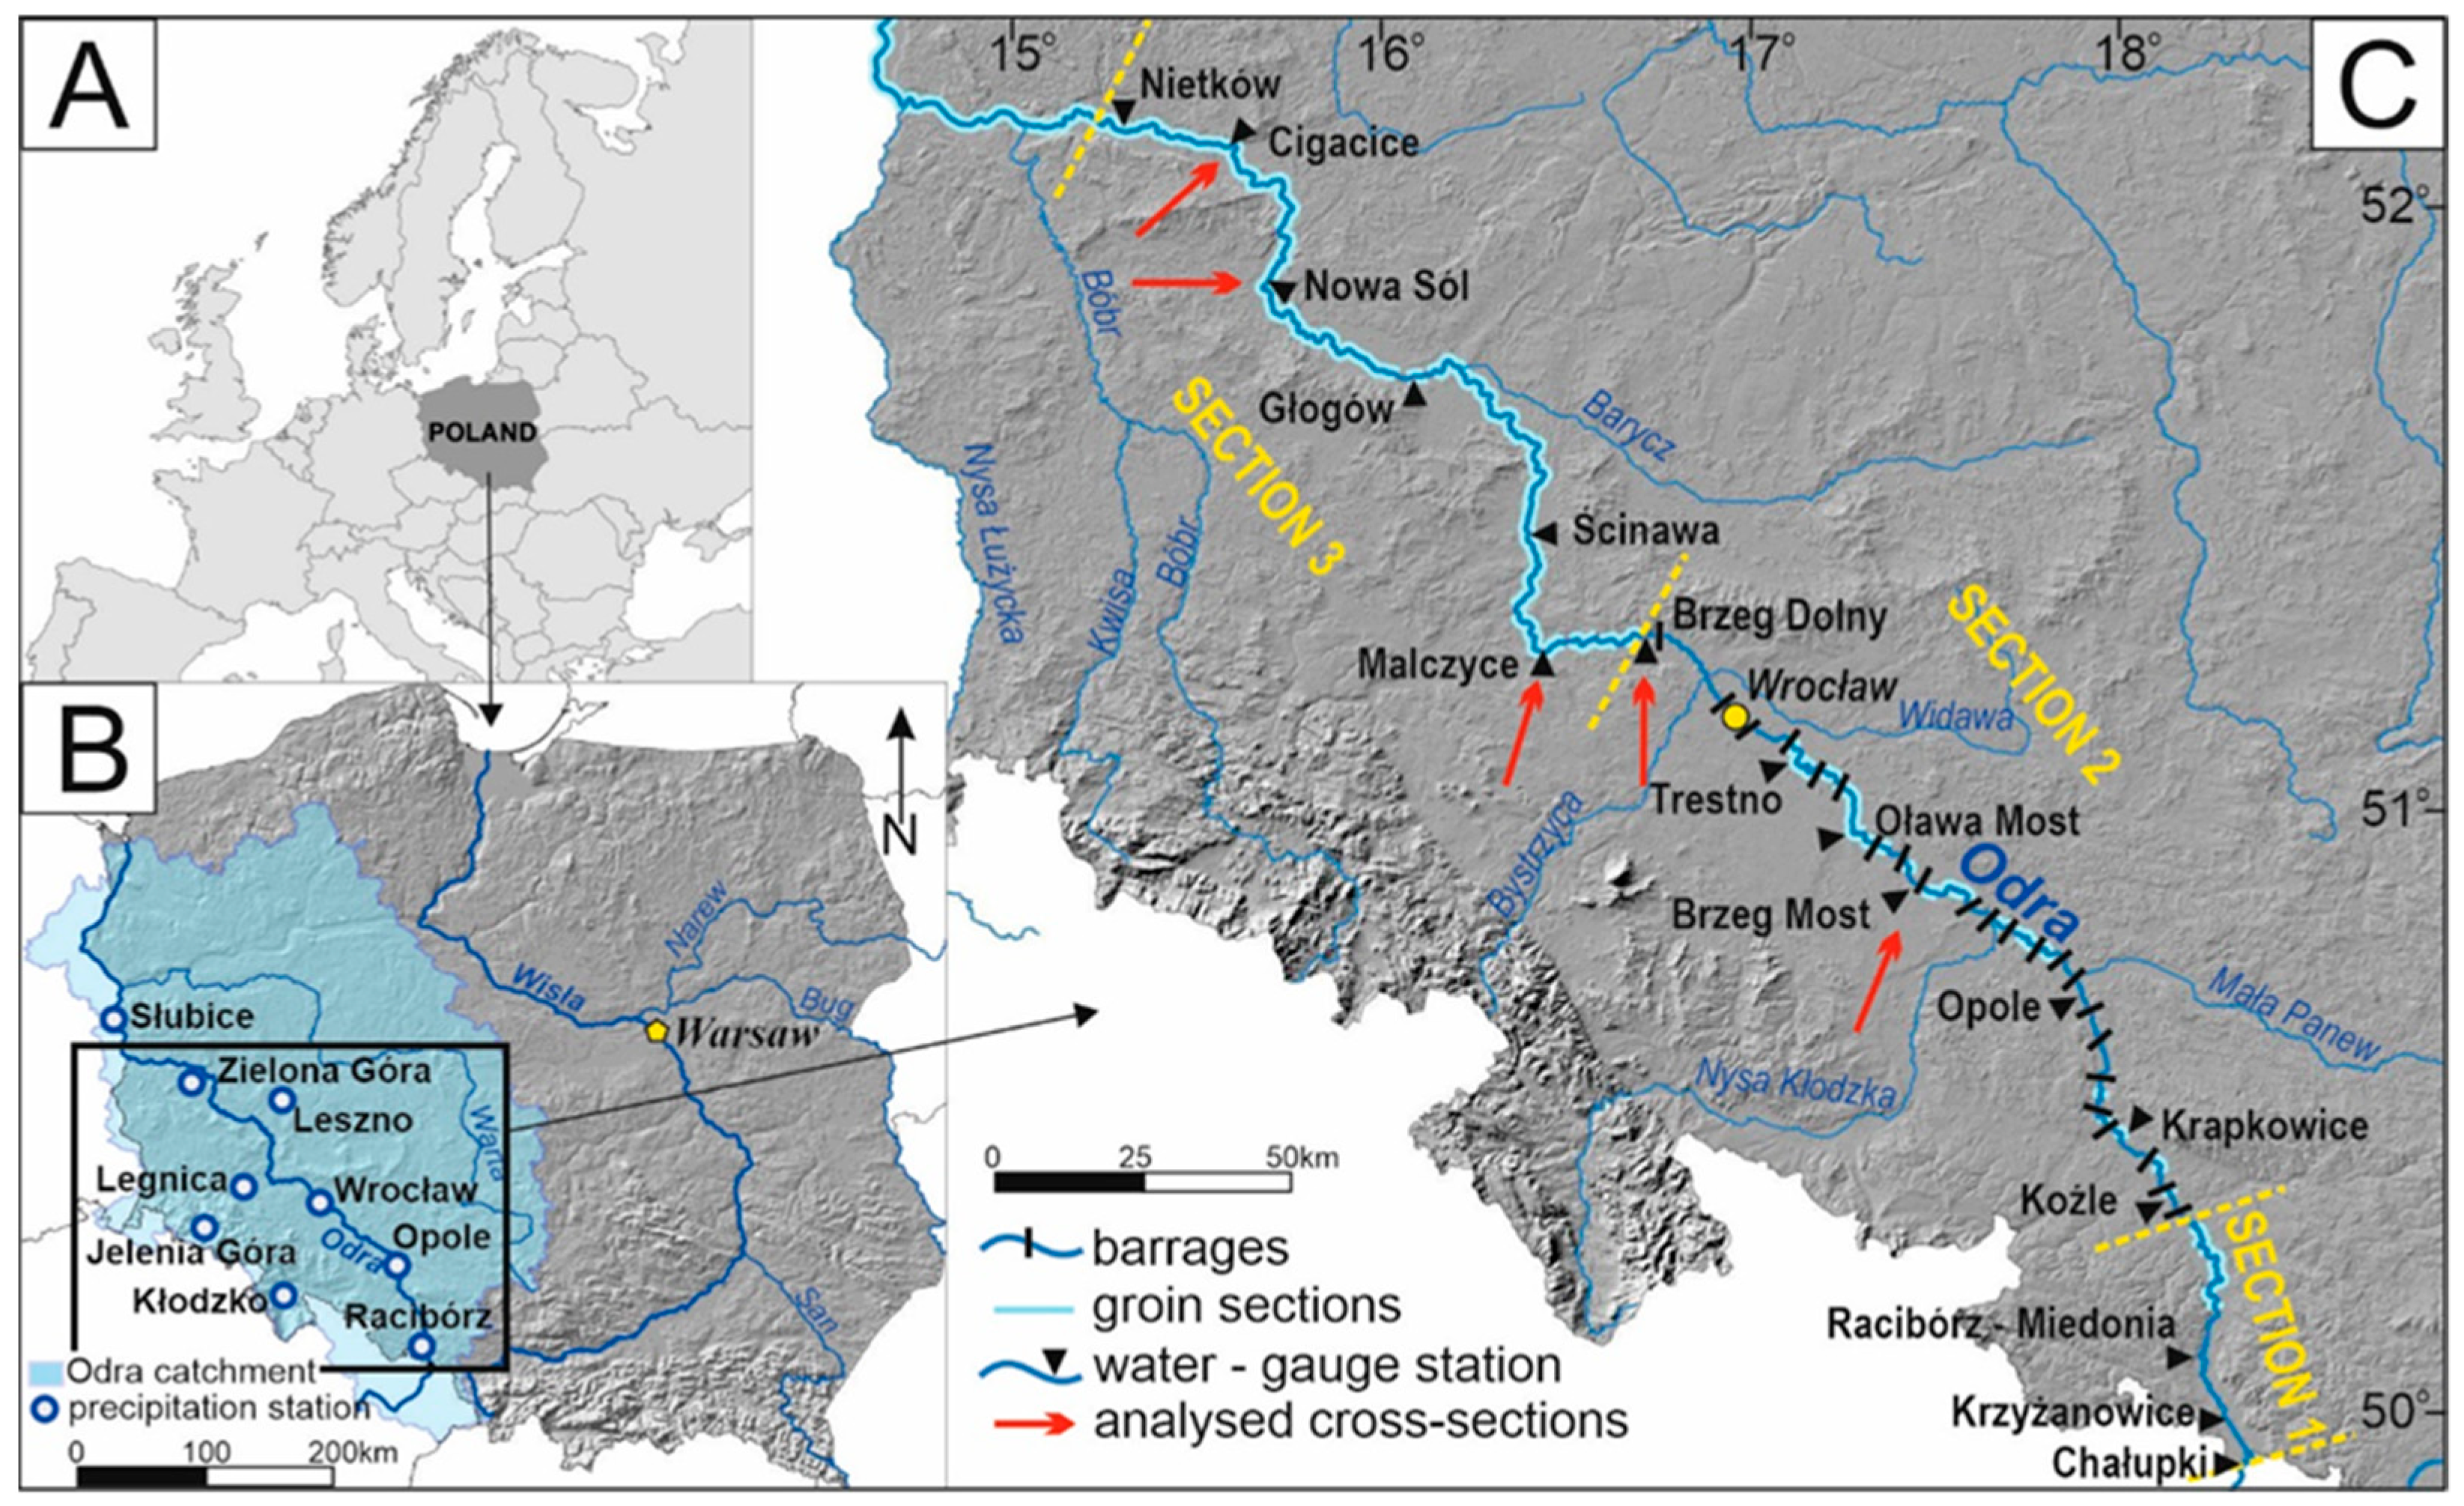
The Odra is mostly a lowland river, with a nival–pluvial–groundwater hydrological regime [44] and a catchment comprising ca. 33% of the area of Poland. As the Odra River is 854 km long (with 742 km in Poland; Figure 1), its mean annual discharge changes downstream from 41 m3 s−1 in the upper course to 535 m3 s−1 at the river mouth. The channel slope decreases from 0.7% near the Czech–Polish border through 0.38% in the middle course and 0.25% in the lower course to 0.04% at the mouth [45]. The catchment of the upper and middle Odra River comprises four physiogeographic regions: the Carpathian Mountains, the Sudety Mountains, the Sudety Piedmont, and the Silesian Lowland. In its upper course, the Odra is a sand-gravel-bed river, while in the lower course, sand is the dominating bed material. The left-bank tributaries of the Odra River flowing out from the Sudety Mountains are mountain rivers in their upper courses and submontane ones in the lower courses, whereas the right-bank tributaries are lowland rivers [46,47]. The highest floods with the largest spatial extent in the catchment are generated by advective rainfall of moderate intensity, lasting at least 2–3 days, whereas convective rainfall of high intensity and a duration of a few to several hours results in local flash floods [48]. Due to channelization of the Odra River in Section 2 (Figure 1), here the river flows to change more rapidly in response to rainfall events in the catchment. Over large parts of the catchment of the upper and middle Odra River, the melting of the snow cover may be rapid. All these factors facilitate the occurrence of relatively rapid, large floods in the upper and middle river course, which can modify the relief of the valley floor. In the lower part of the Odra River catchment, floods mostly occur in spring as a result of the simultaneous melting of the snow cover over extensive lowland areas [47].
Prior to extensive human impacts on its channel, the Odra was a meandering river. The first weirs impounding water for watermills were built in the 12th century [45]. Local bank revetments preventing channel migration have been constructed since Medieval times. A large-scale regulation of the Odra River channel began in 1746 [45]. Its early phase, which lasted until the early 19th century, consisted of channel straightening through meander cut-offs. In total, 34 artificial meander cut-offs were made between Koźle and the mouth of the Nysa Kłodzka River, resulting in the shortening of the river course by 14.7% [45]. The adaptation of the Odra River channel for navigation purposes started with the signing of the Bogumin Protocol in 1819. This initiated the second phase of intense channelization works that aimed at river regulation with groins to attain the minimum depth of the waterway of 1 m at low discharges [49]. However, the bed material flushed out from the narrowed channel upstream caused shallowing of the channel downstream, and in the late 19th century, it became evident that additional technical measures were necessary to obtain the required depth of the waterway. In the 1890s–1900s, 26 barrages were built on the river between Koźle and Wrocław (Figure 1), with 12 of them constructed between Koźle and the mouth of the Nysa Kłodzka River and 14 downstream of this tributary [45]. In the late 1950s, construction of a barrage at Brzeg Dolny, 25 km downstream from Wrocław, completed the channelization of the middle Odra River.
An increase in the size of barges used on the river caused in the 20th century a required depth of the waterway to increase to 1.8 m. However, in many places, particularly in the upper course of the Odra River, such depth is impossible to achieve because of water shortage. The drainage basin of the Odra River is a water-poor area; the long-term mean annual precipitation in the basin amounts to only 592 mm, being below the national average of 618 mm [50].
Despite their limited effectiveness in creating a navigable waterway, various man-made constructions developed within the channel and the floodplain of the Odra River dramatically influenced the morphological river evolution. As a result of these river modifications, up to 3.5 m of bed degradation has occurred to date, and this process was most rapid in the 18th century [51]. In this study, we analyzed the adjustments of the Odra River between the Czech–Polish border and the Nietków water-gauge cross section (Figure 1) using records of daily water stage and discharge in the years 1901–2018 in 16 water-gauge stations. We divided the analyzed part of the river course into three study sections differing with respect to a dominant type of river channelization:
a. In Section 1 between the Czech–Polish border and the barrage at Koźle (Figure 1), the river course was shortened by meander cut-offs, although a meandering channel pattern has remained in its uppermost, 7-km-long reach [52]. In the straightened part of the section, the river was trained by groins. As a result of these interventions, the riverbed degraded by up to 3.5 m and the channel width reduced by one-third to three-fourths of the original value [51]. Currently, the average channel width in the section is 61 m and the river has an average sinuosity of 1.25.
b. Section 2 extending between the barrages at Koźle and Brzeg Dolny is entirely channelized, and except groins, 23 barrages accompanied by hydropower plants partition the river course there (Figure 1). The average channel width is 80 m.
c. In Section 3 extending downstream from the barrage at Brzeg Dolny to the Nietków water-gauge station (Figure 1), the average channel width is 130 m. Although the riverbanks are fixed and arrays of groins train the river along the entire section, it is termed “freely flowing Odra” because of lacking river impoundment by barrages. Only at Malczyce, a new barrage started to operate in 2018.
2.2. Methods
Data about daily water stages and discharges at 16 water-gauge stations on the upper and middle Odra River and annual precipitation totals at 9 precipitation-monitoring stations from the Odra River catchment (Figure 1) were retrieved from the Institute of Meteorology and Water Management—National Research Institute (IMWM-NRI) acting as the National Hydrological and Meteorological Service (NHMS) in Poland. Data about the North Atlantic Oscillation (NAO) index were downloaded from the website of the U.S. National Oceanic and Atmospheric Administration [53].
For each of the analyzed water-gauge stations, decadal WSD/DD curves were calculated based on daily data in the period 1901–2020. The collected data for a given station were grouped to determine a frequency distribution [5]. For this, all observations were divided into 10-year periods. Within each period, the observations were ordered from the highest to the lowest, regardless of any particular observation being made within the given decade. The data were then split into intervals of 10 cm (water stage) or 10 m3 s−1 (discharge). The number of data in each water stage/discharge interval was termed a “frequency index”: fy(h) for water stage and gy(h) for discharge, where y denotes a 10-year interval and h is the height (10 cm or 10 m3 s−1). A cumulative frequency of interval y in a given year was calculated using the formula:
where k is the summation index. The corresponding distribution was then calculated using the formula:
In the same way, a frequency distribution was calculated:
The frequency distribution tables were then presented as duration curves in diagrams.
The frequency index Fy(h) shows how often in the analyzed period water stages reach or exceed the lowest stage in a particular interval. Calculated duration curves characterize the percentage of time, during which water stages or discharges are likely to equal or exceed some specified value of an interest in a river [5,15].
The WSD/DD curves created for succeeding decades enabled us to determine temporal trends in the water stage and discharge in each station under analysis and to compare them among the stations. The increase in the cumulative percentage of the water stage or discharge for a given period indicates that the stages/discharges mostly fell below the averages calculated for the whole record period, indicating the occurrence of a dry period. If both WSD/DD curves follow the same trends, climatic factors may be involved. If a change in the cumulative percentage of the water stage occurs when the discharge duration curve does not change or changes in the opposite direction, a modification of channel geometry can be indicated.
With a lack of data about river discharges in Section 2 of the Odra River, we used annual precipitation totals at 9 precipitation-monitoring stations from the upper and middle parts of its catchment and an average value of the annual precipitation at these stations as substitute information about the variation in river run-off over the past few decades. The occurrence of a systematic change in the annual precipitation totals at the stations and of the catchment-average precipitation totals during the study period was subsequently tested with linear regression models. To verify the influence of the NAO index on the variation of precipitation in the upper and middle Odra River catchment, the significance of possible relationships between the annual precipitation totals at the 9 stations and the catchment-average annual precipitation totals on the one hand and the annual values of the NAO index on the other hand was estimated with linear regression models. The regression relationships analyzed in the study were considered statistically significant if the p-value was <0.05.
Data from successive surveys of water-gauge cross-sections of the Odra River performed during the past few decades were retrieved from the Institute of Meteorology and Water Management—National Research Institute. They were subsequently used to reconstruct changes in vertical and lateral positions of the river channel in the gauge cross-sections over the past few decades.
3. Results
3.1. Changes in Water-Stage and Discharge Duration Curves
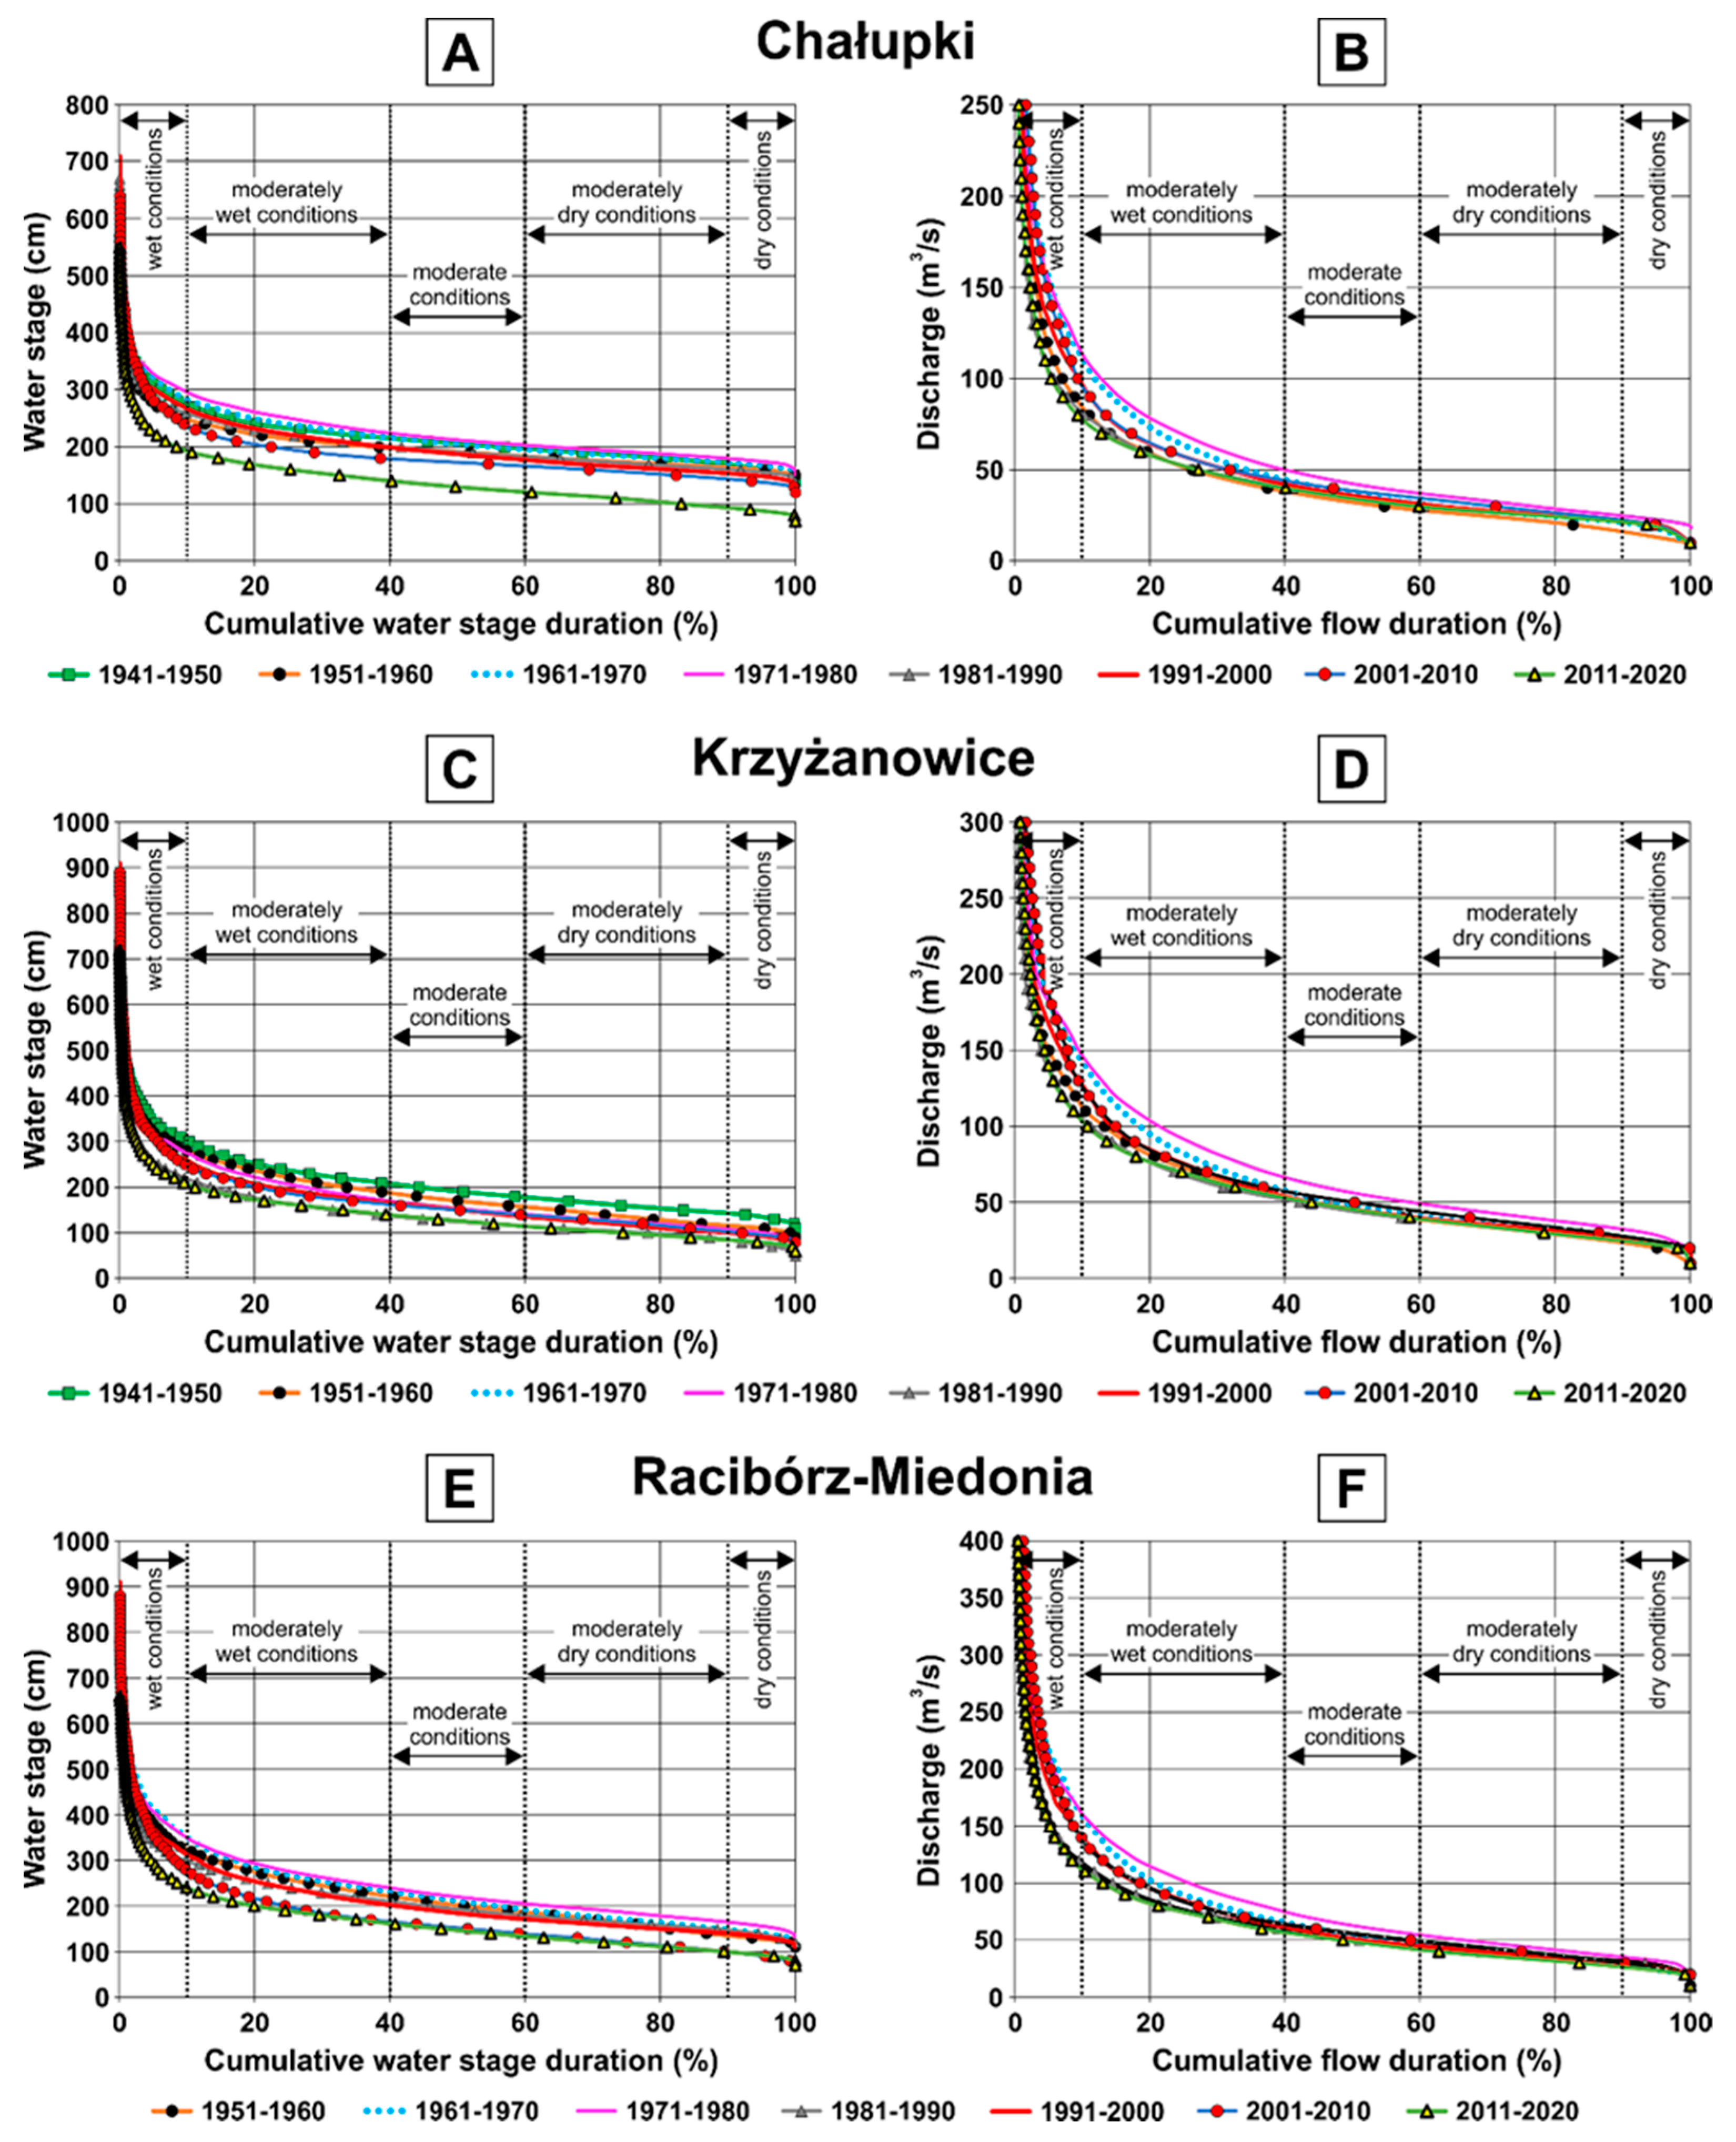
Three water-gauge stations are located in Section 1: Chałupki, Krzyżanowice, and Racibórz-Miedonia (Figure 1). The DD curves for the stations indicate the occurrence of relatively high run-off in the 1970s in the entire spectrum of conditions and in the 1960s during wet and moderately wet conditions (0–40% of the duration). In contrast, the 1950s, 1980s, and 2010s were typified by relatively low run-off, particularly during wet and moderately wet conditions (Figure 2B,D,F and Figure S1). These differences in discharges were generally mimicked by WSD curves, with the curves for the 1970s and 1960s positioned higher than those for the 1980s and 2010s. However, a relatively high position of WSD curves for the 1950s and 1940s indicates the occurrence of channel incision at the gauge cross sections after the mid-20th century (Figure 2A,C,E and Figure S1). The incision must have been particularly intense in the Chałupki gauge cross section, as indicated by the largest difference between the oldest and the youngest WSD curves observed at this station (Figure 2A and Figure S1).
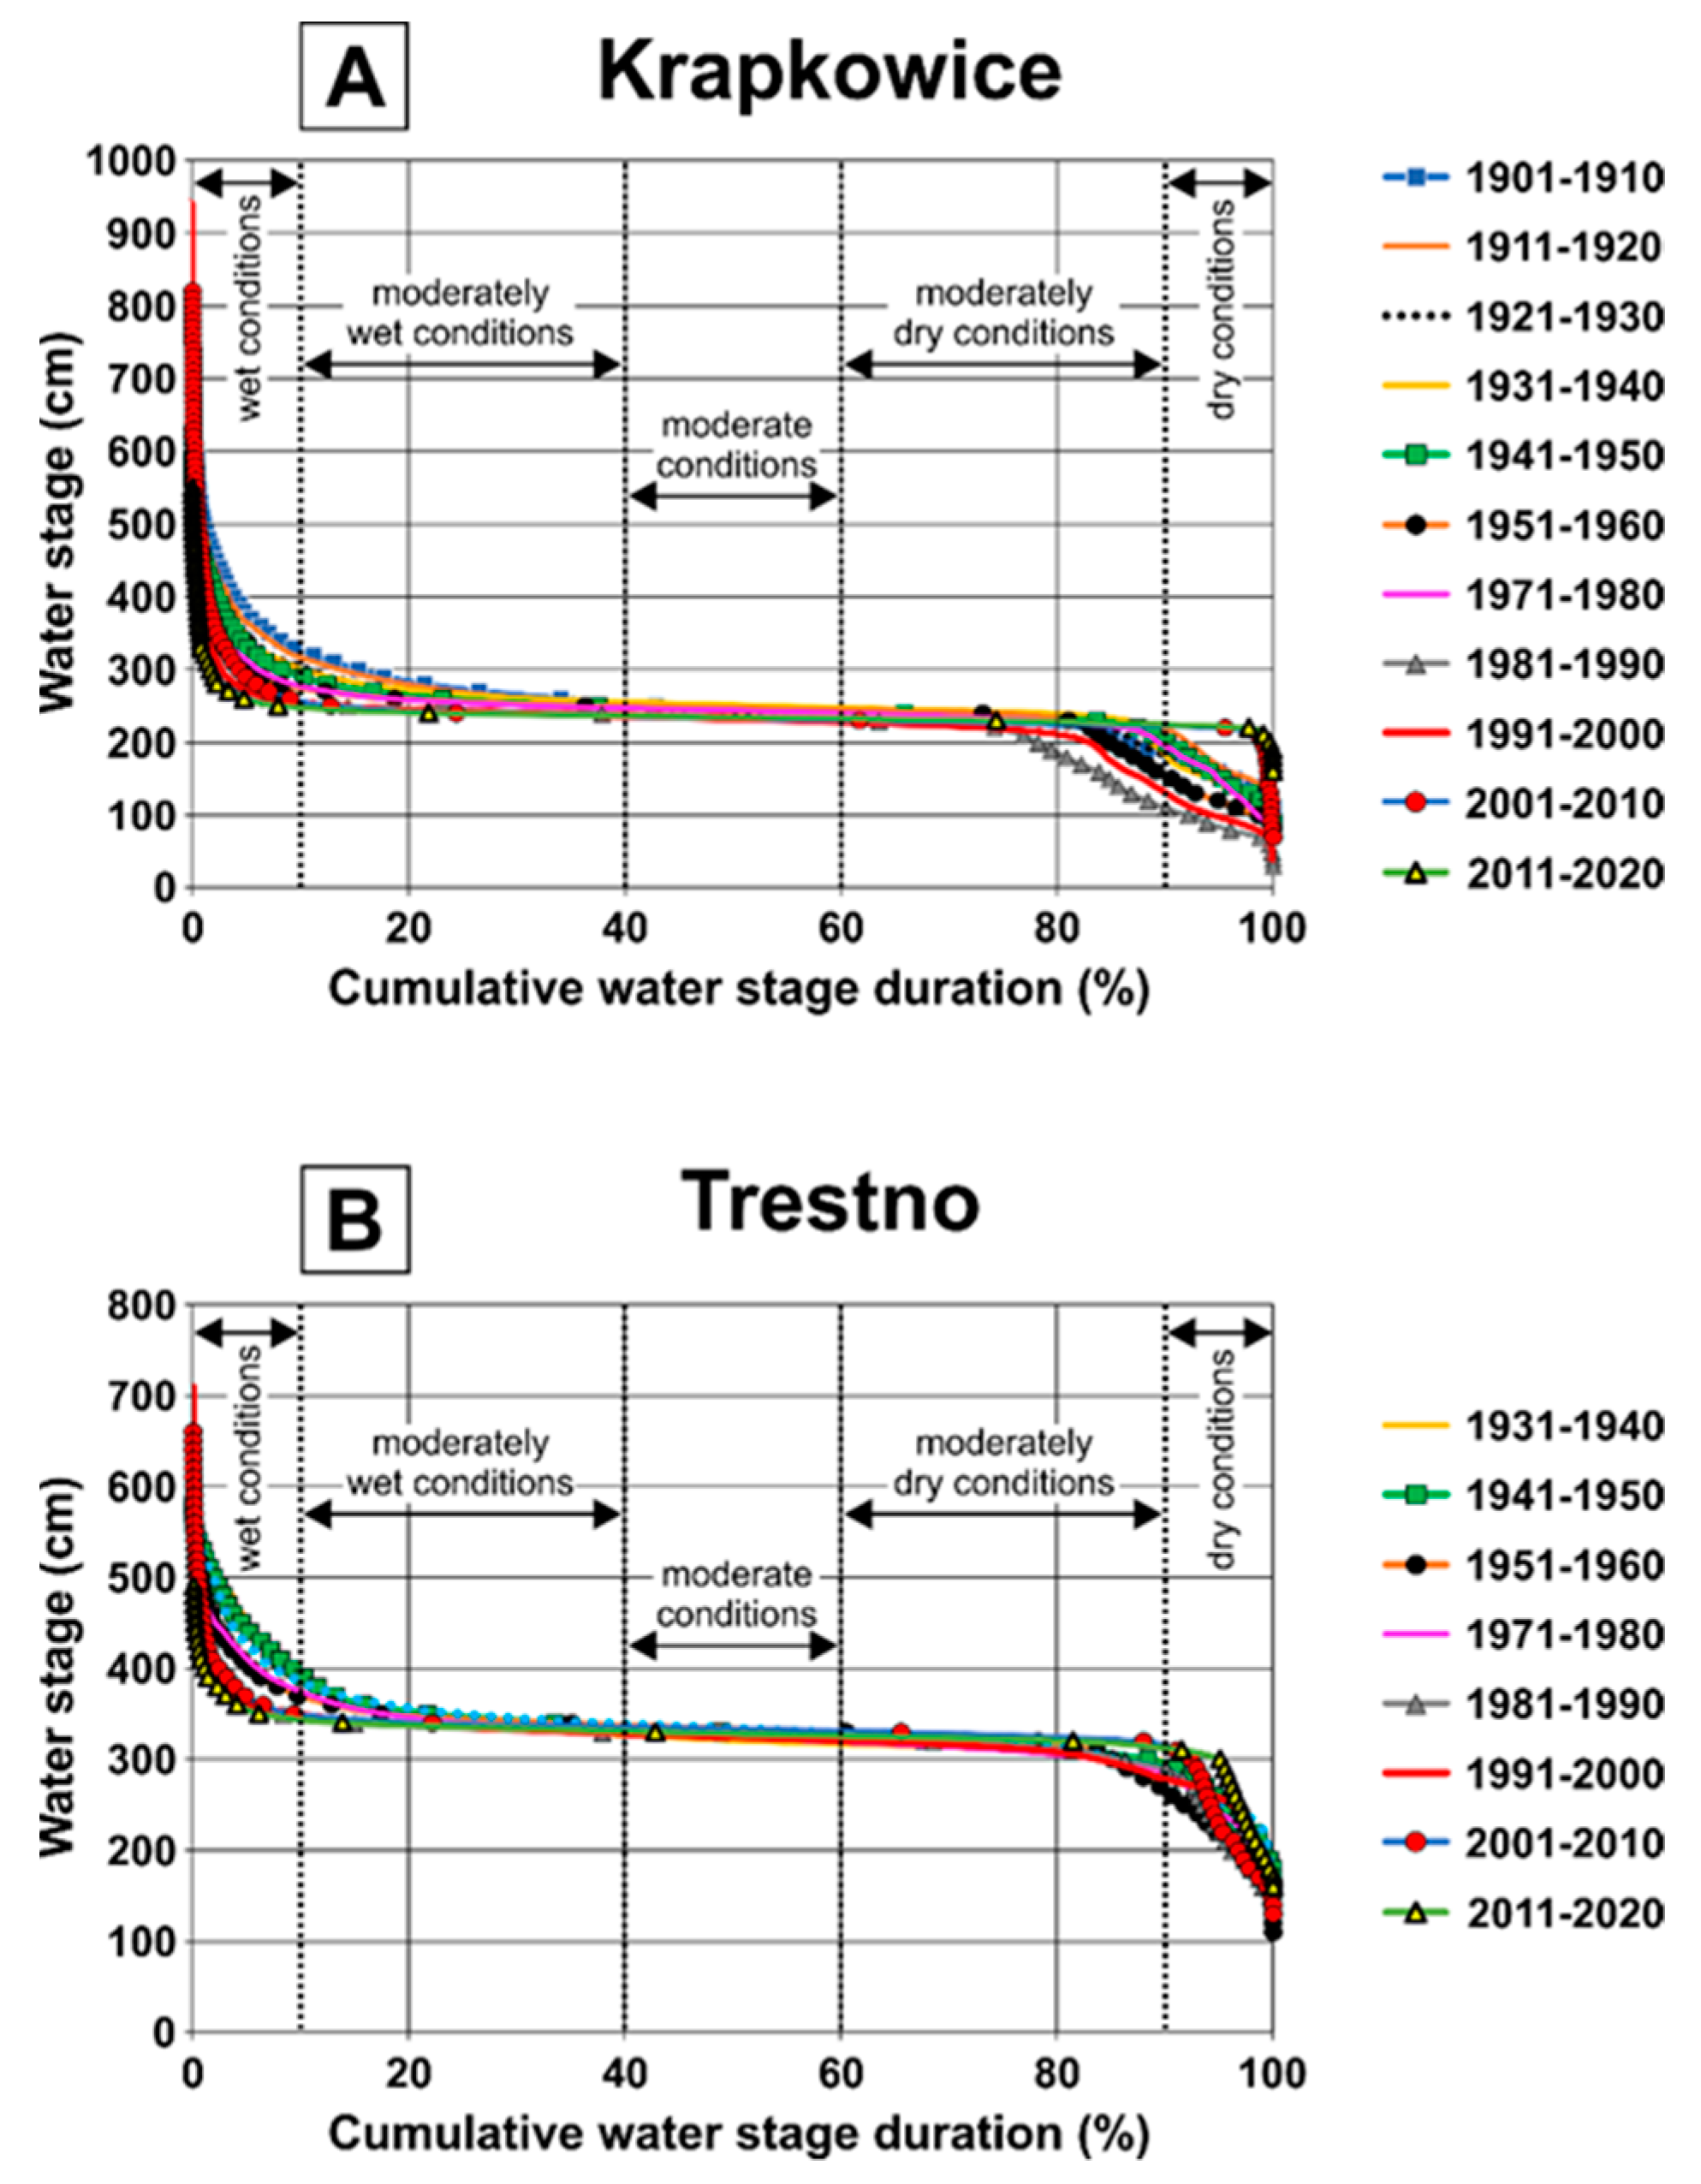
Six water-gauge stations are located in Section 2 of the Odra River: Koźle, Krapkowice, Opole, Brzeg Most, Oława Most, and Trestno (Figure 1). In this section, the operation of barrages has been the most significant human disturbance to hydrological conditions. Due to it, quite different discharges can be associated with the same water stage upstream of a barrage, depending on the degree to which the barrage gates are opened, and thus no discharges and DD curves were available for the gauging stations. The control exerted by the barrages on water stages in this river section is reflected in a flattened shape of WSD curves, with similar stages maintained over a wide range of moderately dry, moderate, and moderately wet conditions, as illustrated by the WSD curves for the Krapkowice and Trestno stations in the upstream and downstream parts of the section, respectively (Figure 3 and Figure S2). Only during wet conditions generating flood flows and dry conditions causing droughts, water stages in the section could not be effectively controlled by the barrages (Figure 3 and Figure S2).
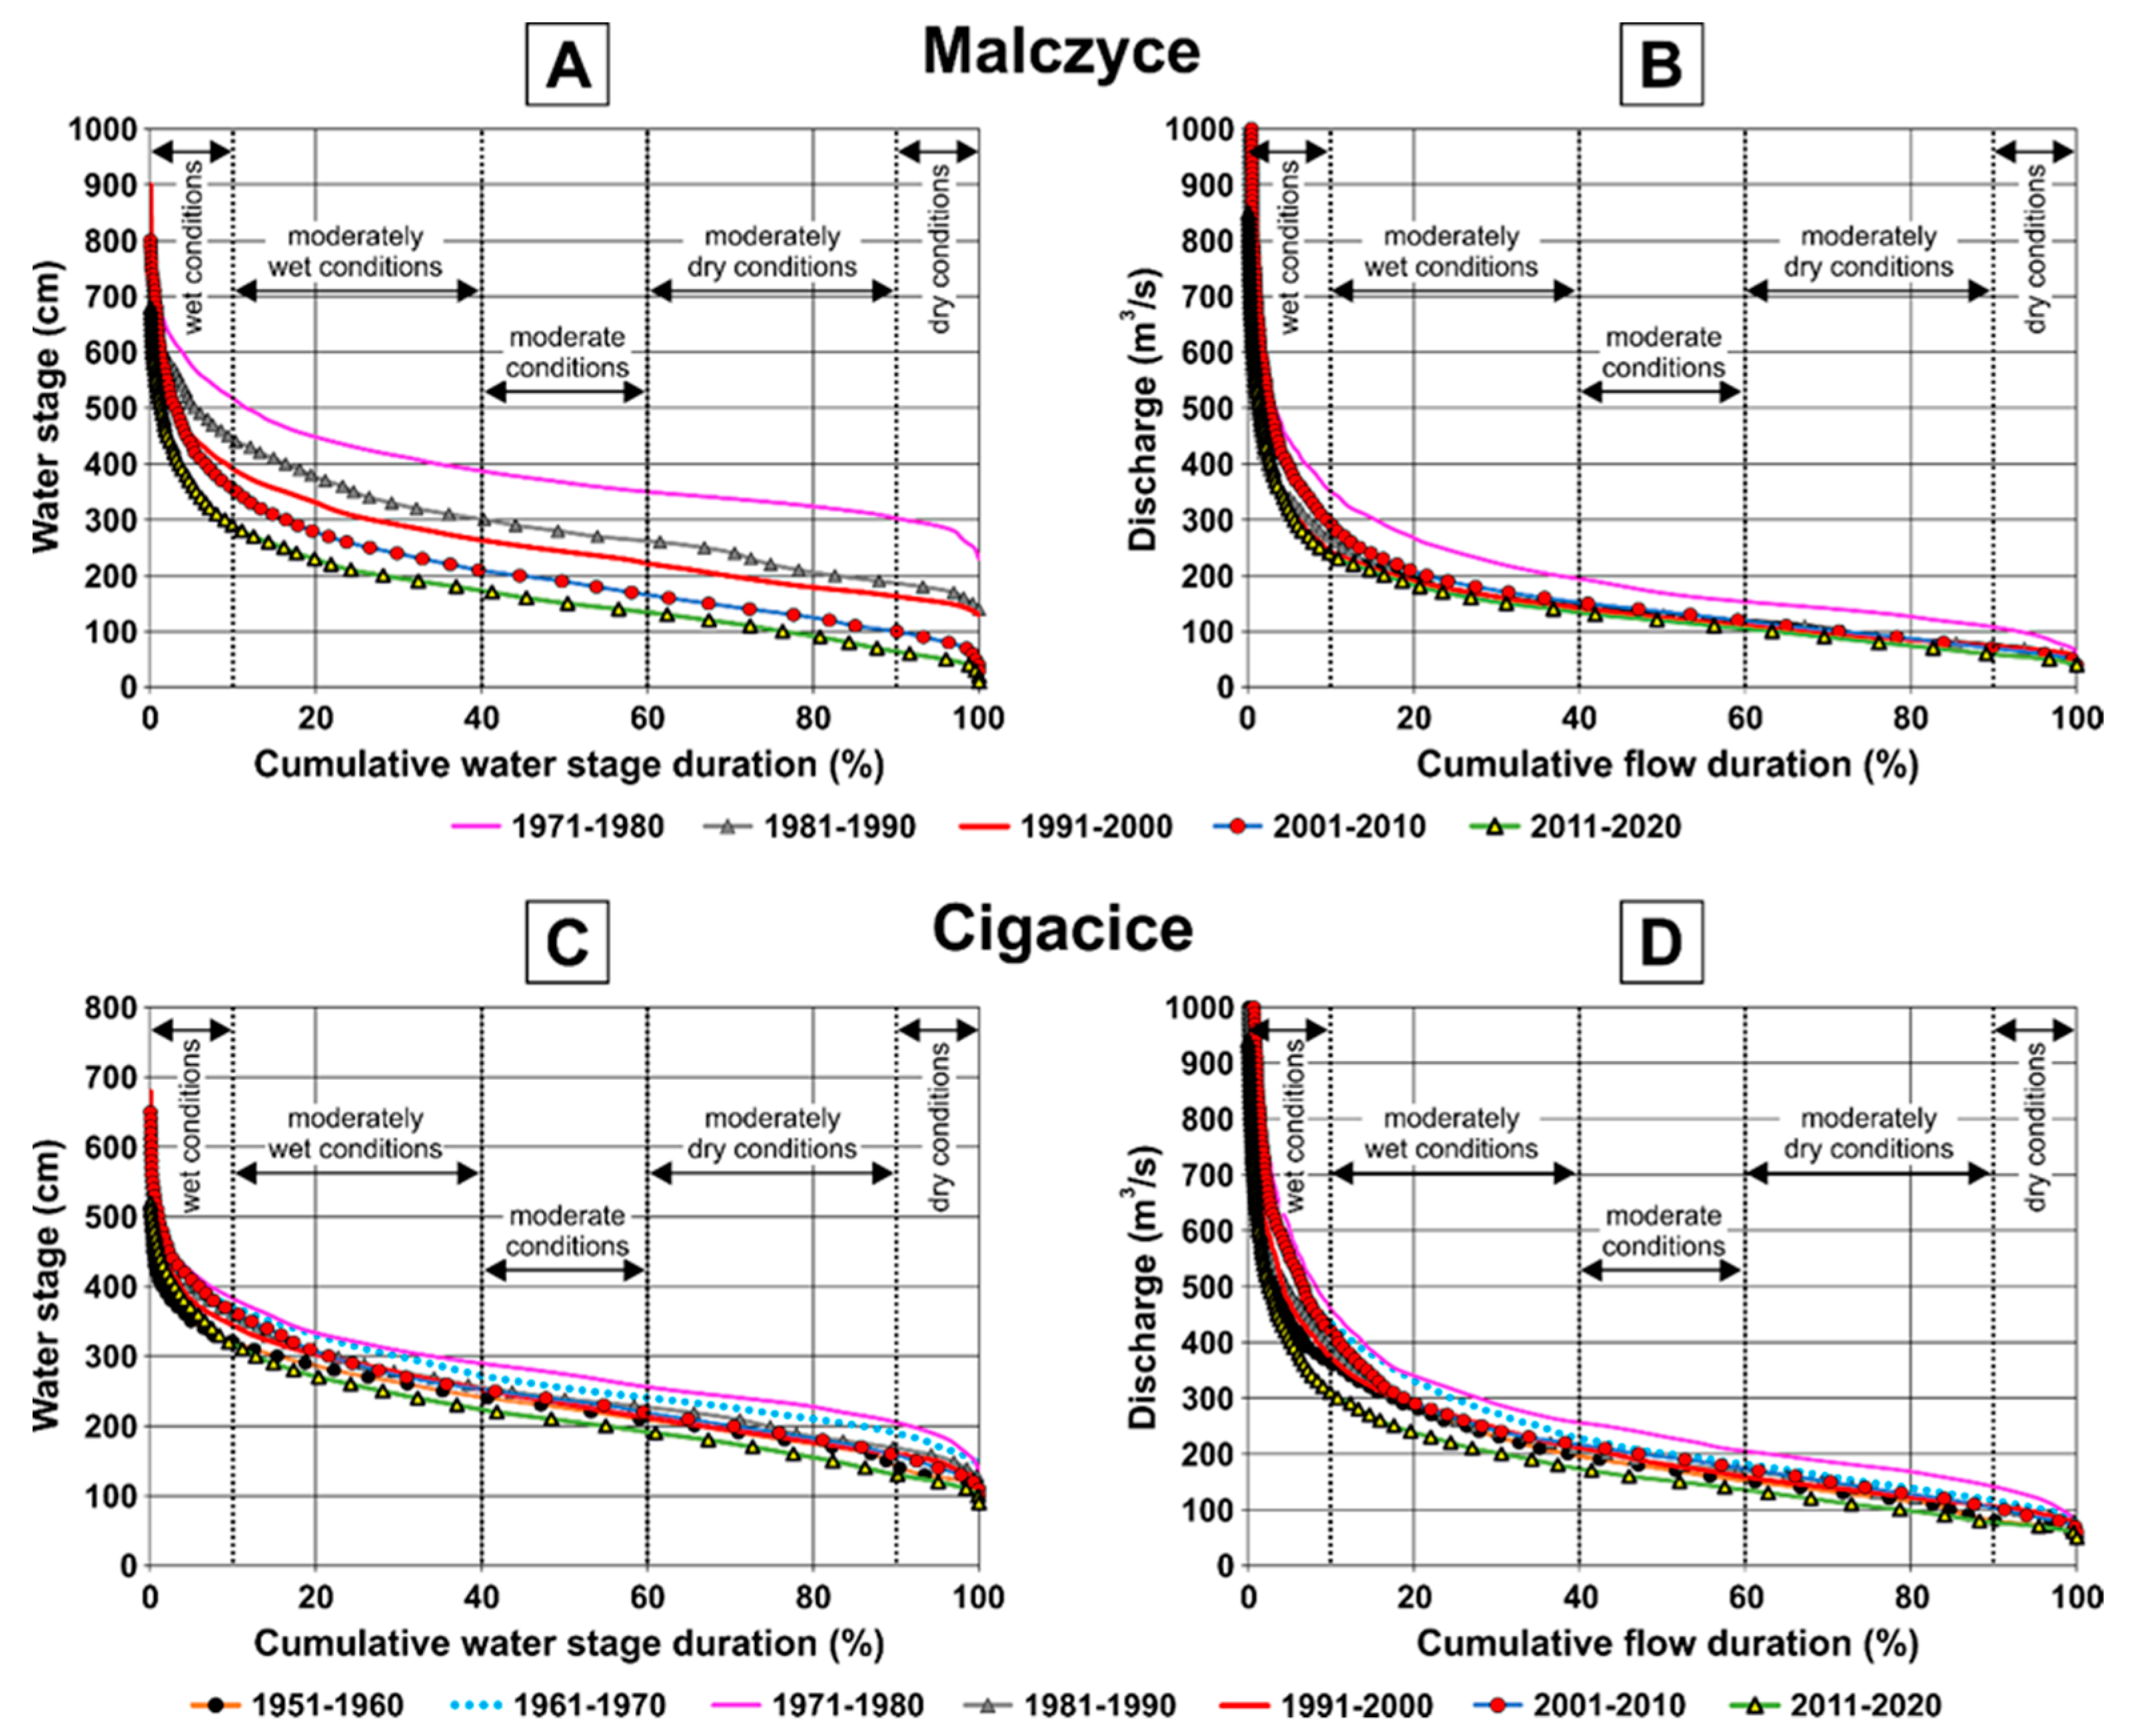
Hydrological observations in Section 3 are conducted at seven gauging stations: Brzeg Dolny, Malczyce, Ścinawa, Głogów, Nowa Sól, Cigacice, and Nietków (Figure 1). Similar to Section 1, the river morphology in Section 3 has been heavily influenced by channel regulation with groins, but here, morphological and hydrological conditions have also been influenced by the river impoundment by numerous barrages in Section 2. Immediately downstream of the series of shallow reservoirs of Section 2, their regulating impact on river flows is clearly visible: at Malczyce, the parts of DD curves representing dry, moderately dry, and moderate hydrological conditions during different decades are positioned close to each other, and the curves become clearly differentiated only for moderately wet and wet conditions (Figure 4B and Figure S3). The exception to this situation is the DD curve for the extremely wet 1970s, which indicates higher run-off over the entire time range (Figure 4B and Figure S3). Farther downstream of Section 3, DD curves for different decades become differentiated over the entire range of hydrological conditions, as the regulating effect of the shallow reservoirs from Section 2 diminishes with water inflow from tributaries and the curves are more influenced by differences in the amount and timing of run-off from the catchment between particular decades. This is illustrated by the DD curves for the Cigacice station from the downstream part of Section 3, which indicate relatively high run-off during the 1970s, a moderate one between the 1980s and 2000s, and a relatively low one during the 2010s (Figure 4D and Figure S3).
A remarkable decrease in WSD curves over the past few decades was observed at the gauging stations from the upper part of Section 3. It was most pronounced at Malczyce, where the WSD curve for the 2010s is positioned 2.2–2.5 m lower than that for the 1970s (Figure 4A and Figure S3). Although a small proportion of the decrease in water stages reflects lower river discharges after the exceptionally wet 1970s, most of it should be attributed to channel incision progressing below the regulated river section downstream from the last barrage. Farther downstream from Section 2, a decrease in WSD curves recorded over the past few decades progressively diminishes; at Cigacice, it attains a value of ~0.8 m (Figure 4C and Figure S3), a value that can be mostly, if not completely, explained by the concomitant decrease in DD curves (Figure 4D and Figure S3).
3.2. Precipitation Variability as a Driver of Hydrological Changes
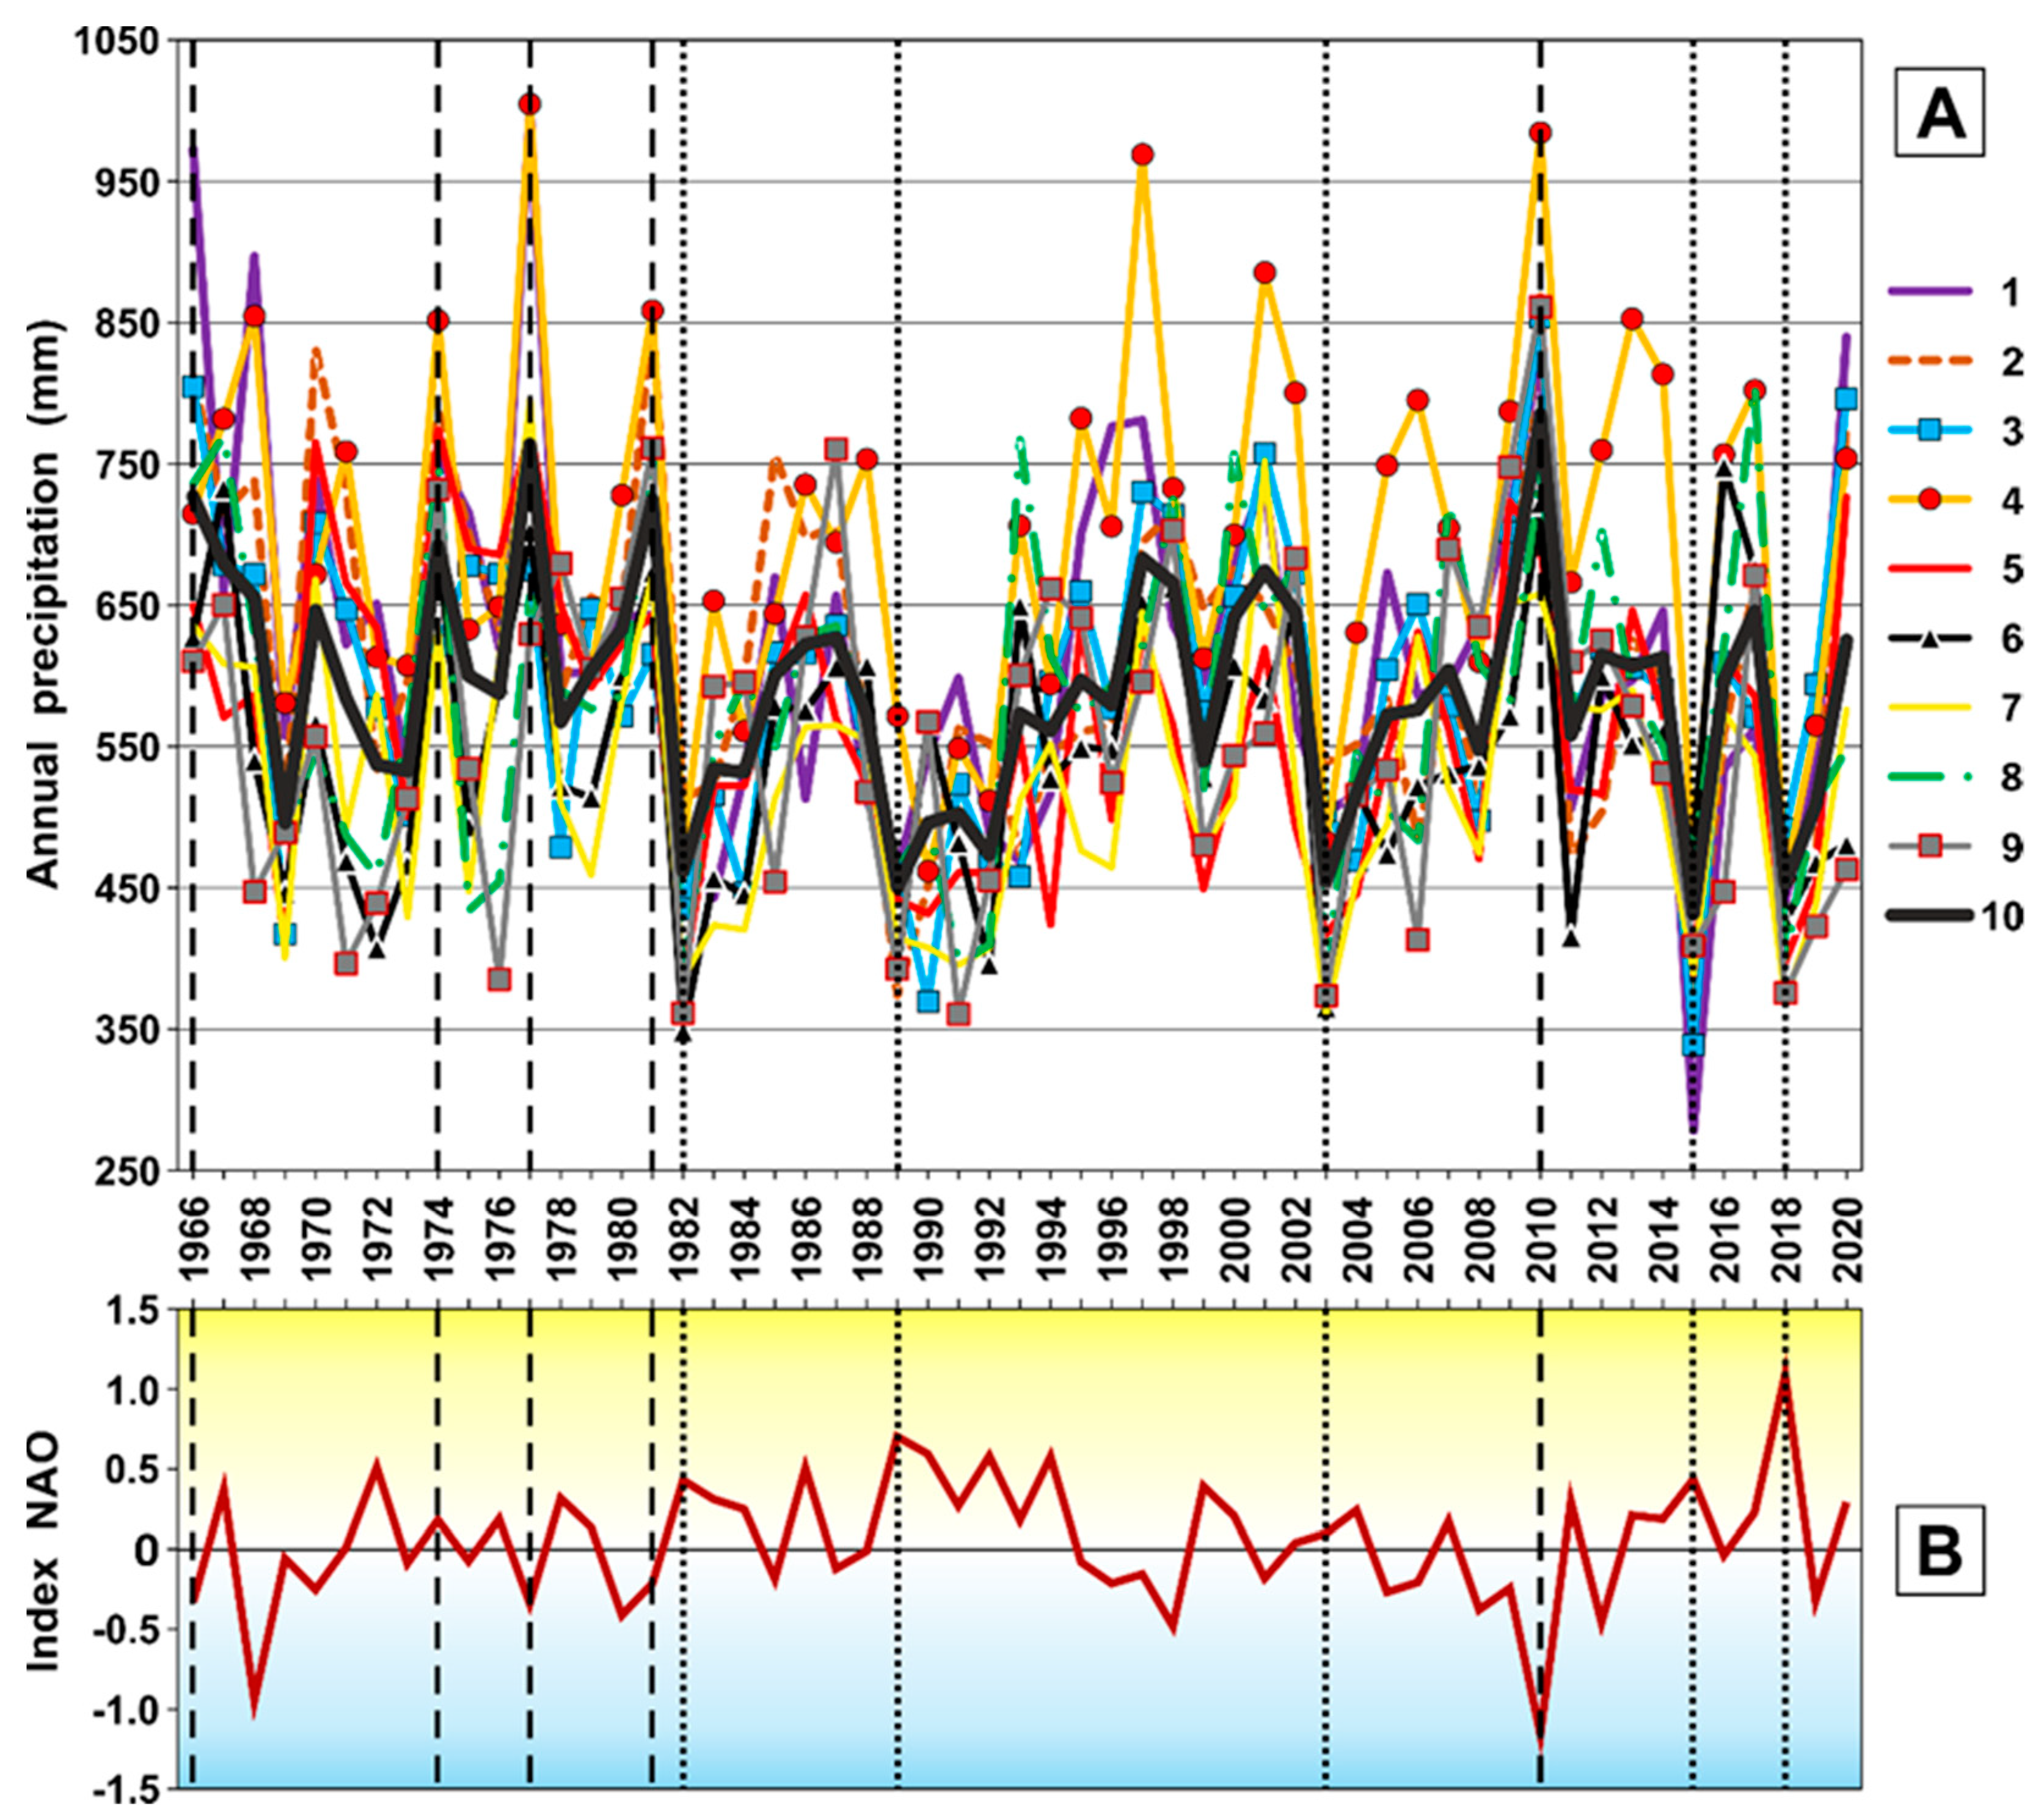
Changes in the run-off from the Odra River catchment revealed by DD curves for successive decades must have been driven by changes in precipitation, and thus, we analyzed the variation in annual precipitation totals recorded at nine precipitation-monitoring stations from the upper and middle parts of the catchment and in the average for these stations, further called catchment-average precipitation (Figure 5A). The analysis indicated the occurrence of a relatively wet period between 1974 and 1981, explaining the high run-off during the 1970s, and relatively dry periods between 1982 and 1992 and between 2011 and 2020, which were responsible for the low run-off during the 1980s and 2010s, respectively. During the wet period, 3 of the 5 years with the highest annual precipitation totals in the study period occurred (Figure 5) and a large flood—considered to be the largest flood in the region since 1903—took place in August 1977 [54]. In turn, each of the two dry periods included 2 of the 5 years with the lowest annual precipitation totals in the study period (Figure 5). The remaining parts of the study period either were typified by moderate values of annual precipitation, as in the years 1993–2002, or included the years with the lowest and highest annual precipitation totals, such as the period of 2003–2010 (Figure 5)—and both these situations explain the moderate river run-off recorded during the 1990s and 2000s.
Notably, no significant trend of changes in annual precipitation totals over the past 55 years was found for the catchment-average precipitation (p = 0.26) and seven of the nine analyzed stations (p-value between 0.06 and 0.94; Table 1). Weak decreasing trends in annual precipitation totals typified only two stations from the lowland parts of the catchment: the Racibórz station (R2 = 0.07, p = 0.04) located in Section 1 of the Odra River, close to the marginal zone of the Silesian Upland, and the Opole station (R2 = 0.12, p = 0.01) in the upper part of Section 2 (Table 1).
Annual precipitation totals in the Odra River catchment were inversely related to annual values of the NAO index. The strongest, highly significant relationship was found for catchment-average precipitation totals (R2 = 0.37, p = 0.000001; Figure 6). The relationship indicated that on average, years with positive annual values of the NAO index were typified by catchment-average annual precipitation below 596 mm and those with negative annual values of the index by precipitation above that value (Figure 6).
The relationships for all analyzed stations were also statistically significant, with the explained variation of annual precipitation totals at individual stations ranging from 13% to 37% (Table 2). Generally, precipitation totals at the stations located in mountain areas were more dependent on the variation in the NAO index (31% and 34% of the explained variance for the Kłodzko and Jelenia Góra stations, respectively) than those recorded at the stations from lowland areas (between 13% and 23% of the explained variance). However, the exception to this pattern was the lowland-located Racibórz station, where 37% of the variation in annual precipitation totals was explained by the variation in the NAO index (Table 2).
Large floods on the upper and middle Odra River are caused by a few day-long advective rainfalls related to cyclonic air circulation from the north, when the movement of the humid and cold air mass to the south results in the uplift of the humid and warm air mass and orogenic precipitation over the Sudety and Beskidy Mountains [48,55]. Some of these synoptic situations and the resultant floods—such as the flood of July 1997, the largest one in the 20th century—occurred in the years without a prominent negative value of the NAO index and were not associated with high annual precipitation totals in the entire catchment (Figure 5). Other large floods, such as those of 1977 and 2010, occurred in the years with a clear negative phase of the NAO, during which high annual precipitation totals were recorded in the entire catchment (Figure 5).
3.3. Channel Changes
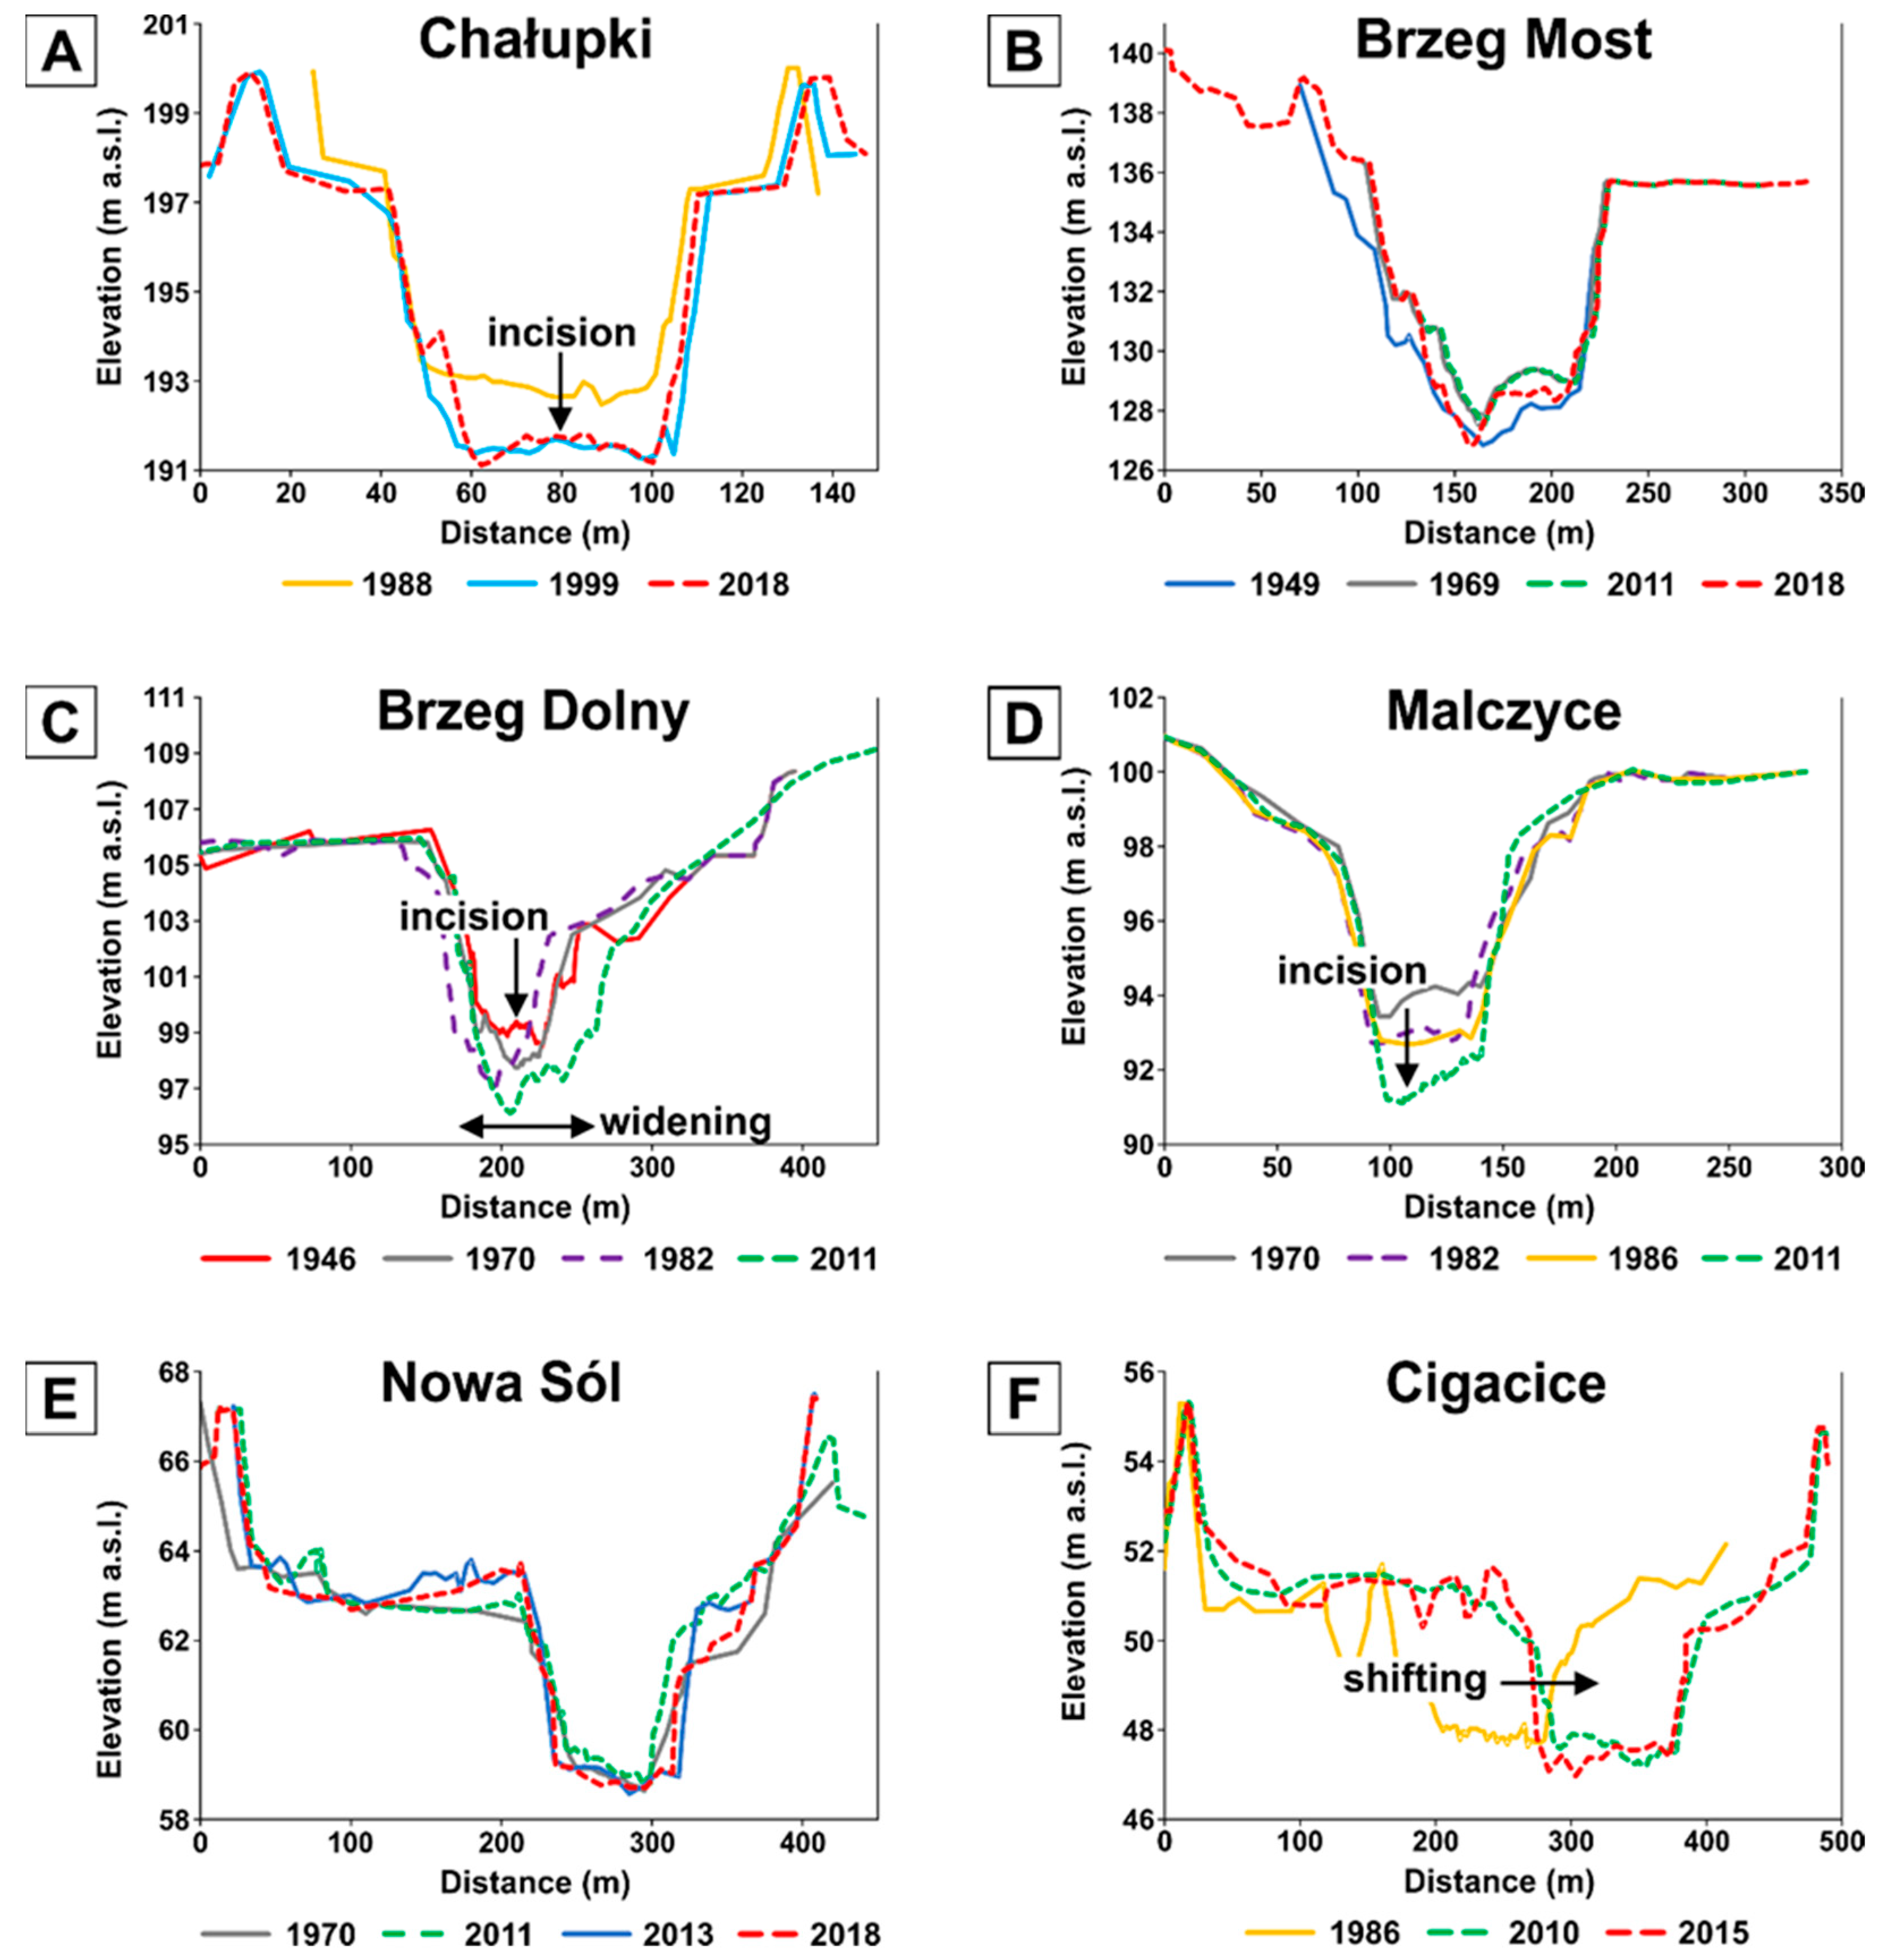
Shifts in WSD curves may reflect not only changes in the duration of river discharges over time but also changes in channel geometry, and thus, we analyzed changes in water-gauge cross sections from the studied sections of the Odra River. At Chałupki, the river incised by ~1.5 m between 1988 and 1999 and subsequently maintained its vertical position (Figure 7A). In the two other gauge cross sections from Section 1 of the river—Krzyżanowice and Racibórz-Miedonia—a vertical position of the riverbed has not changed markedly since the 1970s–1980s, but at Krzyżanowice, channel widening has altered a V-shaped channel to a U-shaped one, whereas at Racibórz-Miedonia, no change in channel shape has been observed.
In the channelized Section 2 of the Odra River, relatively closely spaced barrages (8.3 km on average) hamper considerable changes in the vertical position of the riverbed, whereas bank reinforcements and groins maintain lateral stability of the channel. As a result, no marked channel changes were recorded in this section over the past few decades. This can be illustrated with the gauge cross section at Brzeg Most, where the channel position in 2018 was nearly the same as in 1949, even though small bed aggradation occurred there in the years 1949–1969, followed by small bed degradation in the years 2011–2018 (Figure 7B).
In Section 3, channel adjustments recorded over the past few decades varied considerably along the river course. In the gauge cross section at Brzeg Dolny located immediately downstream from the end of Section 2, the river has incised by ~2 m since 1946 and the incision has been accompanied by channel widening (Figure 7C). Farther downstream, the river remained laterally stable, whereas its channel incised by a similar amount of ~2 m at Malczyce (Figure 7D) and by slightly more than 1 m at Ścinawa. However, no marked channel incision was observed in the lower part of the section. At the Nowa Sól gauge cross section, the vertical stability of the river was accompanied by its lateral stability (Figure 7E), whereas at Cigacice, erosion of the right bank resulted in channel migration within the inter-embankment zone (Figure 7F).
4. Discussion
It is worth noting that in Section 1 and Section 2, an important role in shaping the values of flows and water levels on the Odra River is played by water stages and water distribution systems located on the Odra River itself, as well as retention and flood control reservoirs located in the catchments of the river. It is particularly important to use the hydrotechnical infrastructure on the Odra River to provide hydrological conditions for maintaining inland navigation. The Odra River has the status of a navigable river in the section from Koźle to Malczyce (Section 2 and part of Section 3), and many cities have a system of artificial navigation channels and bypasses separating the water in the Odra River into a main channel and navigation channels—the latter most often associated with the location of industrial and energy plants. The largest water distribution system in the Odra River is located in Wrocław, which combines the functions of inland navigation (industrial and tourist) and flood protection and is called the Wrocław Waterway Junction. The intensive use of the river for transportation purposes in Upper Silesia, where the country’s key coal mining is located, has a long history, and although water transportation in the region is not currently the primary source of supply for the energy industry, the long-term damming of the Odra River and the removal of sediment by dredging the river have left visible consequences. Moreover, maintaining a constant level of the water damming in the shipping canals in Wrocław, as well as the artificial generation of a wave enabling the entry of vessels from the lower course of the river to Wrocław through the Brzeg Dolny barrage, requires targeted water management and maintenance of the watercourse both on the Odra River and on water reservoirs on the following rivers: Nysa Kłodzka, Mała Panew, and Bystrzyca. Hydrotechnical activities and periodic maintenance works (such as removal of vegetation from floodplains) and modernization works in the Odra River canals may be one of the reasons for disturbing the flow of river sediments and the natural morphological processes of the river.
This study used discharge duration (DD) and water-stage duration (WCD) curves to identify patterns of changes in river flows and water levels in the upper and middle Odra River since the mid-20th century and subsequently tried to explain the observed patterns through the analysis of precipitation variability and channel changes. The DD curves indicated temporal variation in decade-average water run-off from the river catchment, whereas the WSD curves revealed differences in the response of water stages to the variation in river flows and to changes in the morphology of gauge cross sections between the three river sections analyzed and among gauging stations within these sections.
In the upper Section 1, relatively high run-off was recorded in the 1970s and relatively low run-off during the 1950s, 1980s, and 2010s. Moreover, the 1960s were typified by relatively high flood discharges, whereas low and medium flows were close to the long-term average. In the middle Section 2, the operation of barrages distorts stage-discharge curves and thus no data about the duration of river discharges were available for this section. However, the regulation of low-to-medium flows by numerous barrages occurring in this section was apparent in the first gauging station from the lower Section 3, whereas farther downstream of that section, the regulating effect of the barrages diminished as a result of the inflow from tributaries, so that differences in the amount of run-off between particular decades were again pronounced.
In some studies, channel incision was recognized on the basis of a lowering of the minimum annual water stages at gauging stations [22,27,40]. In the range of low-to-medium discharges, duration curves for the gauging stations from Section 1 of the Odra River do not indicate marked changes between successive decades. In contrast, the WSD curves gradually lowered over the study period, and the lowering was particularly pronounced at the Chałupki gauging station (Figure 2 and Figure S1). Repeated surveys of the gauge cross sections confirmed rapid channel incision at Chałupki, where the riverbed degraded by up to 2 m between 1988 and 1999 (Figure 7A), whereas in the two downstream-located stations Krzyżanowice and Racibórz-Miedonia, channel incision during the past few decades was less intense but noticeable. These observations indicated that apart from the analysis of a multi-year course of minimum annual water stages, the analysis of DD and WSD curves may reveal changes in the vertical position of a channel bed (cf. [56]). In particular, the lowering of WSD curves associated with a lack of changes in the duration of river discharges over the analyzed period indicates channel incision [30]. Observations from Section 1 of the Odra River also revealed that rapid vertical adjustments of the river channel in this section were characteristic not only of the early phase of the river channelization in the 18th century, as indicated by [51], but could also be activated by renewed channelization works in recent decades.
The discontinuity of fluvial processes created by impoundments influences abiotic and biotic processes in the river [57]. River partitioning by transversal hydraulic structures stabilizes water levels and reduces flow velocity upstream from these structures, hence disturbing or interrupting sediment transport in the river [58]. In Section 2 of the Odra River, the WSD curves reflected the influence of barrages on flow conditions. This is illustrated by the curves for the Krapkowice and Trestno stations, with water stages being stable in a wide range of hydrological conditions (Figure 3 and Figure S2). Moreover, because the barrages formed local base levels, they stabilized the vertical position of the channel bed (Figure 7B).
In Section 3, patterns of hydrological and morphological changes varied along the river. In this section, the river conveys substantially larger discharges than in Section 1, and thus, differences in DD curves between the given decades were pronounced not only for flood discharges but also for low and medium ones (Figure 4B,D and Figure S3). However, while differences in DD curves increased down the section with increasing catchment area and river run-off, differences between WSD curves from different decades were considerably larger in the upper part of the section (Figure 4A and Figure S3) than in its lower part (Figure 4C and Figure S3). In the lower part of the section, the variation in WSD curves reflected differences in the amount of run-off between particular decades, whereas in its upper part, a progressive lowering of the curves caused by channel incision was superimposed on their hydrologically driven variation.
A single barrage and the associated shallow reservoir have little impact on long-term sediment flux in a river [59] because during floods, the barrage gates are opened and sediment can be almost freely transported through the structure. However, the series of 23 barrages from Section 2 of the Odra River must have almost completely arrested the delivery of bed material to the beginning of Section 3, and the resultant sediment starvation of the river has induced erosional adjustments of its channel in the upper part of the section (cf. [60]). At the Brzeg Dolny gauge cross section, immediately downstream from Section 2, about 2 m of channel incision has occurred since the mid-20th century and the lack or destruction of bank reinforcements has enabled bank erosion and channel widening (Figure 7C). However, farther down Section 3, regulation of the channel with groins protected the river banks from erosion, stabilizing the width and lateral position of the channel (Figure 7D,E) and preventing the delivery of bed material caliber sediments from retreating banks to the channel. Under such conditions, rivers tend to re-establish the equilibrium between their transport capacity and sediment load by mobilizing their bed material and degrading the bed, e.g., [36,60], which explains why a similar amount of channel incision as at Brzeg Dolny was also recorded at Malczyce, 20 km downstream from the beginning of Section 3. According to our knowledge, after careful study of maps downstream of Wrocław, the Odra River receives no major tributaries upstream of the water gauges at Malczyce and Ścinawa. Thus, it can be assumed that the trapping of sediment in Sector 2 and the lack of supplementation of new material are causing incision of the Odra River channel over a longer distance. The river bottom stabilizes only in Cigacice. Upstream of this water gauge, the Odra River receives two larger tributaries, the lowland Barycz River (catchment area of 5526 km²) and the mountainous Kaczawa River (catchment area of 2500 km²), which can provide tributary material for transport and stop the incision. The intensive agriculture of the Barycz River catchment may be responsible for the intensive delivery of material into its bed [61] and then into the bed of the Odra River. Unfortunately, in Poland, since the 1980s, there has been no continuous monitoring of the volume of sediment load in rivers, hence the uncertainty of inference. It is only possible to indicate potential sources of sediment supply without indicating specific data.
The delivery of bed material eroded in the uppermost part of the section and in tributaries may have helped to re-establish the dynamic equilibrium farther downstream, and consequently, channel incision decreased in the downstream direction, playing no role in the lower part of the Section 3. In this part of the section, different evolutionary tendencies of the river were observed between its prevailing stretches with untouched channelization structures and maintained lateral and vertical channel stability (Figure 7E) and stretch where the destruction of channelization structures by the river enabled rapid migration of its channel (Figure 7F).
DD curves for consecutive decades did not indicate a systematic change in the amount of run-off from the upper and middle Odra River catchment, as the highest run-off was recorded in the 1970s, while lower run-off typified both earlier and later decades. The ongoing climate changes tend to decrease precipitation totals in southern Europe and increase them in northern Europe [62]. However, the catchment of the upper and middle Odra River is situated between these parts of Europe, with the opposite trends of changes in precipitation totals, and thus, it likely has not been subject to any significant change in precipitation totals in the long term. This supposition was confirmed by the lack of a significant trend of changes in annual precipitation totals found for catchment-average precipitation and for most of the analyzed precipitation-monitoring stations from the catchment, with only two stations from its lowland part having been typified by a weak decreasing trend of precipitation totals.
Despite the general lack of a systematic change in annual precipitation totals over the study period, they varied markedly during the period, with a greater scale of the variation typifying stations from the mountain parts of the Odra River catchment than those from its lowland parts (Figure 5A). Catchment-average annual precipitation totals and precipitation totals at all analyzed stations were inversely related to the annual values of the NAO index, indicating that the catchment of the upper and middle Odra River receives high amounts of precipitation in the years with negative values of the index and low precipitation totals in the years with positive index values. The analysis presented in this study focused on precipitation totals, but mean annual discharges and annual precipitation totals must vary in the same direction, with higher river run-off typifying the years with high precipitation totals and lower run-off occurring in the years with lower precipitation totals. Our findings thus confirm the results of [43] that rivers from the upper and middle Odra River catchment convey above-average run-off in the years with a negative NAO phase and below-average run-off in the years with a positive NAO phase. They also agree with the finding of [62,63] that the mean annual discharges of rivers in the Polish Carpathians, about 100–250 km to the east from the upper Odra River catchment, are inversely correlated with annual values of the NAO index.
During positive phases of the North Atlantic Oscillation—when differences in air pressure between a low-pressure area near Iceland and a high-pressure area near Azores Islands are stronger than average—southern Europe experiences decreased storminess, while northern Europe is typified by increased storminess. The opposite pattern of storminess in Europe typifies negative NAO phases, with weaker-than-average differences in air pressure over the North Atlantic [63,64,65]. Notably, precipitation totals recorded at the stations from the mountain parts of the Odra River catchment exhibited a stronger dependence on the NAO index than those at the stations from its lowland parts. High amounts of precipitation in southern Poland fall when cyclones move from the Mediterranean region to central Europe, inducing northern atmospheric circulation and orogenic precipitation in the Sudety or the Carpathian Mountains [65,66,67]. As such, cyclones originate in southern Europe, and their formation is promoted by the regional pattern of air pressure conditions typical of negative NAO phases. Precipitation induced by these cyclones can greatly increase annual precipitation totals in southern Poland, particularly in the mountains.
Previous research has indicated that the territorial influence of the NAO pattern on river hydrology is wider if river headwaters are influenced by the NAO [67,68]. It is so because river flows generated in headwater parts of catchments are transferred downstream, indirectly affecting hydrological conditions in the downstream section. We found that in the upper and middle Odra River catchment, catchment-average precipitation totals were similarly strongly related to the NAO index as precipitation totals in the mountain parts of the catchment, despite a lower strength of the relationship typifying stations from its lowland parts (Table 2). In contrast to river flows, precipitation is not transferred from one part of a catchment to another, and thus, the explanation of the mentioned pattern must be different—because precipitation totals in the mountain parts of the Odra River catchment are substantially higher than in its lowland parts (Figure 5A), and they have a greater influence on the variation in catchment-average precipitation totals and their relationship with the NAO index than precipitation totals from the lowland parts.
Studies [69,70,71] have indicated that the current NHMS monitoring in Poland for the upper and middle Odra River basin may underestimate the snow cover by up to 30%. Certainly, NHMS monitoring in terms of water content in the snow cover and the transport of river sediments from mountain catchments to the Odra River should be supplemented in the future to enable a full picture of the impact of tributary catchments in shaping the morphology of the Odra riverbed. The role of floods caused by melting snow seems to be diminishing. The alarming increase in air temperature in the past 20 years has caused the snow cover in the Sudetes and, in particular, in the Karkonosze Mountains, where the mountain tributaries of the Odra River have their sources, to be shorter, and its thickness has tended to decrease, as indicated by [69,70,71]. In addition, observations of the lowland Odra River tributaries, e.g., Barycz River, suggest that the snowmelt in autumn and spring will almost vanish by the end of the 21st century [61].
5. Conclusions
The analysis of water-stage duration and discharge duration curves for water-gauge stations on the upper and middle Odra River indicated distinct evolutionary tendencies of channel morphology that typified three studied sections of the river over the past few decades. In the upper Section 1, channel incision was inferred from a progressive decrease in WSD curves associated with a lack of a systematic change in DD curves over successive decades, and such a channel change, most pronounced at the Chałupki station, was confirmed by the analysis of repeated surveys of the gauge cross sections from this river section. In the middle Section 2, WSD curves had a flattened shape, with similar stages maintained over a wide range of hydrological conditions as a result of the operation of barrages. In this section, barrages and bank reinforcements stabilized the vertical and lateral positions of the river channel. Finally, the analysis of WSD curves and repeated surveys of gauge cross sections indicated diverse evolutionary tendencies of the channel morphology in Section 3, with rapid channel incision in its upper part and vertical stability of the riverbed in the lower part.
DD curves for successive decades and annual precipitation totals in the upper and middle Odra River catchment did not indicate a systematic change in the amount of run-off over the study period, but the temporal variation of annual precipitation totals explained differences in the DD curves between individual decades. Annual precipitation totals in each analyzed station from the Odra River catchment and catchment-average precipitation totals were inversely related to annual values of the NAO index, but the influence of the North Atlantic Oscillation on precipitation totals was more pronounced in the mountain parts of the catchment.
The study confirmed the usefulness of DD and WSD curves in recognizing changes in river run-off and the vertical position of the channel bed. While changes in the DD curves for the gauging station on the Odra River reflected climatically driven variability in precipitation totals, the nature of changes in the WSD curves was more complex, largely reflecting distinct human impacts on the river morphology in the three river sections analyzed. WSD and DD curves provide information about the vertical changes of the riverbed only in the profile, similarly to the survey of the cross section of the riverbed at the gauging station, while between the two stations, it is only an assumption. Only additional surveys of the riverbed and continuous monitoring can provide information about how the riverbed is changing. It is also important to remember that the data for the WSD and DD calculations must come from a gauging station operating at the same location; once it is moved, there is no possibility to compare new data with previous years.
Supplementary Materials
The following supporting information can be downloaded at: https://www.mdpi.com/article/10.3390/w15020370/s1.
Author Contributions
Conceptualization, Á.N., A.C. and B.W.; methodology, Á.N. and M.Z.; software, Á.N. and A.C.; validation, Á.N., A.C. and B.W.; formal analysis, Á.N., A.C. and B.W.; investigation, Á.N., A.C. and B.W.; resources, M.W.; data curation, Á.N., A.C., M.W. and B.W.; writing—original draft preparation, Á.N., A.C. and B.W.; visualization, Á.N., A.C. and B.W. All authors have read and agreed to the published version of the manuscript.
Funding
This research received no external funding.
Conflicts of Interest
The authors declare no conflict of interest.
References
- Williams, M.; Zalasiewicz, J.; Davies, N.; Mazzini, I.; Goiran, J.P.; Kane, S. Humans as the third evolutionary stage of biosphere engineering of rivers. Anthropocene 2014, 7, 57–63. [Google Scholar] [CrossRef] [Green Version]
- Macklin, M.G.; Lewin, J. The rivers of civilization. Quat. Sci. Rev. 2015, 114, 228–244. [Google Scholar] [CrossRef]
- Downs, P.W.; Piégay, H. Catchment-scale cumulative impact of human activities on river channels in the late Anthropocene: Implications, limitations, prospect. Geomorphology 2019, 338, 88–104. [Google Scholar] [CrossRef]
- Kiss, T.; Fiala, K.; Sipos, G.; Szatmári, G. Long-term hydrological changes after various river regulation measures: Are we responsible for flow extremes? Hydrol. Res. 2019, 50, 417–430. [Google Scholar] [CrossRef] [Green Version]
- Searcy, J.K. Flow-duration curves. Manual of hydrology: Part 2, Low-flow techniques. U. S. Geol. Surv. Water Supply Paper 1959, 1542-A, 1–38. [Google Scholar]
- Booker, D.J.; Snelder, T.H. Comparing methods for estimating flow duration curves at ungauged sites. J. Hydrol. 2012, 434–435, 78–94. [Google Scholar] [CrossRef]
- Jurasz, J.; Dąbek, P.B.; Kaźmierczak, B.; Kies, A.; Wdowikowski, M. Large scale complementary solar and wind energy sources coupled with pumped-storage hydroelectricity for Lower Silesia (Poland). Energy 2018, 161, 183–192. [Google Scholar] [CrossRef]
- Mendicino, G.; Senatore, A. Evaluation of parametric and statistical approaches for the regionalization of flow duration curves in intermittent regimes. J. Hydrol. 2013, 480, 19–32. [Google Scholar] [CrossRef]
- Hope, A.; Bart, R. Evaluation of a regionalization approach for daily flow duration curves in central and southern California watersheds. J. Am. Water Resour. Ass. 2012, 48, 123–133. [Google Scholar] [CrossRef]
- Longobardi, A.; Villani, P. A statistical, parsimonious, empirical framework for regional flow duration curve shape prediction in high permeability Mediterranean region. J. Hydrol. 2013, 507, 174–185. [Google Scholar] [CrossRef]
- Banasiak, R.; Krzyżanowski, M.; Gierczak, J.; Wdowikowski, M. Bathymetric Changes, Roughness and Conveyance of a Compound, Regulated by Groynes River Channel during low and High Water Conditions. In River Flow 2014, 1st ed.; Shleiss, A.J., de Cesare, G., Franca, M.J., Pfister, M., Eds.; Taylor and Francis: London, UK, 2014; pp. 369–374. [Google Scholar]
- Banasiak, R.; Krzyżanowski, M. Flood flows in the Odra River in 2010—Quantitative and qualitative assessment of ADCP data. Meteorol. Hydrol. Water Manag. 2015, 3, 11–20. [Google Scholar] [CrossRef]
- Schoor, M.M.; Wolfert, H.R.; Maas, G.J.; Middelkoop, H.; Lambeek, J.J.E. Potential for floodplain rehabilitation based on historical maps and present-day processes along the River Rhine, The Netherlands. Geol. Soc. (London) Spec. Publ. 1999, 163, 123–137. [Google Scholar] [CrossRef]
- Castellarin, A.; Galeati, G.; Brandimarte, L.; Montanari, A.; Brath, A. Regional flow-duration curves: Reliability for ungauged basins. Adv. Water Resour. 2004, 27, 953–965. [Google Scholar] [CrossRef]
- Vogel, R.M.; Fennessey, N.M. Flow-duration curves. I: New interpretation and confidence intervals. J. Water Res. Plan. Man. 1994, 120, 485–504. [Google Scholar] [CrossRef]
- Florsheim, J.L.; Chin, A.; Gaffney, K.; Slota, D. Thresholds of stability in incised “Anthropocene” landscapes. Anthropocene 2013, 2, 27–41. [Google Scholar] [CrossRef]
- Darby, S.E.; Simon, A. Incised River Channels: Processes, Forms, Engineering and Management; Wiley: Chichester, UK, 1999; 452p. [Google Scholar]
- Kondolf, G.M.; Piégay, H.; Landon, N. Channel response to increased and decreased bedload supply from land use change: Contrasts between two catchments. Geomorphology 2002, 45, 35–51. [Google Scholar] [CrossRef] [Green Version]
- Wohl, E. Disconnected Rivers: Linking Rivers to Landscapes; Yale Univ. Press: New Haven, CT, USA, 2004; 320p. [Google Scholar]
- Simon, A.; Rinaldi, M. Disturbance, stream incision, and channel evolution: The roles of excess transport capacity and boundary materials in controlling channel response. Geomorphology 2006, 79, 361–383. [Google Scholar] [CrossRef]
- Rinaldi, M.; Wyżga, B.; Dufour, S.; Bertoldi, W.; Gurnell, A. River processes and implications for fluvial ecogeomorphology: A European perspective. In Treatise on Geomorphology; Shroder, J., Butler, D., Hupp, C.R., Eds.; Academic Press: San Diego, CA, USA, 2013; Volume 12, pp. 37–52. [Google Scholar]
- Wyżga, B.; Zawiejska, J.; Radecki-Pawlik, A. Impact of channel incision on the hydraulics of flood flows: Examples from Polish Carpathian rivers. Geomorphology 2016, 272, 10–20. [Google Scholar] [CrossRef]
- Bull, W.B.; Scott, K.M. Impact of mining gravel from urban stream beds in the southwestern United States. Geology 1974, 2, 171–174. [Google Scholar] [CrossRef]
- Peiry, J.L. Channel degradation in the middle Arve River, France. Regul. Rivers Res. Manag. 1987, 1, 183–188. [Google Scholar] [CrossRef]
- Collins, B.; Dunne, T. Gravel transport, gravel harvesting and channel-bed degradation in rivers draining the southern Olympic Mountains, Washington, USA. Environ. Geol. Water Sci. 1989, 13, 213–224. [Google Scholar] [CrossRef]
- Sear, D.A.; Archer, D. Effects of Gravel Extraction on Stability of Gravel-Bed Rivers: The Wooler Water, Northumberland, UK. In Gravel-Bed Rivers in the Environment; Klingeman, P.C., Beschta, R.L., Komar, P.D., Bradley, J.B., Eds.; Water Resources Publication: Highlands Ranch, CO, USA, 1998; pp. 415–432. [Google Scholar]
- Rinaldi, M.; Wyżga, B.; Surian, N. Sediment mining in alluvial channels: Physical effects and management perspectives. River Res. Appl. 2005, 21, 805–828. [Google Scholar] [CrossRef] [Green Version]
- Williams, G.P.; Wolman, M.G. Downstream effects of dams on alluvial rivers. U.S. Geol. Surv. Prof. Paper 1984, 1286, 1–83. [Google Scholar]
- Germanovski, D.; Ritter, D.F. Tributary response to local base level lowering below a dam. Regul. Rivers Res. Manag. 1988, 2, 11–24. [Google Scholar] [CrossRef]
- Kiss, T.; Andrási, G.; Hernesz, P. Morphological alteration of the Dráva as the result of human impact. Acta Geogr. Debrecina, Lands. Environ. 2011, 5, 58–75. [Google Scholar]
- Keesstra, S.D.; van Huissteden, J.; Vanderberghe, J.; Van Dam, O.; de Gier, J.; Pleizer, I.D. Evolution of the morphology of the river Dragonja (SW Slovenia) due to land-use changes. Geomorphology 2005, 69, 191–207. [Google Scholar] [CrossRef]
- Emerson, J.W. Channelization: A case study. Science 1971, 173, 325–326. [Google Scholar] [CrossRef]
- Brookes, A. River channel adjustment downstream from channelization works in England and Wales. Earth Surf. Process. Landf. 1987, 12, 337–351. [Google Scholar] [CrossRef]
- Simon, A. A model of channel response in disturbed alluvial channels. Earth Surf. Process. Landf. 1989, 14, 11–26. [Google Scholar] [CrossRef]
- Wyżga, B. Impact of the channelization-induced incision of the Skawa and Wisłoka Rivers, southern Poland, on the conditions of overbank deposition. Regul. Rivers Res. Manag. 2001, 17, 85–100. [Google Scholar] [CrossRef]
- Wyżga, B. A geomorphologist’s criticism of the engineering approach to channelization of gravel-bed rivers: Case study of the Raba River, Polish Carpathians. Environ. Manag. 2001, 28, 341–358. [Google Scholar] [CrossRef]
- Liébault, F.; Piégay, H. Assessment of channel changes due to long-term bedload supply decrease, Roubion River, France. Geomorphology 2001, 36, 167–186. [Google Scholar] [CrossRef]
- Galay, V.J. Causes of river bed degradation. Water Resour. Res. 1983, 19, 1057–1090. [Google Scholar] [CrossRef]
- Wyżga, B. A review on channel incision in the Polish Carpathian rivers during the 20th century. In Gravel-Bed Rivers VI: From Process Understanding to River Restoration; Habersack, H., Piégay, H., Rinaldi, M., Eds.; Elsevier: Amsterdam, The Netherlands, 2008; pp. 525–556. [Google Scholar]
- Wyżga, B. Present-day downcutting of the Raba River channel (Western Carpathians, Poland) and its environmental effects. Catena 1991, 18, 551–566. [Google Scholar] [CrossRef]
- Dente, E.; Lensky, N.G.; Morin, E.; Dunne, T.; Enzel, Y. Sinuosity evolution along an incising channel: New insights from the Jordan River response to the Dead Sea level fall. Earth Surf. Process. Landf. 2019, 44, 781–795. [Google Scholar] [CrossRef]
- Dente, E.; Lensky, N.G.; Morin, E.; Enzel, Y. From straight to incised meandering channels: Slope impact on sinuosity of confined streams. Earth Surf. Process. Landf. 2021, 46, 1041–1054. [Google Scholar] [CrossRef]
- Wrzesiński, D. Wpływ Oscylacji Północnoatlatyckiej na Zmiany Odpływu Rzek w Polsce w Latach 1951–2000 (Impact of the North Atlantic Oscillation on Changes in the River Runoff in Poland over the Years 1951–2000). In Odpływ Rzeczny i Jego Regionalne Uwarunkowania; Wrzesiński, D., Ed.; Bogucki Wyd. Nauk.: Poznań, Poland, 2010; pp. 153–167. [Google Scholar]
- Wrzesiński, D. Flow Regime Patterns and Their Changes. In Management of Water Resources in Poland; Zeleňáková, M., Kubiak-Wójcicka, K., Negm, A.M., Eds.; Springer: Cham, Switzerland, 2021; pp. 163–180. [Google Scholar]
- Born, A. Regulacja Odry i Rozbudowa Urządzeń Technicznych. In Monografia Odry; Instytut Zachodni: Poznań, Poland, 1948. [Google Scholar]
- Dubicki, A. Tendencje zmian intensywnosci opadow w dorzeczu Odry. Zeszyty Naukowe Akademii Rolniczej we Wrocławiu. Inżynieria Środowiska 1993, 4, 23–34. [Google Scholar]
- Szulczewski, W.; Jakubowski, W.; Tokarczyk, T. An analysis of the hydrological regime as a factor influencing on the distributions of maximum annual flows. In ITM Web of Conferences; EDP Sciences: Ulysses, Frence, 2018; Volume 23, p. 00034. [Google Scholar]
- Dubicki, A.; Malinowska-Małek, J.; Strońska, K. Flood hazards in the upper and middle Odra River basin—A short review over the last century. Limnologica 2005, 35, 123–131. [Google Scholar] [CrossRef] [Green Version]
- Mielcarek, A. Z historii żeglugi odrzańskiej w latach osiemdziesiątych XIX wieku. Zeszyty Naukowe. Problemy Transportu i Logistyki 2003, 2, 225–236. [Google Scholar]
- Kundzewicz, Z.W.; Szamalek, K.; Kowalczak, P. The great flood of 1997 in Poland. Hydrol. Sci. J. 1999, 44, 855–870. [Google Scholar] [CrossRef]
- Czajka, A.; Ciszewski, D. Deposition of overbank sediments within a regulated reach of the upper Odra River, Poland. IAHS-AISH Publ. 2010, 337, 137–142. [Google Scholar]
- Nieznański, P.; Wyżga, B.; Obrdlik, P. Korytarz swobodnej migracji rzeki–koncepcja i jej wdrażanie w czesko-polskim, granicznym odcinku Odry. In Stan Środowiska Rzek Południowej Polski i Możliwości jego Poprawy–Wybrane Aspekty; Wyżga, B., Ed.; Instytut Ochrony Przyrody PAN: Kraków, Poland, 2008; pp. 135–144. [Google Scholar]
- Monthly Mean North Atlantic Oscillation Index Since January 1950. Available online: https://www.cpc.ncep.noaa.gov/products/precip/CWlink/pna/nao.shtml (accessed on 15 September 2021).
- Szczepański, A. “Powódź stulecia” w Legnicy w 1977 roku (The flood of century in Legnica in 1977). Zesz. Nauk PWSZ w Legnicy 2018, 27, 29–44, (In Polish, with English summary). [Google Scholar]
- Kundzewicz, Z.W.; Dobrowolski, A.; Lorenc, H.; Niedźwiedź, T.; Pińskwar, I.; Kowalczak, P. Floods in Poland. In Changes in Flood Risk in Europe; Kundzewicz, Z.W., Ed.; Taylor and Francis: London, UK, 2012; pp. 319–334. [Google Scholar]
- Nádudvari, Á.; Czajka, A. Statistical calculations of the Tisza River channel changes along Vezseny and Martfű (Hungary) from 1873–2010. Carpath. J. Earth Environ. Sci. 2014, 9, 57–70. [Google Scholar]
- Ellis, L.E.; Jones, N.E. Longitudinal trends in regulated rivers: A review and synthesis within the context of the serial discontinuity concept. Environ. Rev. 2013, 21, 136–148. [Google Scholar] [CrossRef]
- Gurnell, A.M. Adjustments in river channel geometry associated with hydraulic discontinuities across the fluvial–tidal transition of a regulated river. Earth Surf. Process. Landf. 1997, 22, 967–985. [Google Scholar] [CrossRef]
- Magilligan, F.J.; Roberts, M.O.; Marti, M.; Renshaw, C.E. The impact of run-of-river dams on sediment longitudinal connectivity and downstream channel equilibrium. Geomorphology 2021, 376, 107568. [Google Scholar] [CrossRef]
- Kondolf, G.M. Hungry water: Effects of dams and gravel mining on river channels. Environ. Manag. 1997, 21, 533–551. [Google Scholar] [CrossRef]
- Marcinkowski, P.; Piniewski, M.; Kardel, I.; Szcześniak, M.; Benestad, R.; Srinivasan, R.; Ignar, S.; Okruszko, T. Effect of climate change on hydrology, sediment and nutrient losses in two lowland catchments in Poland. Water 2017, 9, 156. [Google Scholar] [CrossRef]
- European Commission. Climate Change and the European Water Dimension. In EU Report No. 21553; European Commission—Joint Research Centre: Ispra, Italy, 2005. [Google Scholar]
- Pociask-Karteczka, J.; Limanówka, D.; Nieckarz, Z. Wpływ oscylacji północnoatlantyckiej na przepływy rzek karpackich 1951–2000 (The North Atlantic Oscillation impact on hydrologcal regime in Polish Carpathians 1951–2000). Folia Geogr. Ser. Geogr. Phys. 2003, 33, 89–104, (In Polish, with English Summary). [Google Scholar]
- Hurrell, J.W. Decadal trends in the North Atlantic Oscillation: Regional temperatures and precipitation. Science 1995, 269, 676–679. [Google Scholar] [CrossRef] [Green Version]
- Hurrell, J.W.; van Loon, H. Decadal variations in climate associated with the North Atlantic Oscillation. Clim. Chang. 1997, 36, 301–326. [Google Scholar] [CrossRef]
- Niedźwiedź, T. Characteristics in southern Poland during the severe flooding event of July 1997. Stud. Geomorph. Carpath. Balc. 1999, 33, 5–25. [Google Scholar]
- Stoffel, M.; Wyżga, B.; Niedźwiedź, T.; Ruiz-Villanueva, V.; Ballesteros-Cánovas, J.A.; Kundzewicz, Z.W. Floods in mountain basins. In Flood Risk in the Upper Vistula Basin; Kundzewicz, Z.W., Stoffel, M., Niedźwiedź, T., Wyżga, B., Eds.; Springer: Cham, Switzerland, 2016; pp. 23–37. [Google Scholar]
- Pociask-Karteczka, J. River hydrology and the North Atlantic Oscillation–A general review. Ambio 2006, 35, 312–314. [Google Scholar] [CrossRef] [PubMed]
- Urban, G.; Richterová, D.; Kliegrová, S.; Zusková, I.; Pawliczek, P. Winter severity and snowiness and their multiannual variability in the Karkonosze Mountains and Jizera Mountains. Theor. Appl. Climatol. 2018, 134, 221–240. [Google Scholar] [CrossRef] [Green Version]
- Urban, G.; Richterová, D.; Kliegrová, S.; Zusková, I. Durability of snow cover and its long-term variability in the Western Sudetes Mountains. Theor. Appl. Climatol. 2019, 137, 2681–2695. [Google Scholar] [CrossRef]
- Wdowikowski, M.; Szumiejko, F.; Krakowski, K.; Kózka, K. Wykorzystanie Patrolowych Pomiarów Pokrywy Śnieżnej Jako Element Wsparcia Oceny Określenia Zasobów Wodnych Śniegu w Obszarze Środkowej Odry—Badania Pilotażowe (The Use of Patrol Measurements of Snow Cover as an Element of Support for the Assessment of Snow Water Resources in the Area of the Middle Odra River–Pilot Studies). In JIZERKA 2022; Lipina, P., Procházka, J., Eds.; Český Hydrometeorologický Ústav: Prague, Czech Republic, 2022; pp. 134–137. (In Polish) [Google Scholar]
Figure 1.
Location of Poland (A), the study sections of the upper and middle Odra River in south-western Poland, water-gauge sections and analyzed gauge cross sections in these river sections (C) and location of analyzed precipitation stations within the catchment of the upper and middle Odra River (B).

Figure 2.
Water-stage (A,C,E) and discharge (B,D,F) duration curves for water-gauge stations from Section 1 of the Odra River. Note that the DD curves do not comprise the highest discharges (maximum discharges recorded at the Chałupki, Krzyżanowice, and Racibórz–Miedonia stations were 1820, 2620, and 2800 m3 s−1, respectively), and thus discharges in the right panels do not correspond to water stages in the left panels. At the Chałupki station, the oldest DD curve is available for the years 1951–1960 and at Krzyżanowice for the years 1956–1960.

Figure 3.
Water–stage duration curves for the Krapkowice (A) and Trestno (B) water–gauge stations from Section 2 of the Odra River.
Figure 3.
Water–stage duration curves for the Krapkowice (A) and Trestno (B) water–gauge stations from Section 2 of the Odra River.

Figure 4.
Water–stage (A,C) and discharge (B,D) duration curves for the Malczyce (A,B) and Cigacice (C,D) water–gauge stations from Section 3 of the Odra River. Note that the DD curves do not comprise the highest discharges (maximum discharges recorded at the Malczyce and Cigacice stations were 3020 and 2970 m3 s−1, respectively), and thus discharges in the right panels do not correspond to water stages in the left panels.

Figure 5.
(A) Annual precipitation totals at 9 precipitation-gauging stations from the upper and middle Odra River catchment and average annual precipitation for these stations. (B) Annual average of the NAO index. Dashed lines indicate 5 years with the highest average precipitation at the nine stations and dotted lines 5 years with the lowest average precipitation. Precipitation-gauging stations: 1-Racibórz; 2-Opole; 3-Kłodzko; 4-Jelenia Góra; 5-Wrocław; 6-Leszno; 7-Legnica; 8-Zielona Góra; 9-Słubice; 10-average value of annual precipitation at the nine stations.

Figure 6.
Scatter plot and estimated linear regression relationship between the average for annual precipitation totals at 9 stations from the upper and middle parts of the Odra River catchment and annual values of the NAO index during the years 1966–2020.
Figure 6.
Scatter plot and estimated linear regression relationship between the average for annual precipitation totals at 9 stations from the upper and middle parts of the Odra River catchment and annual values of the NAO index during the years 1966–2020.

Figure 7.
Examples of changes in the gauge cross sections of the Odra River from the studied river sections (A–F) based on surveys in the years 1946–2018.
Figure 7.
Examples of changes in the gauge cross sections of the Odra River from the studied river sections (A–F) based on surveys in the years 1946–2018.


Table 1.
Results from linear regression analysis for the relationships between annual precipitation totals recorded at 9 stations from the upper and middle parts of the Odra River catchment as well as catchment-average annual precipitation, and calendar years. p-values < 0.05 are indicated in bold.
Table 1.
Results from linear regression analysis for the relationships between annual precipitation totals recorded at 9 stations from the upper and middle parts of the Odra River catchment as well as catchment-average annual precipitation, and calendar years. p-values < 0.05 are indicated in bold.
| Station | Slope of Regression (B) | Goodness of Fit (R2) | Significance (p Value) |
|---|---|---|---|
| Racibórz | −2.277 | 0.07 | 0.04 |
| Opole | −2.551 | 0.12 | 0.01 |
| Kłodzko | −0.136 | 0.0004 | 0.88 |
| Jelenia Góra | 0.239 | 0.001 | 0.83 |
| Wrocław | −1.645 | 0.06 | 0.06 |
| Leszno | −0.061 | 0.0001 | 0.94 |
| Legnica | −0.680 | 0.01 | 0.42 |
| Zielona Góra | 0.098 | 0.0002 | 0.92 |
| Słubice | 0.082 | 0.0001 | 0.94 |
| Catchment average | −0.767 | 0.02 | 0.26 |
Table 2.
Results from linear regression analysis for relationships between annual precipitation totals recorded at 9 stations from the upper and middle parts of the Odra River catchment as well as catchment-average annual precipitation, and annual values of the NAO index. p-values < 0.05 are indicated in bold.
| Station | Slope of Regression (B) | Goodness of Fit (R2) | Significance (p Value) |
|---|---|---|---|
| Racibórz | −205.6 | 0.37 | 0.000001 |
| Opole | −145.1 | 0.23 | 0.0002 |
| Kłodzko | −151.4 | 0.31 | 0.00001 |
| Jelenia Góra | −194.5 | 0.34 | 0.000003 |
| Wrocław | −106.1 | 0.16 | 0.003 |
| Leszno | −106.8 | 0.19 | 0.0009 |
| Legnica | −119.5 | 0.23 | 0.0002 |
| Zielona Góra | −107.2 | 0.15 | 0.004 |
| Słubice | −109.4 | 0.13 | 0.007 |
| Catchment average | −123.7 | 0.37 | 0.000001 |
Disclaimer/Publisher’s Note: The statements, opinions and data contained in all publications are solely those of the individual author(s) and contributor(s) and not of MDPI and/or the editor(s). MDPI and/or the editor(s) disclaim responsibility for any injury to people or property resulting from any ideas, methods, instructions or products referred to in the content. |
© 2023 by the authors. Licensee MDPI, Basel, Switzerland. This article is an open access article distributed under the terms and conditions of the Creative Commons Attribution (CC BY) license (https://creativecommons.org/licenses/by/4.0/).
Share and Cite
MDPI and ACS Style
Nádudvari, Á.; Czajka, A.; Wyżga, B.; Zygmunt, M.; Wdowikowski, M. Patterns of Recent Changes in Channel Morphology and Flows in the Upper and Middle Odra River. Water 2023, 15, 370. https://doi.org/10.3390/w15020370
AMA Style
Nádudvari Á, Czajka A, Wyżga B, Zygmunt M, Wdowikowski M. Patterns of Recent Changes in Channel Morphology and Flows in the Upper and Middle Odra River. Water. 2023; 15(2):370. https://doi.org/10.3390/w15020370
Chicago/Turabian StyleNádudvari, Ádám, Agnieszka Czajka, Bartłomiej Wyżga, Marcin Zygmunt, and Marcin Wdowikowski. 2023. "Patterns of Recent Changes in Channel Morphology and Flows in the Upper and Middle Odra River" Water 15, no. 2: 370. https://doi.org/10.3390/w15020370
Note that from the first issue of 2016, this journal uses article numbers instead of page numbers. See further details here.