
Water Footprint Calculation, Effluent Characteristics and Pollution Impact Assessment of Leather Industry in Bangladesh


1
Department of Chemical Engineering, Bangladesh University of Engineering and Technology (BUET), Dhaka 1000, Bangladesh
2
Solidaridad Network Asia, Dhaka 1209, Bangladesh
*
Author to whom correspondence should be addressed.
Water 2023, 15(3), 378; https://doi.org/10.3390/w15030378
Submission received: 2 December 2022
/
Revised: 1 January 2023
/
Accepted: 4 January 2023
/
Published: 17 January 2023
(This article belongs to the Special Issue Water Footprint and Life Cycle Assessment: Complementary Strengths in Analyzing Water Use along Supply Chains)
Abstract
:Leather processing industries consume high volumes of water and chemicals and release effluents into the environment that pollute the surface water and may cause harm to human health. Leather processing involves different wet processing stages such as soaking, liming, chrome tanning, rechroming, neutralization, fatliqouring and dyeing. The pollution generated from the leather processing stages varies in volume, nature and concentrations. Qualitative and quantitative assessments of effluents generated from different stages of leather processing can be useful to understand the stagewise and overall water pollution of leather wet processing and to design and plan pollution abatement initiatives. Water footprints (WF) can help in understanding the total water consumption and water pollution caused by the leather sector. The objectives of this research are to assess the characteristics of effluents generated from different stages of leather processing, calculate the water footprint (WF) and analyze the pollution load of the Bangladesh leather sector. To perform experimental analyses, effluent samples were collected from the following leather processing stages: soaking, liming, deliming and bating, pickling and tanning, wet back, rechroming, neutralization, retanning, dyeing and fatliqouring from four leather processing factories. The key pollution indicating parameters, such as pH, chemical oxygen demand (COD), biological oxygen demand (BOD), total dissolved solid (TDS) and total suspended solid (TSS) of the effluent samples were analyzed. The experimental study showed that almost 52% effluents generate from beam house and tan yard operations, and about 48% effluents generate from post tanning operations. Due to the presence of high amounts of salt, insecticides and bactericides, the effluent generated from the soaking stage contains high BOD and TDS. On the other hand, effluent generated from liming contains the highest amounts of BOD, COD, TDS, and TSS. The reduction or segregation of soaking and liming effluents will be effective in improving the environmental performance of the wet processing of leather. To assess the total water footprint of the leather sector, the water footprint of feed crops and raw hides were calculated, along with the water footprint of the leather processing stages. The water footprints of bovine and ovine crust leather were found to be 34,000 m3/ton and 17,300 m3/ton, respectively. The blue water footprint is higher in soaking, liming and finishing. The green water footprint of leather is mainly contributed by feed crops of farming animals. The grey water footprint was found higher in the soaking, liming, fatliqouring and dyeing stages. About 97% of the water footprints of tanneries are contributed by the wet processing stages. The grey water footprint is the most significant part of the total water footprint of the leather sector, which indicates the impact of high water pollution by the leather processing stages. This study can help to understand the overall scenario of water consumption and water pollution caused by the leather sector in Bangladesh. This study can also be useful in designing sustainable leather products by reducing the total water footprint per unit of leather goods. The systematic approach of this study could be useful for other countries in leather processing.
1. Introduction
Leather and footwear industry is a water and chemical intensive industry which produces high volume effluents with high pollution load. It is estimated that only 20% of chemicals used in the tanning process are absorbed by the leather, and the rest are released as effluent [1,2,3]. The effluent generated is characterized by high chemical oxygen demand (COD), biological oxygen demand (BOD), total dissolved solid (TDS), total suspended solid (TSS) with high pH, strong odor and dark brown color [4,5,6,7]. One of the key reasons for this acute pollution is chrome tanning and the process involved with it. For decades the most credited tanning theory explained the stabilization of the collagen with the formation of cross-links within its triple helix structure [8]. A modification of the supramolecular water sheath also plays a key role in this transformation [9]. Therefore, tannery effluent carries heavy pollution load with different types of tanning materials, salts and large quantities of putrefying suspended matters [10].
The water footprint (WF) can be useful to assess water consumption and pollution load associated to leather industries as it is a scale of water measurement that looks at direct and indirect water use of a consumer or producer [11,12,13,14]. The water footprint (WF) of a product is the volume of freshwater used to produce the product, measured over the full supply chain. It is a multi-dimensional indicator, showing water consumption volumes by source and polluted volumes by type of pollution; all components of a total water footprint (WF) are specified geographically and temporally. The blue water footprint refers to consumption of blue water resources (surface and groundwater) along the supply chain of a product [15]. The green water footprint refers to consumption of green water resources (rainwater stored in the soil as soil moisture) [11]. The grey water footprint refers to pollution and is defined as the volume of freshwater that is required to assimilate the load of pollutants based on existing ambient water quality standards [11]. The water footprint (WF) of leather thus offers a wider perspective on how tanners relate to the use of freshwater systems.
Leather and footwear sector is one of the key export-oriented sectors of Bangladesh. However, lack of water and pollution management and impact assessment of this sector is one of the bottlenecks for constant growth in global export market. Tanneries in Bangladesh need proper management of water for better utility and efficient leather production. Water footprint (WF) and pollution load data can help manufacturers, tanners and dealers to understand the environmental value, especially water value in leather production. Bangladesh exported total USD 866.45 million from leather exports in fiscal year (FY) 2013. In the FY 2015, earnings from leather footwear, leather products and leather were USD 483.81 million, USD 249.16 million, and USD 397.54 million respectively [16,17]. As tanneries are highly water and chemical consuming industries, they release large amount of effluent throughout the year into water bodies with partial treatment or no treatment. Previously, the tanneries in Hazaribagh discharged 22,000 L per day of toxic wastewater into the Buriganga River, located at the backyard of Hazaribagh, Dhaka [18]. For this reason, about 155 tanneries have been relocated to Savar, Dhaka near to Dhaleshwarie River, for the government order, out of which 62 units have started production on the new Savar Tannery Estate in Bangladesh [19]. Due to the relocation of tanneries and environmental compliance issues, export of leather items reduced in FY 2020 to below USD 1 billion. More tanneries are relocating and starting the production in new location. Now after relocation, Dhaleshwarie River can face the same fate as Buriganga if proper measures are not taken to protect it [19].
This paper focuses on calculating water footprint and assessing pollution impacts of Bangladesh leather sector by characterizing tannery effluents and analyzing annual effluent release. This paper also provides a detail assessment of annual blue water consumption and grey water requirement for the leather production and leather products. The data assessment in the study is very essential for water and pollution management in the leather sector of the country. This study will be also useful for other countries working on similar production sectors.
2. Materials and Methods
2.1. Experiments
2.1.1. Chemicals
Dipotassium phosphate (K2HPO4), Disodium phosphate (Na2HPO4.7H2O), Ammonium chloride (NH4Cl), Magnesium sulfate (MgSO4.7H2O), Calcium chloride (CaCl2), Ferric chloride (FeCl3.6H2O), Potassium dichromate (K2Cr2O7), Mercuric sulfate (HgSO4) and Sulfuric acid H2SO4 conc. were purchased from Sigma-Aldrich (St. Louis, MO, USA). All solutions were prepared with grade 1 water (Milli Q water purification system Type 1, Darmstadt, Germany).
2.1.2. Sample Collection and Analysis
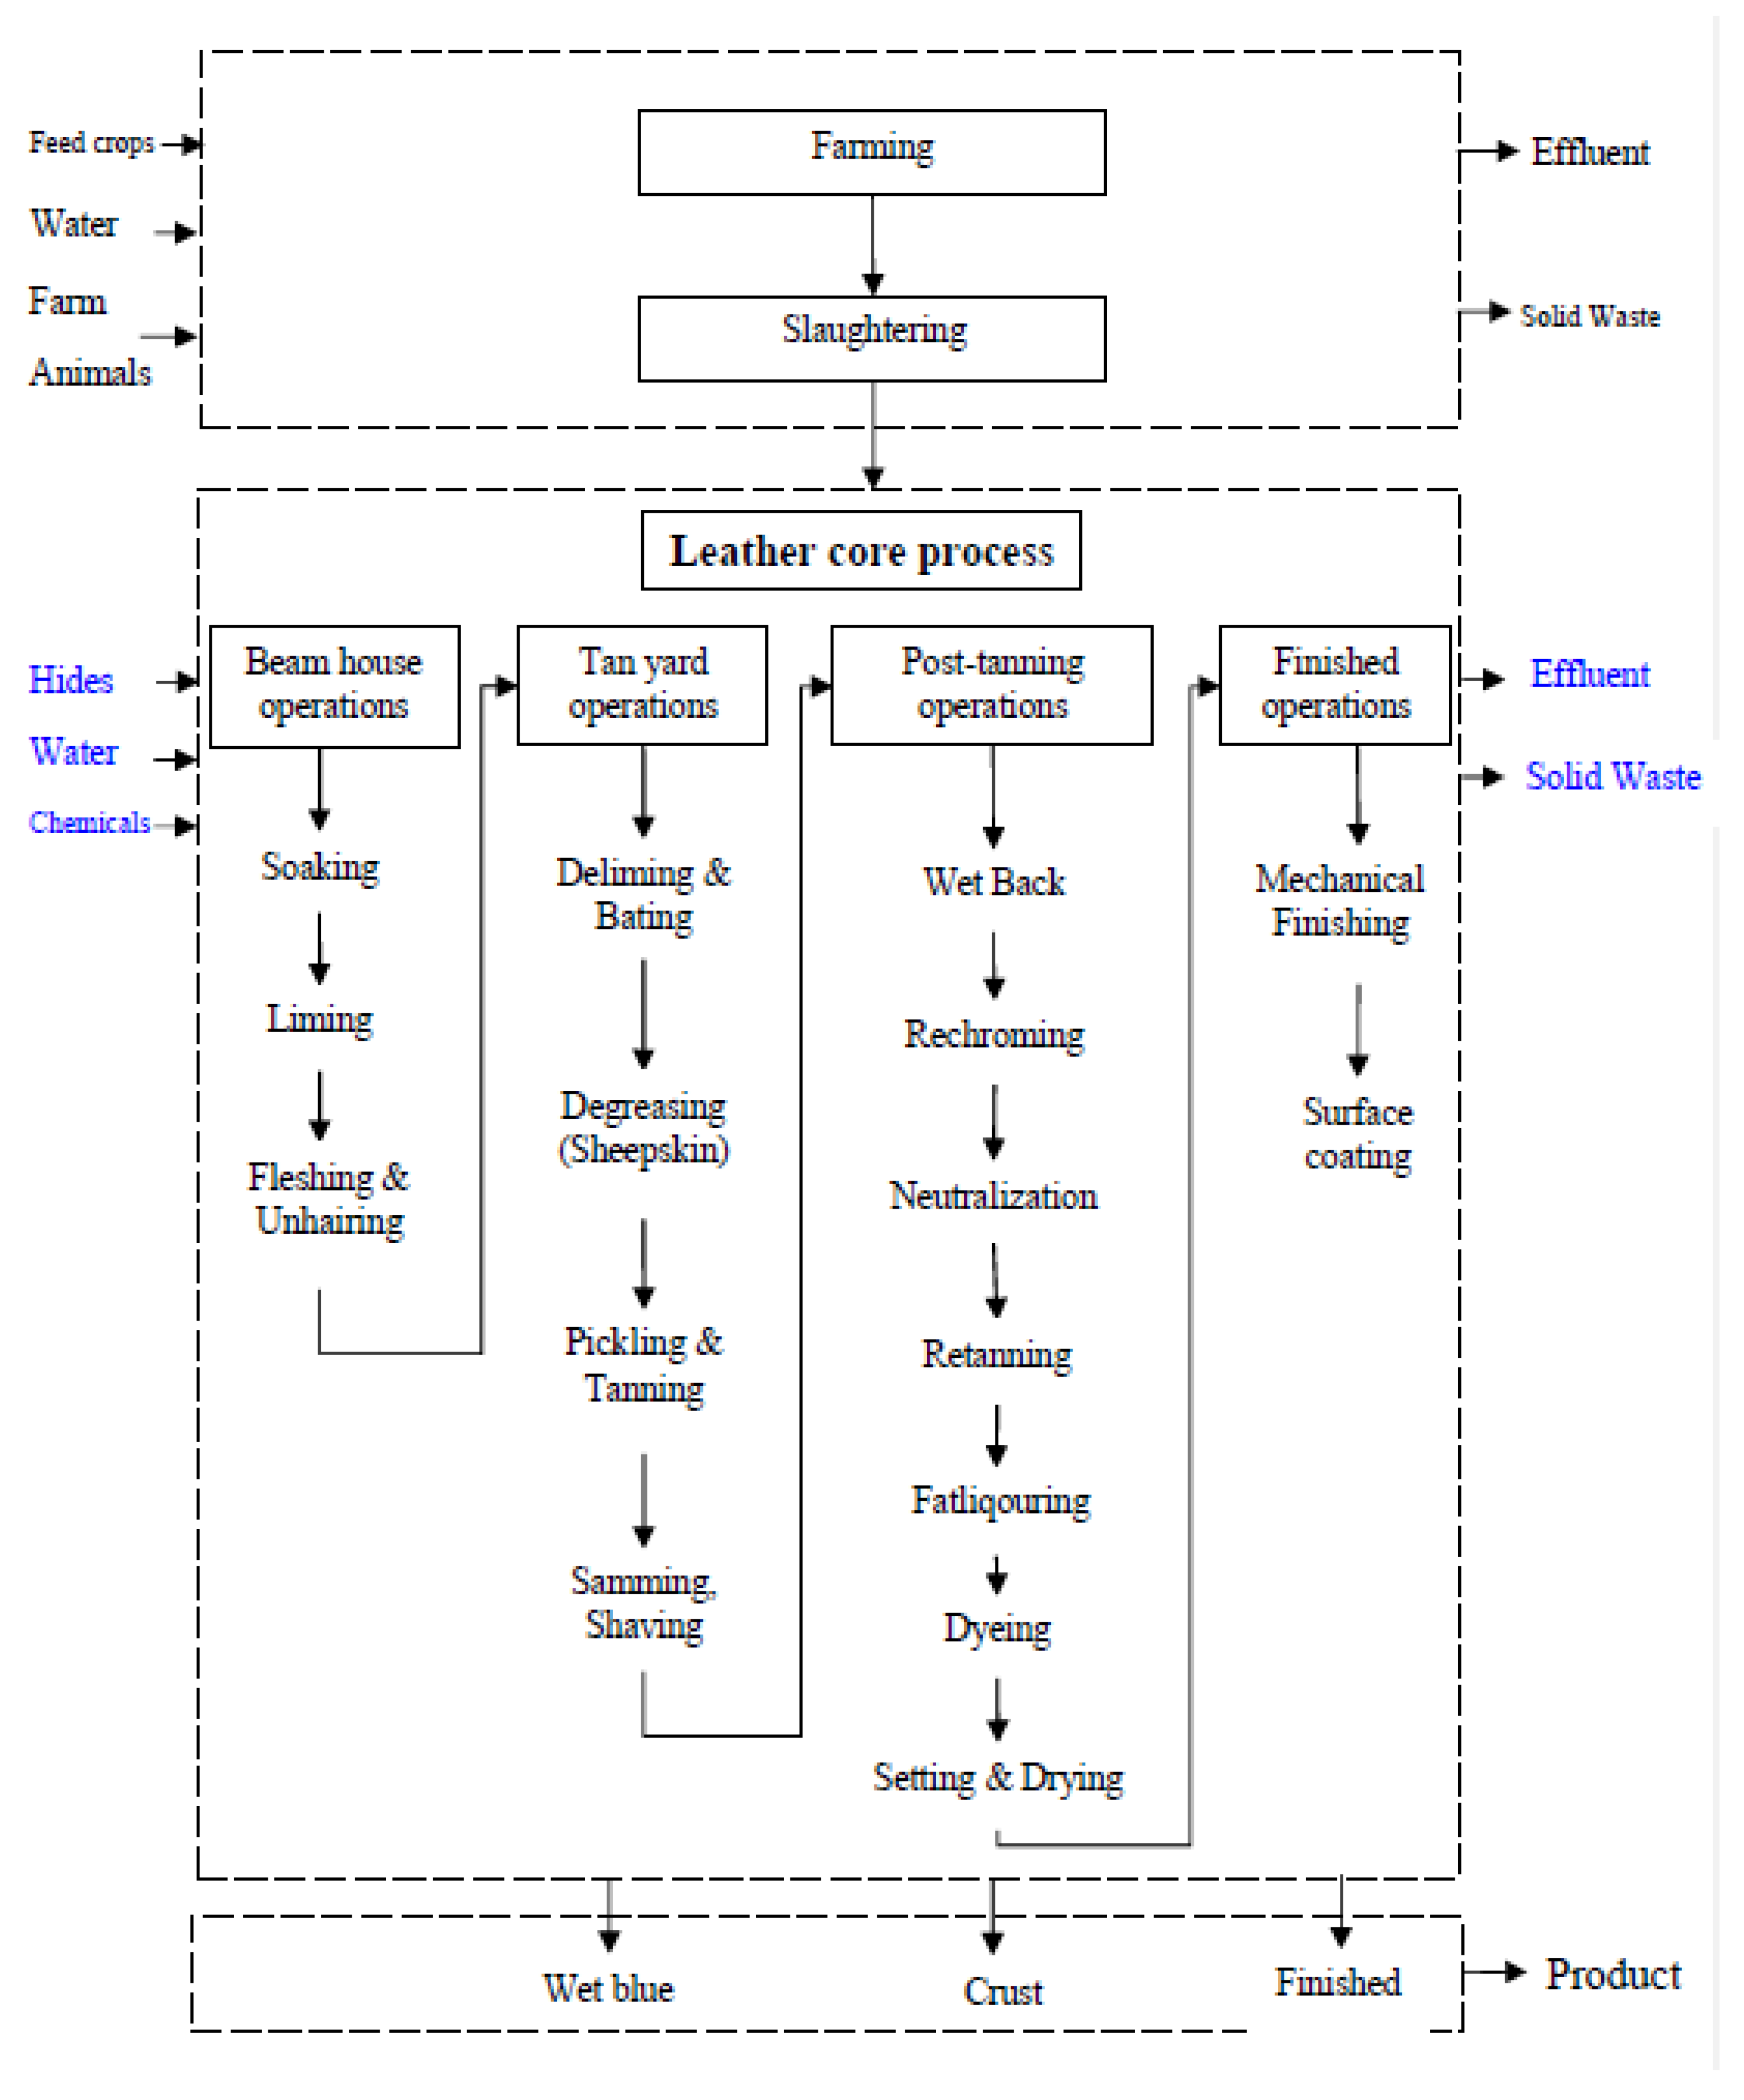
The effluent samples were collected from four leather processing factories located in Savar Tannery Estate, Bangladesh. Sample were collected from the following leather processing stages: soaking, liming, deliming and bating, pickling and tanning, wet back, rechroming, neutralization, retanning, dyeing and fatliqouring (Figure 1). The grab samples were transported on ice in ice box (30 L) and immediately stored in approximately 4 °C. Then the samples were carefully analyzed in the Environment lab of the Chemical Engineering Department, BUET, Bangladesh. The experiments were conducted to analyze pH, BOD5, COD, TDS and TSS of the leather processing effluent. pH and TDS were determined with pH meter (HI 2210, HANNA, Singapore) and TDS meter (HI 2020, HANNA, Singapore). COD was analyzed colorimetric method using COD reactor (HACH) and DR 6000 UV/Vis spectrophotometer (HACH). BOD5 was measured using standard method 5210B (APHA, 2005). TSS was determined by evaporation at 105 °C (24 h) in electric desiccator.
2.2. Annual Pollution Load Calculation
For the calculation of pollution load, annual production of crust leather in Bangladesh on average 323 million ft2 has been taken as basis [16]. Annual production data of crust leather been taken from Leather Goods and Footwears Manufacturers and Exporters Association of Bangladesh [17] and Bangladesh Bureau of Statistics [20].
The weight of crust leathers (mcrust leather) has been calculated using Equation (1) [21].
where mass of the crust leathers is mcrust leather (kg), the area of crust leather is ACrust leather (ft2) and the yield is Yi (kg/ft2). For calculating the weight of crust leathers (mcrust leather), the area of crust leather (ACrust leather) has been multiplied by the yield (Yi) of weight per feet square of leather (Equation (1)) [21]
mcrust leather = ACrust leather × Yi
In terms of weight, it is estimated that in the weight category one ton (1000 kg) of wet salted hides, average weight 28 kg/hide, would give 195 kg of grain and 60 kg of split: a total yield (Yi) of 255 kg of finished leather [22]. In terms of area, it is estimated that one ton of raw hide (39 hides, average area 4 m2/hide) with a total surface area of approximately 156 m2 yields 138 m2 of grain leather and 60 m2 split. The yields related to green weight are as follows: grain leather 12.5 dm2/kg and split leather 5.40 dm2/kg: a total yield of 17.90 dm2/kg green weight [21].
Volume of water consumption has been calculated using the basis and yield of the leather intermediary products and then multiplied with the consumption rate, CR (%) (Table 1) given in Equation (2) [23].
where volume of water is Vwater (m3), and the consumption rate is CR (%). The water consumption rate (%) data of each stage has been collected from tanners and leather technologist through the survey as they follow their recipe to use the water and chemicals for production of leather. A standard recipe has been chosen for the simplification purpose.
Vwater = mcrust leather × CR
Effluent volume (Veffluent) and pollution load (L) are calculated using Equations (3) and (4), respectively [23].
where effluent volume is Veffluent (m3), the volume of water is Vwater (m3), the incorporate water is I (%). Pollutant load is L (kg) and the pollutant concentration is cpollutant (kg/m3). Effluent volume Veffluent (m3) has been calculated with the volume of water Vwater (m3) subtracting the incorporate water volume. Pollutant load (L, kg) has been calculated by the effluent volume Veffluent multiplying the pollutant concentration cpollutant (e.g., BOD, COD, TDS and TSS) [23].
Veffluent = Vwater (1 − I Incoporation)
L = Veffluent × cpollutant
2.3. Water Footprint Calculation Method
The water footprint (WF) of a product is the sum of the water footprints of the process steps taken to produce the product (considering the whole production and supply chain). There are two methods for calculation of WF, one of them is based on ISO-14040/44, 14067 standards and focuses on cradle to-gate approach and another is based on water footprint network (WFN) approach in framework of Hoekstra et al. (2009) [11]. In this study, the water footprint network (WFN) approach [11] is used. The functional unit and system boundary of the finished leathers is defined below (Figure 1). Product water footprint (volume/mass) is equal to the sum of the water footprint relevant processes (WFprocess) divided by the production quantity (P) of the product.
For calculating the water footprint (WF) of leather every water footprint (WF) involve in leather production needs to be calculated using chain summation approach given in Equation (5) [11]:
where the water footprint relevant processes refer to WFprocess (m3/ton) and the production quantity of the product is P (ton). The water footprint (WF) of the product from a farm animal (e.g., leather) is related to the feed consumed consists of two parts: the water footprint (WF) of the various feed crops and the water that is used to mix the feed given in Equation (6) [11]:
where Production of feed crops is Pfeedcrops (ton), water footprints of crop by-products is (m3/ton), mixing water is WFmixing (m3/ton). The water footprints (WFs) of the different crops, roughages and crop by-products (, m3/ton) that are eaten by the various farm animals (e.g., cattle, goat) have been calculated following the methodology developed by Hoekstra and Chapagain [24] and Hoekstra and others [25]. The water footprints (WFs) of feed crops were estimated using a crop water use model that estimates crop water footprints [26,27]. Grey water footprints were estimated by looking at leaching and runoff of nitrogen, phosphorous fertilizers, following Mekonnen and Hoekstra [27]. Bangladesh does not import animal foods from other countries. Animal feed has been considered domestic production (Ti = 0). Therefore, the data was taken according to the relative volumes of domestic production.
2.3.1. Water Footprint Calculation of Feed Crops
The water footprint (WF) is the volume of water used to produce a particular good, measured at the point of production [28,29,30,31,32,33]. The green, blue and grey WFs of crop production were estimated using the calculation framework of Hoekstra et al. (2011) [25]. The computations of crop evapotranspiration (ET) and yield, required for the estimation of the green and blue WFs in crop production, have been done following the method and assumptions provided by Allen et al. (1998) [34] explained in Appendix A.
2.3.2. Water Footprint of Hides and Skins
The water footprint (WF) of farm product (e.g., hides) derived from the WF of a live animal (e.g., cattle, buffalo, goat and sheep) consists of different components: the indirect WF of the feed (WFfeed) and the direct WF related to the drinking water (WFdrink) and service water (WFserv) consumed methods as follows. The water footprint of an animal is expressed as given in Equation (7) [11]:
where the indirect Water footprint is WFfeed (m3/ton) and the direct Water footprint related to the drinking water is WFdrink (m3/ton) and service water is WFserv (m3/ton). WF of feed (WFfeed) from WF of feed crop (WFfeed crop) require Cattle, buffalo, goat and sheep population data which is high in Bangladesh [35] calculated as Equation (8) [11] and their feed composition is also limited within green grass (pasture), fodder and forages.
where DP is dressing percentage (%) and Pf is product fraction (%), WAnimal is weight of live animal (ton) and WProduct is weight of the product (ton). Three main categories of feed resources are potentially available for use in smallholder crop–animal systems in the country. These are pastures (native and improved grasses, herbaceous legumes and multi-purpose trees), crop residues, agro-industrial by-products [36]. Feed crop residue and feed crop by product production and yield data has been taken from BBS, 2017 [20], for this study considered animals that are cattle and goats. The dressing percentage (DP) and product fraction (Pf) of the hides are calculated using Equations (9) and (10) [11]:
where DP is the dressing percentage (%) which is calculated by the chilled carcass weight (ton) by live weight during slaughtering (ton), and Pf is the product faction (%) which is calculated by dividing weight of production (Wproduct) (ton) by weight of animal (Wanimal) (ton). Product fraction (Pf) has been taken 8.40% [37] for cattle and 11% [38] for goat, Water for mixing with the food intake has been taken 2 m3/ton. Drinking water has been estimated 120 m3/ton for cattle and 87 m3/ton for goat [39] from livestock data [40]. Servicing water has been assumed 28 m3/ton.
WFAnimal = WFfeed + WFdrink + WFserv
Different research groups used value fraction (Vf) to calculate water footprint of any specific part of an animal. Value fraction is referred to as the market value of one product from the animal as descried in Aldaya et al. (2011) [25]. However, the correlation between market value (e.g., USD or BDT) and WF of any specific part of an animal is not well defined and well understood. Therefore, in this study, instead of value fraction (Vf), product fraction (Pf) is used to convert from the WF animal to WF hide.
2.3.3. Water Footprint of Leather Production (Tannery)
Water footprint (WF) of tanneries and workers includes blue and grey water footprints (WFs). As tanneries do not utilize the rain water, green WF has been excluded from the calculation. The blue WF of tanneries has been calculated by water consumption in each stage of leather processing. In the production system, the WF of each product WF [p] (m3/kg) is equal to the sum of the relevant process water footprints (WFs) divided by the production quantity of product p (e.g., pelt, wet blue leather and crust leather) given in Equation (11) [11].
where WFtannery is the water footprint of a tannery (m3/ton), WFProcess [s] is the process water footprint of stages [s] (m3/year), and P[p] is the production quantity of product p (ton/year). Both the blue and grey WF calculation method has been given below. For calculating total production each year, weight of animal products is used as basis. Weight of animal products has been calculated from export value of leather from export promotion bureau [16] and then it converted into weight of crust, wet blue, pelt and raw hides with back calculation of their specific weight (raw hide 0.737 kg/ft2, pelt 0.474 kg/ft2, wet blue 0.211 kg/ft2, crust 0.10 kg/ft2) [41].
Blue Water Footprint of Leather Production (Tannery)
The process blue water footprint is calculated by Equation (12) [42].
where the process blue water footprint of each step is WFproc,blue [s] (m3/year), consumption rate of water is CR (m3/ton) and annual production of leathers is AP (ton/year). The process blue water footprint of each step is calculated by multiplying consumption rate (CR) of water (Table 1) in drums and annual production (AP) of leathers given in Equation (12) [42].
Grey Water Footprint of Leather Production (Tannery)
The process grey water footprint is calculated using Equation (13) [23].
where WFproc, grey [s] is the process grey water footprint (m3/year), Ceff is the concentration of the pollutant in the effluent (kg/m3), Cact is the actual concentration of the intake water (kg/m3), Cmax is the ambient water quality standard for the pollutant (kg/m3), Cnat is the natural concentration of pollutant in the river (kg/m3), Effl is the effluent volume (m3/year) and Abst is the water volume of the abstraction (m3/year).
The process grey water footprint, WF proc, grey [s] (m3/year) is calculated by dividing the pollutant load (kg/year) by the difference between the ambient water quality standard for that pollutant (Cmax, in kg/m3) and its natural concentration in river (surface water) (Cnat, in kg/m3) [23]. Pollutants (e.g., BOD and COD) are part of tannery effluent discharged into river, the pollutant load is calculated as the effluent volume (Effl, in m3/year) multiplied by the difference between the concentration of the pollutant in the effluent (Ceffl, in kg/m3) minus the water volume of the abstraction (Abst) multiplied by the actual concentration of the intake water (Cact). The actual, natural concentration of pollutants and ambient water quality standard for pollutants (e.g., BOD and COD) are taken from ECR Schedule 10 Department of Environment (DoE) of Bangladesh [43,44]. The average of the test result of the pollutants concentration (e.g., BOD and COD) from four tanneries effluents is presented in Table 2. In the calculation, BOD values of each stage and sub stages are considered for calculating grey WFs of tannery.
3. Results
3.1. Effluent Characteristics and Pollution Load of Leather Processing
3.1.1. Characteristics of Effluent from Different Stages
Each stage of the leather processing produces effluents which are different in characteristics. In Table 3 each stage and their substages effluent characteristics are given. BOD, COD, TDS and TSS values are average of four leather processing factories. Soaking and liming stages have high BOD, COD, TDS and TSS. Effluent from liming has high pH as this stage is alkaline in nature. Tanning and rechroming effluents have low pH as these stages involve acidic processing. Effluents from each stage has got high pollutant concentration as the effluent contains heavy metals and non-biodegradable solids. Particularly, liming main bath effluent has BOD 2500 mg/L, COD 60,000 mg/L, TDS 14,720 mg/L and TSS 51,400 mg/L, which are very high.
3.1.2. Pollution Load of Leather Processing
Beam House Operations
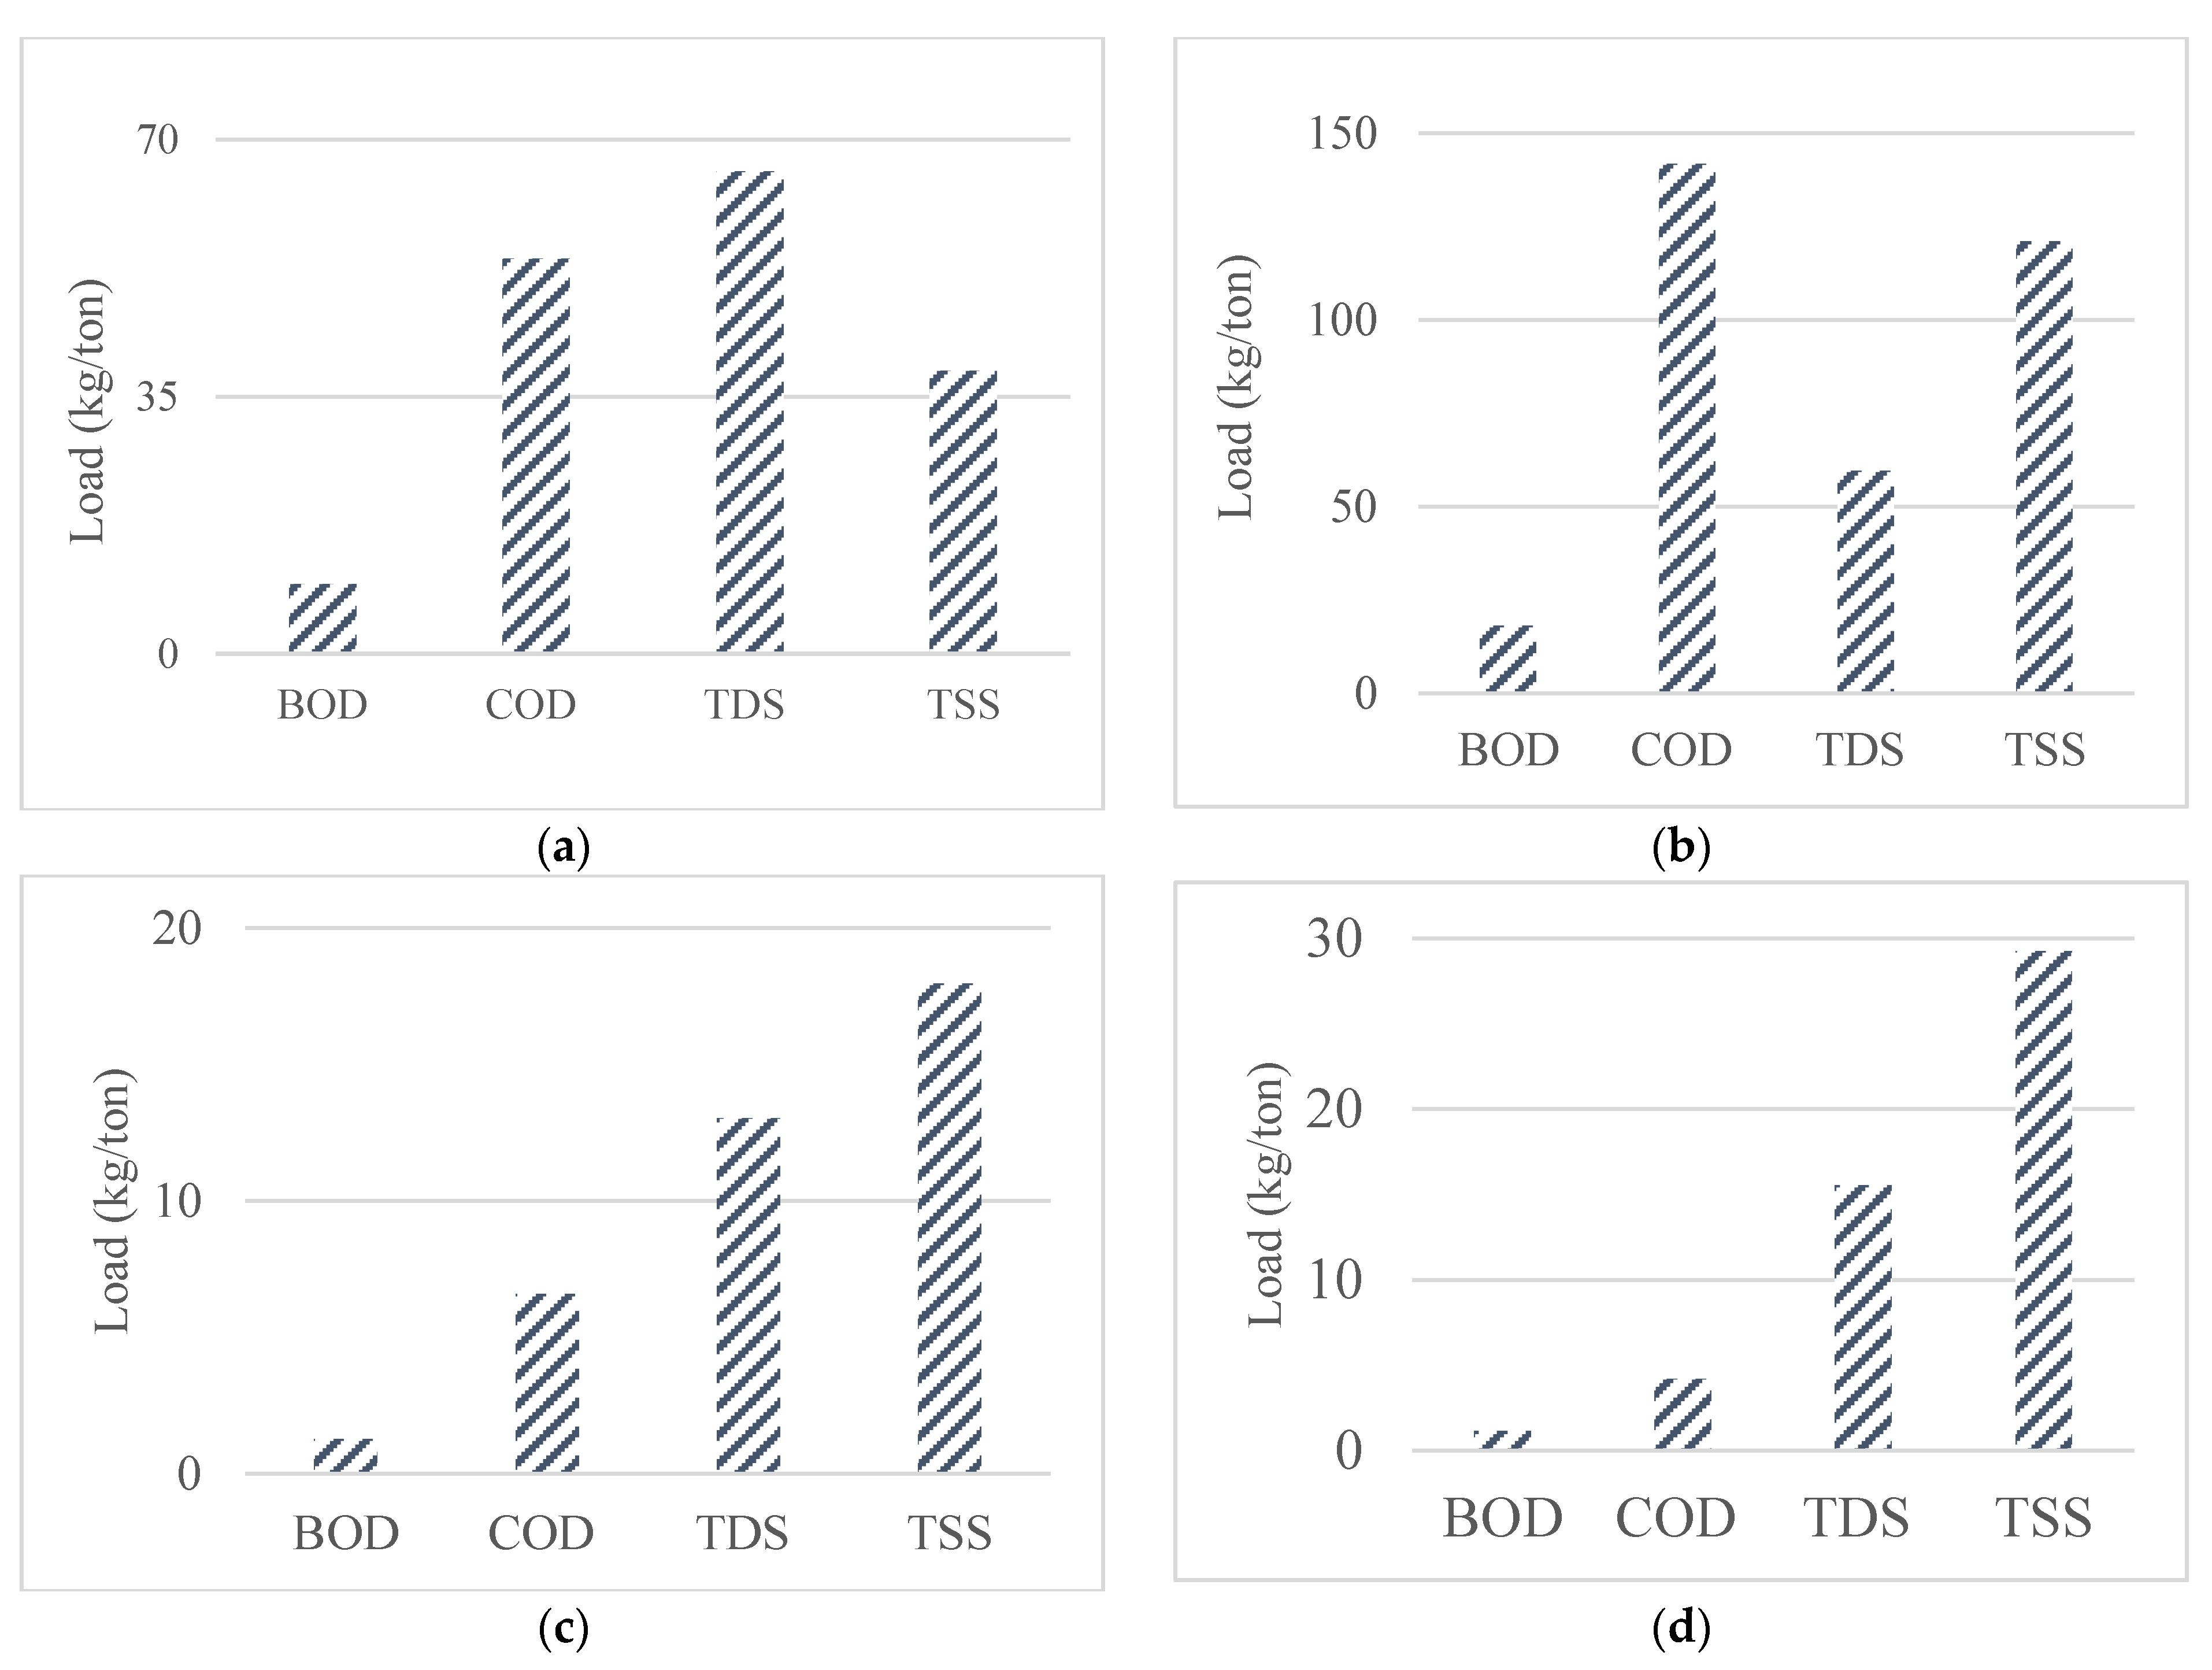
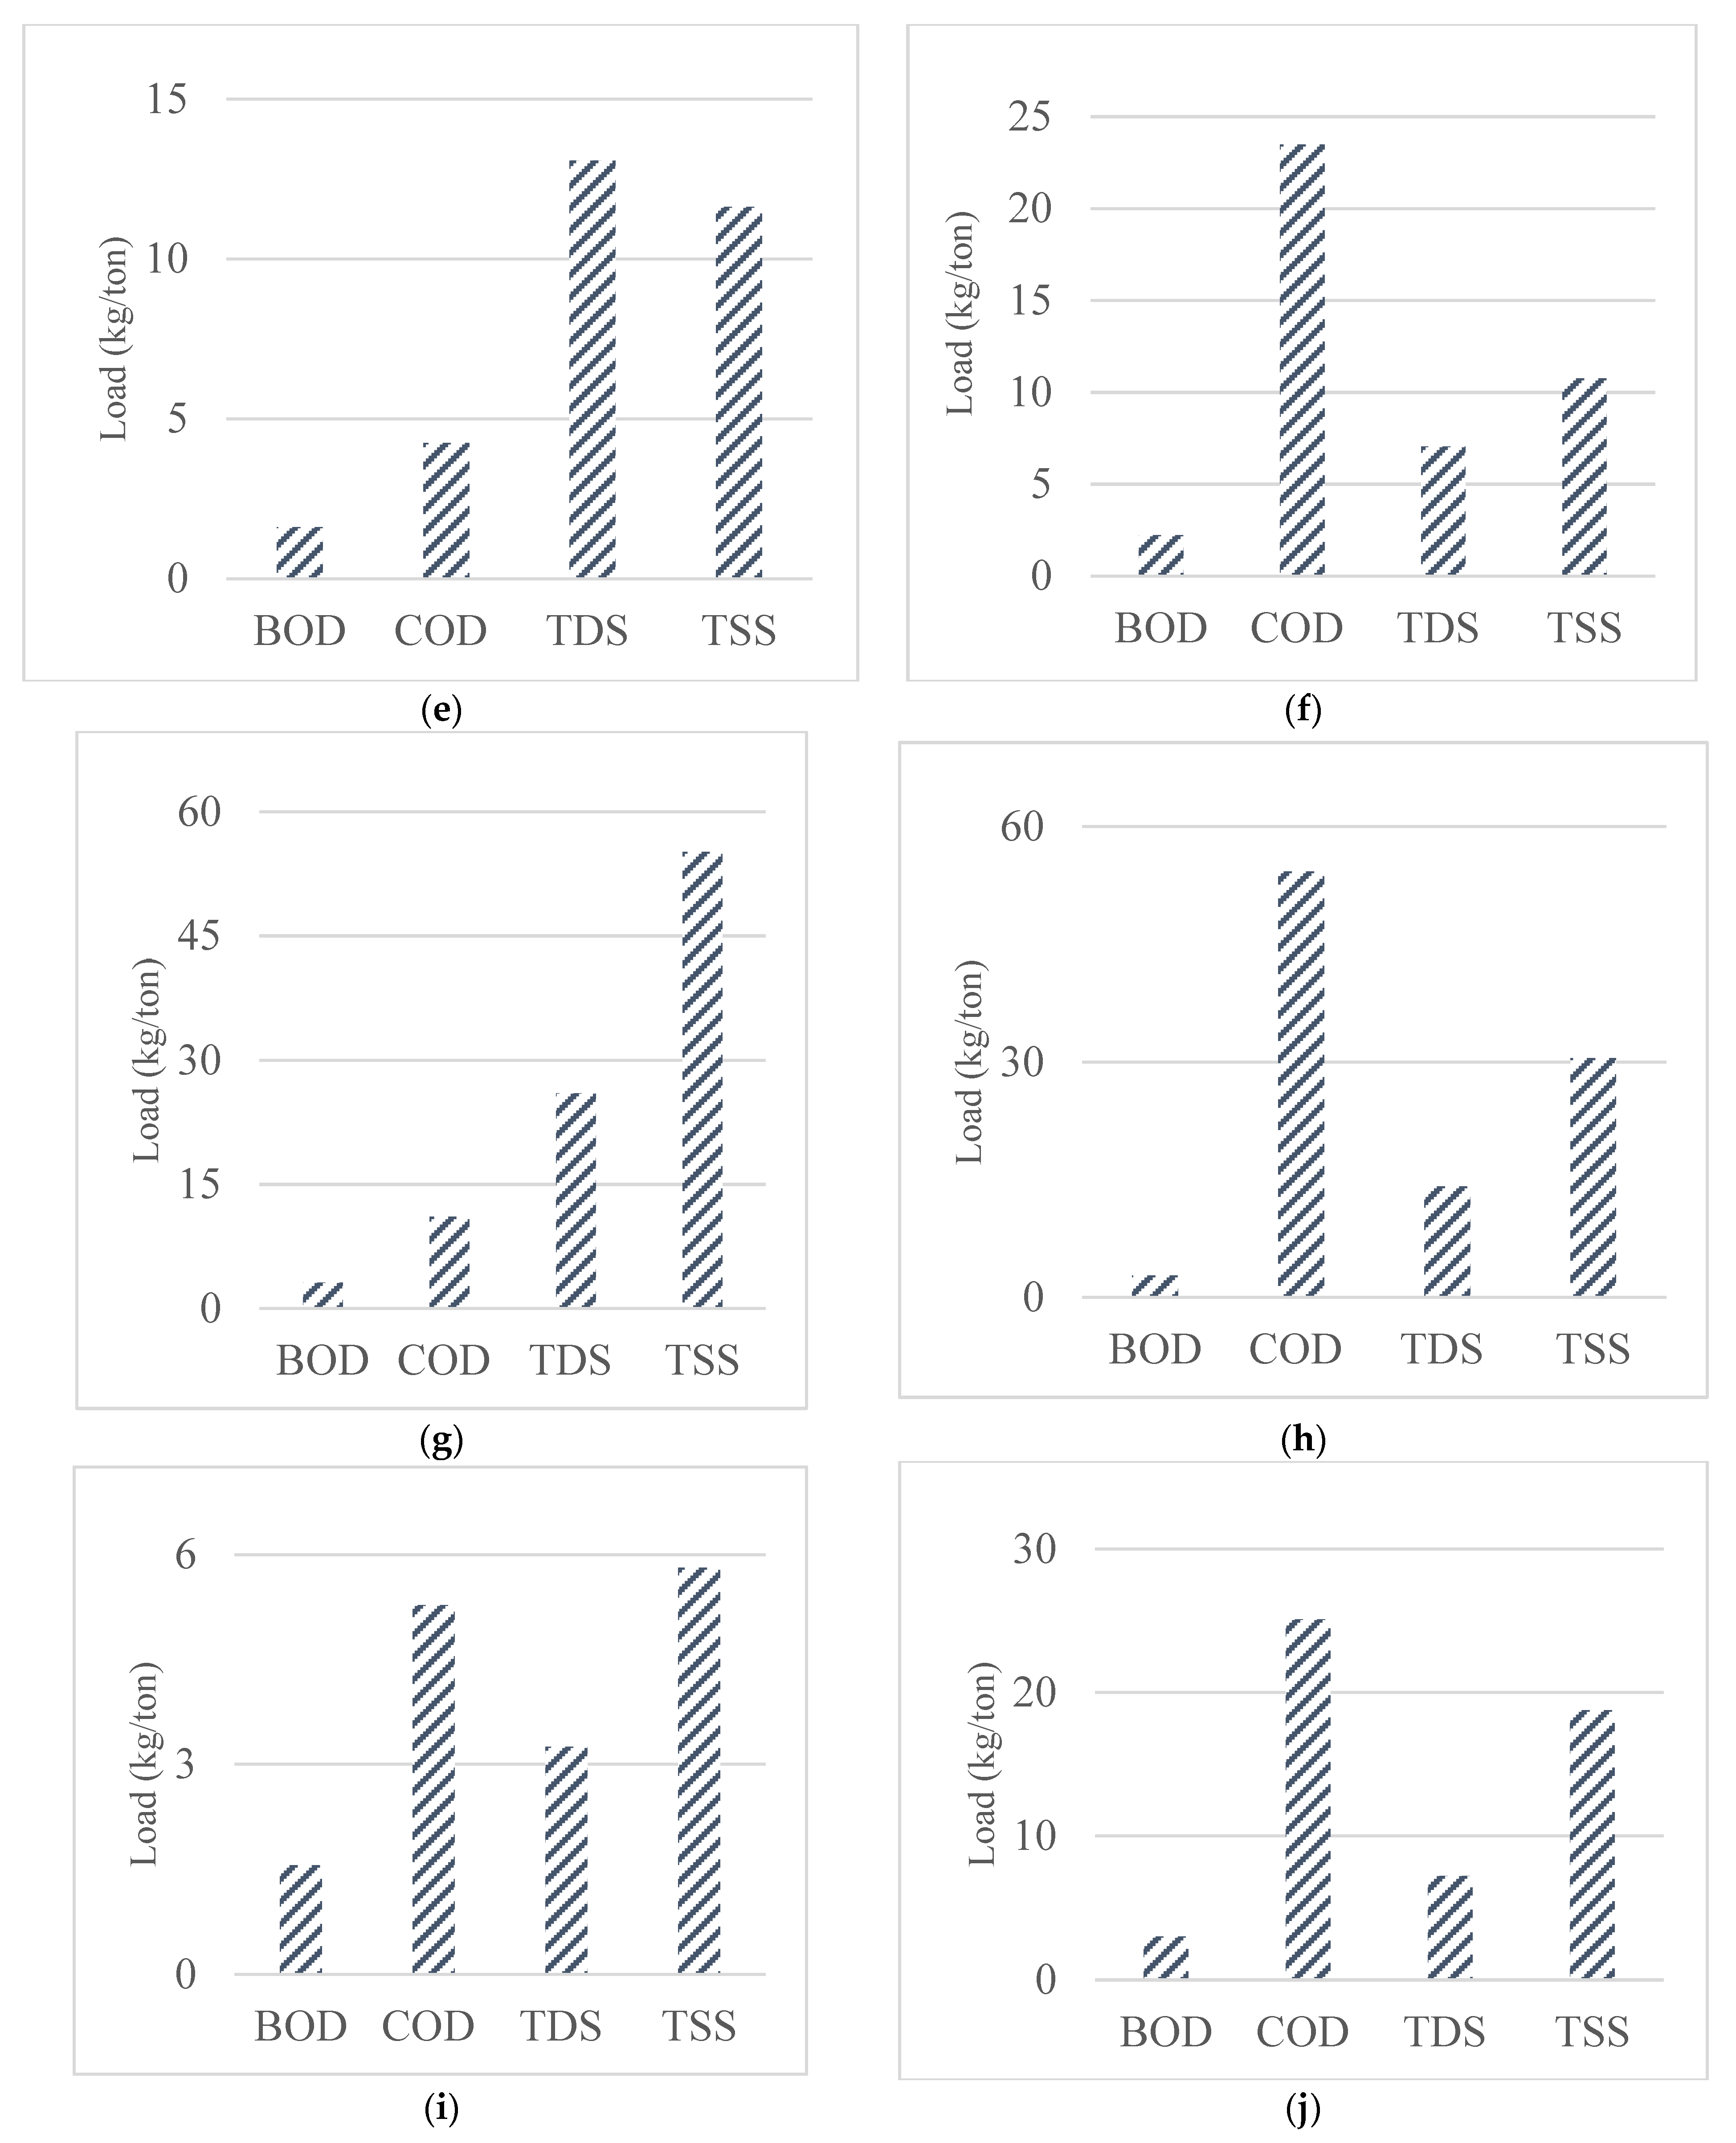
Soaking, which includes the presoaking, main soaking and washing stages, has BOD 10 kg/ton, COD 54 kg/ton, TDS 66 kg/ton and TSS 39 kg/ton, respectively. Pollution load of soaking is given in Figure 2a. Soaking effluent is second most polluted after liming. It contains high amount of salt for salt curing of hides and skins in Bangladesh. Liming stage has BOD 18 kg/ton, COD 142 kg/ton, TDS 60 kg/ton and TSS 121 kg/ton, respectively. Pollution load of liming is given in Figure 2b. This stage produces maximum number of pollutants. Liming generates the most polluted effluent, and it contains lime and dirt. Its TSS is almost 120 kg/ton it means effluent contains many solids such as hair, blood and flesh residue.
Tan Yard Operations
BOD, COD, TDS and TSS of deliming and bating stage were found 1 kg/ton, 7 kg/ton, 13 kg/ton and 18 kg/ton, respectively. Pollution load of deliming and bating stage is given in Figure 2c. Delime washing effluent has low BOD and COD but high TSS still less than liming and soaking effluent. Pickling and tanning stage has BOD 1 kg/ton, COD 4 kg/ton, TDS 16 kg/ton and TSS 29 kg/ton, respectively. Pollution load of pickling and tanning stage is given in Figure 2d.
Post Tanning Operations
Pollution load of post tanning operations includes wet back stage has BOD 2 kg/ton, COD 4 kg/ton, TDS 13 kg/ton and TSS 12 kg/ton, respectively (Figure 2e). Rechroming stage has BOD 2 kg/ton, COD 23 kg/ton, TDS 7 kg/ton and TSS 11 kg/ton, respectively (Figure 2f). Neutralization stage has BOD 3 kg/ton, COD 11 kg/ton, TDS 26 kg/ton and TSS 55 kg/ton, respectively (Figure 2g). Retanning stage has BOD 3 kg/ton, COD 54 kg/ton, TDS 14 kg/ton and TSS 31 kg/ton, respectively (Figure 2h). Dyeing stage has BOD 2 kg/ton, COD 5 kg/ton, TDS 3 kg/ton and TSS 6 kg/ton, respectively (Figure 2i). Fatliqouring stage has BOD 3 kg/ton, COD 25 kg/ton, TDS 7 kg/ton and TSS 19 kg/ton, respectively (Figure 2j).
3.2. Water Footprint of Feed Crops and Raw Hides
3.2.1. Water Footprint of Feed Crops
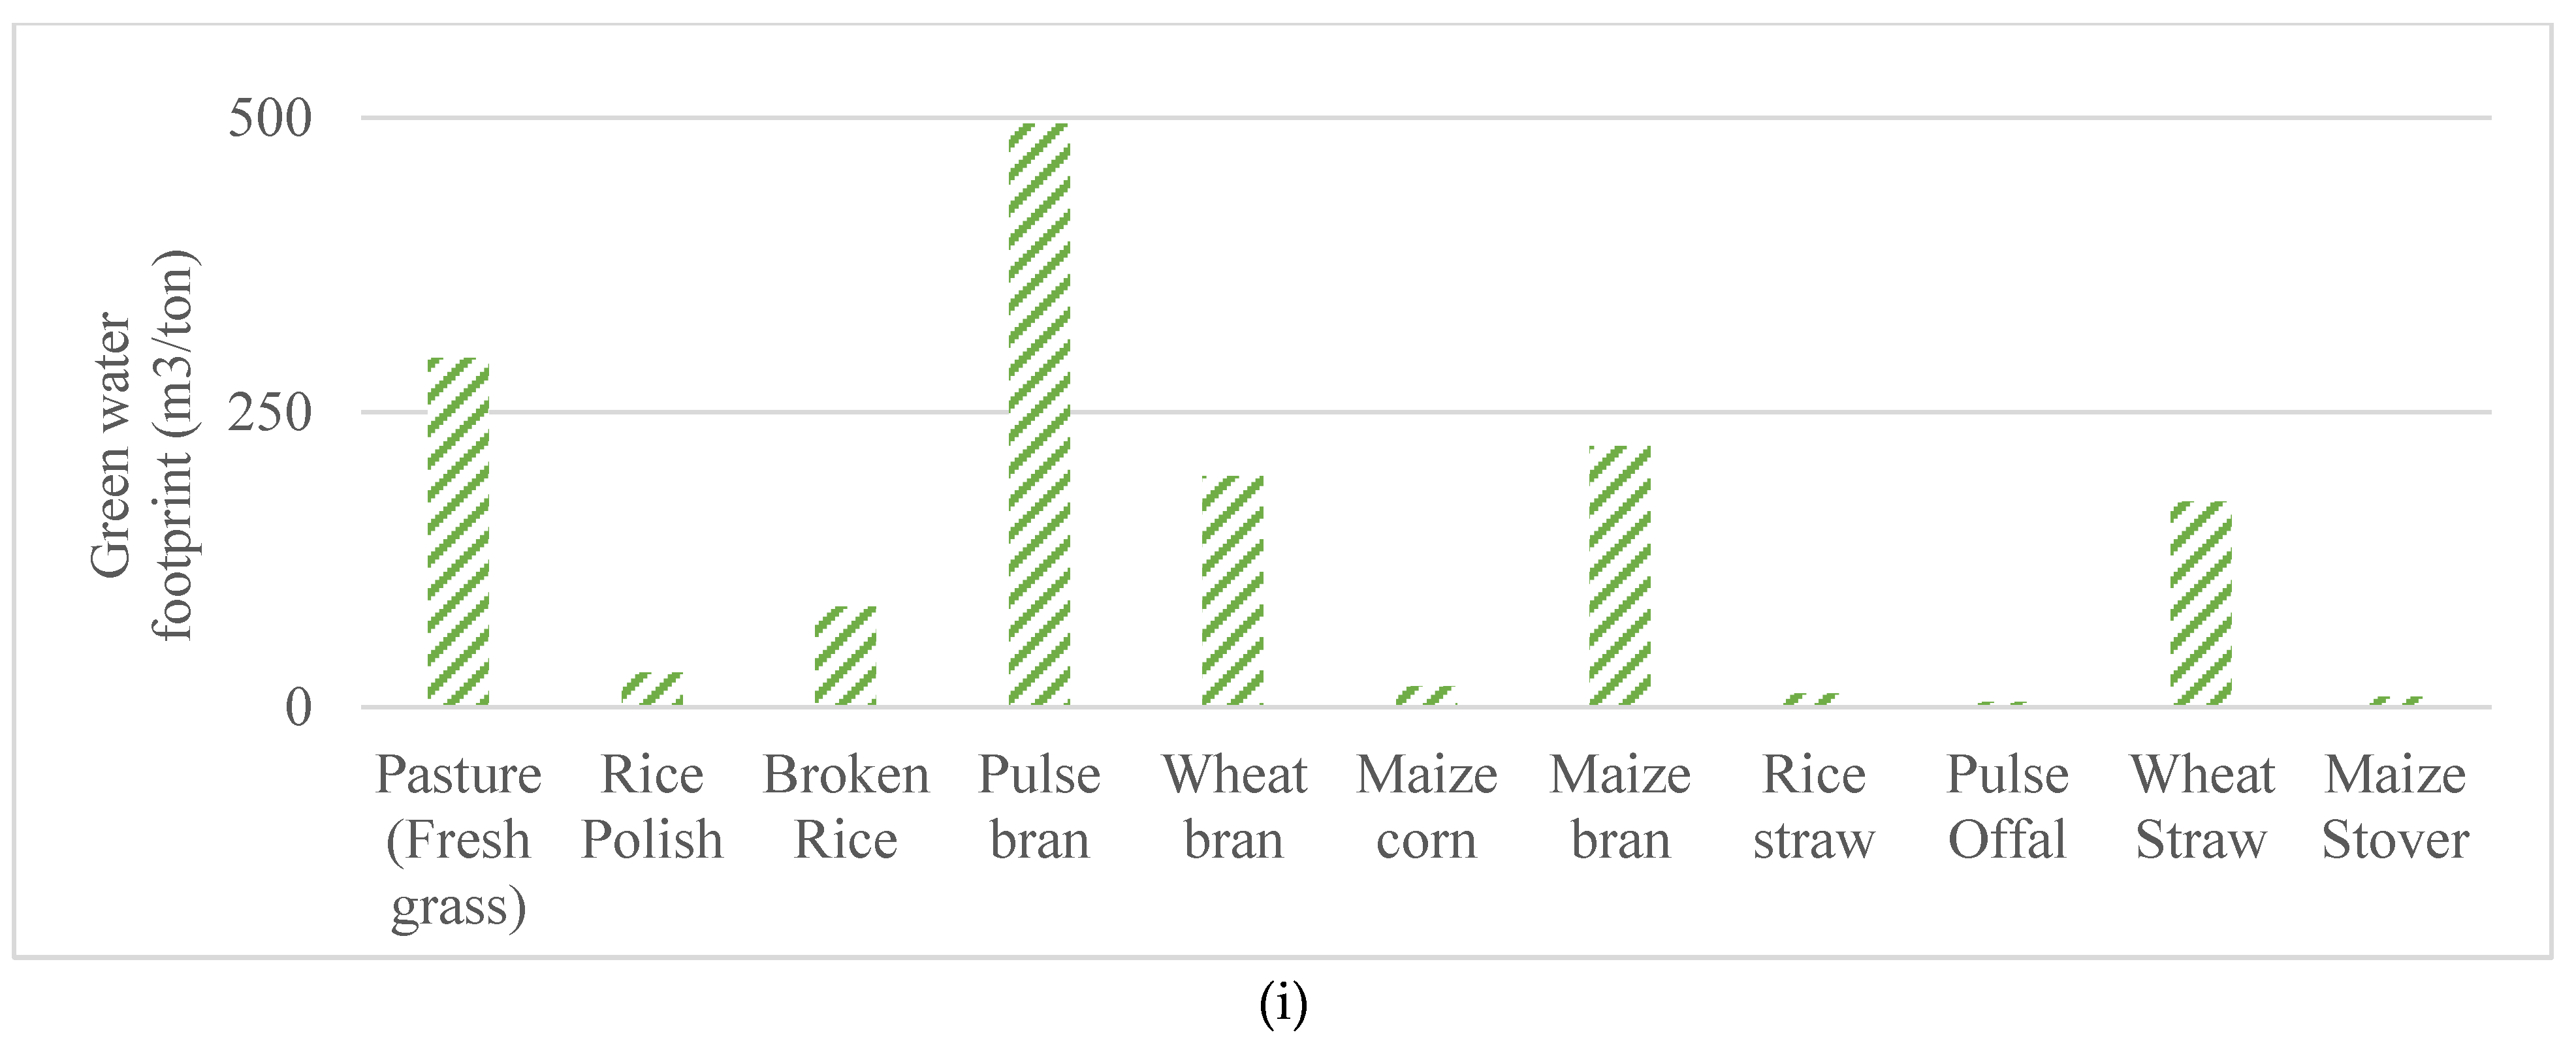
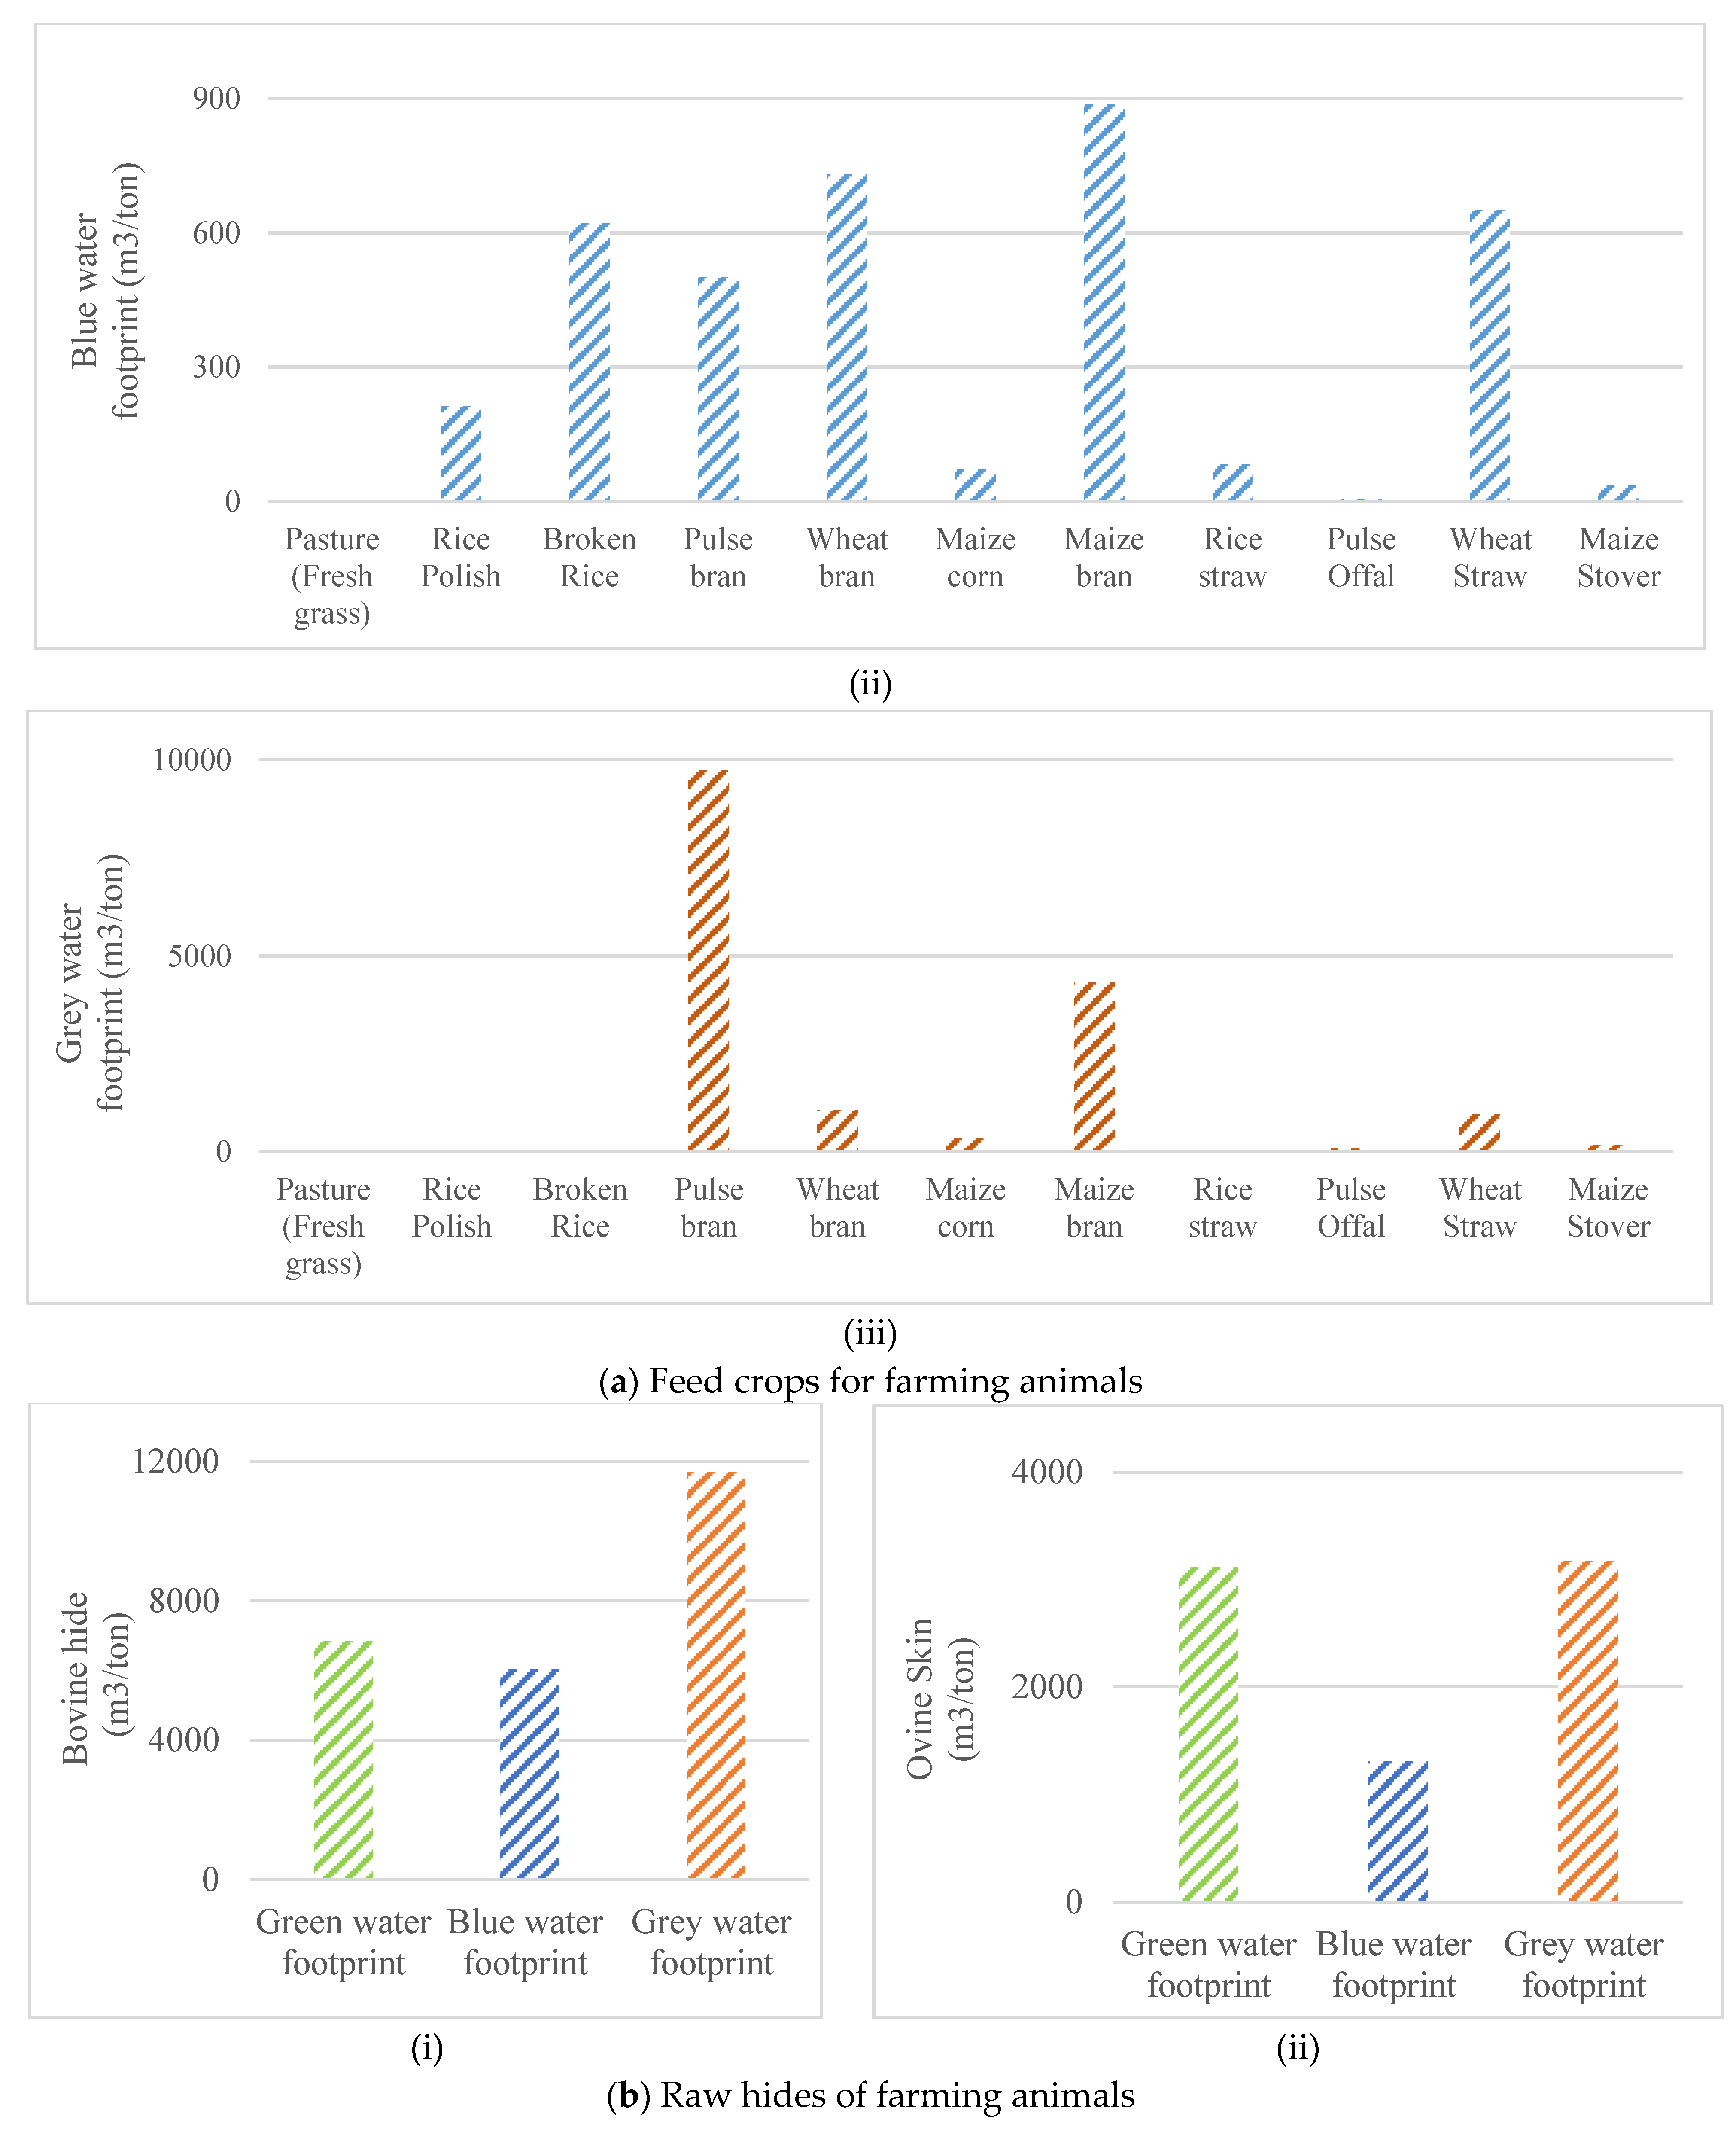
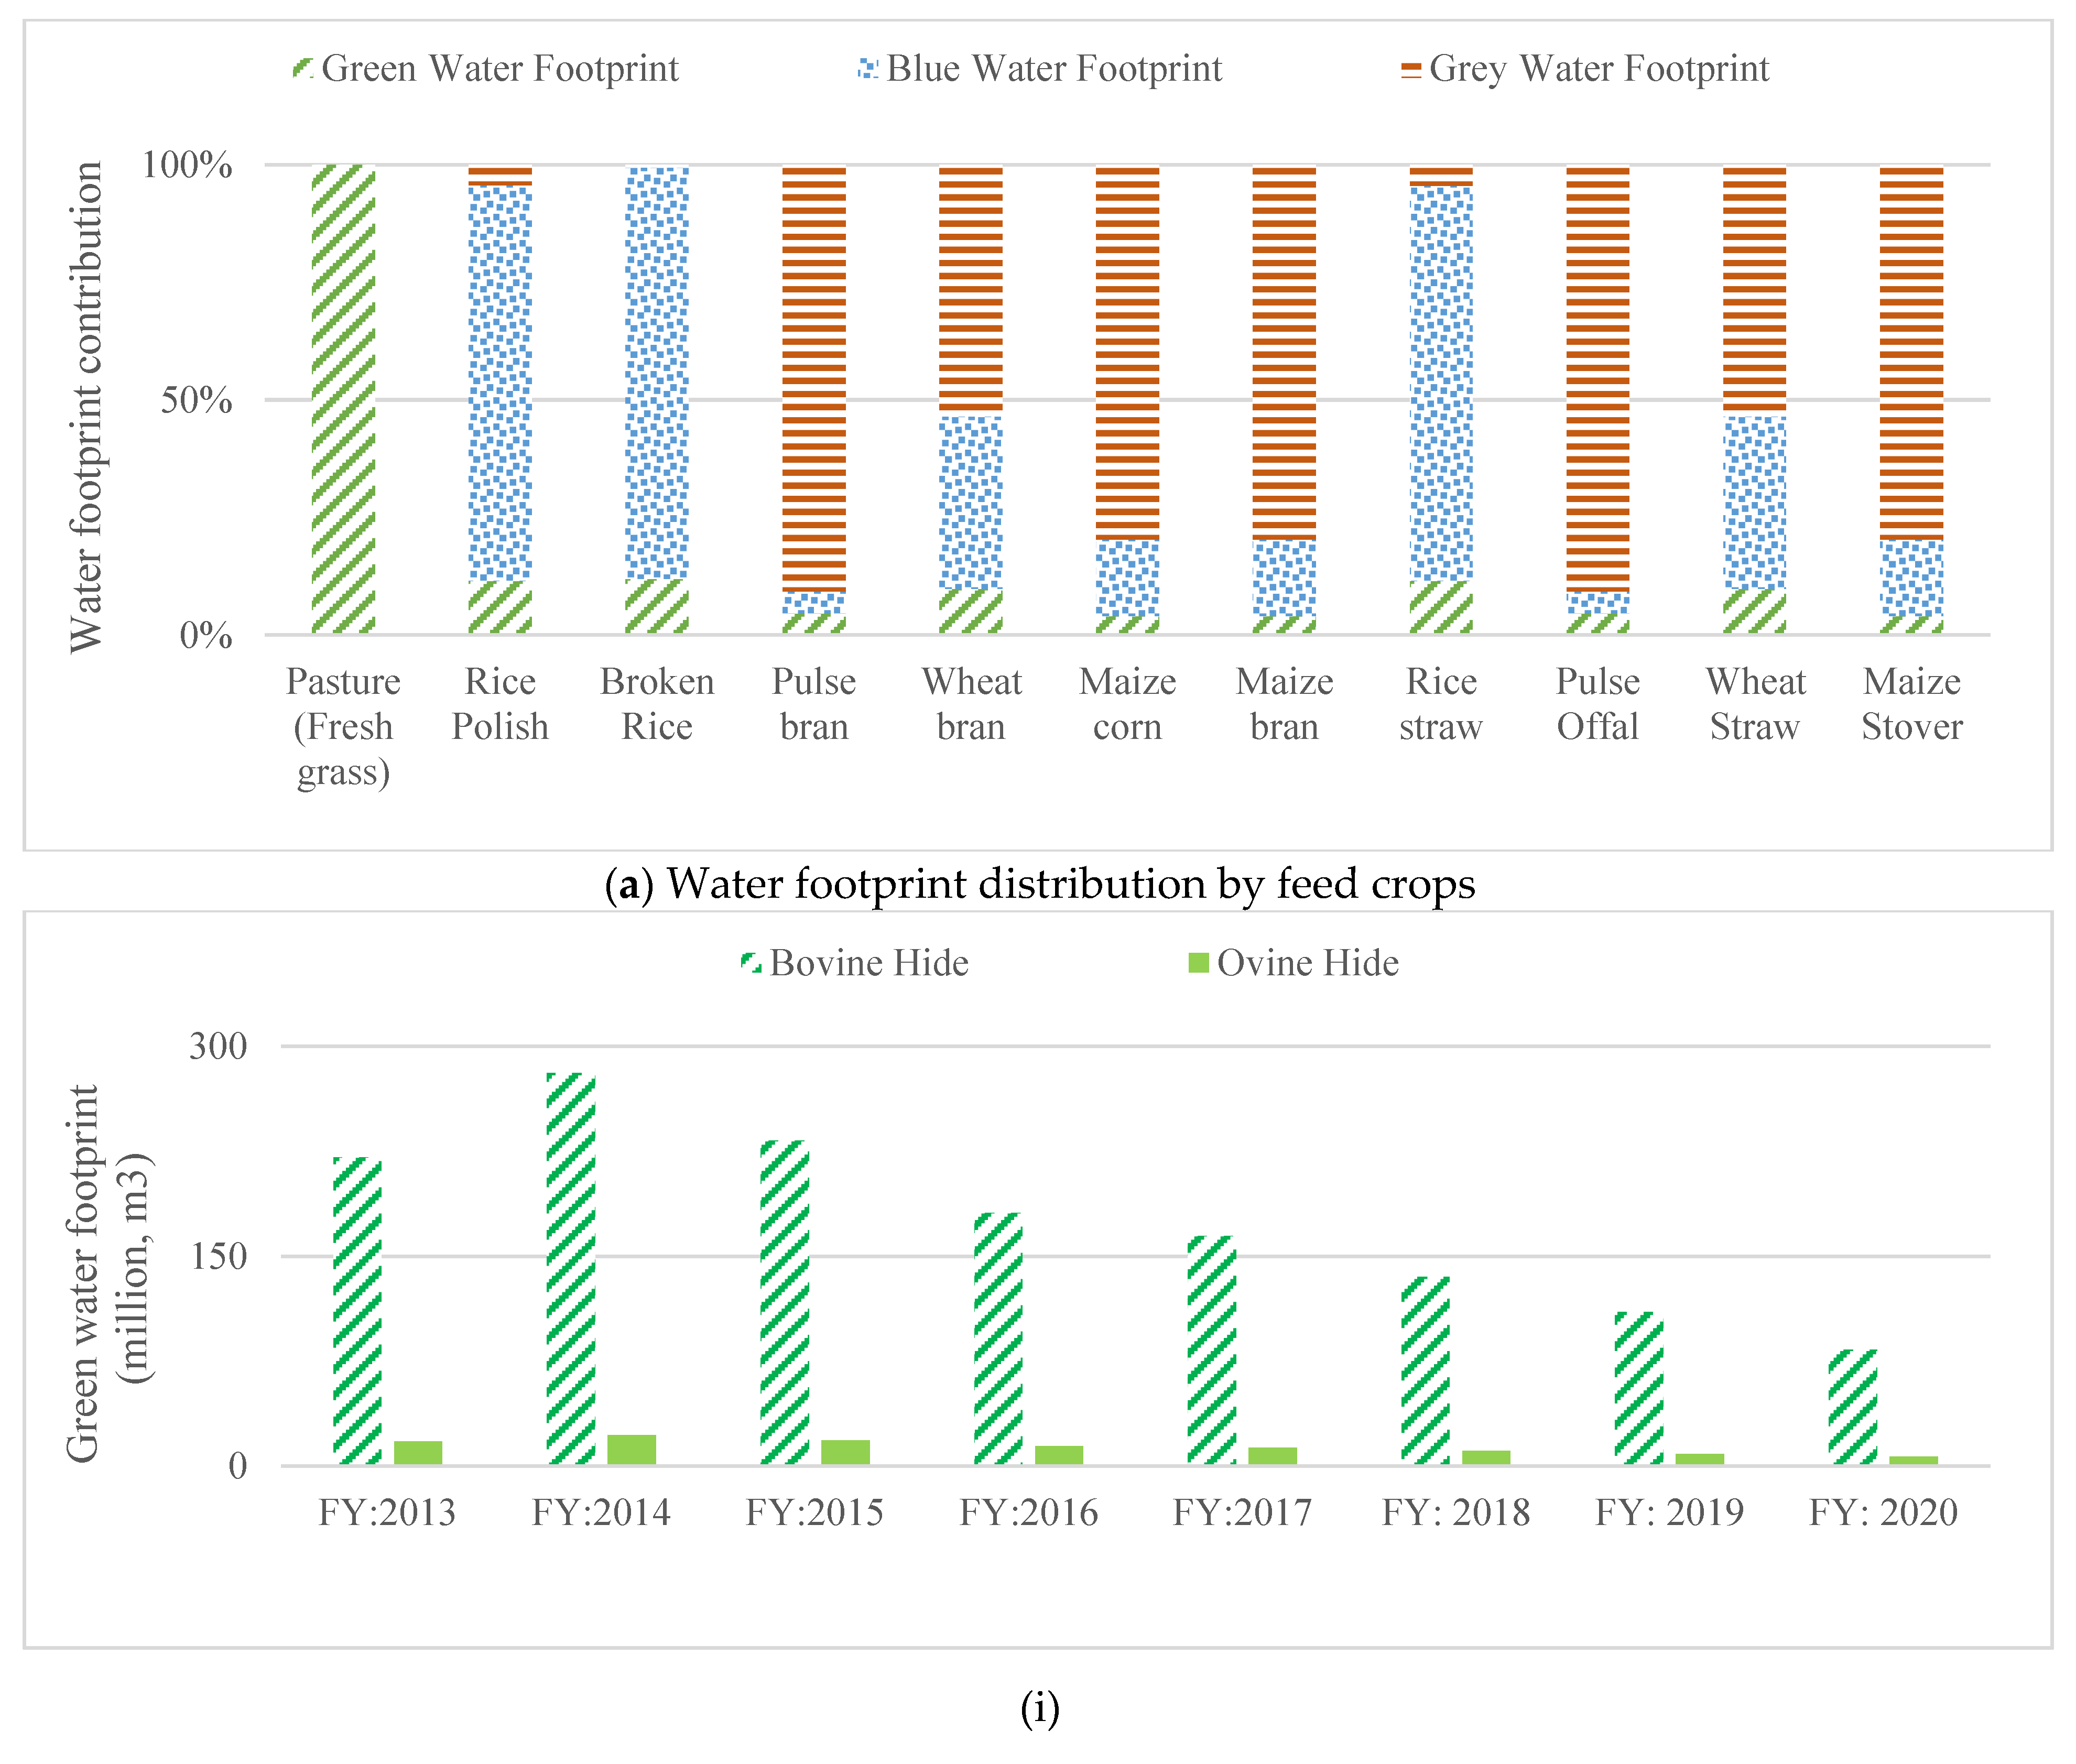
In Figure 3a pasture, the main feed crop of bovine and ovine in Bangladesh has the green water footprint 296 m3/ton. Pasture does not have any blue and grey water footprint as in Bangladesh grassland mainly depends on rainwater. Rice straw is another main feed crop for cattle and buffaloes in Bangladesh. As rice is main food in Bangladesh rice is easily available. Rice straw has green water footprint 11.32 m3/ton, blue water footprint 82.67 m3/ton and grey water footprint 0.43 m3/ton (Figure 3a). Rice polish is a byproduct of rice obtained in the milling operations. It is also important feed ingredient for cattle and buffaloes in Bangladesh. Rice polish has the green water footprint 29.11 m3/ton, blue water footprint 212.62 m3/ton and grey water footprint 11.02 m3/ton. It has low green and grey water footprint. Broken rice is the fragment of rice grain. It is also an important feed ingredient. It has green water footprint 85.05 m3/ton, blue water footprint 621 m3/ton and very negligible grey water footprint. It has high blue water footprint explains its surface water consumption during rice cultivation. Wheat straw is the hard-outer layer of wheat kernel which is jam-packed with various nutrients and fibers so it also very popular feed ingredient for beef cattle in Bangladesh. It has green water footprint 174 m3/ton, blue water footprint 650 m3/ton and grey water footprint 947 m3/ton (Figure 3a).
Wheat bran has green water footprint 196 m3/ton, blue water footprint 731 m3/ton and grey water footprint 1065 m3/ton. Grey water footprint is very high for wheat cultivation method used in Bangladesh. Maize corn is important feed crop for cattle as it adds nutritional value for farming animals. It has green water footprint 17.7 m3/ton, blue water footprint 71 m3/ton and grey water footprint 346 m3/ton. Maize bran has green water footprint 221 m3/ton, blue water footprint 887 m3/ton and grey water footprint 4330 m3/ton. It has again higher grey water footprint and it is probably higher than rice polish (bran) and wheat bran. Maize stover has green water footprint 8.85 m3/ton, blue water footprint 35.5 m3/ton and grey water footprint 173 m3/ton. Pulse bran has green water footprint 494 m3/ton, blue water footprint 501 m3/ton and grey water footprint 9748 m3/ton. Pulse bran has the highest grey water footprint compared with rice residue, wheat bran, maize bran or other by products. Pulse offal has green water footprint 4.12 m3/ton, blue water footprint 4.18 m3/ton and grey water footprint 81.26 m3/ton (Figure 3a).
3.2.2. Water Footprint of Bovine Hides and Skins
Bovine hide is most common in Bangladesh local market. It has green water footprint 6840 m3/ton, blue water footprint 6031 m3/ton and grey water footprint 11,689 m3/ton (Figure 3b). It also means per kg hide green water footprint 6840 L, blue water footprint 6031 L, and grey water footprint 11,689 L and total water footprint 24,560 L. Ovine skin includes both goatskin, sheepskin and lambskin in Bangladesh; among those three types, goat skin is highly available in domestic sources. It has green water footprint 3113 m3/ton, blue water footprint 1308 m3/ton and grey water footprint 3167 m3/ton (Figure 3b).
3.3. Water Footprint of Leather Processing Stages
3.3.1. Water Footprint of Beam House Operations
3.3.2. Water Footprint of Tan Yard Operations
3.3.3. Water Footprint of Post Tanning Operations
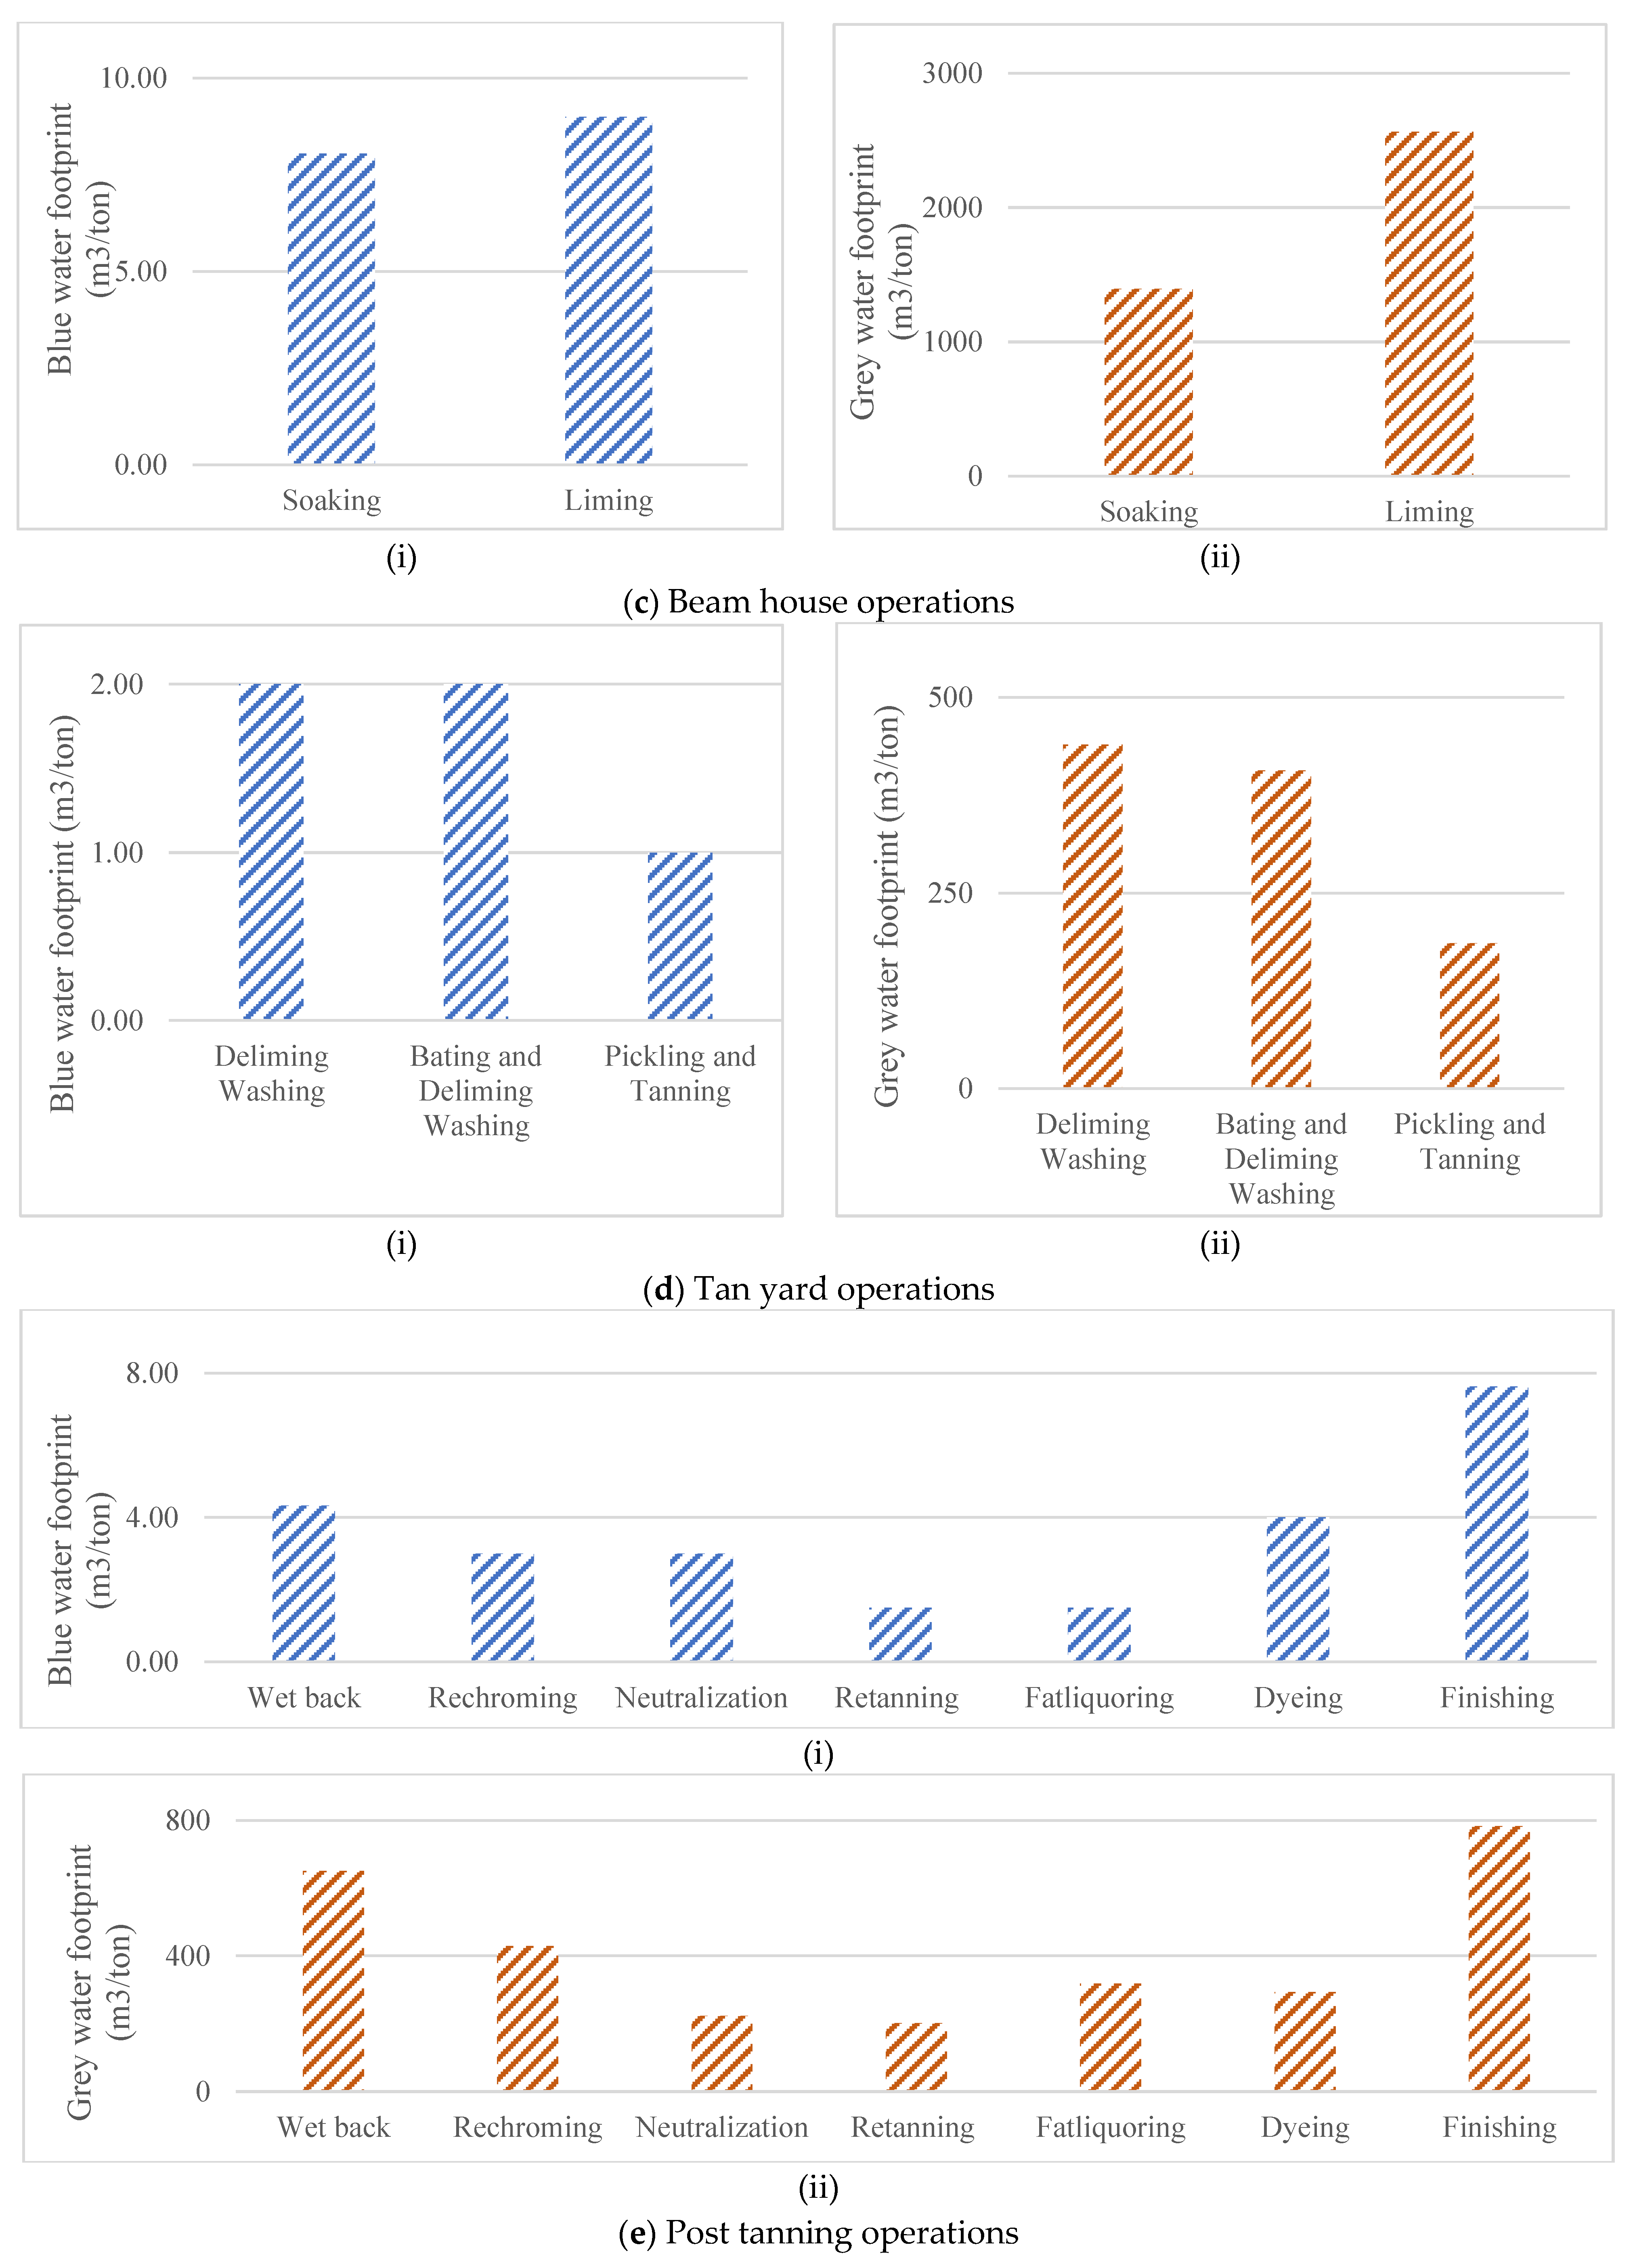
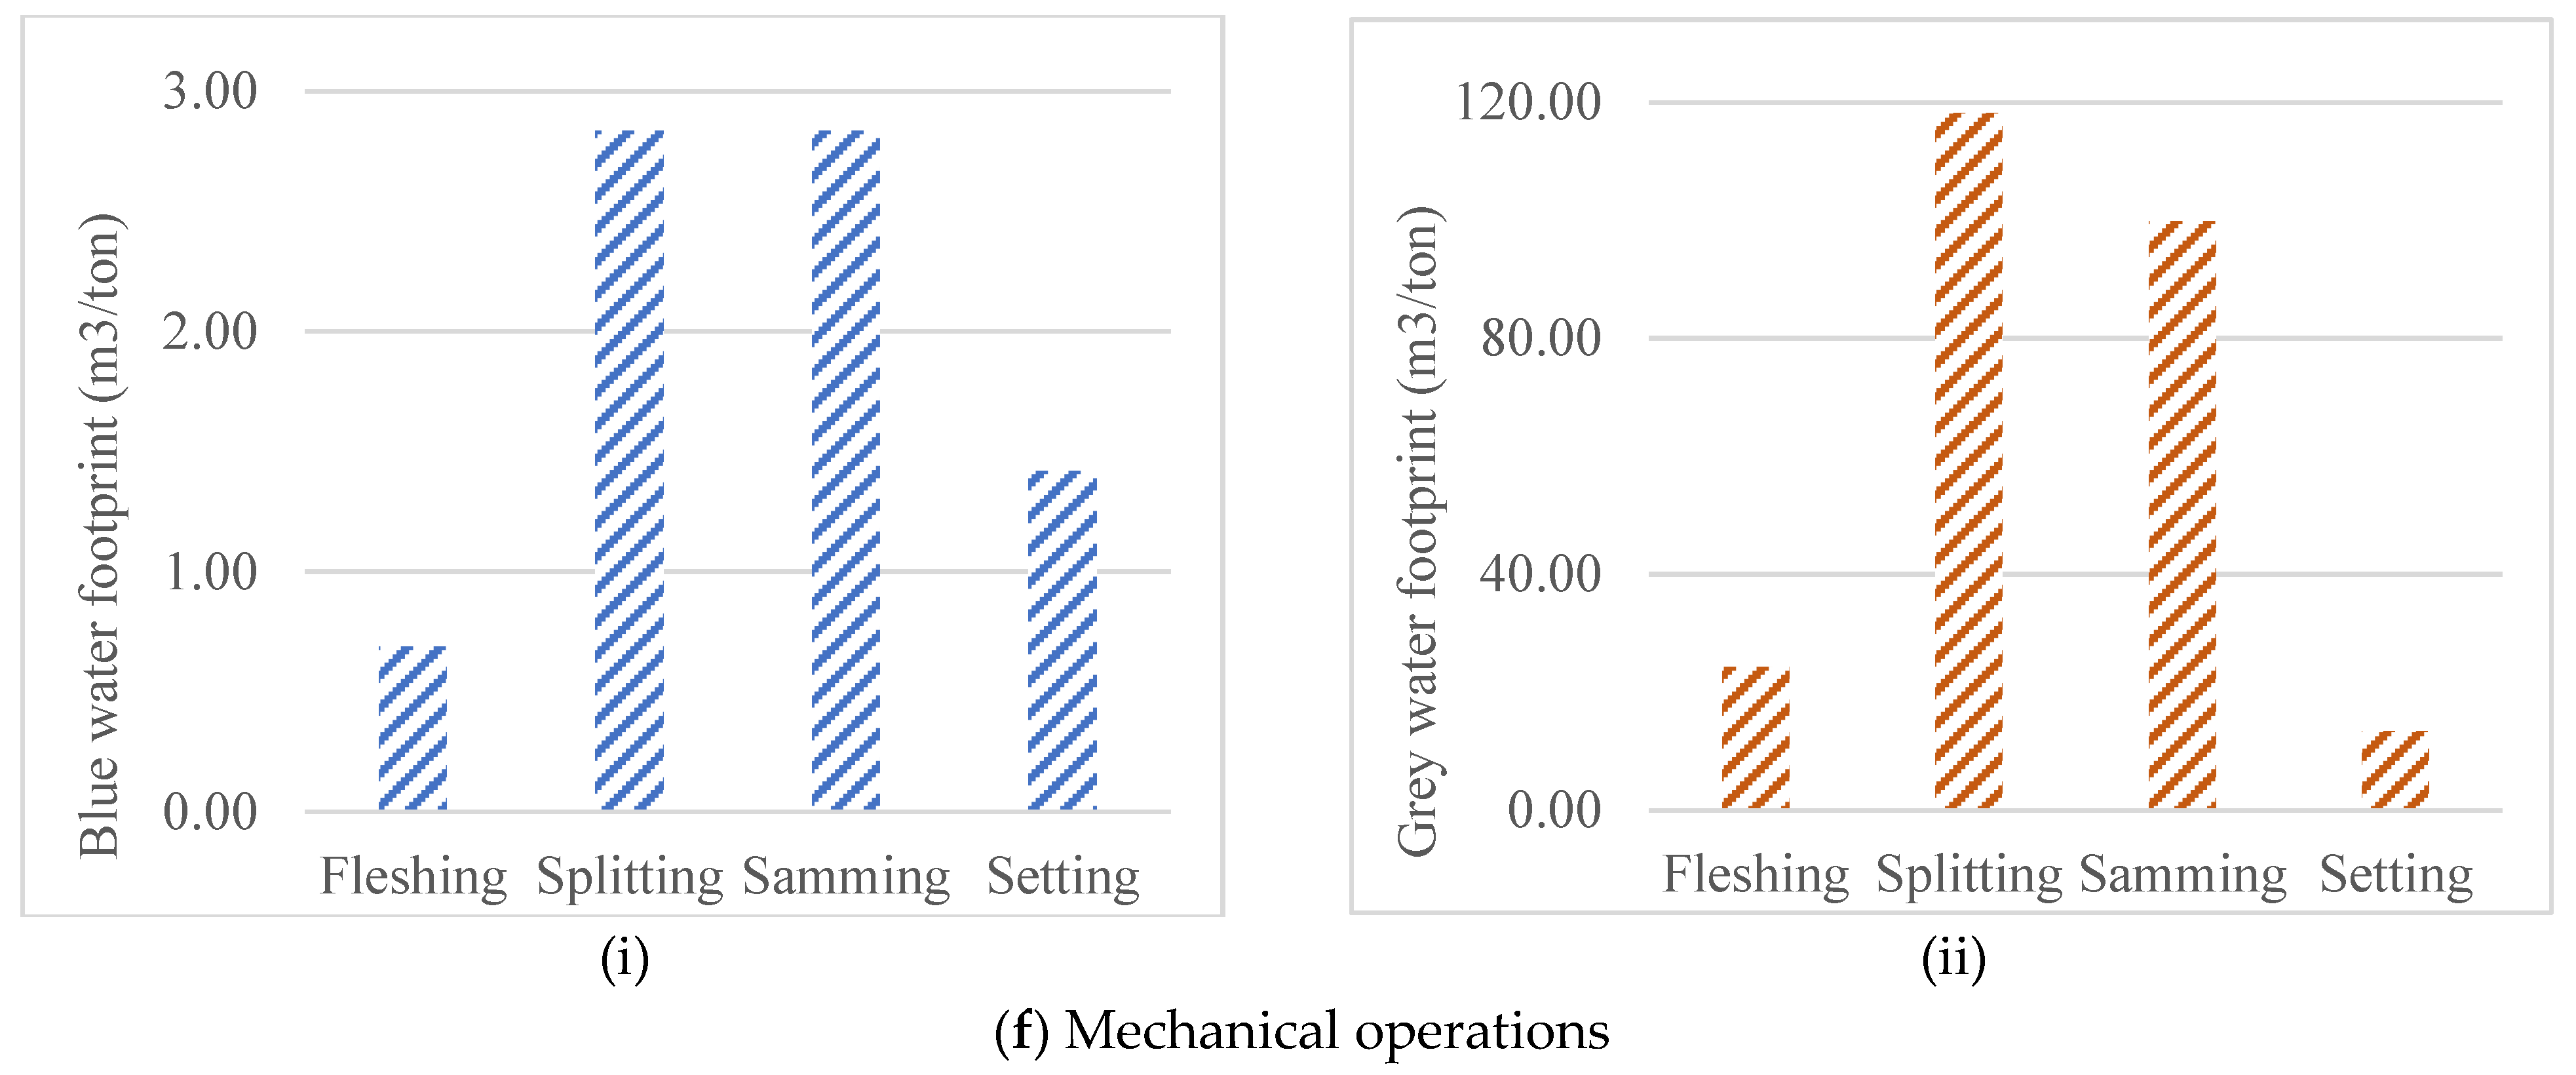
In post tanning operations wet back has 4.33 m3/ton, rechroming has 3.00 m3/ton, neutralization 3.00 m3/ton, retanning has 1.50 m3/ton, fatliqouring has 1.5 m3/ton, dyeing has 4.00 m3/ton and finishing has 7.63 m3/ton blue water footprint (Figure 3e). Wet back has 650 m3/ton, rechroming has 430 m3/ton, neutralization 223 m3/ton, retanning has 201 m3/ton, fatliqouring has 319 m3/ton, dyeing has 294 m3/ton and finishing has 783 m3/ton grey water footprint (Figure 3e).
3.3.4. Water Footprint of Mechanical Operations
Leather production has many mechanical operations in which water involves in fleshing, splitting, samming and setting machines. Therefore, fleshing, splitting, samming and setting machines has 0.69, 2.84, 2.84 and 1.42 m3/ton blue water footprint, respectively, and grey water footprint 24.34, 118, 99.98 and 13.42 m3/ton, respectively (Figure 3f).
3.4. Water Footprint of Products
3.4.1. Water Footprint of Wet Blue Leather
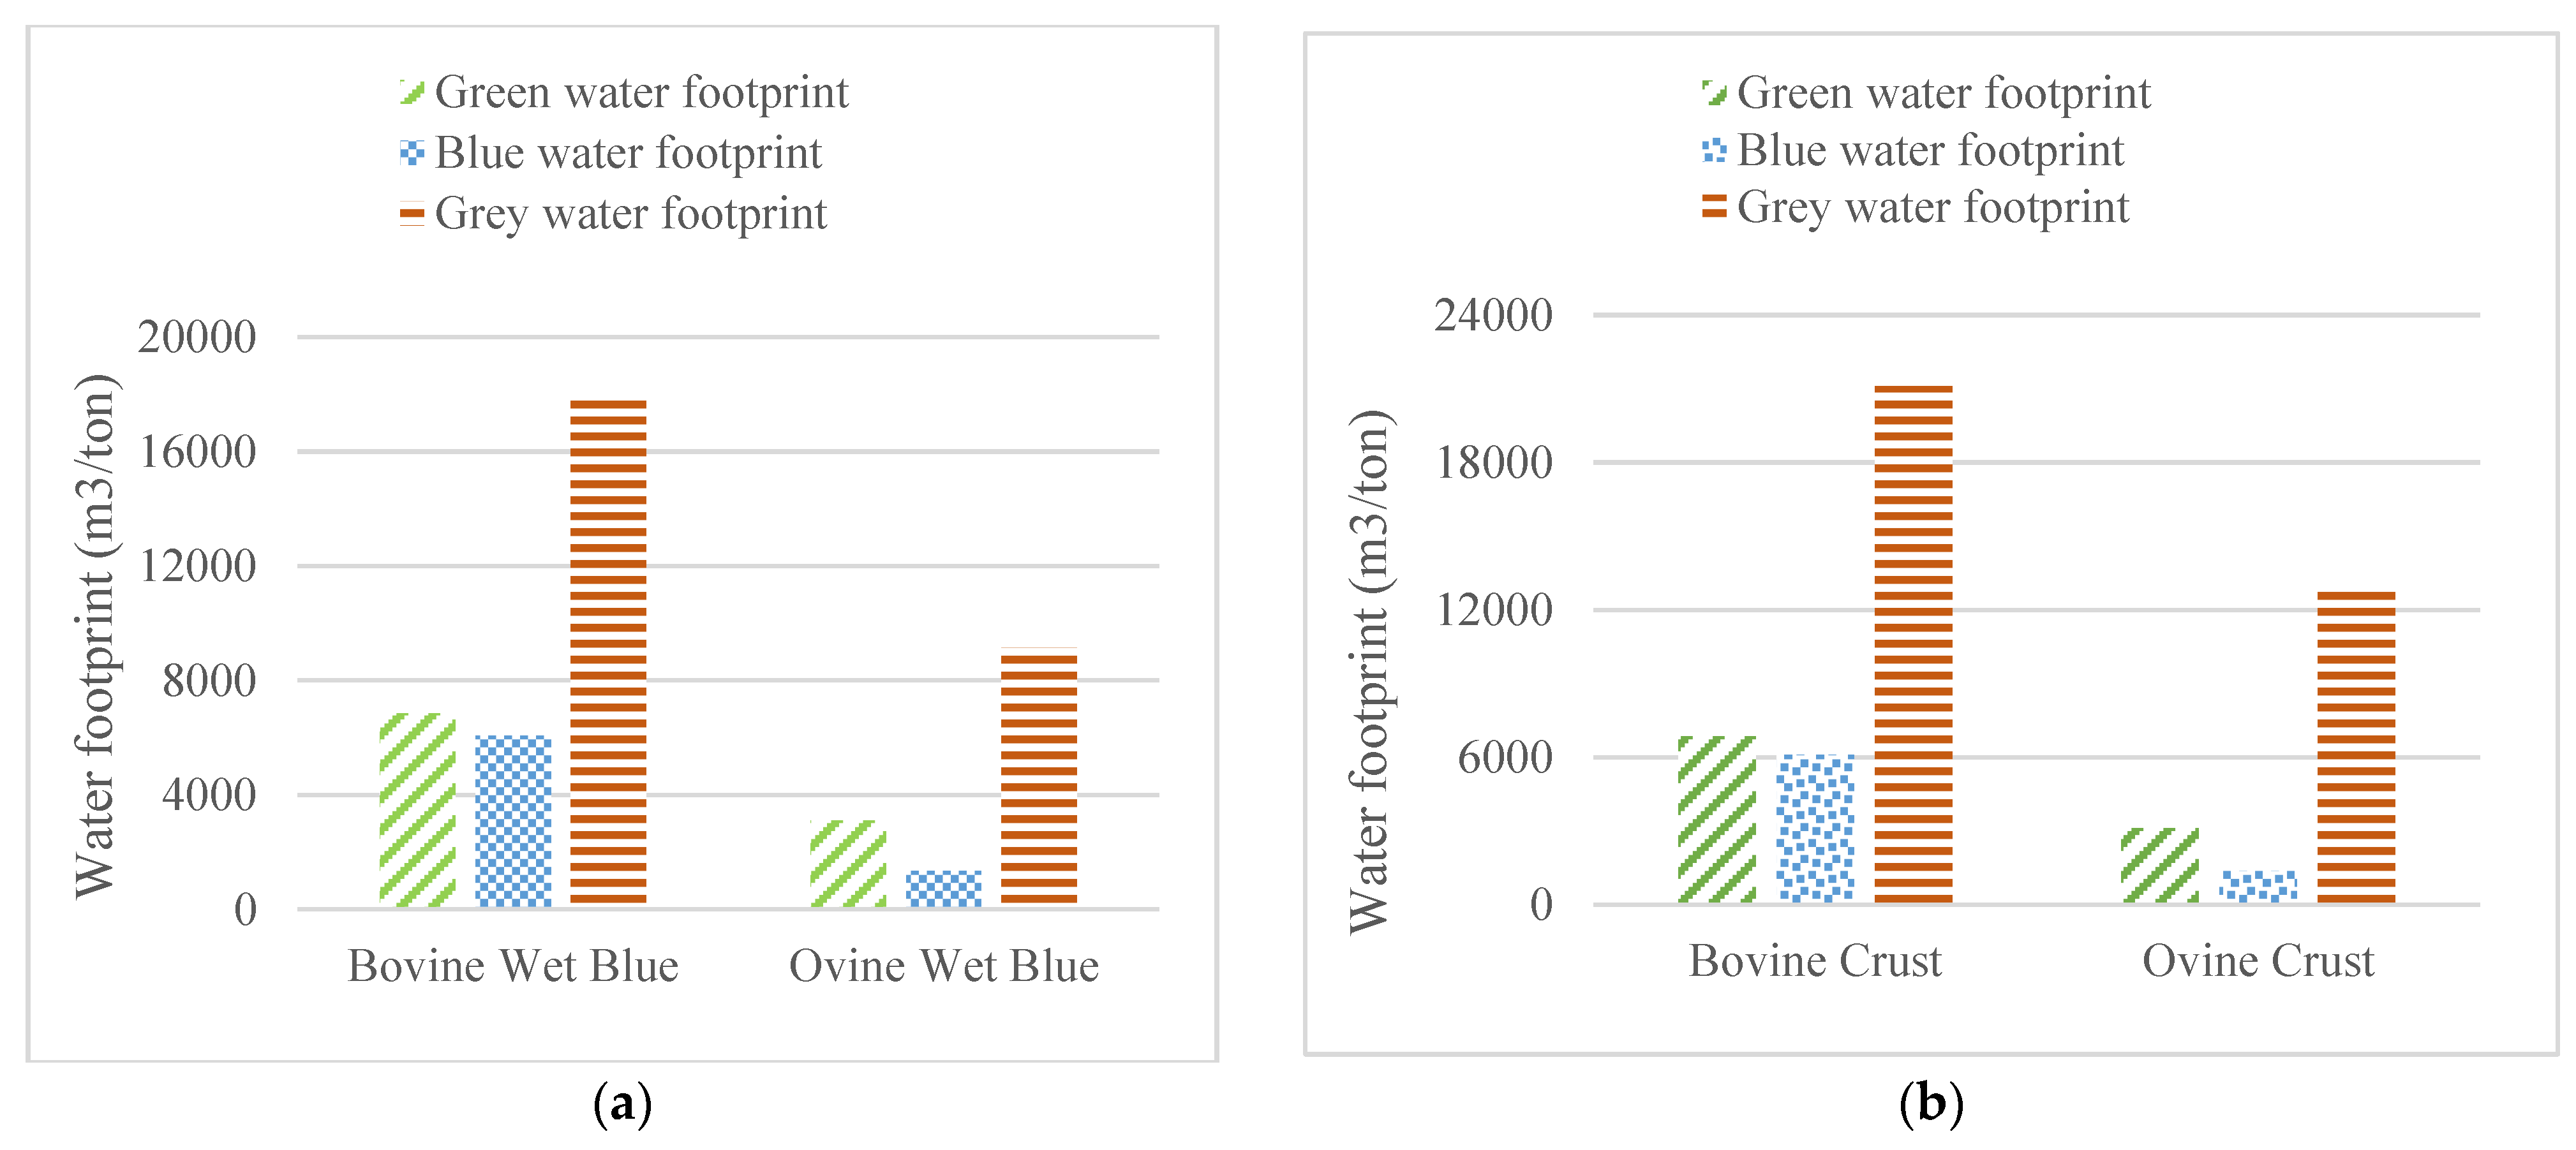
Wet blue leather from bovine hides has green water footprint 6840 m3/ton, blue water footprint 6062 m3/ton and grey water footprint 17,770 m3/ton. Wet blue leather from ovine hides has green water footprint 3113 m3/ton, blue water footprint 1373 m3/ton and grey water footprint 9149 m3/ton (Figure 4a).
3.4.2. Water Footprint of Crust Leather
Crust leather from bovine hides has green water footprint 6840 m3/ton, blue water footprint 6088 m3/ton and grey water footprint 21,121 m3/ton. Crust leather from ovine hides has green water footprint 3113 m3/ton, blue water footprint 1373 m3/ton and grey water footprint 12,885 m3/ton (Figure 4b).
3.4.3. Water Footprint of Finished Leather and Others
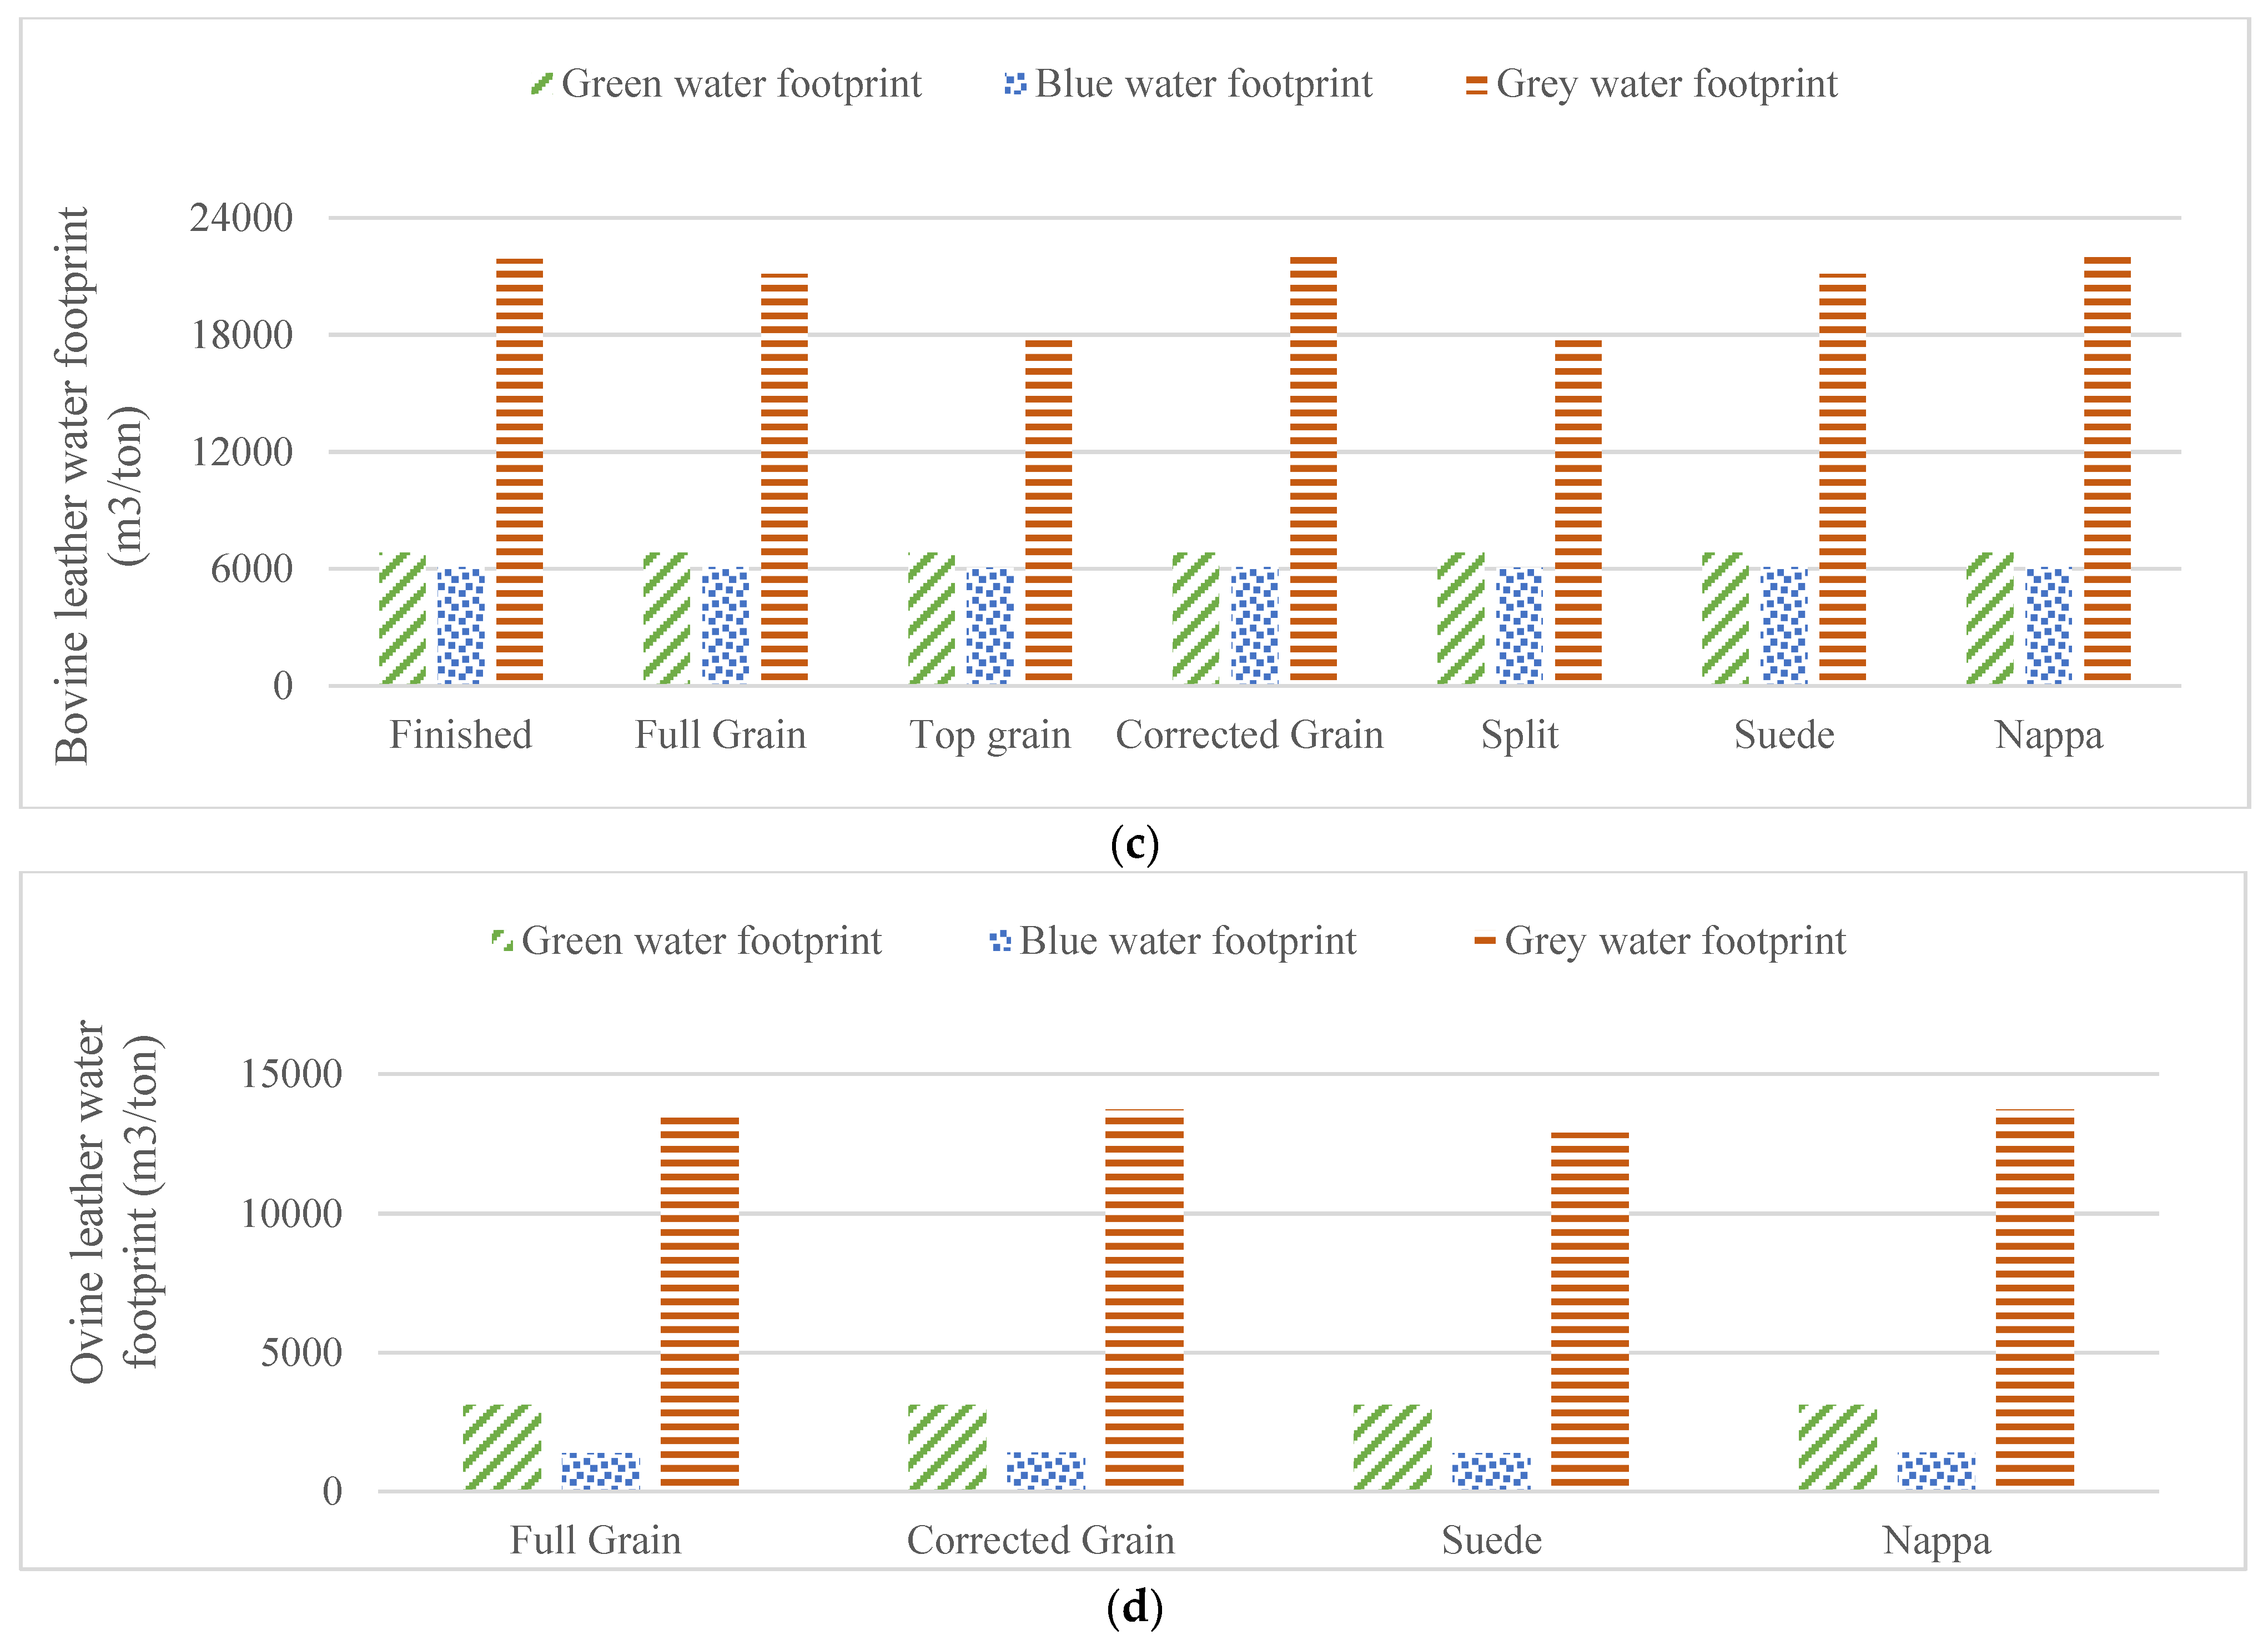
Finished leather from bovine hides has green, blue and grey water footprints 6840 m3/ton, 6096 m3/ton and 21,904 m3/ton, respectively. Full grain leather from bovine hides has green, blue and grey water footprints 6840 m3/ton, 6088 m3/ton and 21,121 m3/ton, respectively. Top grain leather from bovine hides has green, blue and grey water footprints 6840 m3/ton, 6062 m3/ton and 17,771 m3/ton, respectively. Corrected leather from bovine hides has green, blue and grey water footprints 6840 m3/ton, 6106 m3/ton and 21,971 m3/ton, respectively. Split leather from bovine hides has green, blue and grey water footprints 6840 m3/ton, 6062 m3/ton and 17,771 m3/ton, respectively. Suede leather from bovine hides has green, blue and grey water footprints 6840 m3/ton, 6088 m3/ton and 21,121 m3/ton, respectively. Nappa leather from bovine hides has green, blue and grey water footprints 6840 m3/ton, 6106 m3/ton and 21,971 m3/ton, respectively (Figure 4c).
Finished Full grain leather from ovine skins has green water footprint 3113 m3/ton, blue water footprint 1381 m3/ton and grey water footprint 13,668 m3/ton. Corrected leather from ovine hides has green water footprint 3113 m3/ton, blue water footprint 1391 m3/ton and grey water footprint 13,735 m3/ton. Suede leather from ovine hides has green water footprint 3113 m3/ton, blue water footprint 1373 m3/ton and grey water footprint 12,885 m3/ton. Nappa leather from ovine hides green water footprint 3113 m3/ton, blue water footprint 1391 m3/ton and grey water footprint 13,735 m3/ton (Figure 4d).
4. Discussion
4.1. Pollution Load Assessment
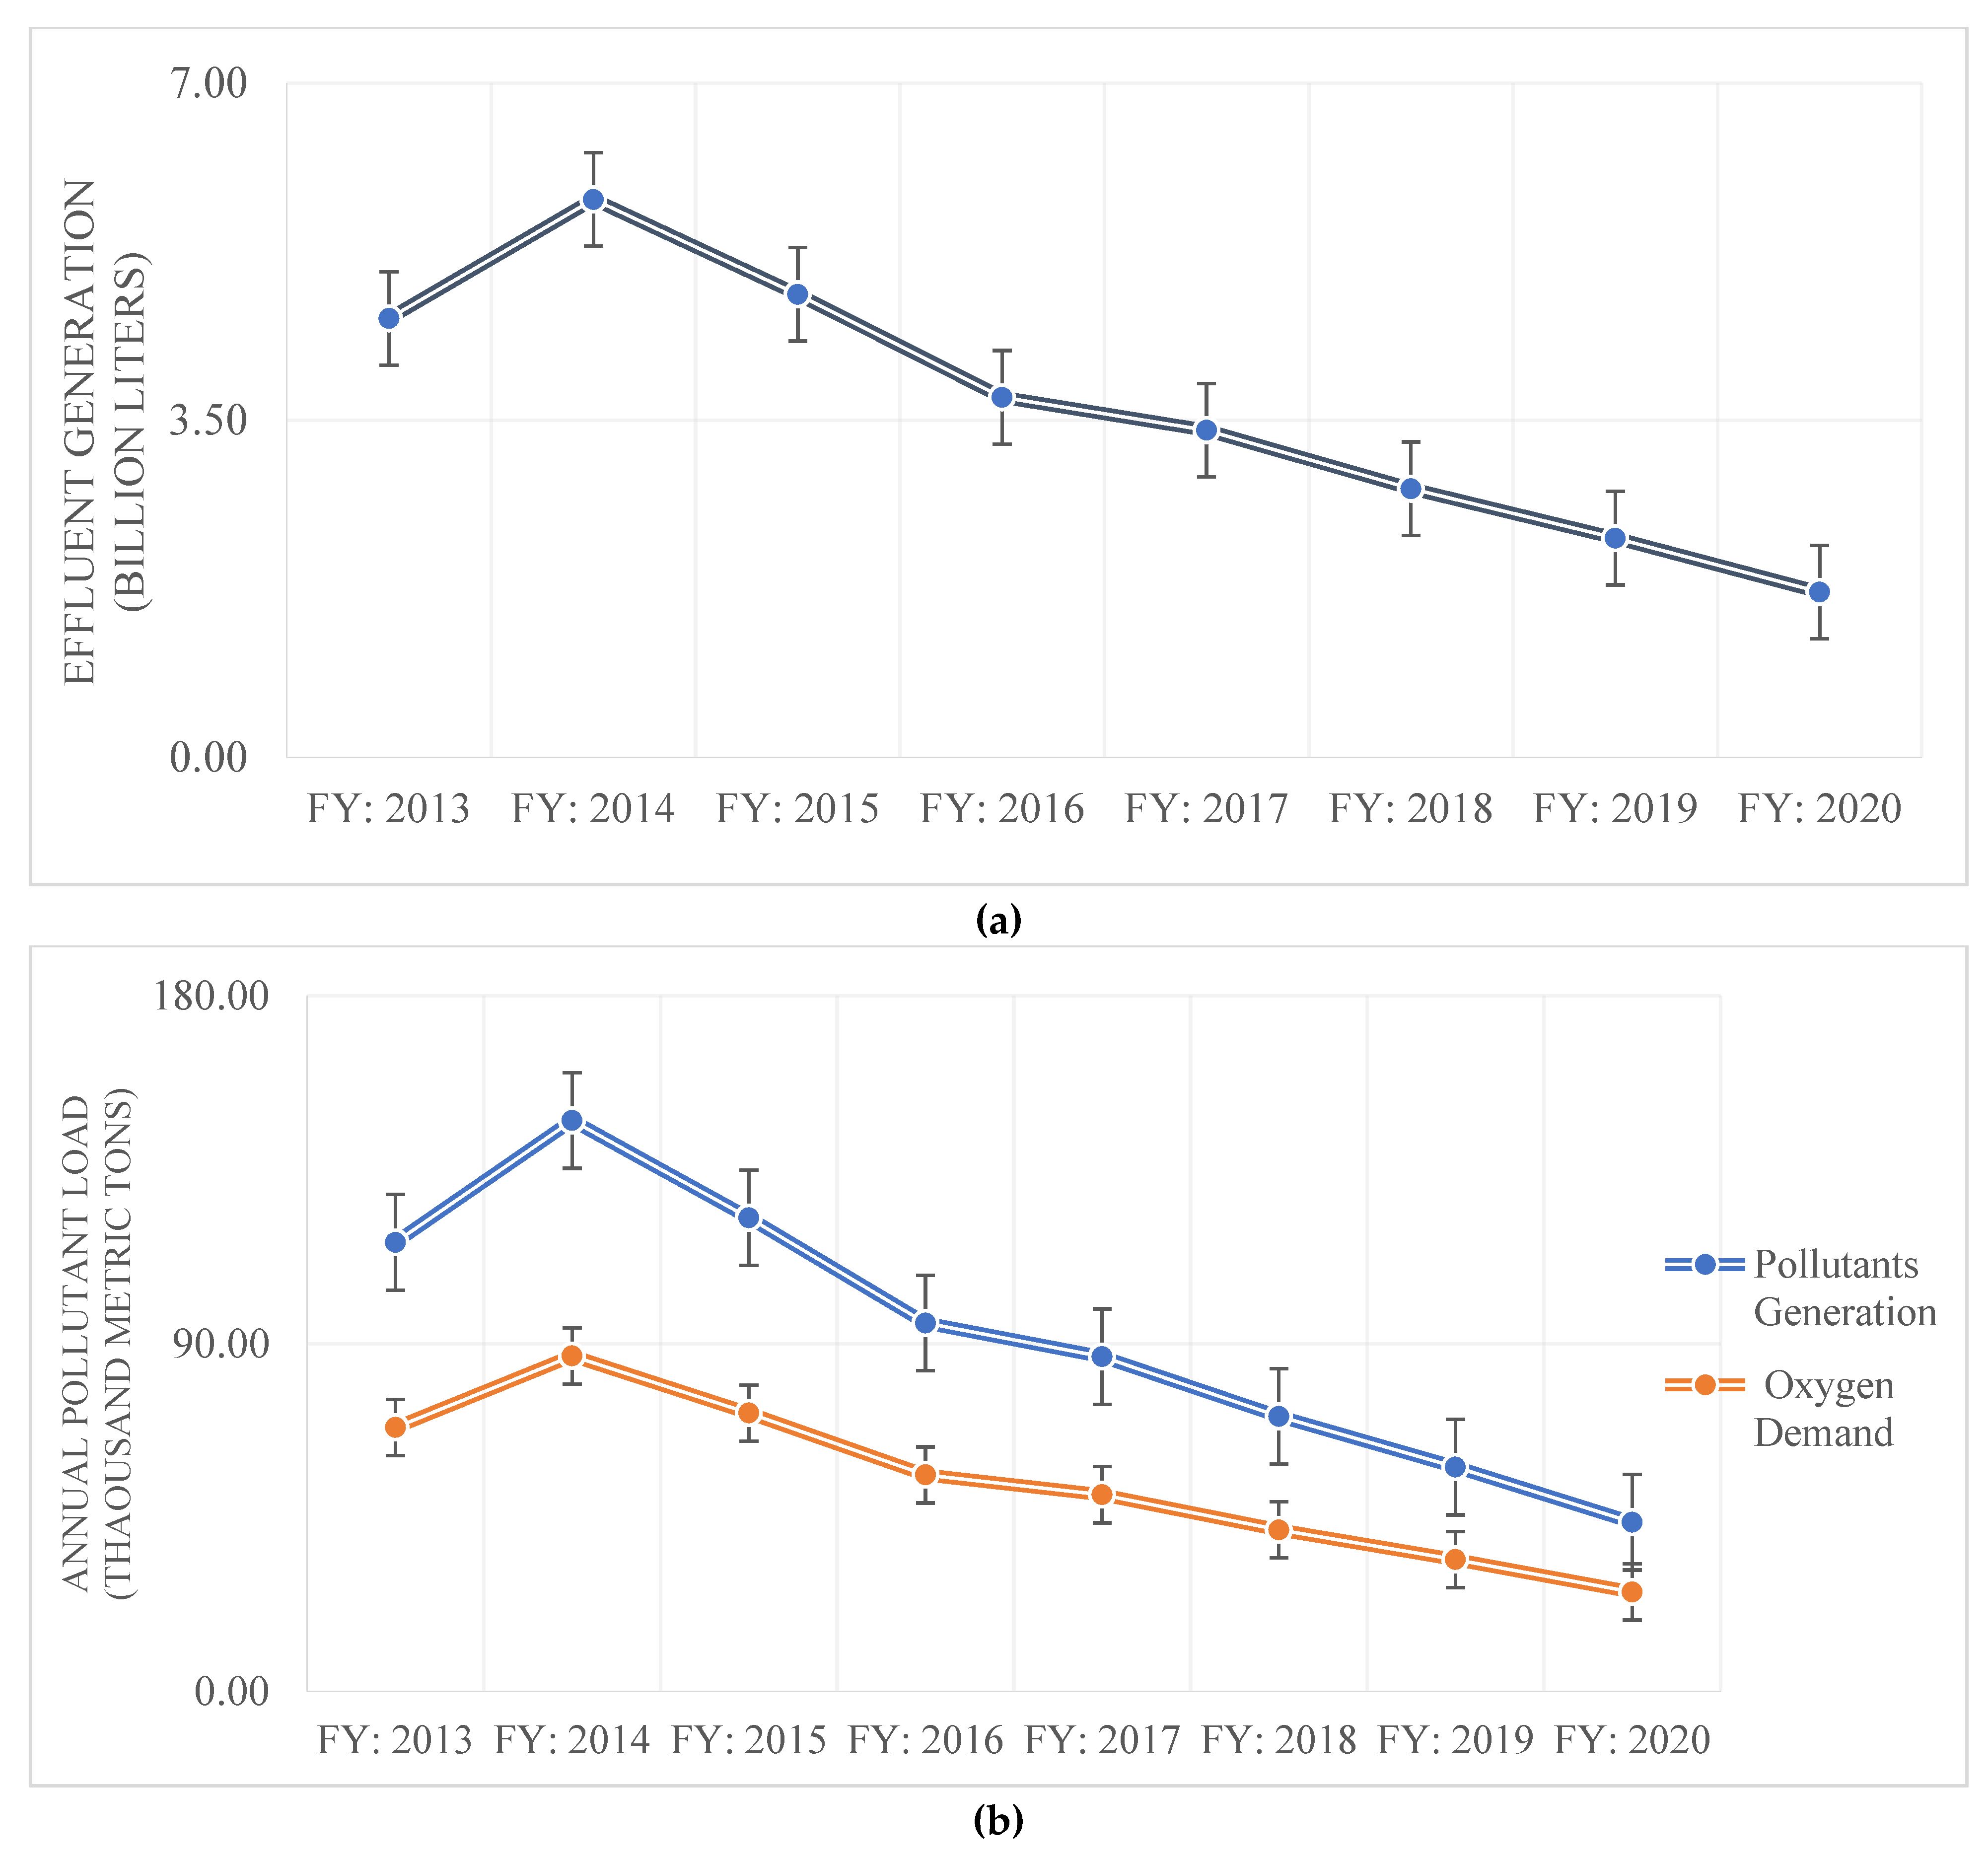
Approximately 30–35 m3 of effluent is generated per ton of raw hides/skins processed [45,46]. Beam house and tan yard operations generate about 15 m3/ton effluent (52%) and post tanning operations generate about 14.35 m3/ton effluent (48%). Almost 87% effluent is generated from beam house in wet blue production. However, the effluent generation depends on the nature of raw material, finished product and production processes applied [47,48,49,50]. The results show that about 3.58-billion-liter effluent generates from leather processing factories each year. The annual effluent generation and pollution load data have gone up in FY 2014 after that those have gone down till FY 2020 (Figure 5). The main reason is that the production slowed down between FY 2014 to FY 2020 for relocation and new Tannery Estate was under construction. The highest pollutant generation is found to be 148 thousand metric tons and oxygen demand 87 thousand metric tons in FY 14 (Figure 5).
4.2. Pollution Impact Assessment
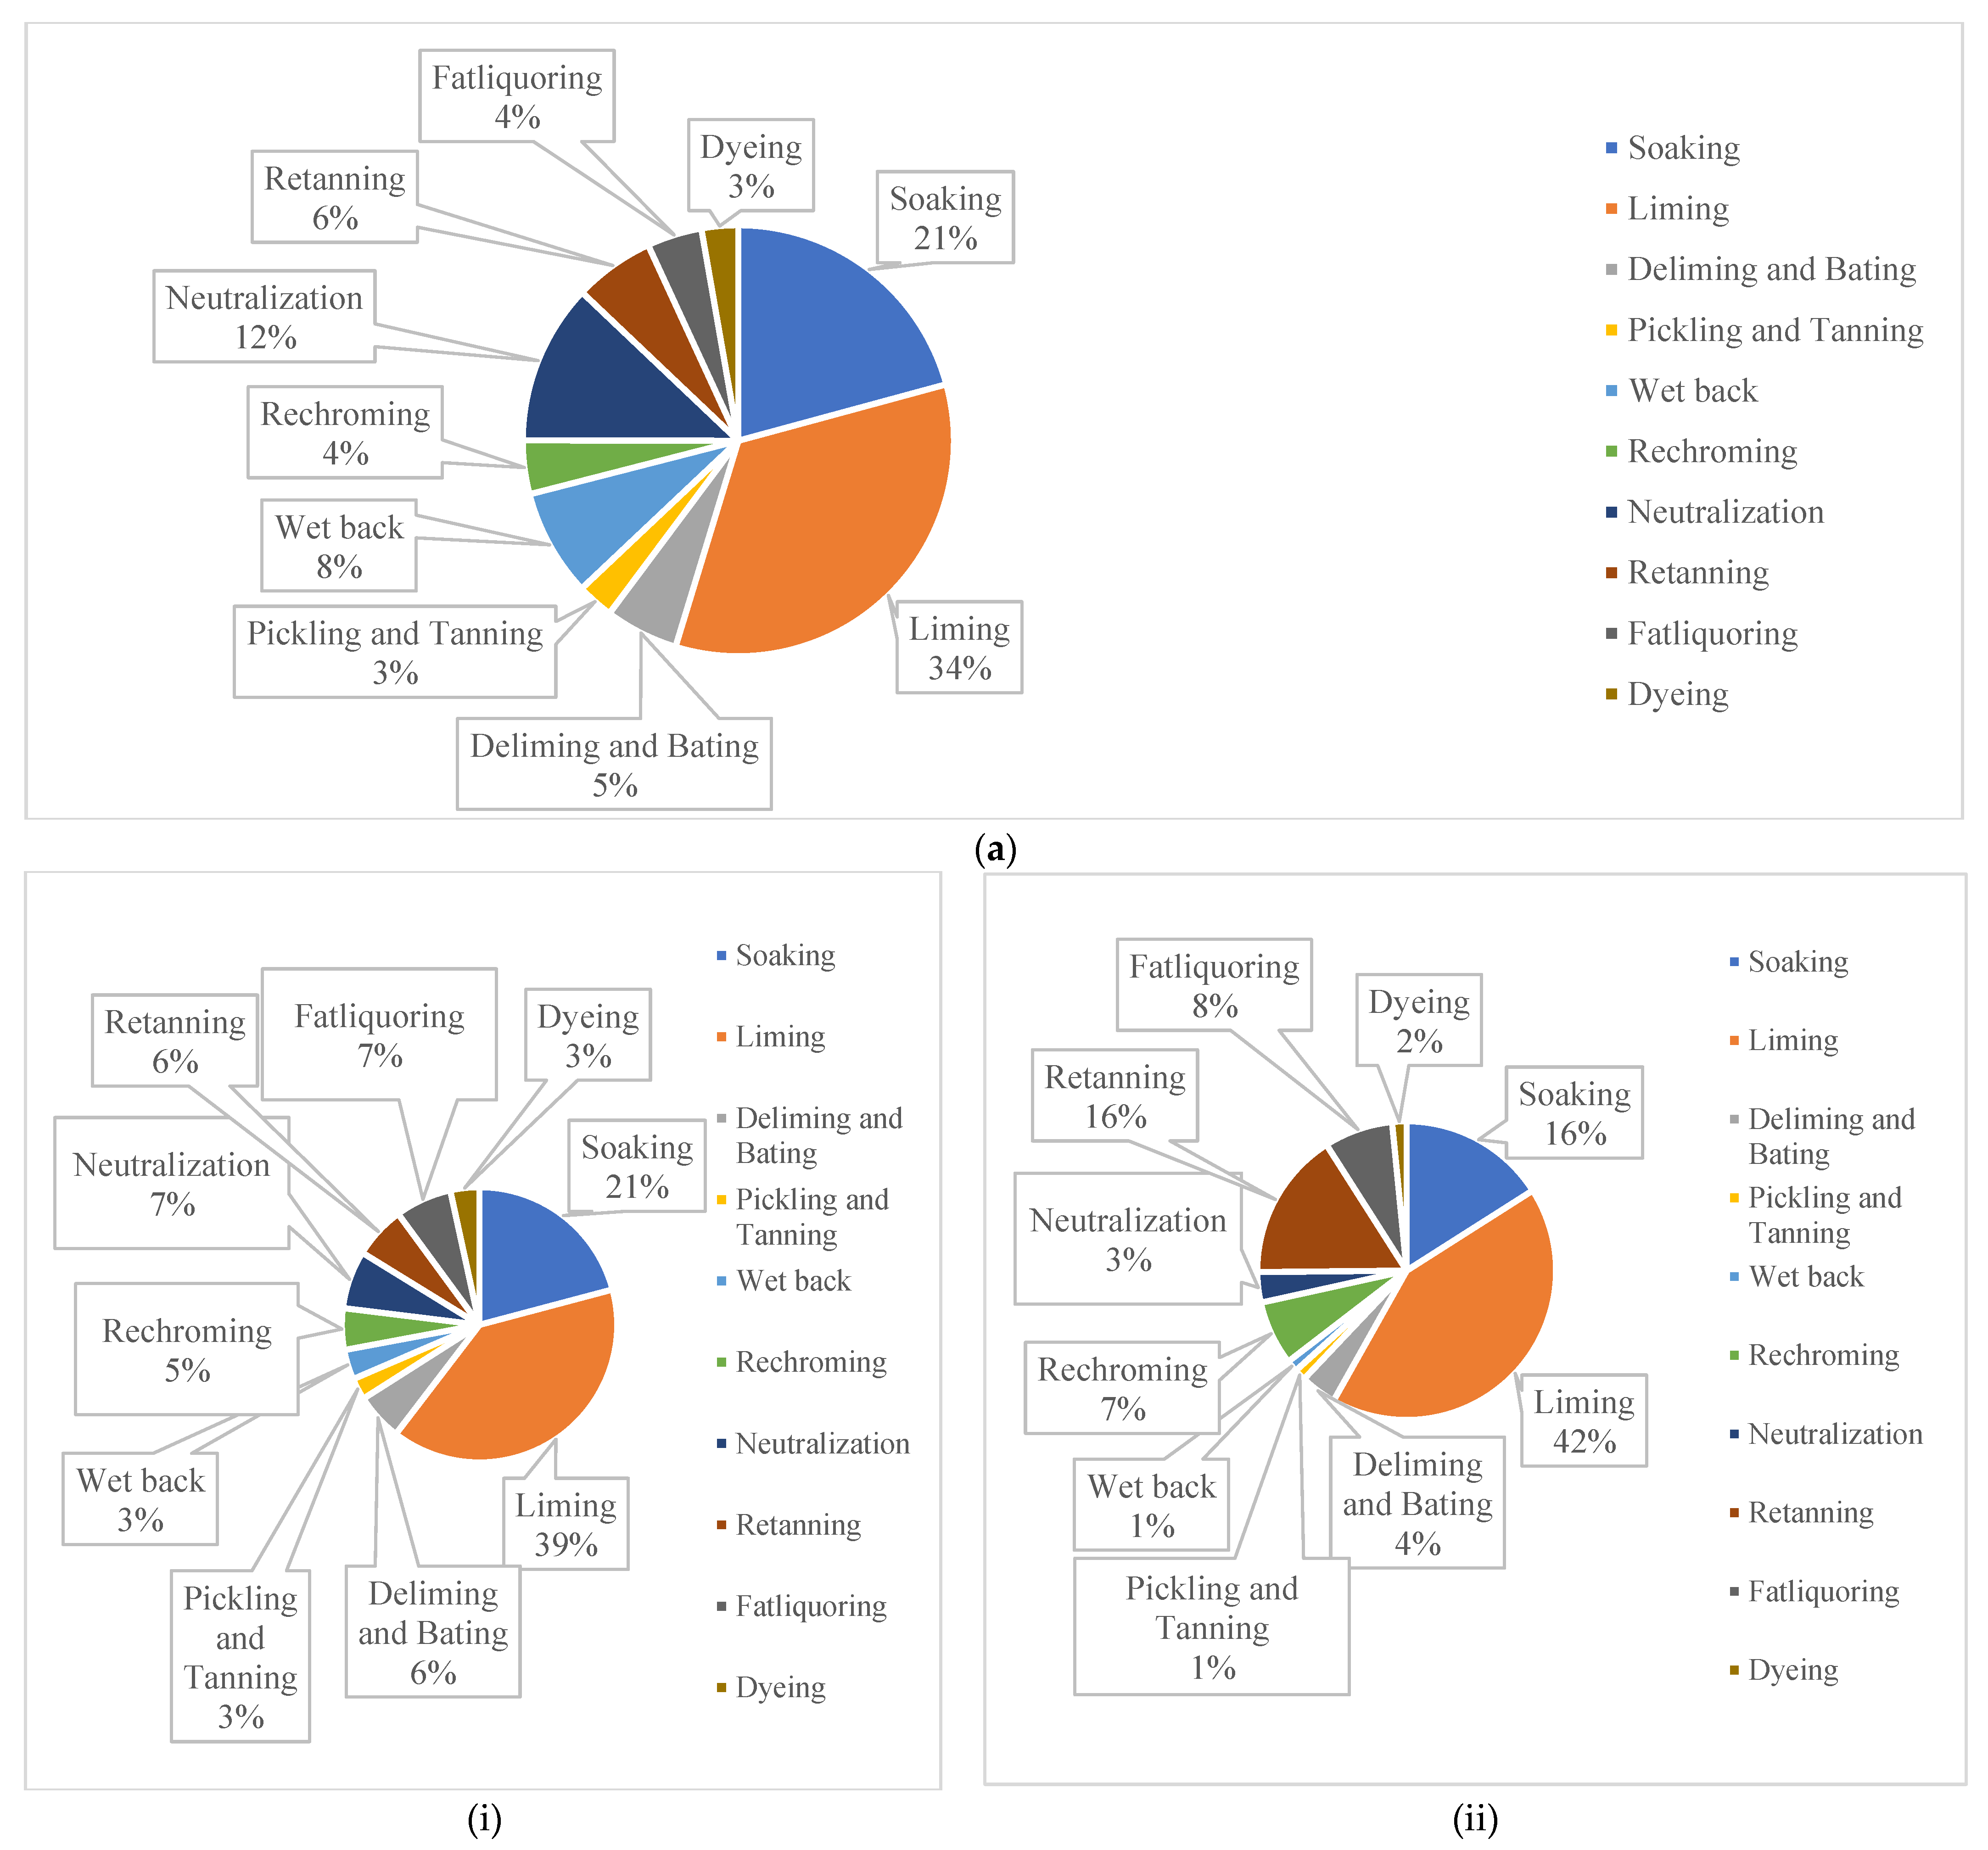
Leather processing effluent is a basic, dark brown colored waste having high COD, BOD, TDS, chromium (III) and phenolics with high pH and strong odor [4,5,51]. Effluent generates mostly from soaking (21%) and liming (34%) of cured or raw hide. Stages such as wet back (8%), retanning (6%) and neutralization (12%) also produce large amount of waste water. Other than that, dyeing (3%), fatliqouring (4%) and rechroming (4%) contributes less to effluent generation. Tan yard operations including deliming, bating and washing (5%), pickling and tanning (3%) produce less amount of effluent (Figure 6a).
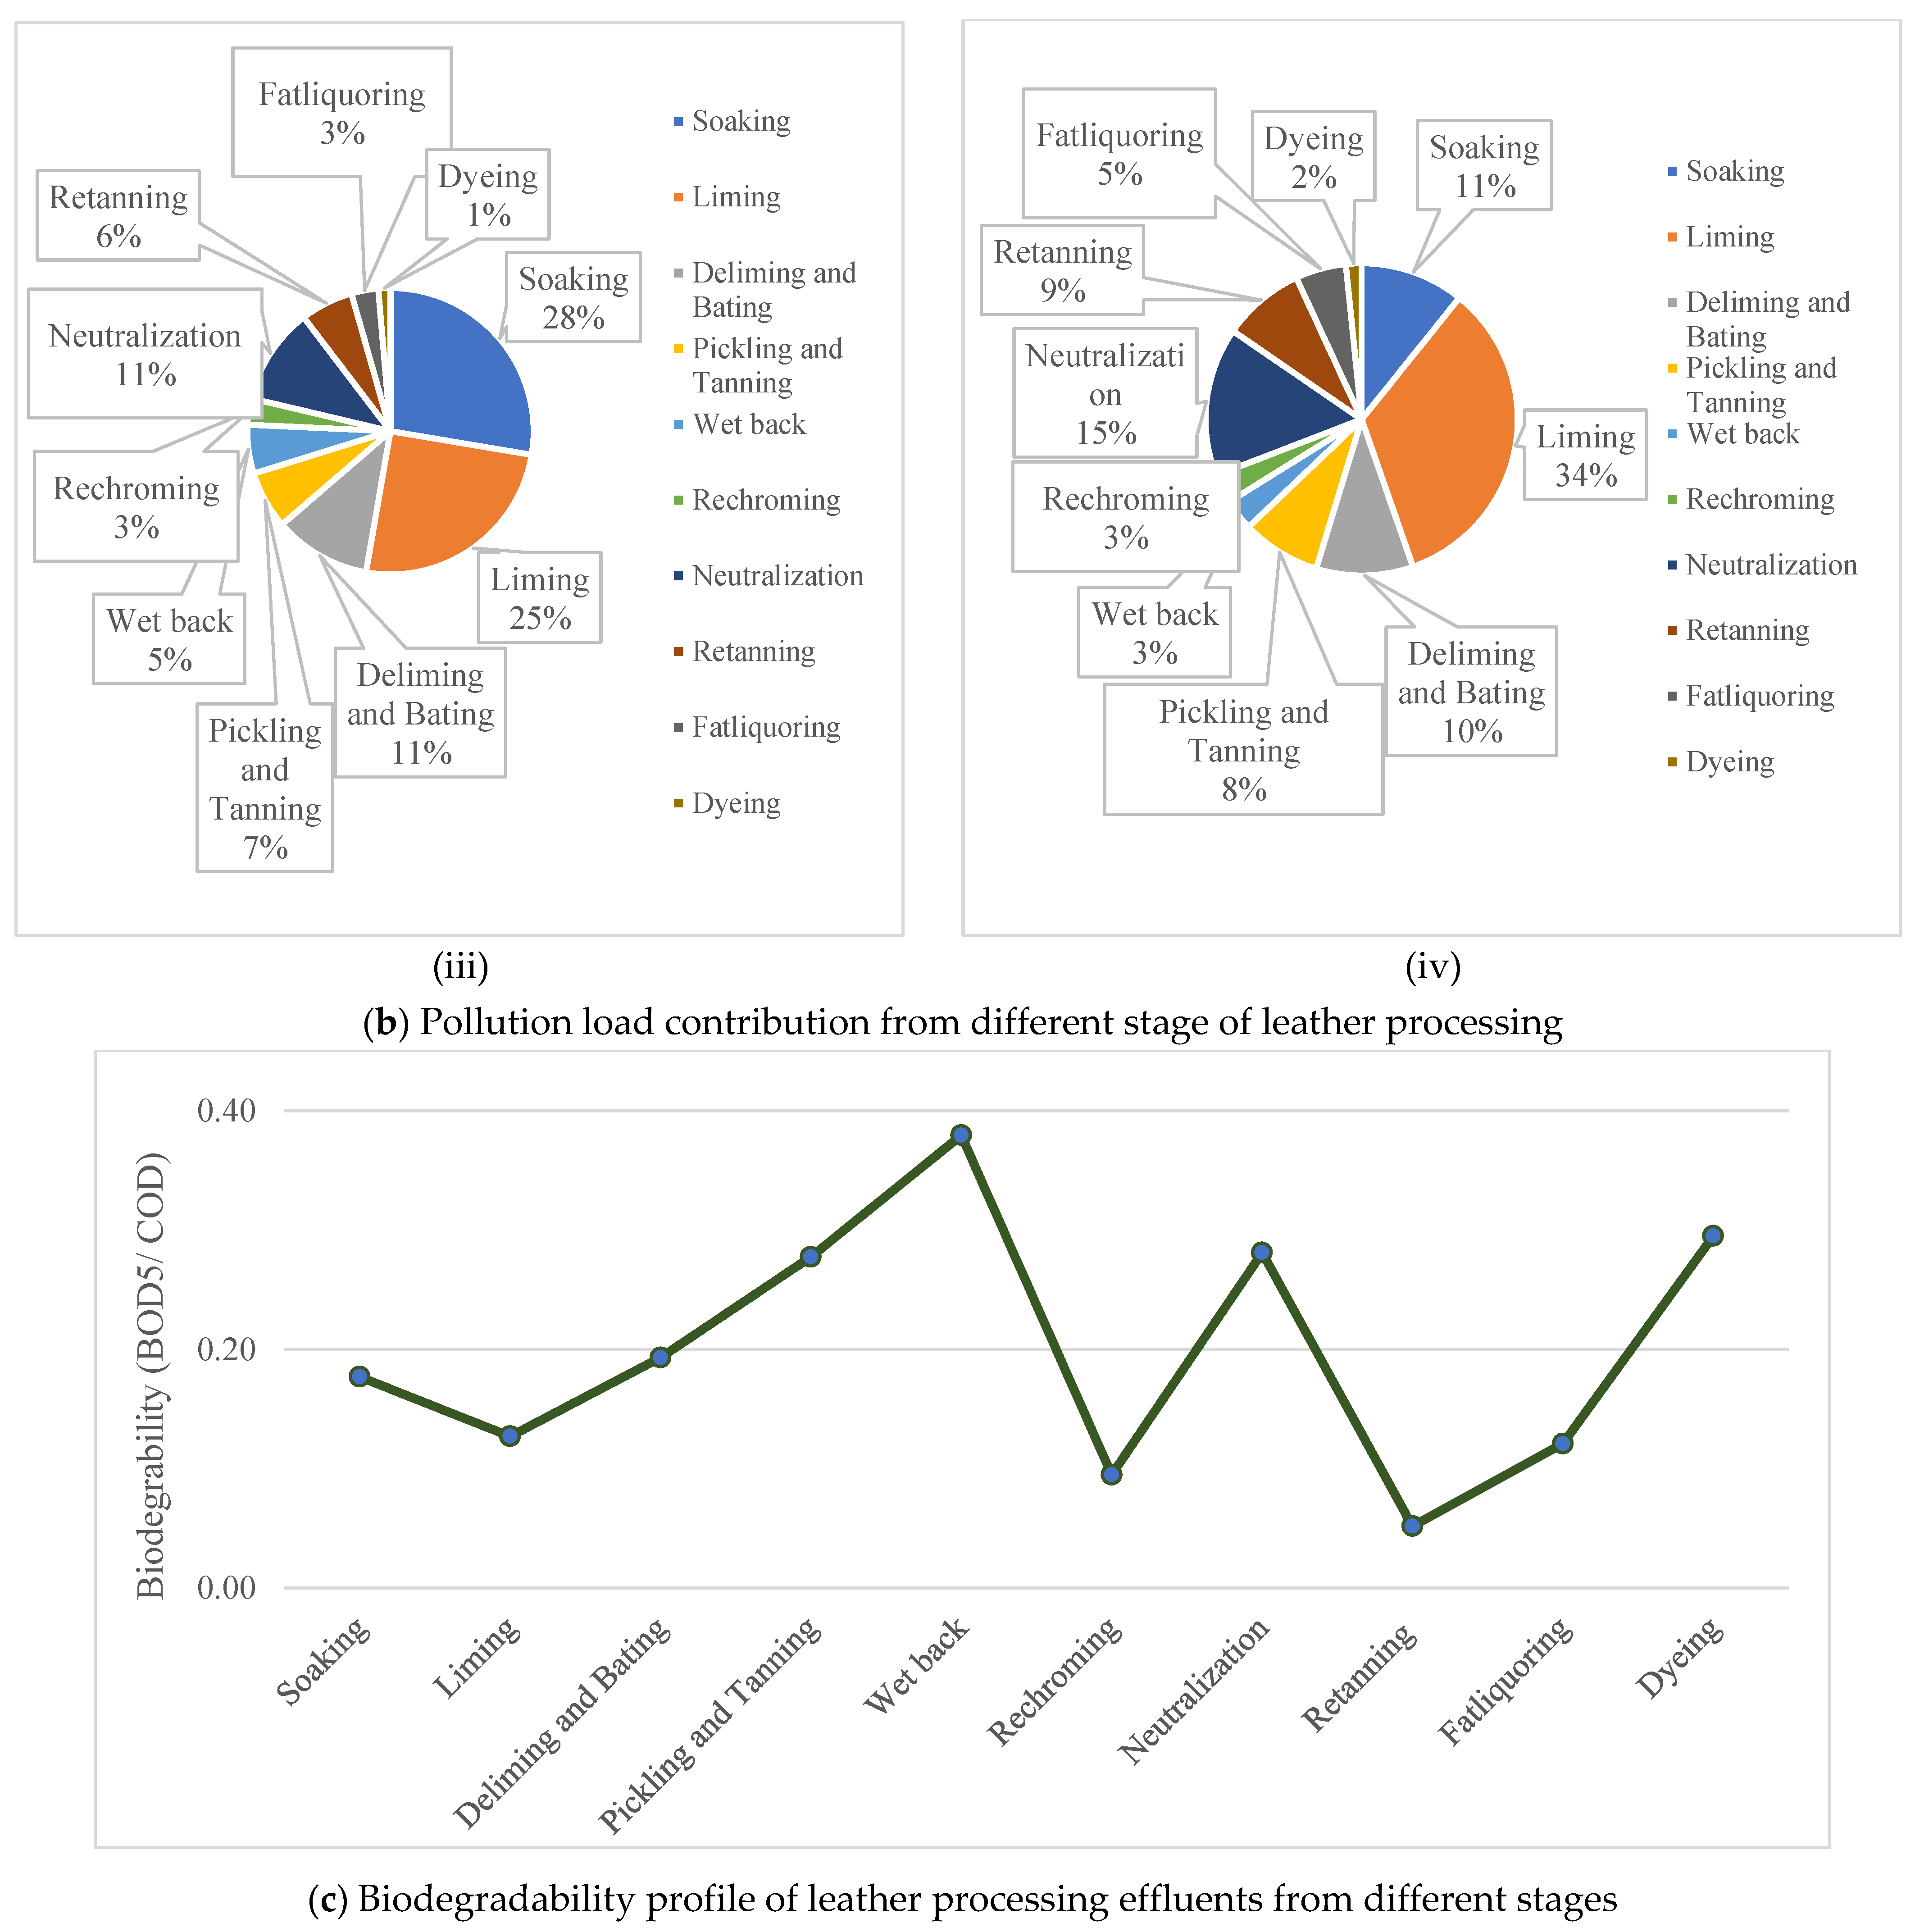
The characteristics of effluent may vary from stage to stage, tannery to tannery, raw materials and chemicals used, type of final product and the production processes adopted by leather processing factories [48,52]. The soaking effluent contains high BOD (21%); TDS (28%); and less COD (16%) and TSS (11%) as it contains high amount of salt, dirt, insecticides and bactericides [53,54]. However, effluent generated from liming contains the highest amount of BOD (39%), COD (42%), TDS (39%) and TSS (25%).
On the other hand, effluent from delime washing, delime and bating contains less amount BOD (6%), COD (4%), TDS (11%) and TSS (10%) and effluent from pickling and tanning also very little contribution in BOD (3%), COD (1%), TDS (7%) and TSS (8%). The retanning effluent streams have relatively low BOD (6%) and TDS (6%) but high COD (16%) for containing trivalent chromium (III), tannins, sulfonated oils and spent dyes [55] (Figure 6b).
Biodegradation of the leather processing effluent can be explained analyzing BOD and COD of effluents. The study shows that the ratio BOD and COD of effluents generated from different wet processing stages varies from 0.13 (Liming) to 0.38 (Wet back), which is much lower than 0.5 (a set point for reasonable biodegradability) (Figure 6c). These data indicate the effluent of leather processing factories contains low biodegradable substances [54]. These can also imply that the effluent contains complex chemical compounds and toxic in nature.
4.3. Water Footprint Assessment
As leather is processed from the by product (raw hide and skin) of the meat processing sector, it has long supply chain from farming section to final product. Determining water footprint of feed crop, then water footprint of hides and skins of farm animals then water footprint of leather has been calculated.
4.3.1. Contribution of Farming Sector in Water Footprint of Leather
Bangladesh has a large number of cattle, buffalo, goat and sheep, which provides hides and skins. Therefore, the water footprint of hides and skins of farming animals are considered to be domestic water footprint of Bangladesh since their feed crops grown and consumed locally. In Appendix B, the green, blue and grey water footprint of feed crops (rice, wheat, maize and pulse) are given in tabular form (Table A3, Table A4, Table A5 and Table A6).
Pasture has 100% green water footprint; Rice Polish (80%), Broken rice (85%) and rice straw (70%) has larger blue water footprint and pulse bran (90%), Maize corn (80%), Maize bran (80%) Pulse offal (90%) and maize stover (80%) has larger grey water footprint contribution in total water footprint of feed crop (Figure 7).
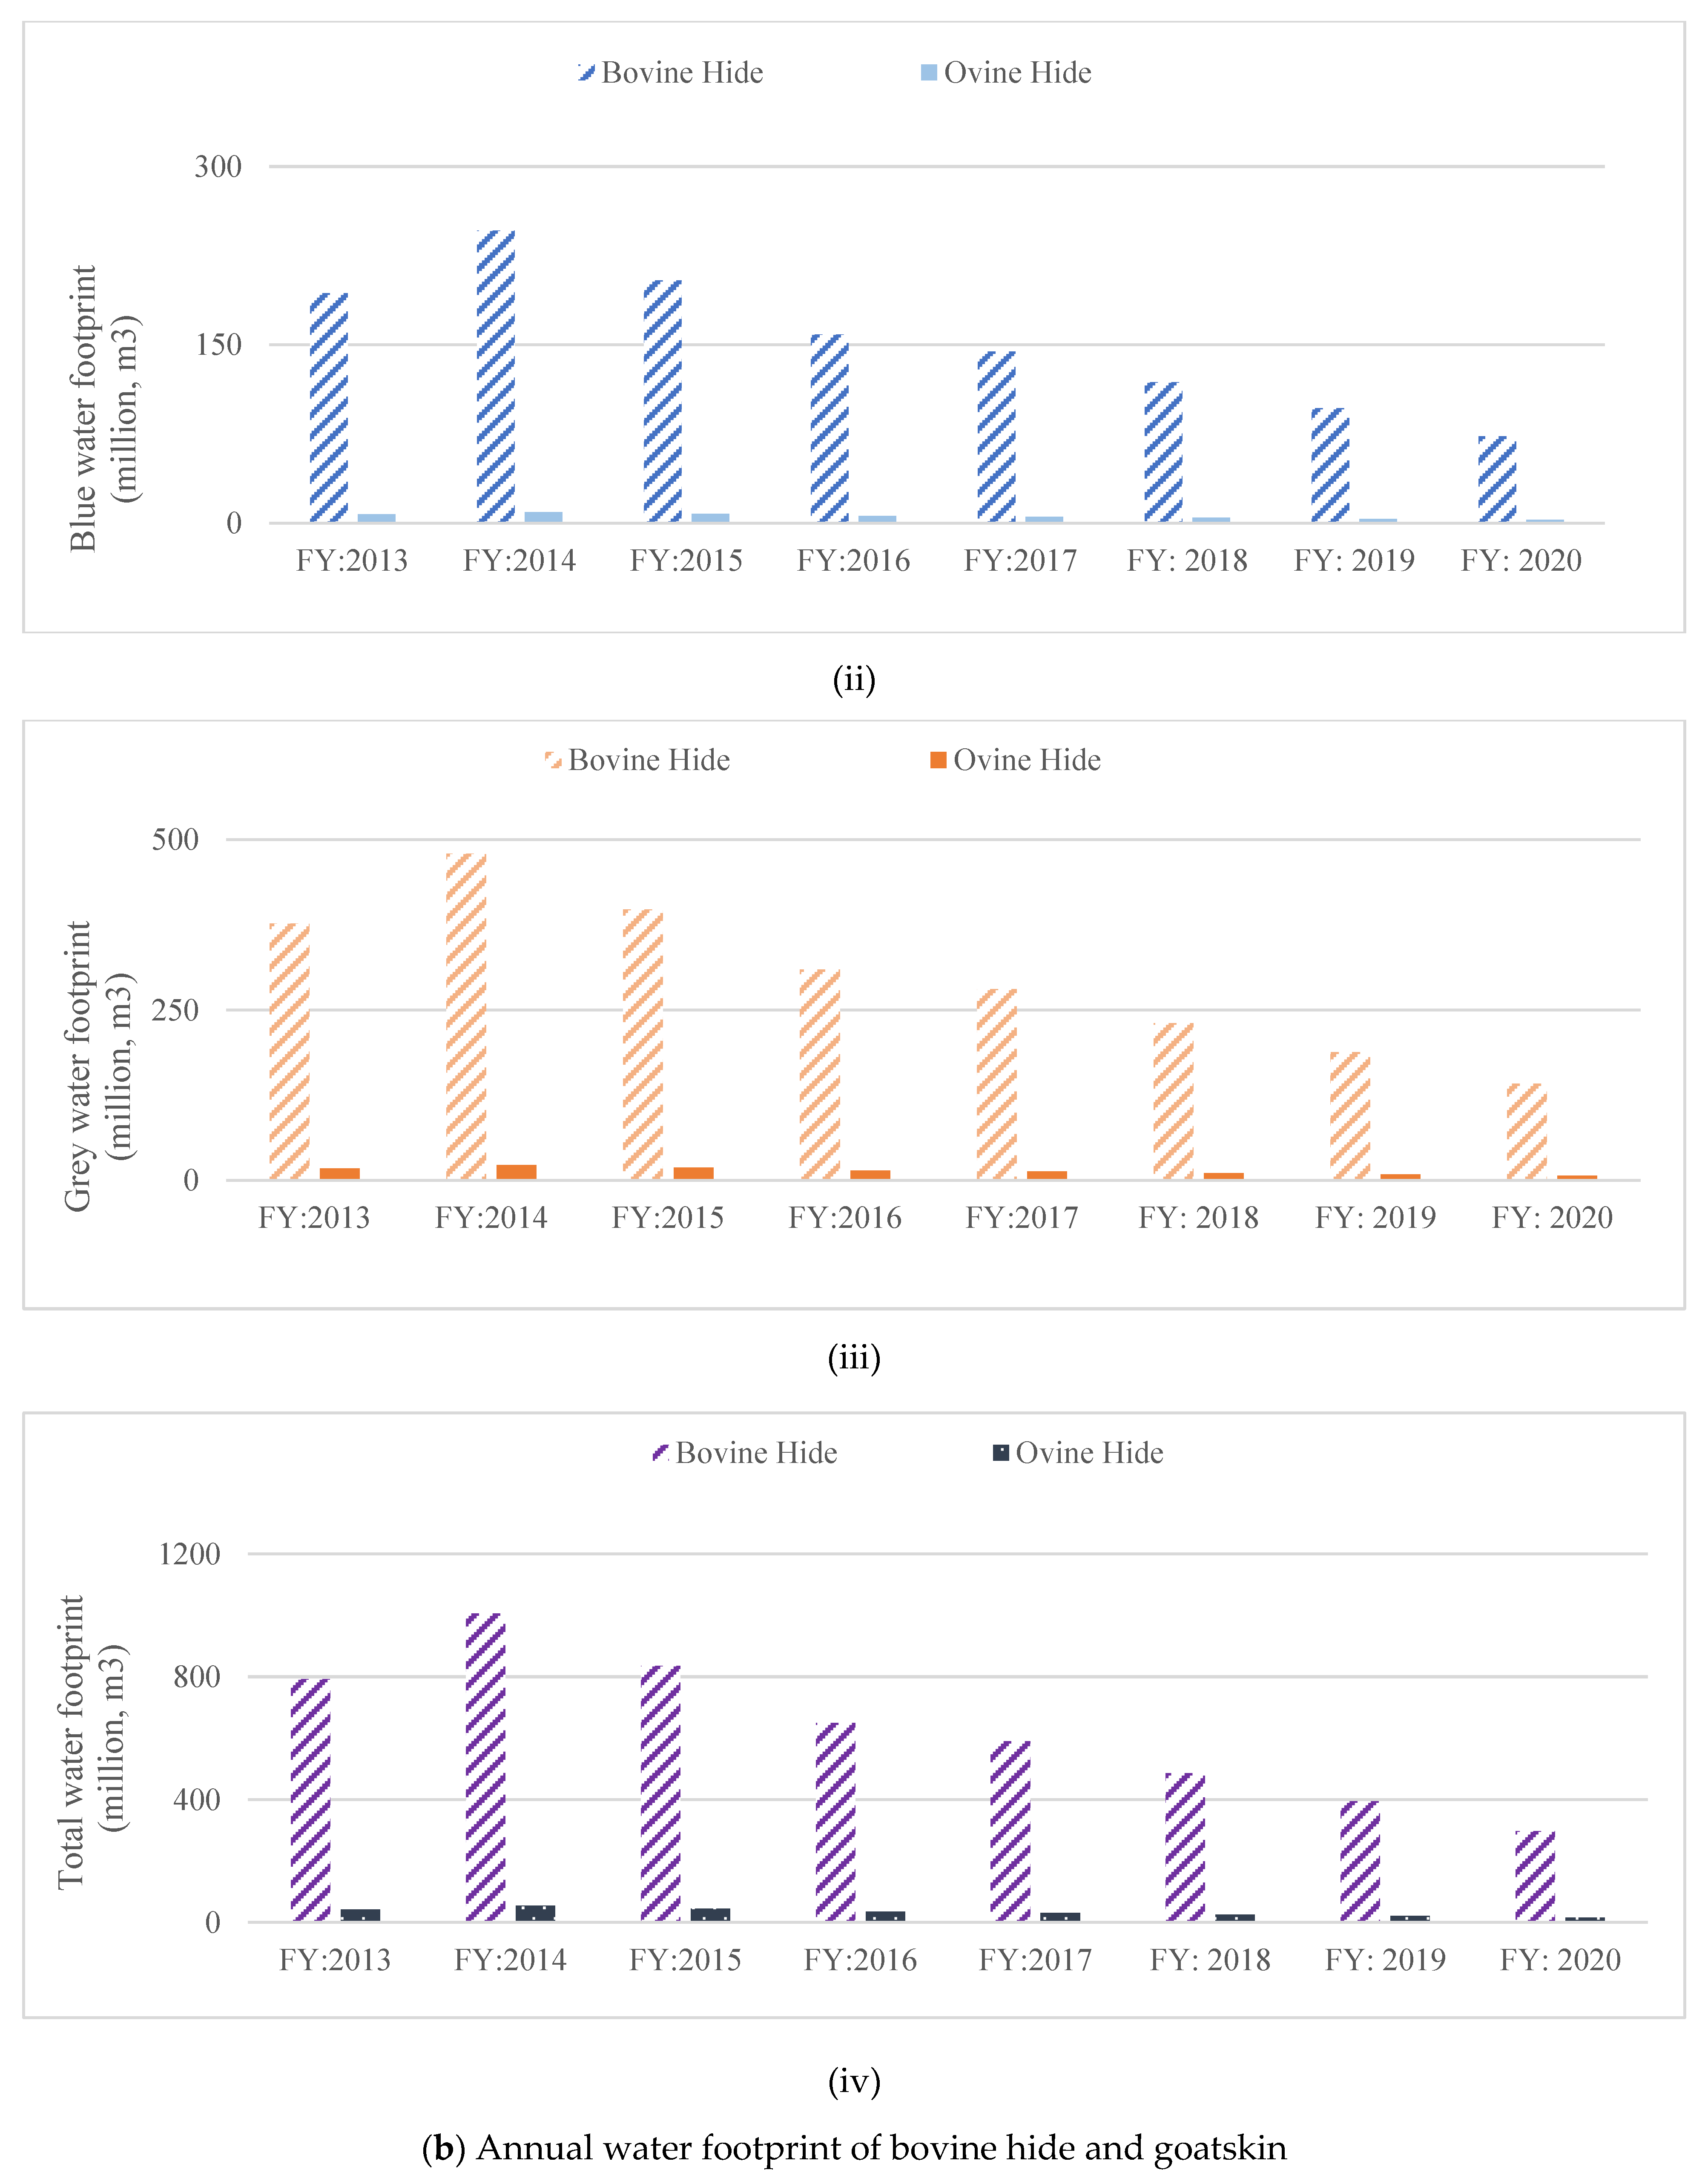
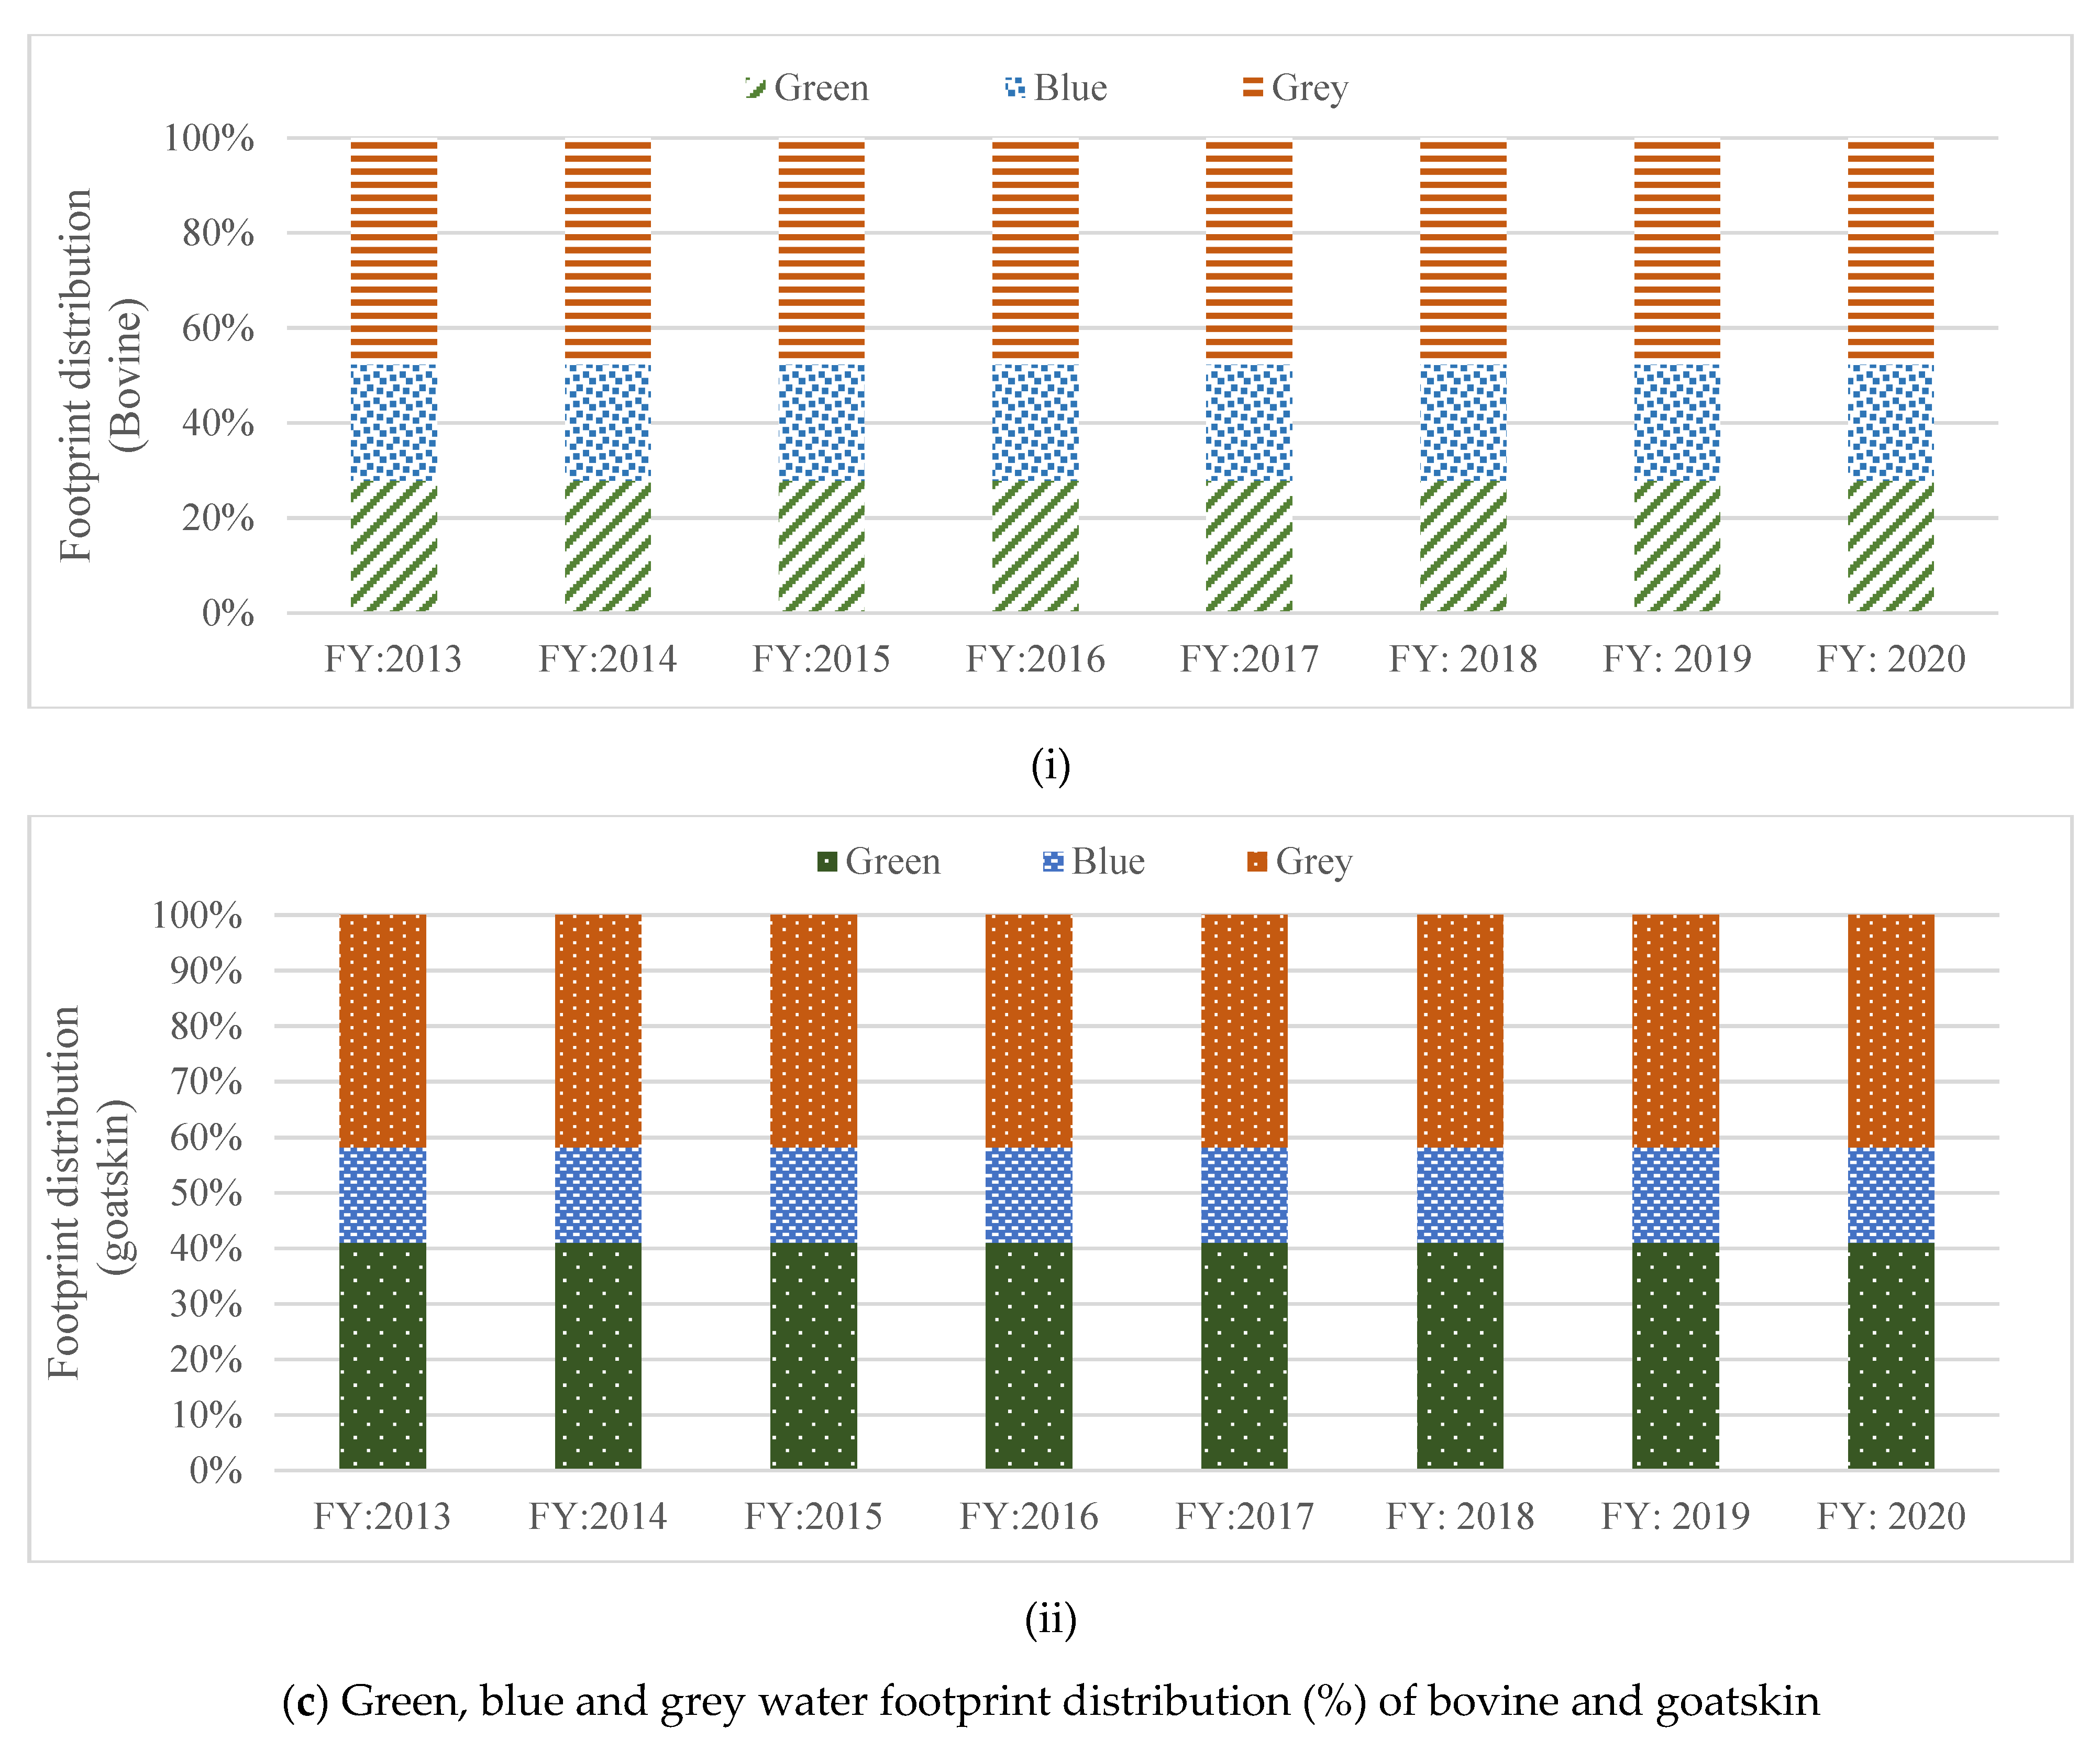
Water footprint of bovine hide is higher than that of ovine hide. The green, blue and grey water footprint of bovine hide has been estimated to be 2155, 1900 and 3683 million m3 in FY 2014; the green, blue and grey water footprint of ovine hide has been estimated to be 85, 36 and 87 million m3 in FY 2014 (Figure 7). Total water footprint of bovine hide has been estimated 6.08, 7.73, 6.42, 5.00 and 4.53 billion m3 in FY 2013, 2014, 2015, 2016 and 2017, respectively. The green water footprint of ovine hide has been estimated 164, 208, 173, 134 and 122 million m3 in FY 2013, 2014, 2015, 2016 and 2017, respectively (Figure 7d). In Figure 7 it is indicated that the grey water footprint is almost 40–50%, blue water footprint is almost 10–20% and green water footprint 30–40% in the total water footprint.
4.3.2. Contribution of Leather Processing in Water Footprint of Leather
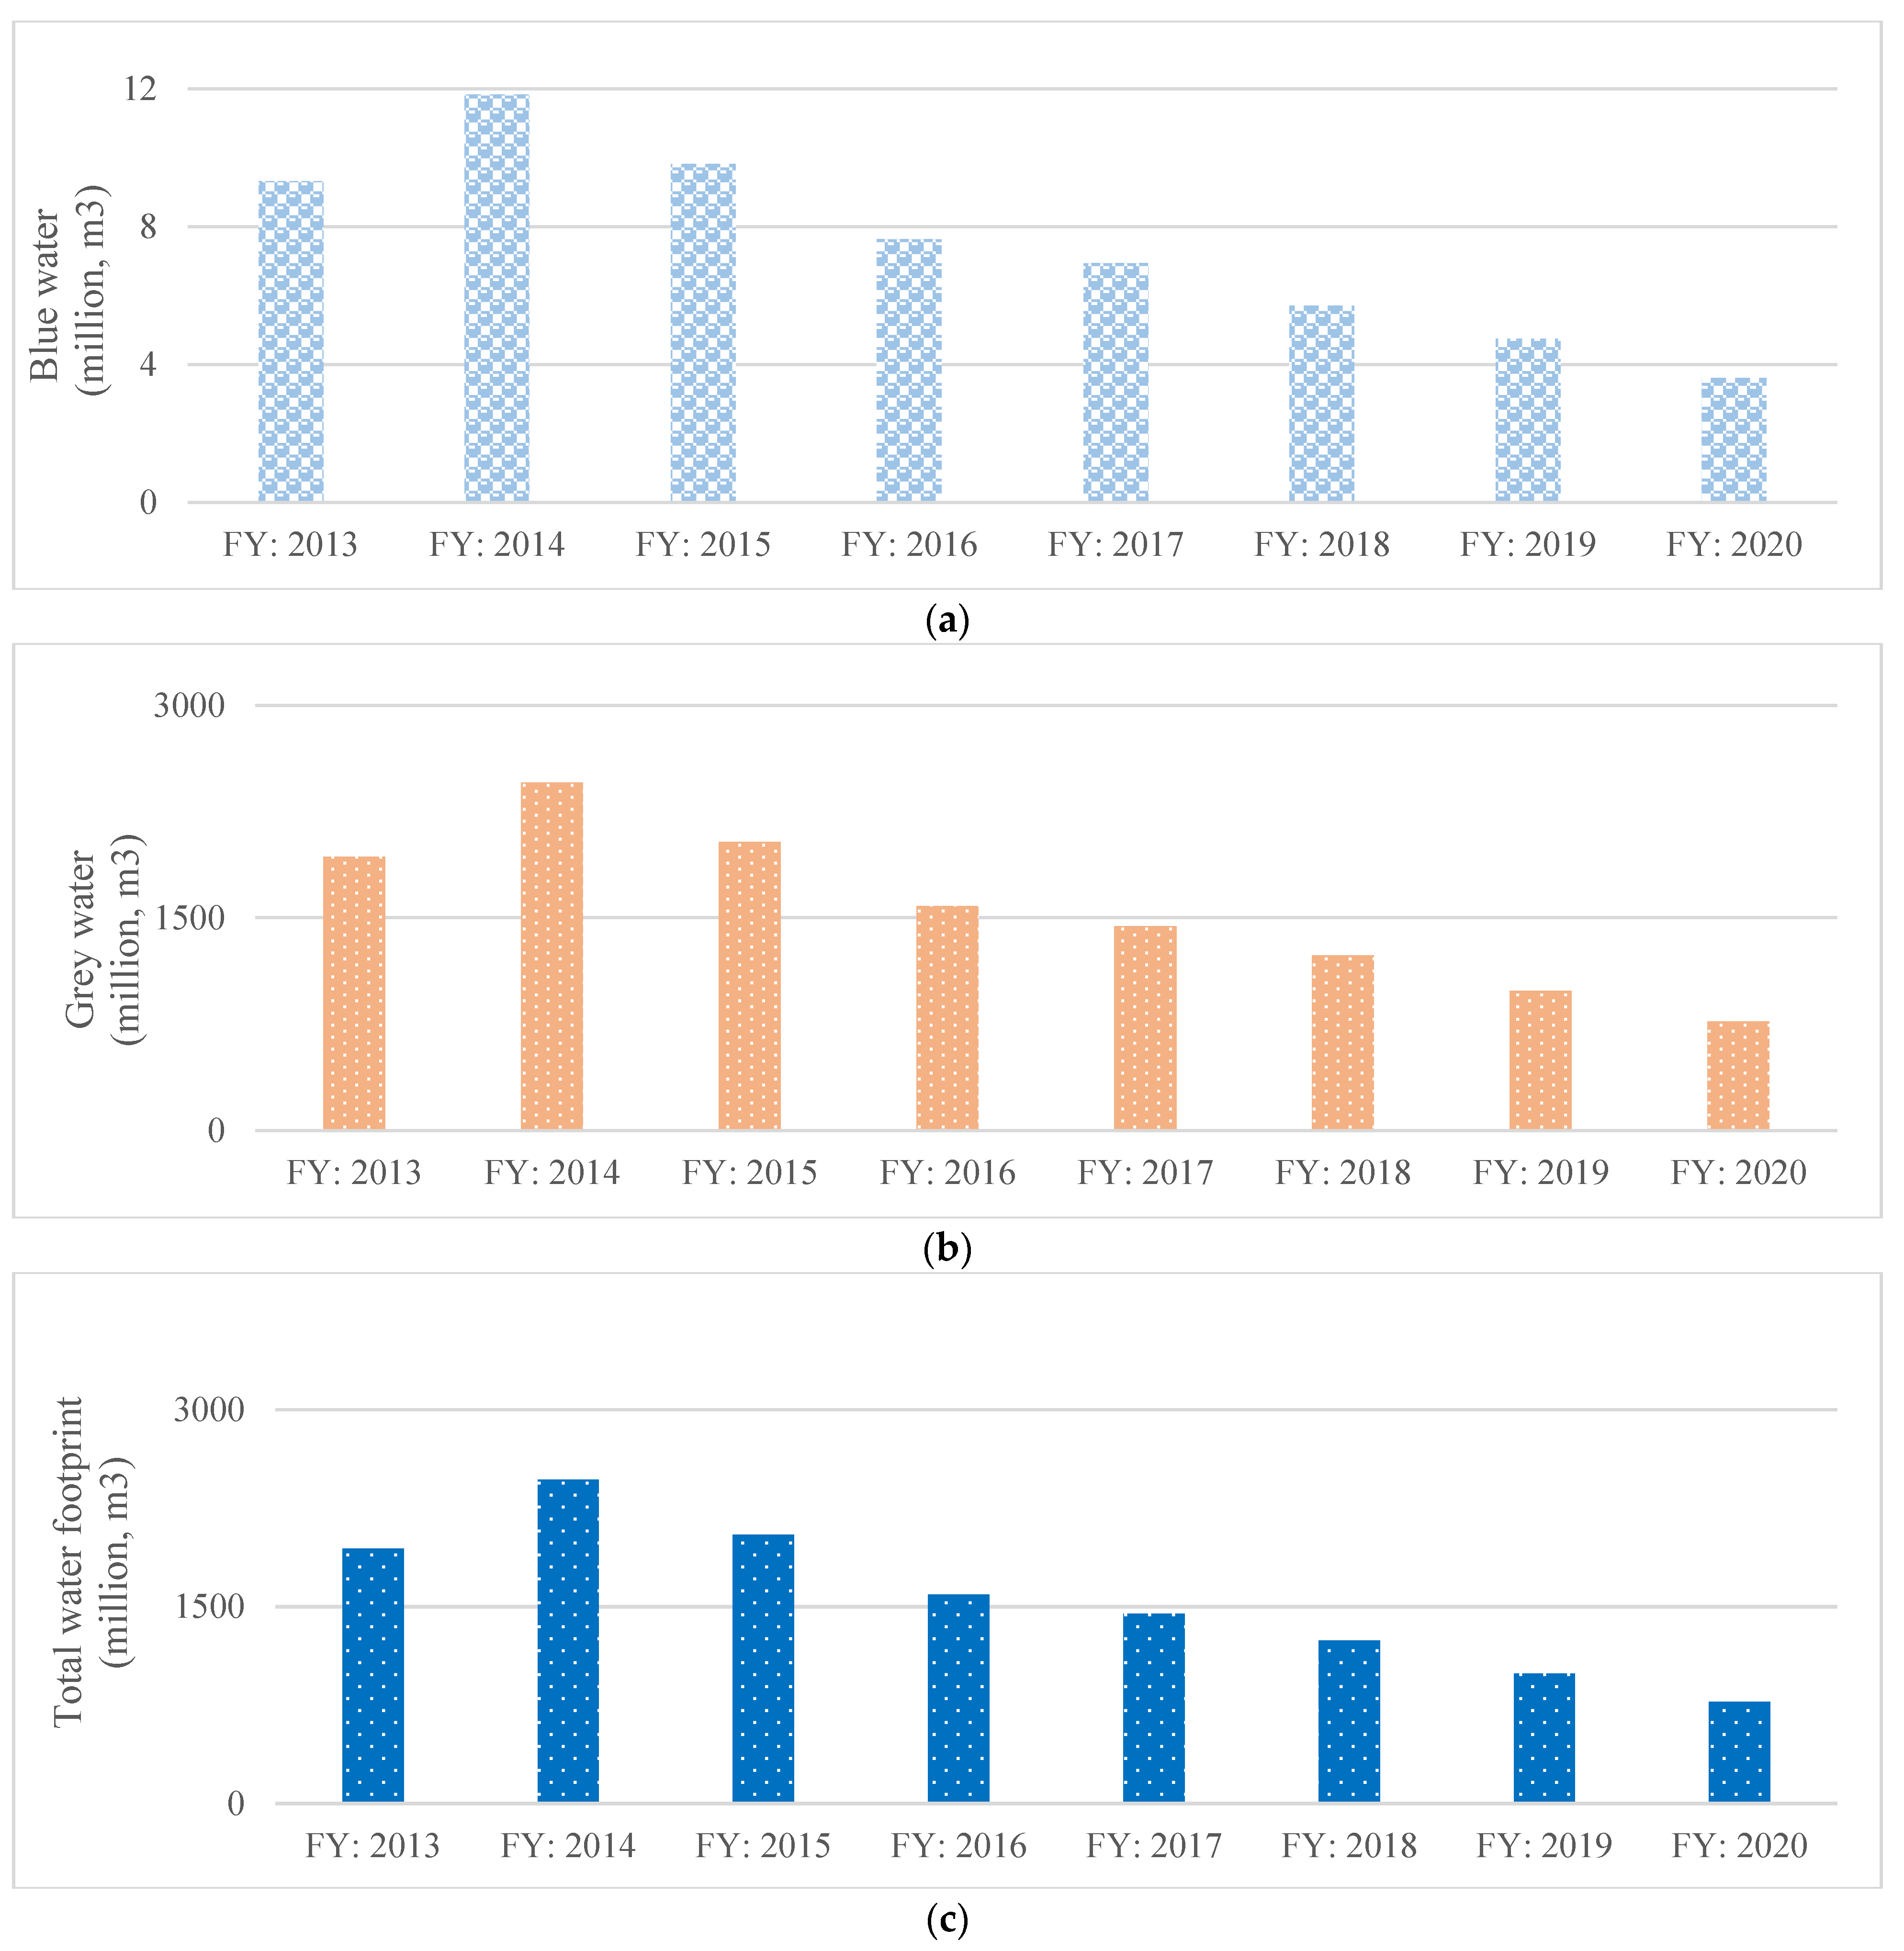
The water footprint of leather processing stages for FY 2013 to FY 2017 have been estimated to be 1940, 2466, 2046, 1592 and 1446 million m3, respectively (Figure 8). The grey water footprint of leather processing has been found significantly higher (up to 207 times) than that of blue water footprint. In which blue water footprint has gone maximum 12 million m3 in FY 2014 (Figure 8a). However, Grey water footprint is almost 207 times higher than blue water footprint of leather processing. It has gone up to 2.46 billion m3 in FY 2014 (Figure 8b).
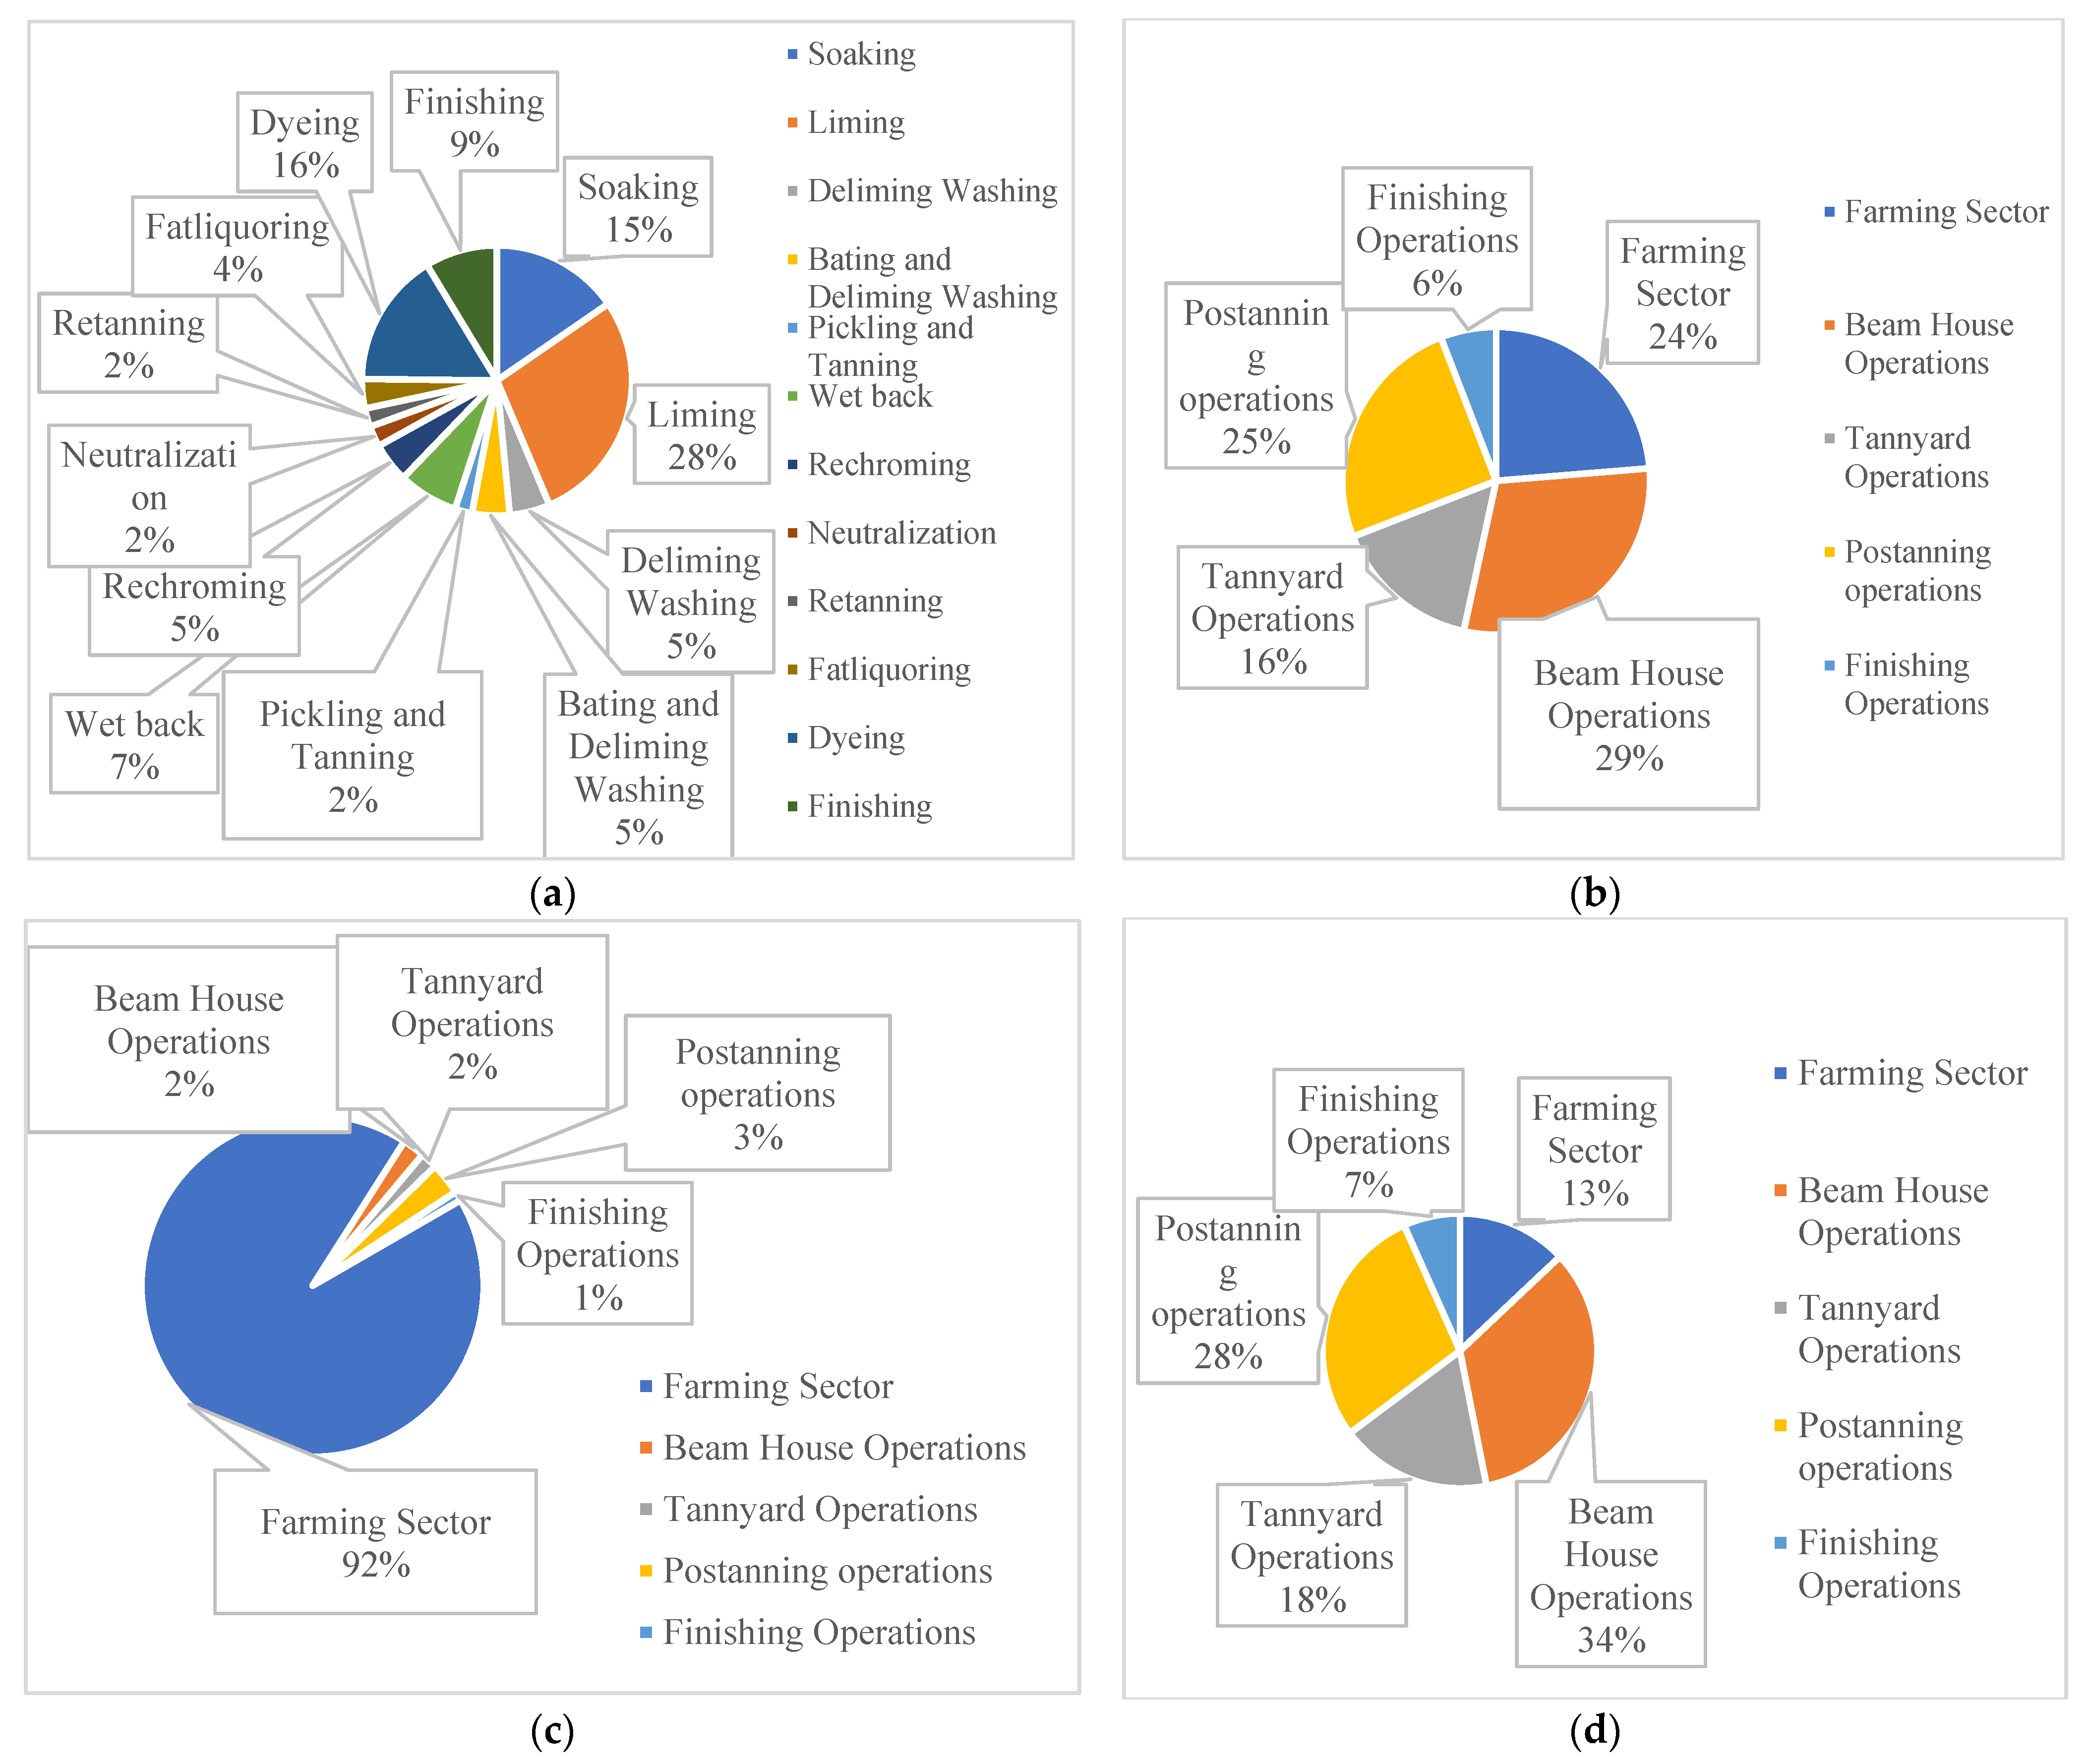
Grey water footprint of tannery is so high that it is almost 100% of total water footprint of leather processing. It indicates the severity of pollution by leather processing stages. Larger grey water footprint indicates higher pollution level caused by leather processing industries. Leather production generates highly toxic effluent which has been discussed in the Section 4.2. Water footprint of tannery has been analyzed through water footprint of different stages. The maximum contribution in water footprint of leather is the beam house operations and soaking (15%) and liming (28%) are maximum contributed to the water footprint because these stages consume and pollute maximum amount of water. From post tanning stages Dyeing (16%) stage has high contribution because of the pollution level of this stage (Figure 9a).
In water footprint of tannery almost 97% water footprint comes from wet process rest is in mechanical process. Again, the water footprint of workers only contributes 20% in the water footprint of tannery, so an 80% water footprint comes from production of leather in tanneries. In total water footprint of leather and leather products the beam house water footprint is 29%, then post tanning 25% (Figure 9b). Both the operations are most water consuming and water pollution section in the total production line of making leather products.
Blue water footprint of leather farming sector alone takes 92% of blue water footprint (Figure 9c), since Bangladesh is agricultural country and major crops such as rice, wheat and maize are cultivated in most part of the country, and the irrigation requires ground or surface water. Tanneries consume very less amount (2–3%) of surface or ground water (Blue water) for production. However, beam house (34%), tan yard (18%) and post tanning (28%) operations has high grey water footprint for releasing highly toxic effluent (Figure 9d). Farming sector also has 13% grey water footprint because the crops are cultivated with fertilizers such as UREA, TSP, Gypsum, etc. in Bangladesh.
However, the green water footprint of leather and leather products only comes from the farming sector, as only agriculture utilizes the rainwater in Bangladesh, and overall, 24% of the farming sector and 76% of the tanneries of the total water footprint are responsible for the total water footprint of leather and leather products.
5. Conclusions
This paper presents the water footprint, effluent characteristics and pollution impact assessment of the Bangladesh leather sector to help understand the water consumption and pollution intensity of tanneries with respect to the blue, green and grey water footprints and pollution load data. This paper includes a detailed study of the pollution load contributed by the key stages of leather production. The effluent produced in leather processing industries is a basic, dark brown-colored waste with COD, BOD, TDS, chromium (III) and phenolics with high pH and strong odor. Beam house and tan yard operations contribute a major part of the effluents. Effluents generated from soaking and liming stages contain very high pollution loads. This study presents that about 3.46 million liters of wastewater is released from local tanneries each year. The leather processing effluent is highly toxic and contains a low biodegradable component, as the maximum COD is found to be 142 kg/ton and BOD is 18 kg/ton.
The water footprint calculation of Bangladesh leather production (tannery) shows the average blue and grey water footprints of the leather sector are about 7.45 billion liters (7.45 million m3) and 1.55 trillion liters (1550 million m3), respectively. The study reports that the grey WF of tannery is about 200 times higher than its blue WF, which indicates the high pollution intensity in leather production. The beam house (soaking and liming) alone contributes 43% of the total grey WF of leather production, and the farming sector contributes 71% of the total WF of leather finished products.
The overall analyses showed that the effluent of leather processing contains a low biodegradable substance, which implies that the effluent contains complex chemical compounds and is toxic in nature. A reduction of the grey water footprint of the leather wet processing stages will significantly reduce the total water footprint of leather products and will help develop sustainable and environment friendly leather goods. This study gives an understanding of the water footprint and pollution load analysis of Bangladesh leather industries. Additionally, it can help to understand the impact of the leather processing with respect to environmental pollution and the total water footprint.
Author Contributions
S.H. contributed to the conceptualization of the study, carried out the experimental work and analysis, and drafted, edited and finalized the manuscript; L.H. carried out the data analysis and calculation specially for WFP; S.R.H. conceived the study, coordinate with industrial processes, and conceptualized manuscript formation; M.S.K. conceived the study, supervised the research project and manuscript preparation, contributed to the writing, and reviewed, edited, and finalized the manuscript. All authors have read and agreed to the published version of the manuscript.
Funding
This research was supported by the BUET CASR research fund and ESTex Research Funding.
Institutional Review Board Statement
Not applicable.
Informed Consent Statement
Not applicable.
Data Availability Statement
Data is contained within the article and supplementary document (Appendix A and Appendix B) shared with the article.
Acknowledgments
The authors are grateful to the Department of Chemical Engineering (ChE), Bangladesh University of Engineering and Technology (BUET) for providing the facilities to carry out the research work. The authors would like to acknowledge A. Noor, M. Rahman and F. K. Shifat for technical discussions.
Conflicts of Interest
The authors declare no conflict of interest.
Appendix A
- Blue and Green Water Footprint of Feed Crops
The grid-based dynamic water balance model used in the study computes a daily soil water balance which is based on the CROPWAT 8.0 model [25] and calculates crop evapotranspiration (ET) by calculating reference evapotranspiration (ETo) [34] using FAO 56 method [56], effective rainfall using USDA method [57] which provide crop water use (CWU) (Table 2). The CROPWAT method has been described in Appendix A. Calculating water footprint (WF) require data includes climate monthly data, soil data and crops cultivation data of Bangladesh. The nearest and most representative meteorological station(s) located within or near the crop-producing district are considered in this study (Table A1). Monthly climate data has been taken from yearbook of agricultural statistics 2018 released from Bangladesh Bureau of Statistics [20], Ministry of Planning Division. Soil texture is mostly clay loam, loam and sandy clay loam [58], soil type in case of rice soil type clayey [28], for maize its sandy loamy to loamy [59], for wheat it can be loamy [60] and crop data is taken from FAOSTAT database [61,62,63].

Table A1.
Crop water use of the major crops for livestock feed in meteorological stations in Bangladesh.
Table A1.
Crop water use of the major crops for livestock feed in meteorological stations in Bangladesh.
| Station | Crop Water Use (CWU) (mm) | |||||||||
|---|---|---|---|---|---|---|---|---|---|---|
| Green Grass | Rice | Wheat | Maize | Pulse | ||||||
| Blue | Green | Blue | Green | Blue | Green | Blue | Green | Blue | Green | |
| Barisal | 1879 | 258 | 1879 | 258 | 582 | 157 | 905 | 236 | 591 | 533 |
| Bogra | 1876 | 256 | 1876 | 256 | 618 | 122 | 927 | 228 | 638 | 492 |
| Comilla | 1799 | 333 | 1799 | 333 | 565 | 169 | 862 | 291 | 549 | 601 |
| Chittagong | 1912 | 324 | 1912 | 324 | 735 | 100 | 1023 | 256 | 613 | 517 |
| Dhaka | 1863 | 238 | 1863 | 238 | 548 | 182 | 865 | 287 | 626 | 421 |
| Dinajpur | 1952 | 230 | 1952 | 230 | 581 | 153 | 906 | 233 | 662 | 451 |
| Faridpur | 1747 | 301 | 1747 | 301 | 682 | 83 | 1002 | 191 | 520 | 528 |
| Jessore | 1812 | 284 | 1812 | 284 | 512 | 185 | 817 | 280 | 560 | 511 |
| Khulna | 1716 | 311 | 1716 | 311 | 538 | 178 | 868 | 259 | 475 | 567 |
| Mymensingh | 1842 | 150 | 1842 | 150 | 476 | 206 | 772 | 306 | 555 | 473 |
| Patuakhali | 1772 | 282 | 1772 | 282 | 571 | 99 | 904 | 155 | 442 | 602 |
| Rajshahi | 1769 | 297 | 1769 | 297 | 561 | 137 | 850 | 249 | 527 | 528 |
| Rangpur | 1867 | 148 | 1867 | 148 | 541 | 157 | 828 | 276 | 570 | 475 |
| Sylhet | 1752 | 383 | 1752 | 383 | 603 | 73 | 925 | 144 | -- | -- |
| Tangail | 1851 | 286 | 1851 | 286 | 571 | 167 | 896 | 262 | 591 | 542 |
Feed crops which are grown in Bangladesh, the CROPWAT 8.0 model is used to calculate blue and green water footprints. The grid-based dynamic water balance model used in the study computes a daily soil water balance and calculates crop water requirements, actual crop water use (both green and blue) and actual yields.
Reference Evapotranspiration (ETo) Calculation: The reference evapotranspiration (ETo) has been calculated using Equation (A1) [34].
where, ETo is reference evapotranspiration (mm d−1), Rn is net radiation (MJ m−2 d−1), eS−ea is difference between the saturation vapor pressure eS (kPa) and the actual vapor pressure ea (kPa), Δ is slope of the saturation vapor pressure–temperature curve (kPa °C−1), γ is psychrometric constant (kPa °C−1), u2 is wind speed at 2 m height (m s−1), T is mean daily air temperature (°C), and G is monthly soil heat flux density (MJ m−2 d−1). All the intermediate parameters were computed following Allen et al. (1998) [34].
Reference evapotranspiration (ETo) is the water evaporated from a reference surface, and was presented to quantify evaporative demand of the atmosphere, independent of the crop growth parameters and management practices [25,34] and important to calculate crops water requirement (CWR). For this model Penman Monteith formula (Equation (A1)) has been used where the reference ETo values were estimated using FAO 56 PM for each of the stations [56]. The FAO56 PM is a hypothetical grass reference based model that have following characteristics: mean height of vegetation (h) = 0.12 m, measurement of temperature, humidity, and wind at the height of 2 m, latent heat transfer (λ) = 2.45(MJ kg−1), bulk surface resistance of 70 sm−1, and albedo = 0.23. The final form of the FAO 56 PM equation for daily or monthly time step is defined as [34].
Effective Precipitation (Peff) Calculation: The USDA SCS (United States Department of Agriculture Soil Conservation Service) method has been used to estimate the effective rainfall (Equations (A2) and (A3)) [17] in CROPWAT 8.0 model.
where, P is precipitation. The evaluation of effective rainfall involves measuring rainfall and/or irrigation, losses toy surface run-off, percolation losses beyond the root zone and the soil moisture uptake by the crop for evapotranspiration [57].
Peff = (P × (125 – 0.2 × 3 × P))/ 125 for P <= 250/3
Peff = 125/3 + 0.1 × P for P > 250/3
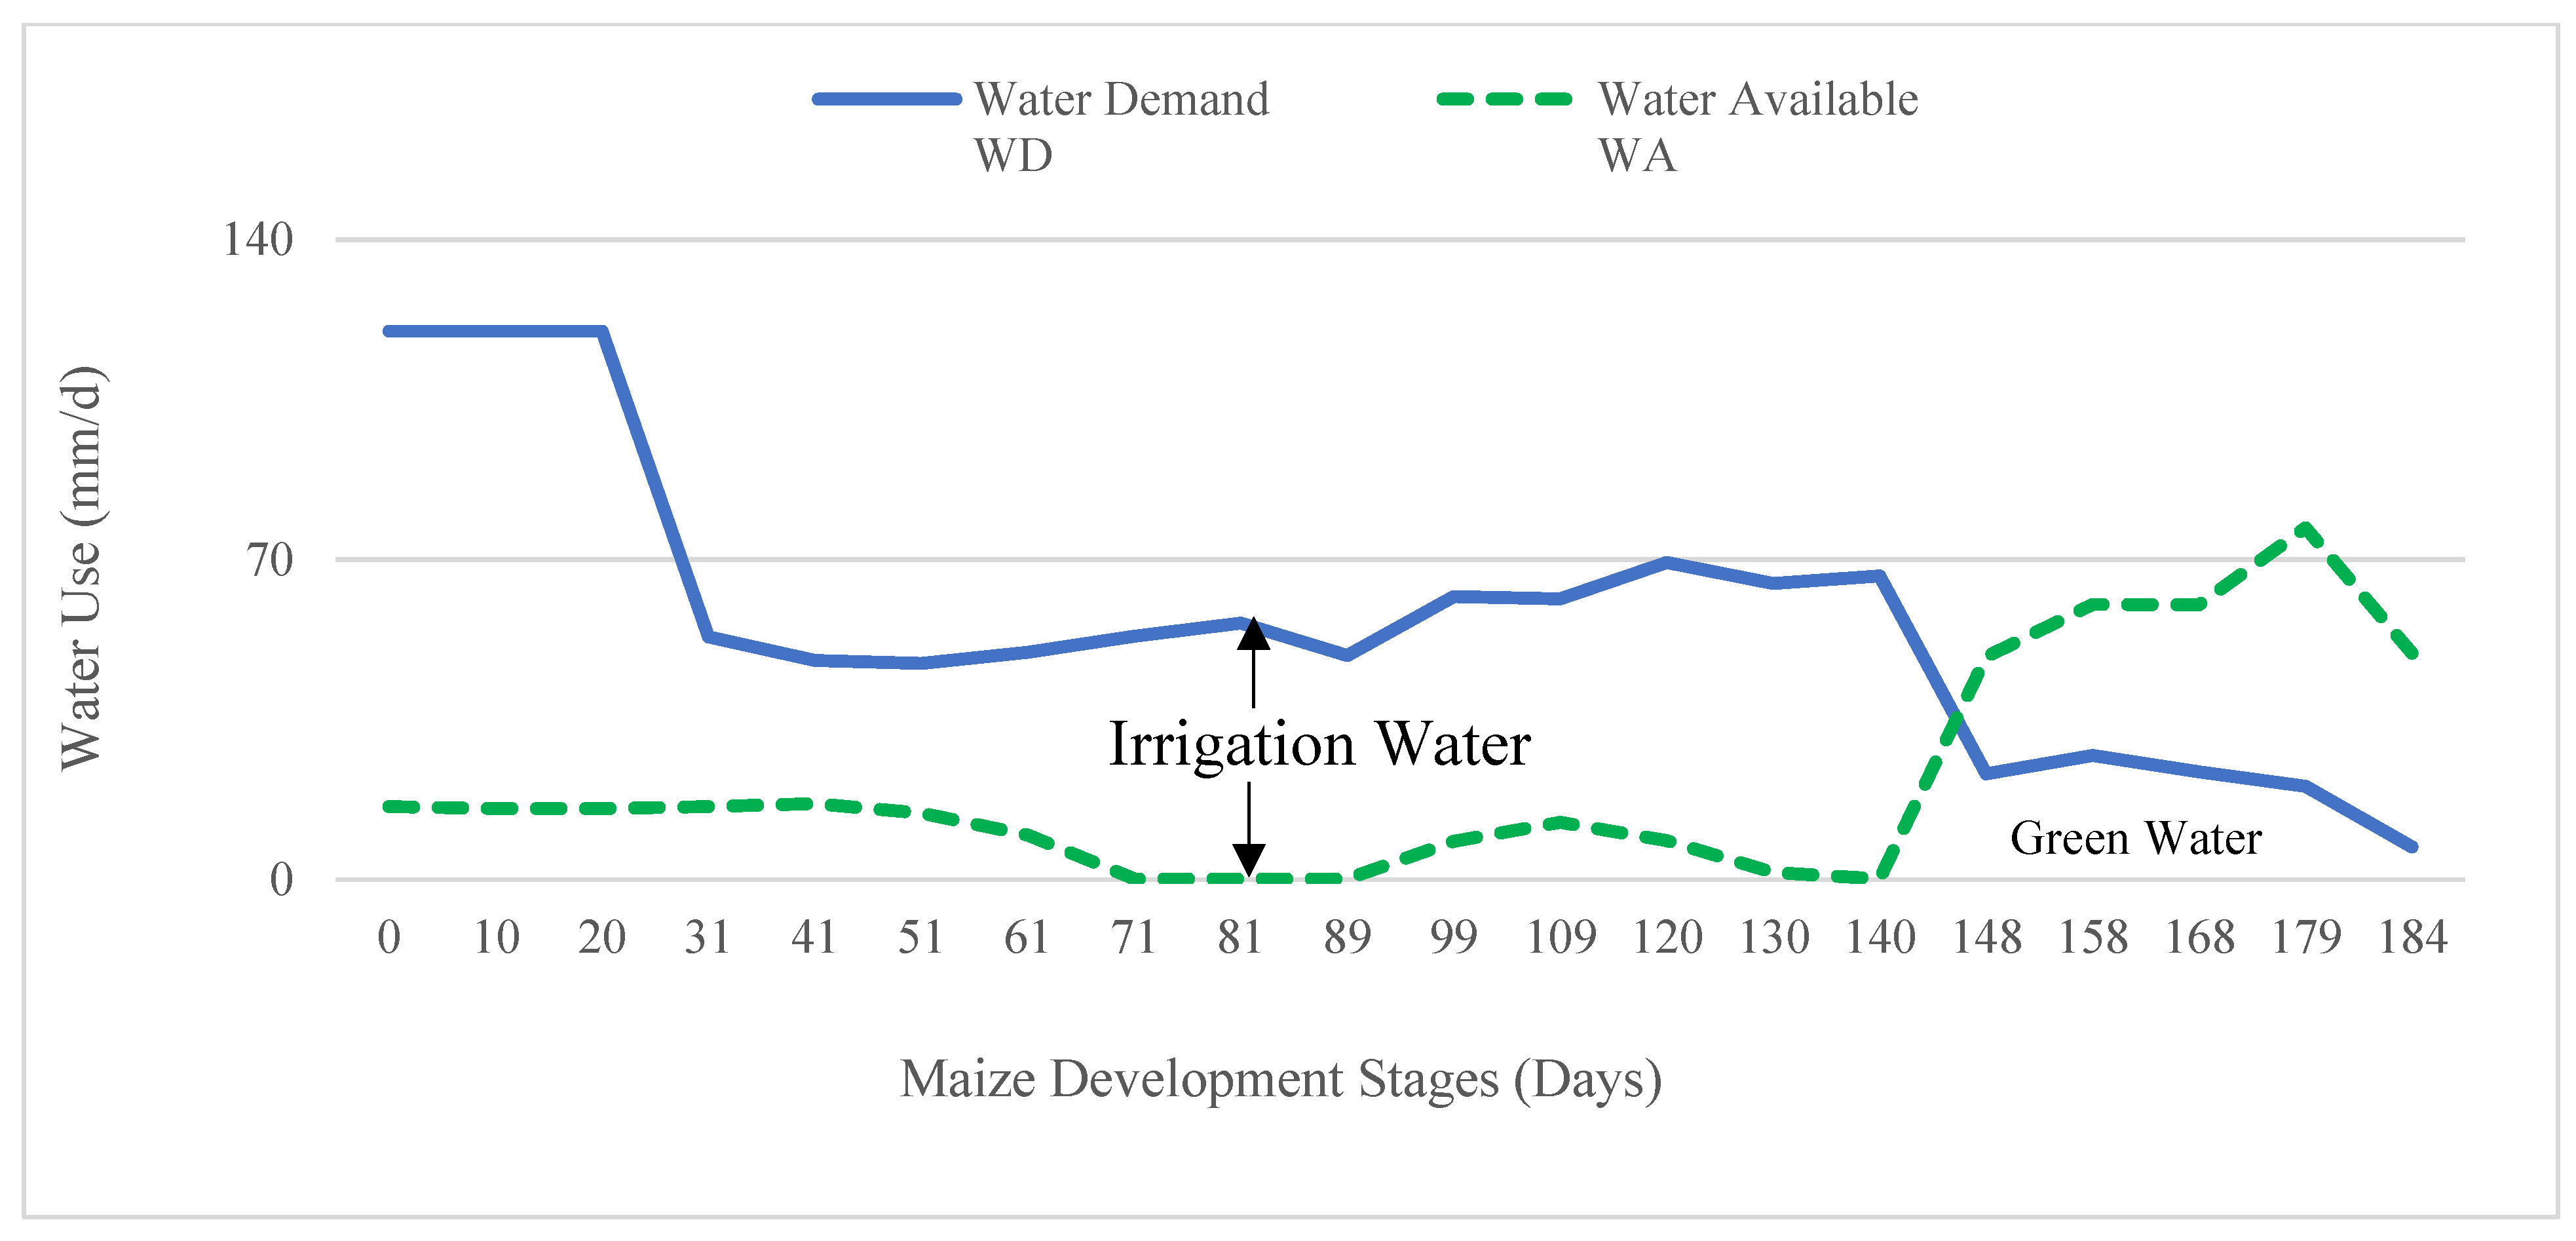
Crop Water Demand and Water Available Graphs: Above mentioned Evapotranspiration (ET), Effective Rainfall (Peff), Crop data, soil data helps to calculate the crop water requirement (CWR). Crop water requirement (CWR) generates water demand (WD) versus Water available (WA) graphs. The water use in the crop fields is calculated for each 10 days cumulative period using the schema as presented in Figure 8. If the total water demand WD is less than total water available WA, green water use is equal to the demand WD. In cases where the WD outstrips WA, the deficit is met by irrigation water supply. This deficit is called irrigation water demand. If a paddy field is 100% irrigated, it is assumed that the ‘blue water’ use in crop production is equal to the deficit. For areas equipped with partial irrigation coverage, the blue water use is estimated on a pro-rata basis.
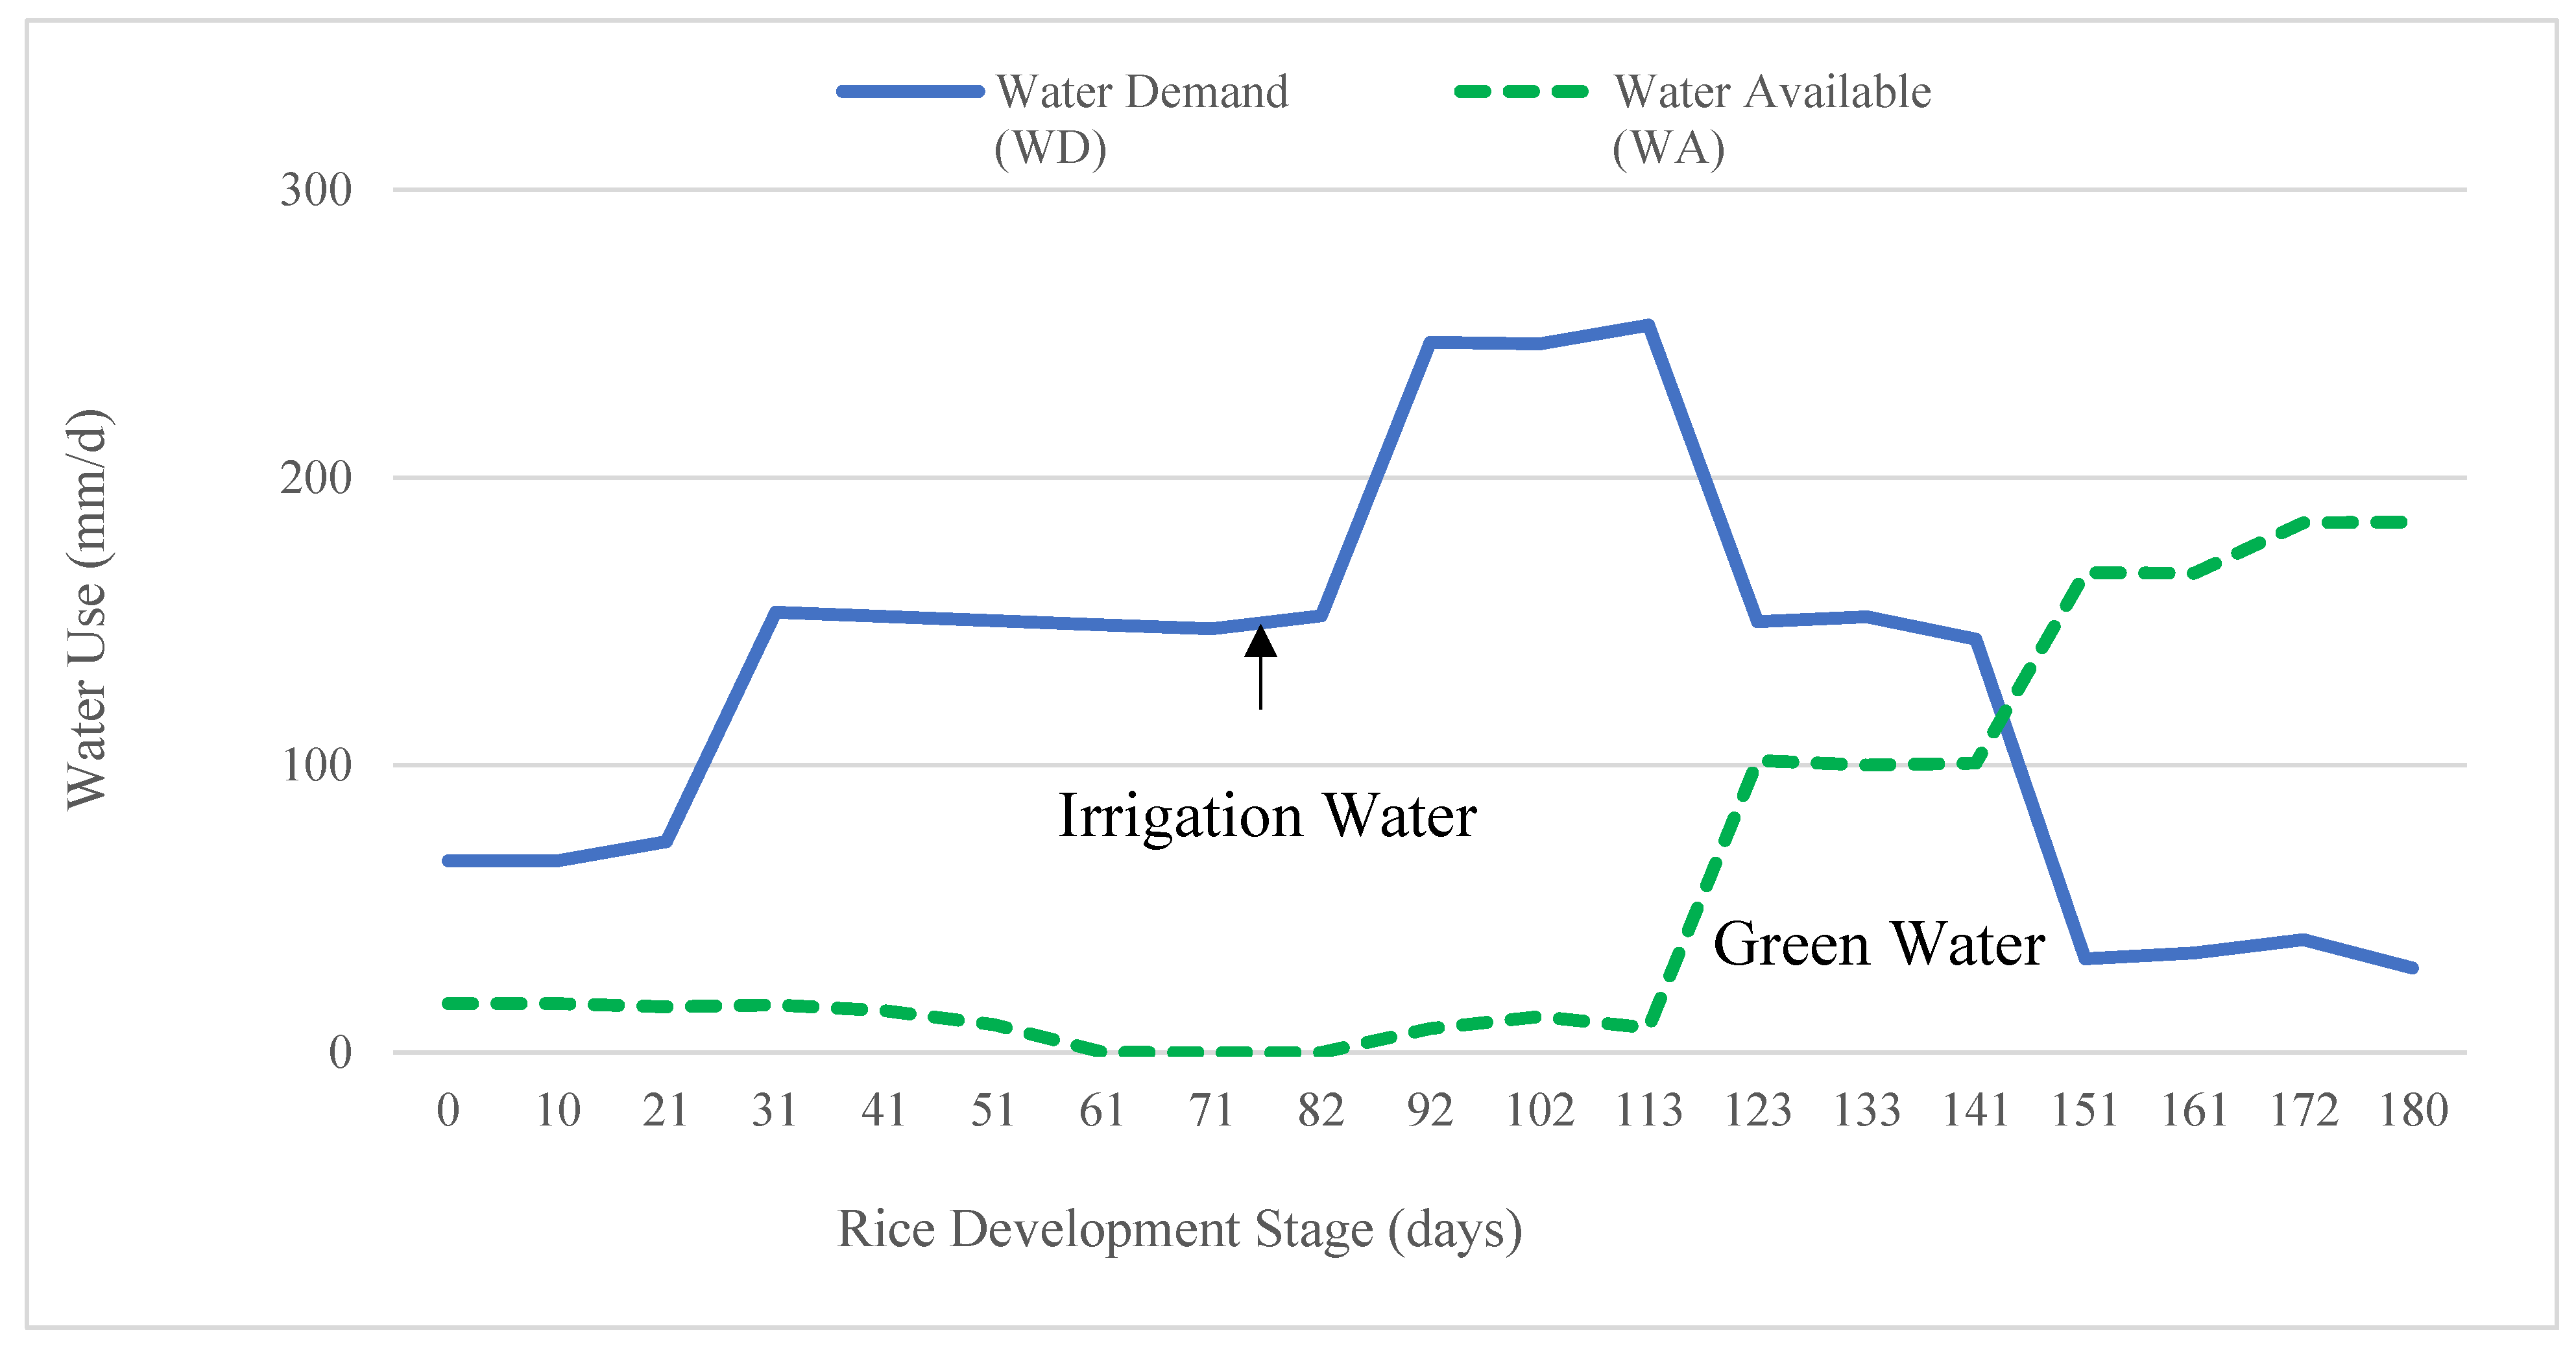
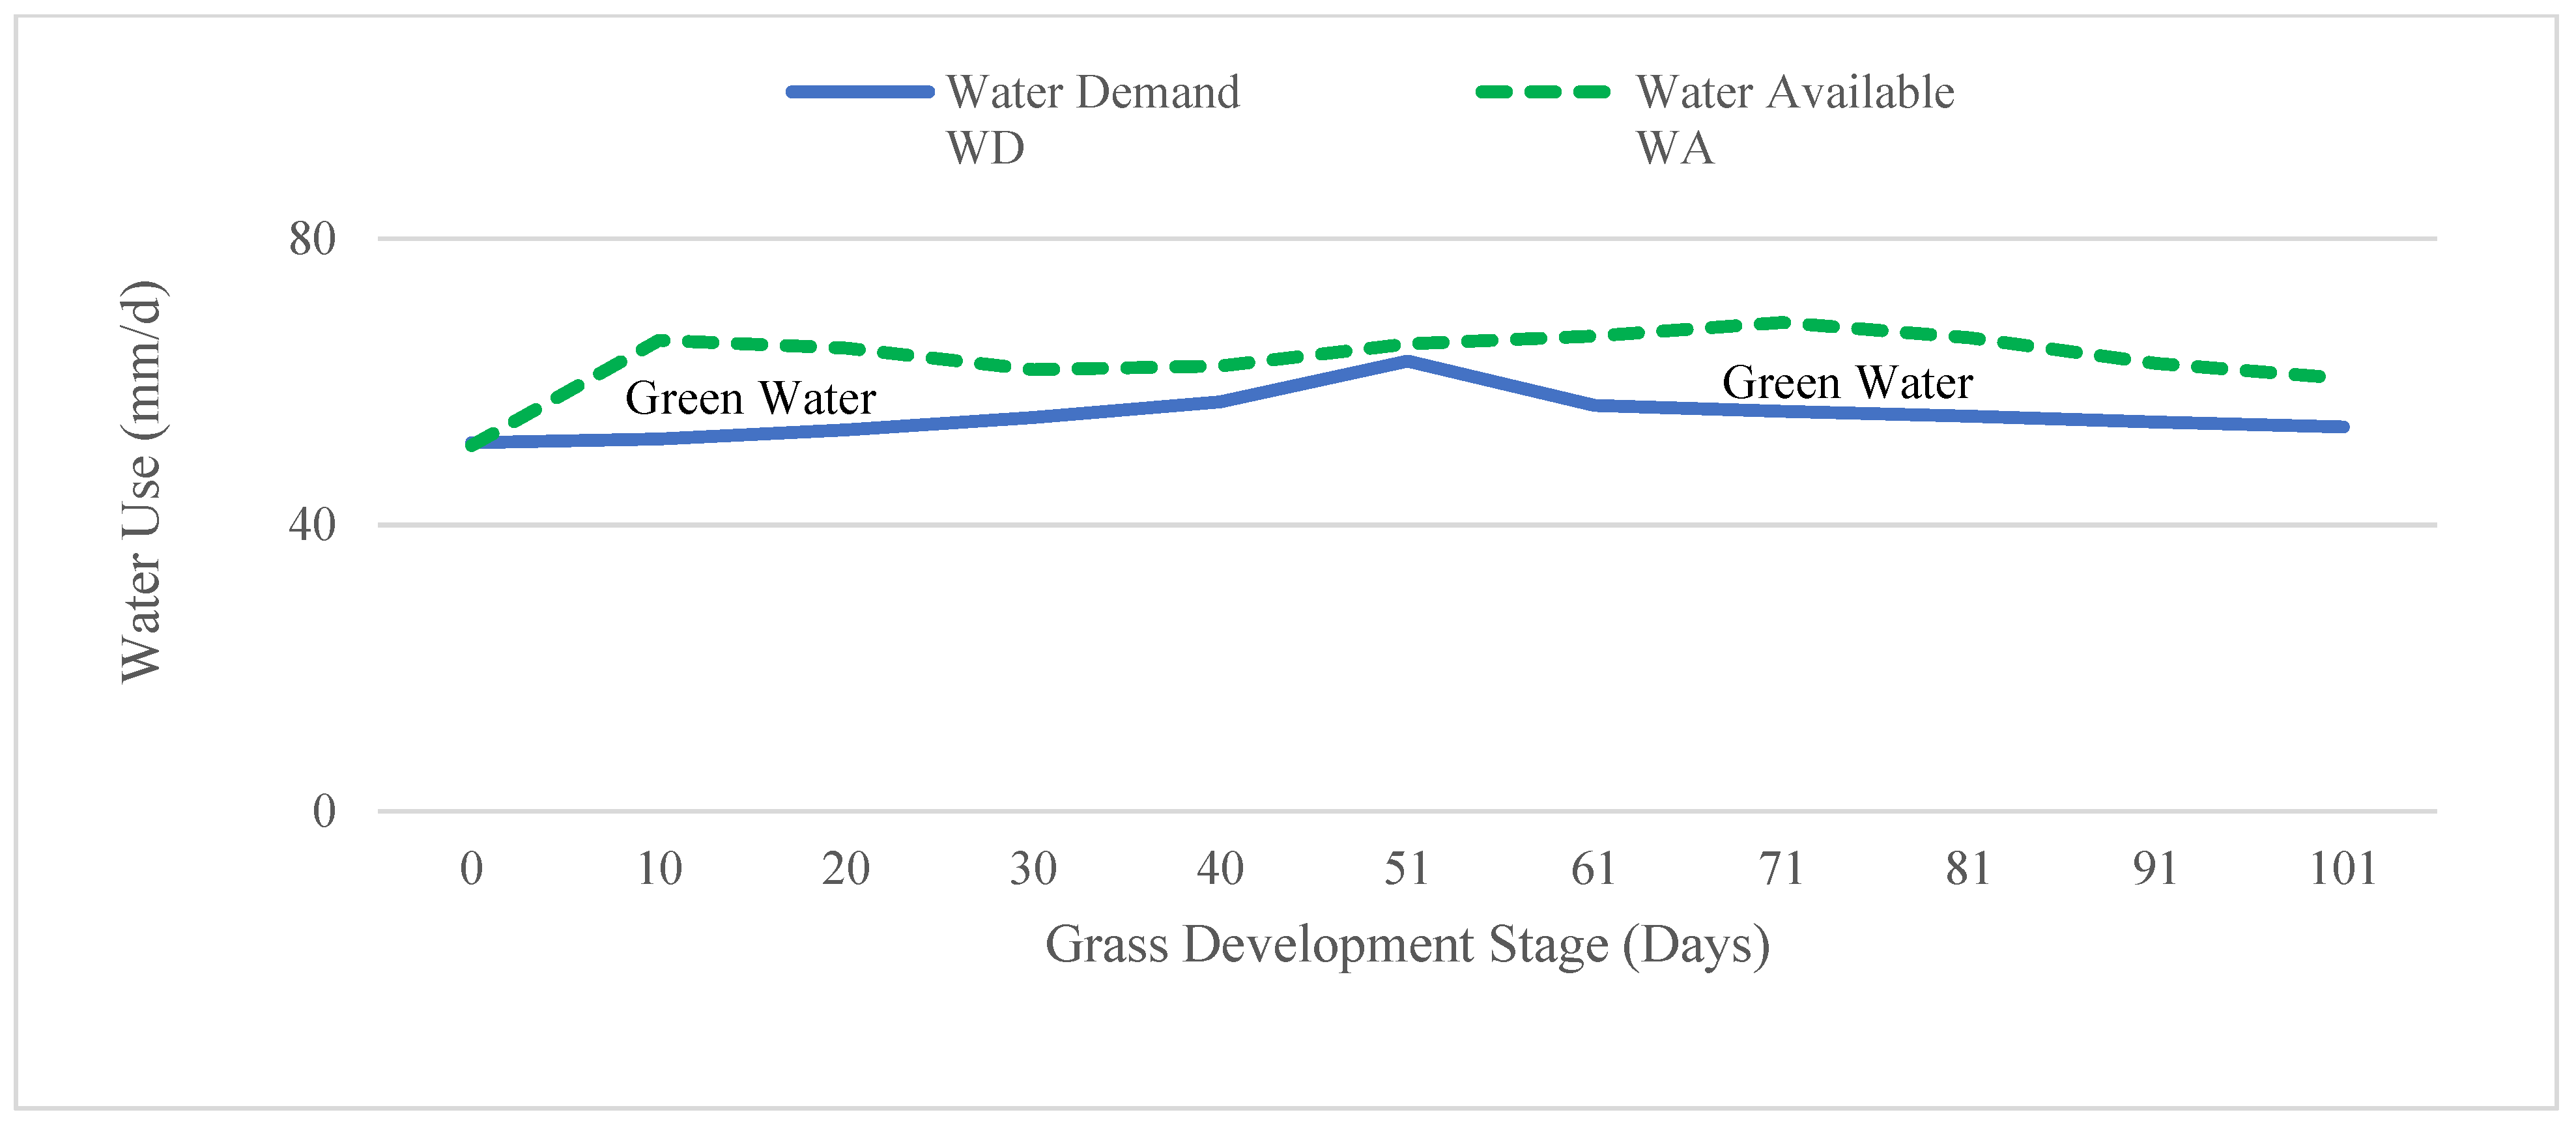
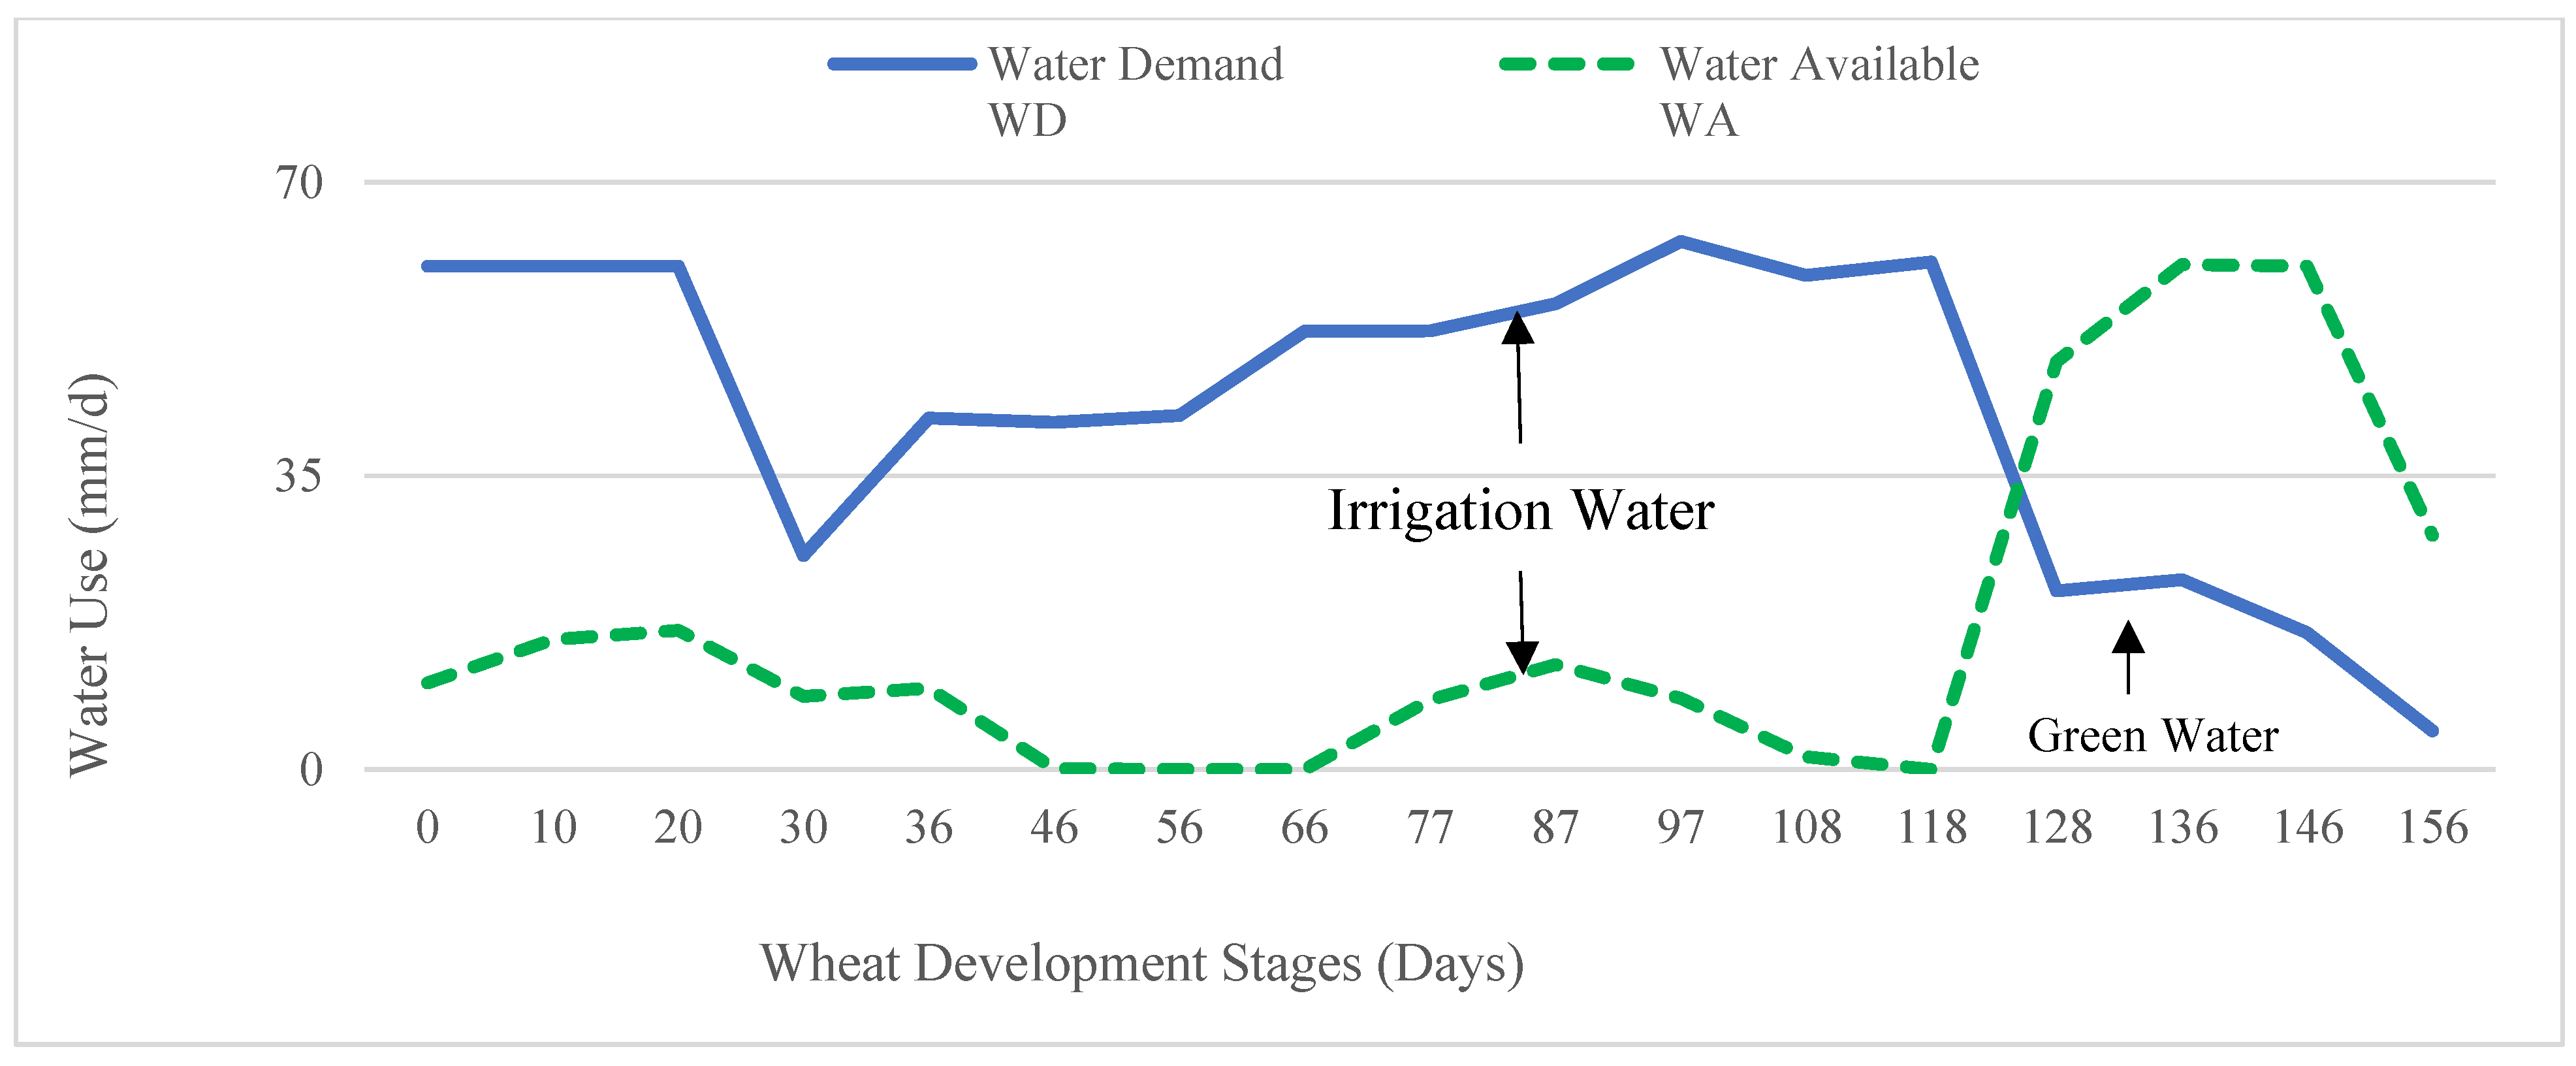
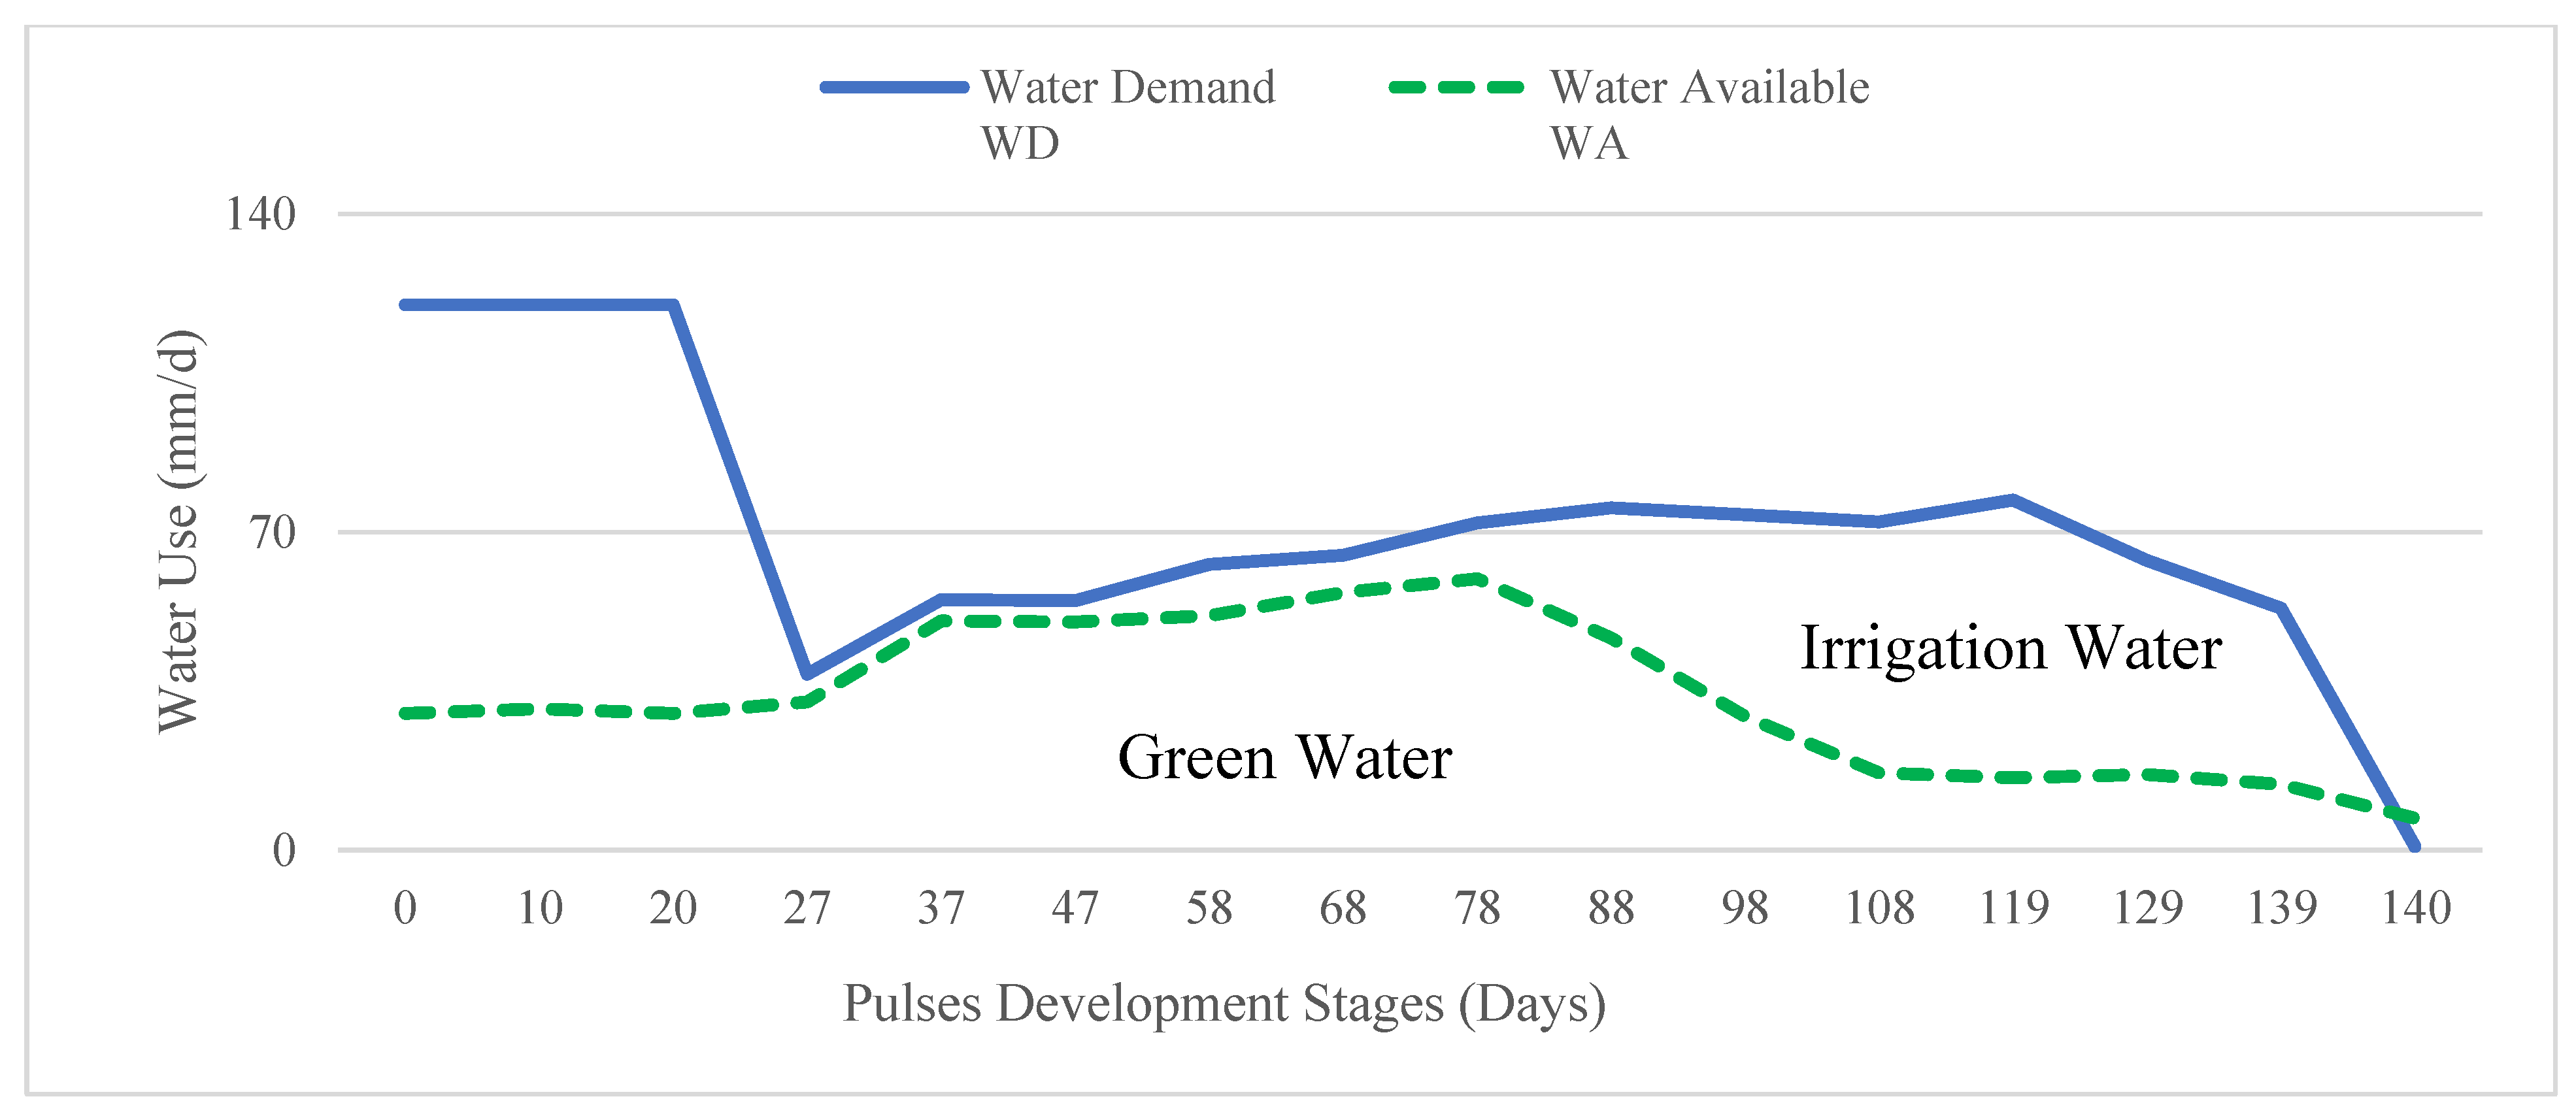
Rice needs irrigation water in its mid stage shown in Figure A1. But the grass in Bangladesh does not require irrigation as it gets enough water from rainfall for the growth. So, pasture has only green water use which has shown in Figure A2. Wheat also requires irrigation water in its mid stage of development (Figure A3). Maize has larger irrigation requirement than pulses on the other hand pulses have larger green water use than maize which is given in the Figure A4 and Figure A5.
Figure A1.
Graphical representation of water demand and water available for rice.

Figure A2.
Graphical representation of water demand and water available for pasture.

Figure A3.
Graphical representation of water demand and water available for wheat.

Maize needs irrigation in its mid stage but water amount is less than rice and wheat shown in Figure A4. On the other hand, pulses need irrigation in last stage (Figure A5) but Bangladesh has many variations of pulses so here the average irrigation water has been considered.
Figure A4.
Graphical representation of water demand and water available for maize.

Figure A5.
Graphical representation of water demand and water available for pulses.

Crop Water Depth (CWD), Crop Water Use (CWU) Calculation: The irrigation requirement (IR), Green Crop Water Depth (CWDgreen) and Blue Crop Water Depth (CWDblue) have been calculated using Equations (A4)–(A6), respectively. The irrigation requirement (IR) or Blue Crop water depth (CWDblue) is calculated as the difference between crop Water Demand (WD) and Water Available (WA) which is Equation (A4). The irrigation requirement is zero if effective rainfall or Water Available is larger than the crop water requirement or Water Demand [42]. This means:
IR = max (0, WD – WA)
CWDgreen = min (WD, Peff)
CWDblue = max (0, IR (WD-WA))
It is assumed that the irrigation requirements are fully met. Green Crop Water Depth (CWDgreen), i.e. Water Use of rainfall, can be equated with the minimum of total crop evapotranspiration (ETc) and effective rainfall (Peff). Blue Crop water depth (CWDblue), i.e., field-evapotranspiration of irrigation water, is equal to the total Water demand (WD) minus Water available (WA), but zero when effective rainfall exceeds water demand (WD) and Equations (A5) and (A6) are used [28,42]:
All water flows are expressed in mm/day or in mm per period of simulation (e.g., 10 days). The average irrigation water requirement and green water use are calculated based on the data for the major district in Bangladesh. Blue water use is calculated by multiplying the irrigation requirement with the irrigated area in each season per district [28]. The green water use in irrigated areas is calculated by multiplying the green water depth by the total area in each season.
The water footprint is the volume of water used to produce a particular good, measured at the point of production [28,29,30,31,32,33]. So, the green and blue water footprints of primary crop by product and crop residue (m3 ton−1) are calculated by dividing the total volume of green and blue water use, CWU (m3 yr−1), respectively, by the quantity of the production (ton yr−1).
Grey Water Footprint of Feed Crops
Grey water footprint indicates the volume of fresh water is needed to assimilate the pollutant load in the water body [25]. Grey WF can be calculated by dividing the pollutant load entering into the water body (L, mass/time) by critical load (Lcritical, mass/time) times run off of the water body (R, volume/time) given in Equation (A7) [7,16].
where, WFgrey is the grey water footprint (m3/year), Cmax is the maximum concentration (kg/m3), Cnat is the natural concentration (kg/m3), f is the leaching-runoff fraction, and Appl is the application rate (kg/year). Critical load, Lcritical refers to the total capacity of the receiving water body to consume the pollutant load. It can be calculated from the ambient water quality standard [43]. It is the subtraction of maximum concentration (Cmax) from the natural concentration (Cnat) of pollutant in the water times the runoff (R) of the water body [11].
For the diffuse source the calculation of the pollutant load of the water body is not straight forward because fertilizers and pesticides are entering into the surface water in a diffuse way. Therefore, it is assumed that a fraction (f) of the applied chemicals reaches to surface water [23,27]. Hence, the calculation of the load becomes fraction (f) multiplied by application rate (Appl). The estimation of the leaching-runoff fraction (f) is also not straight forward given in Equation (A8) [23].
where, the leaching and runoff (f) data for fertilizer component (i.e., nitrogen, phosphorous) must estimate through factors score (Si) and weight (Wi) using Hoekstra et. al (2013), also depends on climate and agricultural practices and its component [23]. Application rate (Appl) of fertilizers for rice [60], maize [64] and wheat [60] in Bangladesh has been be taken from the data available. In Bangladesh cultivable land is limited but used frequently. Mostly local fertilizer cow dung is used other than Urea, TSP, MP, Gypsum etc. are equally popular (Table A2).
Table A2.
Fertilizer application rate in selected crop cultivation of Bangladesh.
| Crop Category | Fertilizers | Application Rate | Total Fertilizer Applied | Water Run off Amount | Volume of Grey Water |
|---|---|---|---|---|---|
| (kg/ha) | (× 106 ton/year) | Million (m3/year) | Million (m3/year) | ||
| Rice a | Cow dung | 20,000 | 3139 | 461.42 | 10,254 |
| Urea | 300 | 47.08 | 7.06 | 156.95 | |
| TSP | 97 | 15.22 | 0.30 | 6.77 | |
| MP | 120 | 18.83 | 1.56 | 34.74 | |
| Gypsum | 112 | 17.58 | 1.46 | 32.42 | |
| Zinc | 10 | 1.57 | 1.02 | 34,005 | |
| Wheat a | Urea | 220 | 23.66 | 4.13 | 82.66 |
| TSP | 150 | 16.13 | 0.28 | 5.65 | |
| MP | 100 | 10.76 | 0.19 | 3.77 | |
| Gypsum | 100 | 10.76 | 6.80 | 136.06 | |
| Borax | 6.5 | 0.70 | 0.03 | 0.58 | |
| Lime | 1000 | 23.66 | 4.13 | 82.66 | |
| Maize b | Cow dung | 5.5 | 0.86 | 0.13 | 2.54 |
| Urea | 464 | 72.82 | 10.92 | 218.47 | |
| TSP | 144 | 22.60 | 0.45 | 9.04 | |
| MP | 113 | 17.74 | 1.47 | 29.44 | |
| Mixed | 100 | 15.69 | 1.30 | 26.05 | |
| Gypsum | 89 | 13.97 | 9.19 | 183.82 | |
| Lime | 87 | 13.65 | 8.98 | 179.69 | |
| Insecticides | 352 | 55.25 | 2.10 | 41.99 | |
| Pulse a | Urea | 44 | 4.32 | 2.81 | 62.36 |
| TSP | 100 | 9.81 | 6.38 | 141.72 | |
| MP | 40 | 3.92 | 2.55 | 56.69 |
Appendix B
Table A3.
Blue water footprint and green water footprint of rice in Bangladesh.
| Station | Volume of Water Use (million m3/year) | Production a (thousand ton/year) | Virtual Water Content (m3/ton) | ||
|---|---|---|---|---|---|
| Blue | Green | Blue | Green | ||
| Barisal | 114 | 16 | 227 | 456 | 63 |
| Bogra | 350 | 48 | 756 | 420 | 57 |
| Comilla | 289 | 53 | 616 | 426 | 79 |
| Chittagong | 121 | 21 | 214 | 515 | 87 |
| Dhaka | 88 | 11 | 201 | 397 | 51 |
| Dinajpur | 341 | 40 | 718 | 430 | 51 |
| Faridpur | 57 | 10 | 140 | 367 | 63 |
| Jessore | 288 | 45 | 654 | 399 | 63 |
| Khulna | 84 | 15 | 199 | 385 | 70 |
| Mymensingh | 482 | 39 | 1076 | 406 | 33 |
| Patuakhali | 5 | 1 | 6 | 682 | 108 |
| Rajshahi | 129 | 22 | 286 | 410 | 69 |
| Rangpur | 251 | 20 | 572 | 397 | 31 |
| Sylhet | 121 | 26 | 200 | 550 | 120 |
| Tangail | 308 | 48 | 683 | 409 | 63 |
Note(s): a Data has been taken from yearbook of agricultural statistics 2016 released from Bangladesh Bureau of Statistics (BBS), Ministry of Planning Division.
Table A4.
Blue water footprint and green water footprint of wheat in Bangladesh.
| Station | Volume of Water Use (million m3/year) | Production a (million ton/year) | Virtual Water Content (m3/ton) | ||
|---|---|---|---|---|---|
| Blue | Green | Blue | Green | ||
| Barisal | 597 | 161 | 1.96 | 277 | 75 |
| Bogra | 1077 | 213 | 4.28 | 228 | 45 |
| Comilla | 794 | 238 | 3.23 | 223 | 67 |
| Chittagong | 2.94 | 0.40 | 0.01 | 381 | 52 |
| Chuadanga | 3089 | 1026 | 18.35 | 153 | 51 |
| Dhaka | 175 | 46 | 0.71 | 223 | 59 |
| Dinajpur | 13,080 | 1588 | 59.77 | 199 | 24 |
| Faridpur | 16,556 | 5995 | 103 | 146 | 53 |
| Jessore | 2202 | 729 | 12.34 | 162 | 54 |
| Khulna | 125 | 54 | 0.56 | 204 | 88 |
| Mymensingh | 1113 | 193 | 4.93 | 205 | 35 |
| Patuakhali | 21.33 | 5.20 | 0.04 | 496 | 121 |
| Rajshahi | 15,934 | 4638 | 92.48 | 156 | 46 |
| Rangpur | 1988 | 239 | 9.30 | 194 | 23 |
| Tangail | 3838 | 1123 | 17.15 | 203 | 59 |
| Sylhet | 54.60 | 9.68 | 0.19 | 261 | 46 |
Note(s): a Data has been taken from yearbook of agricultural statistics 2016 released from Bangladesh Bureau of Statistics (BBS), Ministry of Planning Division.
Table A5.
Blue water footprint and green water footprint of maize in Bangladesh.
| Station | Volume of Water Use (thousand m3/year) | Production a (thousand ton/year) | Virtual Water Content (m3/ton) | ||
|---|---|---|---|---|---|
| Blue | Green | Blue | Green | ||
| Barisal | 68 | 18 | 0.33 | 188 | 49 |
| Bogra | 8945 | 2200 | 58.05 | 140 | 34 |
| Comilla | 6102 | 2060 | 34.05 | 163 | 55 |
| Chittagong | 4.55 | 1.14 | 0.01 | 516 | 129 |
| Chuadanga | 41,284 | 13,688 | 399 | 94 | 31 |
| Dhaka | 3594 | 925 | 26.29 | 124 | 32 |
| Dinajpur | 57,832 | 11,044 | 446 | 118 | 22 |
| Faridpur | 238 | 81 | 2.14 | 101 | 35 |
| Jessore | 213 | 64 | 1.31 | 147 | 44 |
| Khulna | 22 | 9 | 0.14 | 143 | 57 |
| Mymensingh | 322 | 55 | 2.52 | 116 | 20 |
| Patuakhali | 42.32 | 12.37 | 0.18 | 210 | 61 |
| Rajshahi | 10,169 | 3386 | 70.24 | 131 | 44 |
| Rangpur | 15,527 | 2411 | 115 | 123 | 19 |
| Tangail | 620 | 181 | 3.79 | 148 | 43 |
Note(s): a Data has been taken from yearbook of agricultural statistics 2016 released from Bangladesh Bureau of Statistics (BBS), Ministry of Planning Division.
Table A6.
Blue water footprint and green water footprint of pulse in Bangladesh.
| Station | Volume of Water Use (×105 m3/year) | Productiona (thousand ton/year) | Virtual Water Content (m3/ton) | ||
|---|---|---|---|---|---|
| Blue | Green | Blue | Green | ||
| Barisal | 137 | 124 | 16.64 | 748 | 675 |
| Bogra | 6.57 | 5.06 | 0.95 | 626 | 482 |
| Chittagong | 7.97 | 8.72 | 1.14 | 636 | 697 |
| Chuadanga | 13.72 | 11.56 | 2.24 | 557 | 469 |
| Dhaka | 9.04 | 6.08 | 1.31 | 626 | 421 |
| Dinajpur | 1.38 | 0.94 | 0.22 | 566 | 386 |
| Faridpur | 102 | 104 | 21.81 | 425 | 431 |
| Jessore | 60 | 54 | 10.84 | 499 | 456 |
| Khulna | 1.77 | 2.12 | 0.37 | 430 | 514 |
| Mymensingh | 4.06 | 3.46 | 0.77 | 481 | 410 |
| Patuakhali | 50 | 68 | 10.38 | 439 | 597 |
| Rajshahi | 109 | 110 | 28.04 | 353 | 355 |
| Rangpur | 0.82 | 0.69 | 0.16 | 458 | 382 |
| Tangail | 19.78 | 18.13 | 2.22 | 809 | 742 |
Note(s): a Data has been taken from yearbook of agricultural statistics 2016 released from Bangladesh Bureau of Statistics (BBS), Ministry of Planning Division.
References
- Azom, M.R.; Mahmud, K.; Yahya, A.; Sontu, S.; Himon, S. Environmental Impact Assesment of Tanneries: A case Study of Hazaribag in Bangladesh. Int. J. Environ. Sci. Dev. 2012, 3, 151–156. [Google Scholar]
- Masi, C.; Getachew, G.; Mesfin, T. Isolation; screening; characterization, and identification of alkaline protease-producing bacteria from leather industry effluent. Ann. Microbiol. 2021, 71, 24. [Google Scholar] [CrossRef]
- Hansen, E.; Patrice, M.A.; Mariliz, G. Environmental assessment of water, chemicals and effluents in leather post-tanning process: A review. Environ. Impact Assess. Rev. 2021, 89, 106597. [Google Scholar] [CrossRef]
- Dixit, S.; Yadav, A.; Dwivedi, P.; Das, M. Toxic Hazards of Leather Industry and Technologies to Combat Threat: A Review. J. Clean. Prod. 2015, 87, 39–49. [Google Scholar] [CrossRef]
- Durai, G.; Rajasimmam, M. Biological treatment of tannery wastewater: A review. J. Environ. Sci. Technol. 2011, 4, 1–17. [Google Scholar] [CrossRef] [Green Version]
- Suman, H.; Vikas, K.S.; Manish, V. Treatment of tannery industry effluent by electrochemical methods: A review. Mater. Today Proc. 2021, 47, 1438–1444. [Google Scholar] [CrossRef]
- Sawalha, H.; Alsharabaty, R.; Sarsour, S.; Al-Jabari, M. Wastewater from leather tanning and processing in Palestine: Characterization and management aspects. J. Environ. Manag. 2019, 251, 109596. [Google Scholar] [CrossRef]
- Covington, A. Tanning Chemistry: The Science of Leather; RSC Publishing: Cambridge, UK, 2009. [Google Scholar]
- Berman, H.; Bella, J.; Brodsky, B. Hydration Structure of Collagen Peptide. Structure 1995, 3, 893–906. [Google Scholar]
- Akan, J.; Moses, E.; Ogugbuaja, V. Assessment of tannery industrial effluent from Kano metropolis. Asian Network for Scientific Information. J. Appl. Sci. 2007, 7, 2788–2793. [Google Scholar] [CrossRef] [Green Version]
- Hoekstra, A.Y.; Chapagain, A.K.; Aldaya, M.M.; Mekonnen, M.M. Water Footprint Mannual; Water Footprint Network: Enschede, The Netherlands, 2009. [Google Scholar]
- Laurenti, R.; Redwood, M.; Puig, R.; Frostell, B. Measuring the environmental footprint of leather processing technologies. J. Ind. Ecol. 2017, 21, 1180–1187. [Google Scholar] [CrossRef]
- Hou, S.; Liu, Y.; Zhao, X.; Tillotson, M.R.; Guo, W.; Li, Y. Blue and green water footprint assessment for China—A multi-region input–output approach. Sustainability 2018, 10, 2822. [Google Scholar] [CrossRef] [Green Version]
- Kumar, P.S.; Ngueagni, P.T.; Woumfo, E.D.; Vardhan, K.H. Water Footprint in Leather Tanning and Steel Production; Springer: Singapore, 2021; pp. 137–156. [Google Scholar]
- Hoekstra, A.; Chapagain, A.; Aldaya, M.; Mekonnen, M. Water Footprint Assessment Manual; Routledge: London, UK, 2011. [Google Scholar]
- EPB. Leather Export Data; Export Promotion Bureau: Dhaka, Bangladesh, 2020.
- LFMEAB. Export Performances of leather Sector in Bangladesh; Leather Goods and Footwear Manufacturers and Exporters Association of Bangladesh: Dhaka, Bangladesh, 2019. [Google Scholar]
- Fatemi, M.; Rahman, T. Regeneration of the Hazaribagh urban brownfield: An imperative for Dhaka’s sustainable urban development. Urani Izziv 2015, 2, 132–145. [Google Scholar] [CrossRef]
- Khondokar, B.H.; Rahman, M.M. Rapid Assessment of Hazaribagh and Savar Tanneries; South Asian Network on Economic Modeling (SANEM): Dhaka, Bangladesh, 2017. [Google Scholar]
- BBS. Yearbook of Agricutural Statistics—2016; Bangladesh Bureau of Statistics: Dhaka, Bangladesh, 2017.
- Buljan, J.; Reich, G.; Ludvik, J. Mass Balance in Leather Processing; UNIDO, South East Asia: Bangkok, Thailand, 2000. [Google Scholar]
- European Comission. Refecence Documents on Best Available Technique for the Tanning of Hides and Skins; Integrated Pollution Prevention and Control, IPPC: Rome, Italy, 2003.
- Franke, N.; Boyacioglu, H.; Hoekstra, A. Grey Water Footprint Accounting: Tier 1 Supporting Guidelines; Water Footprint Network: Enschede, The Netherlands, 2013. [Google Scholar]
- Hoekstra, A.; Chapagain, A. Globalization of Water: Sharing the Planet’s Freshwater Resources; Blackwell Publishing Ltd.: Oxford, UK, 2008. [Google Scholar]
- Hoekstra, A.Y.; Chapagain, A.K.; Aldaya, M.M.; Mekonnen, M.M. The Water Footprint Assessment Manual: Setting the Global Standard; Earthscan: London, UK, 2011. [Google Scholar]
- Mekonnen, M.M.; Hoekstra, A.Y. A global and high resolution assessment of the green, blue and grey water footprint of wheat. Hydrol. Earth Syst. Sci. 2010, 14, 1259–1276. [Google Scholar] [CrossRef] [Green Version]
- Mekonnen, M.; Hoekstra, A. The green, blue and grey water footprint of crops and derived crop products. Hydrol. Earth Syst. Sci. 2011, 15, 5. [Google Scholar] [CrossRef] [Green Version]
- Chapagain, A.K.; Hoekstra, A.Y. The Blue, Green and Grey Water Footprint of Rice from Production and Consumption Perspectives; Series No. 40; Delft, UNESCO-IHE: Delft, The Netherlands, 2010. [Google Scholar]
- Chapagain, A.; Hoekstra, A. Virtual Water Flows between Nations in Relation to Trade in Livestock and Livestock Products; Value of Water Research Report Series No. 13; UNESCO-IHE: Delft, The Netherlands, 2003. [Google Scholar]
- Chapagain, A.; Hoekstra, A. Water Footprints of Nations; Value of Water Research Report Series No. 16; UNESCO-IHE: Delft, The Netherlands, 2004. [Google Scholar]
- Chapagain, A.; Hoekstra, A. The water footprint of coffee and tea consumption in the Netherlands. Ecol. Econ. 2007, 64, 109–118. [Google Scholar] [CrossRef]
- Oki, T.; Kanae, S. Virtual water trade and world water resources. Water Sci. Technol. 2004, 49, 203–209. [Google Scholar] [CrossRef]
- Hoekstra, A.; Hung, P. Globalization of water resources: International virtual water flows in relation to crop trade. Glob. Environ. Change 2005, 15, 45–56. [Google Scholar] [CrossRef]
- Allen, R.; Pereira, L.; Raes, D.; Smith, M. Crop Evapotranspiration: Guidelines for Computing Crop Water Requirements; United Nations, FAO: New York, NY, USA, 1998. [Google Scholar]
- Huque, K.; Sarker, N. Feeds and feeding of livestock in Bangladesh: Performance, constraints and options forward. Bang. J. Anim. Sci. 2014, 43, 1–10. [Google Scholar] [CrossRef] [Green Version]
- Sarker, N.R.; Habib, A.; Bashar, M.K.; Amin, M.R.; Tabassum, F.; Yeasmin, D. Feeds and Forage Availability, Utilization and Management Practices for Livestock in Some Selected Coastal Areas of Bangladesh. J. Exp. Agric. Int. 2016, 14, 1–11. [Google Scholar] [CrossRef]
- Ali, M.; Hossain, M.; Akhter, S.; Islam, M.; Hashem, M. Effect of age on slaughterhouse by-products of indigenous cattle of Bangladesh. Bang. J. Anim. Sci. 2013, 42, 62–66. [Google Scholar] [CrossRef] [Green Version]
- Salehi, M.; Kadim, I.; Mahgoub, O.; Negahdari, S.; Naeeni, R.S.E. Effects of type, sex and age on goat skin and leather characteristics. Anim. Prod. Sci. 2014, 54, 638–644. [Google Scholar] [CrossRef]
- Parker, D.B.; Brown, M.S. Water Consumption for Livestock and Poultry Production. In Encyclopedia of Water Science; Marcel Dekker Inc.: New York, NY, USA, 2003. [Google Scholar]
- Khatun, M.; Amin, M.; Alam, M.; Khan, M. Effect of market age on production of goat meat and skin. Bang. J. Anim. Sci. 2013, 42, 67–70. [Google Scholar] [CrossRef]
- Sarkar, K. Theory and Practice of Leather Manufacture; Revised edition, second avenue; The Author: Madras, India, 1997. [Google Scholar]
- Hoekstra, A.; Chapagain, A.; Aldaya, M.; Mekonnen, M. Water Footprint Manual. Science Press: Enschede, The Netherlands, 2009; pp. 22–23. [Google Scholar]
- ECR. Environmental Conservation Rules; Department of Environment, Ministry of Environment and Forest: Dhaka, Bangladesh, 1997.
- BUET. Environmental Impact Assessment for Western Bangladesh Bridge Improvement Project; Department of Chemical Engineering, Bangladesh University of Engineering & Technology Bangladesh: Dhaka, Bangladesh, 2014. [Google Scholar]
- Islam, B.; Musa, A.; Ibrahim, E.; Sharafa, S.; Elfaki, B. Evaluation and characterization of tannery wastewater. J. For. Prod. Ind. 2014, 3, 141e150. [Google Scholar]
- Lofrano, G.; Aydin, E.; Russo, F.; Guida, M.; Belgiorno, V.; Meric, S. Characterization, fluxes and toxicity of leather tanning bath chemicals in a large tanning district area (IT). Water Air Soil 2008, 8, 529–542. [Google Scholar] [CrossRef]
- Tunay, O.; Kabdasli, I.; Orhon, D.; Ates, E. Characterization and pollution profile of leather tanning industry in Turkey. Water Sci. Technol. 1995, 32, 1–9. [Google Scholar] [CrossRef]
- Lofrano, G.; Meriç, S.; Zengin, G.E.; Orhon, D. Chemical and biological treatment technologies for leather tannery chemicals and wastewaters: A review. Sci. Total. Environ. 2013, 461–462, 265–281. [Google Scholar] [CrossRef] [PubMed]
- Genawi, N.M.; Ibrahim, M.H.; El-Naas, M.H.; Alshaik, A.E. Chromium removal from tannery wastewater by electrocoagulation: Optimization and sludge characterization. Water 2020, 12, 1374. [Google Scholar] [CrossRef]
- Prokkola, H.; Heponiemi, A.; Pesonen, J.; Kuokkanen, T.; Lassi, U. Reliability of Biodegradation Measurements for Inhibitive Industrial Wastewaters. ChemEngineering 2022, 6, 15. [Google Scholar] [CrossRef]
- Zakmout, A.; Sadi, F.; Portugal, C.A.M.; Crespo, J.G.; Velizarov, S. Tannery Effluent Treatment by Nanofiltration, Reverse Osmosis and Chitosan Modified Membranes. Membranes 2020, 10, 378. [Google Scholar] [CrossRef]
- Apaydin, O.; Kurt, U.; Gonullu, M. An investigation on tannery wastewater by electrocoagulation. Glob. Nest J. 2009, 11, 546–555. [Google Scholar]
- Kanagaraj, J.; Senthilvelan, T.; Panda, R.; Kavitha, S. Eco-friendly waste management strategies for greener environmenttowards sustainable development in leather industry: Acomprehensive review. J. Clean. Prod. 2015, 89, 1–17. [Google Scholar] [CrossRef]
- Karahan, O.; Dogruel, S.; Dulekgurgen, E.; Orhon, D. COD fractionation of tannery wastewaters—Particle size distribution, biodegradability and modeling. Water Res. 2008, 42, 1083–1092. [Google Scholar] [CrossRef]
- Lofrano, G.; Belgiorno, V.; Gallo, M.; Raimo, A.; Meric, S. Toxicity reduction in leather tanning wastewater by improved coagulation flocculation process. Glob. Nest J. 2006, 8, 151–158. [Google Scholar]
- Zotarelli, L.; Dukes, M.; Romero, C.; Migliaccio, K.; Morgan, K. Step by Step Calculation of the Penman–Monteith Evapotranspiration (FAO-56 Method) AE459; Agricultural and Biological Engineering Department, FAO: Rome, Italy, 2010. [Google Scholar]
- Dastane, N.G. Effective Rainfall in Irrigated Agriculture; Natural Resources Management and Environment Department, FAO: Rome, Italy, 1974. [Google Scholar]
- Shill, N.C.; Saleque, M.A.; Islam, M.R.; Jahiruddin, M. Soil Fertility Status of Some of The Intensive Crop Growing Areas Under Major Agro Ecological Zones of Bangladesh. Bangladesh J. Agril. Res. 2016, 41, 735–757. [Google Scholar] [CrossRef]
- Chowdhury, M.A.H.; Hassan, M.S. Hand Book of Agricultural Technology; Bangladesh Agricultural Research Council: Dhaka, Bangladesh, 2013; 230p.
- Forestry and Fisheries. Production Guideline for Wheat; Forestry and Fisheries, Department of Agriculture: Cape Town, Republic of South Africa, 2010.
- FAO. AQUASTAT On-Line Database. 2008. Available online: http://faostat.fao.org (accessed on 1 March 2019).
- Sacks, W.J.; Deryn, D.G.; Foley, J.A.; Ramankutty, N. Crop planting dates: An analysis of global patterns. Glob. Ecol. Biogeogr. 2010, 19, 607–620. [Google Scholar] [CrossRef]
- Portmann, F.T.; Siebert, S.; Döll; Mirca, P. Global monthly irrigated and rainfed crop areas around the year 2000: A new high-resolution data set for agricultural and hydrological modelling. Glob. Biogeochem. Cycles 2000, 24, GB1011. [Google Scholar] [CrossRef]
- Moniruzzaman, M.; Karim, M.; Alam, Q.M. Agro-Economic Analysis of Maize Production in Bangladesh: A Farm Level Study. Bangladesh J. Agril. Res. 2009, 34, 15–24. [Google Scholar] [CrossRef]
Figure 1.
Overview of leather processing from feed crop cultivation to finished product.

Figure 2.
Pollution load of (a) soaking, (b) liming stage of beam house operations post tanning operations, (c) deliming and bating, (d) pickling and tanning stage of tan yard operations and (e) wet back, (f) rechroming (g) neutralization, (h) retanning, (i) dyeing and (j) fatliqouring in leather production.


Figure 3.
Water footprint of (a) feed crops for farming animals in Bangladesh: (i) Green water footprint. (ii) Blue water footprint. (iii) Grey water footprint. (b) Raw hides: (i) Bovine hide and (ii) Ovine skin. (c) Beam house operations: (i) Blue water footprint. (ii) Grey water footprint. (d) Tan yard operations: (i) Blue water footprint. (ii) Grey water footprint. (e) Post tanning operations: (i) Blue water footprint. (ii) Grey water footprint. (f) Mechanical operations: (i) Blue water footprint. (ii) Grey water footprint.


Figure 4.
Water footprint (green, blue and grey) of (a) wet blue leather and (b) crust leather. (c) Bovine finished leather and (d) ovine finished leather.
Figure 4.
Water footprint (green, blue and grey) of (a) wet blue leather and (b) crust leather. (c) Bovine finished leather and (d) ovine finished leather.


Figure 5.
Effluent and pollutant generated by leather processing factories in Bangladesh from FY 2013 to FY 2020: (a) effluent generation, (b) pollutant generation and oxygen demand from leather processing factories.
Figure 5.
Effluent and pollutant generated by leather processing factories in Bangladesh from FY 2013 to FY 2020: (a) effluent generation, (b) pollutant generation and oxygen demand from leather processing factories.

Figure 6.
Volume and characteristics of effluent generated by different stages of leather processing. (a) Effluent generation from leather processing stages. (b) Pollution load contribution from different stages of leather processing: (i) BOD, (ii) COD, (iii) TDS and (iv) TSS. (c) Biodegradability profile of leather processing effluents from different stages.


Figure 7.
Water footprint of feed crops, bovine hide and goatskin. (a) Green, blue and grey water footprint distribution (%) of feed crops. (b) Annual water footprint of bovine hide and goatskin (i) green water footprint, (ii) blue water footprint, (iii) grey water footprint and (iv) total water footprint. (c) Green, blue and grey water footprint distribution (%) of (i) bovine hide and (ii) goatskin.


Figure 8.
Water footprint of leather processing (FY 2013-FY2020). (a) Blue water footprint of leather processing (FY 2013-FY2020). (b) Grey water footprint of leather processing (FY 2013-FY2020). (c) Total water footprint of leather processing (FY 2013-FY2020).
Figure 8.
Water footprint of leather processing (FY 2013-FY2020). (a) Blue water footprint of leather processing (FY 2013-FY2020). (b) Grey water footprint of leather processing (FY 2013-FY2020). (c) Total water footprint of leather processing (FY 2013-FY2020).

Figure 9.
Water footprint analysis for farming and leather processing stages. (a) Distribution (%) of total water footprint by different leather processing stages, (b) Contribution (%) of farming and leather processing operations in total water footprint, (c) Contribution (%) of farming and leather processing operations in blue water footprint, (d) Contribution (%) of farming and leather processing operations in grey water footprint.

Table 1.
Water consumption rate (%) for leather production in tanneries in Bangladesh.
| Main Stages | Sub Stages | Consumption Rate (%) |
|---|---|---|
| Soaking | Pre soaking | 300% of raw weight a |
| Main soaking | 300% of raw weight | |
| Washing | 100% of raw weight | |
| Liming | Bath | 300% of raw weight |
| Washing | 600% of raw weight | |
| Fleshing and unhairing | 3 kg of per 15 sq ft e | |
| Chemical Wash | Washing | 200% of pelt weight b |
| Deliming and Bating | Bath | 100% of pelt weight |
| Pickling and Tanning | Washing | 300% of pelt weight |
| Bath | 100% of pelt weight | |
| Wet back | Bath | 200% of wet blue shaved weight c |
| Rechroming | Washing | 200% of wet blue shaved weight |
| Bath | 100% of wet blue shaved weight | |
| Neutralization | Washing | 200% of wet blue shaved weight |
| Bath | 150% of wet blue shaved weight | |
| Retanning | Washing | 150% of wet blue shaved weight |
| Bath | 150% of wet blue shaved weight | |
| Fatliquoring | Bath | 150% of wet blue shaved weight |
| Dyeing | Bath | 200% of wet blue shaved weight |
| Top dyeing | 200% of wet blue shaved weight | |
| Washing | 200% of wet blue shaved weight | |
| Finishing | 0.02 kg of per 1 sq ft e crust leather d |
Note(s): (A Standard consumption data has been followed for the purpose of simplification, helped by Bangladesh Tanners Association). a raw weight is the weight of raw hide and skin. b pelt weight is the weight of the soaked and limed hide and skin. c wet blue shaved weight is the weight of the processed hide and skin through beam house and tan yard operations. d crust leather is wet blue leather processed by post tanning processes. e sq ft means square feet.
Table 2.
Pollutants concentration in effluent from each stage of tanneries and in groundwater, surface water, and ambient water quality standard.
Table 2.
Pollutants concentration in effluent from each stage of tanneries and in groundwater, surface water, and ambient water quality standard.
| Stages | Sub Stages | Effluent Volume (×105) (m3/year) | Pollutant Load | |
|---|---|---|---|---|
| BOD (mg/L) | COD (mg/L) | |||
| Soaking | Pre soaking | 4.14 | 2500 | 15,900 |
| Main soaking | 4.14 | 1810 | 9564 | |
| Washing | 2.15 | 1200 | 4667 | |
| Liming | Main Bath | 4.14 | 2500 | 59,698 |
| Washing | 12.9 | 2200 | 4462 | |
| Chemical Wash | Washing | 2.00 | 693 | 1184 |
| Deliming and Bating | Washing | 2.00 | 1980 | 10,258 |
| Pickling and Tanning | Main Bath | 0.99 | 1816 | 6523 |
| Wet back | Main Bath | 1.16 | 855 | 2254 |
| Rechroming | Washing | 0.58 | 2367 | 24,971 |
| Neutralization | Main Bath | 0.43 | 1440 | 5545 |
| Washing | 0.43 | 772 | 2322 | |
| Retanning | Main Bath | 0.43 | 1988 | 38,482 |
| Fatliquoring | Main Bath | 0.43 | 3147 | 26,034 |
| Dyeing | Main Bath | 0.29 | 2421 | 8208 |
| Ground water a | 3.00 | 10.00 | ||
| Surface water a | 5.00 | 15.00 | ||
| Water quality standard a | 12.00 | 200 | ||
Note(s): a Water quality standards were available in ECR, 1997 (DoE).
Table 3.
Physiochemical characteristics of effluent in each stage of leather processing.
| Stages | Sub Stages | pH | BOD (mg/L) | COD (mg/L) | TDS (mg/L) | TSS (mg/L) | |||||
|---|---|---|---|---|---|---|---|---|---|---|---|
| M a | SD b | M | SD | M | SD | M | SD | M | SD | ||
| Soaking | Pre soaking | 6.99 | 0.18 | 2500 | 320 | 15,900 | 7443 | 4440 | 978 | 1240 | 247 |
| Main soaking | 9.82 | 1.36 | 1810 | 278 | 9564 | 3552 | 17,078 | 7718 | 11,109 | 5547 | |
| Washing | 7.34 | 0.25 | 1200 | 266 | 4667 | 1032 | 17,078 | 3607 | 14,700 | 2699 | |
| Liming | Main Bath | 11.94 | 0.67 | 2500 | 555 | 59,698 | 25,353 | 14,720 | 6403 | 51,369 | 11,256 |
| Washing | 12.93 | 0.73 | 2200 | 238 | 4462 | 372 | 5210 | 1047 | 3670 | 782 | |
| Chemical Wash | Washing | 9.16 | 0.24 | 693 | 301 | 1184 | 210 | 2230 | 404 | 1240 | 201 |
| Deliming and Bating | Washing | 8.07 | 0.42 | 1980 | 644 | 10,258 | 6893 | 20,250 | 7393 | 27,942 | 5195 |
| Pickling and Tanning | Main Bath | 3.47 | 0.85 | 1816 | 451 | 6523 | 1906 | 24,148 | 13,548 | 45,488 | 27,457 |
| Wet back | Main Bath | 2.19 | 0.59 | 855 | 90 | 2254 | 739 | 6954 | 1292 | 6181 | 2388 |
| Rechroming | Washing | 3.85 | 0.37 | 2367 | 240 | 24,971 | 18,217 | 7493 | 2175 | 11,431 | 8752 |
| Neutralization | Main Bath | 4.69 | 1.07 | 1440 | 261 | 5545 | 1188 | 9085 | 4632 | 12,017 | 11,719 |
| Washing | 5.03 | 0.52 | 772 | 216 | 2322 | 192 | 4030 | 493 | 2895 | 95 | |
| Retanning | Main Bath | 5.50 | 1.01 | 1988 | 628 | 38,482 | 19,374 | 10,053 | 1996 | 21,651 | 6174 |
| Fatliquoring | Main Bath | 4.98 | 1.84 | 3147 | 139 | 26,034 | 15,417 | 7493 | 2857 | 19,477 | 13,493 |
| Dyeing | Main Bath | 4.47 | 0.96 | 2421 | 489 | 8208 | 1139 | 5057 | 3340 | 9039 | 6364 |
Note(s): a M mean value. b SD standard deviation.
Disclaimer/Publisher’s Note: The statements, opinions and data contained in all publications are solely those of the individual author(s) and contributor(s) and not of MDPI and/or the editor(s). MDPI and/or the editor(s) disclaim responsibility for any injury to people or property resulting from any ideas, methods, instructions or products referred to in the content. |
© 2023 by the authors. Licensee MDPI, Basel, Switzerland. This article is an open access article distributed under the terms and conditions of the Creative Commons Attribution (CC BY) license (https://creativecommons.org/licenses/by/4.0/).
Share and Cite
MDPI and ACS Style
Humayra, S.; Hossain, L.; Hasan, S.R.; Khan, M.S. Water Footprint Calculation, Effluent Characteristics and Pollution Impact Assessment of Leather Industry in Bangladesh. Water 2023, 15, 378. https://doi.org/10.3390/w15030378
AMA Style
Humayra S, Hossain L, Hasan SR, Khan MS. Water Footprint Calculation, Effluent Characteristics and Pollution Impact Assessment of Leather Industry in Bangladesh. Water. 2023; 15(3):378. https://doi.org/10.3390/w15030378
Chicago/Turabian StyleHumayra, Sumaya, Laila Hossain, Selim Reza Hasan, and Mohidus Samad Khan. 2023. "Water Footprint Calculation, Effluent Characteristics and Pollution Impact Assessment of Leather Industry in Bangladesh" Water 15, no. 3: 378. https://doi.org/10.3390/w15030378
Note that from the first issue of 2016, this journal uses article numbers instead of page numbers. See further details here.