
Post-Construction, Hydromorphological Cumulative Impact Assessment: An Approach at the Waterbody Level Integrating Different Spatial Scales

Abstract
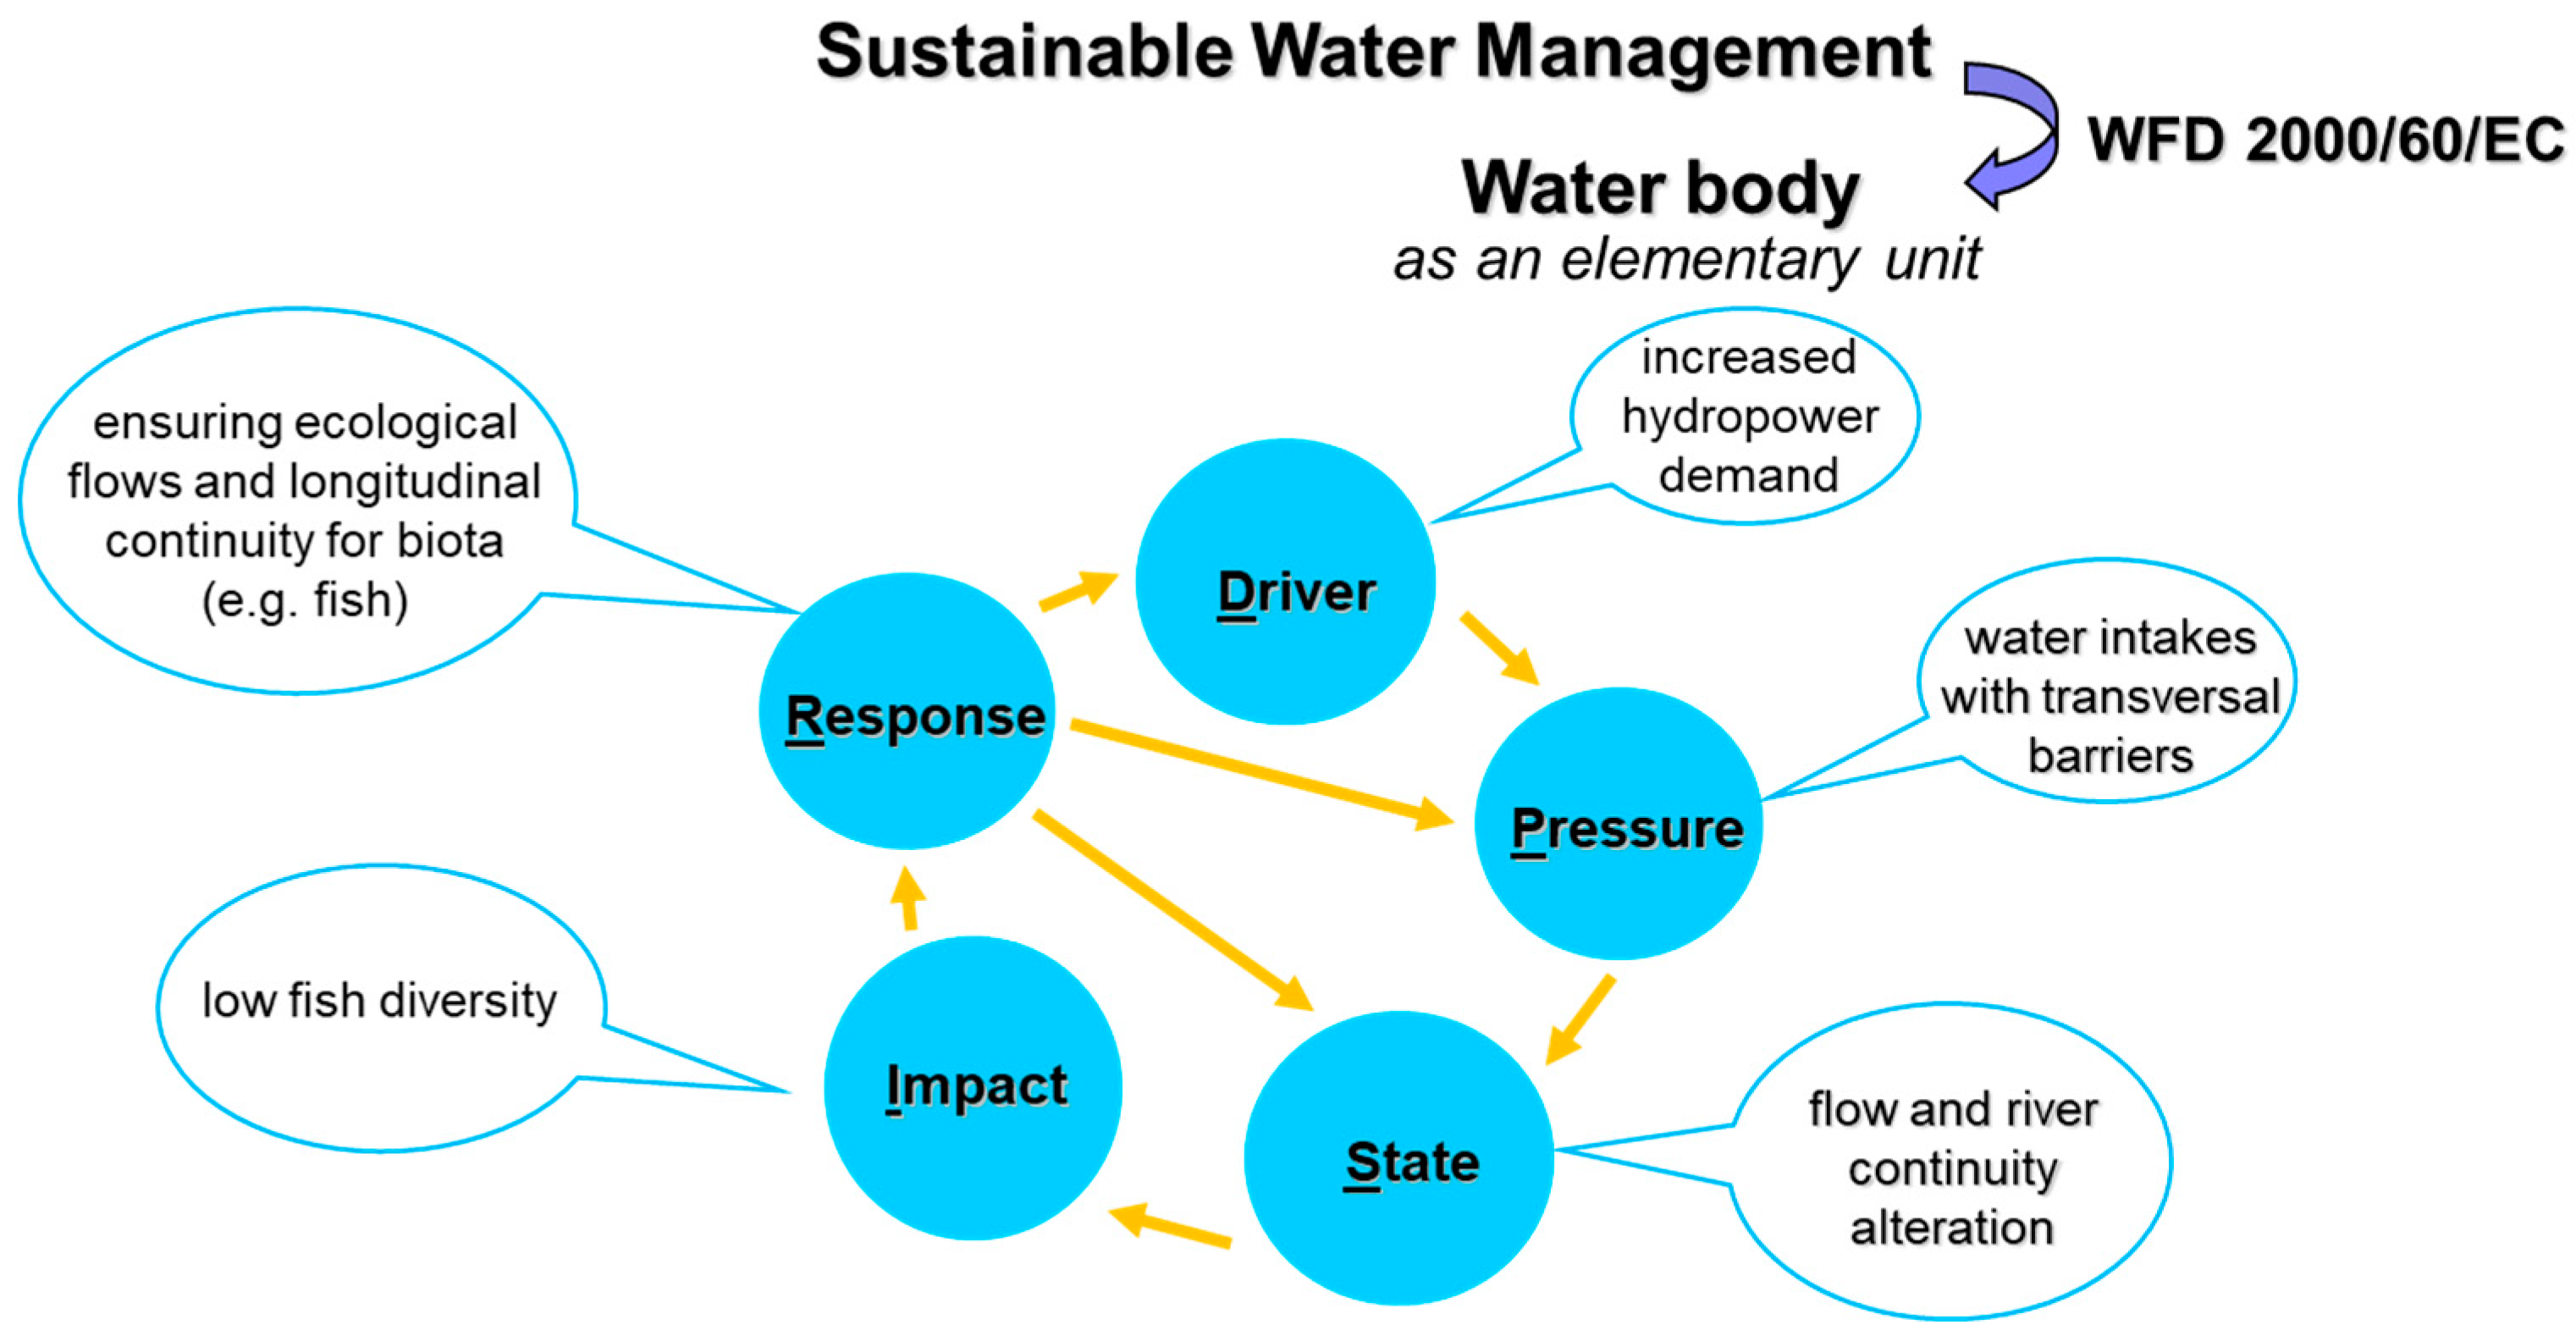
:1. Introduction
2. Materials and Methods
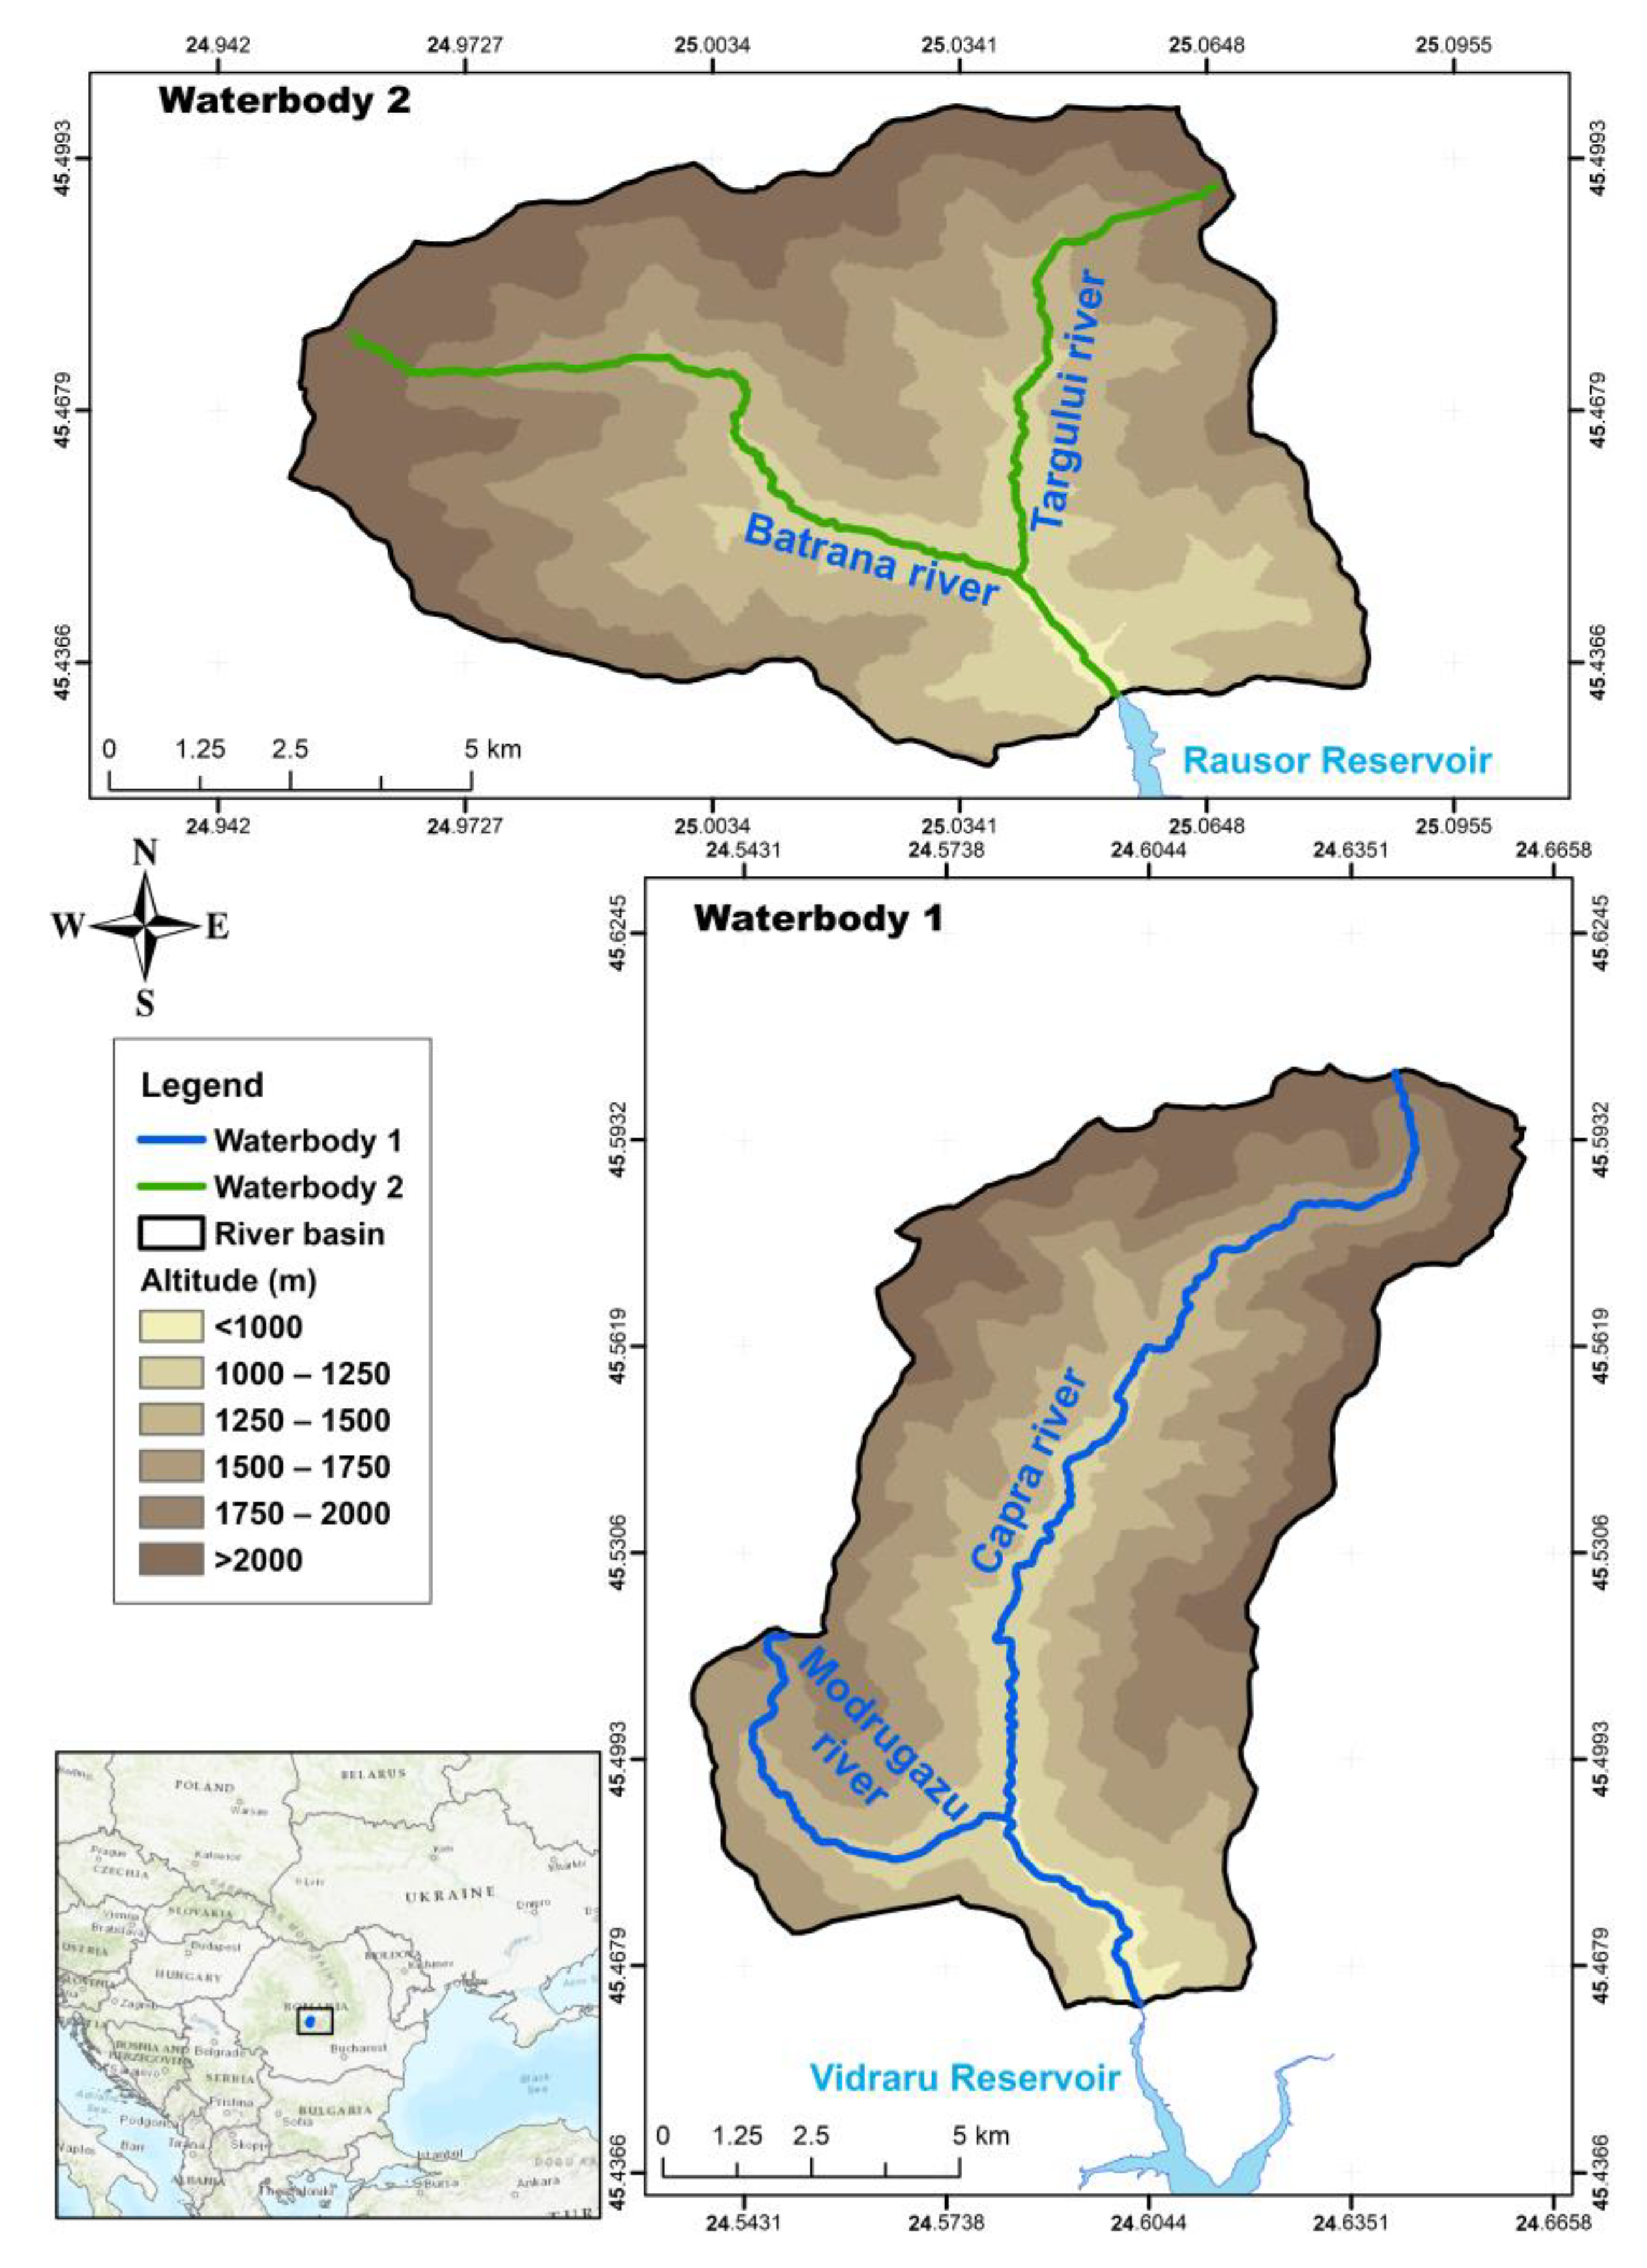
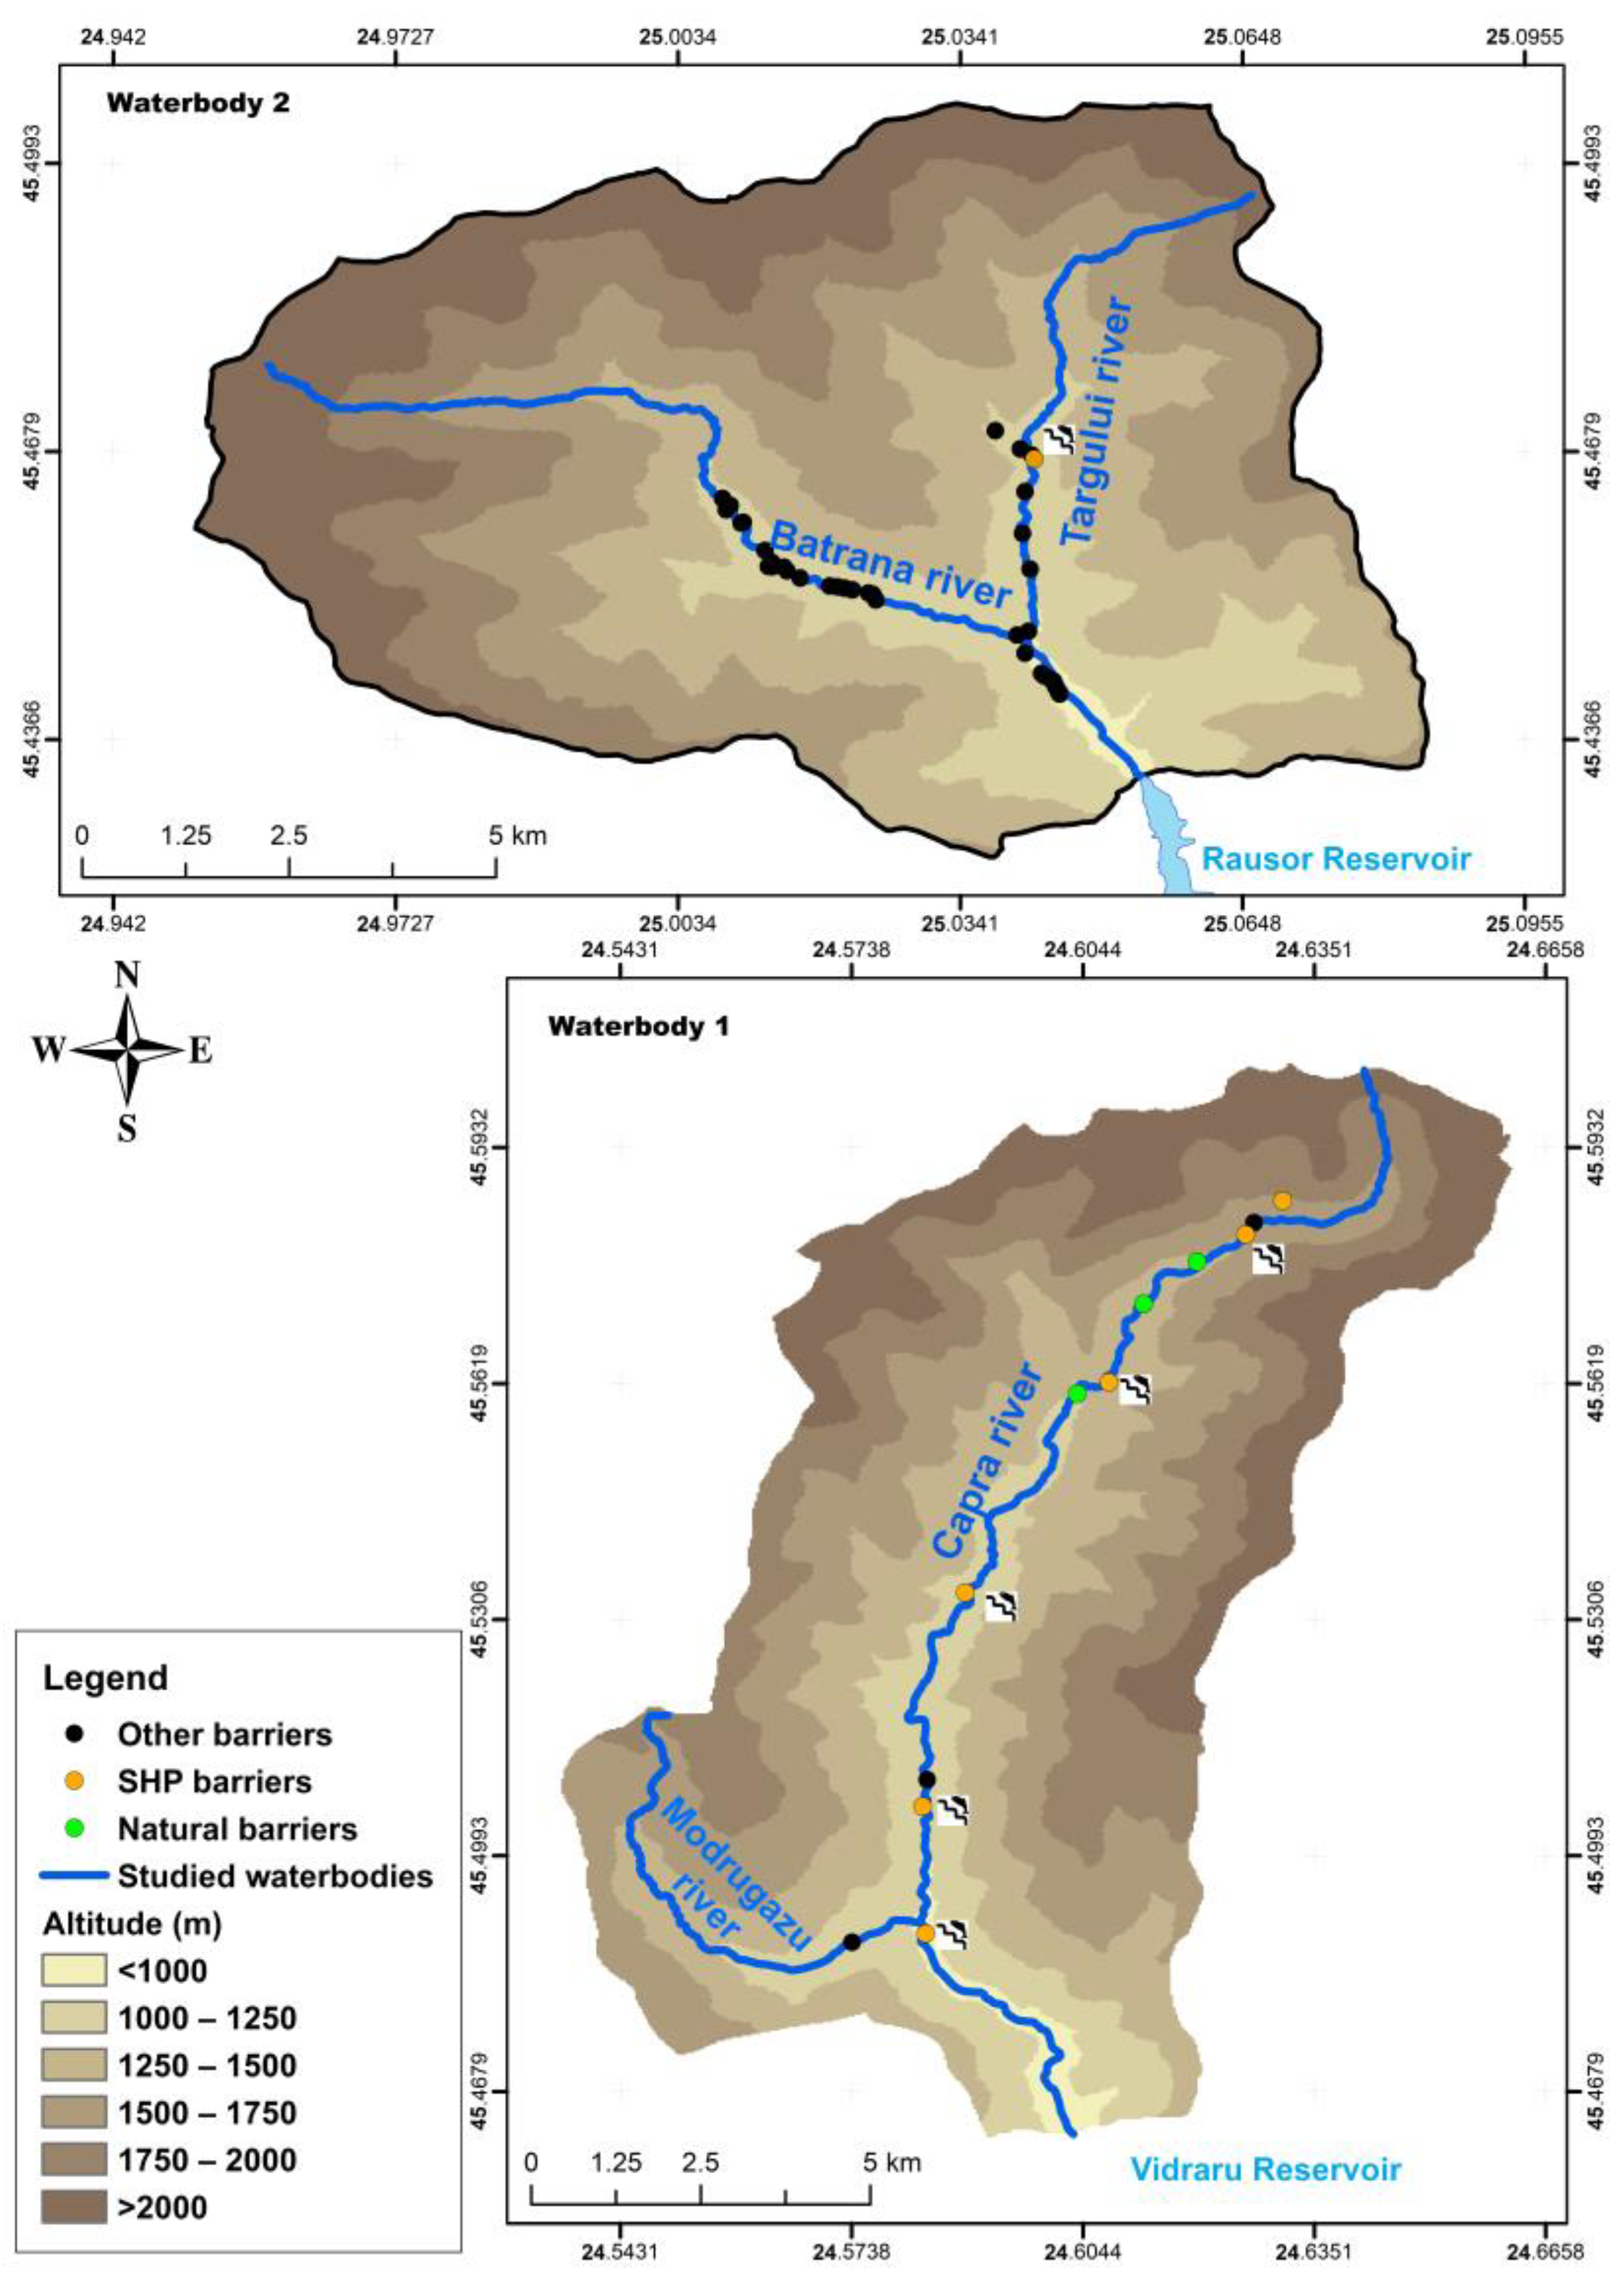
2.1. The Case Studies
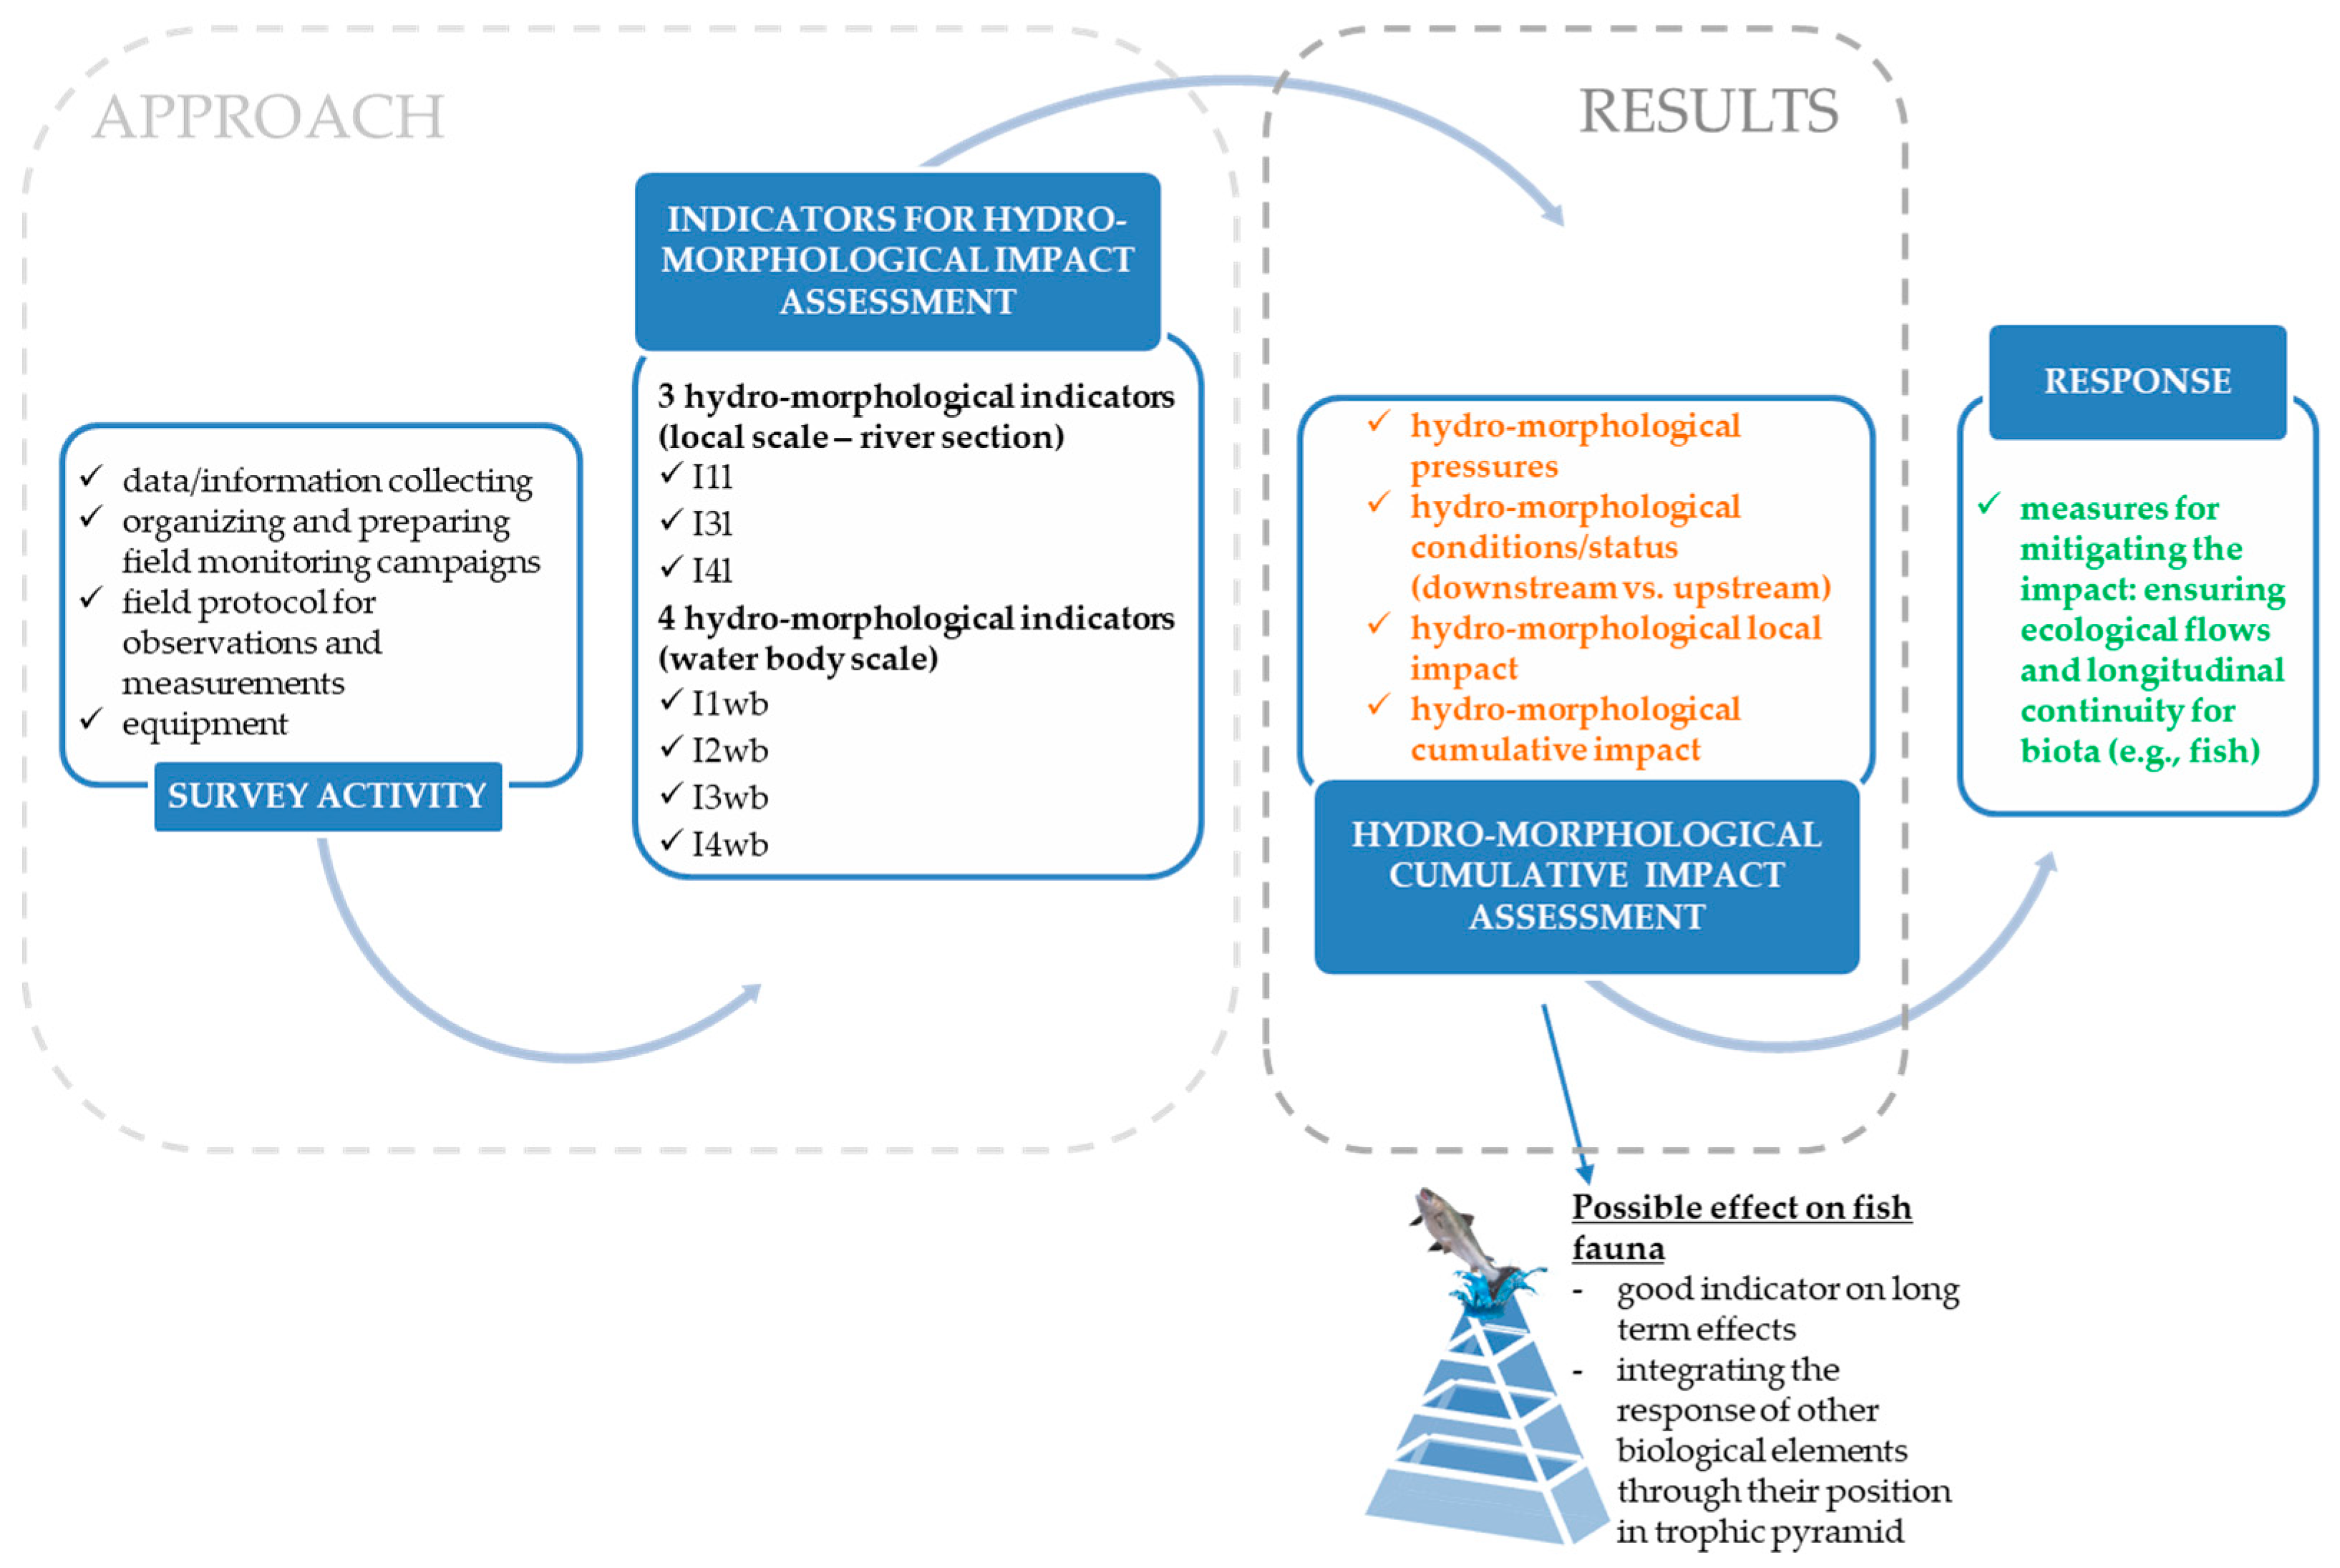
2.2. The Survey Approach
- Measurements of some parameters that are the basis for the hydromorphological assessment and also for the local and waterbody cumulative impact assessment;
- Identification of all hydromorphological pressures and the activities that can generate such pressures (e.g., transversal structures, water intakes);
- Filling in the gaps of data before construction by current measurements in the upstream section conventionally unaltered.
2.3. Hydromorphological Data
2.4. Hydromorphological Cumulative Impact Assessment Approach
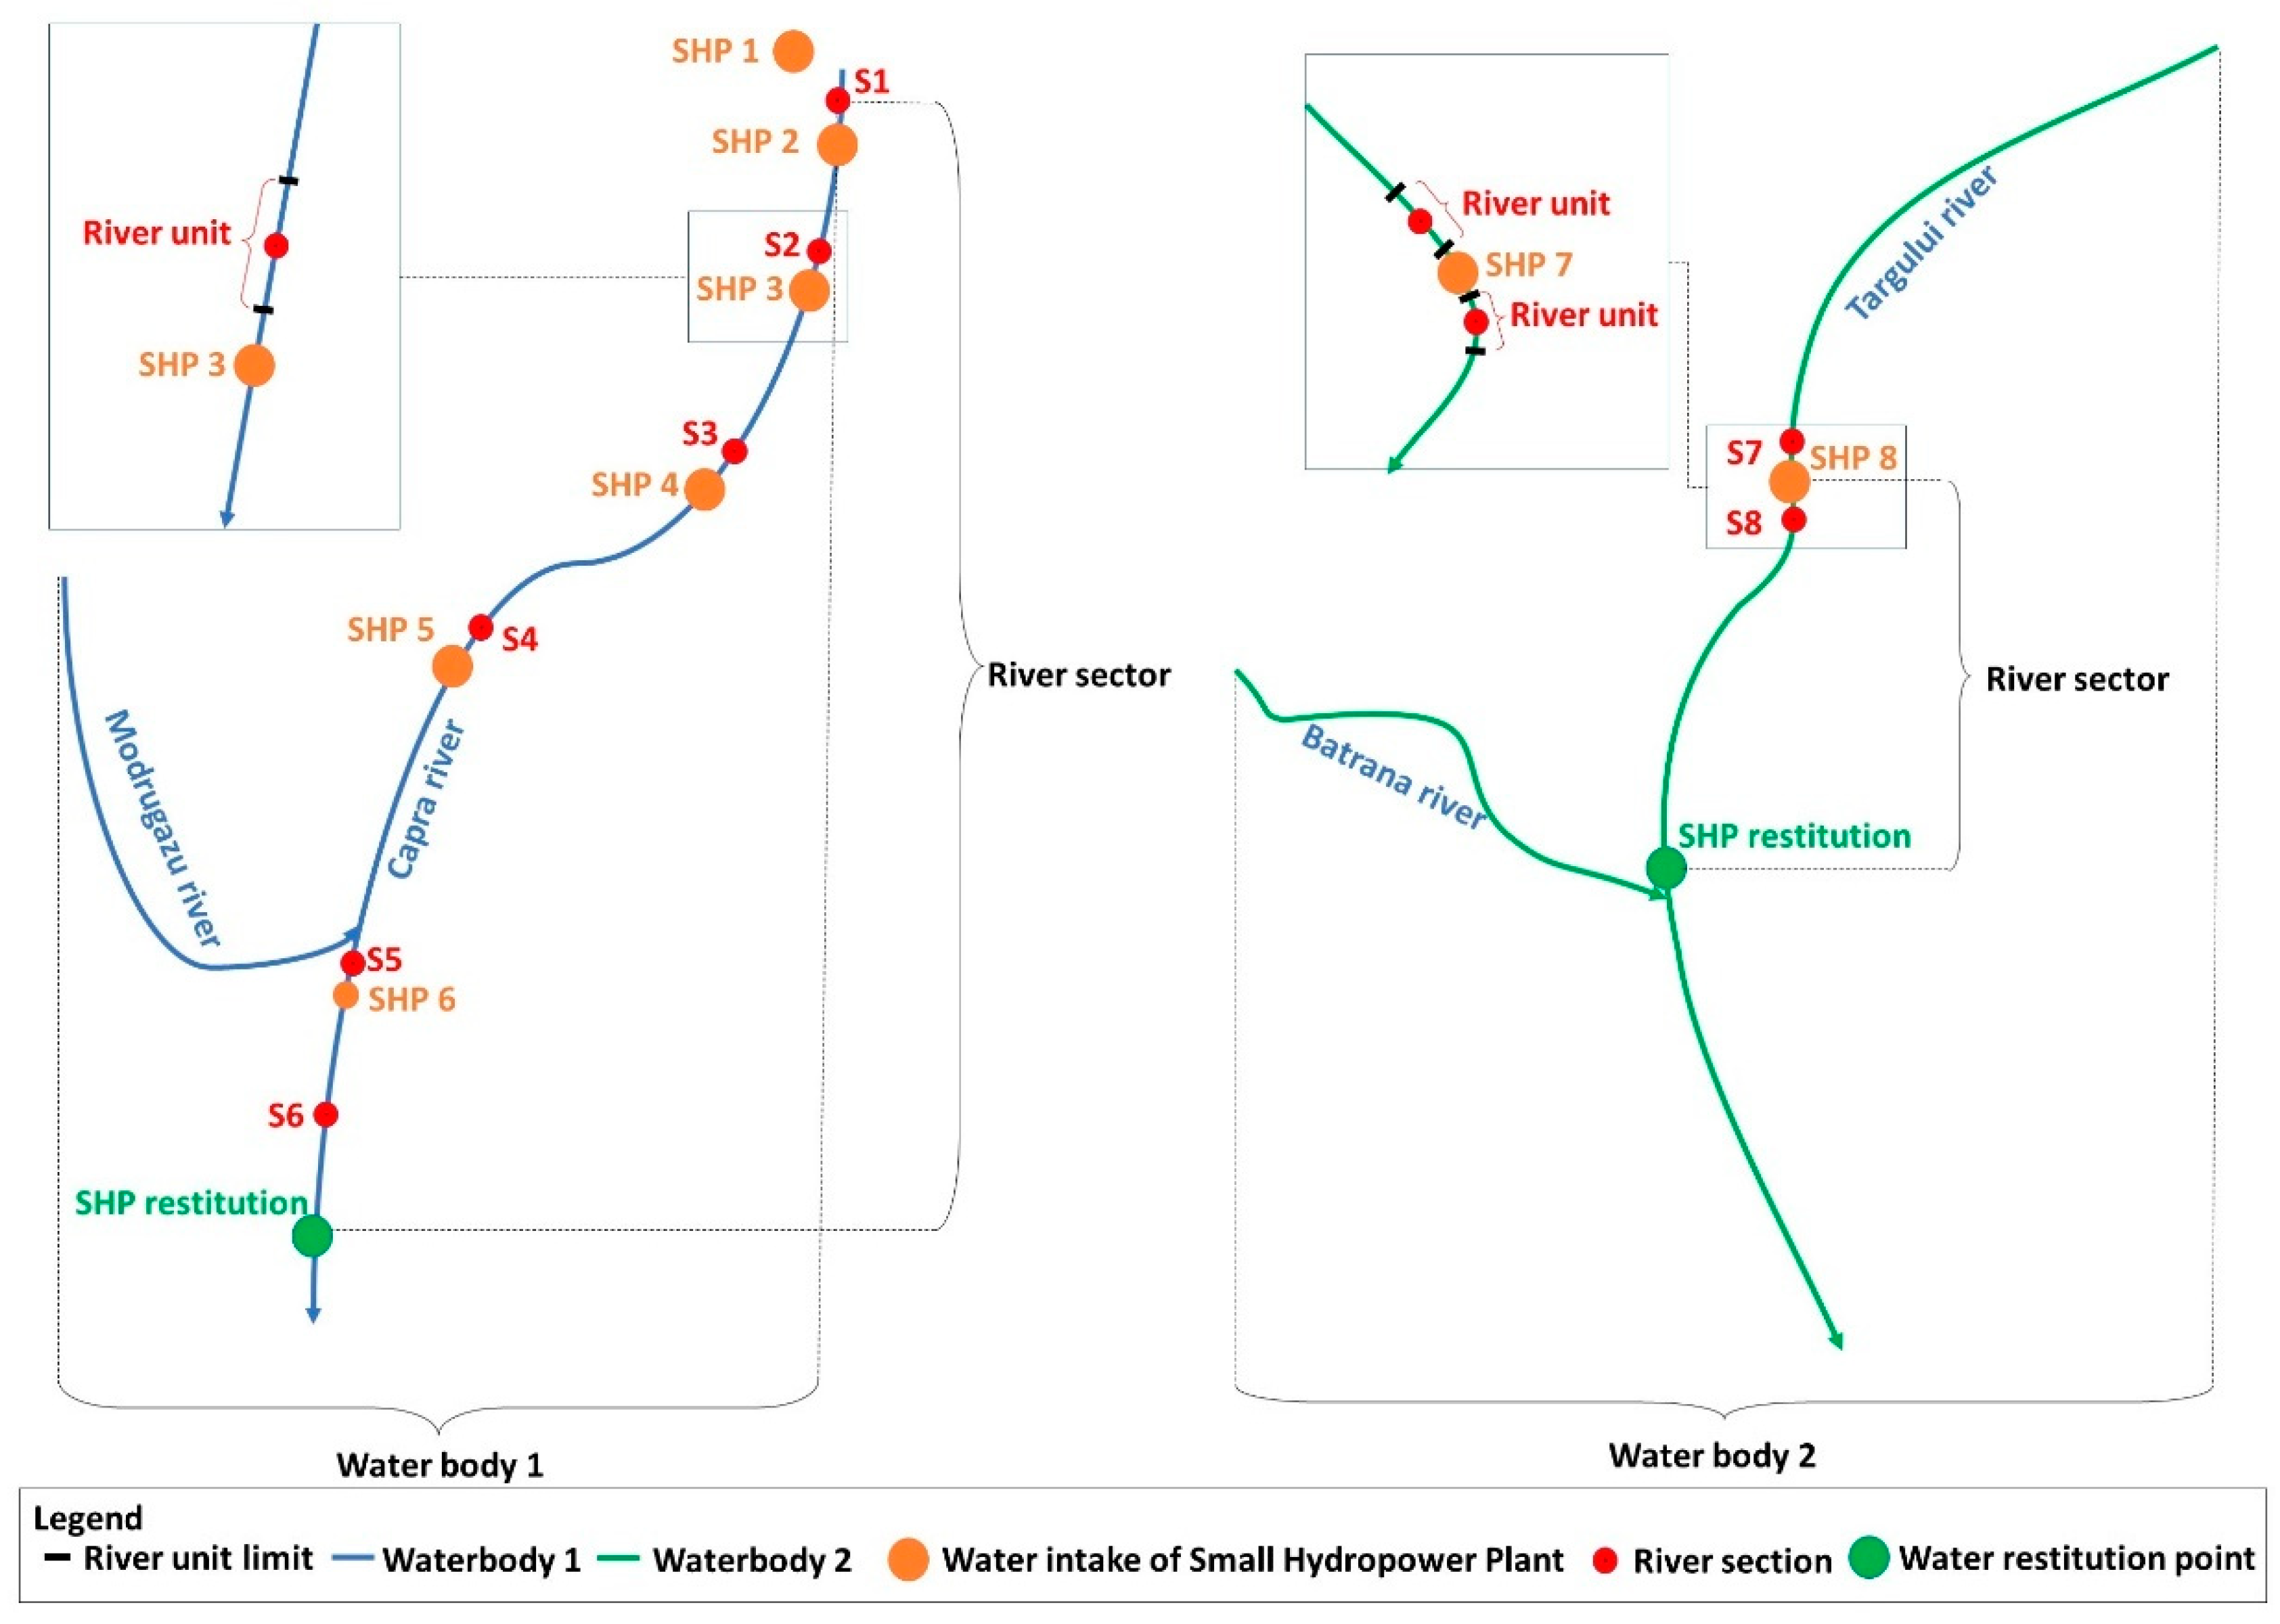
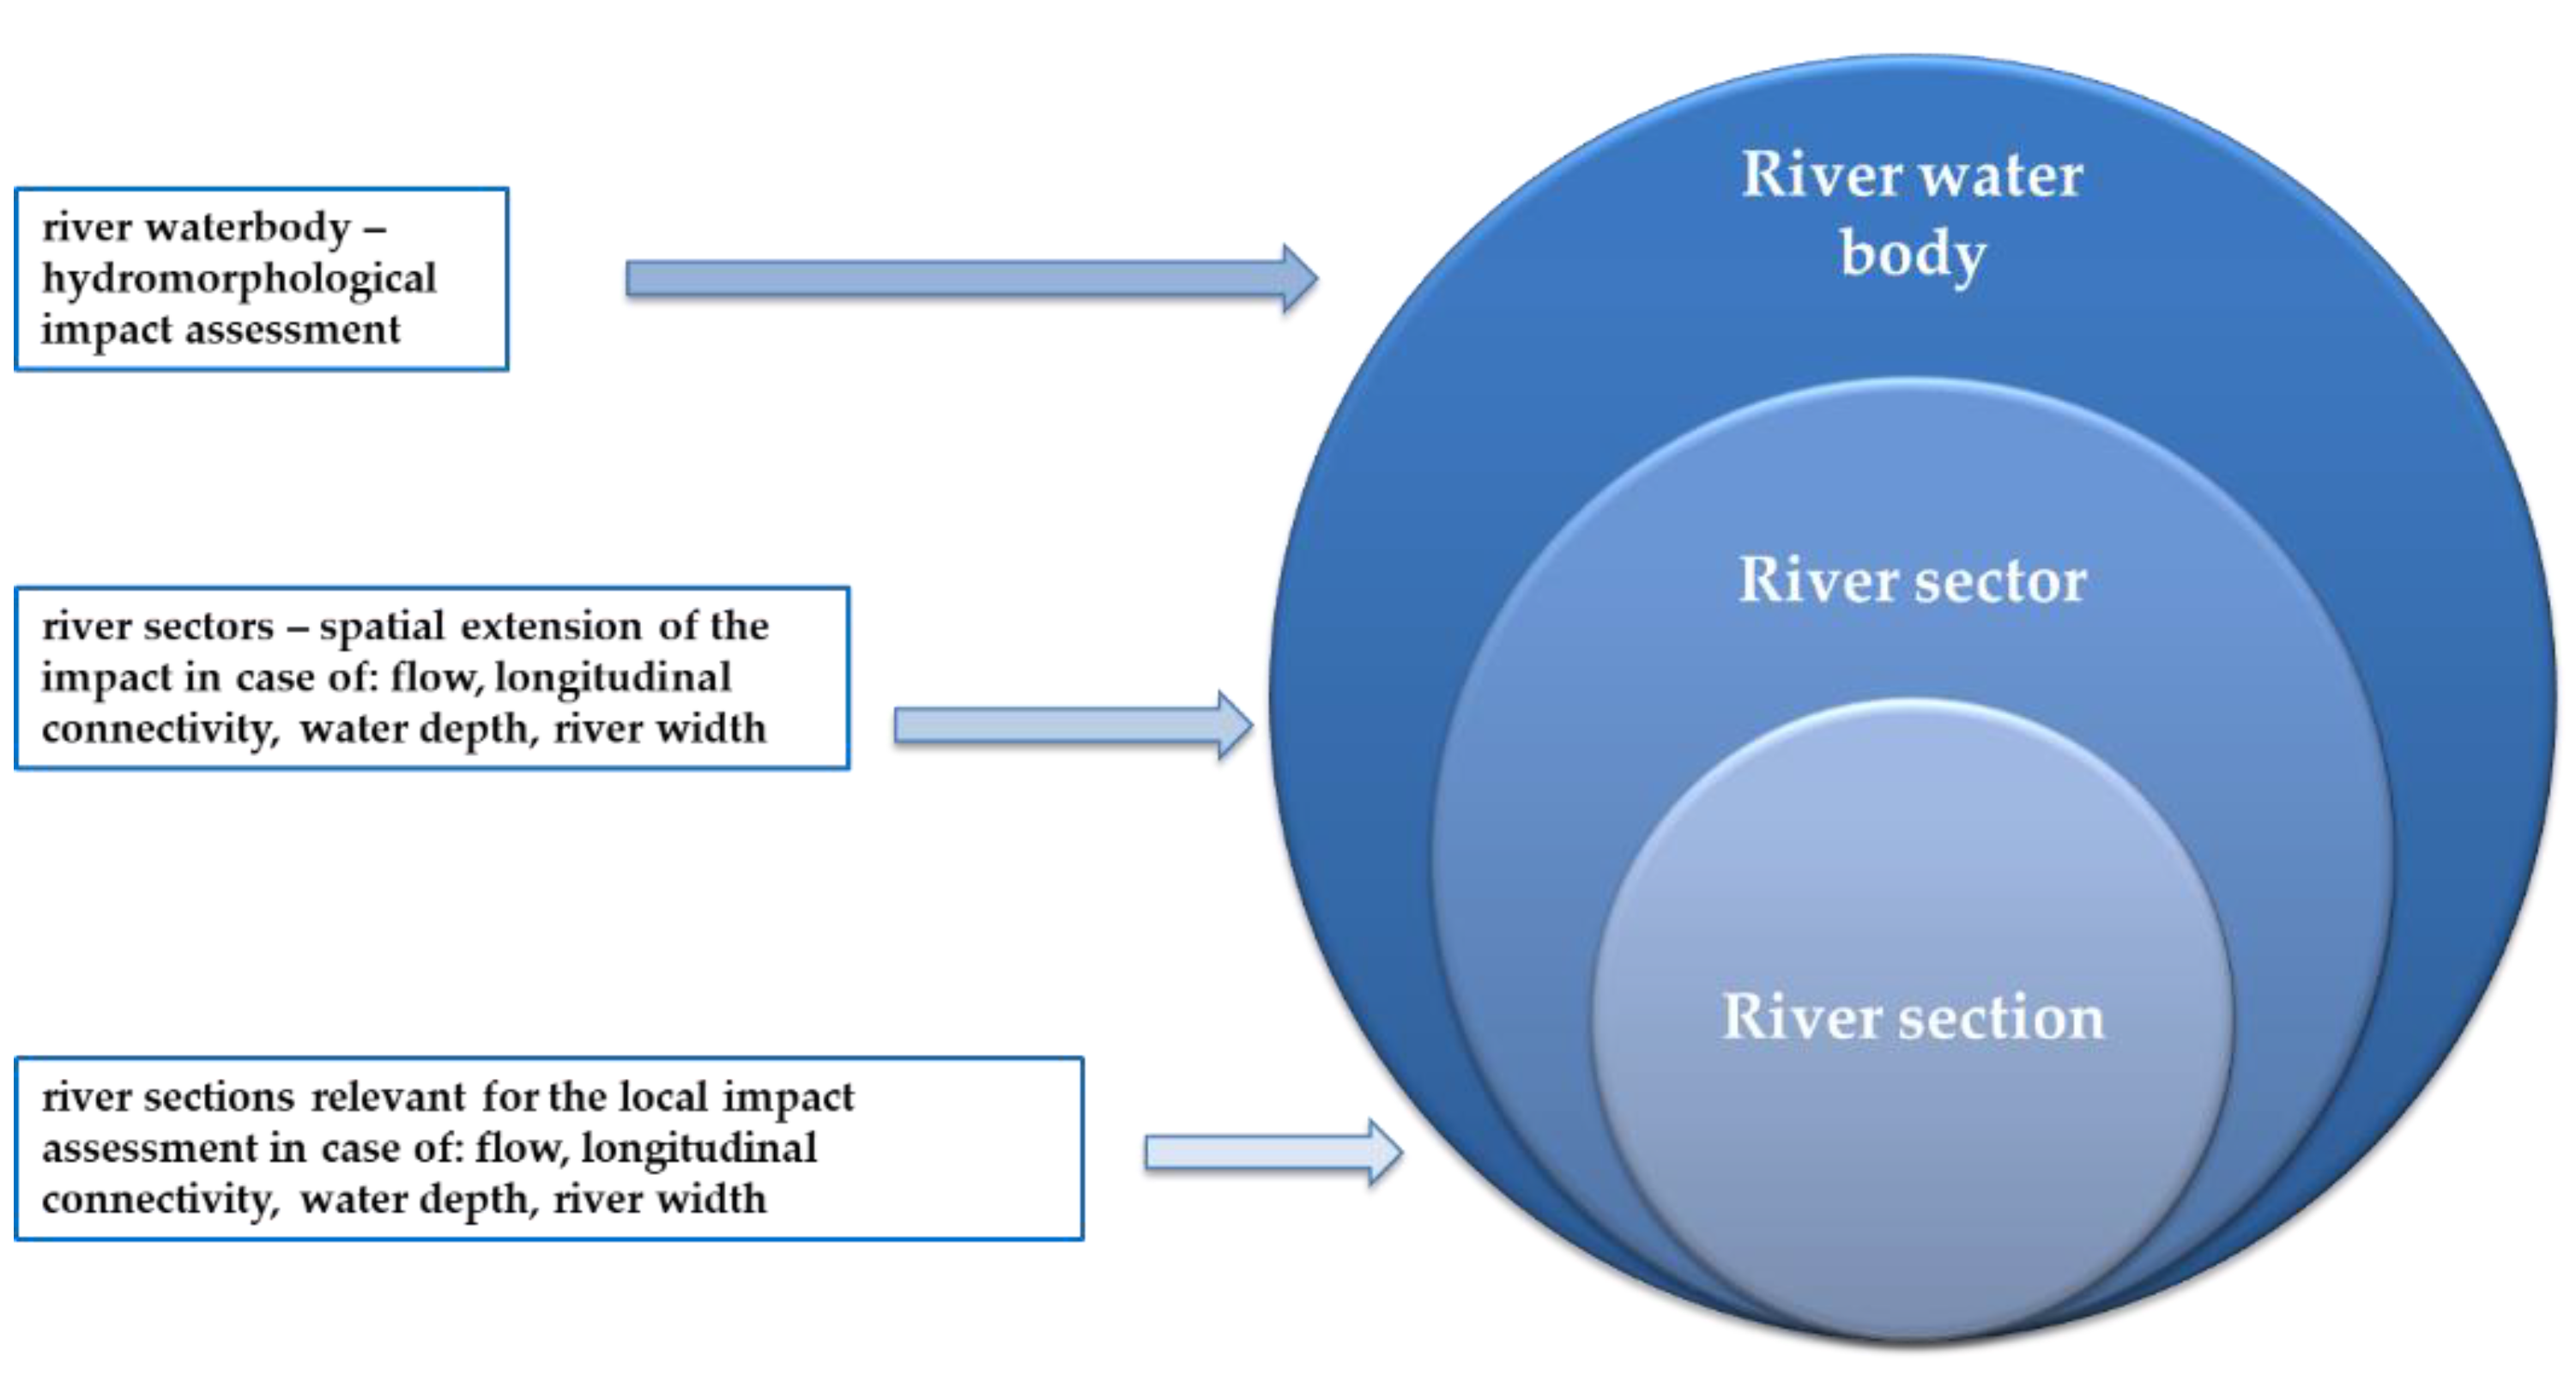
2.4.1. River Section (Local Level)
2.4.2. River Sector Level
2.4.3. Waterbody Level
- If the significant impact at local/river sector is affecting less than 5% of the total length of the waterbody, the impact is low at waterbody level and with no risk of deterioration or compromising the achievement of environmental objectives;
- If the significant impact at local/river sector is between 5 and 20% of the total length of the waterbody, the impact is moderate at waterbody level but with no risk of deterioration or compromising the achievement of environmental objectives;
- If the significant impact at local/river sector represents more than 20% of the length of the waterbody, it could lead to the deterioration of the condition of the entire waterbody and therefore to the registration of a significant impact at the level of the waterbody. Based on the precautionary principle, it was considered that the value of 20% is a precautionary one, allowing a better identification of the impact at waterbody level.
3. Results
The Results of the Survey Approach and the Hydro-Morphological Cumulative Impact Assessment
4. Discussion
5. Conclusions
Author Contributions
Funding
Data Availability Statement
Acknowledgments
Conflicts of Interest
References
- Rieman, B.E.; Dunham, J.B. Metapopulations and Salmonids: A Synthesis of Life History Patterns and Empirical Observations. Ecol. Freshw. Fish. 2000, 9, 51–64. [Google Scholar] [CrossRef]
- Hughes, F.M.R.; Rood, S.B. Allocation of River Flows for Restoration of Floodplain Forest Ecosystems: A Review of Approaches and Their Applicability in Europe. Environ. Manag. 2003, 31, 12–33. [Google Scholar] [CrossRef]
- Sindelar, C.; Schobesberger, J.; Habersack, H. Effects of weir height and reservoir widening on sediment continuity at run-of-river hydropower plants in gravel bed rivers. Geomorphology 2016, 291, 106–115. [Google Scholar] [CrossRef]
- Kuriqi, A.; Pinheiro, A.N.; Sordo-Ward, A.; Bejarano, M.D.; Garrote, L. Ecological impacts of run-of-river hydropower plants—Current status and future prospects on the brink of energy transition. Renew. Sustain. Energy Rev. 2021, 142, 110833. [Google Scholar] [CrossRef]
- Golfieri, B.; Surian, N.; Hardersen, S. Towards a More Comprehensive Assessment of River Corridor Conditions: A Comparison between the Morphological Quality Index and Three Biotic Indices. Ecol. Indic. 2018, 84, 525–534. [Google Scholar] [CrossRef]
- European Environmental Agency (EEA). Environmental Indicators: Typology and Use in Reporting; EEA internal working paper; European Environment Agency: Copenhagen, Denmark, 2003; pp. 6–7. [Google Scholar]
- Organisation for Economic Co-Operation and Development (OECD). OECD Core Set of Indicators for Environmental Performance Reviews: A Synthesis Report by the Group on the State of the Environment; OECD: Paris, France, 1993. [Google Scholar]
- Vannevel, R. Using DPSIR and Balances to Support Water Governance. Water 2018, 10, 118. [Google Scholar] [CrossRef] [Green Version]
- Tscherning, K.; Helminga, K.; Krippner, B.; Sieber, S.; Gomez y Paloma, S. Does research applying the DPSIR framework support decision making? Land Use Policy 2012, 29, 102–110. [Google Scholar] [CrossRef]
- Niemeijer, D.; De Groot, R.S. Framing environmental indicators: Moving from causal chains to causal networks. Environ. Dev. Sustain. 2008, 10, 89–106. [Google Scholar] [CrossRef]
- Svarstad, H.; Kjerulf Petersen, L.; Rothman, D.; Sieple, H.; Wätzold, F. Discursive biases of the environmental research framework DPSIR. Land Use Policy 2008, 25, 116–125. [Google Scholar] [CrossRef]
- Atkins, J.P.; Burdon, D.; Elliott, M.; Gregory, A.J. Management of the marine environment: Integrating ecosystem services and societal benefits with the DPSIR framework in a systems approach. Mar. Pollut. Bull. 2011, 62, 215–226. [Google Scholar] [CrossRef]
- Patrício, J.; Michael, E.; Mazik, K.; Papadopoulou, K.-N.; Smith, C.J. DPSIR—Two Decades of Trying to Develop a Unifying Framework for Marine Environmental Management? Front. Mar. Sci. 2016, 3, 177. [Google Scholar] [CrossRef] [Green Version]
- Cooper, P. Socio-ecological accounting: DPSWR, a modified DPSIR framework, and its application to marine ecosystems. Ecol. Econ. 2013, 94, 106–115. [Google Scholar] [CrossRef] [Green Version]
- Eastwood, P.D.; Mills, C.M.; Aldridge, J.N.; Houghton, C.A.; Rogers, S.I. Human activities in UK offshore waters: As assessment of direct, physical pressure on the seabed. ICES J. Mar. Sci. 2007, 64, 453–463. [Google Scholar] [CrossRef]
- European Environmental Agency. Available online: https://www.eea.europa.eu/policy-documents/wfd-cis-guidance-document-no-3 (accessed on 25 November 2022).
- Ormerod, S.J.; Dobson, M.; Hildrew, A.G.; Townsend, C.R. Multiple stressors in freshwater ecosystems. Freshw. Biol. 2010, 55, 1–4. [Google Scholar] [CrossRef]
- Kalogianni, E.; Vourka, A.; Karaouzas, I.; Vardakas, L.; Laschou, S.; Skoulikidis, N.T. Combined effects of water stress and pollution on macroinvertebrate and fish assemblages in a Mediterranean intermittent river. Sci. Total Environ. 2017, 603–604, 639–650. [Google Scholar] [CrossRef] [PubMed]
- Appiah-Opoku, S. Environmental impact assessment in developing countries: The case of Ghana. Environ. Impact Assess. Rev. 2001, 21, 59–71. [Google Scholar] [CrossRef]
- Carvalho, L.; Mackay, E.B.; Cardoso, A.C.; Baattrup-Pedersen, A.; Birk, S.; Blackstock, K.L.; Borics, G.; Borja, A.; Feld, C.K.; Ferreira, M.T.; et al. Protecting and restoring Europe’s waters: An analysis of the future development needs of the Water Framework Directive. Sci. Total Environ. 2019, 658, 1228–1238. [Google Scholar] [CrossRef]
- Walter, R.; Merritts, D. Natural Streams and the Legacy of Water-Powered Mills. Science 2008, 319, 299–304. [Google Scholar] [CrossRef] [Green Version]
- Wolter, C.; Lorenz, S.; Scheunig, S.; Lehmann, N.; Schomaker, C.; Nastase, A.; Diego García de Jalón, D.; Marzin, A.; Lorenz, A.; Kraková, M.; et al. Review on Ecological Response to Hydromorphological Degradation and Restoration, REFORM Project (Restoring Rivers FOR Effective Catchment Management). 2013. Available online: https://www.reformrivers.eu/system/files/1.3%20Ecol%20response%20to%20HyMo%20changes_final.pdf (accessed on 28 November 2022).
- Csiki, S.; Rhoads, B. Hydraulic and Geomorphological Effects of Run-of-River Dams. Prog. Phys. Geog. 2010, 34, 755–780. [Google Scholar] [CrossRef]
- Mueller, M.; Pander, J.; Geist, J. The Effects of Weirs on Structural Stream Habitat and Biological Communities. J. Appl. Ecol. 2011, 48, 1450–1461. [Google Scholar] [CrossRef]
- Anderson, D.; Moggridge, H.; Warren, P.; Shucksmith, J. The impacts of ‘run-of-river’ hydropower on the physical and ecological condition of rivers. Water Environ. J. 2015, 29, 268–276. [Google Scholar] [CrossRef] [Green Version]
- Jansson, R.; Nilsson, C.; Dynesius, M.; Andersson, E. Effects of River Regulation on River-Margin Vegetation: A Comparison of Eight Boreal Rivers. Ecol. Appl. 2010, 10, 203–224. [Google Scholar] [CrossRef]
- Malm Renöfält, B.; Jansson, R.; Nilsson, C. Effects of hydropower generation and opportunities for environmental flow management in Swedish riverine ecosystems. Freshw. Biol. 2010, 55, 49–67. [Google Scholar] [CrossRef]
- Greet, J.; Webb, J.; Downes, B. Flow Variability Maintains the Structure and Composition of In-Channel Riparian Vegetation. Freshwat. Biol. 2011, 56, 2514–2528. [Google Scholar] [CrossRef]
- Eionet Central Data Repository. Available online: https://cdr.eionet.europa.eu/help/WFD/WFD_715_2022/Guidance%20documents/WFD%20Descriptive%20Reporting%20Guidance.pdf (accessed on 28 November 2022).
- Ministry of Environment, Waters and Forests—Romania. Available online: http://www.mmediu.ro/articol/studiul-privind-evaluarea-impactului-asupra-mediului-a-constructiei-si-exploatarii-lucrarilor-de-amenajare-pentru-valorificarea-potentialului-hidroenergetic-prin-microhidrocentrale-amplasate-pe-cursurile-de-apa-capra-buda-otic-izvorul-mircea-cuca-cartisoar/4742 (accessed on 14 September 2022).
- Moldoveanu, M.; Galie, A.; Radulescu, D. Methodology for hydromorphological assessment of Romanian rivers—Results of testing. In Proceedings of the 15th International Multidisciplinary Scientific Geoconference, Albena, Bulgaria, 18–24 June 2015; Book 3—Volume 1, pp. 427–436. [Google Scholar]
- Galie, A.C.; Moldoveanu, M.; Antonaru, O. Hydro-morphological assessment of atypical lowland rivers—Romanian Litoral basin case study. Carpathian J. Earth Environ. Sci. 2017, 12, 161–169. [Google Scholar]
- Moldoveanu, M.; Sarbu, D.; Galie, A.C.; Bojan, V.; Mezdroiu, I. Assessment of river water quality using an integrated hydro-morphological, physico-chemical and biological approach. AES Bioflux 2017, 9, 158–172. [Google Scholar]
- Banaduc, A.; Banaduc, D.; Ursu, L.; Rachita, R. Historical human impact on the Capra Stream macroinvertebrates and fish communities (Southern Romanian Carpathians). Acta Oecologica Carp. 2014, VII, 111–152. [Google Scholar]
- Banaduc, A.; Pauli, S.; Banaduc, D.; Didenko, A.; Sender, J.; Marić, S.; Del Monte, P.; Khoshnood, Z.; Zakeyuddin, S. Environmental aspects of implementation of micro hydro power plants—A short review. Transylv. Rev. Syst. Ecol. Res. 2015, 17, 179–198. [Google Scholar] [CrossRef] [Green Version]
- Costea, G.; Pusch, M.T.; Banaduc, D.; Cosmoiu, D.; Banaduc, A. A review of hydropower plants in Romania: Distribution, current knowledge, and their effects on fish in headwater streams. Renew. Sustain. Energy Rev. 2021, 145, 111003. [Google Scholar] [CrossRef]
- AQUAPROIECT S.A. Bucharest, Cadastral Water Atlas of Romania. Unpublish. 1992. [Google Scholar]
- WordClim. Available online: https://www.worldclim.org/data/v1.4/worldclim14.html (accessed on 28 December 2022).
- International Commission for the Protection of the Danube River (ICPDR). Available online: http://www.icpdr.org/main/sites/default/files/nodes/documents/drbmp_update_2021_final_annex_17_-_ecological_prioritisation_approach.pdf (accessed on 30 December 2022).
- International Commission for the Protection of the Danube River (ICPDR). Available online: http://www.icpdr.org/flowpaper/viewer/default/files/nodes/documents/icpdr_fish_migration_final.pdf (accessed on 5 December 2022).
- Utzinger, J.; Roth, C.; Peter, A. Effects of environmental parameters on the distribution of bullhead Cottus gobio with particular consideration of the effects of obstructions. J. Appl. Ecol. 1998, 35, 882–892. [Google Scholar] [CrossRef]
- Weeratunge, N.; Béné, C.; Siriwardane, R.; Charles, A.; Johnson, D.; Allison, E.H.; Nayak, P.K.; Badjeck, M.C. Small-scale fisheries through the well-being lens. Fish Fish. 2014, 15, 255–279. [Google Scholar] [CrossRef]
- Cooke, S.J.; Cowx, I.G. The Role of Recreational Fishing in Global Fish Crises. BioScience 2004, 54, 857–859. [Google Scholar] [CrossRef]
- Lynch, A.J.; Cooke, S.J.; Deines, A.M.; Bower, S.D.; Bunnell, D.B.; Cowx, I.G.; Nguyen, V.M.; Nohner, J.; Phouthavong, K.; Riley, B.; et al. The social, economic, and environmental importance of inland fish and fisheries. Environ. Rev. 2016, 24, 115–121. [Google Scholar] [CrossRef]
- Armstron, G.; Apahamian, M.; Fewings, G.; Gough, P.; Reader, N.; Varallo, P. Environment Agency Fish Pass Manual: Guidance Notes on the Legislation, Selection and Approval of Fish Passes in England and Wales; Environment Agency Rio House, Waterside Drive, Aztec West Almondsbury: Bristol, UK, 2010; p. 51. [Google Scholar]
- Wiatkowski, M.; Tomczyk, P. Comparative Assessment of the Hydromorphological Status of the Rivers Odra, Bystrzyca, and ’Sleza Using the RHS, LAWA, QBR, and HEM Methods above and below the Hydropower Plants. Water 2018, 10, 855. [Google Scholar] [CrossRef] [Green Version]
- Tomczyk, P.; Willems, P.; Wiatkowski, M.J. Comparative analysis of changes in hydromorphological conditions upstream and downstream hydropower plants on selected rivers in Poland and Belgium. J. Clean. Prod. 2021, 328, 129524. [Google Scholar] [CrossRef]
- Babbud, C.; Lane, S.N. Ecosystem impacts of Alpine water intakes for hydropower: The challenge of sediment management. WIREs Water 2016, 3, 41–61. [Google Scholar] [CrossRef]
- Xie, D.; Wang, Z.B.; Van der Wegen, M.; Huang, J. Morphodynamic modeling the impact of large-scale embankment on the large bar in a convergent estuary. Mar. Geol. 2021, 442, 106638. [Google Scholar] [CrossRef]
- Xie, D.; Pan, C.; Wu, X.; Gao, S.; Wang, Z.B. Local human activities overwhelm decreased sediment supply from the Changjiang River: Continued rapid accumulation in the Hangzhou Bay-Qiantang Estuary system. Mar. Geol. 2017, 392, 66–77. [Google Scholar] [CrossRef]


| Data Type | Scale | Source | Description |
|---|---|---|---|
| Hydrological | Local | NIHWM database | The multiannual average natural flow computed within a cross section at the end of the waterbody (2 values) and also in case of each SHP (7 values). |
| Local (river section) | NARW | The values of abstracted flow in case of each SHP. | |
| Transversal barriers | Local, waterbody | NARW, field monitoring campaigns | The height of barrier, the number of barriers/km of river length. |
| Water depth | Local (characteristic cross-section) | Field monitoring campaigns | Measurements according to the national instructions harmonized with the recommendations of the World Meteorological Organization |
| Water width | Local (characteristic cross-section) | Field monitoring campaigns |
| Indicator (Description) | Formula/Criteria | 5 Class System According to Methodology for Hydromorphological Assessment of Romanian Rivers | Scale of Application | ||||
|---|---|---|---|---|---|---|---|
| Class I | Class II | Class III | Class IV | Class V | |||
| I1l Average consumed flow (Identifies a potential local flow modification) | Qmean abstracted—mean abstracted flow by each water use averaged over 1 year Qnatural or renaturalized multiannual mean—multiannual average natural or renaturalized discharge averaged for all data recorded computed in the case of each water use in the water intake cross-section | ≤10% | 11–30% | 31–50% | 51–70% | ≥71% | Local (l) |
| I1wb Average consumed flow (Identifies a water deficit at waterbody level) | Qnatural multiannual mean—multiannual average natural discharge averaged for all data recorded computed at the end cross-section of the waterbody; = mean return flows averaged over 1 year; j = number of water intakes; k = number of users which return flows | Waterbody (wb) | |||||
| I2wb Longitudinal continuity/connectivity of the riverbed 2 (Indirectly assesses the impact of transversal structures on the mobility of fish species) | The maximum height of the barriers | ≤50 cm | 50–70 cm | 71–200 cm | >200 cm | Waterbody (wb) | |
| I3l Mean water depth variation (based on the data collected during monitoring campaigns within the characteristic, upstream and downstream, cross-sections for all water intakes) | —mean water depth measured downstream (current conditions); —mean water depth measured upstream (reference conditions/natural or quasi-natural condition conventionally unaltered). | <20% | 21–40% | 41–60% | 61–80% | ≥81% | Local (l) |
| I3wb Mean water depth variation (based on the arithmetic average of the mean water depths measured within the characteristic, upstream and downstream, cross-sections for all water intakes) | —mean water depth measured downstream (current conditions) 1; —mean water depth measured upstream (reference conditions/natural or quasi-natural condition conventionally unaltered) 1. | <20% | 21–40% | 41–60% | 61–80% | ≥81% | Waterbody (wb) |
| I4l Water width variation (based on the data collected during monitoring campaigns within the characteristic, upstream and downstream, cross-sections for all water intakes) | —water width measured downstream (current conditions); —water width measured upstream (reference conditions/natural or quasi-natural conventionally unaltered). | <20% | 21–40% | 41–60% | 61–80% | ≥81% | Local (l) |
| I4wb Water width variation (based on the arithmetic average of the water widths measured within the characteristic cross-sections (upstream and downstream) for all water intakes with artificial barriers) | —water width measured downstream (current conditions) 1; —water width measured upstream (reference conditions/natural or quasi-natural conventionally unaltered) 1. | <20% | 21–40% | 41–60% | 61–80% | ≥81% | Waterbody (wb) |
| Significance of the Hydromorphological Impact at Local Scale | Spatial Extension of the Impact (Waterbody Scale) | ||
|---|---|---|---|
| <5% | 5–20% | >20% | |
| Significant | Low | Moderate | Significant |
| No impact | No impact | No impact | No impact |
| No. | River | Barriers (Transversal Structures and Natural Barriers) | Barriers Height (m) | Fish Aids | Flow Direction |
|---|---|---|---|---|---|
| Waterbody 1 |  | ||||
| 1 | Capra | Culvert | 2 | No | |
| 2 | Capra | SHP 2 | 1.45 | Yes | |
| - | Capra | Natural barrier | 0.4 | - | |
| - | Capra | Natural barrier | 1.1 | - | |
| 5 | Capra | SHP 3 | 1.45 | Yes | |
| - | Capra | Natural barrier | 0.25 | - | |
| 6 | Capra | SHP 4 | 1.45 | Yes | |
| 7 | Capra | Sediment Weir | 8 | No | |
| 8 | Capra | SHP 5 | 1.45 | Yes | |
| 9 | Capra | SHP 6 | 1.45 | Yes | |
| 1 | Modrugazu | Sediment Weir | 8 | No | |
| Waterbody 2 | |||||
| 1,2 | Targului | Sediment Weir | 2.5 | No | |
| 3, 5–8 | Targului | Sediment Weir | 3.5 | No | |
| 4 | Targului | SHP 8 | 1.45 | Yes | |
| 9–18 | Targului | Sediment Weir | 0.5 | No | |
| 1–4 | Batrana | Sediment Weir | 1.2 | No | |
| 5, 9–10 | Batrana | Sediment Weir | 1.0 | No | |
| 6 | Batrana | Sediment Weir | 2.0 | No | |
| 7 | Batrana | Sediment Weir | 1.7 | No | |
| 8, 11, 13–16 | Batrana | Sediment Weir | 1.5 | No | |
| 12, 17 | Batrana | Sediment Weir | 1.1 | No | |
| 18, 20 | Batrana | Sediment Weir | 1.7 | No | |
| 19 | Batrana | Sediment Weir | 1.6 | No | |
| 21 | Batrana | Sediment Weir | 0.5 | No | |
| SHP | Mean Abstracted Flow (m3/s) in 2019 | Mean Returned Flow (m3/s) in 2019 | Multiannual Average Natural Flow (Waterbody Section) (m3/s) | Multiannual Average Natural Flow (Abstraction Point) (m3/s) | Local Level Assessment | Waterbody Level Assessment | ||
|---|---|---|---|---|---|---|---|---|
| I1l Value (%) | I1l Class 1 | I1wb Value (%) | I1wb Class 1 | |||||
| Waterbody 1 | ||||||||
| 1 | 0.028 | 0.028 | 2.64 | 0.068 | 41.2 | III | 0 | I |
| 2 | 0.195 | 0.195 | 0.4 | 48.7 | III | |||
| 3 | 0.405 | 0.405 | 0.7 | 57.8 | IV | |||
| 4 | 0.771 | 0.771 | 1.42 | 54.3 | IV | |||
| 5 | 0.976 | 0.976 | 1.94 | 50.3 | IV | |||
| 6 | 1.61 | - | 2.36 | 68.2 | IV | |||
| 7 | - | 1.61 | - | |||||
| Waterbody 2 | ||||||||
| 8 | 0.36 | 0.36 | 2.13 | 0.64 | 56.25 | IV | 0 | I |
| Length of the Waterbody (km) | No. of Transversal Structures | Maximum Height of the Transversal Structure (m) | Transversal Structures Density on the Waterbody | I2 Class 1 |
|---|---|---|---|---|
| Waterbody 1 | ||||
| 27.3 | 8 | 8 | 0.29 | V |
| Waterbody 2 | ||||
| 17.92 | 39 | 3.5 | 2.18 | V |
| SHP | Hmed upstream | Hmed downstream | Δh (%) | I3l (2019) | I3wb (2019) 1 | ||||
|---|---|---|---|---|---|---|---|---|---|
| C1 | C2 | C1 | C2 | C1 | C2 | C1 1 | C2 1 | ||
| Waterbody 1 | |||||||||
| 1 | - | - | 0.34 | 0.25 | - | - | - | - | Class I |
| 2 | 0.34 | 0.25 | 0.38 | 0.21 | 11.76 | −16 | I | I | |
| 3 | 0.38 | 0.21 | - | 0.17 | - | −19.05 | - | I | |
| 4 | - | 0.17 | - | 0.16 | - | −5.88 | - | I | |
| 5 | - | 0.16 | - | 0.19 | - | −18.75 | - | I | |
| 6 | - | 0.19 | - | 0.32 | - | 68.42 | - | IV | |
| Waterbody 2 | |||||||||
| 8 | 0.21 | 0.13 | 0.21 | 0.14 | 0.00 | −7.69 | I | I | I |
| SHP | Bupstream | Bdownstream | ΔB (%) | I4l (2019) | I4wb (2019) 1 | ||||
|---|---|---|---|---|---|---|---|---|---|
| C1 | C2 | C1 | C2 | C1 | C2 | C1 1 | C2 1 | ||
| Waterbody 1 | |||||||||
| 1 | - | - | 5.95 | 5.50 | - | - | - | - | Class II |
| 2 | 5.95 | 5.50 | 6.30 | 3.00 | 5.88 | −45.45 | I | III | |
| 3 | 6.30 | 3.00 | - | 4.70 | - | 56.67 | - | III | |
| 4 | - | 4.70 | - | 4.70 | - | 0.00 | - | I | |
| 5 | - | 4.70 | - | 4.00 | - | −14.89 | - | I | |
| 6 | - | 4.00 | - | 4.50 | - | 12.50 | - | I | |
| Waterbody 2 | |||||||||
| 8 | 7.00 | 12.00 | 3.50 | 3.50 | −50 | −70.83 | III | IV | III |
Disclaimer/Publisher’s Note: The statements, opinions and data contained in all publications are solely those of the individual author(s) and contributor(s) and not of MDPI and/or the editor(s). MDPI and/or the editor(s) disclaim responsibility for any injury to people or property resulting from any ideas, methods, instructions or products referred to in the content. |
© 2023 by the authors. Licensee MDPI, Basel, Switzerland. This article is an open access article distributed under the terms and conditions of the Creative Commons Attribution (CC BY) license (https://creativecommons.org/licenses/by/4.0/).
Share and Cite
Moldoveanu, M.; Stănescu, S.-V.; Gălie, A.-C. Post-Construction, Hydromorphological Cumulative Impact Assessment: An Approach at the Waterbody Level Integrating Different Spatial Scales. Water 2023, 15, 382. https://doi.org/10.3390/w15030382
Moldoveanu M, Stănescu S-V, Gălie A-C. Post-Construction, Hydromorphological Cumulative Impact Assessment: An Approach at the Waterbody Level Integrating Different Spatial Scales. Water. 2023; 15(3):382. https://doi.org/10.3390/w15030382
Chicago/Turabian StyleMoldoveanu, Marinela, Stelian-Valentin Stănescu, and Andreea-Cristina Gălie. 2023. "Post-Construction, Hydromorphological Cumulative Impact Assessment: An Approach at the Waterbody Level Integrating Different Spatial Scales" Water 15, no. 3: 382. https://doi.org/10.3390/w15030382