
How Do Sampling Methods Affect the Body Size–Abundance Relationships of Benthic Macroinvertebrates in Freshwater Ecosystems? A Comparative Analysis
 ,
,
Abstract
:1. Introduction
2. Materials and Methods
2.1. Study Area
2.2. Experimental Design and Sampling Protocols
2.3. Statistical Analysis
3. Results
4. Discussions
5. Conclusions
Author Contributions
Funding
Institutional Review Board Statement
Informed Consent Statement
Data Availability Statement
Acknowledgments
Conflicts of Interest
References
- Brown, J.H.; Gillooly, J.F.; Allen, A.P.; Savage, V.M.; West, G.B. Toward a metabolic theory of ecology. Ecology 2004, 85, 1771–1789. [Google Scholar] [CrossRef]
- Woodward, G.; Ebenman, B.; Emmerson, M.C.; Montoya, J.M.; Olesen, J.M.; Valido, A.; Warren, P.H. Body size in ecological networks. Trends Ecol. Evol. 2005, 20, 402–409. [Google Scholar] [CrossRef] [PubMed] [Green Version]
- White, E.P.; Ernest, S.M.; Kerkhoff, A.J.; Enquist, B.J. Relationships between body size and abundance in ecology. Trends Ecol. Evol. 2007, 22, 323–330. [Google Scholar] [CrossRef] [PubMed] [Green Version]
- Damuth, J. Population density and body size in mammals. Nature 1981, 290, 699–700. [Google Scholar] [CrossRef]
- Damuth, J. Of size and abundance. Nature 1991, 351, 268–269. [Google Scholar] [CrossRef]
- Gaston, K.J.; Blackburn, T.M. Range size body size relationships: Evidence of scale dependence. Oikos 1996, 75, 479–485. [Google Scholar] [CrossRef]
- Damuth, J. Cope’s rule, the island rule and the scaling of mammalian population density. Nature 1993, 365, 748–750. [Google Scholar] [CrossRef]
- Strayer, D.L. Perspectives on the size structure of lacustrine zoobenthos, its causes and its consequences. J. N. Am. Benthol. Soc. 1991, 10, 210–221. [Google Scholar] [CrossRef]
- Reizopoulou, S.; Nicolaidou, A. Index of Size Distribution (ISD): A method of quality assessment for coastal lagoons. Hydrobiologia 2007, 577, 141–149. [Google Scholar] [CrossRef]
- Gjoni, V.; Cozzoli, F.; Rosati, I.; Basset, A. Size-density relationships: A cross-community approach to benthic macroinvertebrates in Mediterranean and Black Sea lagoons. Estuar. Coast 2017, 40, 1142–1158. [Google Scholar] [CrossRef]
- Gjoni, V.; Ghinis, S.; Pinna, M.; Mazzotta, L.; Marini, G.; Ciotti, M.; Rosati, I.; Vignes, F.; Arima, S.; Basset, A. Patterns of functional diversity of macroinvertebrates across three aquatic ecosystem types, NE Mediterranean. Medit. Mar. Sci. 2019, 20, 703–717. [Google Scholar] [CrossRef] [Green Version]
- Hanson, J.M. Macroinvertebrate size-distributions of two contrasting freshwater macrophyte communities. Freshw. Biol. 1990, 24, 481–491. [Google Scholar] [CrossRef]
- Rodríguez, M.A.; Magnan, P. Community structure of lacustrine macrobenthos: Do taxon based and size-based approaches yield similar insights? Can. J. Fish. Aquat. Sci. 1993, 50, 800–815. [Google Scholar] [CrossRef]
- Pomeranz, J.; Junker, J.R.; Wesner, J. Spatiotemporal variability of abundance size-spectra in streams across North America. Authorea 2021, 27. Available online: https://www.authorea.com/doi/full/10.22541/au.160288488.87240084 (accessed on 10 January 2022).
- Solimini, A.G.; Benvenuti, A.; D’Olimpio, R.; De Cicco, M.; Carchini, G. Size structure of benthic invertebrate assemblages in a Mediterranean river. J. N. Am. Benthol. Soc. 2001, 20, 421–431. [Google Scholar] [CrossRef]
- Schmid, P.E.; Schmid-Araya, J.M.; Tokeshi, M. The scaling of biomass variance across trophic levels in stream species communities: A macroecological approach. Hydrobiologia 2020, 847, 2705–2723. [Google Scholar] [CrossRef]
- Gjoni, V.; Marle, P.; Ibelings, B.W.; Castella, E. Size–Abundance Relationships of Freshwater Macroinvertebrates in Two Contrasting Floodplain Channels of Rhone River. Water 2022, 14, 794. [Google Scholar] [CrossRef]
- Wallace, J.B.; Webster, J.R. The role of macroinvertebrates in stream ecosystem function. Annu. Rev. Entomol. 1996, 41, 115–139. [Google Scholar] [CrossRef]
- Friberg, N.; Bonada, N.; Bradley, D.C.; Dunbar, M.J.; Edwards, F.K.; Grey, J.; Hayes, R.B.; Hildrew, A.G.; Lamouroux, N.; Trimmer, M.; et al. Biomonitoring of human impacts in freshwater ecosystems: The good, the bad and the ugly. Adv. Ecol. Res. 2011, 44, 1–69. [Google Scholar]
- Basset, A.; Sabetta, L.; Sangiorgio, F.; Pinna, M.; Migoni, D.; Fanizzi, F.; Barbone, E.; Galuppo, N.; Fonda Umani, S.; Reizopoulou, S.; et al. Biodiversity conservation in Mediterranean and Black Sea lagoons: A trait-oriented approach to benthic invertebrate guilds. Aquat. Conserv. Mar. Freshw. Ecosyst. 2008, 18/S1, 4–15. [Google Scholar] [CrossRef]
- Morin, A.; Rodriguez, M.A.; Nadon, D. Temporal and environmental variation in the biomass spectrum of benthic invertebrates in streams: An application of thin-plate splines and relative warp analysis. Can. J. Fish. Aquat. Sci. 1995, 52, 1881–1892. [Google Scholar] [CrossRef]
- Renzi, M.; Pinna, M.; Basset, A. Do Mining Activities Significantly Affect Feeding Behavior of Freshwater Benthic Macroinvertebrates? A Case Study in South Sardinia (Italy). Mine Water Environ. 2017, 36, 239–247. [Google Scholar]
- Di Sabatino, A.; Cristiano, G.; Pinna, M.; Lombardo, P.; Miccoli, F.P.; Marini, G.; Vignini, P.; Cicolani, B. Structure, functional organization and biological traits of macroinvertebrate assemblages from leaf-bags and benthic samples in a third-order stream of Central Apennines (Italy). Ecol. Indic. 2014, 46, 84–91. [Google Scholar] [CrossRef]
- Di Sabatino, A.; Cristiano, G.; Di Sanza, D.; Lombardo, P.; Giansante, C.; Caprioli, R.; Vignini, P.; Miccoli, F.P.; Cicolani, B. Leaf-Nets (LN): A new quantitative method for sampling macroinvertebrates in non-wadeable streams and rivers. River Res. Appl. 2016, 32, 1242–1251. [Google Scholar] [CrossRef]
- Di Sabatino, A.; Cristiano, G.; Vignini, P.; Miccoli, F.P.; Cicolani, B. A modification of the leaf-nets method for sampling benthic invertebrates in spring habitats. J. Limnol. 2018, 77, 82–87. [Google Scholar] [CrossRef] [Green Version]
- Cristiano, G.; Cicolani, B.; Miccoli, F.P.; Di Sabatino, A. A modification of the leaf-bags method to assess spring ecosystem functioning: Benthic invertebrates and leaf-litter breakdown in Vera Spring (Central Italy). PeerJ 2019, 7, e6250. [Google Scholar] [CrossRef] [PubMed]
- Lamberti, G.A.; Hauer, F.R. Methods in stream ecology. Academic Press: Cambridge, MA, USA, 2017. [Google Scholar]
- Fonnesu, A.; Pinna, M.; Basset, A. Spatial and temporal variations of detritus breakdown rates in the river Flumendosa basin (Sardinia, Italy). Int. Rev. Hydrobiol. 2004, 89, 443–452. [Google Scholar] [CrossRef]
- Barbone, E.; Rosati, I.; Pinna, M.; Basset, A. Taxonomic and dimensional structure of benthic macroinvertebrate guilds in the Margherita di Savoia Salt Pans (Italy). Transit. Waters Bull. 2007, 1, 21–31. [Google Scholar]
- Galuppo, N.; Maci, S.; Pinna, M.; Basset, A. Habitat types and distribution of benthic macroinvertebrates in a transitional water ecosystem: Alimini Grande (Puglia, Italy). Transit. Waters Bull. 2007, 1, 9–19. [Google Scholar]
- Sangiorgio, F.; Quintino, V.; Rosati, I.; Rodrigues, A.M.; Pinna, M.; Basset, A. Macrofauna in Mediterranean and Black Sea transitional aquatic ecosystems: A comparative study of the benthic populations sampled by box corer and leaf bags. Ecol. Indic. 2014, 38, 159–169. [Google Scholar] [CrossRef]
- Pinna, M.; Marini, G.; Cristiano, G.; Mazzotta, L.; Vignini, P.; Cicolani, B.; Di Sabatino, A. Influence of aperiodic summer droughts on leaf litter breakdown and macroinvertebrate assemblages: Testing the drying memory in a Central Apennines River (Aterno River, Italy). Hydrobiologia 2016, 782, 111–126. [Google Scholar] [CrossRef]
- Tachet, H.; Bournaud, M.; Richoux, P.; Usseglio-Polatera, P. Invertébrés d’eau douce: Systématique, Biologie, Ecologie, 2nd ed.; CNRS Editions: Paris, France, 2010. [Google Scholar]
- Pinna, M.; Janzen, S.; Franco, A.; Specchia, V.; Marini, G. Role of habitats and sampling techniques on macroinvertebrate descriptors and ecological indicators: An experiment in a protected Mediterranean lagoon. Ecol. Indic. 2017, 83, 495–503. [Google Scholar] [CrossRef]
- Sharma, P.; Kaur, M. Classification in pattern recognition: A review. Int. J. Adv. Res. Comput. Sci. Eng. Inf. Technol. 2013, 3, 298–306. [Google Scholar]
- Damuth, J. Population ecology: Common rules for animals and plants. Nature 1998, 395, 115–116. [Google Scholar] [CrossRef]
- Schmid, P.E.; Tokeshi, M.; Schmid-Araya, J.M. Relation between population density and body size in stream communities. Science 2000, 289, 1557–1560. [Google Scholar] [CrossRef] [PubMed] [Green Version]
- Schmid, P.E.; Tokeshi, M.; Schmid-Araya, J.M. Scaling in stream communities. Proc. R. Soc. Lond. B 2002, 269, 2587–2594. [Google Scholar] [CrossRef] [PubMed]
- Stead, T.K.; Schmid-Araya, J.M.; Schmid, P.E.; Hildrew, A.G. The distribution of body size in a stream community: One system, many patterns. J. Anim. Ecol. 2005, 74, 475–487. [Google Scholar] [CrossRef]
- Gjoni, V.; Basset, A. A cross-community approach to energy pathways across lagoon macroinvertebrate guilds. Estuar. Coast 2018, 41, 2433–2446. [Google Scholar] [CrossRef]
- Gjoni, V.; Glazier, D.S. A perspective on body size and abundance relationships across ecological communities. Biology 2020, 9, 42. [Google Scholar] [CrossRef] [Green Version]
- Nee, S.; Read, A.F.; Greenwood, J.J.; Harvey, P.H. The relationship between abundance and body size in British birds. Nature 1991, 351, 312–313. [Google Scholar] [CrossRef]
- Tokeshi, M. Species Coexistence: Ecological and Evolutionary Perspective; Blackwell Science Ltd.: London, UK, 1999; 454p. [Google Scholar]
- King, J.M.; Hensall-Howard, M.P.; Day, J.A.; Davies, B.R. Leaf pack dynamics in a southern African stream. Freshw. Biol. 1987, 18, 325–340. [Google Scholar] [CrossRef]
- Warren, P.H. Estimating morphologically determined connectance and structure for food webs of freshwater invertebrates. Freshw. Biol. 1995, 33, 213–221. [Google Scholar] [CrossRef]
- Trebilco, R.; Baum, J.K.; Salomon, A.K.; Dulvy, N.K. Ecosystem ecology: Size-based constraints on the pyramids of life. Trends Ecol. Evol. 2013, 28, 423–431. [Google Scholar] [CrossRef] [PubMed]
- Cross, W.F.; Hood, J.M.; Benstead, J.P.; Huryn, A.D.; Nelson, D. Interactions between temperature and nutrients across levels of ecological organization. Glob. Chang. Biol. 2015, 21, 1025–1040. [Google Scholar] [CrossRef] [PubMed] [Green Version]
- O’Gorman, E.J.; Pichler, D.E.; Adams, G.; Benstead, J.; Cohen, H.; Craig, N.; Cross, W.F.; Demars, B.O.L.; Friberg, N.; Giíslason, G.M.; et al. Impacts of warming on the structure and functioning of aquatic communities: Individual- to ecosystem-level responses. Adv. Ecol. Res. 2012, 47, 81–176. [Google Scholar]
- Jennings, S.; Mackinson, S. Abundance–body mass relationships in size-structured food webs. Ecol. Lett. 2003, 6, 971–974. [Google Scholar] [CrossRef]
- Pinna, M.; Sangiorgio, F.; Fonnesu, A.; Basset, A. Spatial analysis of plant detritus processing in a Mediterranean River type: The case of the River Tirso Basin, Sardinia, Italy. J. Environ. Sci. 2003, 15, 227–240. [Google Scholar]
- Pinna, M.; Basset, A. Summer drought disturbance on plant detritus decomposition processes in three River Tirso (Sardinia, Italy) sub-basins. Hydrobiologia 2004, 522, 311–319. [Google Scholar] [CrossRef]
- Petersen, R.C.; Cummins, K.W. Leaf processing in a woodland stream. Freshw. Biol. 1974, 4, 343–368. [Google Scholar] [CrossRef]
- Schmid-Araya, J.M. Invertebrate recolonization patterns in the hyporheic zone of a gravel stream. Limnol. Oceanogr. 2000, 45, 1000–1005. [Google Scholar] [CrossRef]
- Blackburn, T.M.; Gaston, K.J. Animal body size distributions: Patterns, mechanisms and implications. Trends Ecol. Evol. 1994, 9, 471–474. [Google Scholar] [CrossRef] [PubMed]
- Ross, H.H. Stream communities and terrestrial biomes. Arch. Für Hydrobiol. 1963, 59, 235–242. [Google Scholar]
- Orth, R.J.; Moore, K.A. Seasonal and year-to-year variations in the growth of Zostera marina L. (eelgrass) in the lower Chesapeake Bay. Aquat. Bot. 1986, 24, 335–341. [Google Scholar] [CrossRef]
- Diehl, S.; Kornijów, R. Influence of Submerged Macrophytes on Trophic Interactions among Fish and Macroinvertebrates. In the Structuring Role of Submerged Macrophytes in Lakes; Springer: New York, NY, USA, 1998; pp. 24–26. [Google Scholar]
- Bozzeda, F.; Zangaro, F.; Colangelo, M.A.; Pinna, M. Relationships between size and abundance in beach plastics: A power-law approach. Mar. Pollut. Bull. 2021, 173, 113005. [Google Scholar] [CrossRef] [PubMed]


| Sampling Technique | Intercept Value | Intercept SE | Slope Value | Slope SE | C.I. Min | C.I. Max | Adjusted R-Square | p |
|---|---|---|---|---|---|---|---|---|
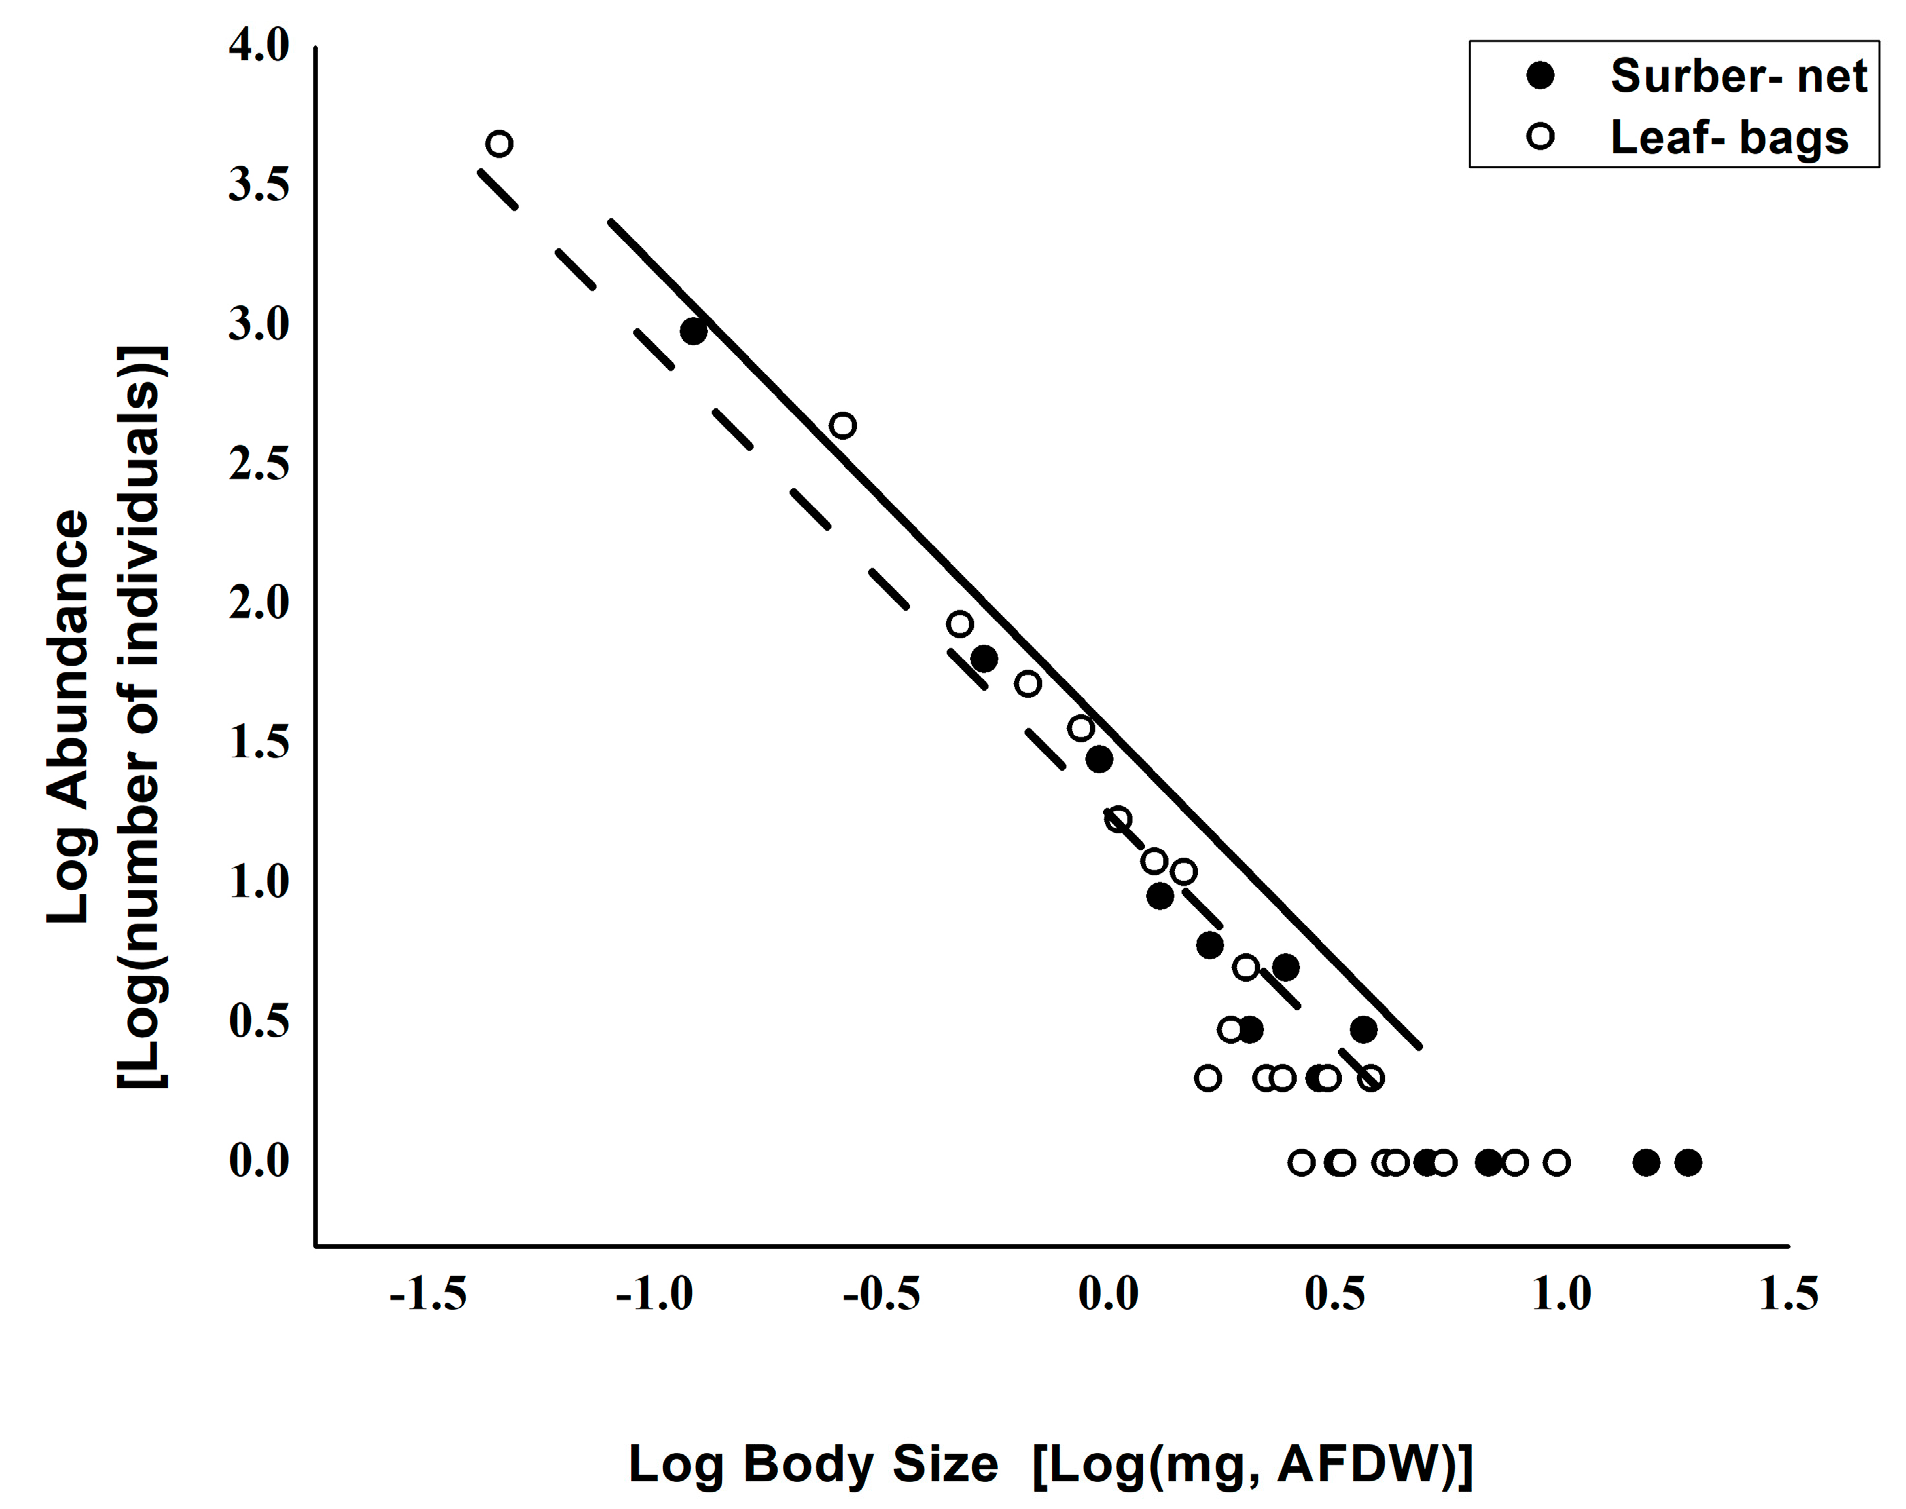
| Surber-net | 1.253 | 0.109 | −1.416 | 0.163 | −1.497 | −1.334 | 0.851 | *** |
| Leaf-bags | 1.226 | 0.065 | −1.817 | 0.116 | −1.875 | −1.759 | 0.92 | *** |
| Surber Net | |||||
|---|---|---|---|---|---|
| Source | GDL | SS | MSE | F | Pr > F |
| Model | 1 | 0.008 | 0.008 | 0.022 | 0.882 |
| Error | 37 | 13.300 | 0.359 | ||
| Correct total | 38 | 13.308 | |||
| Leaf bags | |||||
| Source | GDL | SS | MSE | F | Pr > F |
| Model | 1 | 0.011 | 0.011 | 0.010 | 0.923 |
| Error | 45 | 51.305 | 1.140 | ||
| Correct total | 46 | 51.316 | |||
| Source | Value | SE | t | Pr > |t| | Lower Limit (95%) | Upper Limit (95%) |
|---|---|---|---|---|---|---|
| Intercept | 0.422 | 0.107 | 3.935 | 0 | 0.202 | 0.641 |
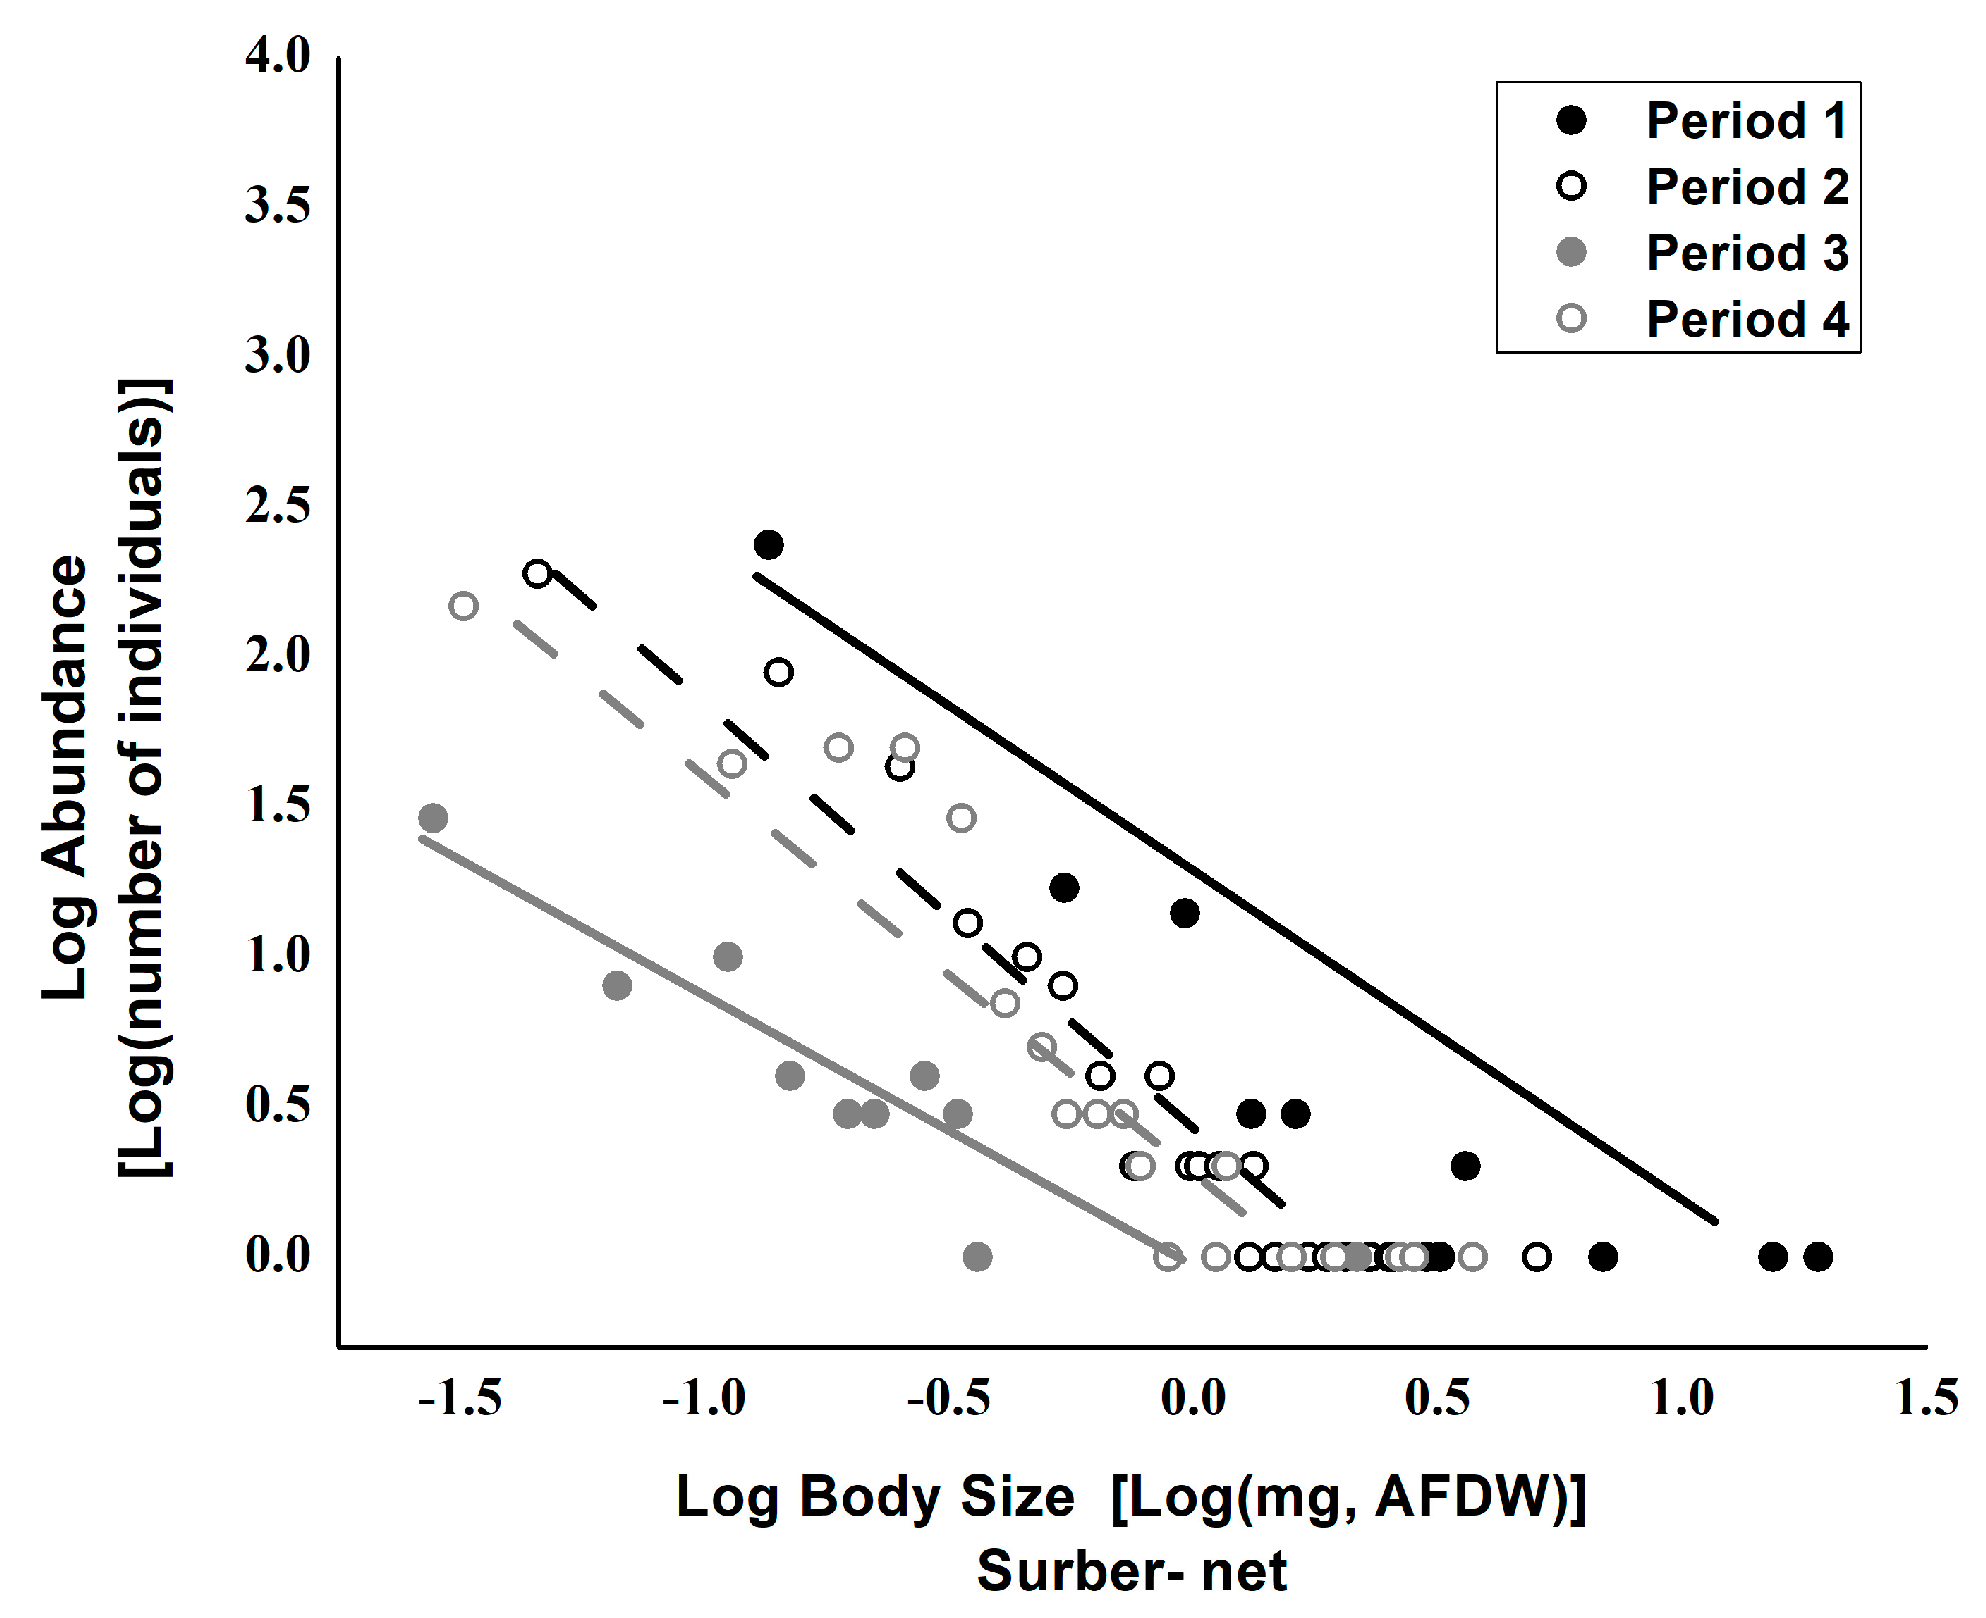
| Body-size_Surber-net_Period 1 | −0.472 | 0.174 | −2.704 | 0.012 | −0.829 | −0.114 |
| Body-size_Surber-net_Period 2 | −1.497 | 0.132 | −11.303 | <0.0001 | −1.769 | −1.226 |
| Body-size_Surber-net_Period 3 | −0.19 | 0.188 | −1.007 | 0.323 | −0.576 | 0.196 |
| Body-size_Surber-net_Period 4 | −1.390 | 0.215 | −6.448 | <0.0001 | −1.831 | −0.948 |
| Intercept | 0.476 | 0.083 | 5.769 | <0.0001 | 0.310 | 0.642 |
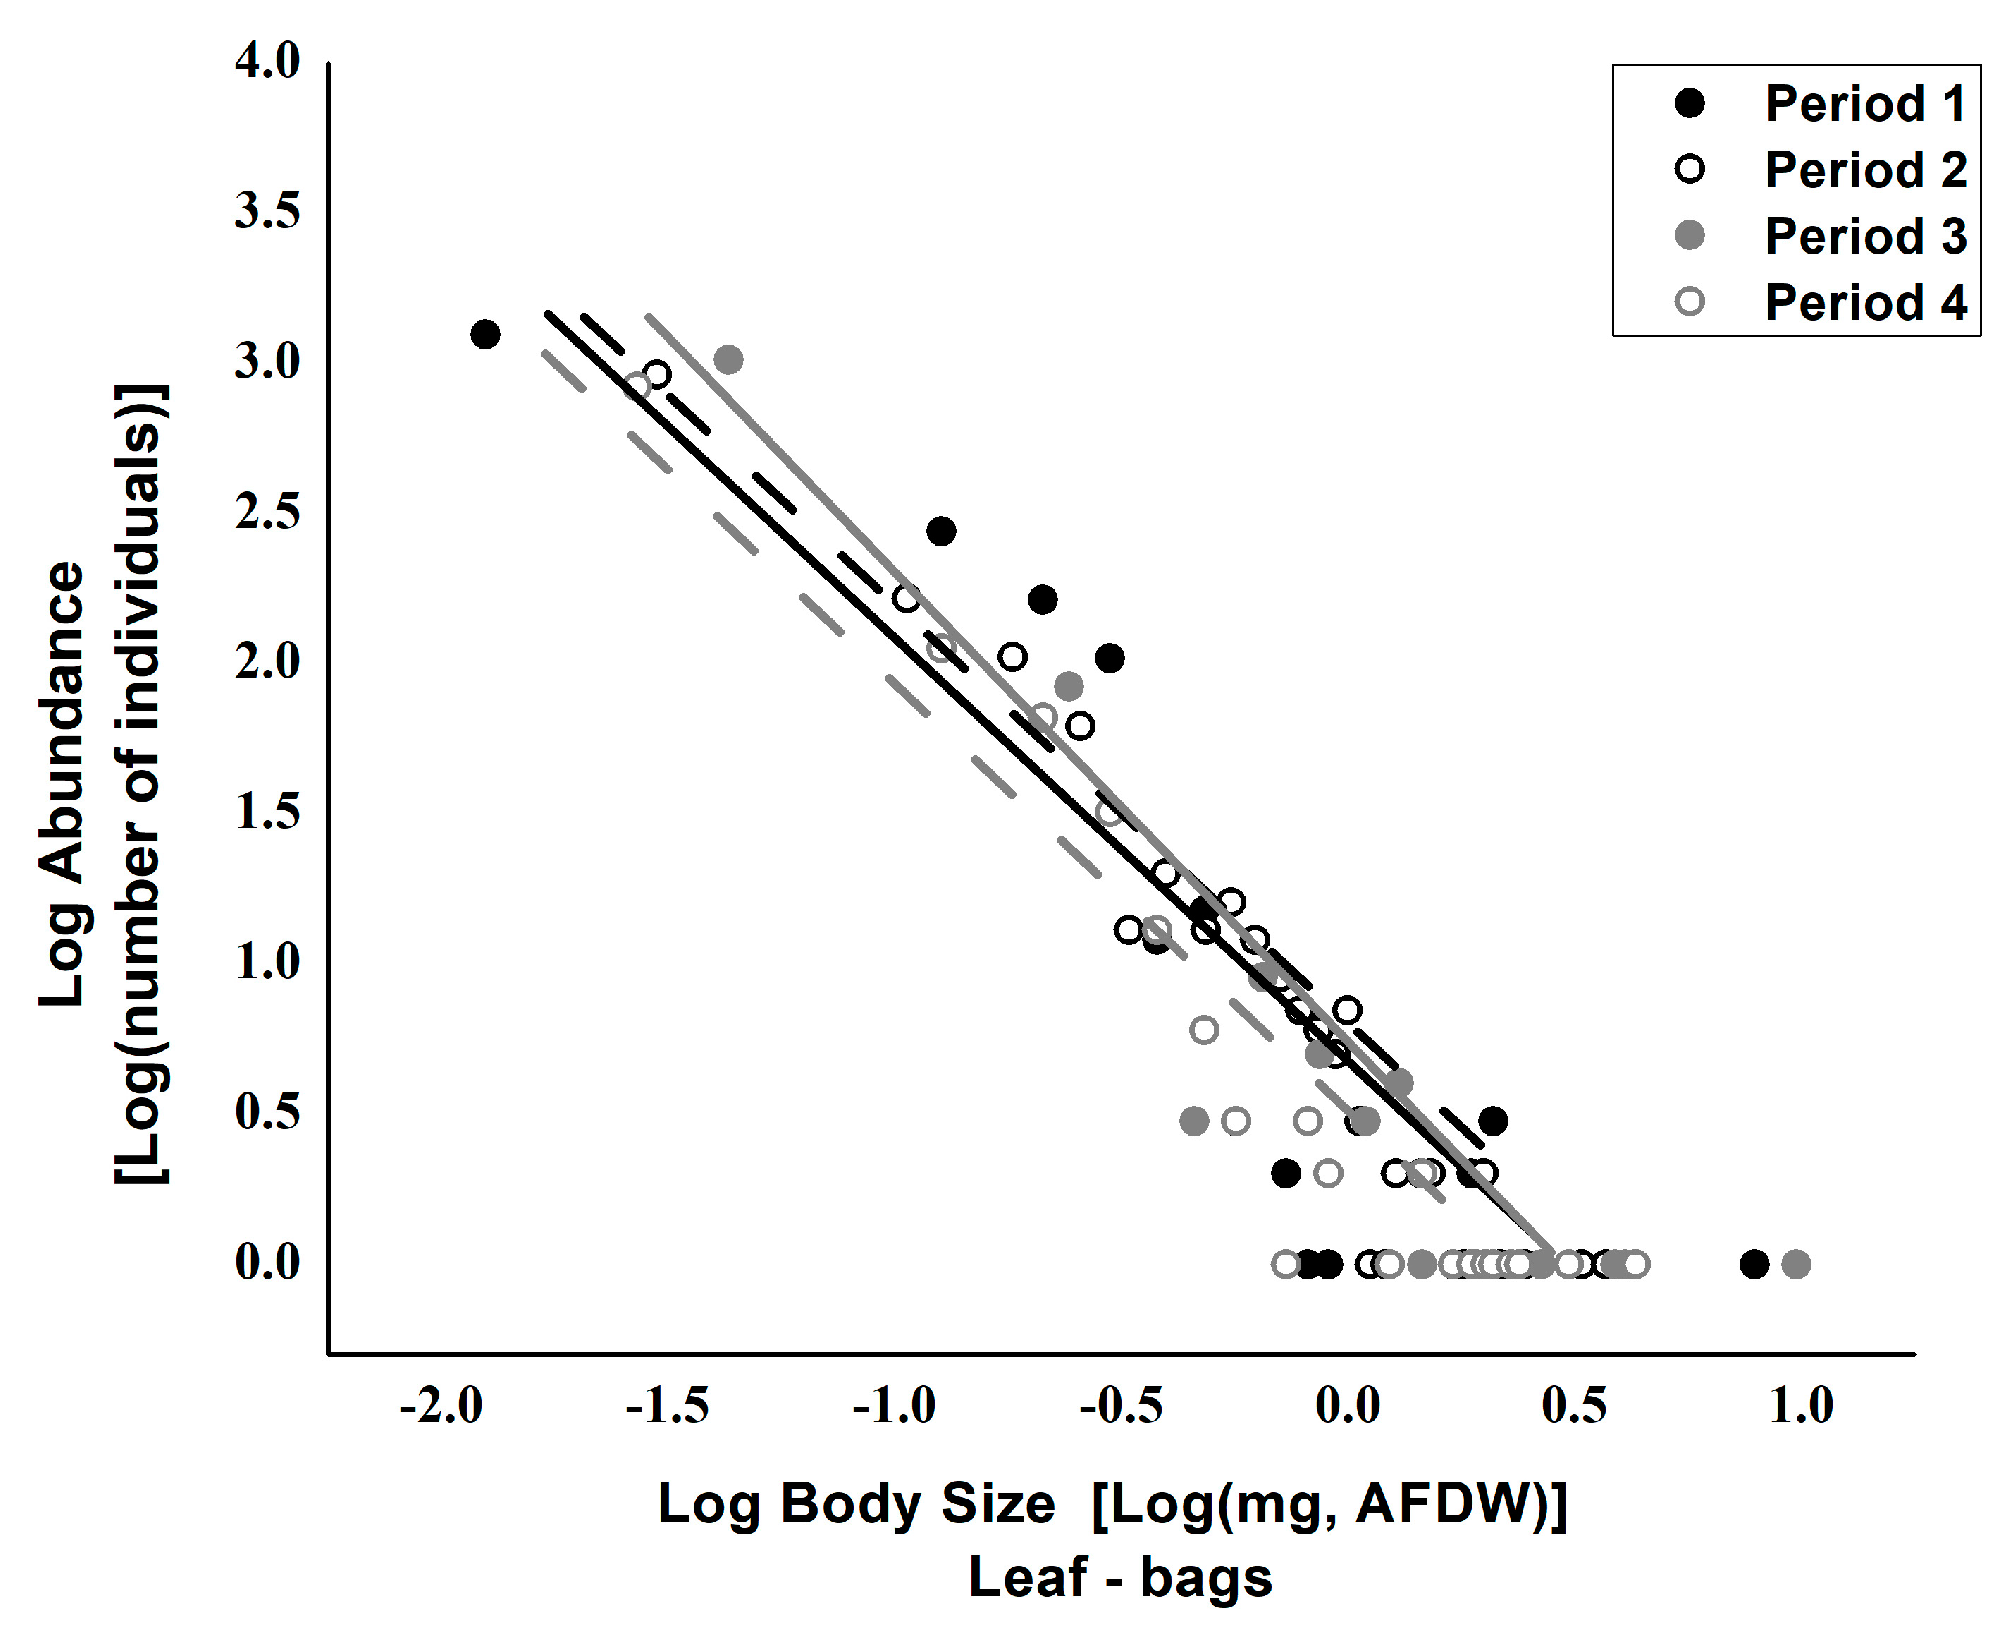
| Body-size_Leaf-Bags_Period 1 | 0.166 | 0.175 | 0.953 | 0.346 | −0.186 | 0.518 |
| Body-size_Leaf-Bags_Period 2 | 0.197 | 0.101 | 1.947 | 0.058 | −0.007 | 0.401 |
| Body-size_Leaf-Bags_Period 3 | 0.292 | 0.111 | 2.639 | 0.011 | 0.069 | 0.515 |
| Body-size_Leaf-Bags_Period 4 | 0 | 0 | - | - | - | - |
| DF | Sum of Squares | Mean Square | F Value | Prob > F | |
|---|---|---|---|---|---|
| Model Leaf-Bags | 4 | 11.576 | 2.894 | 3.901 | 0.376 |
| Error Leaf-Bags | 1076 | 798.216 | 0.742 | ||
| Total Leaf-Bags | 1080 | 809.793 | |||
| Model Surber-net | 4 | 1.135 | 0.378 | 4.201 | 0.005 *** |
| Error Surber-net | 5175 | 466.194 | 0.090 | ||
| Total Surber-net | 5178 | 467.329 |
Disclaimer/Publisher’s Note: The statements, opinions and data contained in all publications are solely those of the individual author(s) and contributor(s) and not of MDPI and/or the editor(s). MDPI and/or the editor(s) disclaim responsibility for any injury to people or property resulting from any ideas, methods, instructions or products referred to in the content. |
© 2023 by the authors. Licensee MDPI, Basel, Switzerland. This article is an open access article distributed under the terms and conditions of the Creative Commons Attribution (CC BY) license (https://creativecommons.org/licenses/by/4.0/).
Share and Cite
Pinna, M.; Gjoni, V.; Bozzeda, F.; Marini, G.; Cristiano, G.; Di Sabatino, A. How Do Sampling Methods Affect the Body Size–Abundance Relationships of Benthic Macroinvertebrates in Freshwater Ecosystems? A Comparative Analysis. Water 2023, 15, 386. https://doi.org/10.3390/w15030386
Pinna M, Gjoni V, Bozzeda F, Marini G, Cristiano G, Di Sabatino A. How Do Sampling Methods Affect the Body Size–Abundance Relationships of Benthic Macroinvertebrates in Freshwater Ecosystems? A Comparative Analysis. Water. 2023; 15(3):386. https://doi.org/10.3390/w15030386
Chicago/Turabian StylePinna, Maurizio, Vojsava Gjoni, Fabio Bozzeda, Gabriele Marini, Giovanni Cristiano, and Antonio Di Sabatino. 2023. "How Do Sampling Methods Affect the Body Size–Abundance Relationships of Benthic Macroinvertebrates in Freshwater Ecosystems? A Comparative Analysis" Water 15, no. 3: 386. https://doi.org/10.3390/w15030386