
Assessment of Water Quality and Heavy Metal Environmental Risk on the Peri-Urban Karst Tropical Lake La Sabana, Yucatán Peninsula
 , , and
Abstract
:
1. Introduction
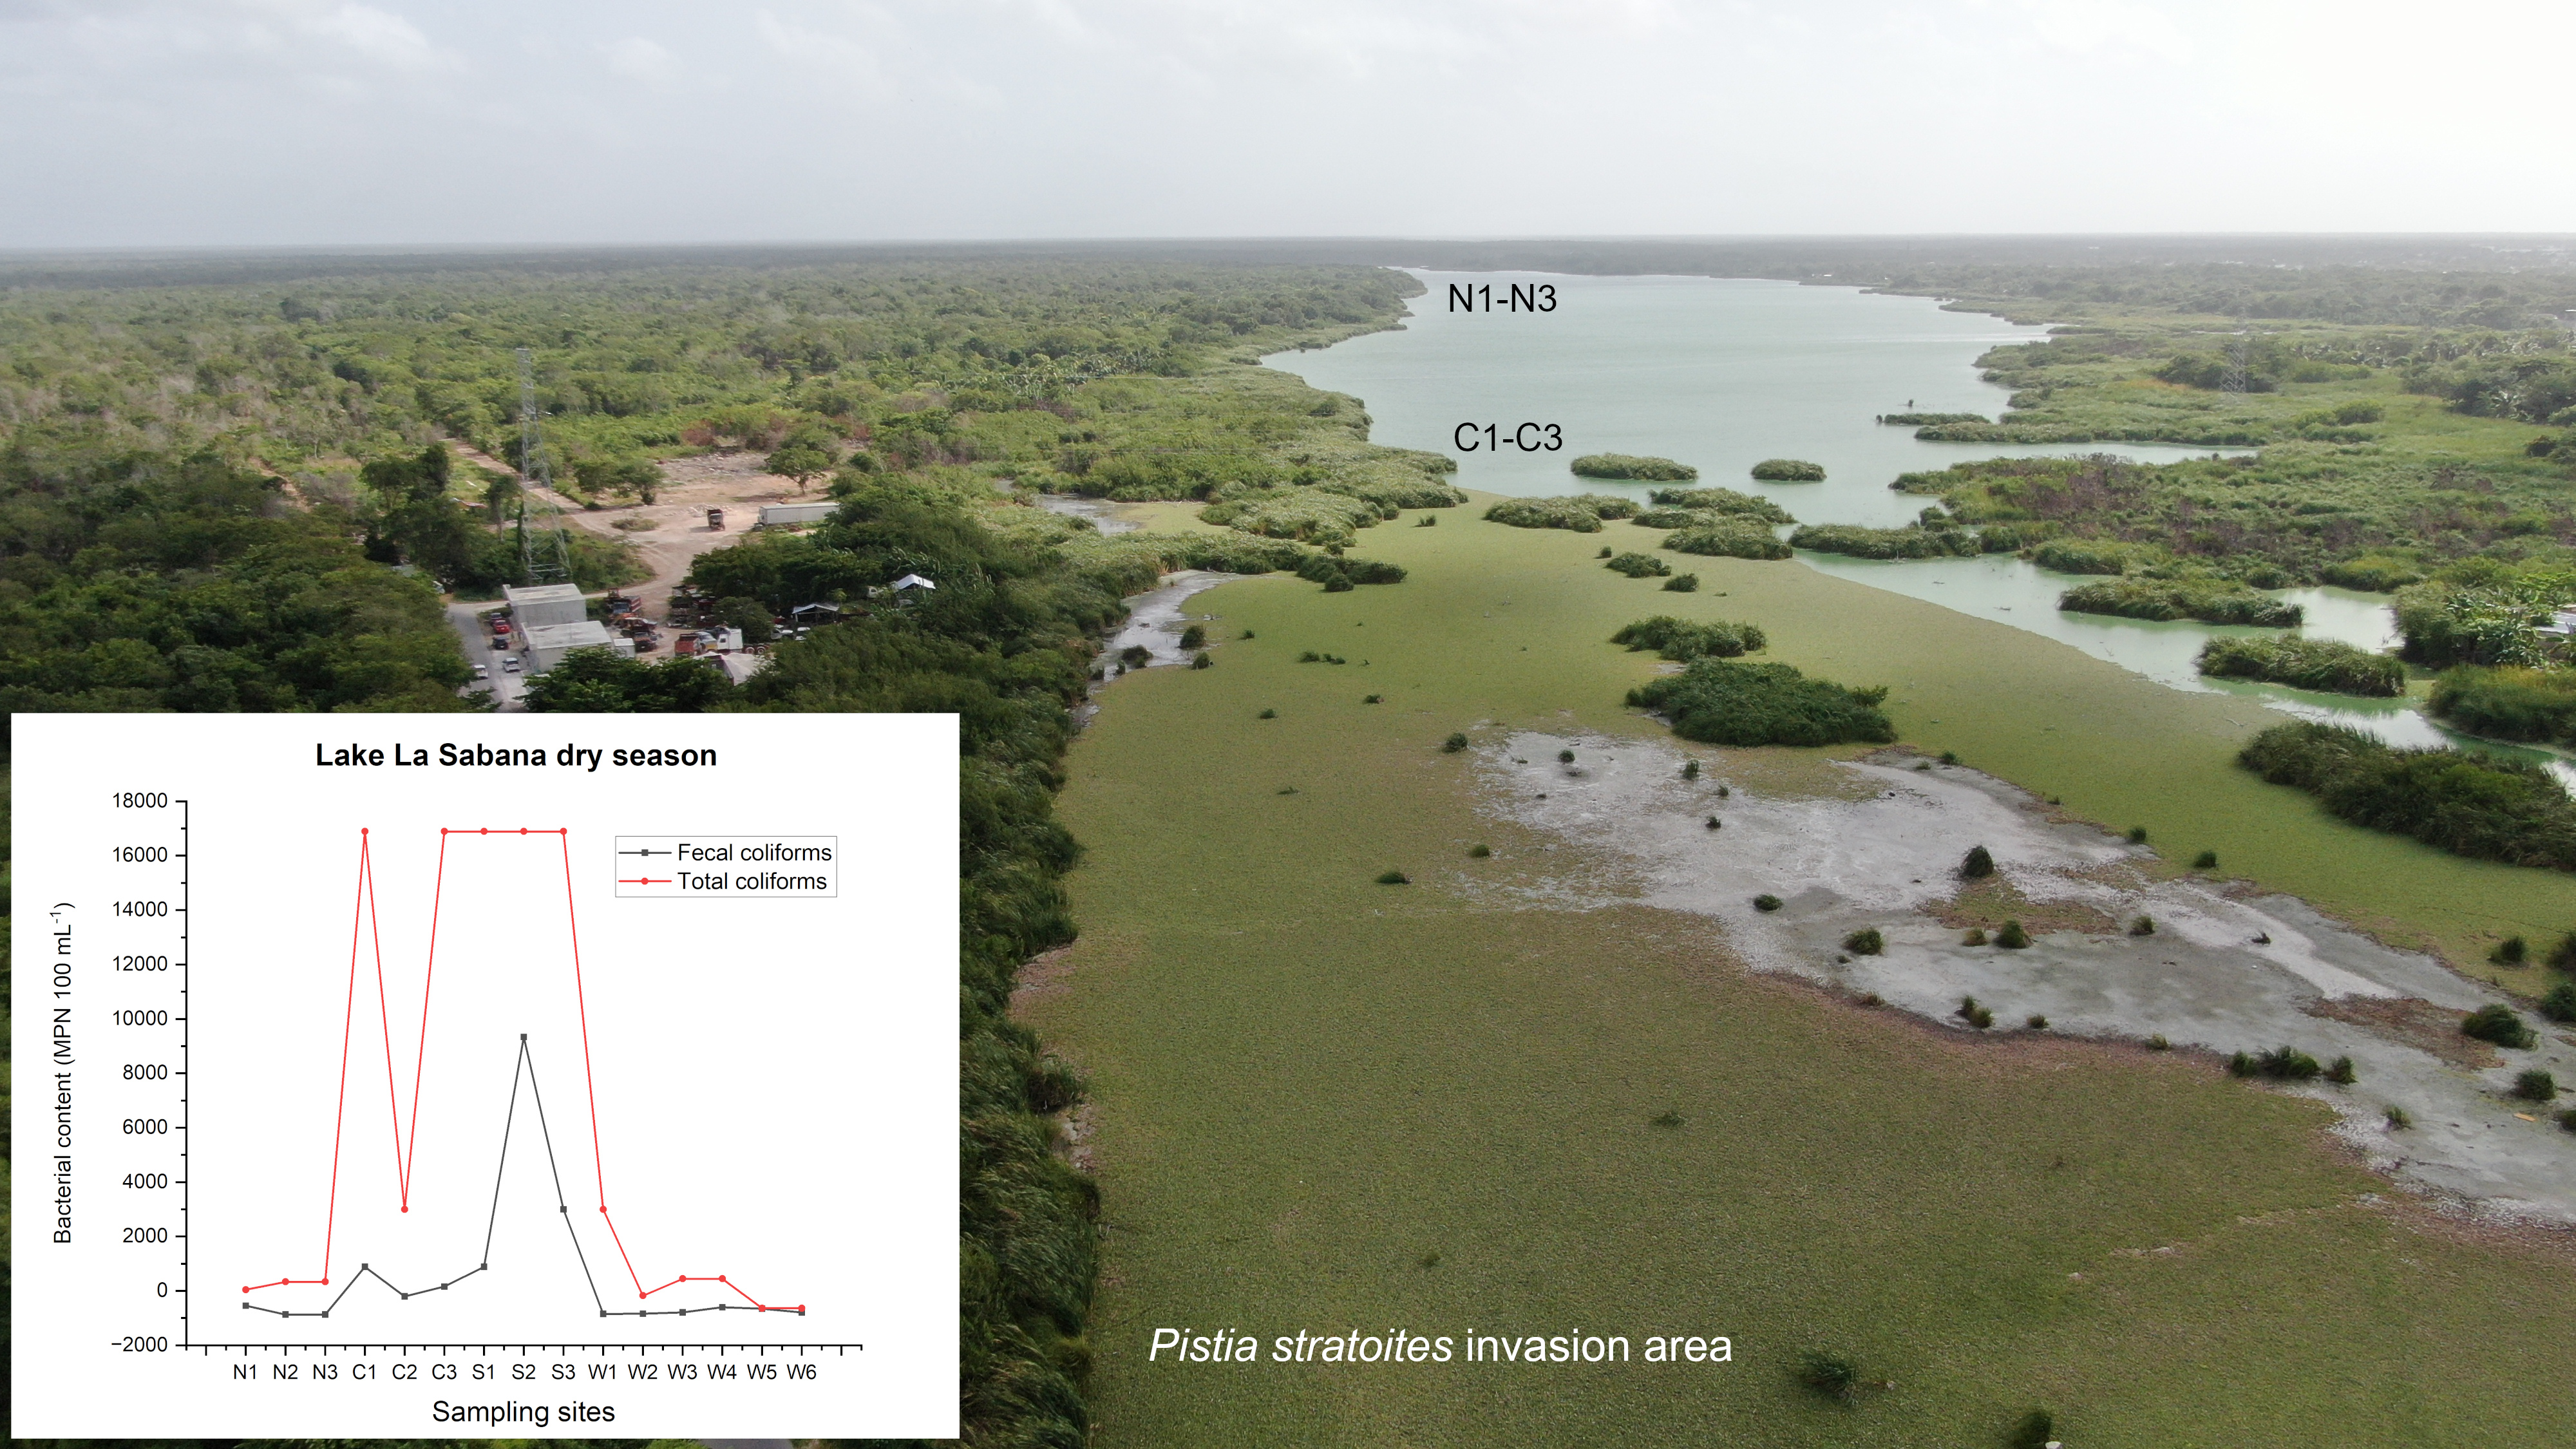
1.1. Study Site
1.2. Water Physical, Chemical and Microbiological Parameters, and Quality Assessment
1.3. Heavy Metals in Sediment, Fish Tissue and Ecological Risk Assessment
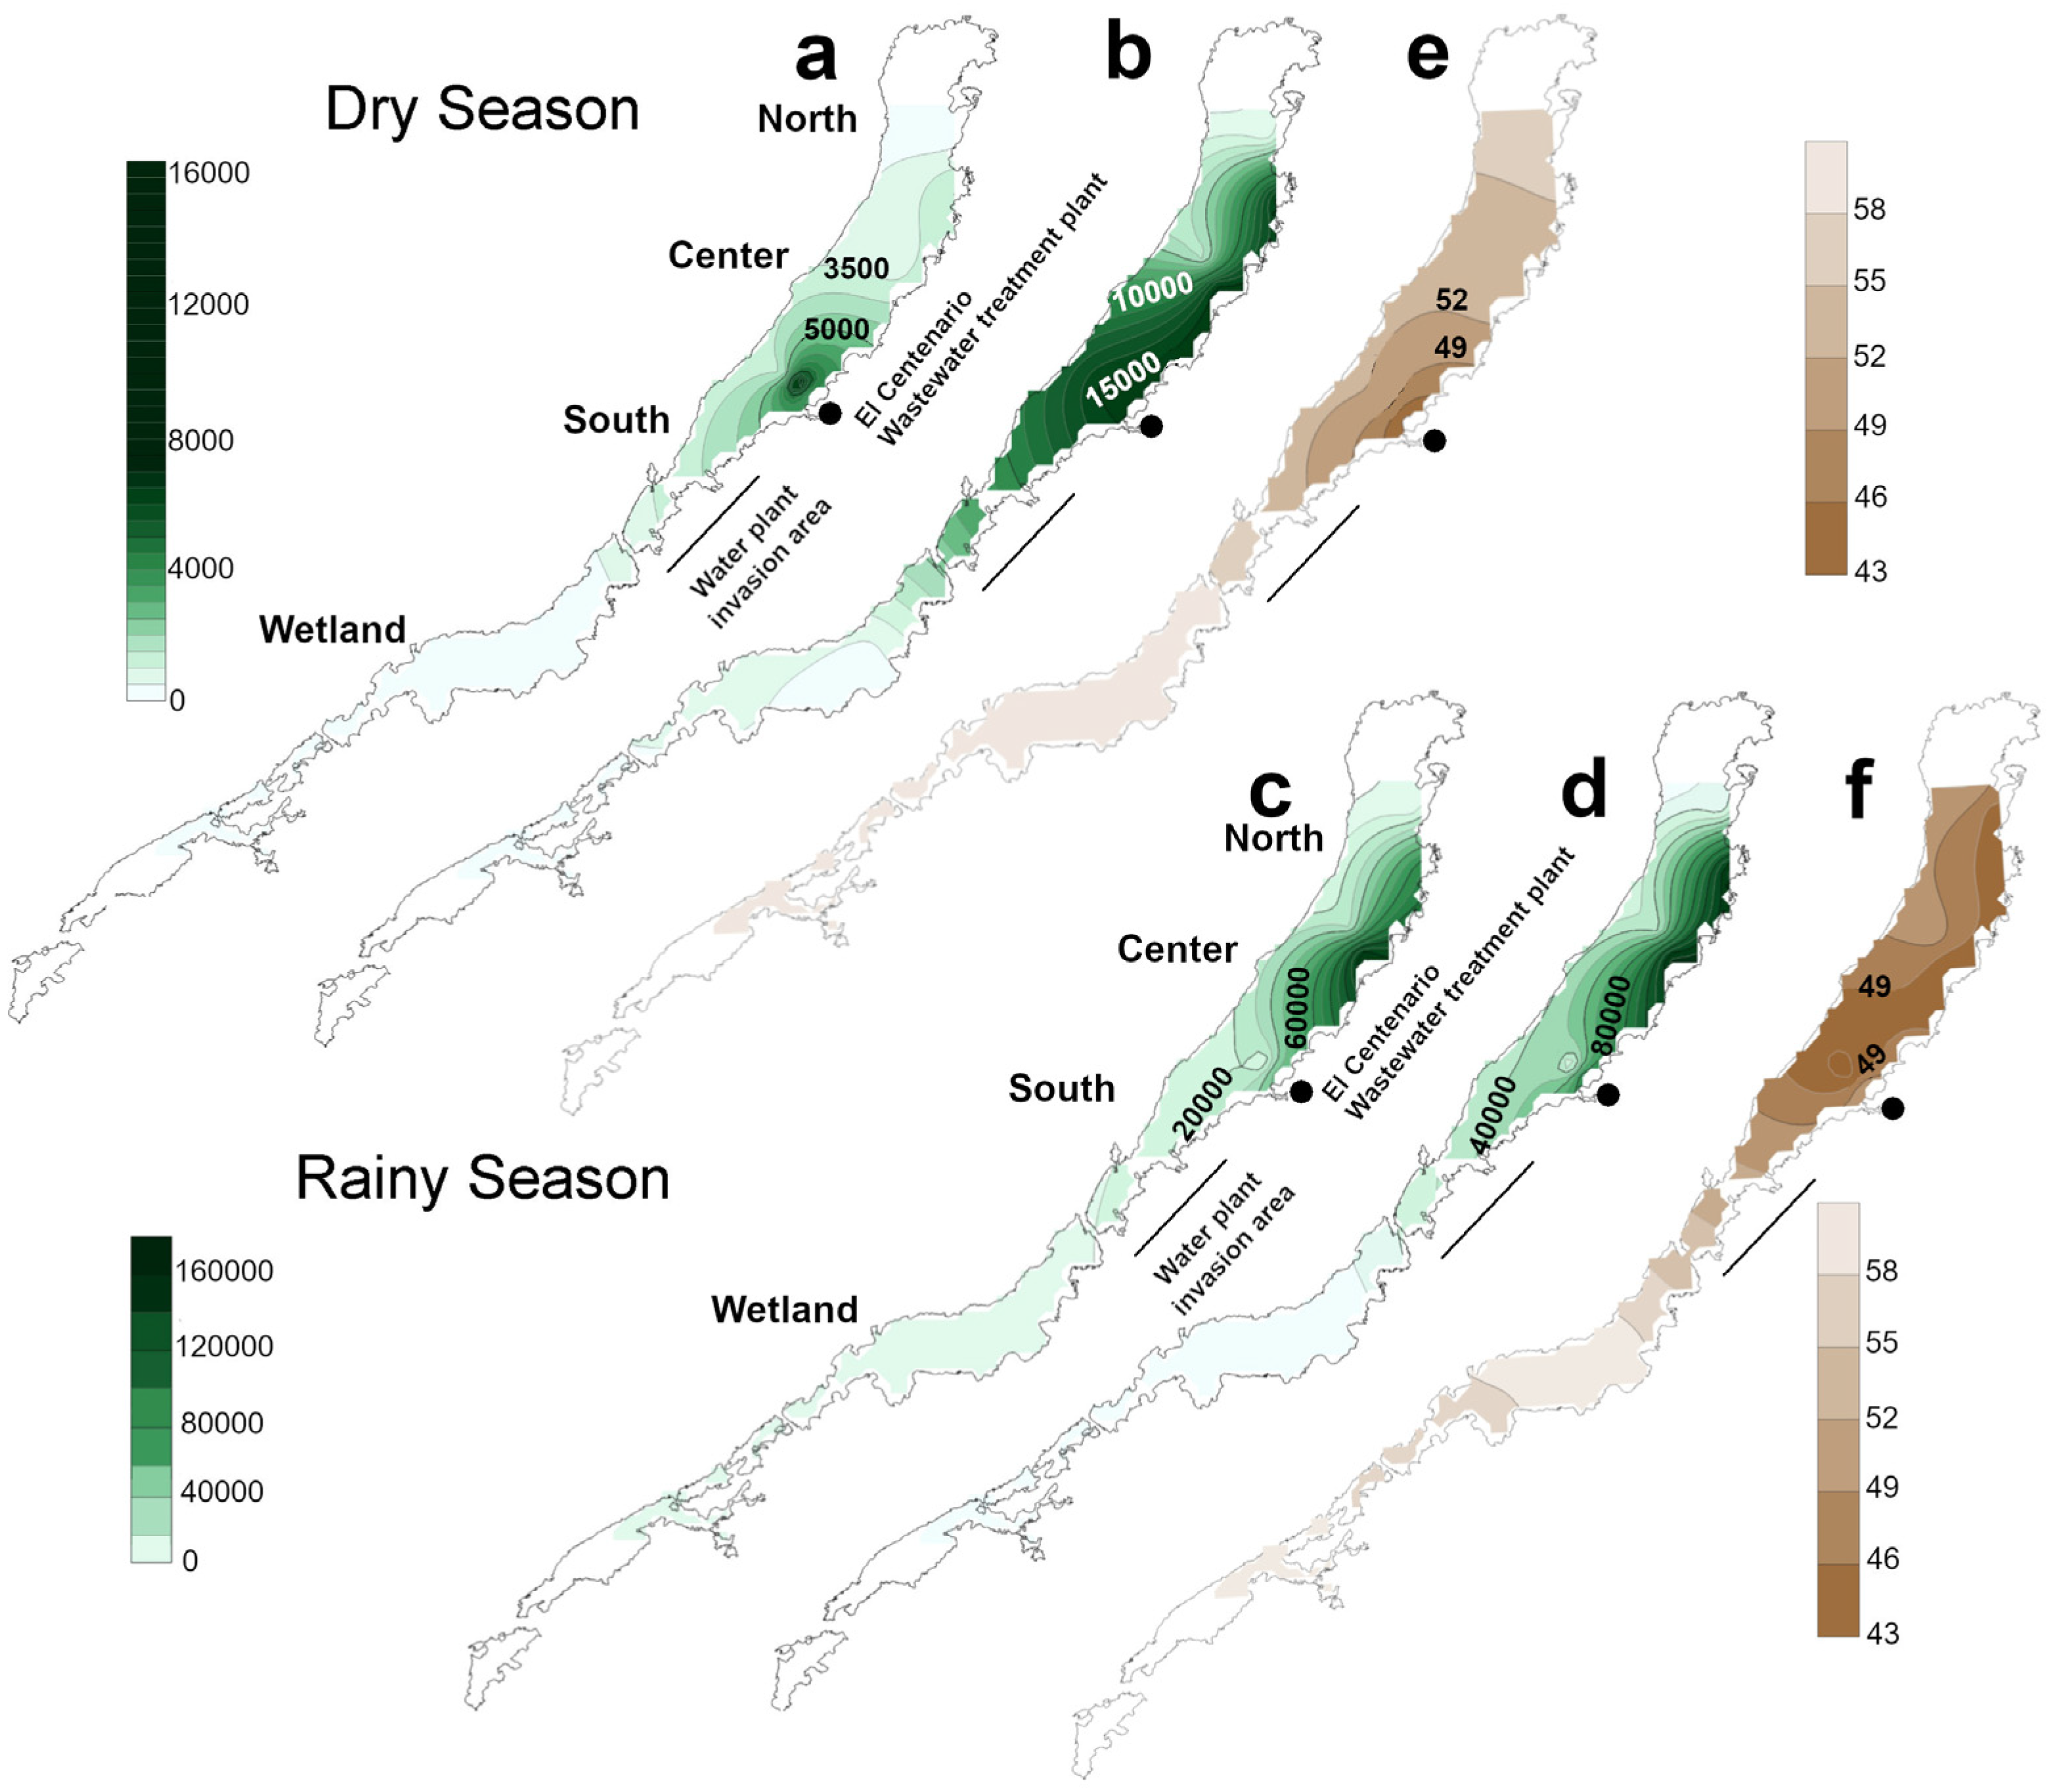
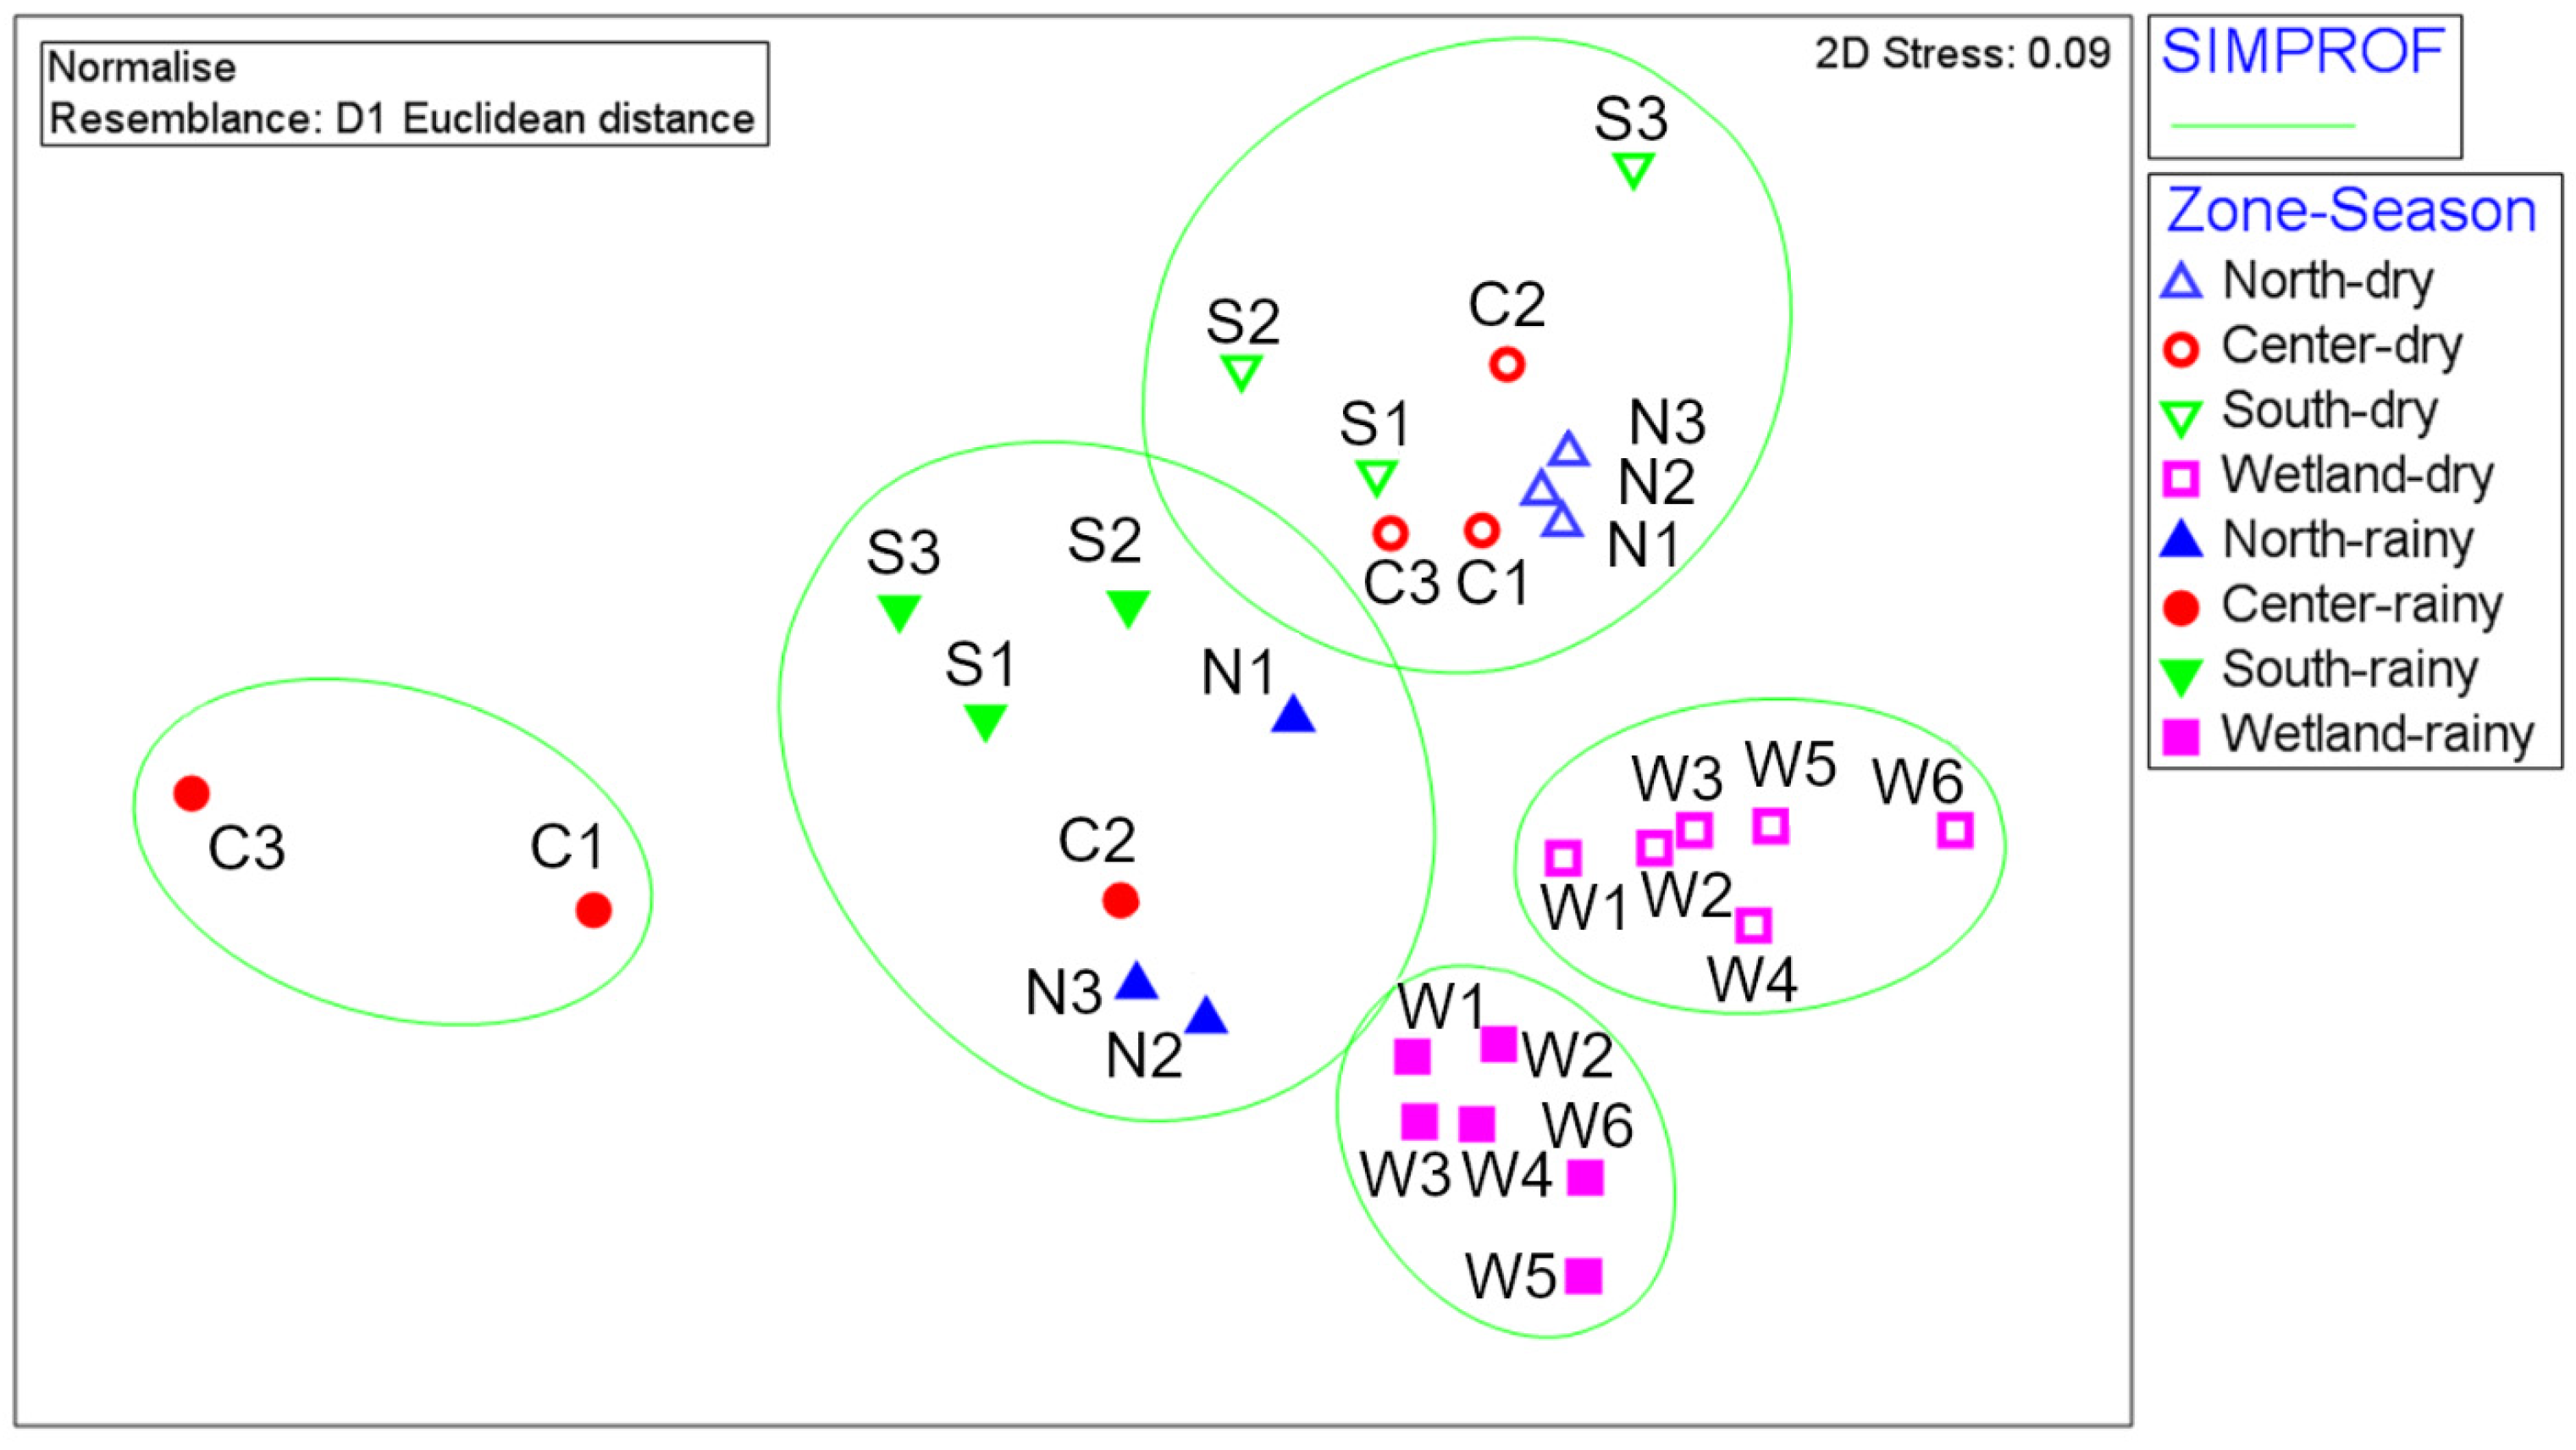
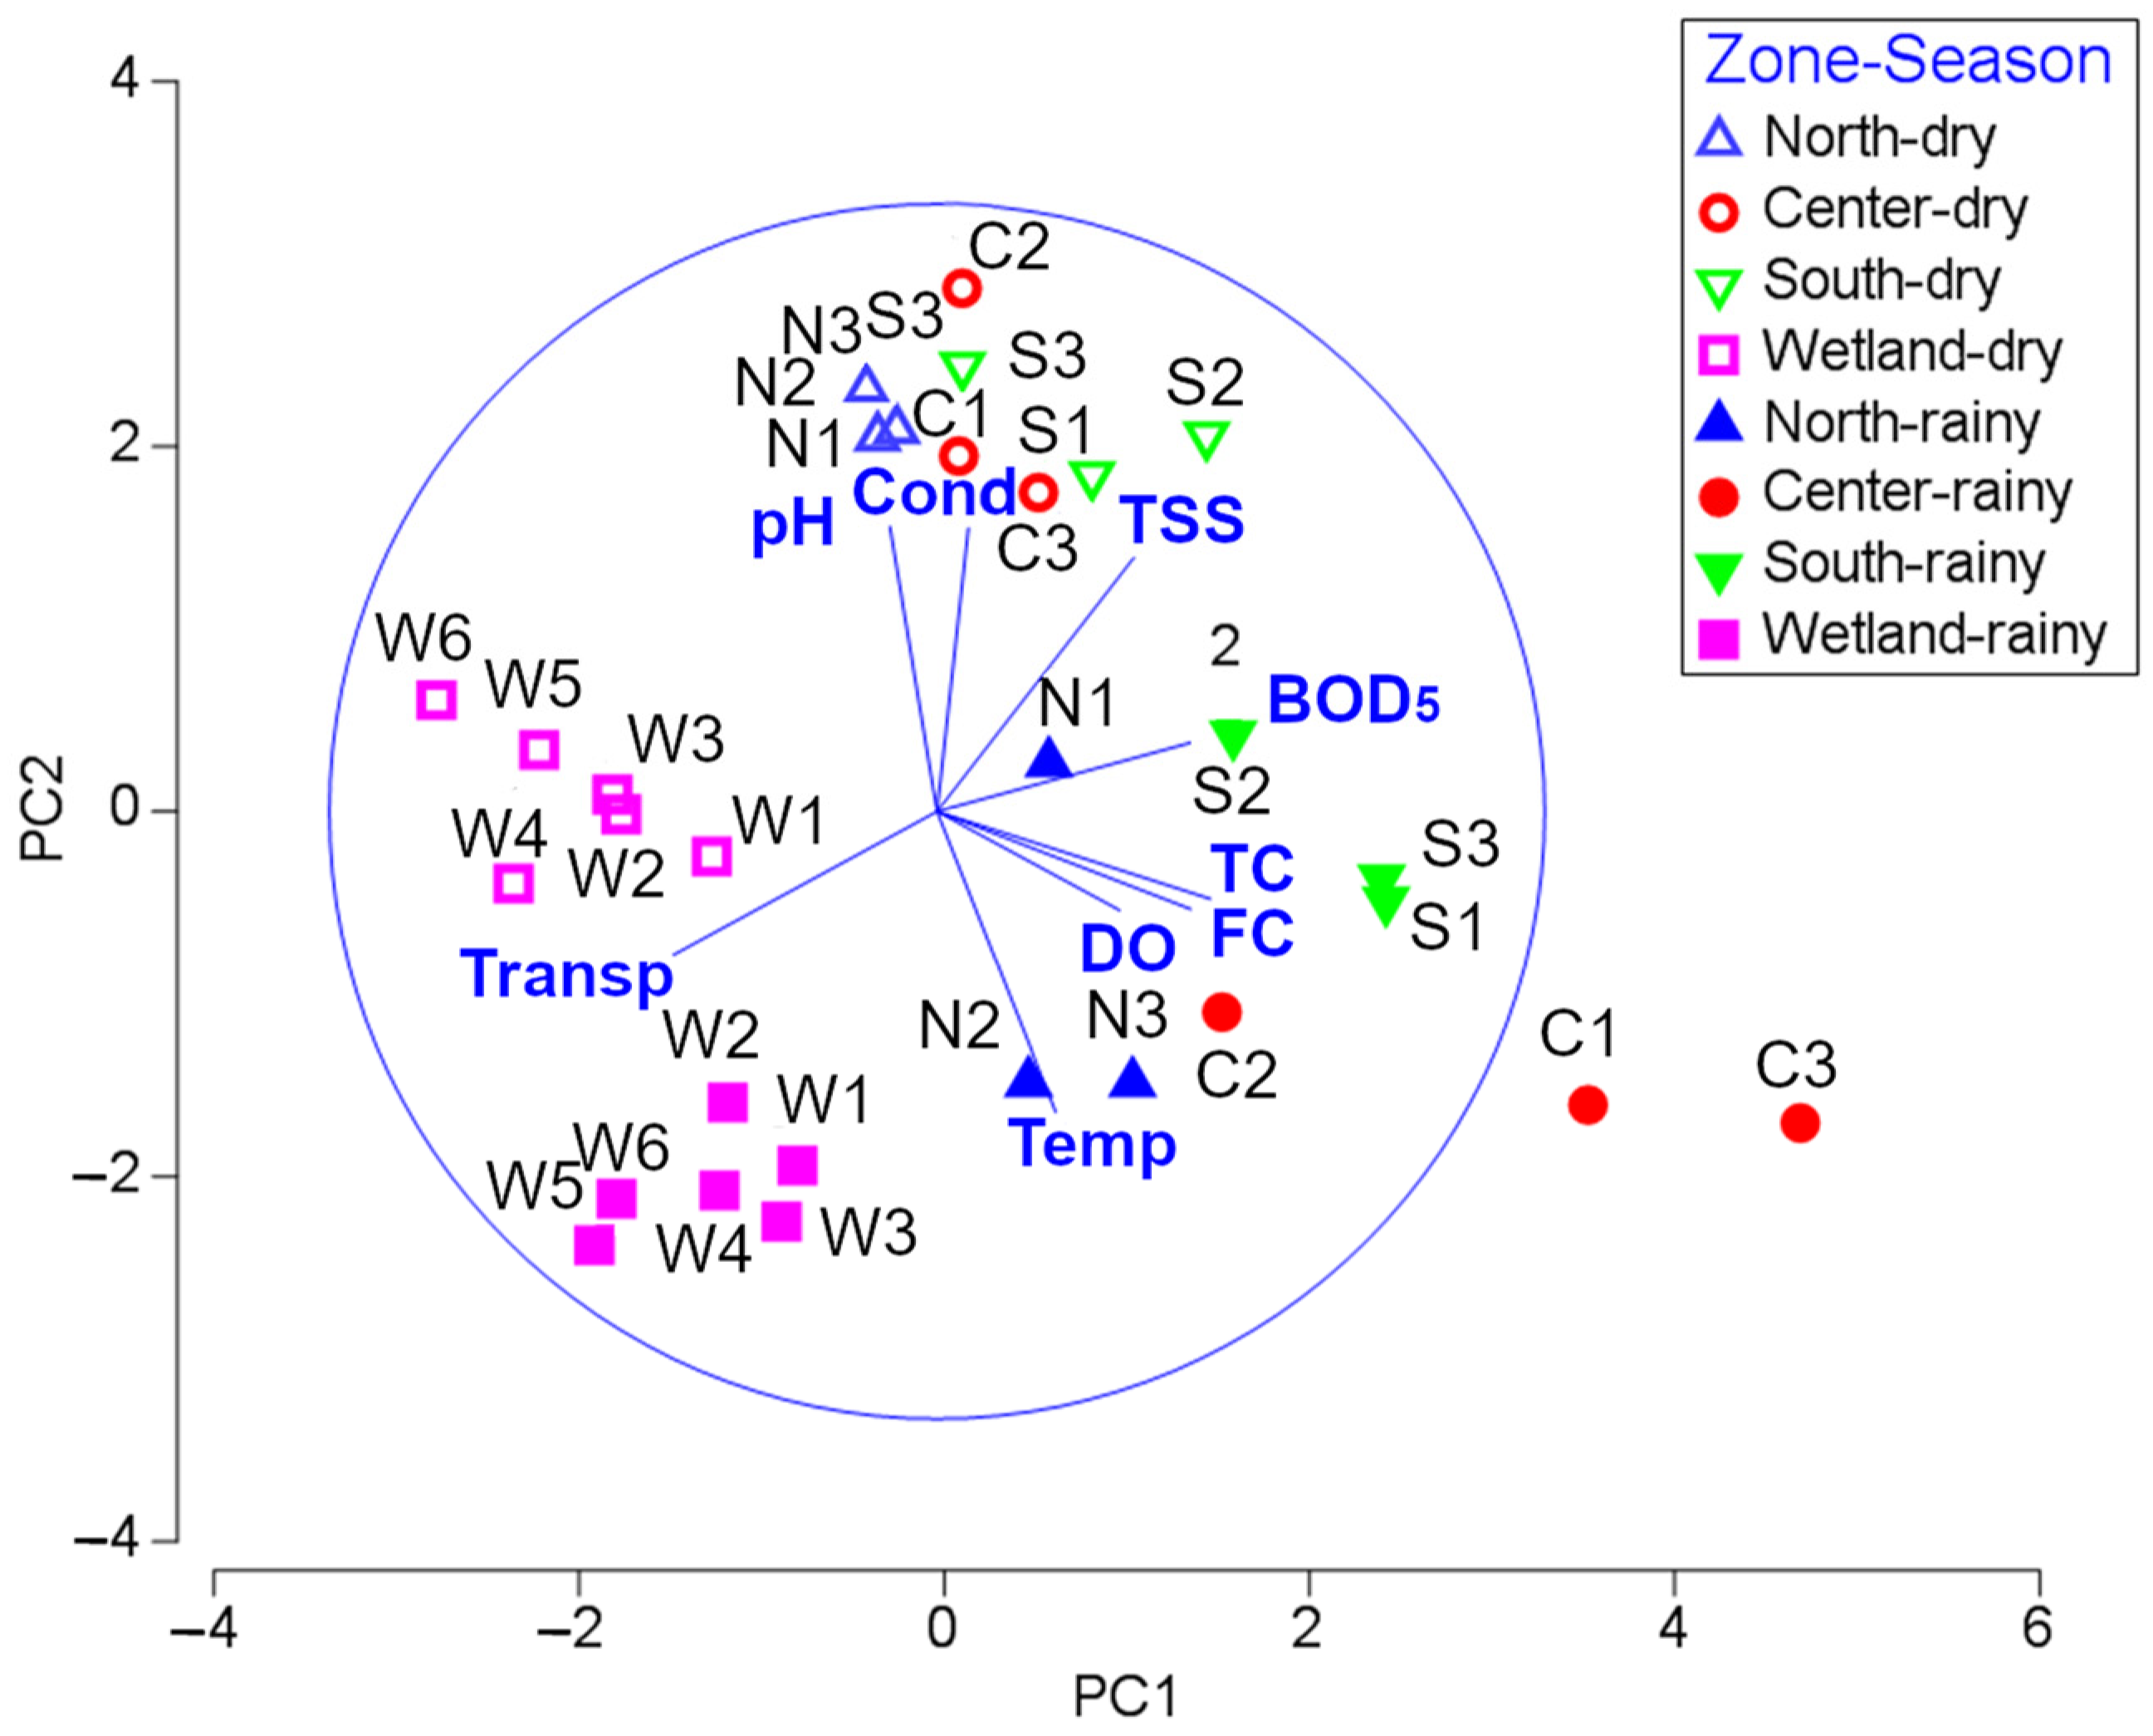
1.4. Spatial and Temporal Environmental Variability between Lake Zones
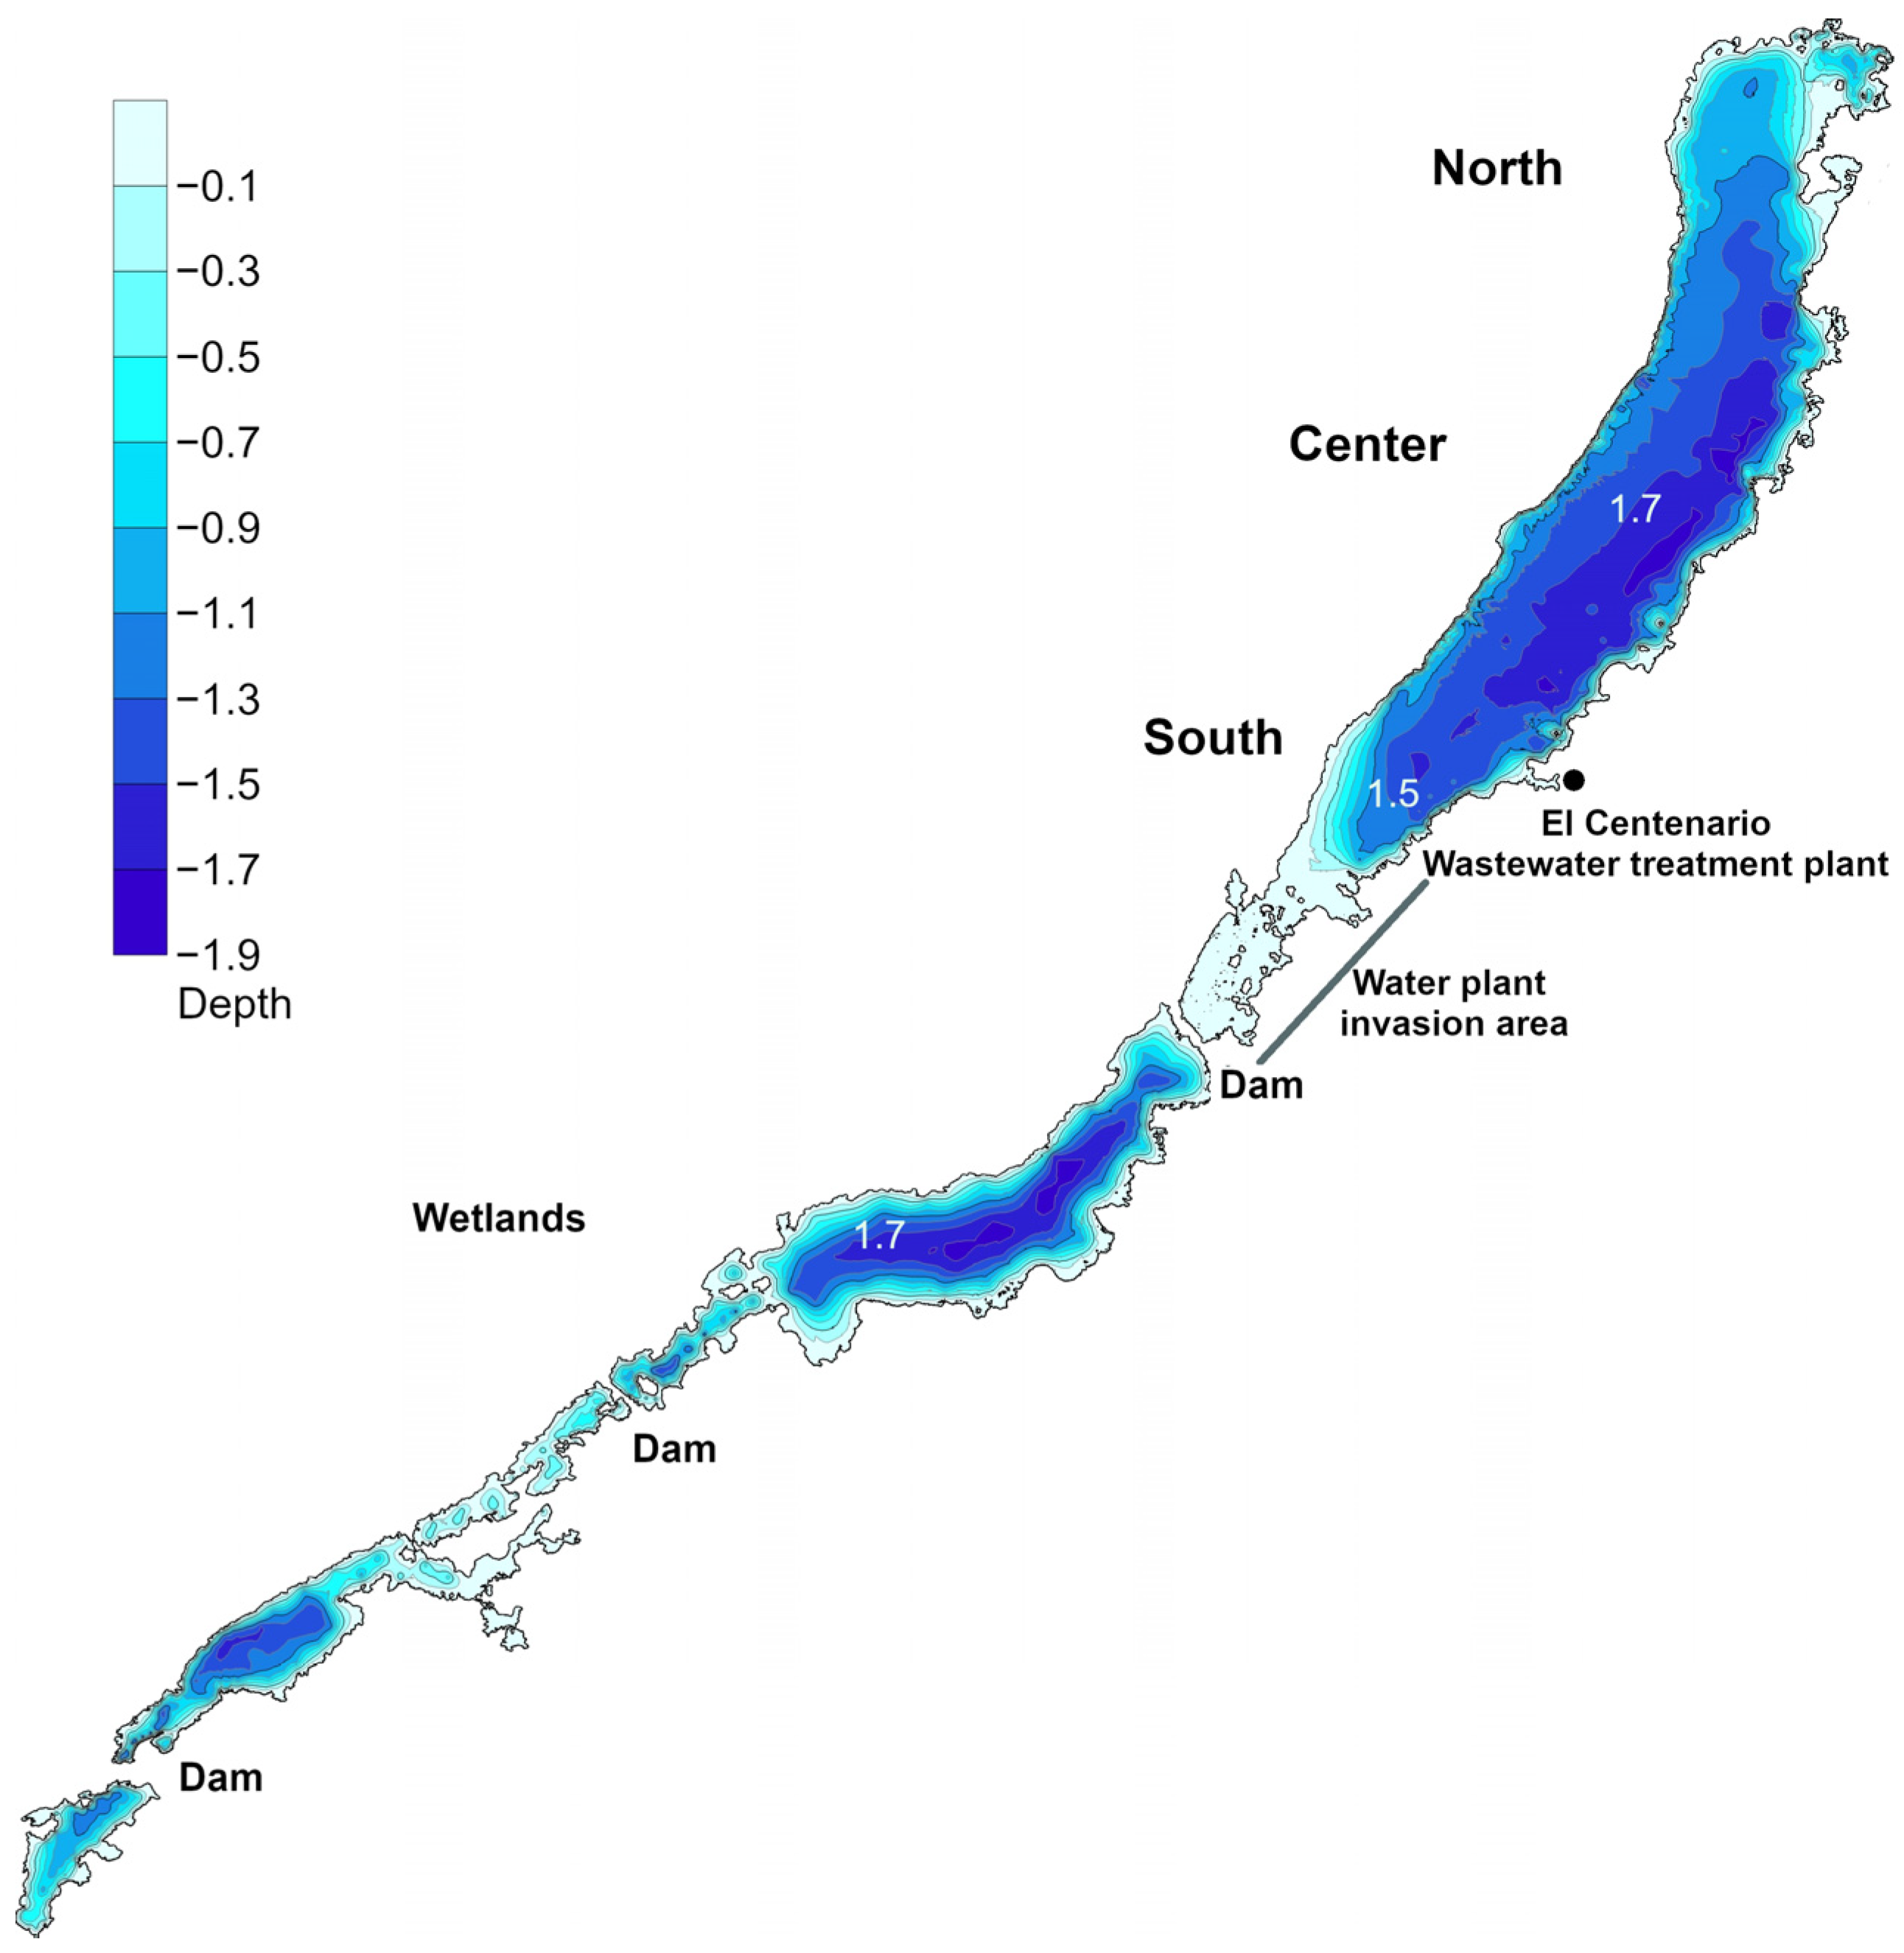
Bathymetry of Lake La Sabana
2. Results
2.1. Coliform Bacteria and NSF Water Quality Index in La Sabana
2.2. Heavy Metals in Surficial Sediment and Ecological Risk Index
2.3. Heavy Metal in Oreochromis niloticus and Metal Pollution Index
2.4. Lake La Sabana Bathymetry, Spatial and Temporal Environmental Variability
3. Discussion
3.1. Anthropogenic Alterations in La Sabana: Water Quality, Heavy Metals and Environmental Risk
3.2. Ecosystem Effects of Wastewater Discharge and the Nutrient Increase in La Sabana
4. Conclusions
Supplementary Materials
Author Contributions
Funding
Data Availability Statement
Acknowledgments
Conflicts of Interest
References
- Bauer-Gottwein, P.; Gondwe, B.R.N.; Charvet, G.; Marín, L.E.; Rebolledo-Vieyra, M.; Merediz-Alonso, G. Review: The Yucatán Peninsula Karst Aquifer, Mexico. Hydrogeol. J. 2011, 19, 507–524. [Google Scholar] [CrossRef]
- Perry, E.; Velazquez-Oliman, G.; Marin, L. The Hydrogeochemistry of the Karst Aquifer System of the Northern Yucatan Peninsula, Mexico. Int. Geol. Rev. 2002, 44, 191–221. [Google Scholar] [CrossRef]
- Lugo-Hubp, J.; Aceves-Quesada, J.F.; Espinasa-Pereña, R. Rasgos Geomorfológicos Mayores de La Península de Yucatán. Rev. Mex. Cienc. Geol. 1992, 10, 143–150. [Google Scholar]
- Gondwe, B.R.N.; Lerer, S.; Stisen, S.; Marín, L.; Rebolledo-Vieyra, M.; Merediz-Alonso, G.; Bauer-Gottwein, P. Hydrogeology of the South-Eastern Yucatan Peninsula: New Insights from Water Level Measurements, Geochemistry, Geophysics and Remote Sensing. J. Hydrol. 2010, 389, 1–17. [Google Scholar] [CrossRef]
- Pacheco, A.J.; Cabrera, S.A. Groundwater Contamination by Nitrates in the Yucatan Peninsula, Mexico. Hydrogeol. J. 1997, 5, 47–53. [Google Scholar] [CrossRef]
- Cohuo, S.; Pérez, M.A.; Macario-González, L.A.; Ortíz-León, H.J. Humedal La Sabana Chetumal, ¿qué Sabemos y Que Podemos Hacer? Avacient 2020, 4, 150–158. [Google Scholar]
- González-Herrera, R.; Sánchez-y-Pinto, I.; Gamboa-Vargas, J. Groundwater-Flow Modeling in the Yucatan Karstic Aquifer, Mexico. Hydrogeol. J. 2002, 10, 539–552. [Google Scholar] [CrossRef]
- Mercado-Salas, N.F.; Morales-Vela, B.; Suárez-Morales, E.; Iliffe, T.M. Conservation Status of the Inland Aquatic Crustaceans in the Yucatan Peninsula, Mexico: Shortcomings of a Protection Strategy. Aquat. Conserv. Mar. Freshw. Ecosyst. 2013, 23, 939–951. [Google Scholar] [CrossRef]
- Cohuo, S.; Macario-González, L.; Pérez, L.; Schwalb, A. Overview of Neotropical-Caribbean Freshwater Ostracode Fauna (Crustacea, Ostracoda): Identifying Areas of Endemism and Assessing Biogeographical Affinities. Hydrobiologia 2017, 786, 5–21. [Google Scholar] [CrossRef]
- Rodríguez-Huerta, E.; Rosas-Casals, M.; Hernández-Terrones, L.M. Water Societal Metabolism in the Yucatan Peninsula. The Impact of Climate Change on the Recharge of Groundwater by 2030. J. Clean. Prod. 2019, 235, 272–287. [Google Scholar] [CrossRef]
- Marín, L.E.; Steinich, B.; Pacheco, J.; Escolero, O.A. Hydrogeology of a contaminated sole-source karst aquifer, Mérida, Yucatán, Mexico. Geofísica Int. 2000, 39, 359–365. [Google Scholar] [CrossRef]
- Censo de Población y Vivienda 2020. Available online: https://www.inegi.org.mx/app/cpv/2020/resultadosrapidos/ (accessed on 30 September 2022).
- Metcalfe, C.D.; Beddows, P.A.; Bouchot, G.G.; Metcalfe, T.L.; Li, H.; Van Lavieren, H. Contaminants in the Coastal Karst Aquifer System along the Caribbean Coast of the Yucatan Peninsula, Mexico. Environ. Pollut. 2011, 159, 991–997. [Google Scholar] [CrossRef] [PubMed]
- Moreno-Pérez, P.A.; Hernández-Téllez, M.; Bautista-Gálvez, A. In Danger One of the Largest Aquifers in the World, the Great Mayan Aquifer, Based on Monitoring the Cenotes of the Yucatan Peninsula. Arch. Environ. Contam. Toxicol. 2021, 81, 189–198. [Google Scholar] [CrossRef]
- León-Borges, J.A.; Viveros-Jiménez, F.; Rodríguez-Mata, A.E.; Lizardi-Jiménez, M.A. Hydrocarbon Contamination Patterns in the Cenotes of the Mexican Caribbean: The Application of Principal Component Analysis. Bull. Environ. Contam. Toxicol. 2020, 105, 758–763. [Google Scholar] [CrossRef]
- Avila, J.P.; Sansores, A.C.; Quintal, M.B.; Can, L.A.; Perera, M.P. Environmental Study on Cadmium in Groundwater in Yucatan. In Water Resources in Mexico: Scarcity, Degradation, Stress, Conflicts, Management, and Policy; Hexagon Series on Human and Environmental Security and Peace; Oswald Spring, Ú., Ed.; Springer: Berlin/Heidelberg, Germany, 2011; pp. 239–249. ISBN 978-3-642-05432-7. [Google Scholar]
- Polanco, A.G.; Alberto, J.A.N.; Sánchez, J.S.; Rejón, G.J.M.; Gómez, J.M.; Del Valls Casillas, T.A. Contamination by Organochlorine Pesticides in the Aquifer of the Ring of Cenotes in Yucatán, México. Water Environ. J. 2015, 29, 140–150. [Google Scholar] [CrossRef]
- Borbolla-Vazquez, J.; Ugalde-Silva, P.; León-Borges, J.; Díaz-Hernández, J.A. Total and Faecal Coliforms Presence in Cenotes of Cancun; Quintana Roo, Mexico. BioRisk 2020, 15, 31–43. [Google Scholar] [CrossRef]
- Gischler, E.; Gibson, M.A.; Oschmann, W. Giant Holocene Freshwater Microbialites, Laguna Bacalar, Quintana Roo, Mexico. Sedimentology 2008, 55, 1293–1309. [Google Scholar] [CrossRef]
- Censo de Población y Vivienda 2010. Available online: https://www.inegi.org.mx/programas/ccpv/2010/ (accessed on 28 September 2022).
- Chetumal: Economía, Empleo, Equidad, Calidad de Vida, Educación, Salud y Seguridad Pública. Available online: https://datamexico.org/es/profile/geo/chetumal (accessed on 9 January 2023).
- Tejero, J.L.; Romero Juan, M. Planta de Tratamiento de Aguas Residuales “Centenario”; Comisión de Agua Potable y Alcantarillado del Estado de Quintana Roo: Chetumal, Mexico. Available online: https://www.capa.gob.mx/cultura/pdfs/tratamiento.pdf (accessed on 15 September 2022).
- Bi, J.; Zhang, L.; Yuan, H.; Zhang, J. Multi-Indicator Water Quality Prediction with Attention-Assisted Bidirectional LSTM and Encoder-Decoder. Inf. Sci. 2023, 625, 65–80. [Google Scholar] [CrossRef]
- Smith, B.; Morse, S. Late Classic Soil Conservation and Agricultural Production in the Three Rivers Region. Humboldt J. Soc. Relat. 2019, 1, 64–80. [Google Scholar] [CrossRef]
- Huix, C.M.; Ortíz-León, H.J.; Medina-Quej, A.; Cohuo, S. Variación Espacial Del Zooplancton En La Laguna La Sabana, Chetumal, México 2017. Avacient 2021, 11, 25–36. [Google Scholar]
- Martínez-Vadillo, M.; Cutz-Pool, L.Q.; López-Chan, J.; Cohuo, S. Composición Avifaunística Del Humedal La Sabana Chetumal, México, Durante El Año 2018. Avacient 2020, 4, 7–16. [Google Scholar]
- Peel, M.C.; Finlayson, B.L.; McMahon, T.A. Updated World Map of the Köppen-Geiger Climate Classification. Hydrol. Earth Syst. Sci. 2007, 11, 1633–1644. [Google Scholar] [CrossRef] [Green Version]
- Waliser, D.E.; Shi, Z.; Lanzante, J.R.; Oort, A.H. The Hadley Circulation: Assessing NCEP/NCAR Reanalysis and Sparse in-Situ Estimates. Clim. Dyn. 1999, 15, 719–735. [Google Scholar] [CrossRef]
- Antuña-Marrero, J.C.; Otterå, O.H.; Robock, A.; Mesquita, M.d.S. Modelled and Observed Sea Surface Temperature Trends for the Caribbean and Antilles. Int. J. Climatol. 2016, 36, 1873–1886. [Google Scholar] [CrossRef]
- Taylor, M.A.; Alfaro, E.J. Central America and the Caribbean, Climate of. In Encyclopedia of World Climatology; Encyclopedia of Earth Sciences Series; Oliver, J.E., Ed.; Springer: Dordrecht, The Netherlands, 2005; pp. 183–189. [Google Scholar] [CrossRef]
- Erkmen, O. Practice 4—Most Probable Number Technique. In Microbiological Analysis of Foods and Food Processing Environments; Erkmen, O., Ed.; Academic Press: Cambridge, MA, USA, 2022; pp. 31–37. [Google Scholar] [CrossRef]
- Woomer, P.L. Most Probable Number Counts. In Methods of Soil Analysis; John Wiley & Sons: Hoboken, NJ, USA, 1994; pp. 59–79. [Google Scholar] [CrossRef]
- Peeler, J.T.; Houghtby, G.A.; Rainosek, A.P. The Most Probable Number Technique. In Compendium of Methods for the Microbiological Examination of Foods; American Public Health Association: Washington, DC, USA, 1992; pp. 105–120. [Google Scholar]
- U.S. Food and Drug Administration. Bacteriological Analytical Manual (BAM). Available online: https://www.fda.gov/food/laboratory-methods-food/bacteriological-analytical-manual-bam (accessed on 26 September 2022).
- Brown, R.M.; McClealland, N.I.; Deininger, R.A.; Tozer, R.G. A Water Quality Index—Do We Dare? Water Seawage Work. 1970, 117, 339–343. [Google Scholar]
- Tahity, T.; Islam, M.R.U.; Bhuiyan, N.Z.; Choudhury, T.R.; Yu, J.; Noman, M.A.; Hosen, M.M.; Quraishi, S.B.; Paray, B.A.; Arai, T.; et al. Heavy Metals Accumulation in Tissues of Wild and Farmed Barramundi from the Northern Bay of Bengal Coast, and Its Estimated Human Health Risks. Toxics 2022, 10, 410. [Google Scholar] [CrossRef]
- Andrew, T.; Francis, E.; Charles, M.; Naigaga, I.; Jessica, N.; Micheal, O.; Drago, K.C.; Celsus, S. Mercury concentration in muscle, bellyfat and liver from Oreochromis niloticus and Lates niloticus consumed in Lake Albert fishing communities in Uganda. Cogent Food Agric. 2016, 2, 1214996. [Google Scholar] [CrossRef]
- Díaz López, C.; Carrión Jiménez, J.M.; González Bucio, J.L. Estudio de La Contaminación Por Hg, Pb, Cd y Zn En La Bahía de Chetumal, Quintana Roo, México. Rev. Soc. Quím. Perú 2006, 72, 19–31. [Google Scholar]
- Tun-Canto, G.E.; Álvarez-Legorreta, T.; Zapata-Buenfil, G.; Sosa-Cordero, E. Heavy Metals in Soils and Sediments in the Sugarcane Area of Southern Quintana Roo, Mexico. Rev. Mex. Cienc. Geol. 2017, 34, 157–169. [Google Scholar] [CrossRef] [Green Version]
- Buenfil-Rojas, A.M.; Álvarez-Legorreta, T.; Cedeño-Vázquez, J.R. Metals and Metallothioneins in Morelet’s Crocodile (Crocodylus Moreletii) from a Transboundary River between Mexico and Belize. Arch. Environ. Contam. Toxicol. 2015, 68, 265–273. [Google Scholar] [CrossRef]
- Romero-Calderón, A.G.; Morales-Vela, B.; Rosíles-Martínez, R.; Olivera-Gómez, L.D.; Delgado-Estrella, A. Metals in Bone Tissue of Antillean Manatees from the Gulf of Mexico and Chetumal Bay, Mexico. Bull. Environ. Contam. Toxicol. 2016, 96, 9–14. [Google Scholar] [CrossRef] [PubMed]
- USEPA (United States Environmental Protection Agency). Method 3051A: Microwave Assisted Acid Digestion of Sediments, Sludges, Soils and Oils; U.S. Environmental Protection Agency: Washington, DC, USA, 2007.
- USEPA (United States Environmental Protection Agency). Method 3015A: Microwave Assisted Acid Digestion of Aqueous Samples and Extracts; U.S. Environmental Protection Agency: Washington, DC, USA, 2007.
- Smal, H.; Ligęza, S.; Pranagal, J.; Gmitrowicz-Iwan, J. Speciation and Risk Assessment of Zn, Pb, and Cd in Bottom Sediments of Two Small Upland Dam Reservoirs, Poland. J. Environ. Manage. 2022, 322, 116041. [Google Scholar] [CrossRef] [PubMed]
- Hakanson, L. An Ecological Risk Index for Aquatic Pollution Control. A Sedimentological Approach. Water Res. 1980, 14, 975–1001. [Google Scholar] [CrossRef]
- Jiang, X.; Lu, W.X.; Zhao, H.Q.; Yang, Q.C.; Yang, Z.P. Potential Ecological Risk Assessment and Prediction of Soil Heavy-Metal Pollution around Coal Gangue Dump. Nat. Hazards Earth Syst. Sci. 2014, 14, 1599–1610. [Google Scholar] [CrossRef] [Green Version]
- Ma, L.; Han, C. Water Quality Ecological Risk Assessment with Sedimentological Approach; IntechOpen: London, UK, 2019. [Google Scholar] [CrossRef] [Green Version]
- Töre, Y.; Ustaoğlu, F.; Tepe, Y.; Kalipci, E. Levels of toxic metals in edible fish species of the Tigris River (Turkey); Threat to public health. Ecol. Ind. 2021, 123, 107361. [Google Scholar] [CrossRef]
- Usero, J.; Gonzalez-Regalado, E.; Gracia, I. Trace metals in the bivalve molluscs Ruditapes decussatus and Ruditapes philippinarum from the Atlantic Coast of Southern Spain. Environ. Int. 1997, 23, 291–298. [Google Scholar] [CrossRef]
- Clarke, K.R.; Gorley, R.N. PRIMER v7: User Manual/Tutorial; PRIMER-E: Devon, UK, 2015. [Google Scholar]
- Canadian Council of Ministers of the Environment. Canadian Sediment Quality Guidelines for the Protection of Aquatic Life. Available online: https://www.pla.co.uk/Environment/Canadian-Sediment-Quality-Guidelines-for-the-Protection-of-Aquatic-Life (accessed on 28 September 2022).
- Benjamini, Y.; Hochberg, Y. Controlling the False Discovery Rate: A Practical and Powerful Approach to Multiple Testing. J. R. Stat. Soc. Ser. B Methodol. 1995, 57, 289–300. [Google Scholar] [CrossRef]
- Anderson, M.J.; Walsh, D.C.I. PERMANOVA, ANOSIM, and the Mantel Test in the Face of Heterogeneous Dispersions: What Null Hypothesis Are You Testing? Ecol. Monogr. 2013, 83, 557–574. [Google Scholar] [CrossRef]
- de Jesús-Navarrete, A.; Yanez-Montalvo, A.; Falcón, L.I.; Vargas-Espósitos, A. Nematode Fauna Associated with Freshwater Microbialites in Bacalar Lake, Quintana Roo, Mexico. Limnology 2021, 22, 347–355. [Google Scholar] [CrossRef]
- Yu-Lin, L.; Delgado-Bals, V.H.; Gutiérrez-Aguirre, M.A. Batimetría y Calidad de Agua de La Laguna Milagros, Quintana Roo, México. Teor. Prax. 2018, 25, 9–30. [Google Scholar]
- Perkins, T.L.; Clements, K.; Baas, J.H.; Jago, C.F.; Jones, D.L.; Malham, S.K.; McDonald, J.E. Sediment Composition Influences Spatial Variation in the Abundance of Human Pathogen Indicator Bacteria within an Estuarine Environment. PLoS ONE 2014, 9, e112951. [Google Scholar] [CrossRef] [PubMed]
- Moshi, H.A.; Shilla, D.A.; Kimirei, I.A.; Reilly, C.O.; Clymans, W.; Bishop, I.; Loiselle, S.A. Community Monitoring of Coliform Pollution in Lake Tanganyika. PLoS ONE 2022, 17, e0262881. [Google Scholar] [CrossRef] [PubMed]
- Holcomb, D.A.; Stewart, J.R. Microbial Indicators of Fecal Pollution: Recent Progress and Challenges in Assessing Water Quality. Curr. Environ. Health Rep. 2020, 7, 311–324. [Google Scholar] [CrossRef] [PubMed]
- Abaya, L.M.; Wiegner, T.N.; Colbert, S.L.; Beets, J.P.; Carlson, K.M.; Kramer, K.L.; Most, R.; Couch, C.S. A Multi-Indicator Approach for Identifying Shoreline Sewage Pollution Hotspots Adjacent to Coral Reefs. Mar. Pollut. Bull. 2018, 129, 70–80. [Google Scholar] [CrossRef]
- Wear, S.L.; Acuña, V.; McDonald, R.; Font, C. Sewage Pollution, Declining Ecosystem Health, and Cross-Sector Collaboration. Biol. Conserv. 2021, 255, 109010. [Google Scholar] [CrossRef]
- Benavides, L.; Avellán, T.; Caucci, S.; Hahn, A.; Kirschke, S.; Müller, A. Assessing Sustainability of Wastewater Management Systems in a Multi-Scalar, Transdisciplinary Manner in Latin America. Water 2019, 11, 249. [Google Scholar] [CrossRef] [Green Version]
- Rivera, P.; Chávez, R.; Salinas, F.R.; Rivera, P.; Chávez, R.; Salinas, F.R. Advances and Limitations in the Treatment of Wastewater in the State of Zacatecas. Tecnol. Cienc. Agua 2018, 9, 113–123. [Google Scholar] [CrossRef]
- Wang, D.; Li, X.; Ding, Y.; Zeng, T.; Zeng, G. Nitrogen and Phosphorus Recovery from Wastewater and the Supernate of Dewatered Sludge. Recent Pat. Food Nutr. Agric. 2009, 1, 236–242. [Google Scholar] [CrossRef]
- Yamashita, T.; Yamamoto-Ikemoto, R. Nitrogen and Phosphorus Removal from Wastewater Treatment Plant Effluent via Bacterial Sulfate Reduction in an Anoxic Bioreactor Packed with Wood and Iron. Int. J. Environ. Res. Public. Health 2014, 11, 9835–9853. [Google Scholar] [CrossRef] [Green Version]
- United States Environmental Protection Agency. Method 365.3: Phosphorous, All Forms (Colorimetric, Ascorbic Acid, Two Reagent). Available online: https://www.epa.gov/sites/default/files/2015-08/documents/method_365-3_1978.pdf (accessed on 29 September 2022).
- McCrary, J.K.; Castro, M.; McKaye, K.R. Mercury in Fish from Two Nicaraguan Lakes: A Recommendation for Increased Monitoring of Fish for International Commerce. Environ. Pollut. Barking Essex 2006, 141, 513–518. [Google Scholar] [CrossRef]
- Porto, J.I.R.; Araujo, C.S.O.; Feldberg, E. Mutagenic Effects of Mercury Pollution as Revealed by Micronucleus Test on Three Amazonian Fish Species. Environ. Res. 2005, 97, 287–292. [Google Scholar] [CrossRef] [PubMed]
- Campbell, L.; Dixon, D.G.; Hecky, R.E. A Review of Mercury in Lake Victoria, East Africa: Implications for Human and Ecosystem Health. J. Toxicol. Environ. Health B Crit. Rev. 2003, 6, 325–356. [Google Scholar] [CrossRef] [PubMed]
- Evans, M.S.; Muir, D.; Lockhart, W.L.; Stern, G.; Ryan, M.; Roach, P. Persistent Organic Pollutants and Metals in the Freshwater Biota of the Canadian Subarctic and Arctic: An Overview. Sci. Total Environ. 2005, 351–352, 94–147. [Google Scholar] [CrossRef] [PubMed]
- Murillo-Cisneros, D.A.; Zenteno-Savín, T.; Harley, J.; Cyr, A.; Hernández-Almaraz, P.; Gaxiola-Robles, R.; Galván-Magaña, F.; O’Hara, T.M. Mercury Concentrations in Baja California Sur Fish: Dietary Exposure Assessment. Chemosphere 2021, 267, 129233. [Google Scholar] [CrossRef]
- Gonzalez, P.; Dominique, Y.; Massabuau, J.C.; Boudou, A.; Bourdineaud, J.P. Comparative Effects of Dietary Methylmercury on Gene Expression in Liver, Skeletal Muscle, and Brain of the Zebrafish (Danio Rerio). Environ. Sci. Technol. 2005, 39, 3972–3980. [Google Scholar] [CrossRef]
- Kennedy, C.J. Uptake and Accumulation of Mercury from Dental Amalgam in the Common Goldfish, Carassius Auratus. Environ. Pollut. Barking Essex 1987 2003, 121, 321–326. [Google Scholar] [CrossRef]
- Da Silva, E.T.L.; Pedreira, M.M.; Dias, M.L.F.; Gomes, M.V.T.; Soares, M.A.; Pedreira, R.S.F.; Schorer, M. Mercury Chloride Toxicity in Juveniles Prochilodus Argenteus a Species from Southeastern Brazil. Environ. Sci. Pollut. Res. Int. 2022, 29, 21803–21810. [Google Scholar] [CrossRef]
- Havelková, M.; Dušek, L.; Némethová, D.; Poleszczuk, G.; Svobodová, Z. Comparison of Mercury Distribution Between Liver and Musc—A Biomonitoring of Fish from Lightly and Heavily Contaminated Localities. Sensors 2008, 8, 4095–4109. [Google Scholar] [CrossRef] [Green Version]
- Backstrom, C.H.; Buckman, K.; Molden, E.; Chen, C.Y. Mercury Levels in Freshwater Fish: Estimating Concentration with Fish Length to Determine Exposures through Fish Consumption. Arch. Environ. Contam. Toxicol. 2020, 78, 604–621. [Google Scholar] [CrossRef]
- Wells, R.J.D.; Chumchal, M.M.; Cowan, J.H. Effect of Trawling and Habitat on Mercury Concentration in Juvenile Red Snapper from the Northern Gulf of Mexico. Trans. Am. Fish. Soc. 2008, 137, 1839–1850. [Google Scholar] [CrossRef]
- Bongoua-Devisme, A.; Bolou Bi, E.; Kassin, K.; Balland-Bolou-Bi, C.; Gueable, Y.; Adiaffi, B.; Yao-Kouame, A.; Djagoua, E. Assessment of Heavy Metal Contamination Degree of Municipal Open-Air Dumpsite on Surrounding Soils: Case of Dumpsite of Bonoua, Ivory Coast. Int. J. Eng. Res. Gen. Sci. 2018, 6, hal-01891039. [Google Scholar]
- Teta, C.; Hikwa, T. Heavy Metal Contamination of Ground Water from an Unlined Landfill in Bulawayo, Zimbabwe. J. Health Pollut. 2017, 7, 18–27. [Google Scholar] [CrossRef] [PubMed] [Green Version]
- Wang, Z.; Luo, P.; Zha, X.; Xu, C.; Kang, S.; Zhou, M.; Nover, D.; Wang, Y. Overview Assessment of Risk Evaluation and Treatment Technologies for Heavy Metal Pollution of Water and Soil. J. Clean. Prod. 2022, 379, 134043. [Google Scholar] [CrossRef]
- Lamborg, C.H.; Fitzgerald, W.F.; Damman, A.W.H.; Benoit, J.M.; Balcom, P.H.; Engstrom, D.R. Modern and Historic Atmospheric Mercury Fluxes in Both Hemispheres: Global and Regional Mercury Cycling Implications. Glob. Biogeochem. Cycles 2002, 16, 51-1–51-11. [Google Scholar] [CrossRef]
- Raygoza-Viera, J.R.; Ruiz-Fernández, A.C.; Ruelas-Inzunza, J.; Alonso-Hernández, C.; Pérez-Bernal, L.H.; Páez-Osuna, F. Accumulation and Distribution of Hg and 210Pb in Superficial Sediments from a Coastal Lagoon in the SE Gulf of California Associated with Urban-Industrial and Port Activities. Environ. Earth Sci. 2014, 72, 2729–2739. [Google Scholar] [CrossRef]
- Feng, X.; Tang, S.; Li, Z.; Wang, S.; Liang, L. Landfill Is an Important Atmospheric Mercury Emission Source. Chin. Sci. Bull. 2004, 49, 2068–2072. [Google Scholar] [CrossRef]
- Li, Z.-G.; Feng, X.; Li, P.; Liang, L.; Tang, S.-L.; Wang, S.-F.; Fu, X.-W.; Qiu, G.-L.; Shang, L.-H. Emissions of Air-Borne Mercury from Five Municipal Solid Waste Landfills in Guiyang and Wuhan, China. Atmos. Chem. Phys. 2010, 10, 3353–3364. [Google Scholar] [CrossRef] [Green Version]
- Southworth, G.R.; Lindberg, S.E.; Bogle, M.A.; Zhang, H.; Kuiken, T.; Price, J.; Reinhart, D.; Sfeir, H. Airborne Emissions of Mercury from Municipal Solid Waste. II: Potential Losses of Airborne Mercury before Landfill. J. Air Waste Manag. Assoc. 2005, 55, 870–877. [Google Scholar] [CrossRef] [PubMed] [Green Version]
- Ortiz-hernández, M.C.; Sáenz-morales, R. Effects of Organic Material and Distribution of Fecal Coliforms in Chetumal Bay, Quintana Roo, México. Environ. Monit. Assess. 1999, 55, 423–434. [Google Scholar] [CrossRef]
- Long, D.T.; Pearson, A.L.; Voice, T.C.; Polanco-Rodríguez, A.G.; Sanchez-Rodríguez, E.C.; Xagoraraki, I.; Concha-Valdez, F.G.; Puc-Franco, M.; Lopez-Cetz, R.; Rzotkiewicz, A.T. Influence of Rainy Season and Land Use on Drinking Water Quality in a Karst Landscape, State of Yucatán, Mexico. Appl. Geochem. 2018, 98, 265–277. [Google Scholar] [CrossRef]
- Oliva-Rivera, J.J.; Ocaña, F.A.; Navarrete, A.d.J.; Carrillo, R.M.d.J.; Vargas-Espósitos, A.A. Reproductive aspects of Pomacea flagellata (Mollusca: Ampullariidae) at Bacalar lagoon, Quintana Roo, México. Rev. Biol. Trop. 2016, 64, 1643–1650. [Google Scholar] [CrossRef] [PubMed]
- Di Luca, G.A.; Hadad, H.R.; Mufarrege, M.M.; Maine, M.A.; Sánchez, G.C. Improvement of Cr Phytoremediation by Pistia Stratiotes in Presence of Nutrients. Int. J. Phytoremediation 2014, 16, 167–178. [Google Scholar] [CrossRef]
- Mufarrege, M.M.; Hadad, H.R.; Maine, M.A. Response of Pistia Stratiotes to Heavy Metals (Cr, Ni, and Zn) and Phosphorous. Arch. Environ. Contam. Toxicol. 2010, 58, 53–61. [Google Scholar] [CrossRef]
- Galal, T.M.; Dakhil, M.A.; Hassan, L.M.; Eid, E.M. Population Dynamics of Pistia stratiotes L. Rend. Lincei Sci. Fis. Nat. 2019, 30, 367–378. [Google Scholar] [CrossRef]
- Lu, Q.; He, Z.L.; Graetz, D.A.; Stoffella, P.J.; Yang, X. Phytoremediation to Remove Nutrients and Improve Eutrophic Stormwaters Using Water Lettuce (Pistia stratiotes L.). Environ. Sci. Pollut. Res. Int. 2010, 17, 84–96. [Google Scholar] [CrossRef] [PubMed]
- Nahar, K.; Hoque, S. Phytoremediation to Improve Eutrophic Ecosystem by the Floating Aquatic Macrophyte, Water Lettuce (Pistia Stratiotes L.) at Lab Scale. Egypt. J. Aquat. Res. 2021, 47, 231–237. [Google Scholar] [CrossRef]
- Cejudo, E.; Acosta-González, G.; Ortega-Camacho, D.; Tun-Rosado, G.E. Changes in the Hydrochemistry of a Karstic Lake in Yucatan, Mexico. Environ. Earth Sci. 2020, 79, 98. [Google Scholar] [CrossRef]
- Macario-González, L.; Cohuo, S.; Angyal, D.; Pérez, L.; Mascaró, M. Subterranean Waters of Yucatán Peninsula, Mexico Reveal Epigean Species Dominance and Intraspecific Variability in Freshwater Ostracodes (Crustacea: Ostracoda). Diversity 2021, 13, 44. [Google Scholar] [CrossRef]
- Pérez, L.; Bugja, R.; Lorenschat, J.; Brenner, M.; Curtis, J.; Hoelzmann, P.; Islebe, G.; Scharf, B.; Schwalb, A. Aquatic Ecosystems of the Yucatán Peninsula (Mexico), Belize, and Guatemala. Hydrobiologia 2011, 661, 407–433. [Google Scholar] [CrossRef]
- Hernández-Terrones, L.M.; Null, K.A.; Ortega-Camacho, D.; Paytan, A. Water Quality Assessment in the Mexican Caribbean: Impacts on the Coastal Ecosystem. Cont. Shelf Res. 2015, 102, 62–72. [Google Scholar] [CrossRef]


| Site | Heavy Metals in Surficial Sediment (in mg kg−1) | Ecological Risk Factor (Er) | ||||
|---|---|---|---|---|---|---|
| Pb | Cd | Zn | Hg | Zn | Hg | |
| N1 | <LOD | <LOD | 73.2 | 0.25 | 0.41 | 41.29 |
| N3 | <LOD | <LOD | 52.1 | 0.27 | 0.29 | 43.88 |
| C1 | <LOD | <LOD | 590.1 | 0.44 | 3.3 | 70.99 |
| C3 | <LOD | <LOD | 40.4 | 0.12 | 0.23 | 19.55 |
| S1 | <LOD | <LOD | 41.3 | 0.14 | 0.23 | 22.94 |
| S3 | <LOD | <LOD | 664.5 | 0.30 | 3.79 | 49.24 |
| W1 | <LOD | <LOD | 104.2 | 0.34 | 0.59 | 55.37 |
| W2 | <LOD | <LOD | 42.3 | 0.31 | 0.49 | 49.6 |
| Mean | - | - | 202.1 | 0.27 | ||
| St dev | - | - | 264 | 0.10 | ||
| Cv (%) | - | - | 130.6 | 37.9 | ||
| Weight (gr) | Total Length (cm) | Hg Concentration (mg kg−1) | Metal Pollution Index |
|---|---|---|---|
| 300 | 26 | 0.0085 | 0.17 |
| 200 | 22 | 0.019 | 0.38 |
| 225 | 21 | 0.0247 | 0.494 |
| 300 | 25.5 | 0.0205 | 0.41 |
| 200 | 22.5 | 0.1289 | 2.578 |
| 190 | 20 | 0.0233 | 0.466 |
| 350 | 26 | 0.0254 | 0.508 |
| 200 | 23 | 0.0145 | 0.29 |
| 330 | 25 | 0.0278 | 0.556 |
| 210 | 25 | 0.0227 | 0.454 |
| 200 | 22 | 0.0129 | 0.258 |
| 180 | 19 | 0.1196 | 2.392 |
| 200 | 21 | 0.1362 | 2.724 |
| 190 | 19 | 0.0451 | 0.902 |
| 170 | 18 | 0.2073 | 4.146 |
| Source | df | SS | MS | Pseudo-F | p Perm | Unique Perms |
|---|---|---|---|---|---|---|
| Lake zone | 3 | 100.25 | 33.418 | 10.834 | 0.001 *** | 998 |
| Season | 1 | 70.617 | 70.617 | 22.893 | 0.001 *** | 999 |
| Lake zone × Season | 3 | 23.175 | 7.725 | 2.504 | 0.003 ** | 999 |
| Residuals | 22 | 67.862 | 3.085 | |||
| Total | 29 | 261 |
Disclaimer/Publisher’s Note: The statements, opinions and data contained in all publications are solely those of the individual author(s) and contributor(s) and not of MDPI and/or the editor(s). MDPI and/or the editor(s) disclaim responsibility for any injury to people or property resulting from any ideas, methods, instructions or products referred to in the content. |
© 2023 by the authors. Licensee MDPI, Basel, Switzerland. This article is an open access article distributed under the terms and conditions of the Creative Commons Attribution (CC BY) license (https://creativecommons.org/licenses/by/4.0/).
Share and Cite
Cohuo, S.; Moreno-López, A.; Escamilla-Tut, N.Y.; Pérez-Tapia, A.M.; Santos-Itzá, I.; Macario-González, L.A.; Villegas-Sánchez, C.A.; Medina-Quej, A. Assessment of Water Quality and Heavy Metal Environmental Risk on the Peri-Urban Karst Tropical Lake La Sabana, Yucatán Peninsula. Water 2023, 15, 390. https://doi.org/10.3390/w15030390
Cohuo S, Moreno-López A, Escamilla-Tut NY, Pérez-Tapia AM, Santos-Itzá I, Macario-González LA, Villegas-Sánchez CA, Medina-Quej A. Assessment of Water Quality and Heavy Metal Environmental Risk on the Peri-Urban Karst Tropical Lake La Sabana, Yucatán Peninsula. Water. 2023; 15(3):390. https://doi.org/10.3390/w15030390
Chicago/Turabian StyleCohuo, Sergio, Antonia Moreno-López, Naydelin Y. Escamilla-Tut, Alondra M. Pérez-Tapia, Iván Santos-Itzá, Laura A. Macario-González, Carmen A. Villegas-Sánchez, and Alejandro Medina-Quej. 2023. "Assessment of Water Quality and Heavy Metal Environmental Risk on the Peri-Urban Karst Tropical Lake La Sabana, Yucatán Peninsula" Water 15, no. 3: 390. https://doi.org/10.3390/w15030390