1. Introduction
The shelf zone is actively developed and used for the search and extraction of seabed mineral resources, laying various communications along the bottom, and for maricultural purposes. Therefore, it is important to study changes in the structure of the shelf bottom. Residual sediment transport, which is influenced by many factors, including tide, wind, and waves, controls coastal morphological changes [
1]. Typhoons have a strong impact on changing coastal morphology. They affect economic activity in coastal regions all over the world [
2]. So, the work [
3] shows that typhoons lead to an increase in biological activity. Also, the geochemistry of water composition changes after typhoons [
4]. In world practice, studies of typhoons’ impact on the shelf are important due to the increase in intensity and frequency of their manifestations [
5,
6]. Typhoons have a significant impact on the hydrological situation on the shelf. For example, in the East China Sea at a depth of 110 m, Typhoon Danas caused changes in near-bottom water temperature and current speeds, which led to strong resuspension of sedimentary material [
7]. Experimental and numerical models of fine-grained deposits transfer by hydrodynamic processes are considered in [
8]. Numerical models of sediment transport formulation without seabed slope effect are used in [
9], and [
10] demonstrates different options for modeling sediment transport on the bedform evolution process.
Relief sediment waves (SWs) are found both in deep-sea and in the shelf zones worldwide. For example, on the shelf edge in the Aegean Sea, SWs were mentioned in [
11], where it is noted that they are spread out over a great area of about 55 km
2. Besides, SWs with the largest sizes are located in the Bay of Biscay; they reach 40 m in height and 1.8 km in length [
12]. SWs are also found on the shelf of the Adriatic Sea [
13], in the South Atlantic, off the coast of Africa [
14], and off the northeastern coast of Taiwan in the South China Sea [
15]. Moreover, SWs were observed off the coast of France [
16] and in the Indian Ocean [
17]. Different variants of SWs bedding and formation conditions in the deep sea are described in sufficient detail in [
18]. The works [
19,
20,
21,
22] are devoted to SWs migration; here, the SWs are located in the channel of Moriches Bay, Monterey Canyon, off the coast of central California, and in the Irish Sea.
The SWs formation conditions may vary. On the shelf, there are three types of SWs formation and development: the first type of these waves is formed due to turbidity currents generated by internal waves; the second type occurs due to the effect of turbidity currents entrained by bottom currents; and the third type is caused by soil creep on steep slopes [
23]. However, SWs formation, as well as their migration, are most likely associated with the joint influence of the two, and in some cases, of all three processes [
24].
The studies presented in [
25] are of particular interest: the authors consider the transport of sedimentary material by internal waves on the shelf of Portugal near the Nazare submarine canyon. Intense internal waves in this area are observed in a short period of the year, similar to Peter the Great Bay, where these waves are especially strong in the autumn season.
The study of the relief morphology of the Sea of Japan coastal zone is of scientific and applied importance for engineering, and construction works on the shelf, laying pipe- and telecommunication lines along the seabed. Additionally, the functioning hydrophysical study area of the Pacific Oceanological Institute of the Far Eastern Branch, Russian Academy of Sciences (POI FEB RAS), is located in Peter the Great Bay, where joint international oceanological research is carried out.
The authors briefly considered the mechanism of SWs formation by internal waves in [
26]. Tidal waves, rolling on wedge-shaped coast, disintegrate with a decrease in the oscillations period. It is noted that spatial scales of SWs coincide with internal waves at a depth of 40–100 m in Posyet Bay (a bay in the southwestern part of Peter the Great Bay). Based on the new results of hydrophysical work carried out by the authors, we specified more accurately the hydrological conditions of possible SWs formation in Peter the Great Bay.
The purpose of this work is to show, based on sediments material classification by the size of the grains composing this material in the area of SWs occurrence, that:
(1) In the summer and autumn seasons, a powerful thermocline forms off the Primorye coast under the influence of seasonal typhoons. Due to the pronounced gradient layer, the amplitude and strength of internal gravity waves increase;
(2) The orbital speeds of internal waves are sufficient to form a fine-dispersed turbid system in SWs troughs, which is entrained by the Primorsky current along the shelf, transforming into turbidity current, deepening these troughs;
(3) Under the influence of typhoons, the near-bottom speed of the Primorsky current increases by an order of magnitude on the Bay shelf and becomes sufficient to form not only fine- but also coarse-grained turbidity current entrained by the Primorsky current along SWs through sand intensively developing them;
(4) The formation, development, and migration of SWs on Peter the Great Bay shelf are conditioned by the peculiarities of such hydrological processes, typical for this region of the Sea of Japan, as the Primorsky current and disintegration of internal waves in the SWs zone.
We should note that typhoons, coming from the tropical regions of the Pacific Ocean, are common events for Primorye in summer. Model calculations show that meteorological conditions, when the wind speed is 54 km/h or more, along with the orographic peculiarities of the area, are the determining factors in significant changes in the hydrology of the bay [
27]. For example, we have established that under the influence of northeasterly wind with a speed of up to 54 km/h and a duration of about 2 days, powerful upwelling develops off the coast in our study area.
2. Materials and Methods
Employees of POI FEB RAS regularly carry out complex geological, geophysical, and hydrological studies in Peter the Great Bay. On the basis of the obtained in-situ hydrological data, we performed a numerical simulation of internal waves’ disintegration on a tapering shelf. Geological and geophysical studies showed the general picture of the geological structure of Peter the Great Bay, the Sea of Japan. More than 1500 samples of bottom sediments were picked from all over the bay and analyzed in detail for lithology and stratigraphy during various studies in more than 50 extended off-coast trips, mostly carried out by POI FEB RAS [
28]. Besides, seismic-acoustic studies applying various methods were carried out using boomers and seismic guns. Several shallow (up to 150 m deep) wells were drilled and examined in the central part of the bay [
29]. At the same time, due to the low resolution of the previously conducted seismoacoustic studies, some issues concerning the nature of the Holocene sediment thickness and composition distribution, and the factors determining their deposition, remained unresolved. The roof structure of the buried Upper Pleistocene sediments and its bedding depth also remained unclear. In 2008, seismoacoustic studies were carried out using a 3.5 kHz “GeoPulse Subbottom Profiler” (UK), applying continuous seismoacoustic profiling (CSP) in the bay on a 600 km
2 shelf area [
30]. The maximum penetration depth of the CSP signal was about 40 m. The profiler used in seismoacoustic studies has a high enough resolution to identify thin layers with a thickness of 0.1–0.3 m. Research by the CSP method has now covered the entire area of Peter the Great Bay [
31]. All the above questions on the bay’s geological structure were discussed in works [
30,
31,
32]. Besides, detailed bathymetric studies were carried out in the bay in 2009–2010, using the onboard echo sounder “GPS GARMIN” [
32]. With the help of mathematical processing of the bathymetric survey data, we could clarify the spatial position of SWs throughout the bay.
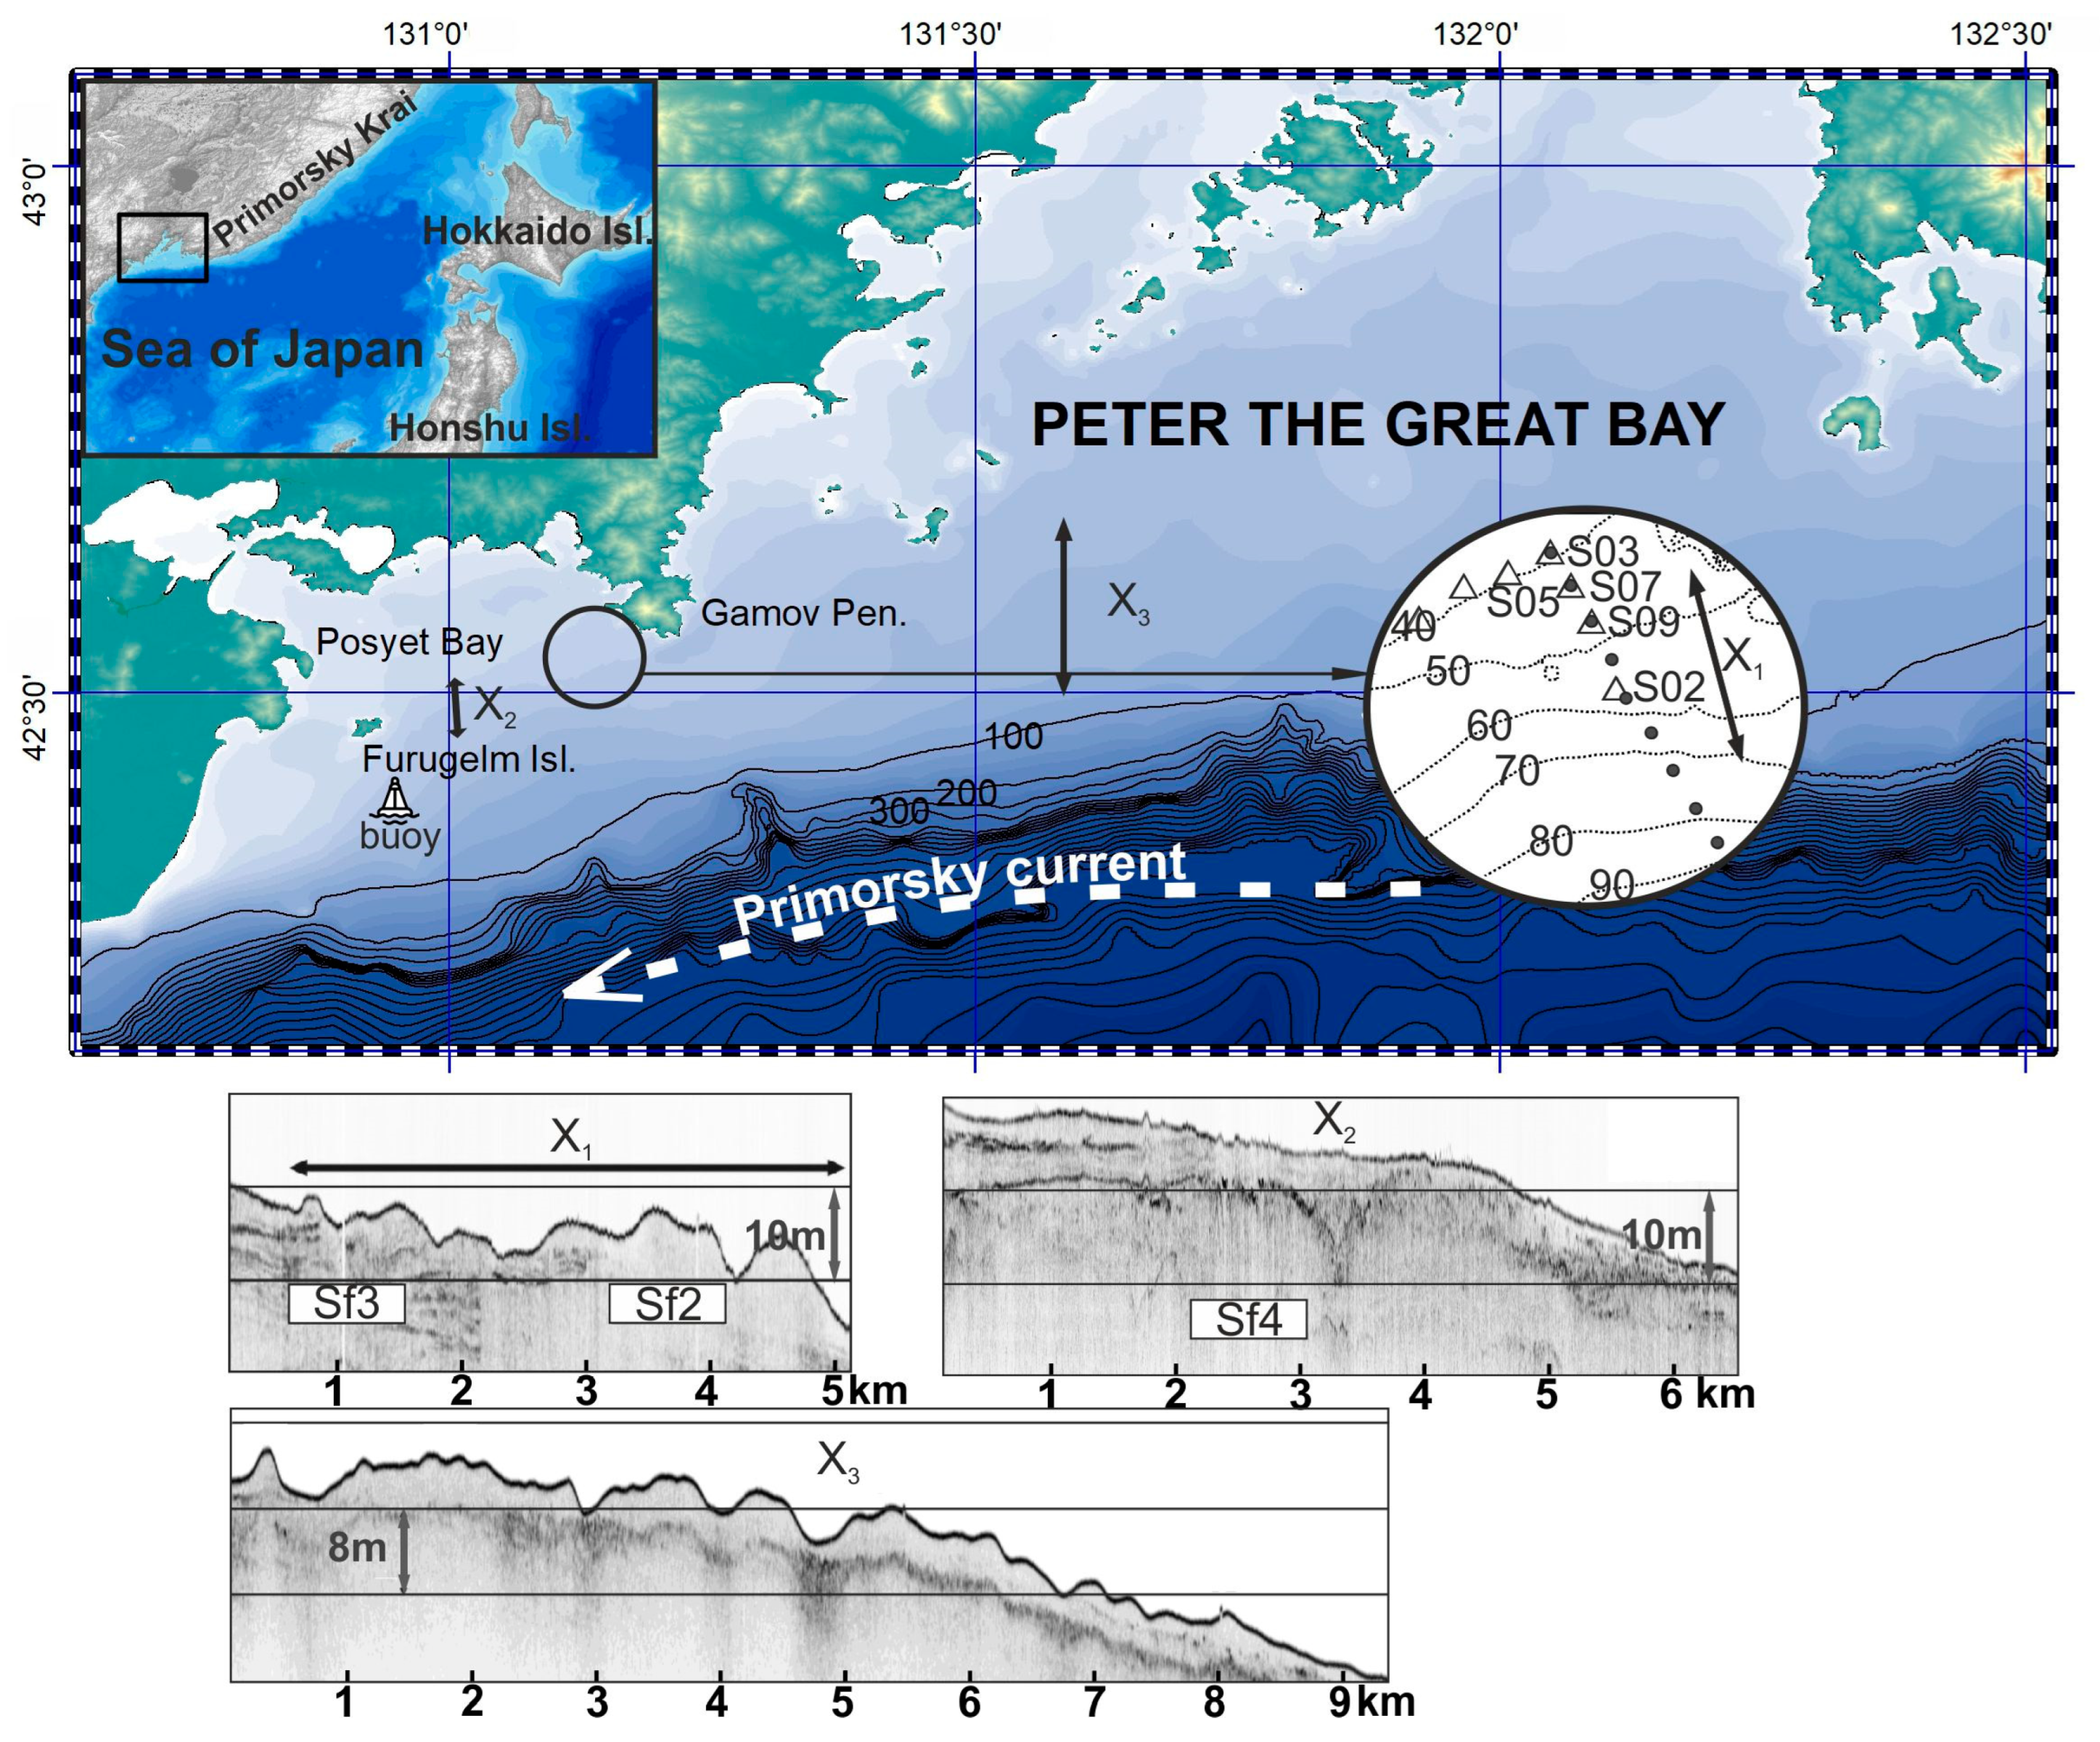
On the shelf of Peter the Great Bay, starting from 2010 to the present, the authors have been carrying out hydrological measurements using a spatially distributed hydrological complex (
Figure 1, inset) [
33,
34]. The hydrological complex consists of vertical moored thermostrings and autonomous pressure loggers installed in the lower and upper parts of a thermostring. We verify the data of the moored thermostrings with the help of regularly conducted hydrological cross-sections at the installation points. The route of hydrological cross-sections is a line from the 40th to the 100th isobath with a total length of about 18.5 km. We used a Conductivity-Temperature-Depth (CTD) “RBR XR-620” hydrological profiler until 2015 and an “RBR-concerto” profiler later. At the distance of about 50 m from the S03 thermostring (see
Figure 1), a set of 3 depth-distributed “Infinity” current meters were installed for 2–3 days. A stationary weather station GMX-500 operates at the Gamov Peninsula, providing data on meteorological conditions in the area. Usually, the total operating time of the complex is 10–18 days. The advantage of such an approach is collecting long-term, up to two weeks, continuous measurements, including periods of extreme external influences.
We also used the data of a ”Seawatch” autonomous oceanographic measuring system (manufactured by Fugro-OCEANOR, Norway), moored at the 56 m isobath in the southwestern part of the bay, at the point with coordinates 42°25′30′′ N 130°55′04′′ E. The oceanographic buoy was installed from August to September 2016. The system is equipped with a 400 kHz “Aquadopp” Acoustic Doppler Current Profiler (ADCP). Downward-directed ADCP recorded the current profile, averaged over 4 m thick layers in the depth range from 2 to 45 m, with 1-h discreteness and accuracy of 0.5 cm/s in the velocity range of 3–250 cm/s.
The main source initiating internal waves in the shelf area under study is the interaction of barotropic tide currents with the continental slope edge in the shelf seaward part. The continental slope frames Peter the Great Bay, and the depth increases from 200 m to 3000 m or more (
Figure 1). We modeled the disintegration of nonlinear internal waves using the Korteweg–de Vries (KdV) equation and based on field observations. We also calculated the wavelengths of the decaying internal waves in the shelf area where the SWs are located.
3. Sediment Waves
SWs are observed in the bottom topography of Peter the Great Bay according to the CSP profiles and bathymetric survey data (
Figure 1) [
30,
35]. The authors carried out additional lithological studies in the area of SWs distribution. Based on the features described in [
23], they were the SWs, not gravity or landslide creeps (folds), that were identified in the investigated area using the CSP data. Recorded SWs have various altitude characteristics from 0.5 to 8 m. In describing an individual sediment wave, it is customary to use the concept of a riffle. Micro-riffles with a height of about 1 m have latitudinal orientation and are found throughout the studied area; riffles with heights from 2 to 8 m are found at depths of 50–70 m. They stretch from northeast to southwest and are arc-shaped. Also, the objects with vertical heights of more than 8 m can be observed in the bottom relief of the study area—this is a swell extending from the Gamov Peninsular to Furugelm Island and a depression in the center of Posyet Bay (
Figure 1). The formation of micro-riffles and riffles (or SWs) with a height of several meters is most likely associated with modern morpholythodynamic processes caused by hydrophysical phenomena. The largest landforms (higher than 10 m) could occur during several glacioeustatic sea-level fluctuations in the Late Pleistocene and Holocene [
28].
Formation of riffles with heights of 2–8 m in Peter the Great Bay is apparently associated with hydrophysical processes, namely, with seasonal typhoons and disintegration of internal waves at depths of 40–100 m. In the vicinity of the Gamov Peninsula, where the internal waves disintegrate most actively, the number of riffles reaches 7. The distance between the riffles’ crests is about 500–700 m; the height is from 2 to 6 m (
Figure 1, X
1). Towards Furugelm Island, the number of riffles decreases to 2–3, the distance between the crests is about 800–1000 m (
Figure 1, X
2), and near the island, they smoothly turn into a swell 6–8 m high. In addition, the riffles with heights from 4 to 8 m are registered on CSP seismograms throughout Peter the Great Bay (
Figure 1, X
3); they are located at depths from 50 to 100 m, and their number can reach 8 per cross-section. The riffles in the central part of Peter the Great Bay have a slightly larger distance between the crests, in contrast to those shown in
Figure 1 (X
1 section). However, the length of the bedforms is also about 500–600 m. In the bay center, the riffles with heights of 3–8 m alternate with low ones (from 1 to 3 m).
There are four types of facies conditions for the bottom sediment formation observed in Peter the Great Bay: lagoon-bay, underwater coastal slope, and inner and outer shelf. On the 50–60 m isobaths, where we singled out the riffles, there is a conventional border between the facies conditions for the sediments formed by the outer and inner shelf. The inner shelf facies consist of pebbles, gravels, psammites, aleurites, and mictites. On the outer shelf with depths of 60–80 m, fine-grained sorted psammites turn into poorly sorted medium- and coarse-grained psammites with gravel and pebble admixture.
Lithological studies were carried out in 2008–2009 with the “GOIN” geological pipe 1.5 m long to clarify the geological situation at the shelf area of seismoacoustic works. According to the results of laboratory studies of bottom sediment samples, sediment density in Peter the Great Bay was 1.2–2.2 g/m
3 [
30]. Medium-grained and fine-grained psammites mainly represent bottom sediments in the bay; in the northeastern part of the bay (off the Gamov Peninsula coast), they often have shell detritus. The fraction of fine-grained psammites (0.25–0.1 mm) prevails. There is practically no fraction of coarse-grained psammites (1–0.5 mm). Two zones with different density characteristics and lithological composition of bottom sediments are singled out: a zone with a high content of medium-grained facies with greenish-gray sediments distributed in the inner part of the bay; and a zone of increased content of fine-grained facies along the side of the bay, with yellowish-gray sediment.
The analysis of the CSP seismic profiles, carried out in 2008 in Peter the Great Bay [
30,
31,
32] zones, where SWs are located, shows that the acoustic appearance and nature of the sedimentary cover bedding in the study area are different. Three Seismic facies (Sf) are singled out on seismic cross-sections, and their areas are outlined. The sediments of Sf1 are widespread in the northern part of the study area. They are related to the sediments of the channel located near the Gamov Peninsula coastline, through which the sediments are carried out from the western part of Posyet Bay to the deep-water parts of the shelf. Sf1 is represented mainly by fine-grained sands. Sf2 has the greatest distribution, which is observed in seabed areas with depths from 35 to 55–70 m; these facies sediments consist of medium-grained sands. Sf3 is widespread in the southern part of the study area and was found on the seabed with depths of more than 55–70 m, and is represented by fine-grained sand, sometimes with a silty fraction. The transition from Sf2 to Sf3 sediments is often accompanied by a noticeable decrease in the reflected signal intensity, which may indicate a relatively short distance at which the size of sand particles changes (from medium-grained to fine-grained), the appearance of silty component, and, as a consequence, an abrupt change in physical properties of bottom sediments.
4. Impact of Typhoons
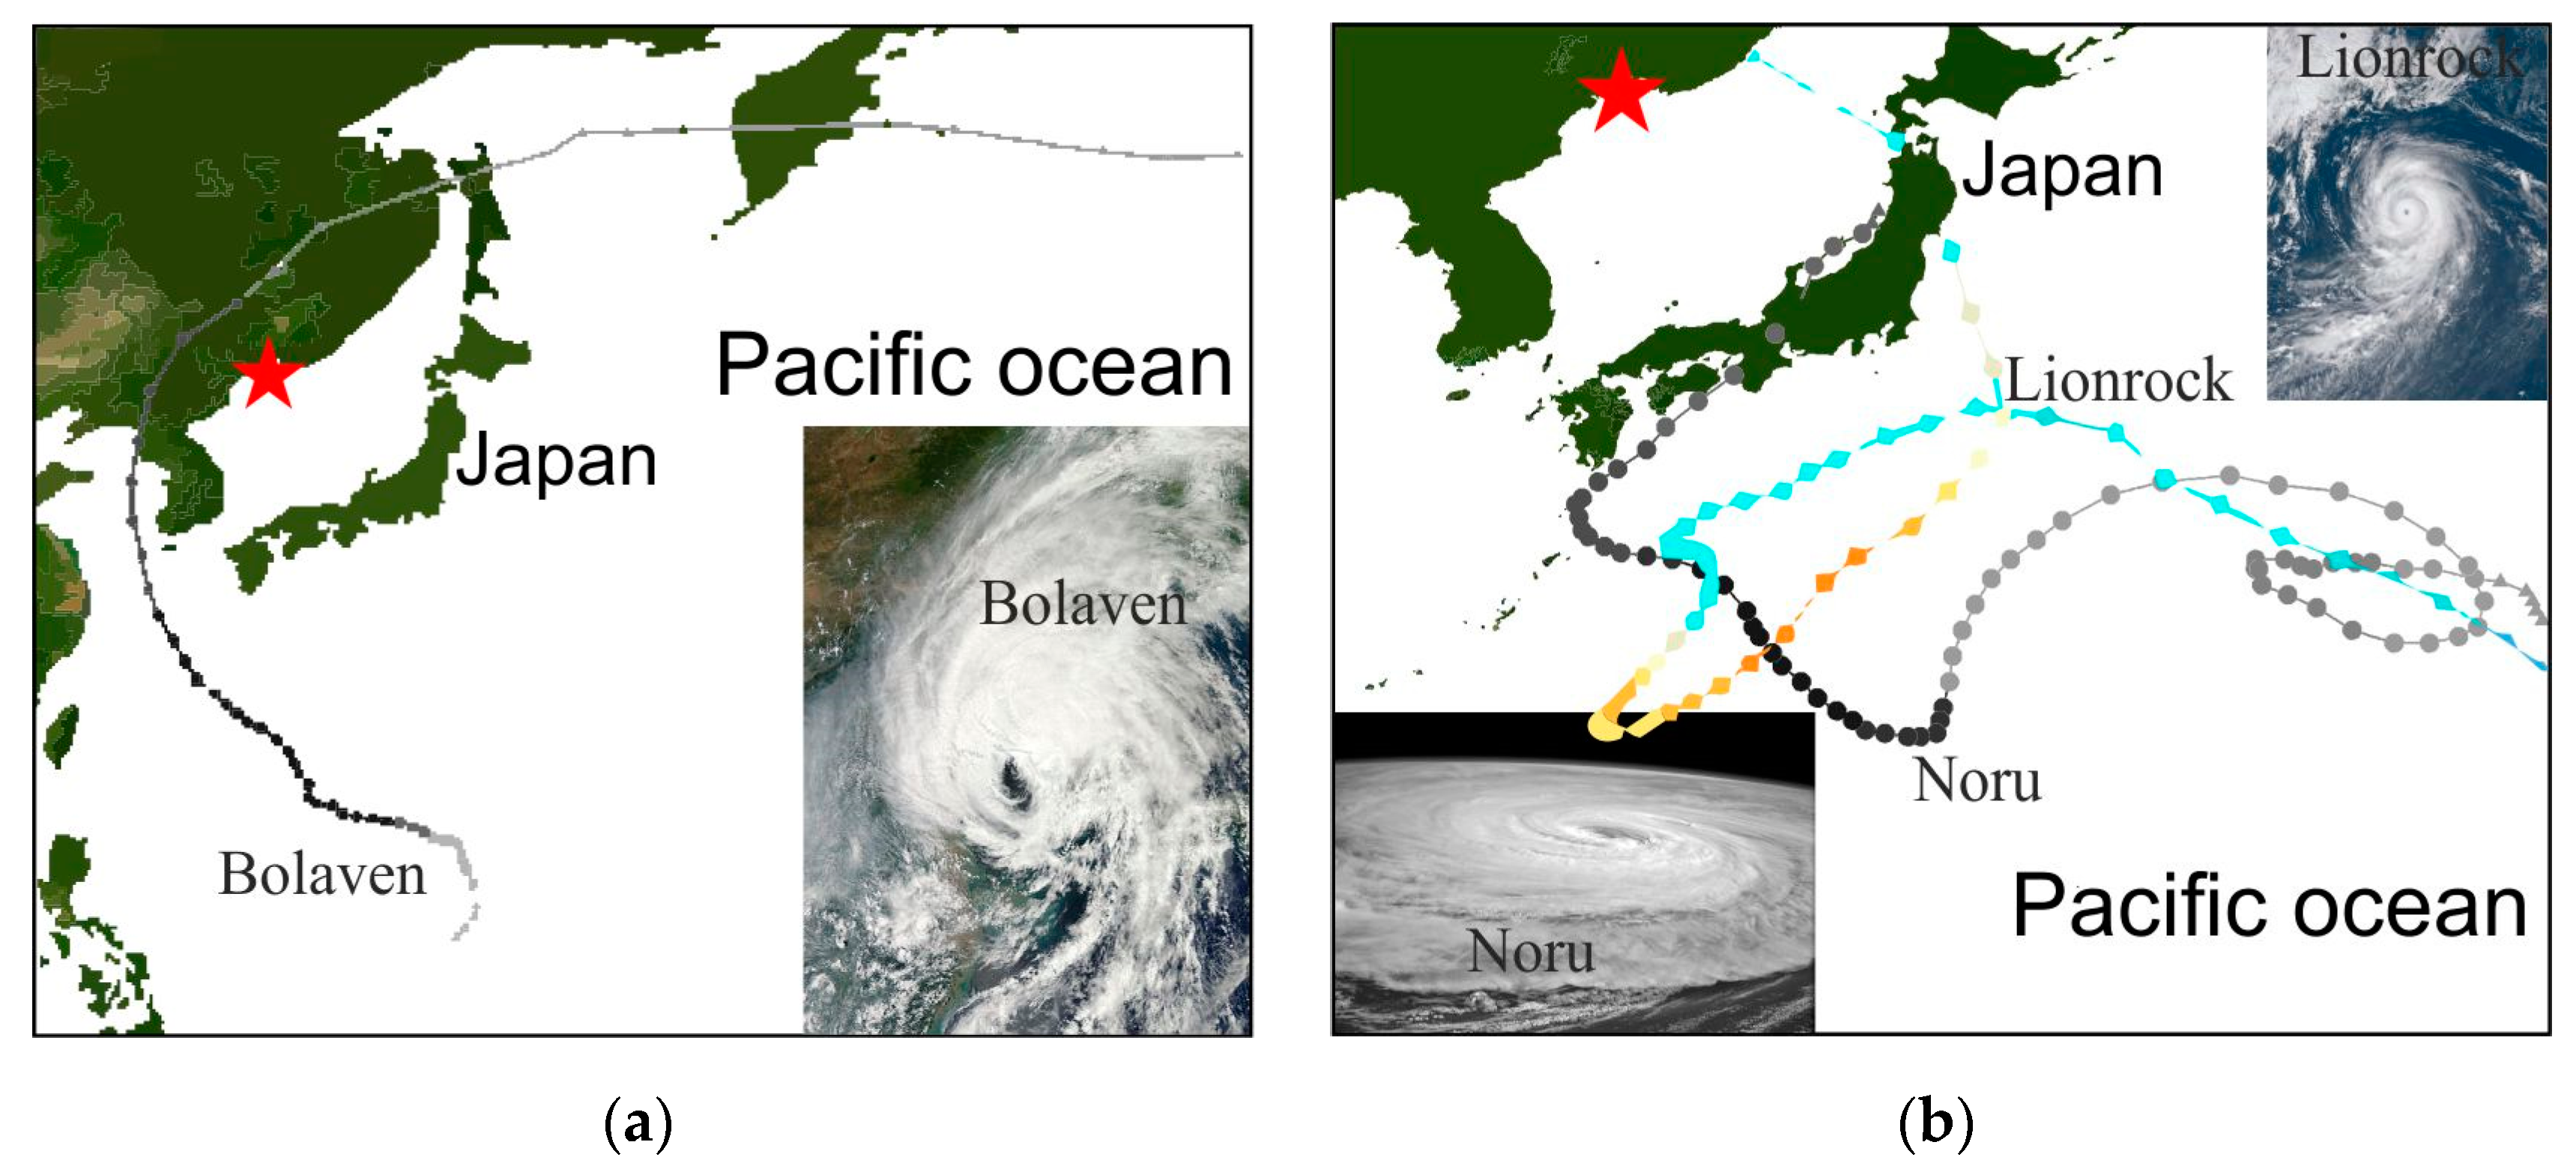
Typhoon Bolaven passed over the Primorye coast on the morning of 29 August 2012. This allowed us to track its effect on the hydrological situation on the shelf since our hydrological complex was operating at that time. The complex installation place is marked with an asterisk in
Figure 2.
Figure 2a shows the track of Typhoon Bolaven and its space image (insert). Originating in the Pacific Ocean on August 19, the typhoon passed over the Yellow Sea, then over the territory of South and North Korea, China and Primorye. Having made a long detour along the coast, the typhoon ceased to exist in the Barents Sea. The maximum wind speed reached 185 km/h.
Figure 2b shows the track of Typhoon Noru. Originating in the Pacific Ocean on 20 July 2017, the typhoon crossed the Japanese Islands and the Sea of Japan, slightly touching Primorye by its edge. Typhoon Noru, having interacted with Tropical Storm Kulap, looped counterclockwise southeast of Japan on 28–30 July and transformed into a super typhoon on 31 July. Over the Sea of Japan on 7–8 August, the typhoon became a planetary phenomenon (
Figure 2b, insert) and then decayed after 10 August.
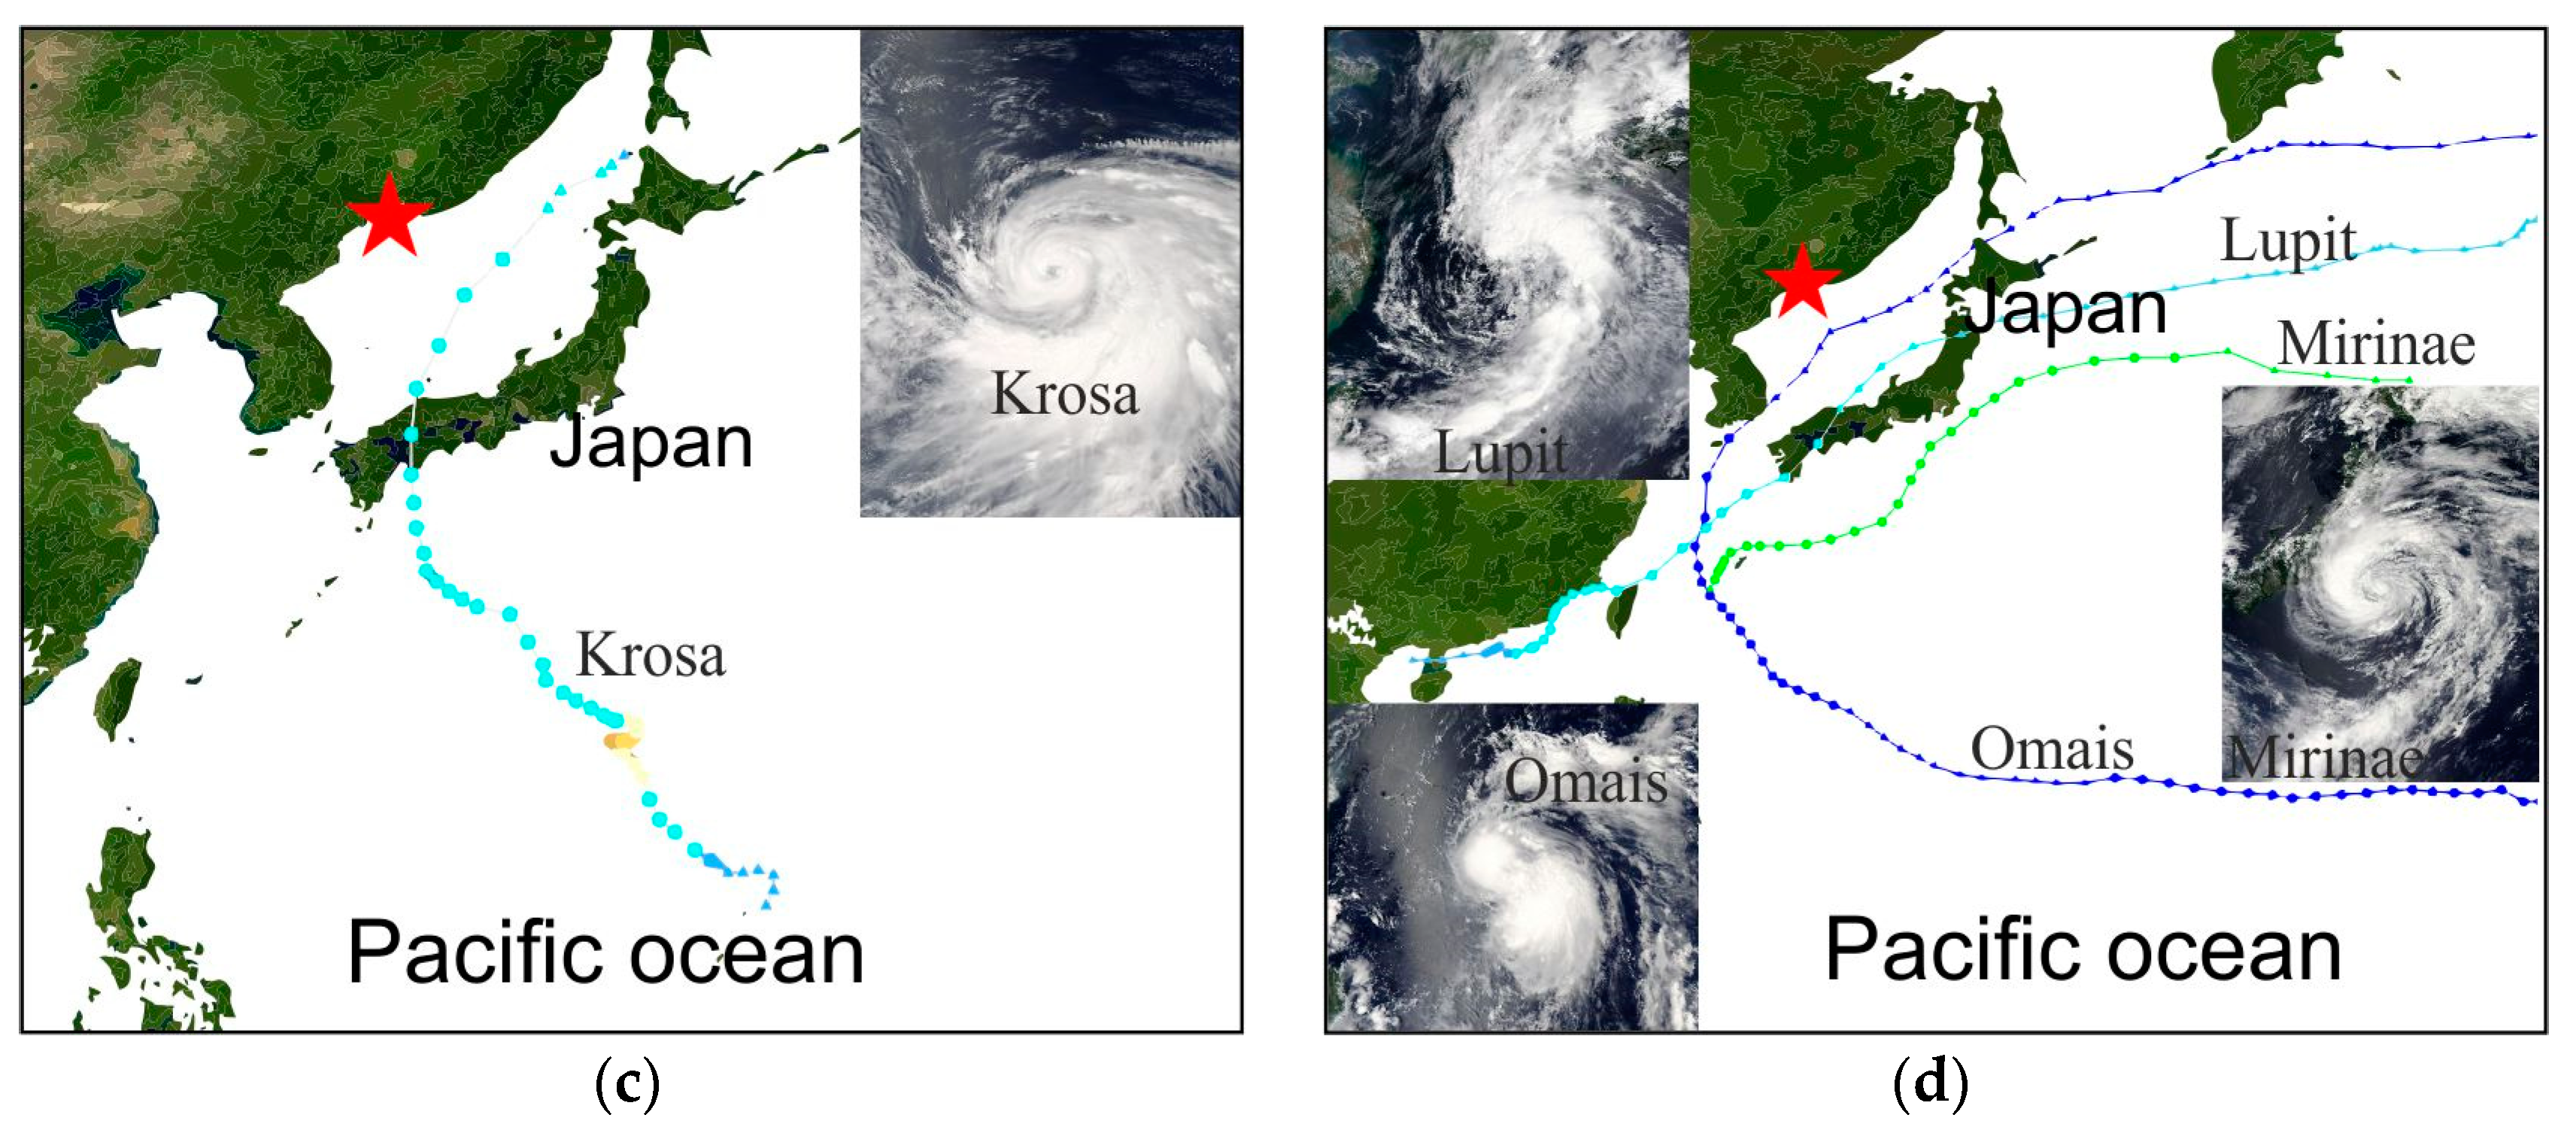
Typhoon Krosa passed near Primorye on 16 August 2019 (
Figure 2c). It originated on August 5 over the Mariana Islands and quickly became a tropical storm of the third category. On 13 August, it crossed the island of Hokkaido and entered the Sea of Japan, the diameter of the storm increased to 1600 km, and the wind speed reached 151 km/h.
In 2021, the recorded storms’ impacts on the characteristics of Peter the Great Bay significantly differed from the previous years due to the fact that three storms passed over the bay in a fairly short period. At the same time, all of them were rather weak and passed far enough from Primorye. Nevertheless, we can state that typhoons have affected the hydrological characteristics of the Primorye coastal waters. Typhoon Mirinae passed by Primorye with its edge on 6–8 August 2021 (
Figure 2d). It originated on the east coast of Taiwan on August 3 and moved along the east coast of Japan, while its center did not enter the Sea of Japan. The wind speed reached 95 km/h. At the same time, on 2 August 2021, Typhoon Lupit originated to the west of Sanya Island. Typhoon Lupit passed along the coast of China, crossed the East China Sea, made a detour off the east coast of Kyushu, crossed the island of Hokkaido and entered the Sea of Japan (
Figure 2d). The typhoon’s edge came out to the coast of Primorye on August 8–9. The wind speed did not exceed 85 km/h. Typhoon Omais originated on 6 August 2021, over the central part of the Pacific Ocean, passed into the South China Sea and turned towards the Sea of Japan (
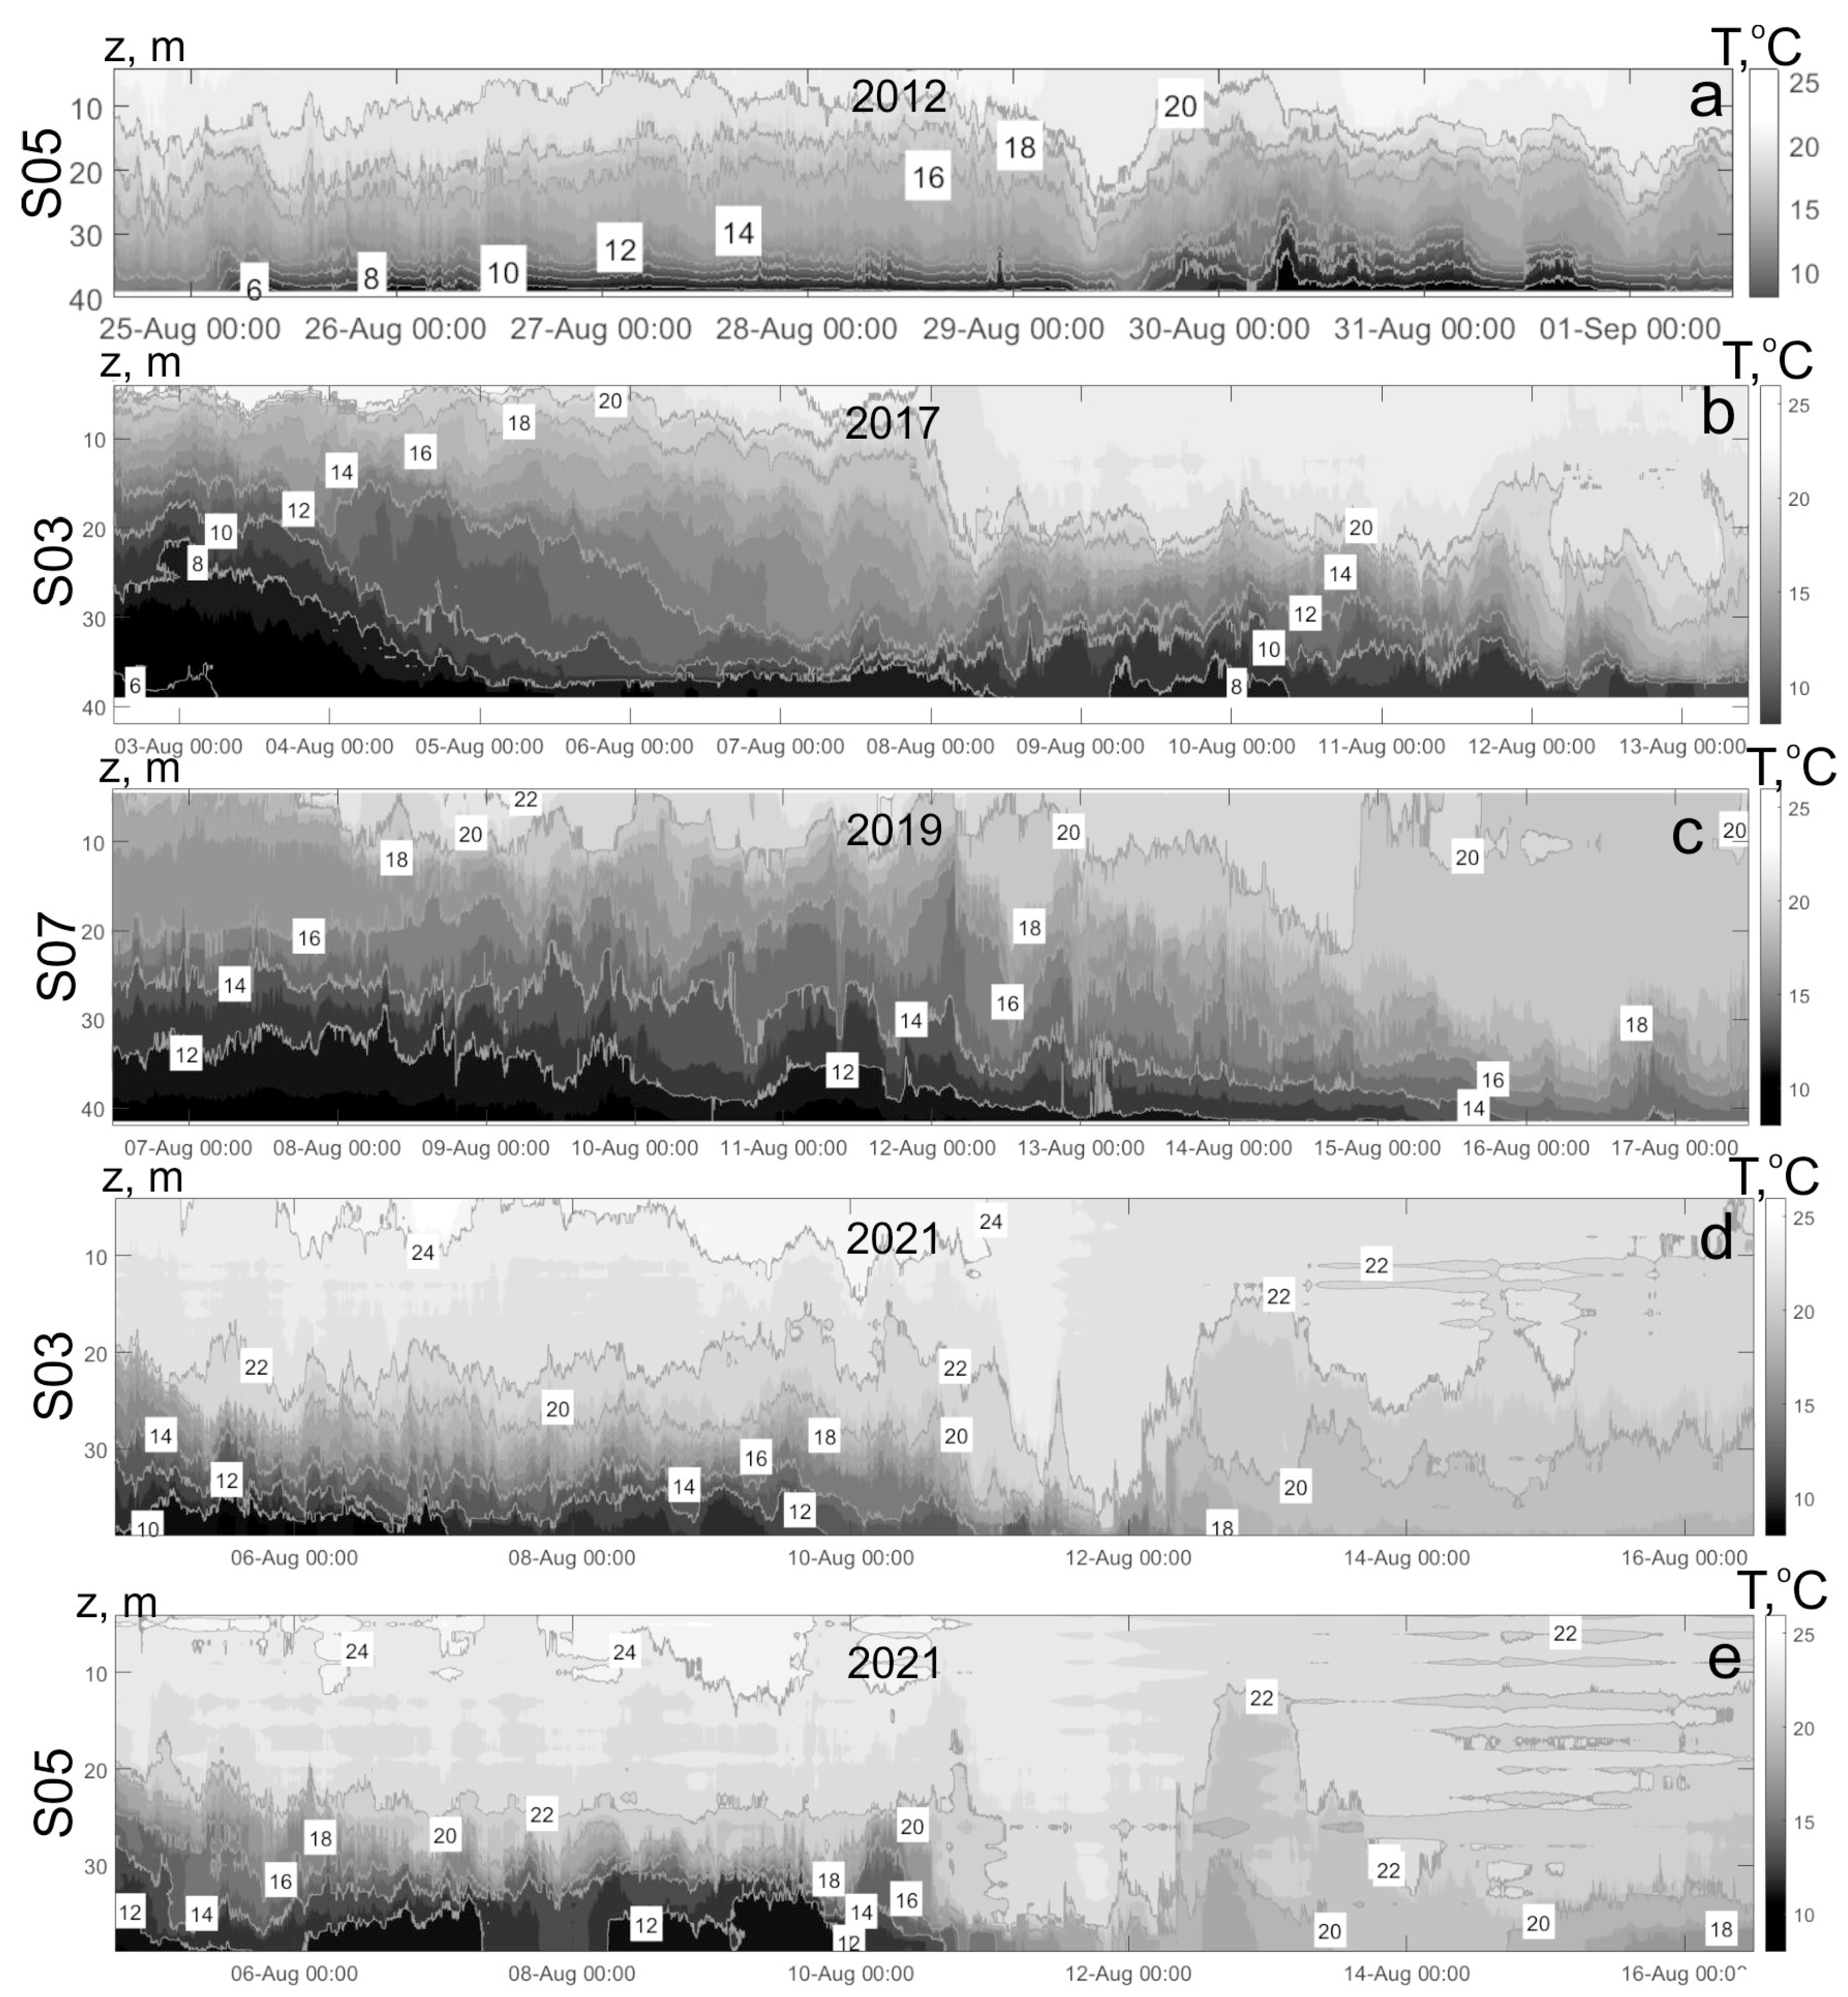
Figure 2d). Typhoon Omais passed into the Sea of Japan through the Tsushima Strait, and on 10–11 August, it reached the coast of Primorye. The wind speed was 85 km/h. The uniqueness of Typhoon Omais was its duration of 14 days and the traveled distance of 1610 km. First of all, we will consider the hydrological situation in Peter the Great Bay in summer, when the synoptic situation is characterized by moderate weather conditions. For example, during the period of hydrological measurements from 25 July to 2 August 2012, the meteorological conditions were characterized by sufficient stability: the wind was weak, occasionally increasing to moderate southerly wind, and sea waves were also weak. Air temperature rose up to 27 °C during the day, falling to 20 °C at night. The near-surface layer of water was warmed up to 19–21 °C, and at the bottom (at a depth of 75 m), the temperature was approximately 1 °C (
Figure 3). In
Figure 3a, the thermoclines are shown as the areas of concentrated isotherms. Three thermoclines were observed in the water column to a depth of about 70 m. The first thermocline was located close to the sea surface to a depth of 8 m, where the temperature changed by 4 °C. The second jump was registered at a depth of 35–50 m, where the temperature changed by 5 °C, and the last one, at a depth horizon of 60–80 m. The temperature changed by 7 °C in the third thermocline, located near the bottom. As the depth decreased, the hydrological situation changed insignificantly. Due to the relief, the lower layer of water was “cut off,” and only its heated part remained.
Figure 3b from 3–8 August 2017 and
Figure 3c from 7–13 August 2019 show the hydrological situation in calm meteorological conditions. We can identify two thermoclines in the data of thermostrings, which were installed at a depth of about 40 m. The upper thermocline, located from the surface to the depths of about 15 m, was characterized by an insignificant temperature gradient: 3–4 °C per 5 m depth (0.6–0.8 °C/m). A similar hydrological situation was described in [
36], an example of hydrological studies that were carried out in 1984–1990. Thus, we can state that the hydrological situation in the region has been quite stable in certain seasons over the past decades.
Typhoon Bolaven passed off the coast of Primorye from the evening of 28 August to the morning of 29 August 2012, bringing warm water from the southwest. The maximum wind speed was 126 km/h. We made a hydrological cross-section on 31 August, when the strong wind subsided. During these measurements, the wind was northwesterly, from moderate to strong. According to our observations (
Figure 3a), the heated water layer of 19–22 °C reached a depth of 15–20 m. Below, to the depth of 35 m, there was a transition layer, where the water temperature dropped from 19 °C to 5 °C, and further to the bottom, the temperature changed smoothly from 5 °C to 1 °C. We should note that during the typhoon, water colder than 5 °C was observed at depths of less than 40 m, which is not typical for Peter the Great Bay in summer. Apparently, this is caused by an increase in the thickness of the layer of warmed (up to 15 °C and above) water and the overpressure phenomenon. In addition, at the depths of 30–35 m, there was a high-gradient thermocline with a decrease in temperature of more than 2 °C per 1 m. In July and early August, the near-surface water layer warmed up evenly to 20 °C; near the bottom, the water temperature dropped to 1 °C, and the lower transition layer was at a depth of about 70–80 m. At the end of August, the upper water layer warmed up to a temperature of more than 21 °C, and, at the same time, the temperature gradient increased with depth. Due to this fact, the lower transition layer rose up to the depths of 60–70 m. Most likely, on 25 August, Typhoon Bolaven, which “pushed” masses of warm water from the southwest of the Sea of Japan ahead of itself, was already making an impact. The hydrological picture, from 25 August to 1 September 2012, was quite calm. Only after the passage of the typhoon, from the evening of 29–30 August, we observed a local fluctuation; where at first, there was an influx of warm surface water, and a powerful thermocline moved down to a depth below 40 m, and then it moved up to 30 m depth. Further, on 31 August and 1 September, the hydrological situation stabilized.
Typhoon Noru was the second longest-lasting tropical cyclone in the Pacific Northwest in the entire observation period and the second most intense basin tropical cyclone in 2017. Typhoon Noru passed over South Primorye on 7–8 August 2017 with its edge, and the wind reached 54–72 km/h with gusts of up to 90–110 km/h; sometimes, the wind increased up to 120–130 km/h. The height of the waves observed off the Primorye coast was 4–5 m. In 2017, we began to use the modernized autonomous vertical moored thermo-strings with pressure loggers installed near the lower and upper temperature sensors [
37]. It allowed us to trace the retrospective of Typhoon Noru’s passage in Peter the Great Bay (
Figure 2b).
Figure 3b shows temperature changes over depth and time from 6–10 August 6, 2017, recorded by the S03 thermostring (installed at a depth of 40 m). On August 6, meteorological conditions were quiet; there were two weakly pronounced wide thermoclines: one near the surface from 7 to 15 m with a temperature drop of about 7 °C, and the second at the depths of 27–35 m and change in temperature by 8 °C. During the beginning of Typhoon Noru’s passage, on 7 August, when the wind load of approximately 12–17 m/s appeared, an influx of warmer water was detected on the surface, and manifestations of intense internal waves’ packets were recorded. The study of intense internal waves’ passage in Peter the Great Bay is described in more detail in [
38]. The depths of the thermoclines did not change until 8 August; the temperature gradient in the upper thermocline increased up to 9 °C. Significant changes in hydrological parameters occurred on 8 August, when maximum wind loads up to 126 km/h were recorded. The water layer, warmed to more than 20 °C, stretched from the surface to the depth of 17–19 m; then, at the depths of 20–30 m, a powerful thermocline was identified with a temperature change of 15 °C. The passage of intense internal waves was also recorded. A powerful thermocline formed by Typhoon Noru was observed until August 12.
During Typhoon Krosa’s passage on 19 August 2019, the distributed autonomous systems were installed from 7–18 August (
Figure 3c). In the period from 7–14 August, no pronounced thermoclines were observed, and the amplitudes of short-period internal gravity waves were insignificant. We can note that the influx of warm surface water began two days before the typhoon arrived on the coast. At that time, a layer of water with an increased temperature gradient began to form at depths of 20–30 m. On 16 August, a pronounced thermocline was already completely formed at the depths of 35–40 m with a temperature change of more than 12 °C. A similar hydrological situation was observed during the passage of Typhoon Bolaven in 2012 and Typhoon Noru in 2017. Against the background of incoming surface warm water, a cold bottom layer remained, and a powerful thermocline was formed at the depths of 30–40 m. The influence of typhoons was noticeable several days before their arrival, and the hydrological picture remained stable for several days after the typhoon passage.
In 2021, a unique situation was recorded when weather conditions off the Primorye coast were affected by three typhoons at once with a 1-day interval. On 7–9 August 2021, Typhoon Mirinae passed over the Sea of Japan without approaching Primorye. Typhoon Lupit passed along the Primorye coast on August 8–9 (
Figure 3e), and Typhoon Omais came to the Primorye coast, the closest of all those storms, on 10–11 August. The influence of the Mirinae and Lupit typhoons on hydrological characteristics was similar to previous years when warm surface water came from the southern part of the Sea of Japan, and there was a powerful thermocline at the depths of 30–40 m. Apparently, Typhoon Omais, with a trajectory from the center of the Pacific Ocean through the Tsushima Strait and along the Korean Peninsula, brought a huge mass of strongly warmed surface water to the southern Primorye coast. In addition, in the hydrological situation off the Primorye coast, the influence of two previous typhoons was noticeable; we observed a 30 m warmed water layer, and the thermocline moved down to the bottom (9–11 August in
Figure 3d,e). On the sea surface, the water temperature measured with a CTD profiler during hydrological cross-sections reached 28 °C. We observed a warmed water layer with a temperature above 18 °C from the surface to the bottom at depths of more than 60 m. The thermocline moved down below the installation depth of the deepest thermostring. Also, unfortunately, the time of the thermostrings’ operation in 2021 did not allow us to monitor the hydrological situation on the shelf without the influence of typhoons.
In October 2022, we were able to register the speed of current using Infinity current meters during the strong wind influence on the hydrological situation in Peter the Great Bay.
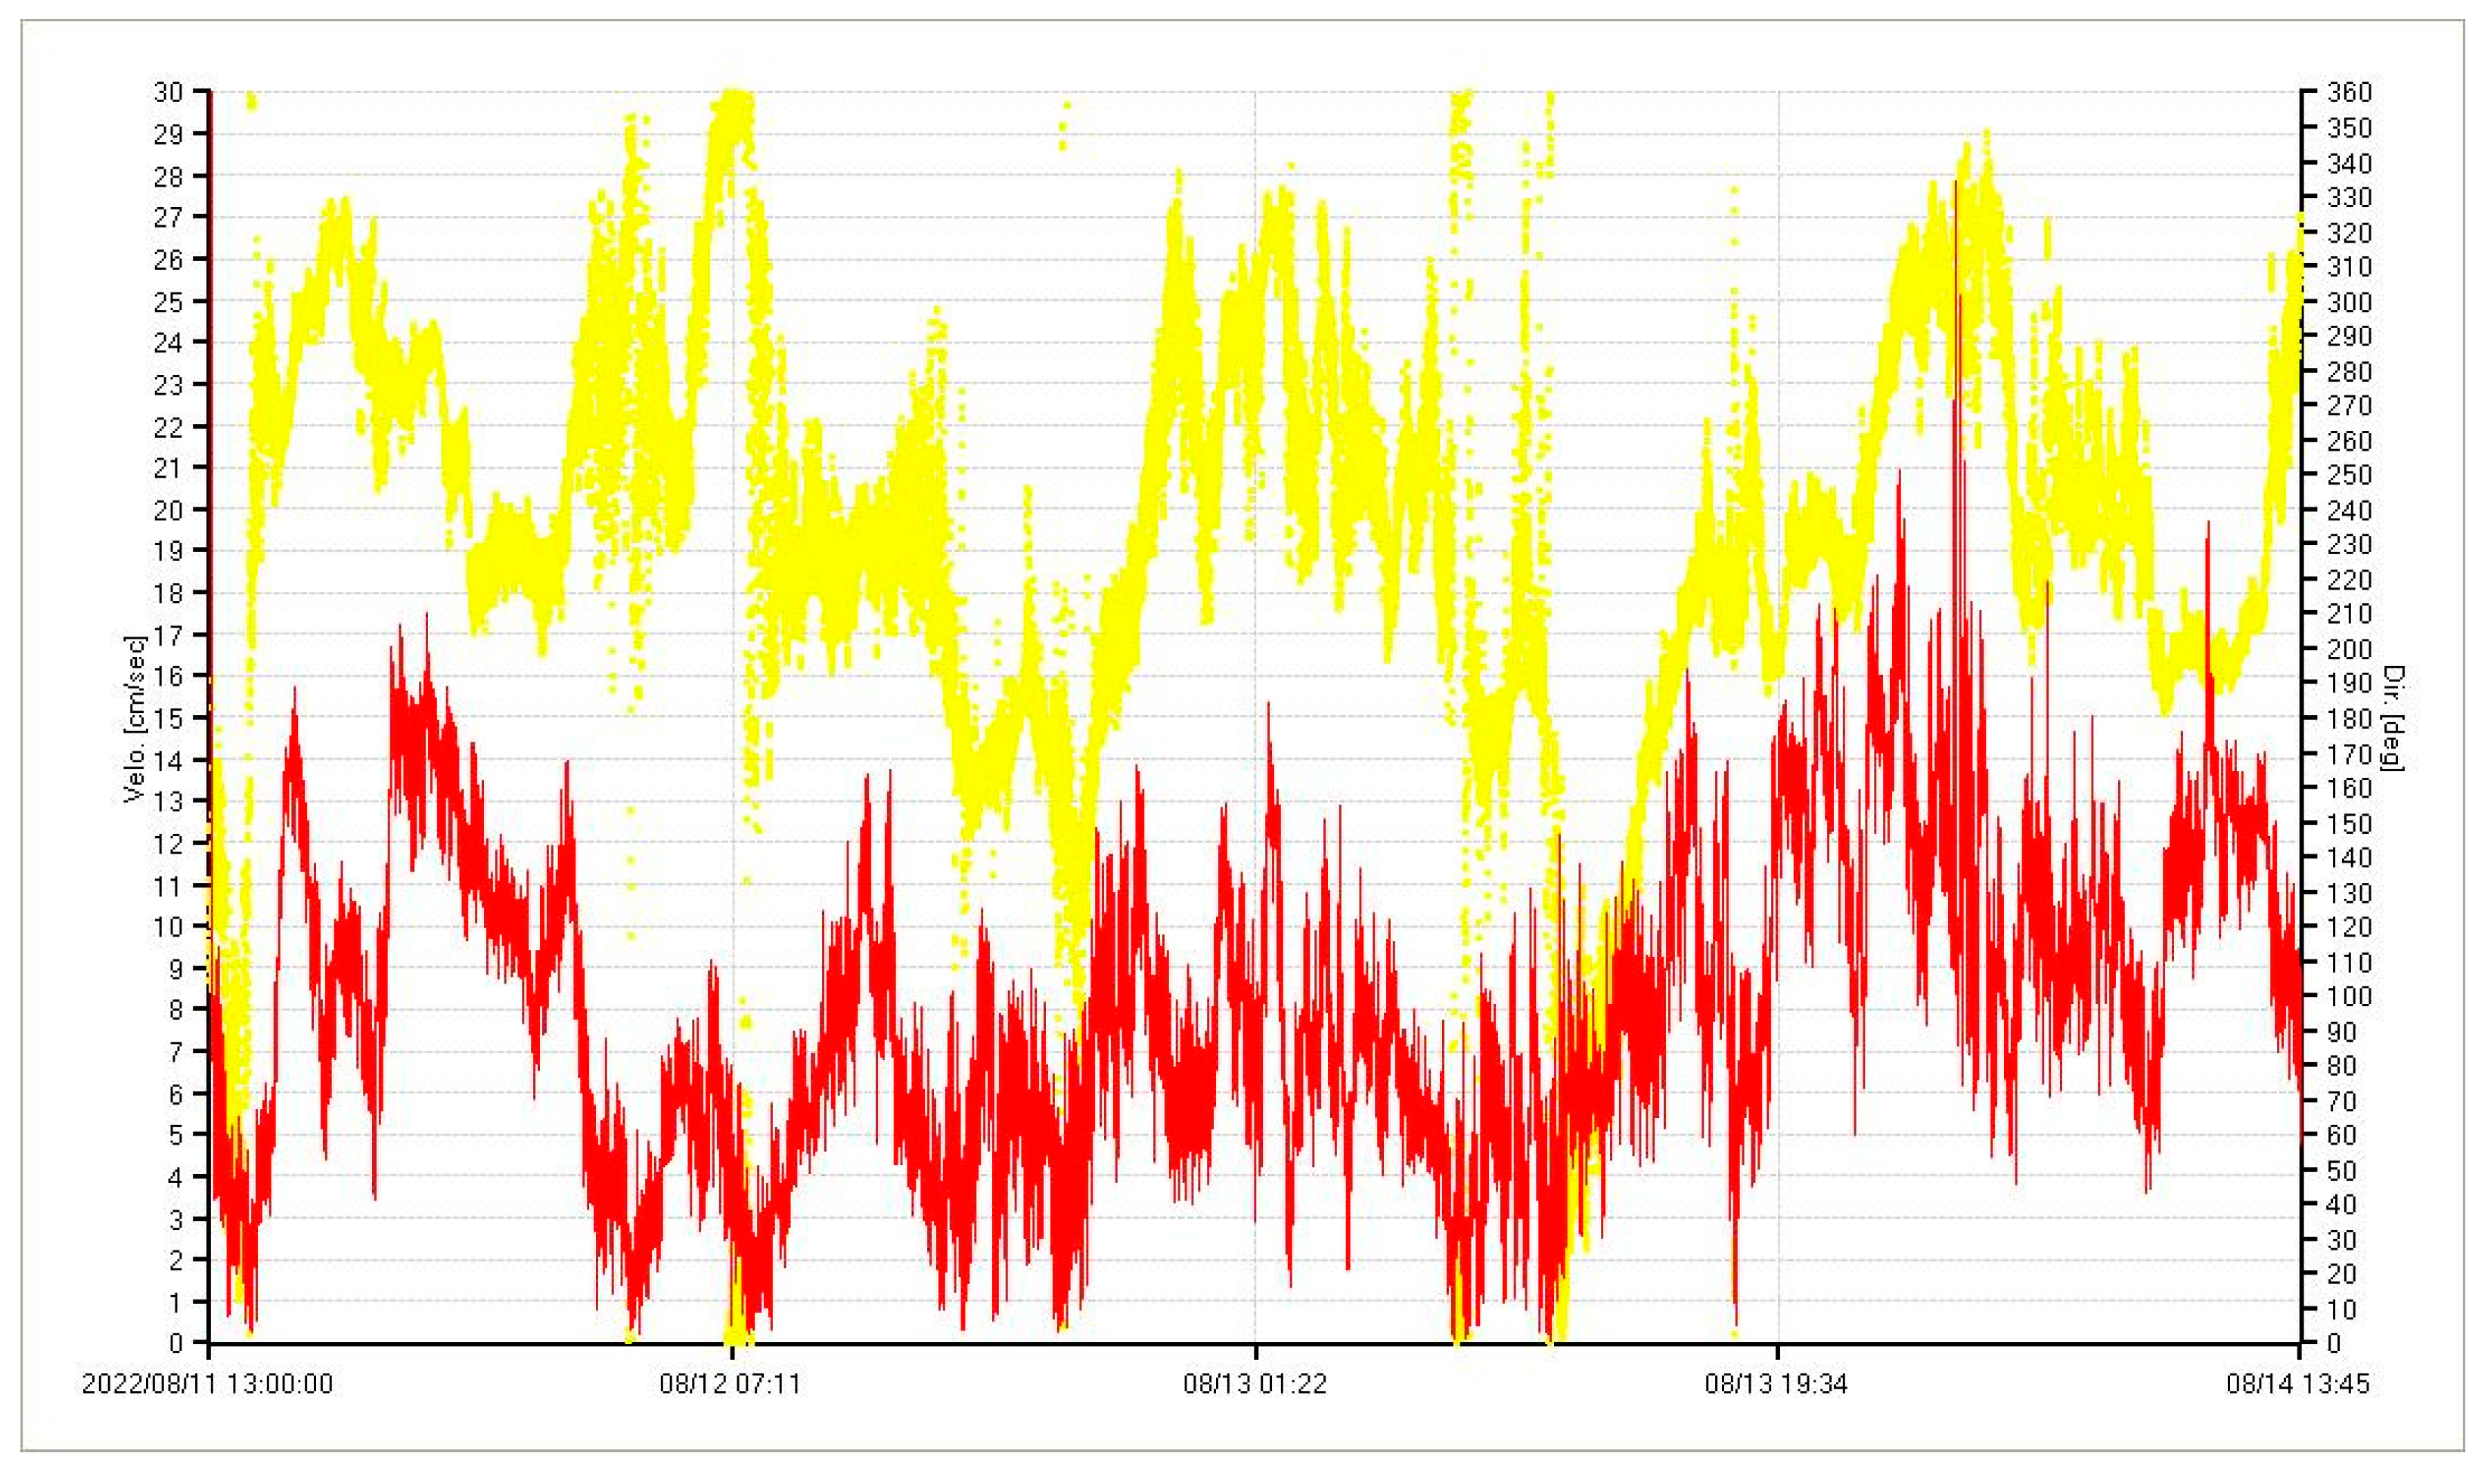
Figure 4 shows the current speed (red) and direction (yellow) for the period from 13:00 on 11 August to 13:45 on 14 August 2022, when meteorological conditions were moderate. The current meter was located 2 m above the bottom. The current speed during this period most often did not exceed 20 cm/s, with one peak of up to 28 cm/s.
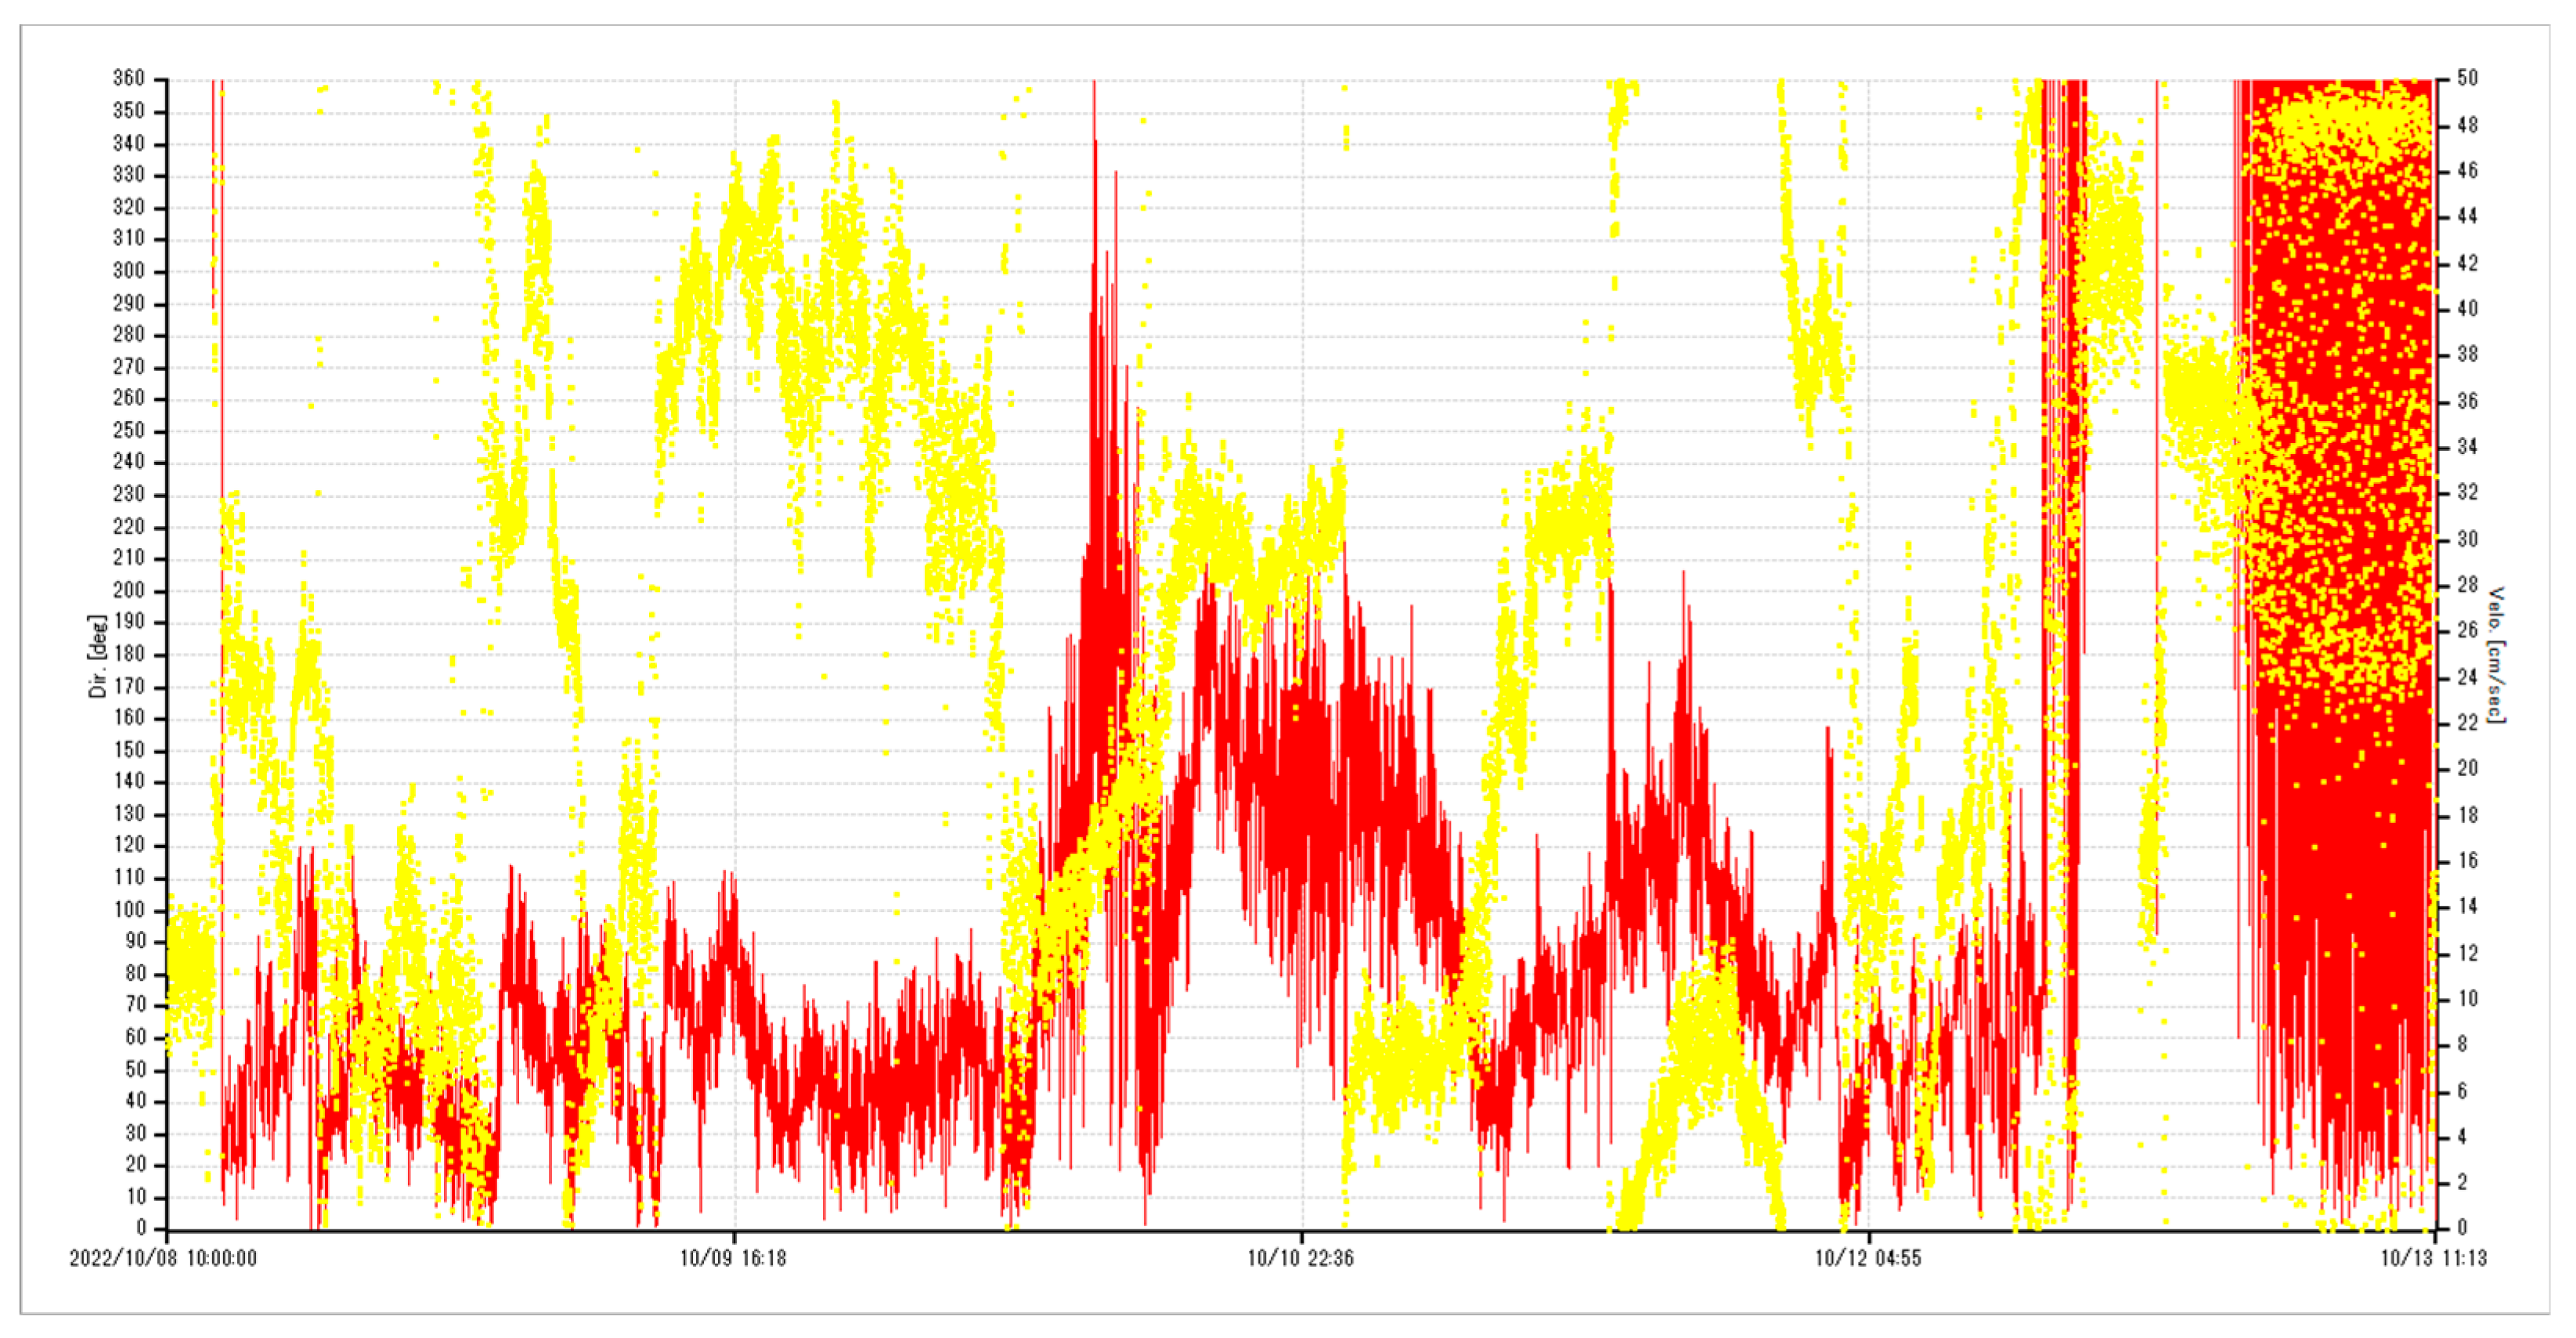
Figure 5 shows the speed and direction of currents near the bottom when the speed and direction of the wind off the coast of Primorye were similar to typhoons. Current measurements in the bay were carried out from 10:00 on 8 October to 11:13 on 13 October 2022. The current meter was also located at a distance of 2 m above the bottom. We should note that two other instruments (located at 8 and 14 m above the bottom) recorded similar current speeds. Meteorological data showed that the wind speed from 8 October 2022, to 12 October 2022, increased from 36 km/h to 60 km/h, with gusts of up to 80 km/h. The wind was southeasterly, easterly. We can see that with a strong wind load on the water area, the current speeds reach 50 cm/s or more. Thus, we can conclude that the current speeds during typhoons’ passages can exceed 50 cm/s. This parameter is important in calculating the critical current speed at which particles of different granulometric sizes will break away from the bottom and move.
6. Results of Turbidity Currents’ Analysis
According to [
18], SWs on the continental slopes and shelves are formed by turbidity (TB) currents flowing along the seabed with a fine- or coarse-dispersed sedimentary suspension entrained by bottom currents down and along the slope and also along the shelf. The roiling process and subsequent transport of sediments are conditioned by the following parameters of the marine environment: the bottom current speed, the size of sediments, the concentration of sediments, and the sea depth in SWs location zones [
39,
40].
We will consider the peculiarities of turbidity currents on the shelves formed by nonlinear internal waves (NIWs). These waves are generated by forced tidal or inertial currents over the continental shelf edge and represent a characteristic feature of the World Ocean coastal zones and its marginal seas, including shelf waters of the Sea of Japan [
33]. When propagating towards the coast, NIWs cross a zone with specific distribution of the buoyancy frequency
N(
z) over the depth, in which the coefficient of quadratic nonlinearity is close to zero. Crossing this zone, the waves change their polarity; thus, a depression wave transforms into a packet of nonlinear elevation waves, resulting from disintegration. The disintegration of NIWs with a change in polarity was studied using numerical simulation and laboratory experiments in [
41,
42,
43]. The turbulence of sediments induced by disintegrating NIWs was observed in the middle shelf zone in western Portugal [
25] and on the continental slope of the South China Sea.
Modern hydrodynamic interpretation of the NIWs disintegration, as a result of a change in their polarity, is built on the base of the Korteweg–de Vries (KdV) equation:
where
η(
x,
t) are the vertical displacements of pycnocline on the shelf relative to non-perturbed level;
x,
t are horizontal coordinates and time;
c is the phase velocity of long linear internal waves;
α,
β are coefficients of square nonlinearity and dispersion, respectively. These coefficients depend on the background distribution of buoyancy frequency
N(z) of shelf waters in the following way:
Here,
W(z) is the amplitude function of the first NIWs mode vertical displacements. It is determined by numerical solving boundary value problems for eigenvalues:
where
z is the vertical coordinate directed upward,
c0 is the phase velocity of the lowest mode of the internal wave, and
H is shelf depth.
Let us consider the peculiarities of sediment roiling and their transport during the SWs formation by nonlinear internal waves with change in their polarity on the shelf of Peter the Great Bay. According to studies in the “continental shelf–coastal area of the bay” zone, we can observe two types of waves: NIWs depressions in the shelf edge area, as a result of the internal tide transformation, and NIWs elevations, generated above the shelf, as a result of a change in the NIWs polarity [
33].
Propagating along the pycnocline of the Sea of Japan shelf waters into the coastal waters, the NIWs depressions cross the zone, in which the nonlinearity coefficient
α n the KdV equation changes its sign. According to numerous studies, NIW depressions in this zone transform into packets of intense NIW elevations, forming the so-called internal undular bores. This phenomenon was recorded in 2012 in Posyet Bay and was briefly discussed in [
26]. The authors also supposed that the processes associated with the disintegration of nonlinear internal gravity waves are possible reasons for the SWs formation. Let us show that in the autumn season, the NIWs disintegration zone and/or, correspondingly, zone of intense internal undular bores generation is located in Posyet Bay above the SWs relief zone.
Analysis of the obtained hydrological data shows that the background conditions during the experiment were characterized by the presence of a well-defined seasonal pycnocline, which was located at the depths of 30–50 m (the depth depended on the station position along the section), with the buoyancy frequency maximum of ~30 cycles/h. As a result of solving the boundary value problem (4) with background profile N(z), calculated from field data, we found that the recorded internal waves at frequencies of ~1/15 min−1 and ~1/19 min−1 have wavelengths close to the spatial scales of the relief SWs: wavelengths L1 = 600 m and L2 = 900 m.
The analysis of the buoyancy frequency
N(z) distribution by depth along the hydrological cross-section revealed that the following feature characterizes the density stratification of the bay coastal waters in the autumn season. In the area where sedimentary relief waves are located, the following relationship is fulfilled:
According to relations (4), the indicated feature (4) leads to zeroing of the coefficient
α of the quadratic term in Equation (3). At depths of 60–40 m, the quadratic nonlinearity coefficient
α in the Korteweg–de Vries equation changes its sign, which depends on the pycnocline position above the rising slope of the continental shelf. Nonlinearity is negative if the pycnocline is closer to the surface and positive otherwise. The zone in which the pycnocline is located approximately halfway between the free surface and the fraying-out continental shelf is called critical. In this zone, the nonlinearity is close to zero. Its intersection with the NIW depression leads to the generation of secondary, shorter in duration and more intense in energy, elevation solitons, and the adjacent relaxation zone, consisting of an oscillating packet of linear waves with vanishing amplitudes.
Figure 6 shows the disintegration process of NIW depression of Gaussian shape during its passage through an infinitely narrow critical zone with subsequent generation of a packet of NIW elevation in the layer of stratified fluid with parameters close to the parameters of NIW recorded in the bay. The depression soliton disintegrates with the subsequent generation of a packet of elevation solitons and the formation of an oscillating linear wave packet in the study area with a constant depth of ~50 m. The phase velocity, the coefficients of quadratic, cubic nonlinearities, and dispersion are, respectively: 0.4 ms
−1, 2.1 × 10
−2 s
−1, 1.4 × 10
−3 m
−1s
−1, and 36.7 m
3s
−1. It follows from
Figure 6 that in the process of disintegration of a single depression with unit amplitude by the time
t = 10 in conventional units, an undular bore consisting of a packet of amplitude-ranked solitons with a relaxation zone has formed.
Thus, according to field observations in the autumn season of 2012, first, a significant increase in the energy of internal waves was recorded in the range of spatial scales, close to the horizontal scale of relief sedimentary waves at the boundary of their location; second, in the SWs location zone, the parameter of quadratic nonlinearity, determined by the density stratification, turned out to be close to zero; third, in the SWs location zone, generation of a packet of nonlinear internal waves with the maximum amplitude of ~5 m and duration of ~6 min, caused by the disintegration of the wave with an amplitude of ~3 m and duration of ~40 min, was registered.
We will also consider another possible mechanism of the turbidity currents formation on the shelf of Peter the Great Bay, entrained by the Primorsky current and consisting, in this case, of coarse-grained fractions of bottom sediments. The basis of this mechanism is the Primorsky current, with its core located along the bay’s continental slope. It is intensified by typhoons passing over the Sea of Japan.
The arrows on the bay’s continental slope show the direction of the Primorsky current (
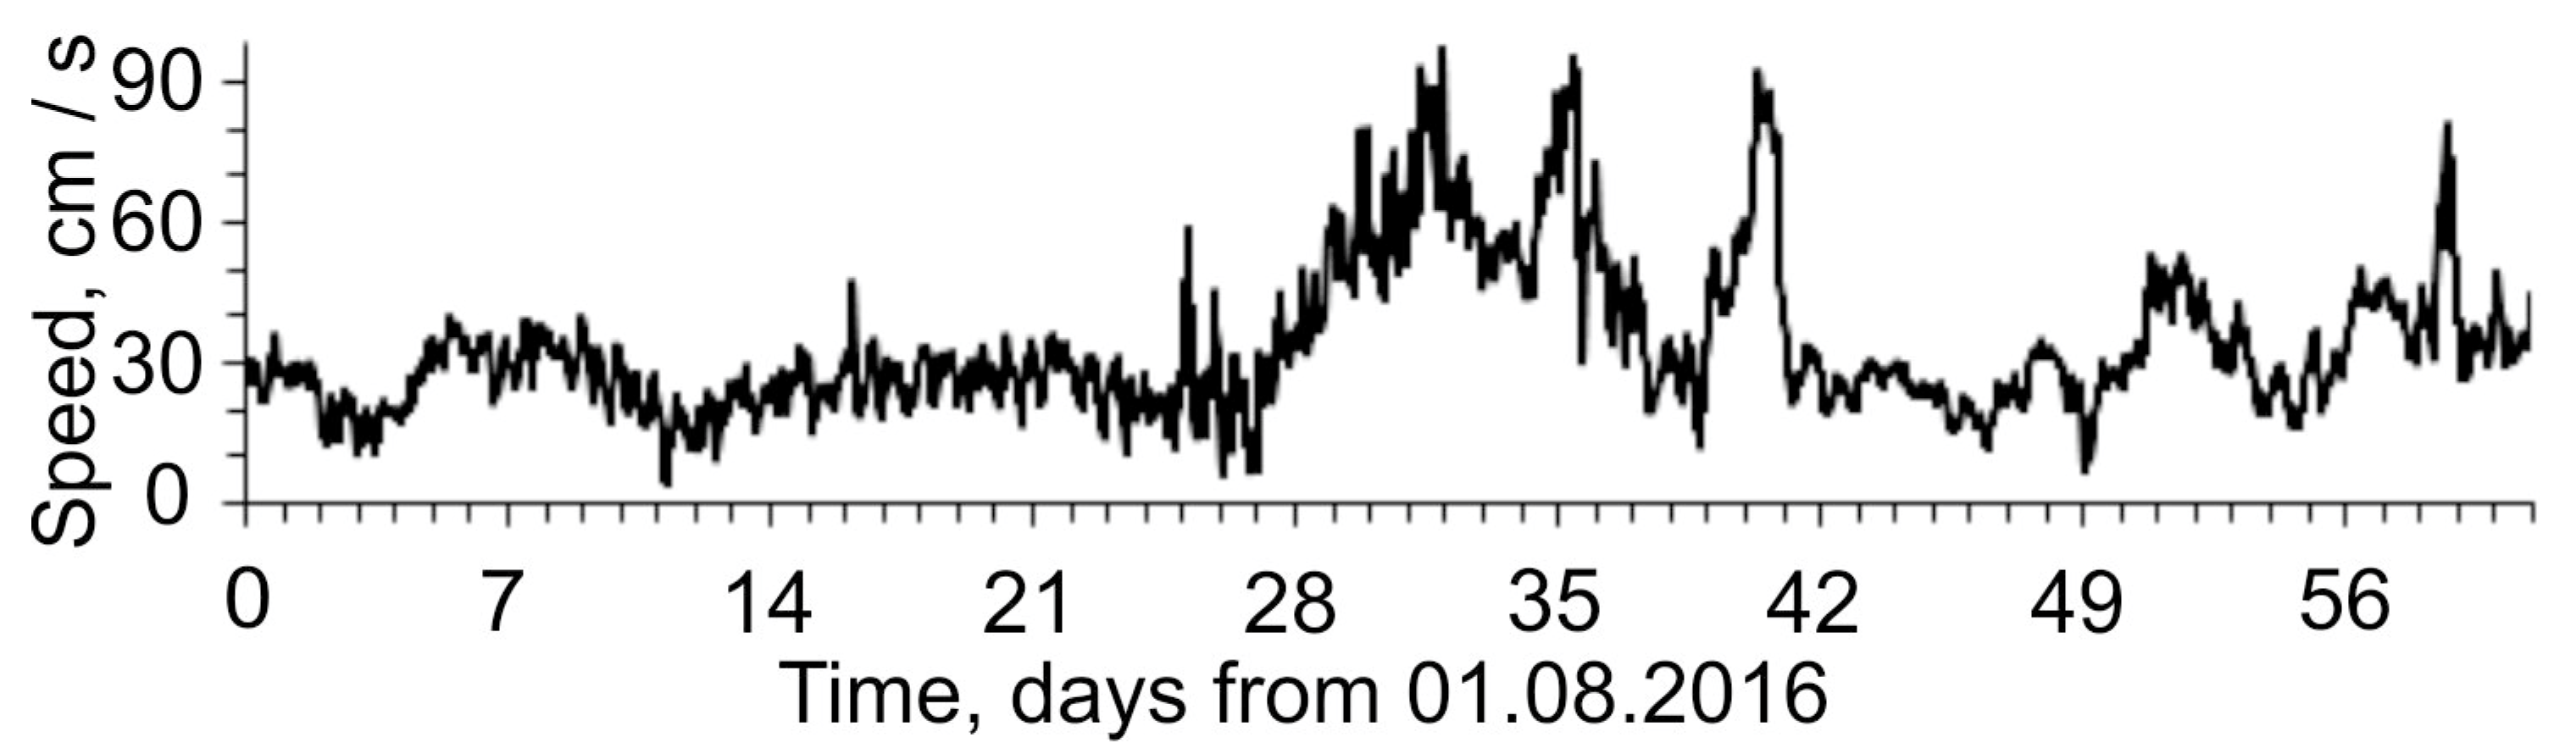
Figure 1). The icon denotes the hydrological buoy location. The direction of the current in the study area during typhoon Lionrock passing at the end of August 2016 (
Figure 2b) was 245° (counting from the north). Typhoon Lionrock entered the Sea of Japan and turned into a strong tropical storm by 22:00 UTC on 30 August 2016. At 18:00 UTC the next day (31 August), the typhoon reached the Primorye coast. According to the measurements performed by the automated hydrometeorological complex installed on the oceanographic buoy, the near water atmospheric pressure was ~975 hPa, and the wind speed was ~13.5 m/s, i.e., the typhoon turned into a tropical storm, which caused the circulation of waters with unusual characteristics in Peter the Great Bay.
Analysis of the data on the current velocity revealed that the Primorsky current in its upper 40-m layer is a barotropic flow. Its velocity in all measured layers, including the bottom layer (due to barotropy), approximately equals a constant value, close to the average velocity over the 40-m layer. The implementation of this speed is shown in
Figure 7. According to
Figure 7, until 29 August, i.e., before the typhoon entered the Sea of Japan, the speed of the Primorsky current varied in the range of 10–30 cm/s; it was sufficient only to maintain TB currents of fine-grained sedimentary material.
From 30 August, when the typhoon entered the Sea of Japan, the Primorsky current speed began to increase. About a day later, on 31 August, by the time the typhoon came to the Primorye coast, the speed of this current reached an extreme value of 80–90 cm/s, sufficient for the formation and support of the bottom current with large sedimentary fractions. Further, the atmospheric impact on the water circulation in the bay gradually weakened, and in three days, by September 3, it stopped. However, the circulation of waters in the bay, formed by the typhoon, remained stable, and the Primorsky current speed remained significant even after that date and amounted to ~55 cm/s, i.e., sufficient for the formation of TB currents with a coarse-grained suspension of bottom sediments. Later, twice more—on September 4 and 8, the speed of this current increased to extreme values of ~70–80 cm/s, sufficient to entrain the coarse-grained sedimentary fractions along the SWs depressions, continuing to develop relief sedimentary waves in Peter the Great Bay.
7. Conclusions
In the course of oceanological studies in Peter the Great Bay of the Sea of Japan, the interaction of the forced tidal/inertial currents with the sea shelf edge of the bay was confirmed, which leads to the generation of internal waves with tidal/inertial frequencies (hereinafter—the internal tide). When propagating over the shelf, the internal tide is transformed into nonlinear internal waves of two types: nonlinear depression waves and internal elevation undular bores.
In the process of geological and geophysical studies on the shelf of the bay, we found that
(1) On the isobaths of the bay from 50 to 100 m, the “packets” of relief sedimentary waves were recorded, consisting of one to several undulations with horizontal spatial scales from 500 to 1000 m and heights from 2 to 8 m;
(2) A significant increase in the energy of high-frequency internal waves with scales of ~600–900 m, close to the SWs horizontal spatial scales, was recorded on the seaward boundary of the SWs location zone;
(3) The generation of a packet of nonlinear internal waves (internal undular bore) caused by the disintegration of a solitary internal depression wave with an amplitude of ~3 m and duration of ~40 min into a packet of several solitary elevation waves with a duration of ~6 min and with the amplitude of 5 m, was registered in the SWs location zone;
(4) Under the atmospheric influence of typhoons, the kinetic energy of nonlinear internal waves and of the Primorsky current significantly increased, which, in that case, acted both as a source of formation of turbidity currents, including medium- and coarse-grained sedimentary material that forms SWs, and as a bottom current that entrained turbidity current along SWs troughs, intensifying their formation.

 ,
, 


