
Collaborative Watershed Modeling as Stakeholder Engagement Tool for Science-Based Water Policy Assessment in São Paulo, Brazil
 , and
, and
Abstract
:1. Introduction
2. Method
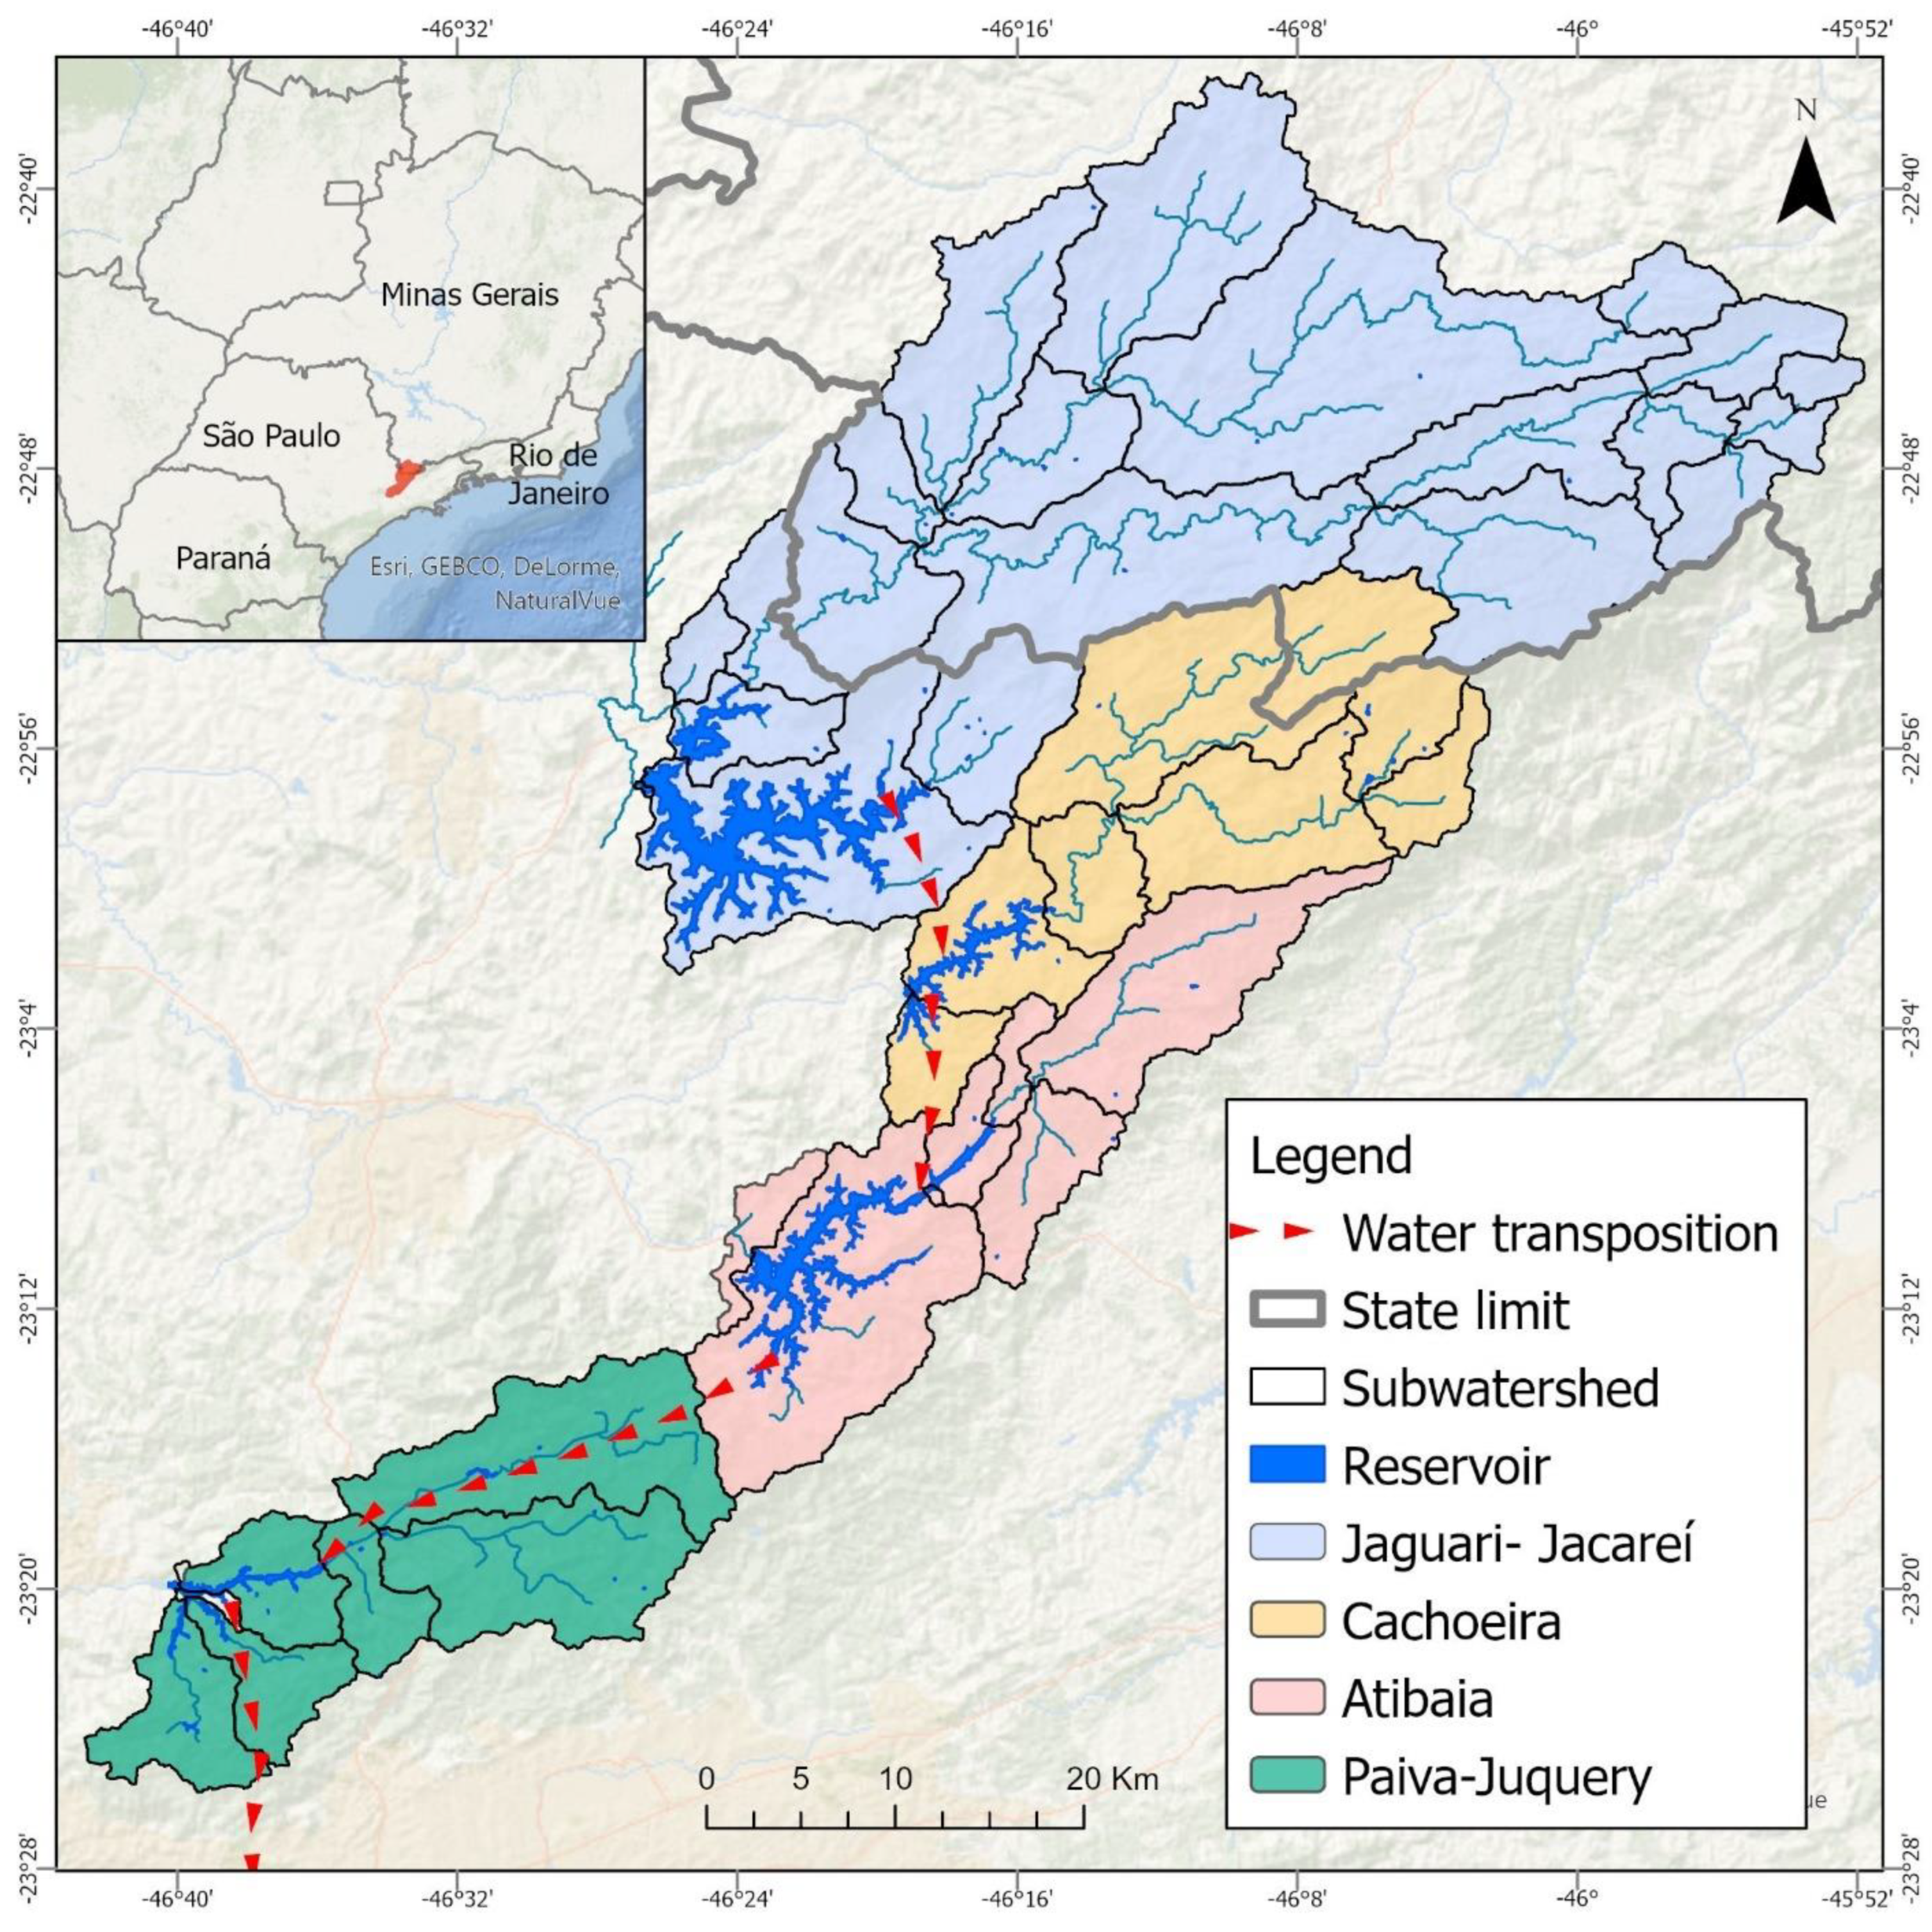
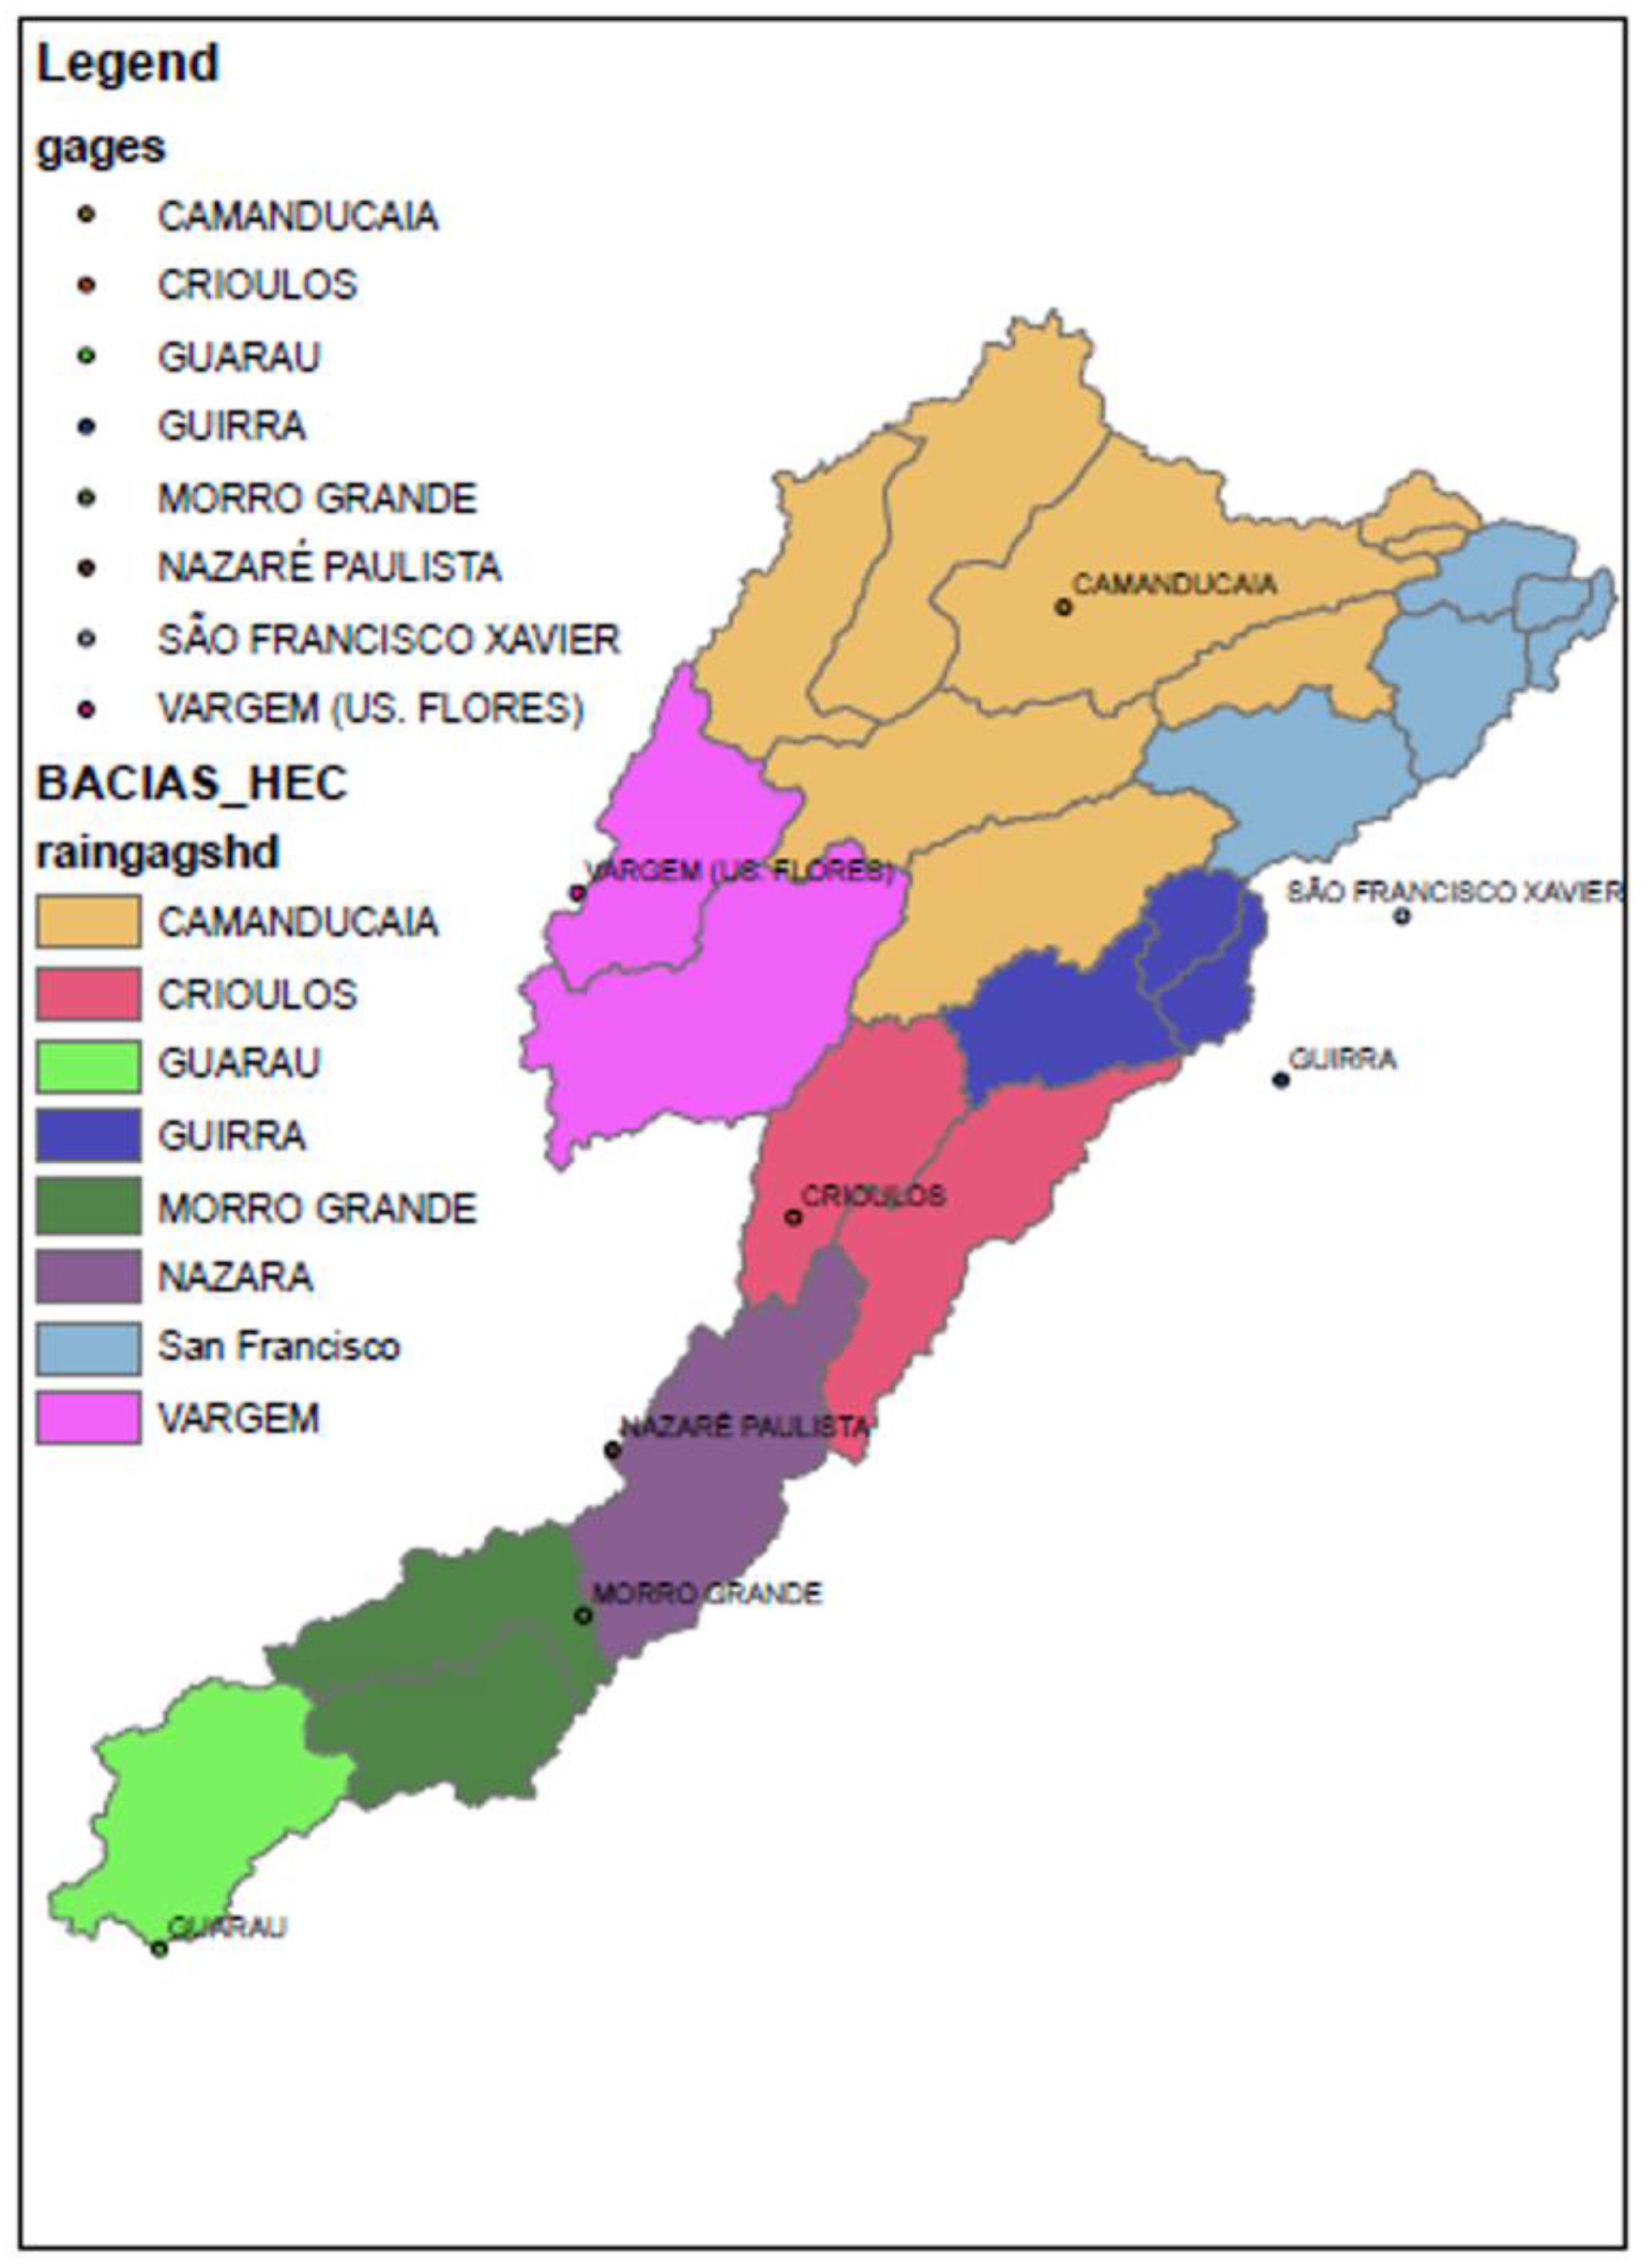
2.1. Study Site
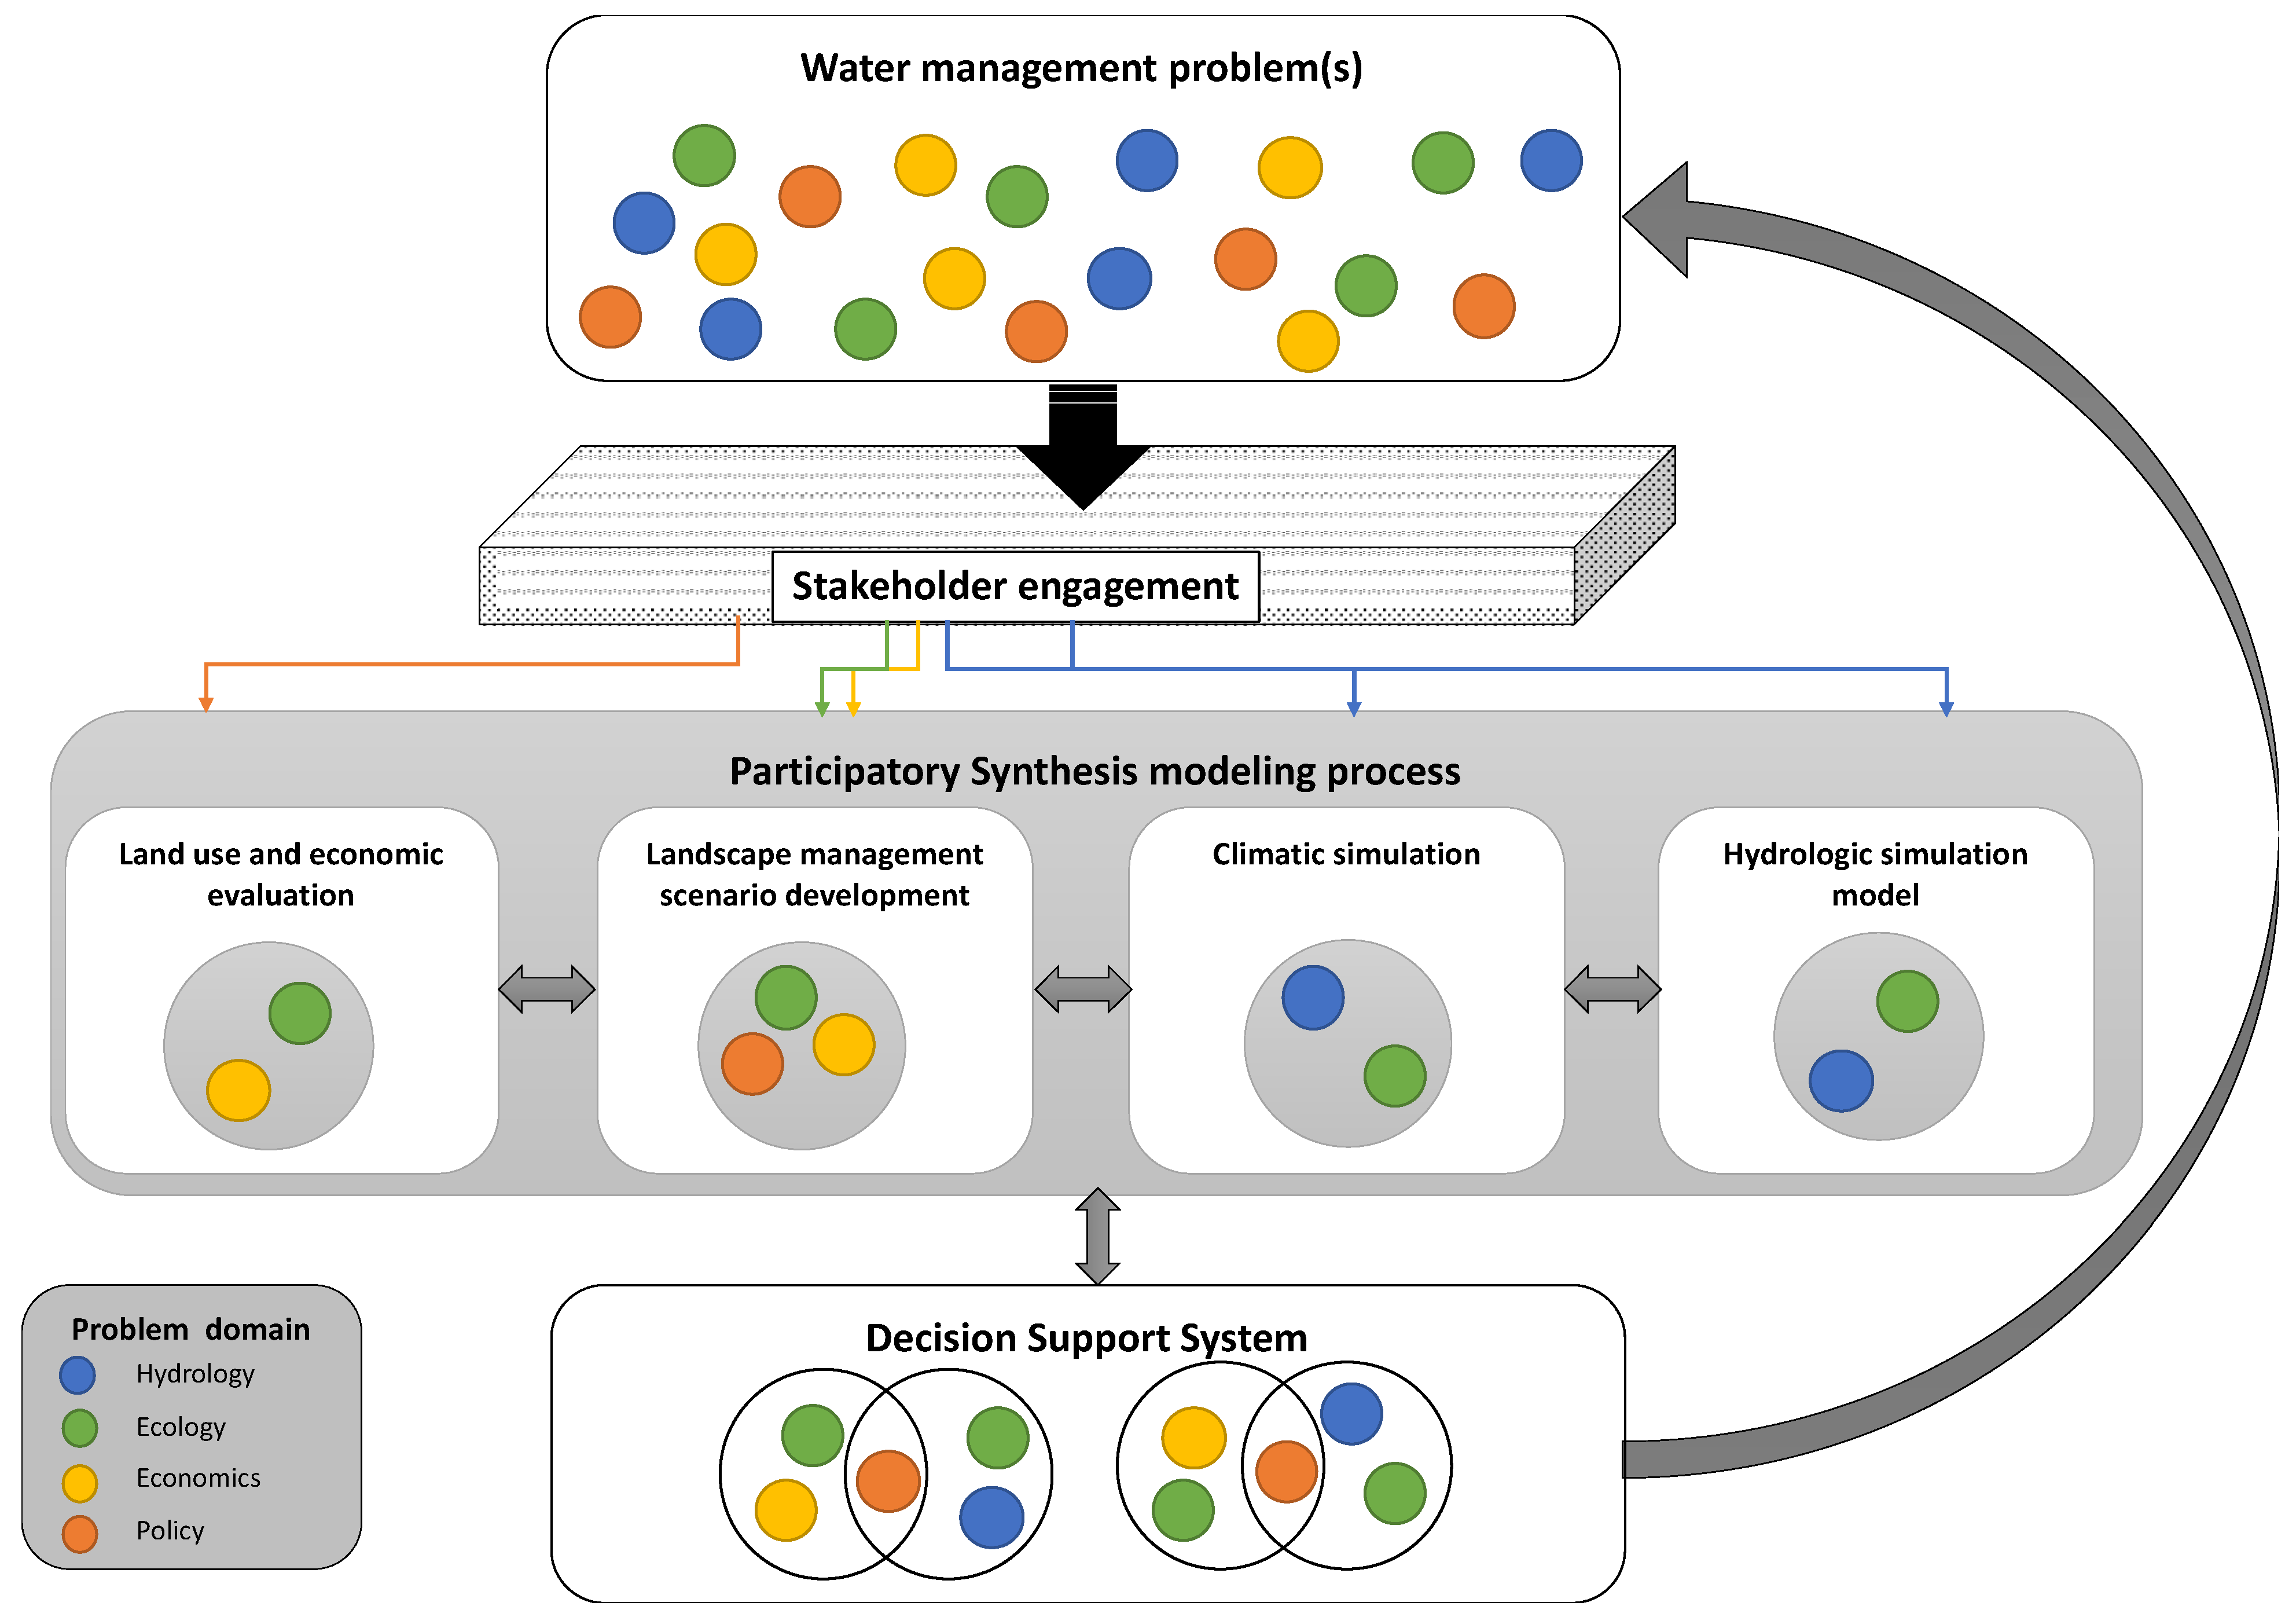
2.2. Collaborative Modeling Process Overview
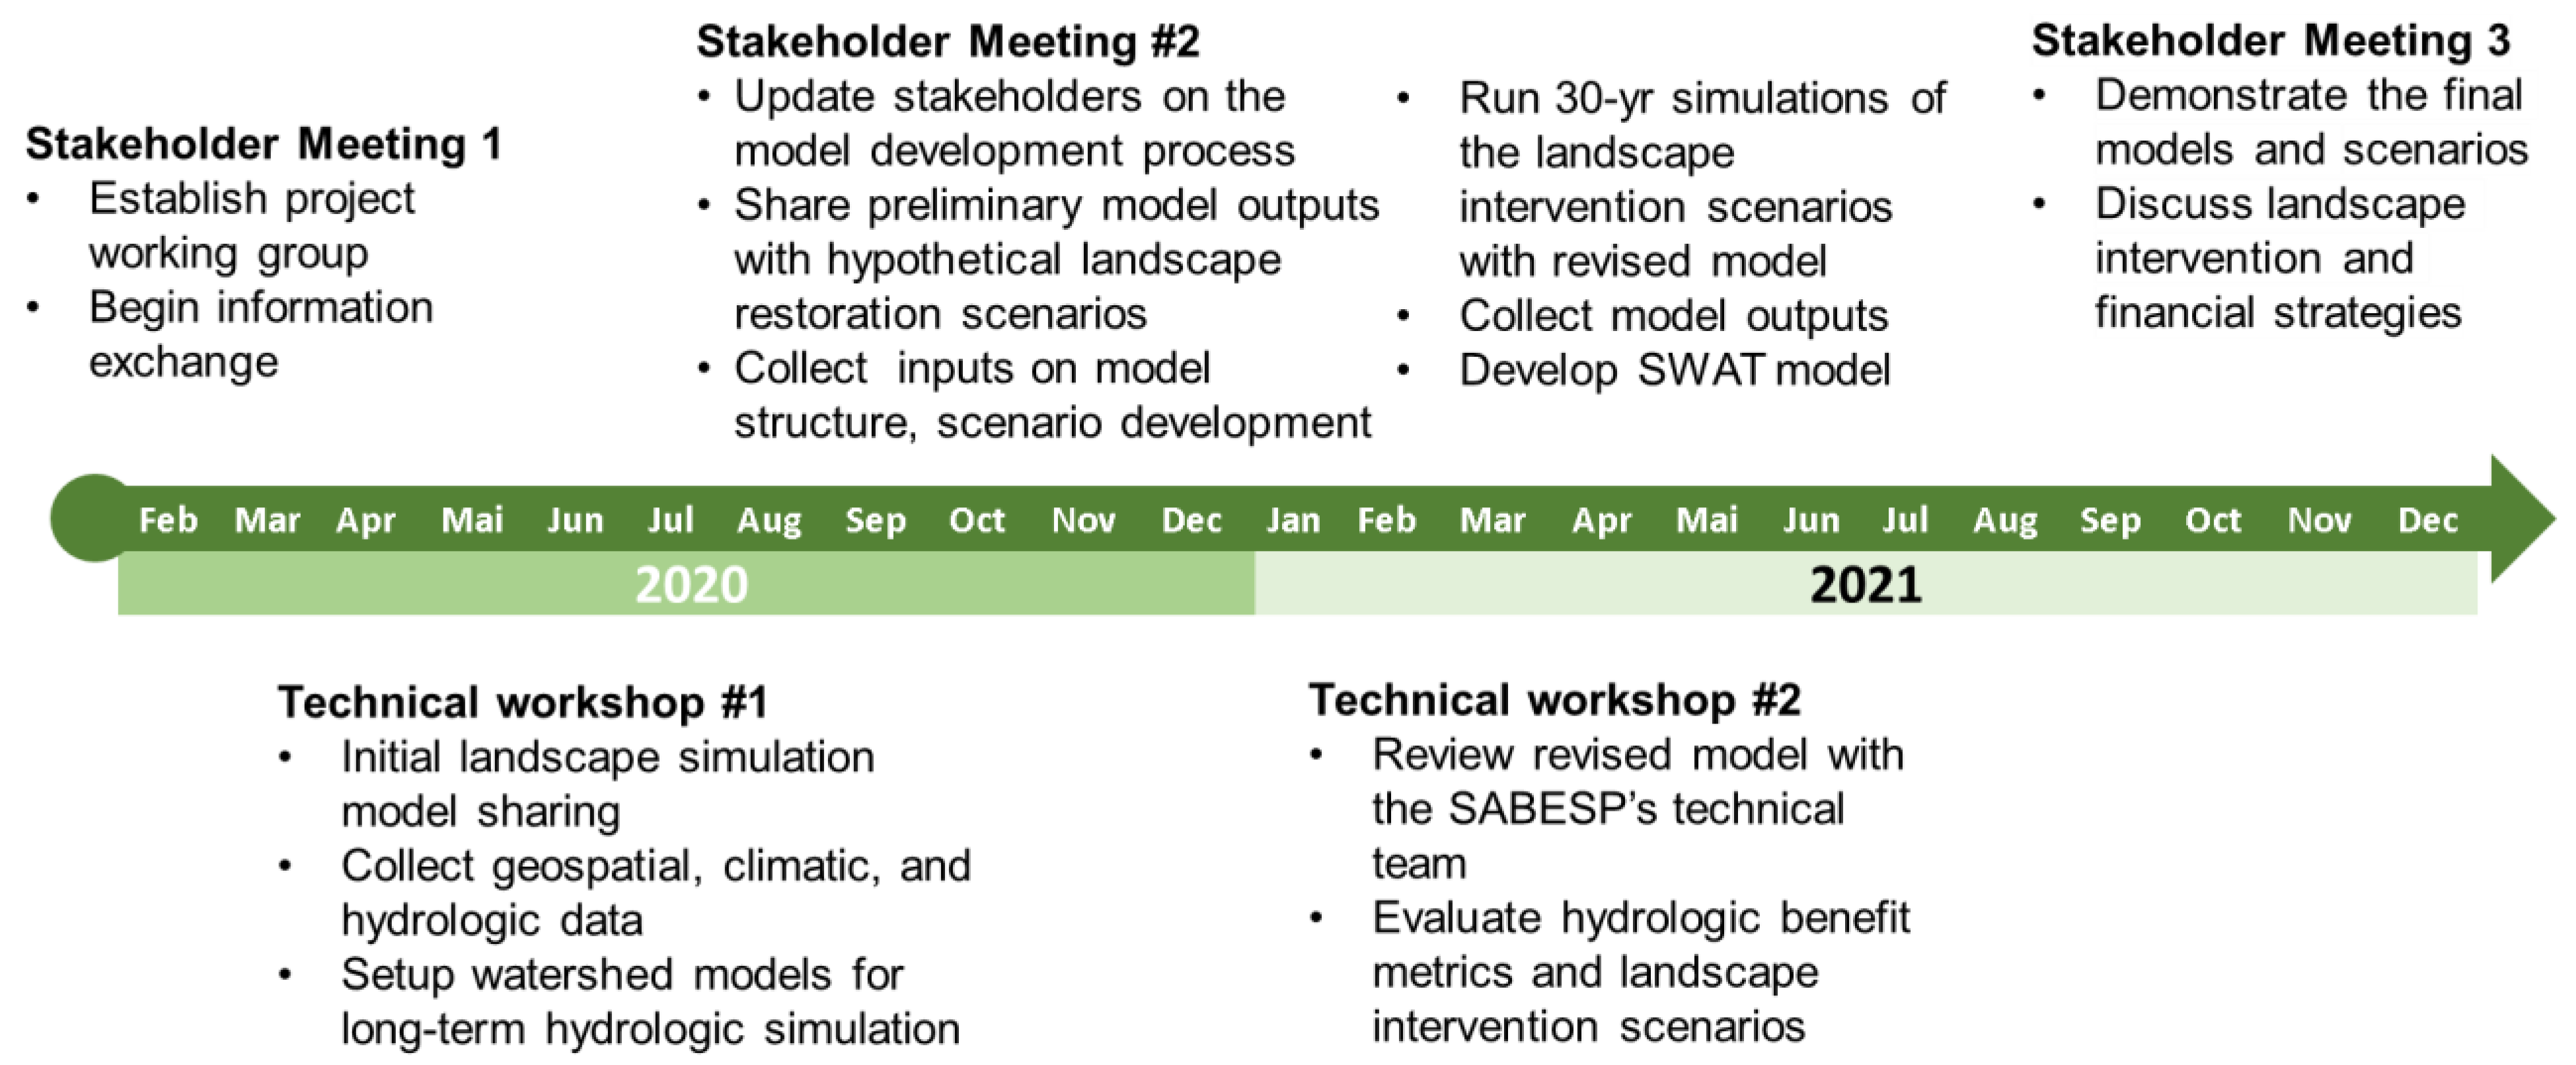
2.2.1. Stakeholder Engagement
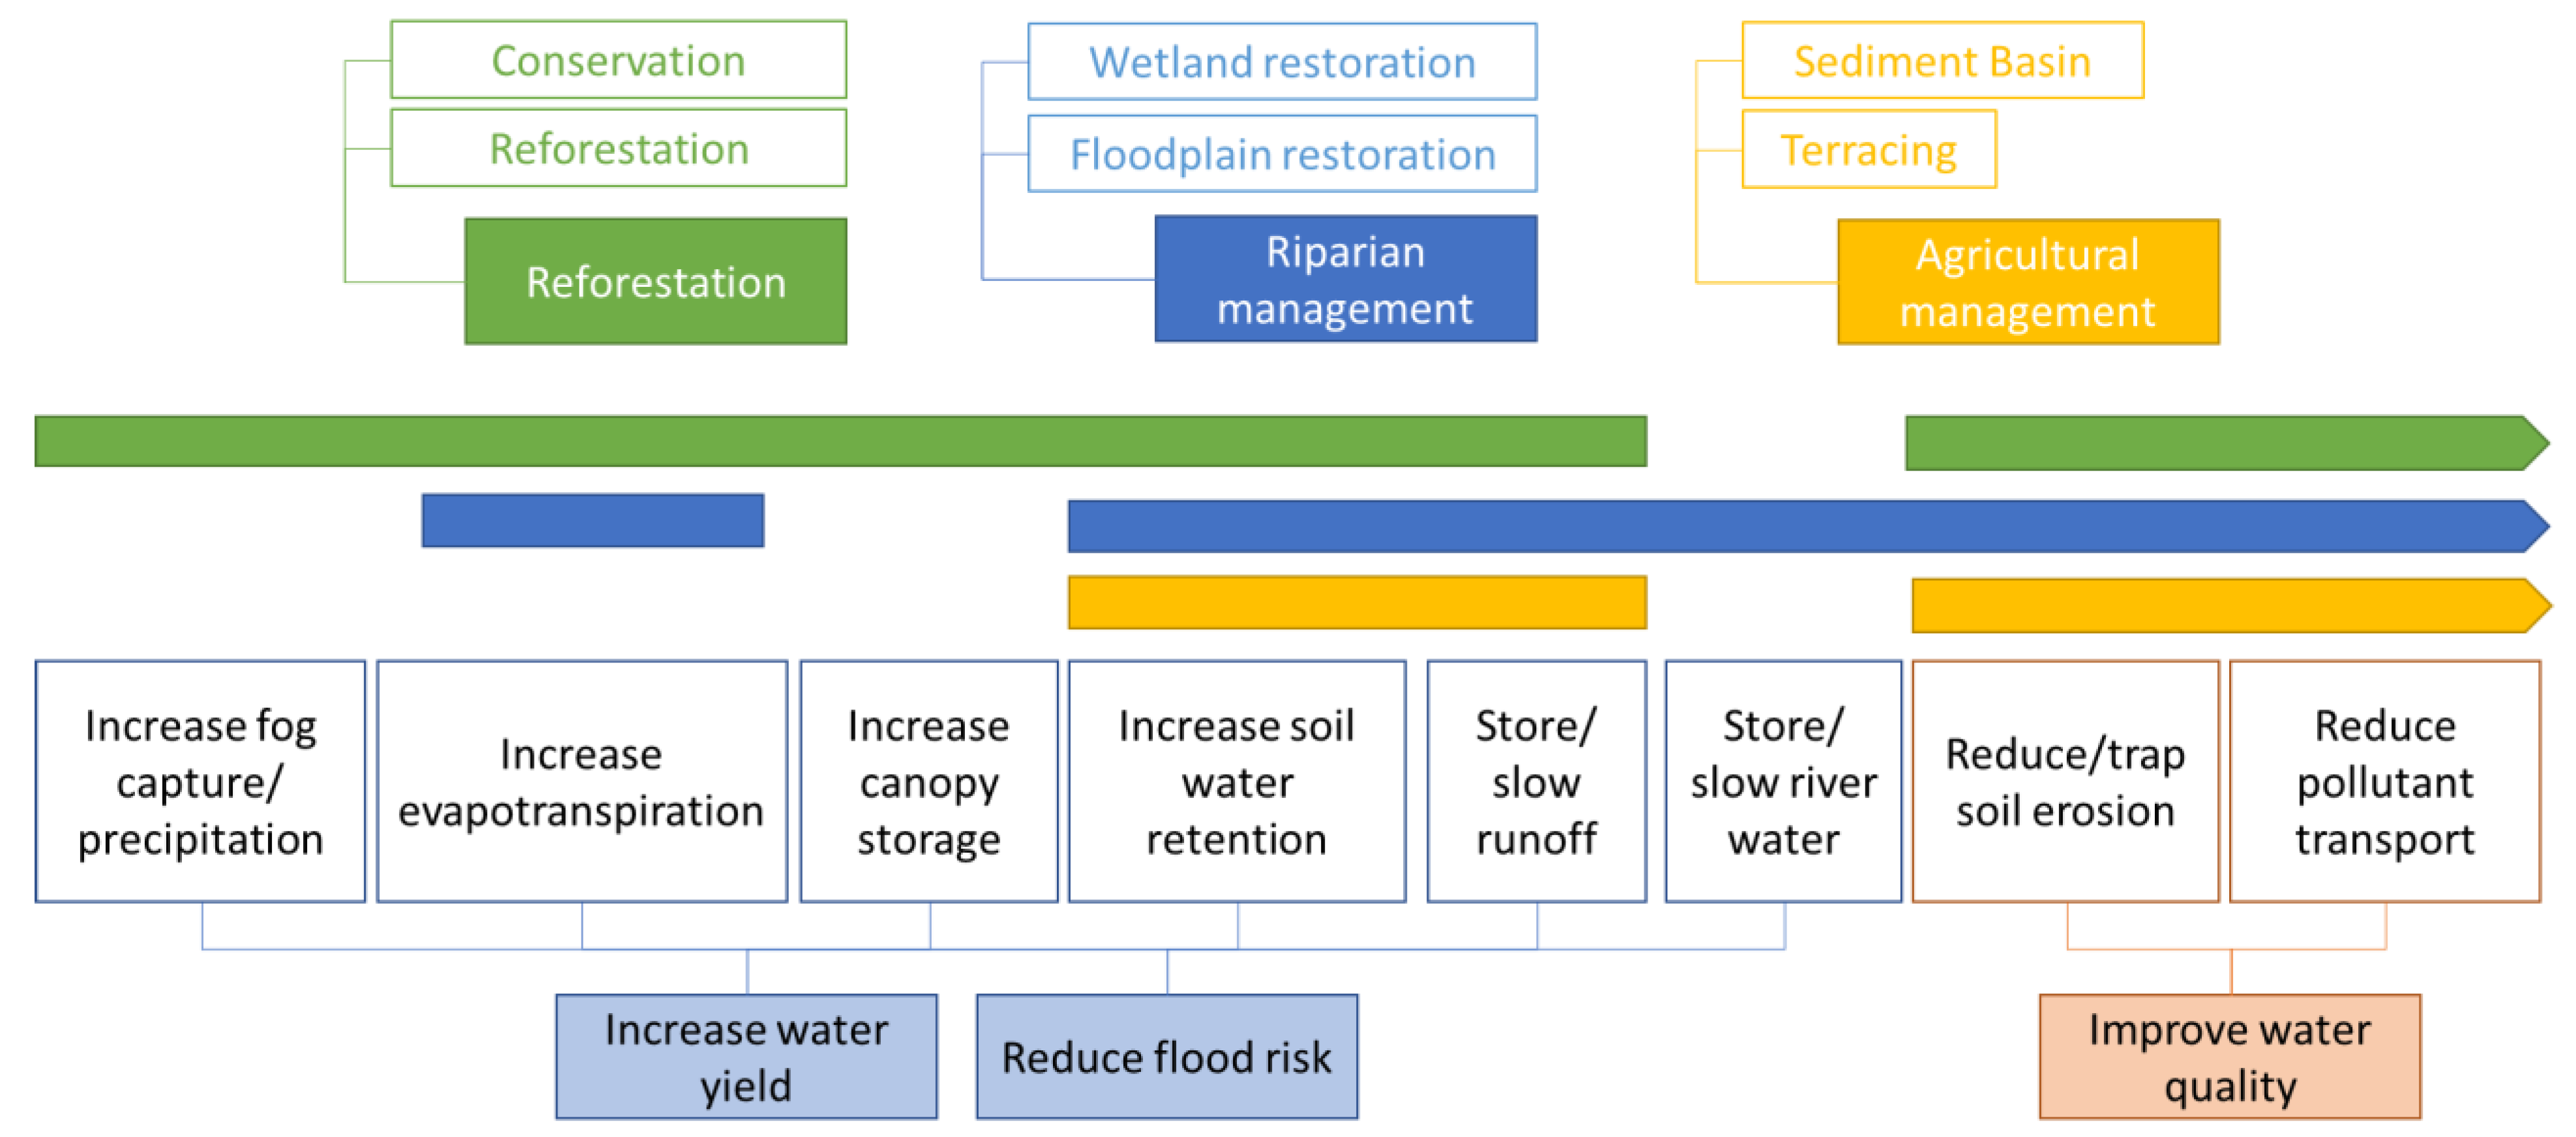
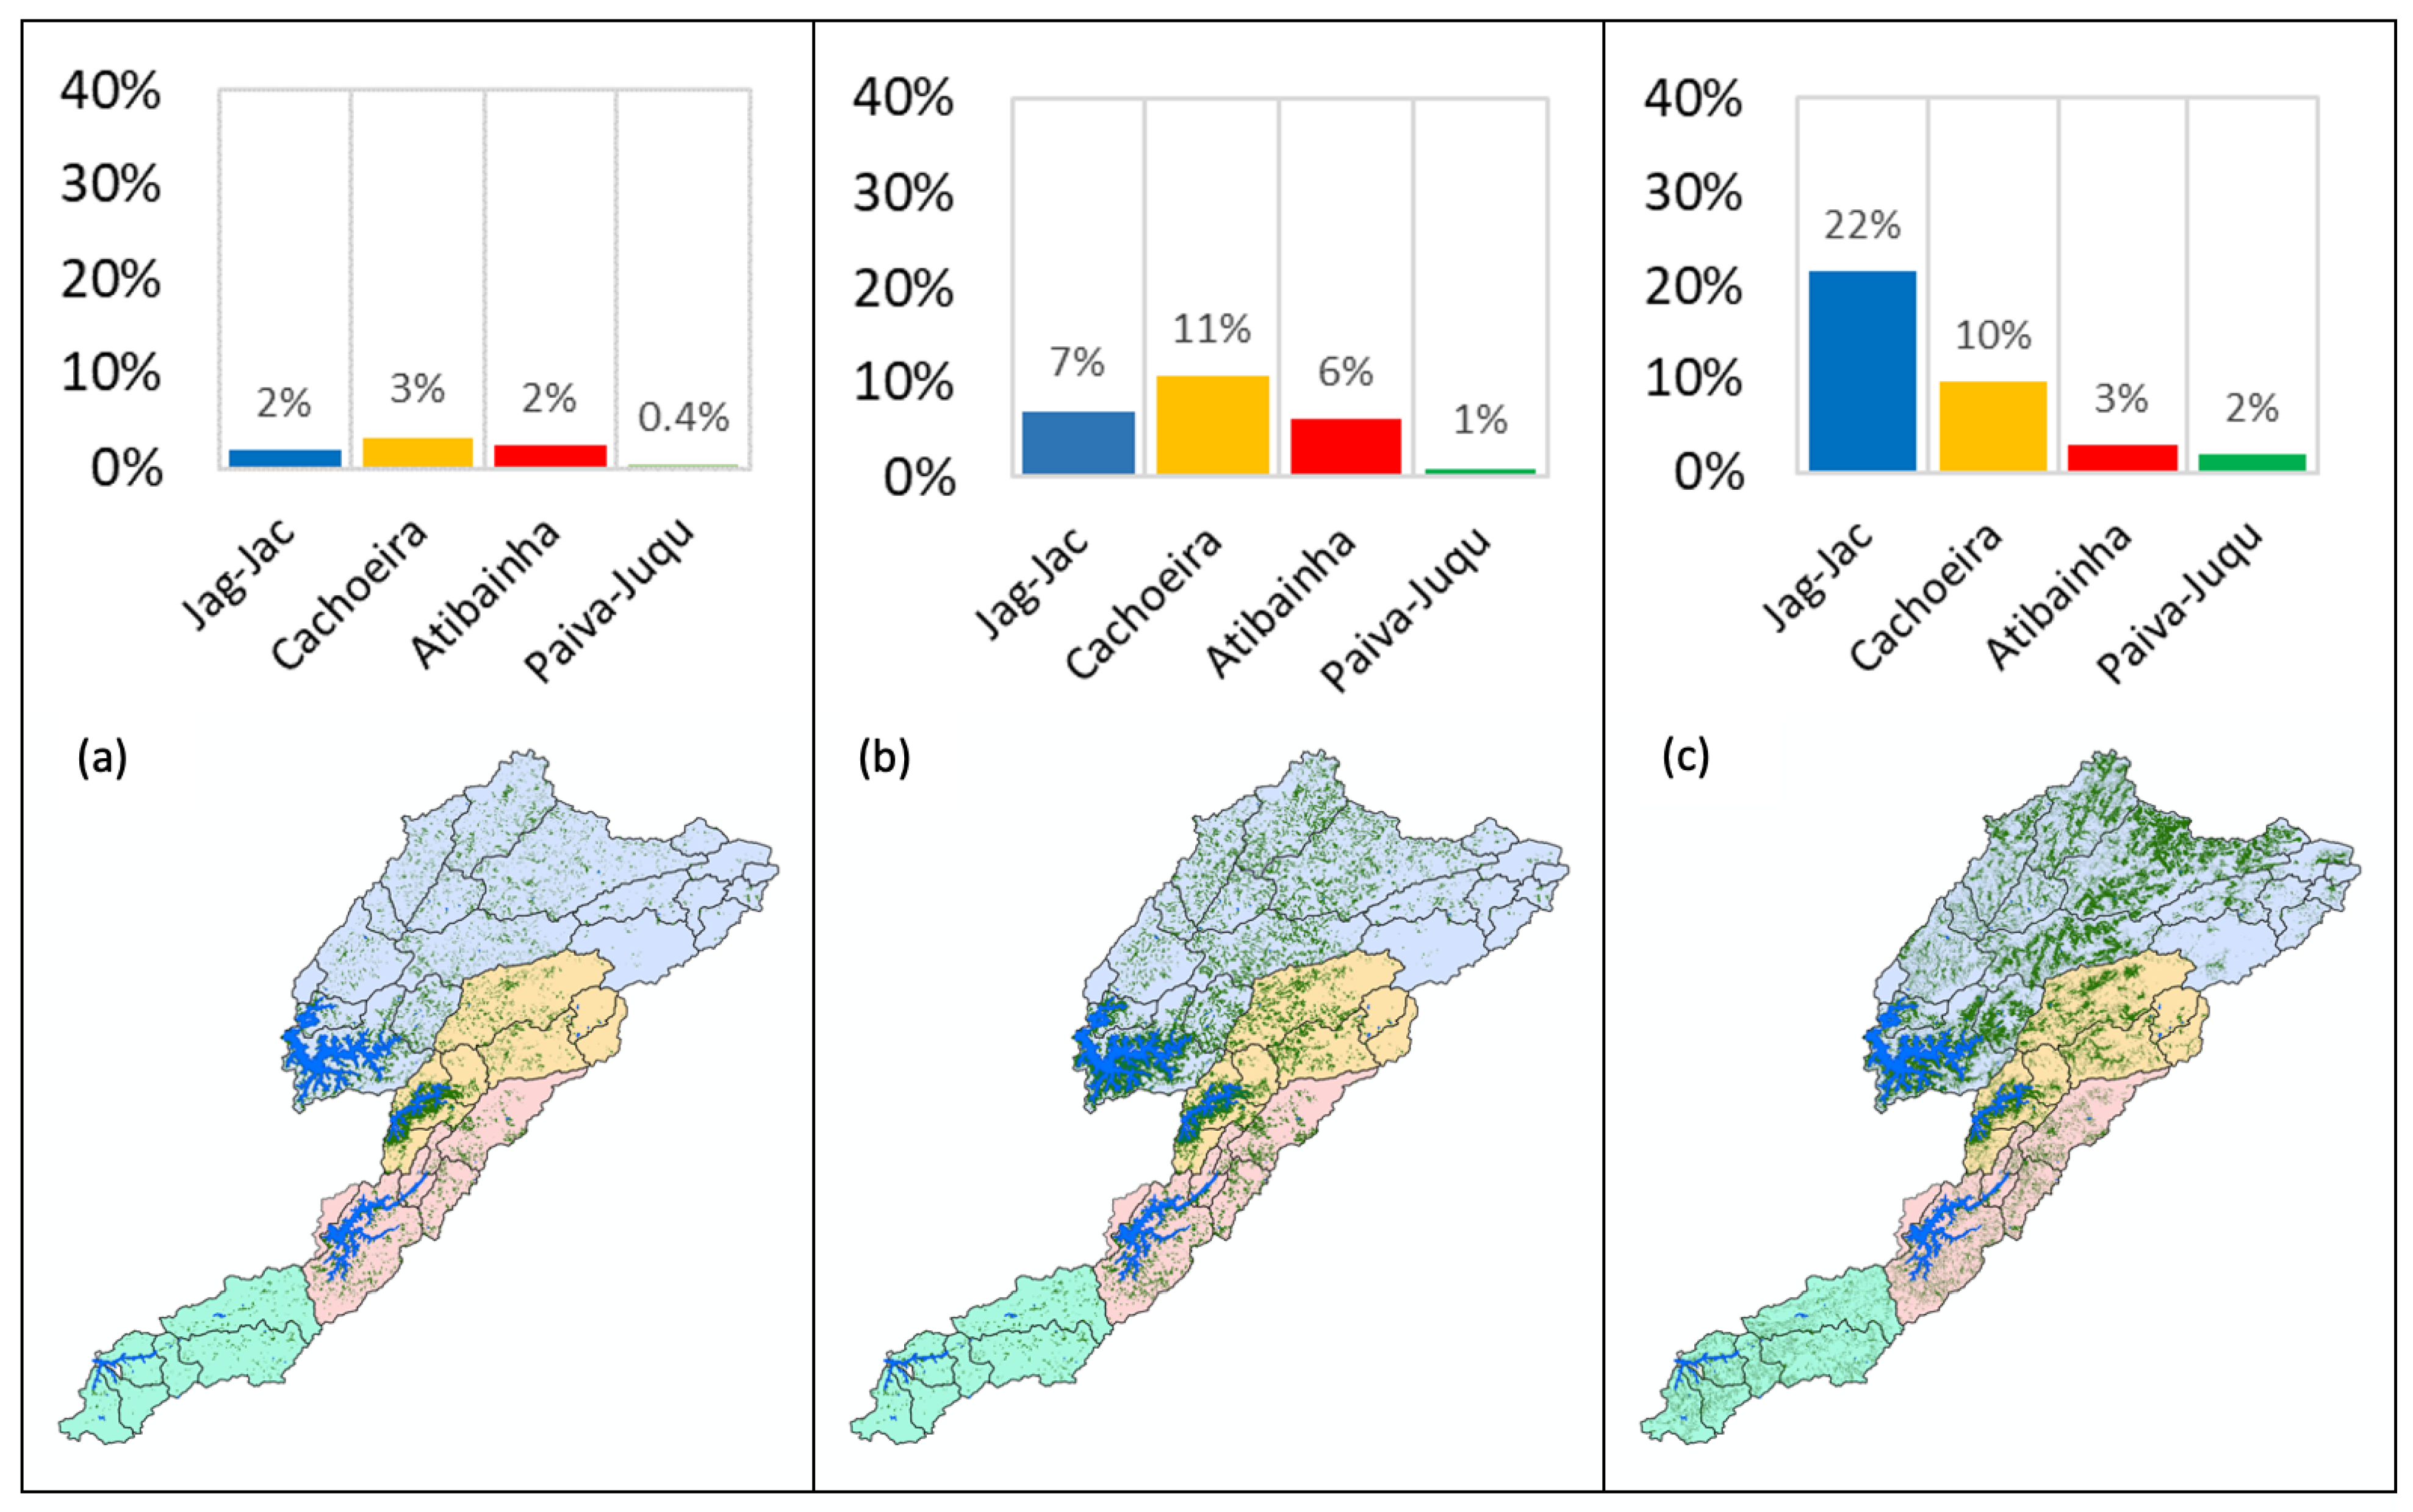
2.2.2. Landscape Management Scenarios
- (1)
- Minimum Intervention (MI): Although this study is not related in any way to enforcement of the Brazilian Forest Code, the legal definition of Permanent Protected Areas (APP), defining riparian areas and springs buffers for protection, has been used to define this scenario. Restoration of riparian buffer zones in pastures ranges from 5 m for small proprieties to 15 m for larger properties, plus a buffer zone of 500 m around the reservoirs managed by SABESP. The purpose of this scenario is to explore the hydrological benefits of basic legal compliance standards in the CWSS.
- (2)
- Enhanced Intervention (EI): The enhanced intervention scenario follows the same logic as the minimum intervention scenario but with greater riparian buffer protections, ranging from 30 m to 50 m, plus the 500 m buffer protection around reservoirs.
- (3)
- Customized RIOS scenario (RIOS): To include a case that prioritizes areas for maximizing infiltration and baseflow given the geophysical characteristics (climate, topography, soil type, and underlying geology), we used the Resource Investment Optimization System (RIOS), designed by The Natural Capital Project, to map and define the extent of this scenario.
2.2.3. Environmental Simulation Models
- (1)
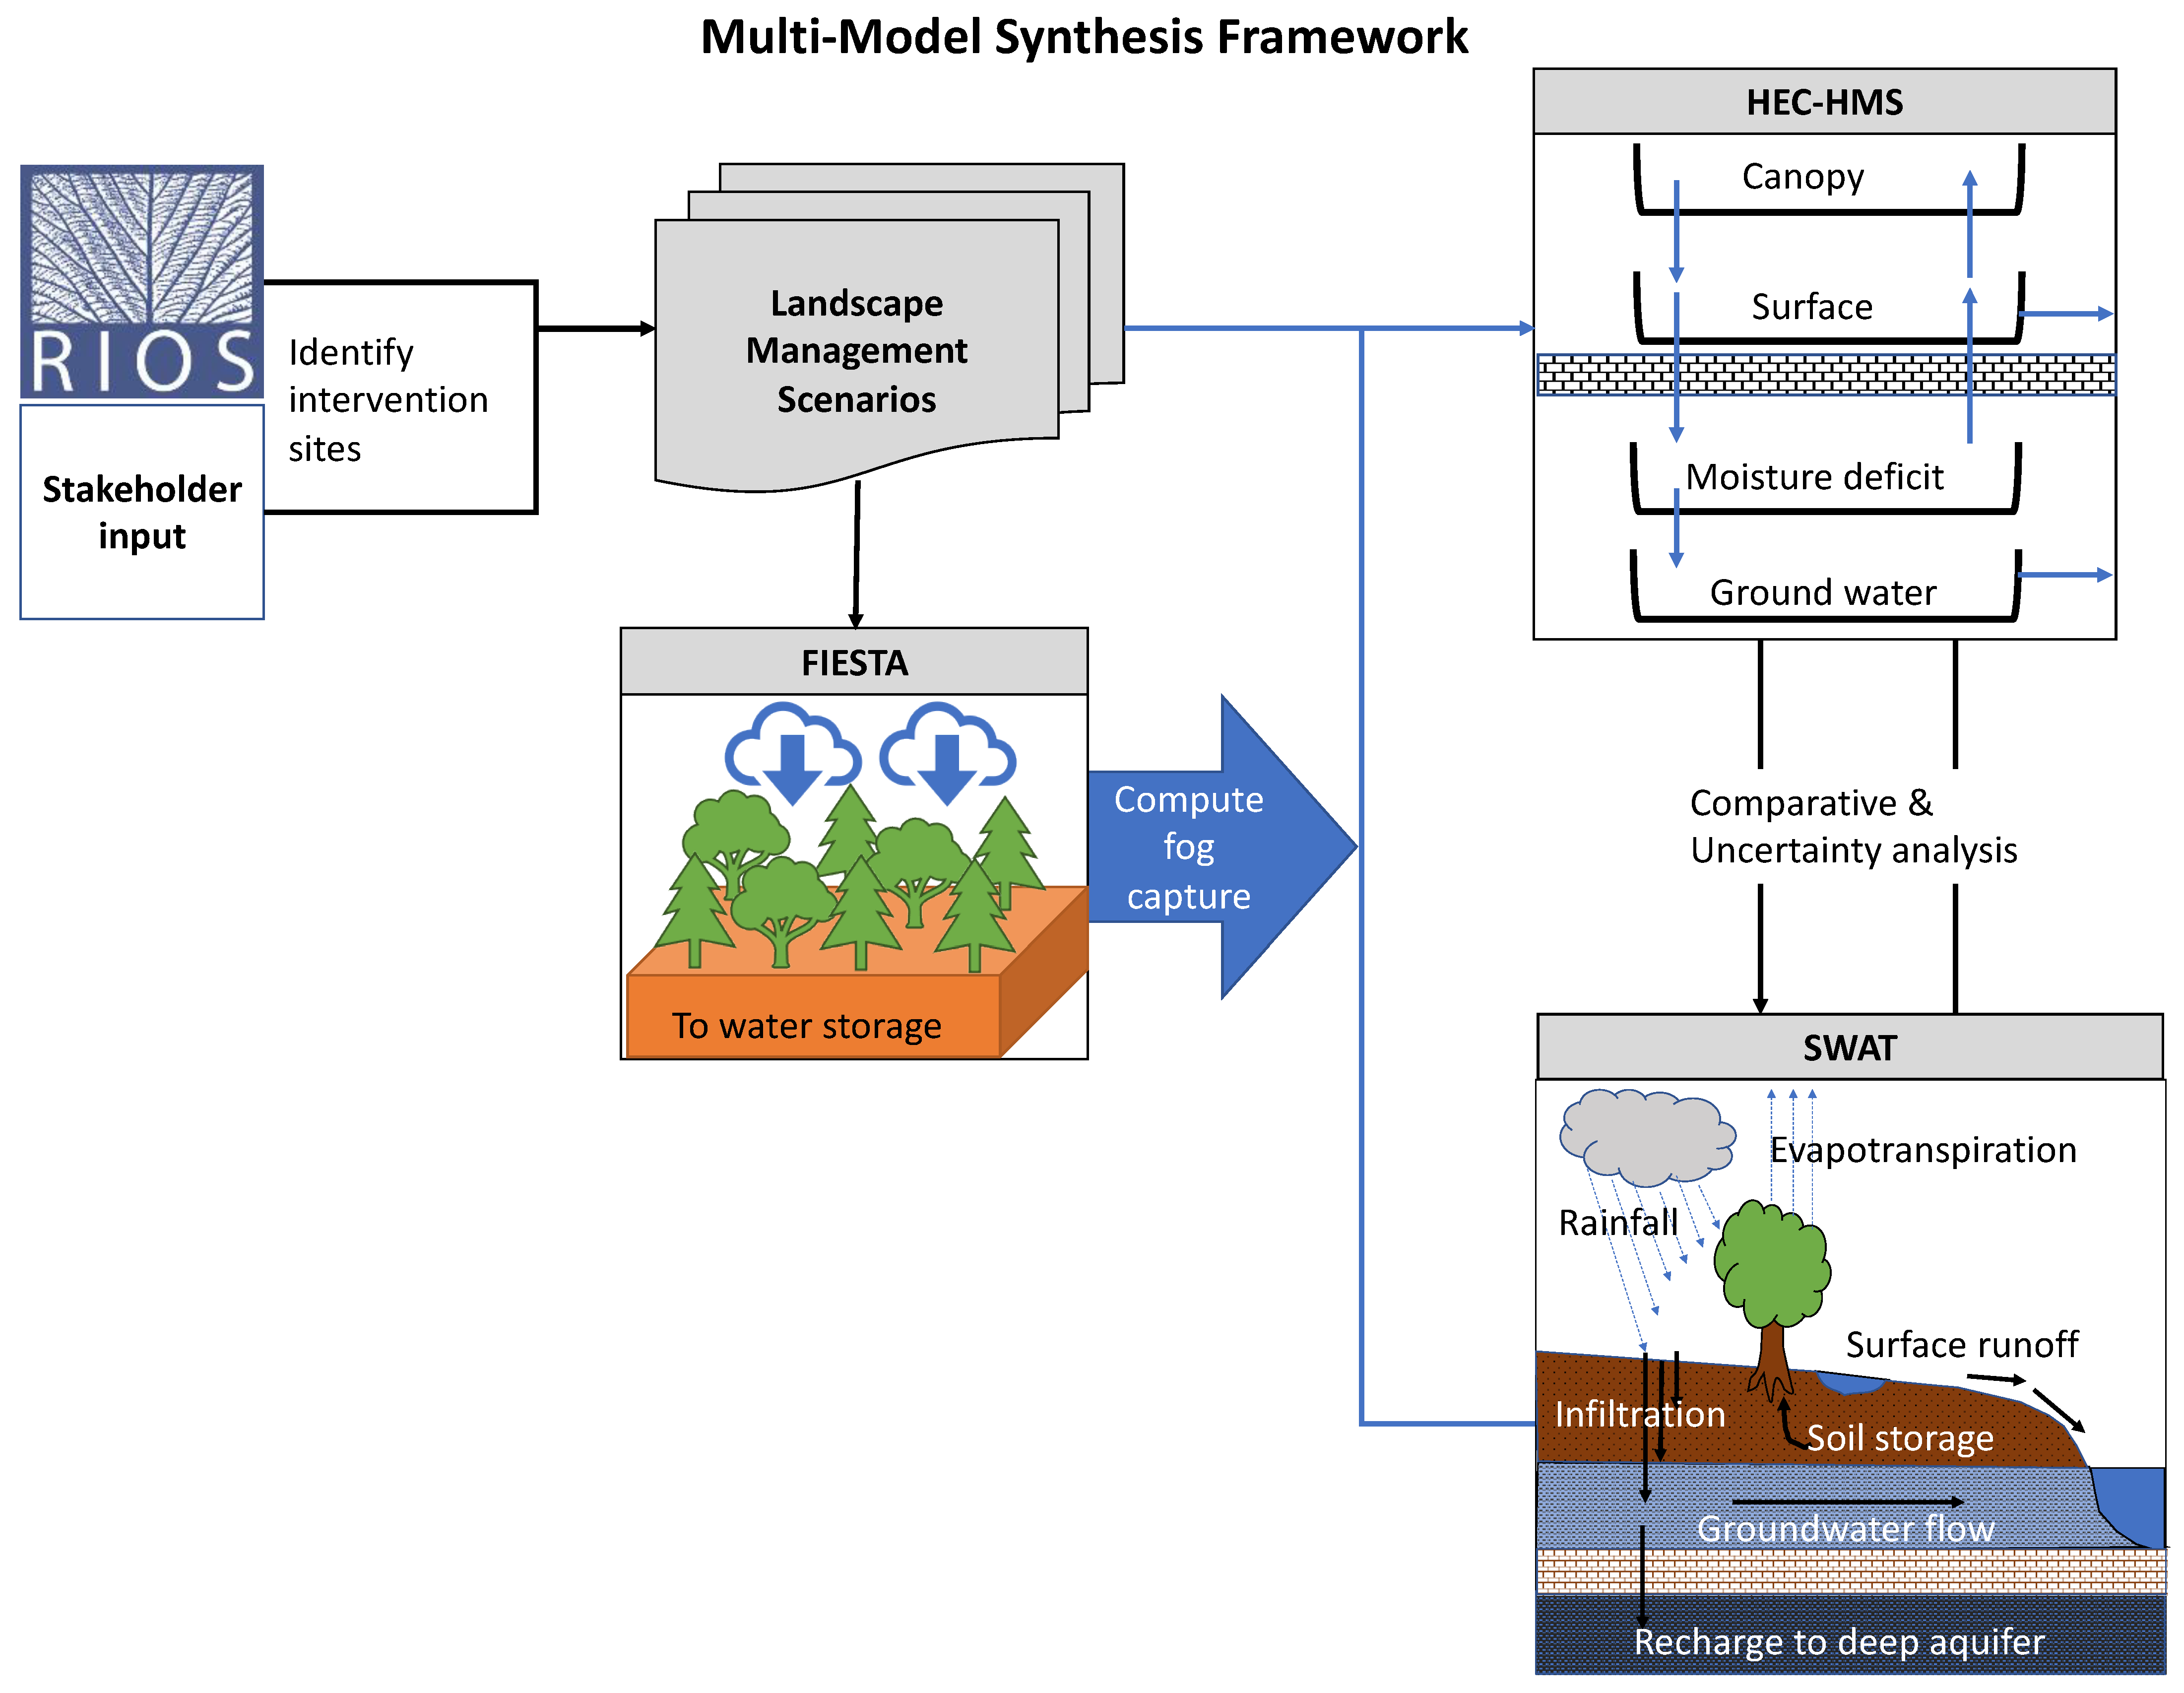
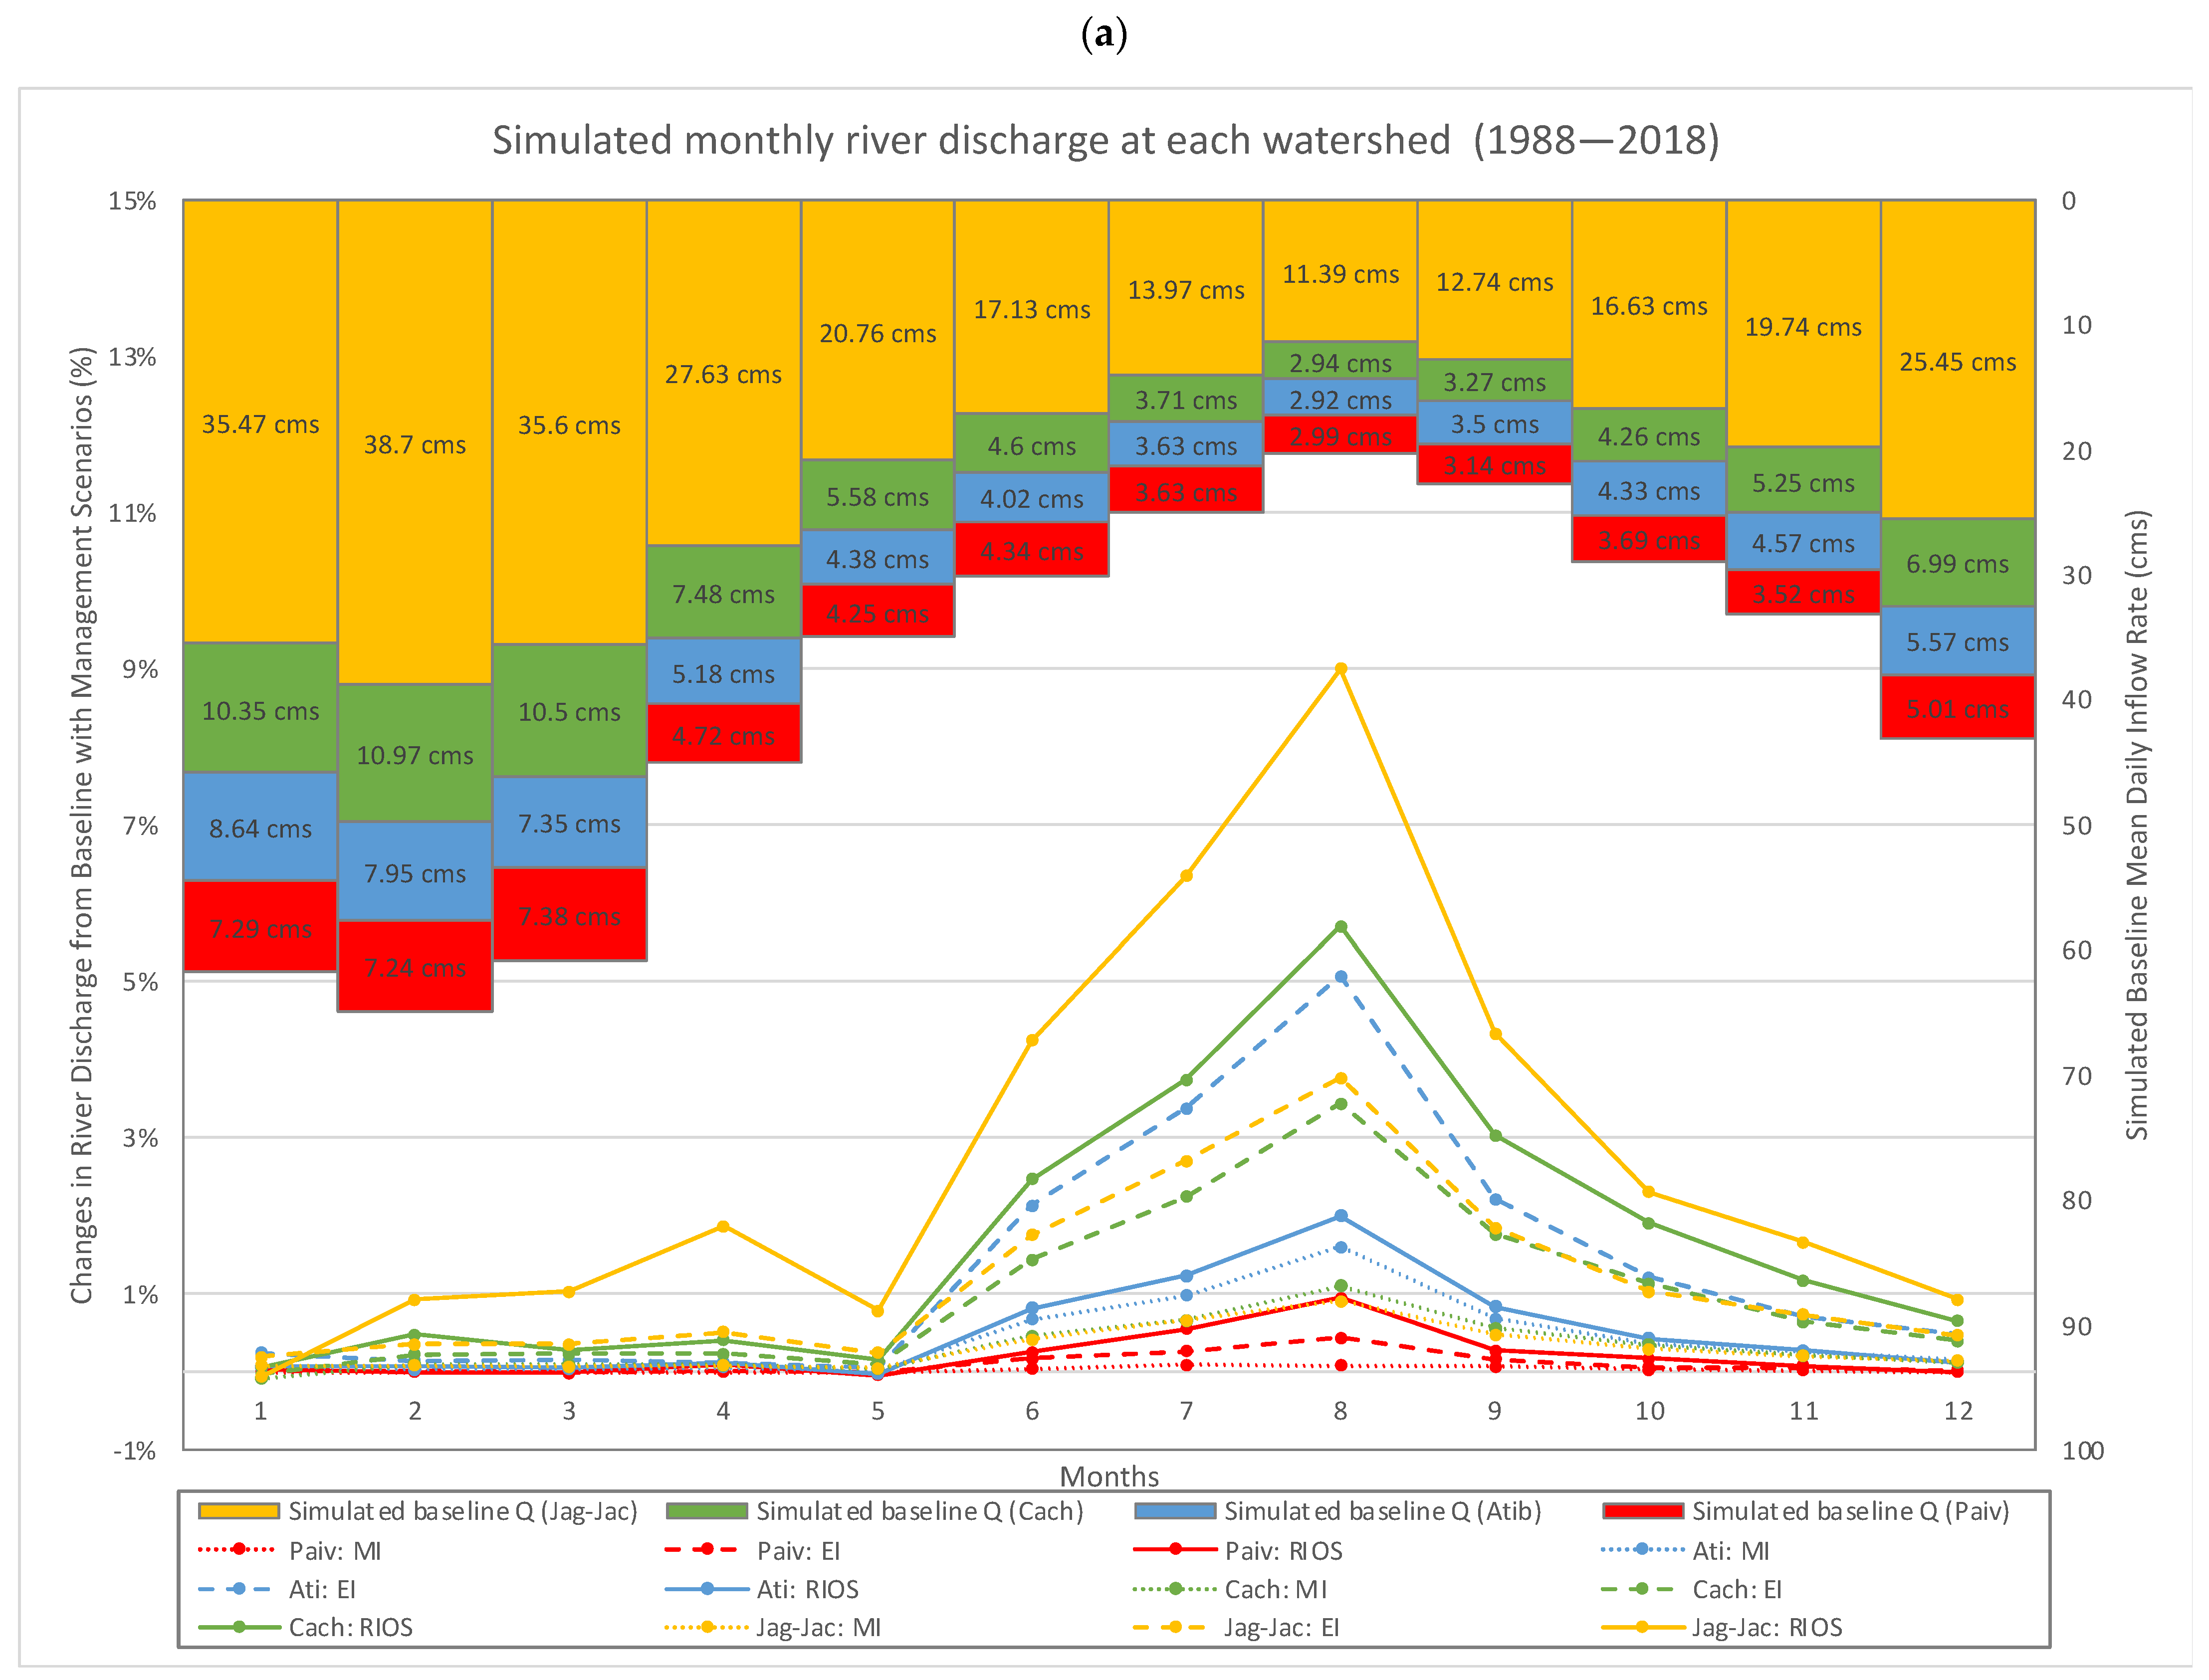
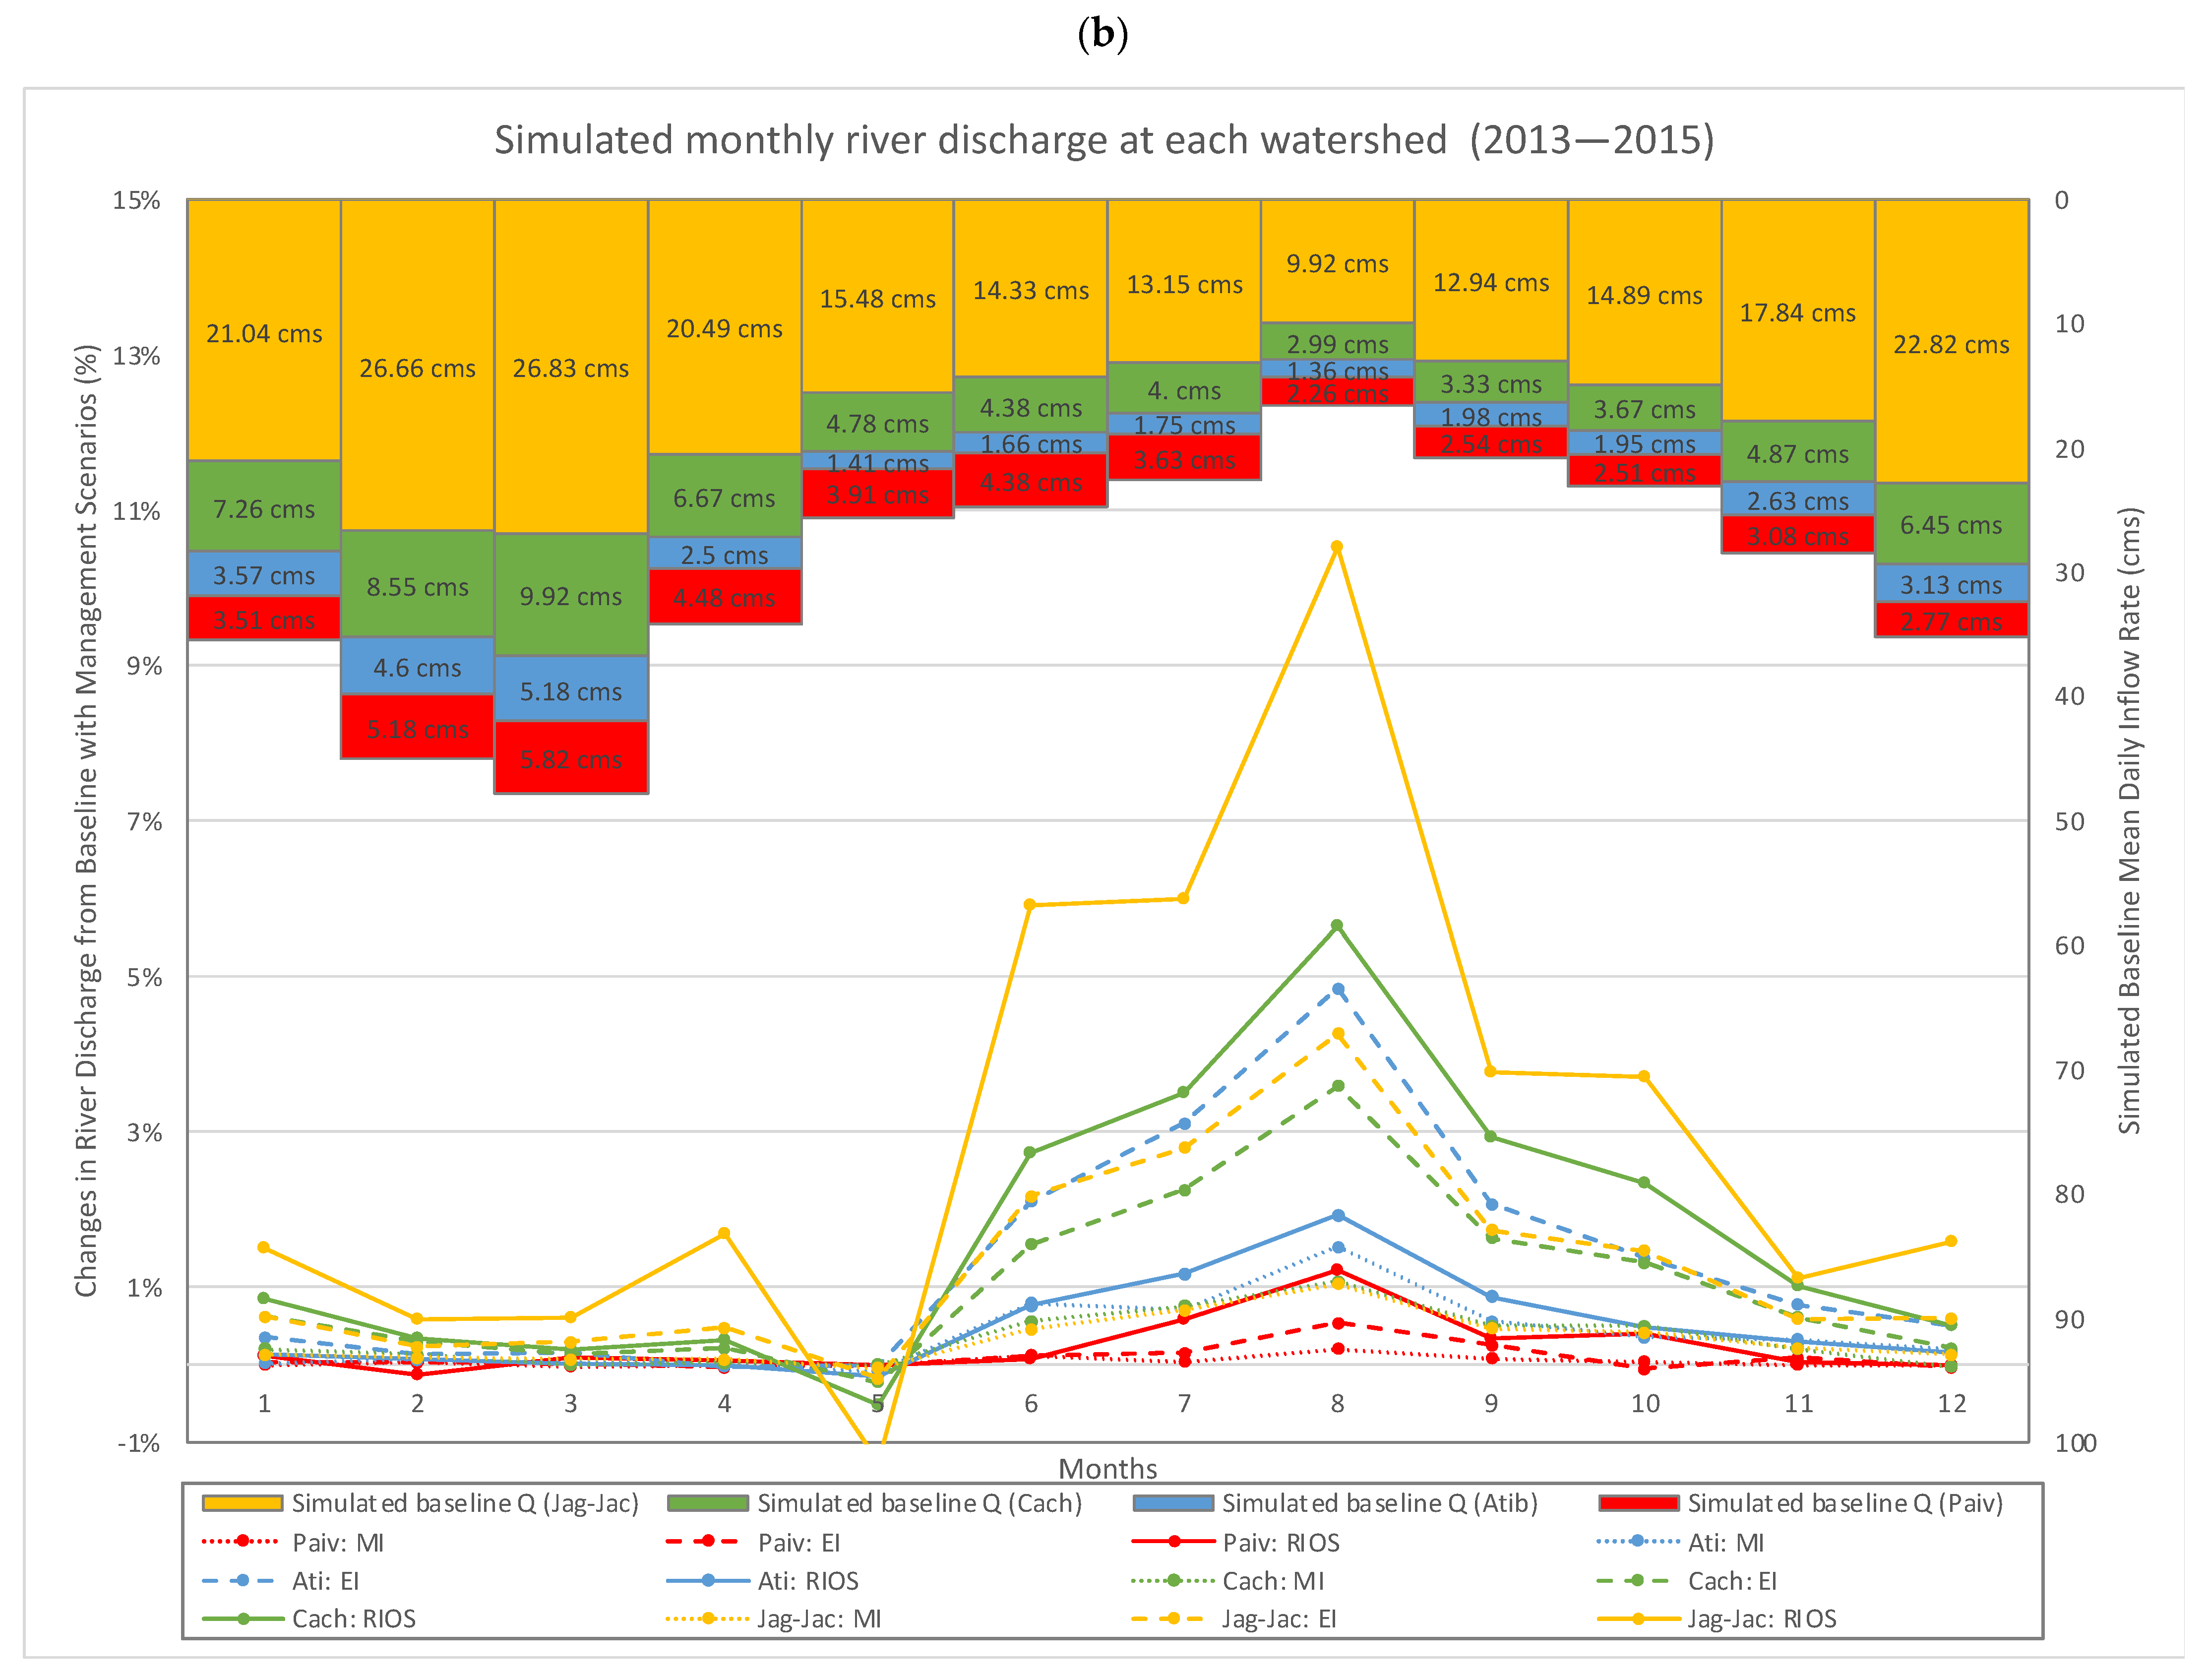
- Resource Investment Optimization System (RIOS): Developed by the Natural Capital Project (NatCap), RIOS is a spatial modeling tool designed to prioritize areas in watersheds to optimize investments for multiple benefits so as to protect clean water supplies, mitigate flood risks, and contribute toward biodiversity and social goals [17]. RIOS integrates biophysical, social, and economic data to screen the landscape areas, and we used the land-use/land-cover, topography, surficial geology, canopy cover, and climate data to map the locations in the CWSS that would maximize distributed storage of water in the soil columns and vegetations across the watershed (i.e., customized RIOS scenario).
- (2)
- Fog Interception for the Enhancement of Stream-flow in Tropical Areas (FIESTA): FIESTA is a hydrological model that quantifies hydrological fluxes contributed by fog interception in a watershed and is used to quantify the potential water balance gains for each landscape management scenario [18]. Fog interception is an additional input to water balance when forest captures cloud water that would otherwise pass over the watershed. Additional water from fog capture can play an integral role in biological process as a part of the hydrological cycle in those regions where recurrent dry season creates drought conditions. To estimate this parcel of fog water for each management scenario, FIESTA model was used to map those areas with high potential for fog capture, compute fog capture potential using topographic, land-cover, and climatic data, and allocate the amount for those areas covered in the scenarios.
- (3)
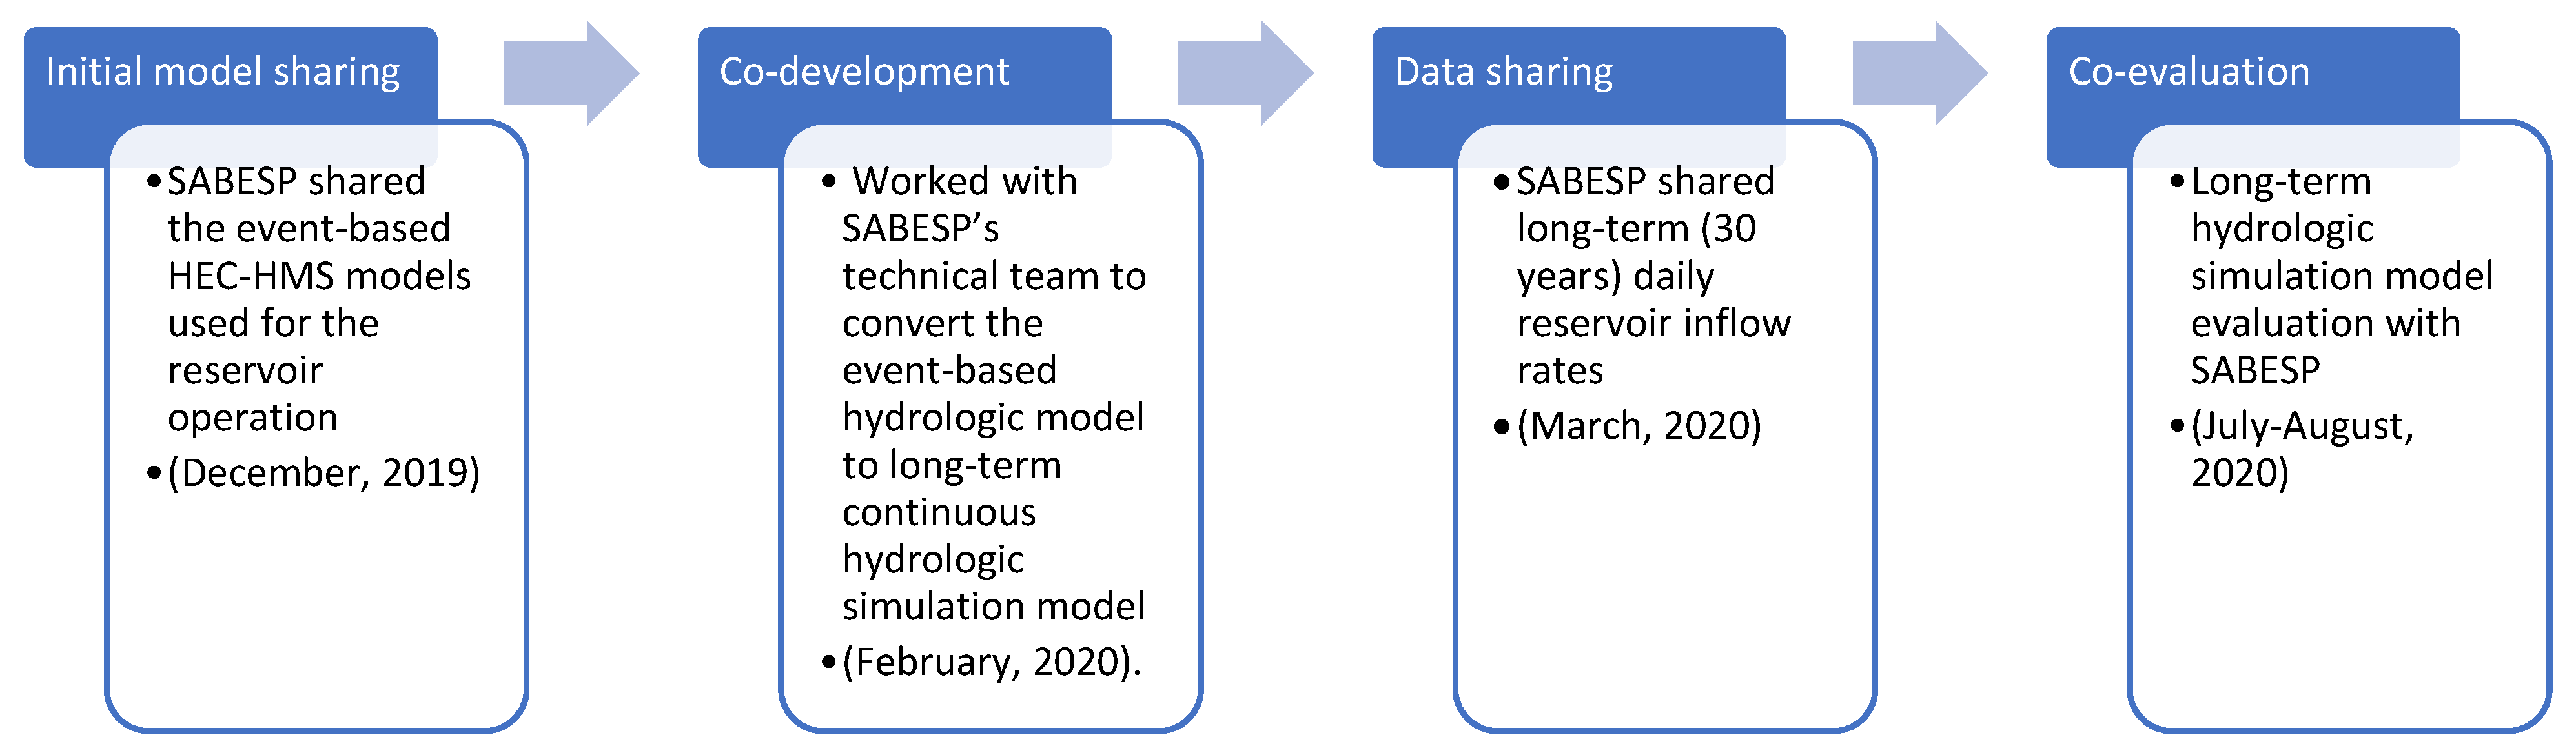
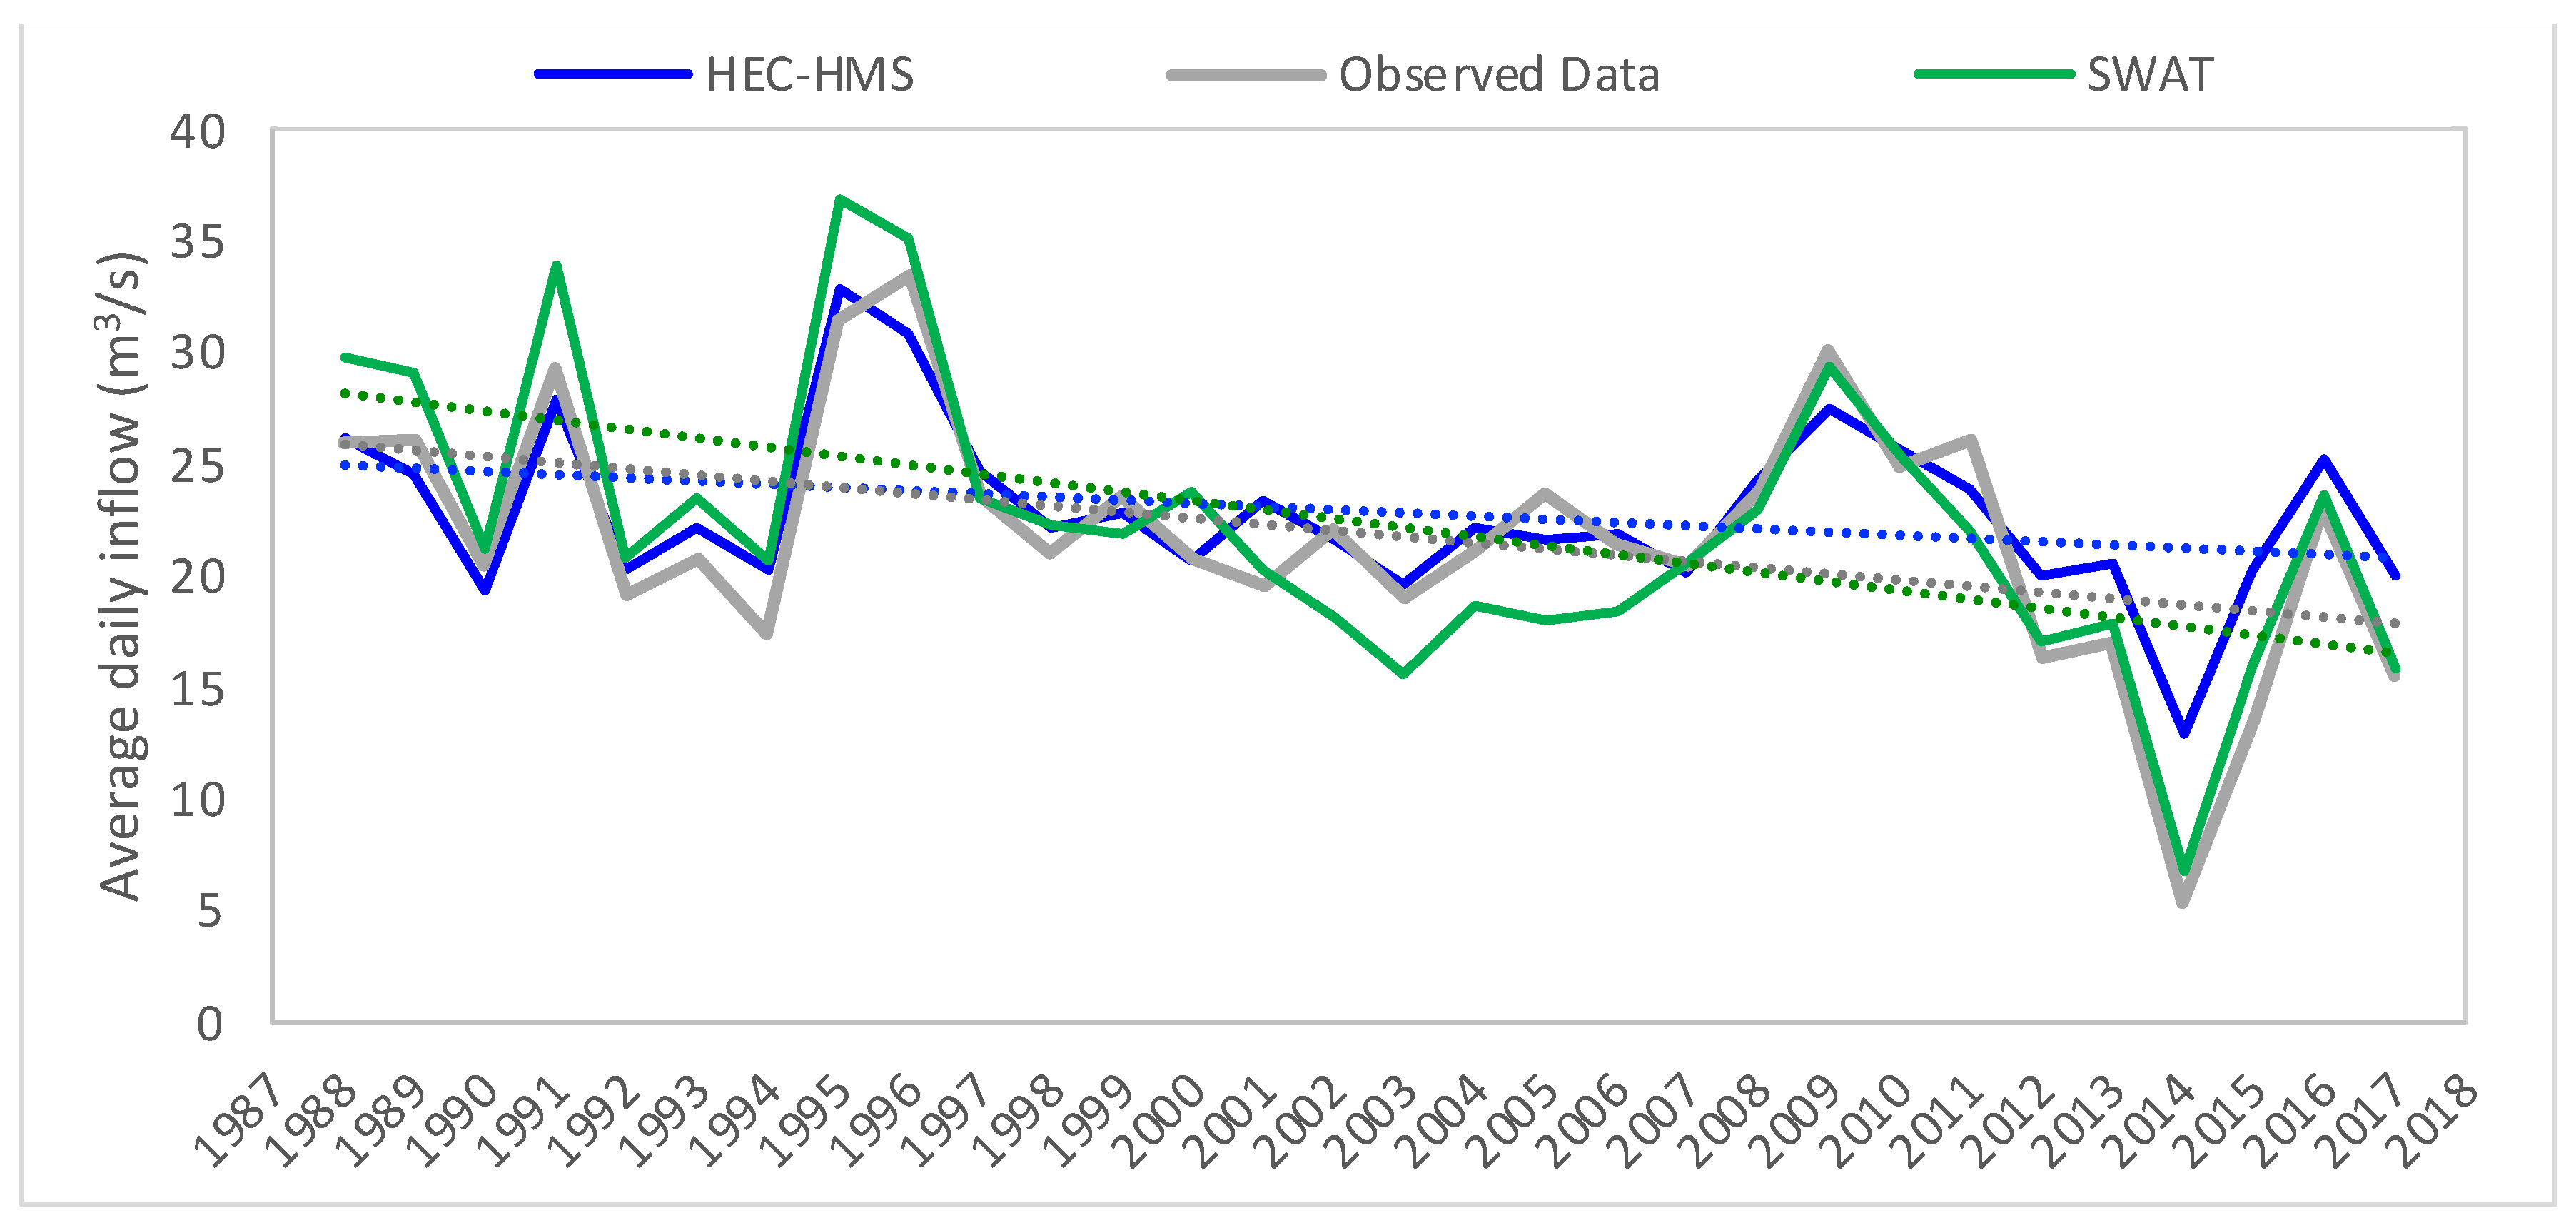
- Hydrologic Engineering Center-Hydrologic Modelling System (HEC-HMS): HEC-HMS was originally used by SABESP to simulate event-based (~12–24 h) surface runoff given precipitation, hydrologic network, and reservoir water level data. During the February 2020 workshop with SABESP, we began the process of converting the existing model for long-term continuous hydrologic simulations—a model that simulates both wet and dry weather behaviors—by adapting the Soil Moisture Accounting (SMA) algorithm. We developed four independent models to evaluate individual reservoirs. Subsequently, we identified data need for the long-term hydrologic simulation and worked with SABESP to obtain them. When the long-term hydrologic simulation model setup was completed, we worked with SABESP’s engineering team to calibrate, validate, and evaluate the model framework, input data, and outputs (Figure 6). For further details on model structure and computational algorithm, refer to Acosta et al. [6].
- (4)
- Soil and Water Assessment Tool (SWAT): SWAT is a semi-distributed and continuous hydrologic simulation model that includes multiple hydrologic and water chemistry processes [19]. Compared to HEC-HMS, SWAT operates over more detailed and spatially explicit watershed information and hydrologic processes. SWAT uses geospatial attributes, such as soils, land-use/land-cover, topography, and crop management parameters, to predict the response of climatic inputs in the system. We used SWAT to simulate the watershed hydrology and the erosion, transport, and fate of sediment and nutrients. SWAT outputs of water balance simulation are compared to HEC-HMS outputs to assess the general modelling uncertainty and provide additional predictions about water quantity and quality associated with each landscape management scenario. For further details on model structure and computational algorithm, refer to Acosta et al. [6].
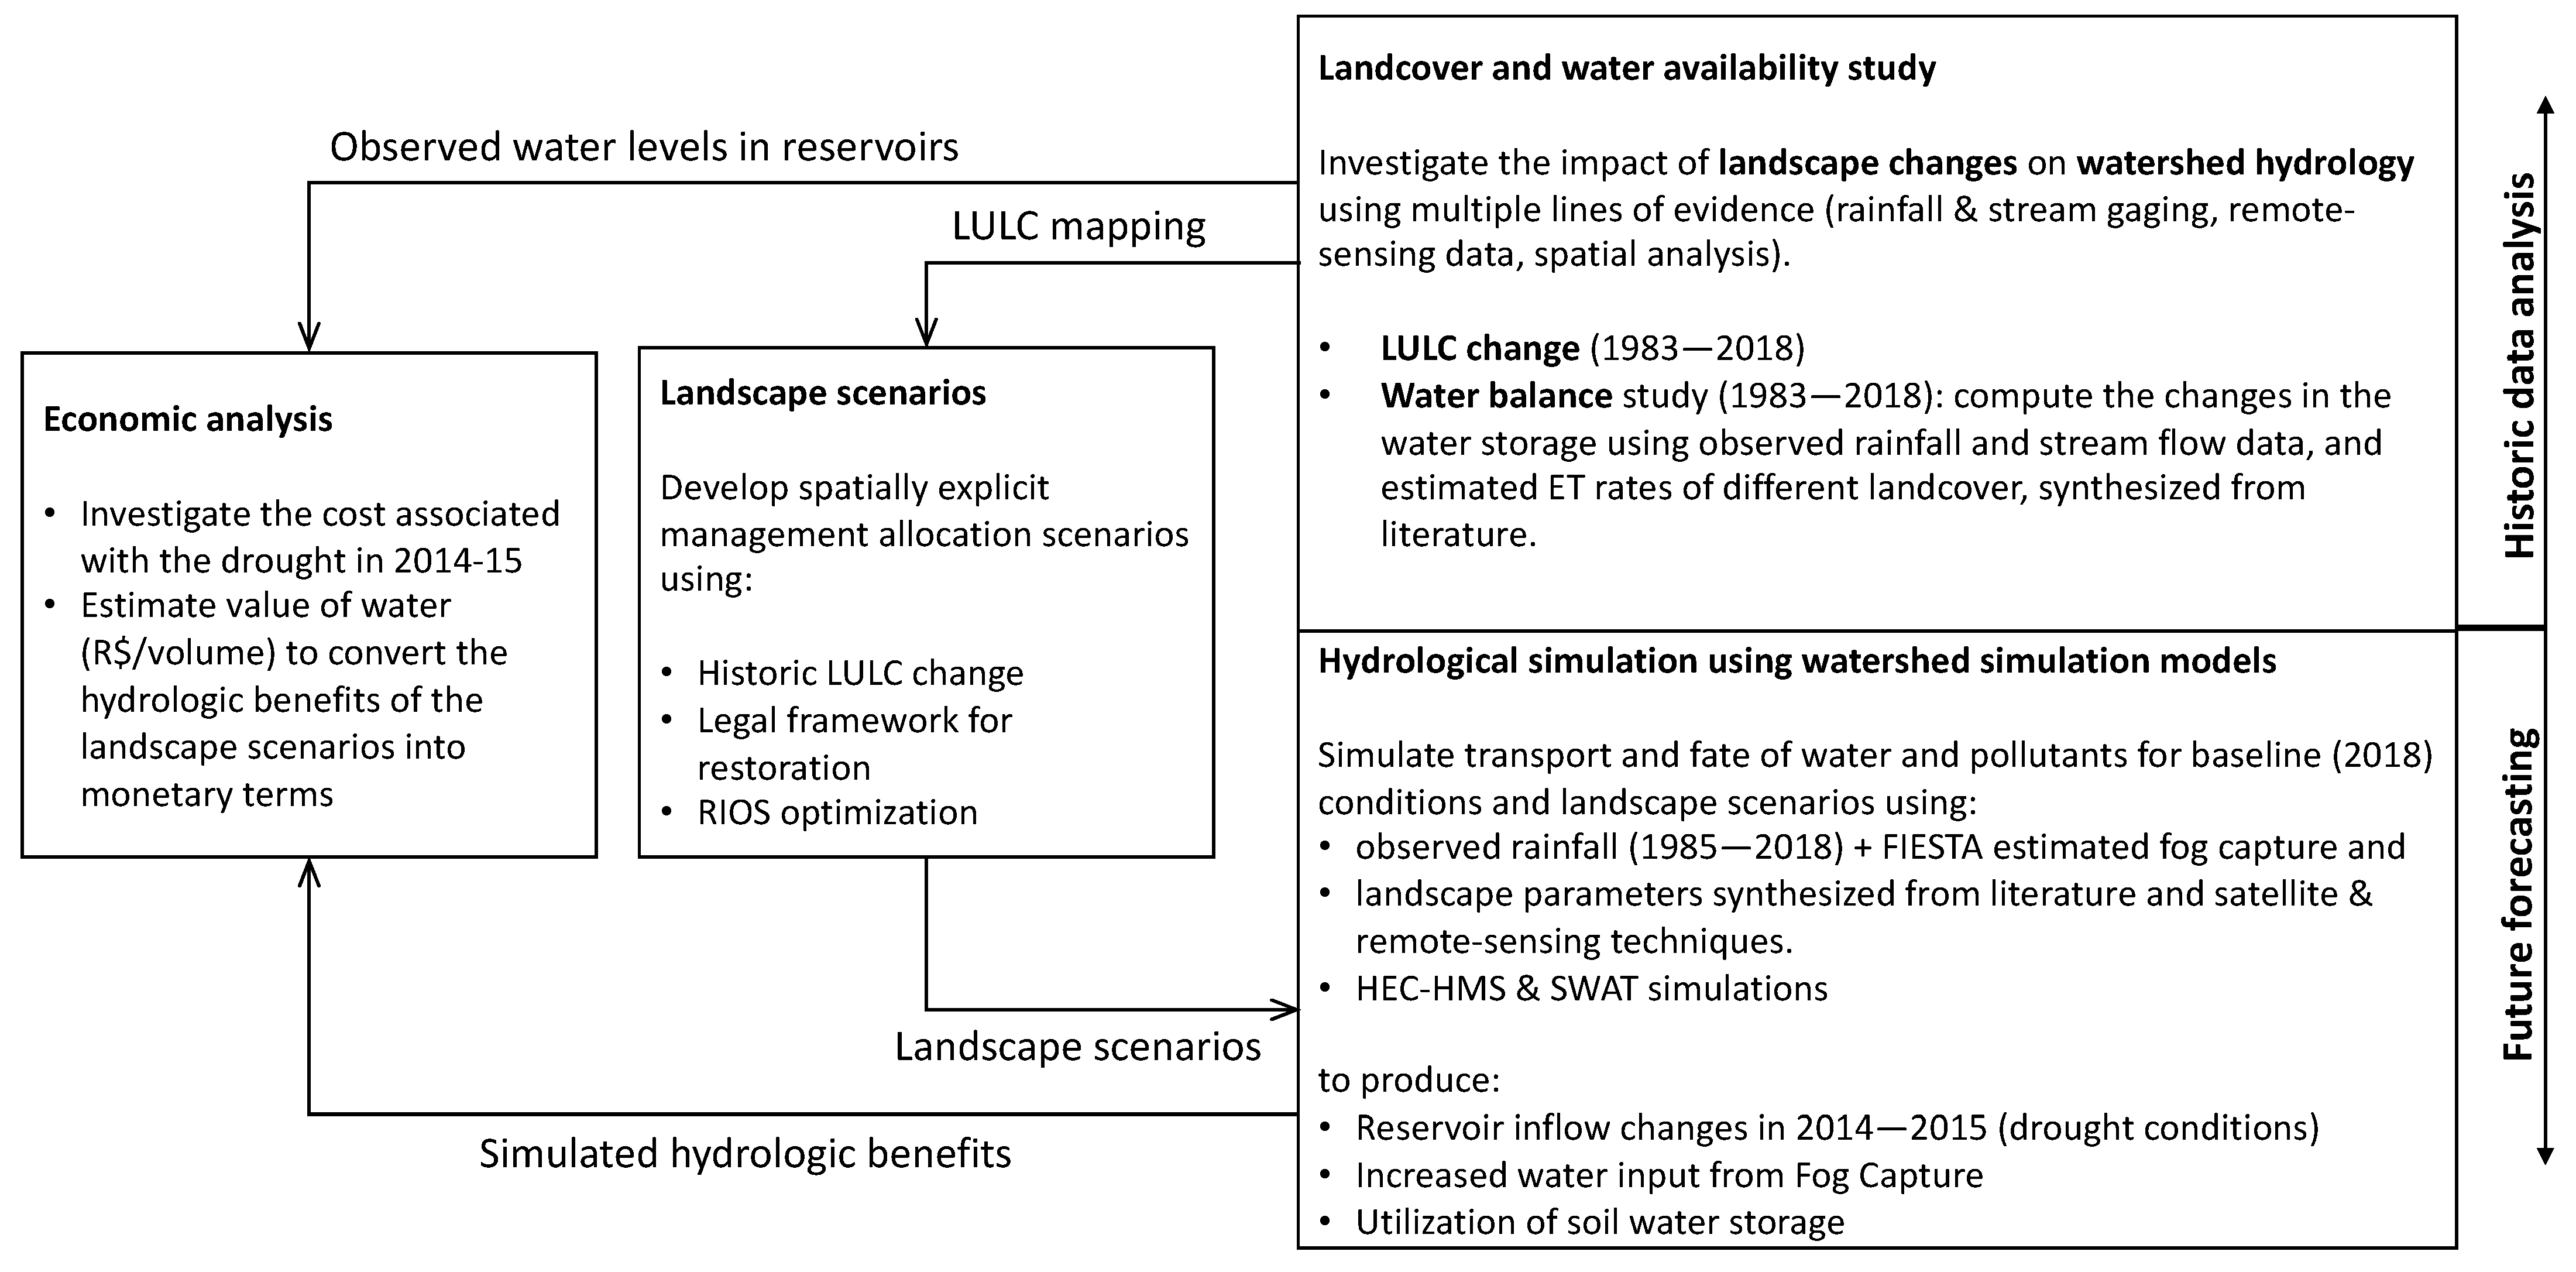
2.2.4. Model Synthesis Evaluation and Intervention Impact Simulation
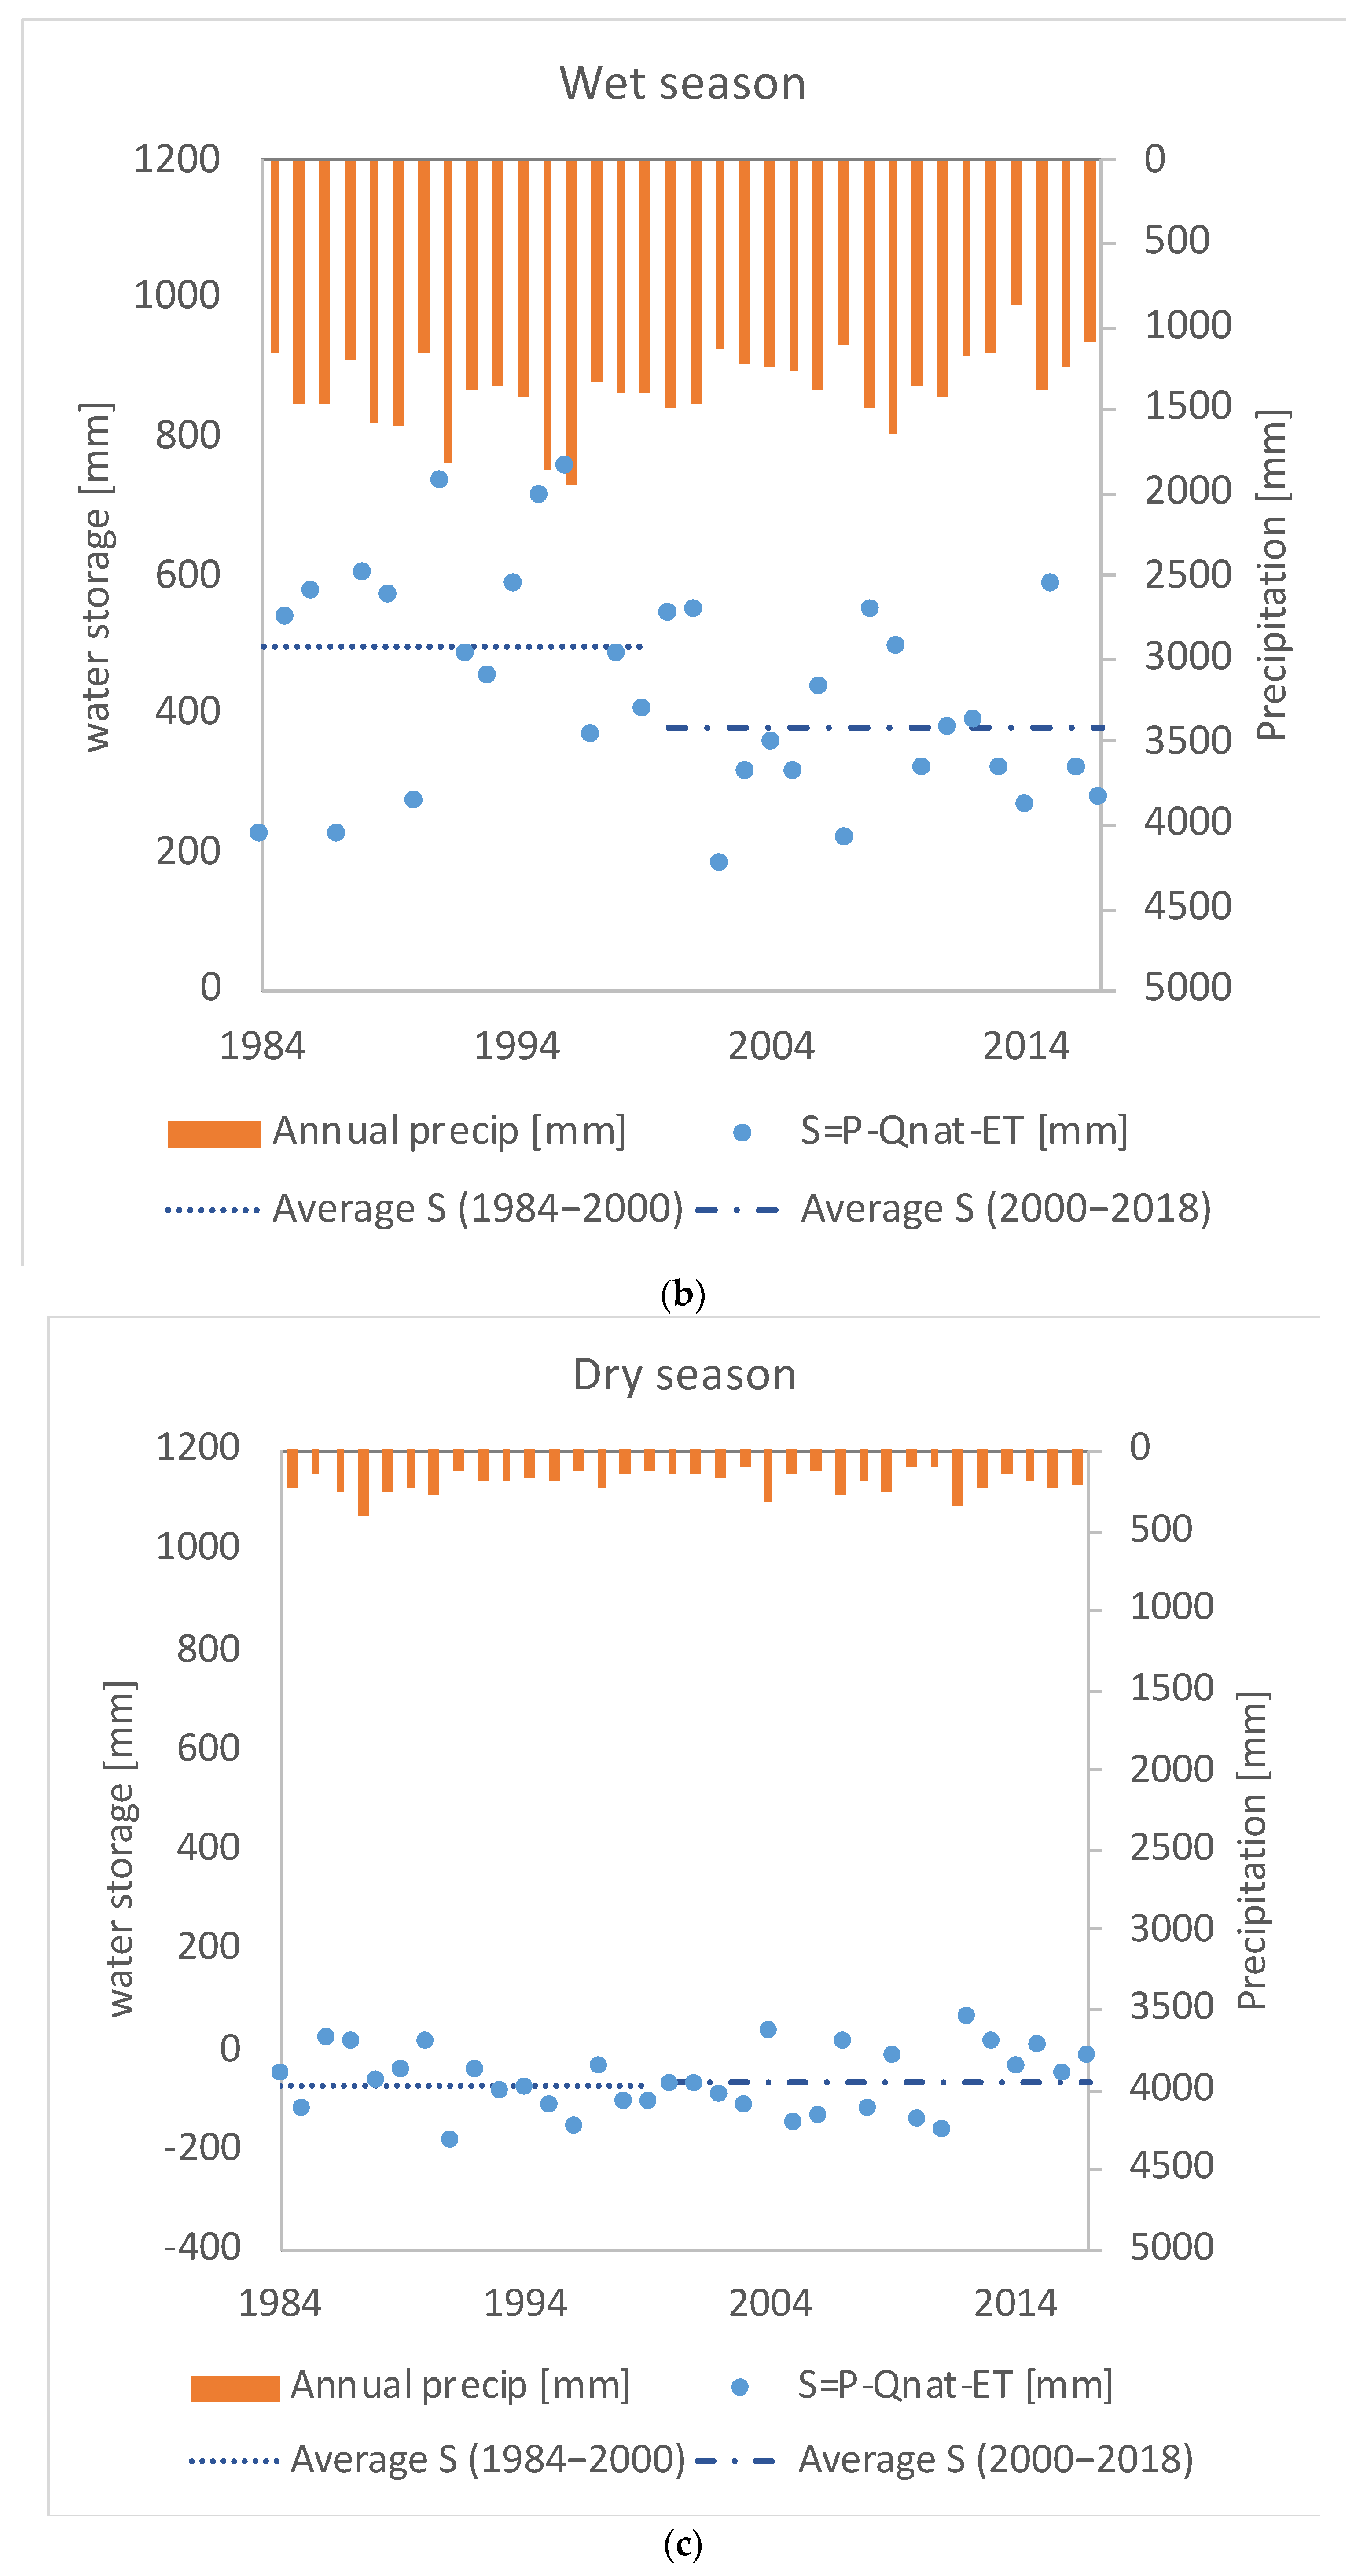
2.2.5. Economic Evaluation of the Cost of Extreme Drought and Value of Ambient Water Storage
3. Results
3.1. Biophysical Simulation Summary
3.2. Economic Analysis Summary
4. Discussion
4.1. Science–Policy Challenges for Achieving Water Security
4.2. Consideration of Collaborative Modeling for Stakeholder Engagement
5. Conclusions
Supplementary Materials
Author Contributions
Funding
Data Availability Statement
Acknowledgments
Conflicts of Interest
Abbreviations
| CWSS | Cantareira Water Supply System |
| IPCC | Intergovernmental Panel on Climate Change |
| NbS | Nature-based Solution |
| GDP | Gross Domestic Product |
| SABESP | São Paulo State Water and Sanitation Company |
| ARSESP | São Paulo State Public Services Regulatory Agency |
| TNC | The Nature Conservancy |
| WRI | World Resources Institute |
| SESYNC | National Socio-Environmental Synthesis Center/University of Maryland |
| PCJ | Piracicaba–Capivarí–Jundiaí Rivers Watershed Committee |
| HEC-HMS | Hydrologic Engineering Center-Hydrologic Modeling System |
| RIOS | Resource Investment Optimization System |
| FIESTA | Fog Interception for the Enhancement of Stream-flow in Tropical Areas |
| SWAT | Soil and Water Assessment Tool |
| SIMA | São Paulo State Secretariat of Infrastructure and Environment |
| PES | Payment for Ecosystem Services |
| LULC | Land-use/Land-cover |
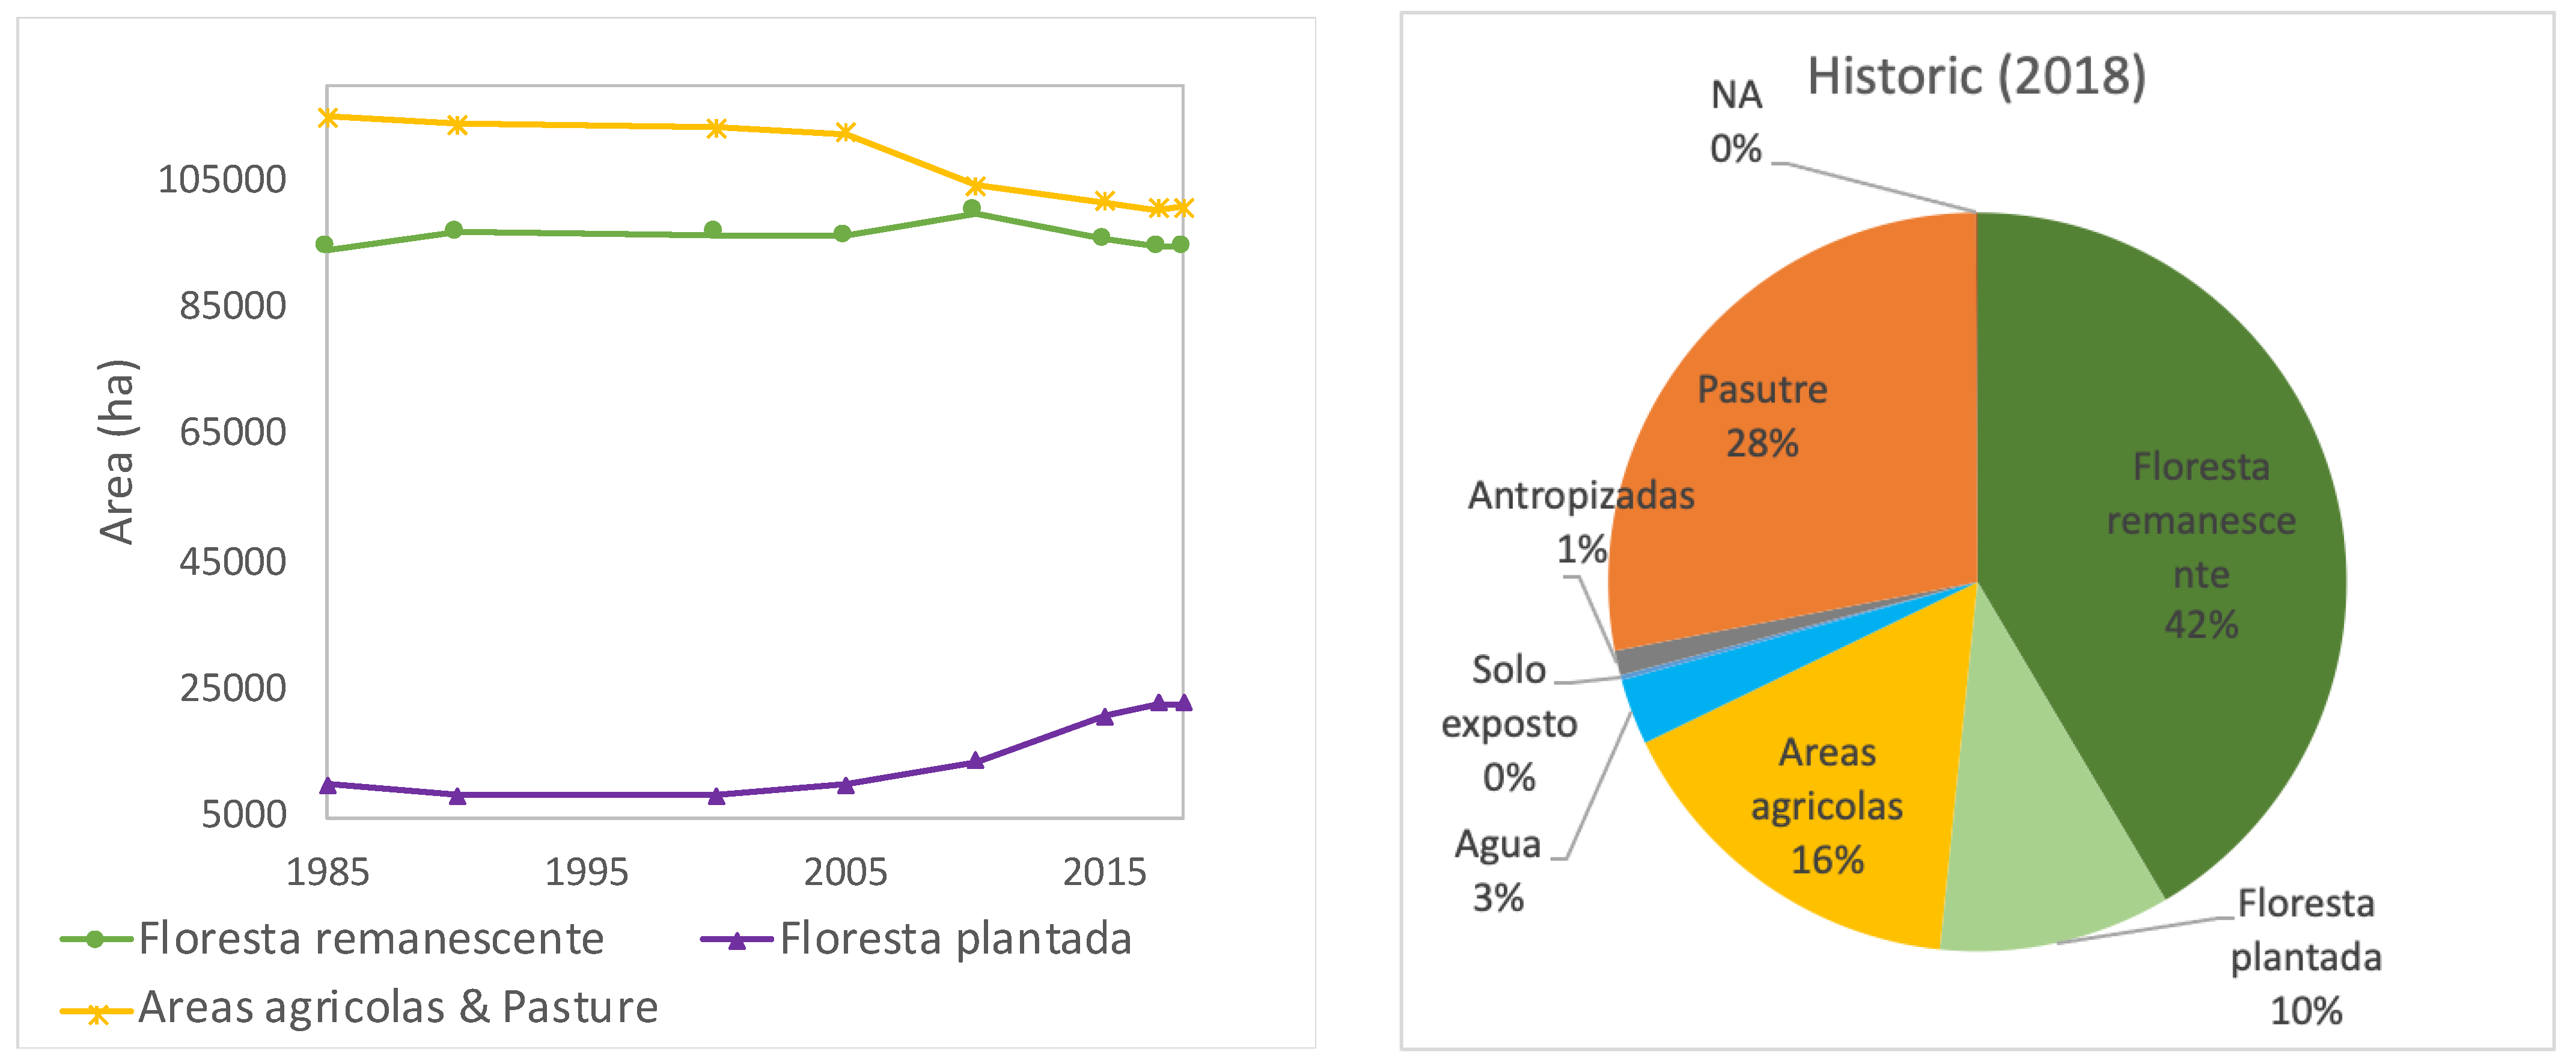
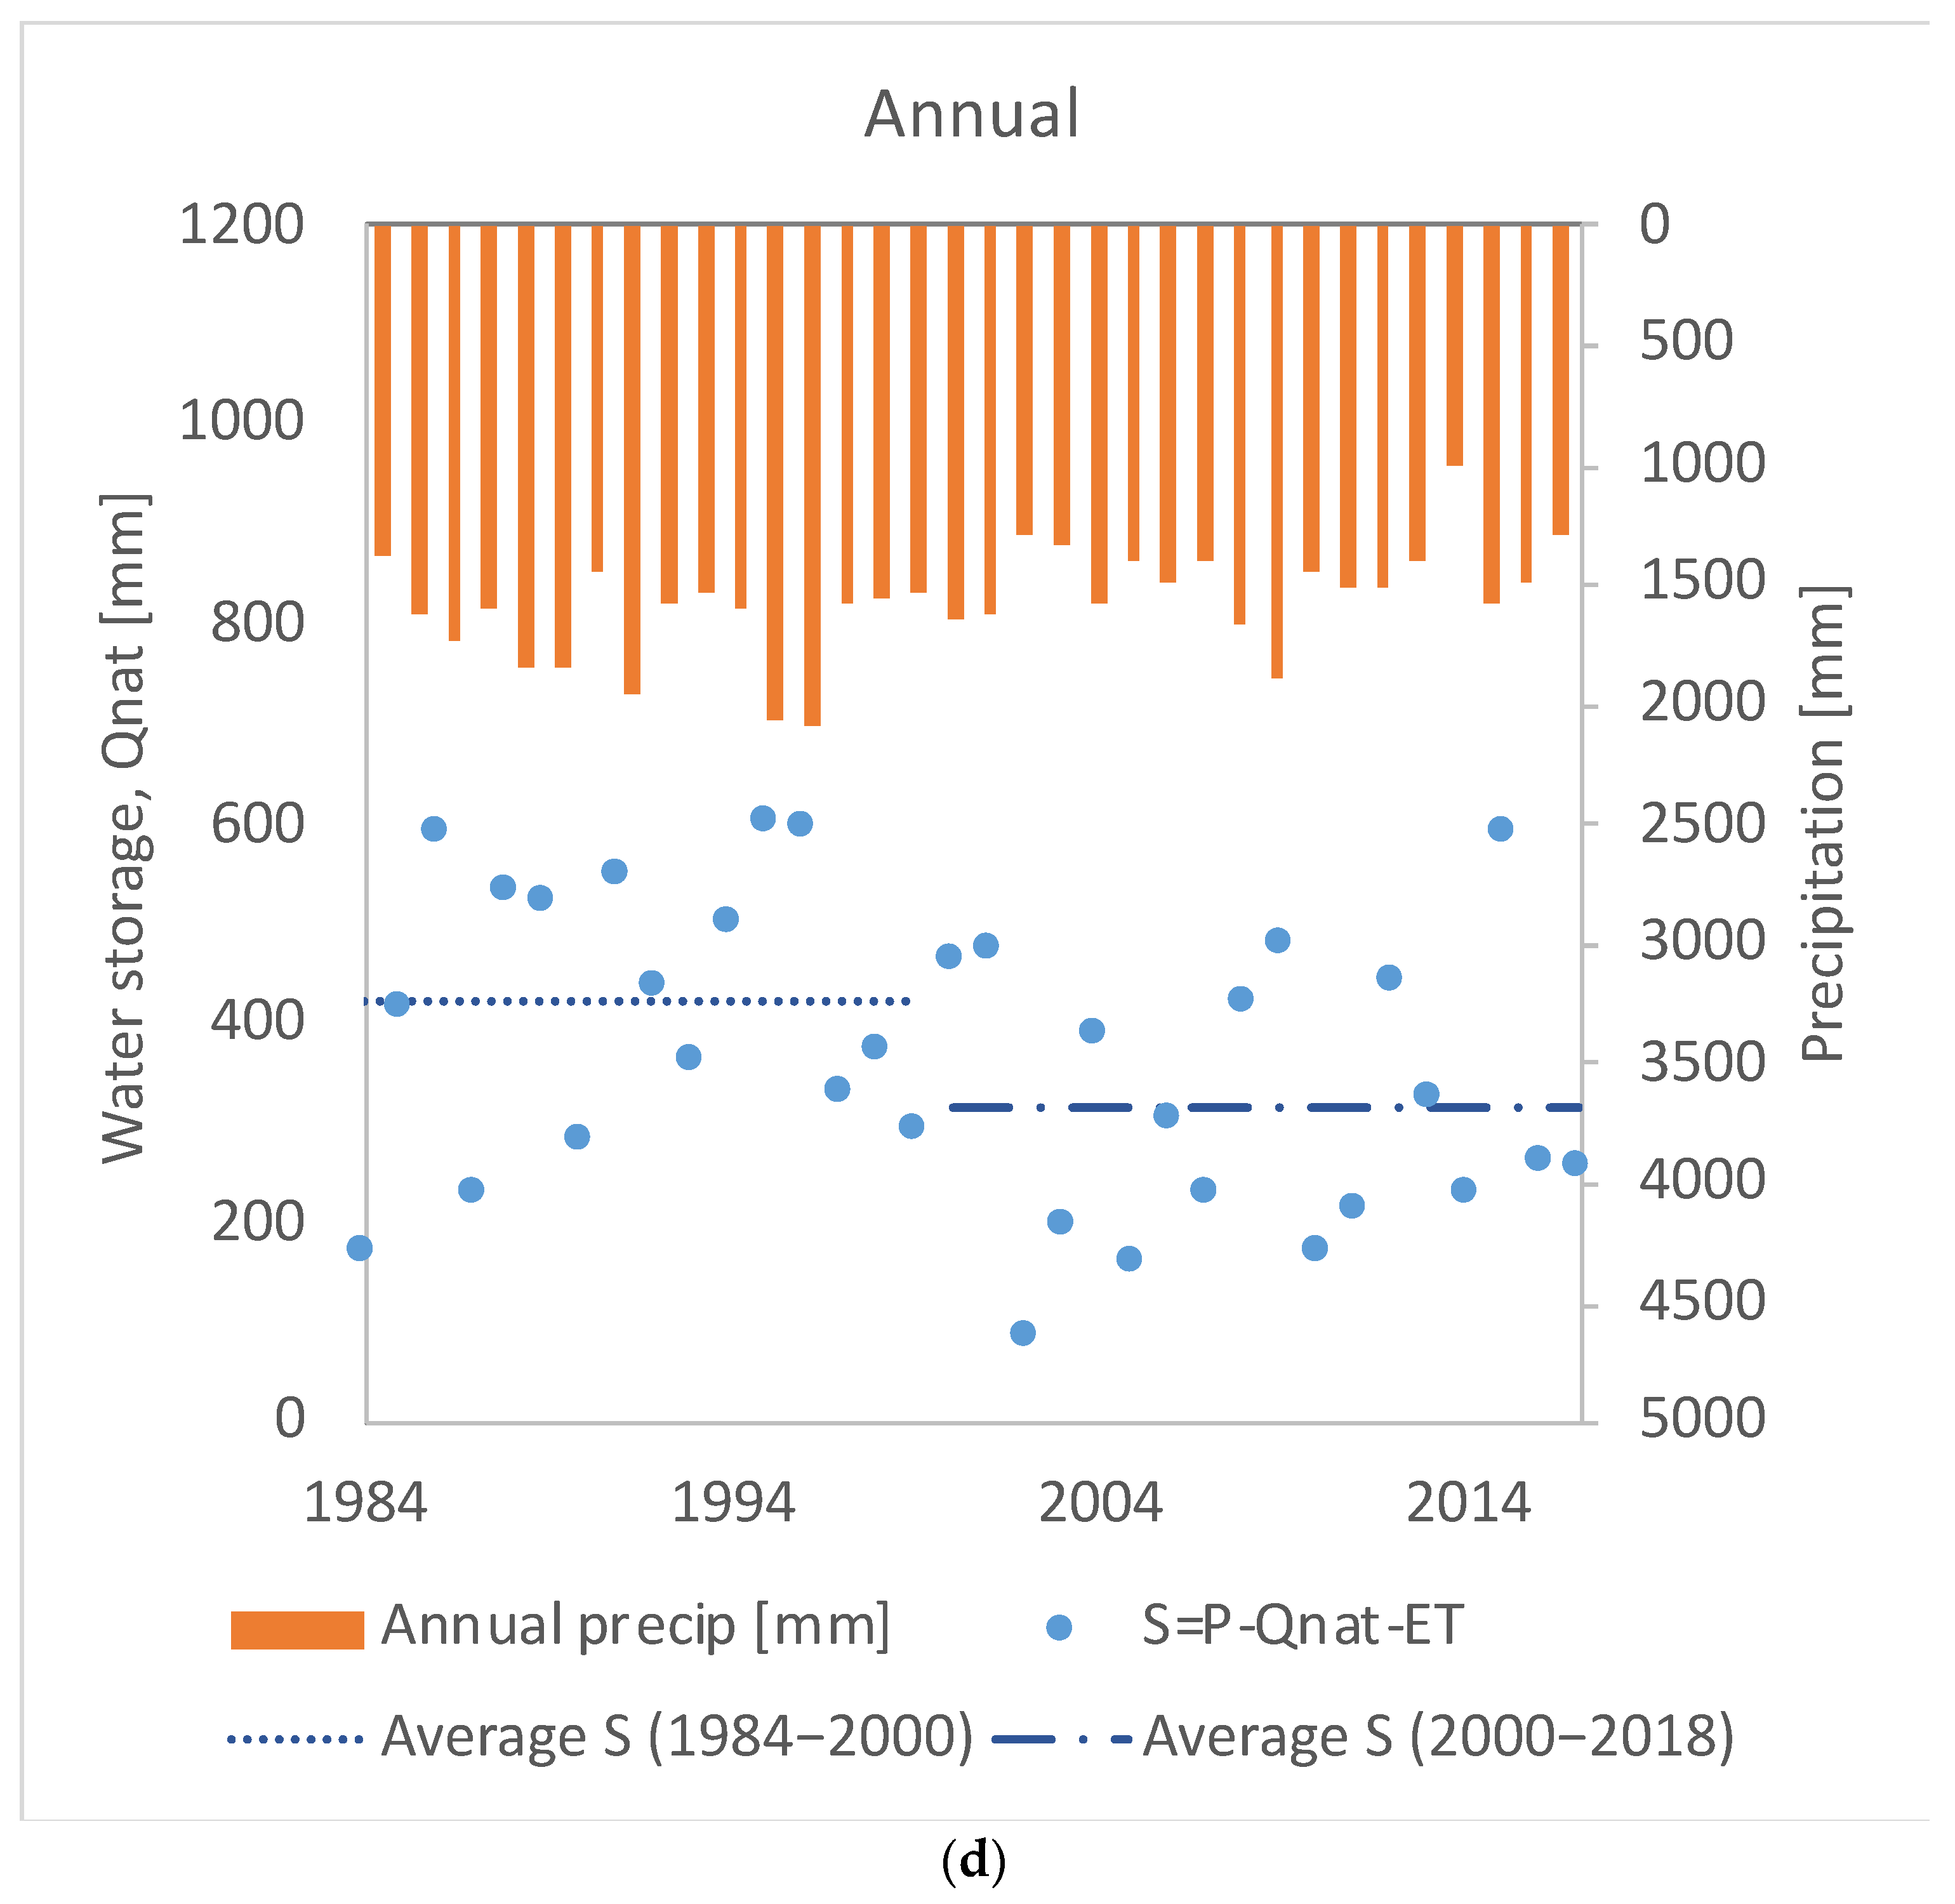
Appendix A. Historical Land-Use and Land-Cover Change Analysis


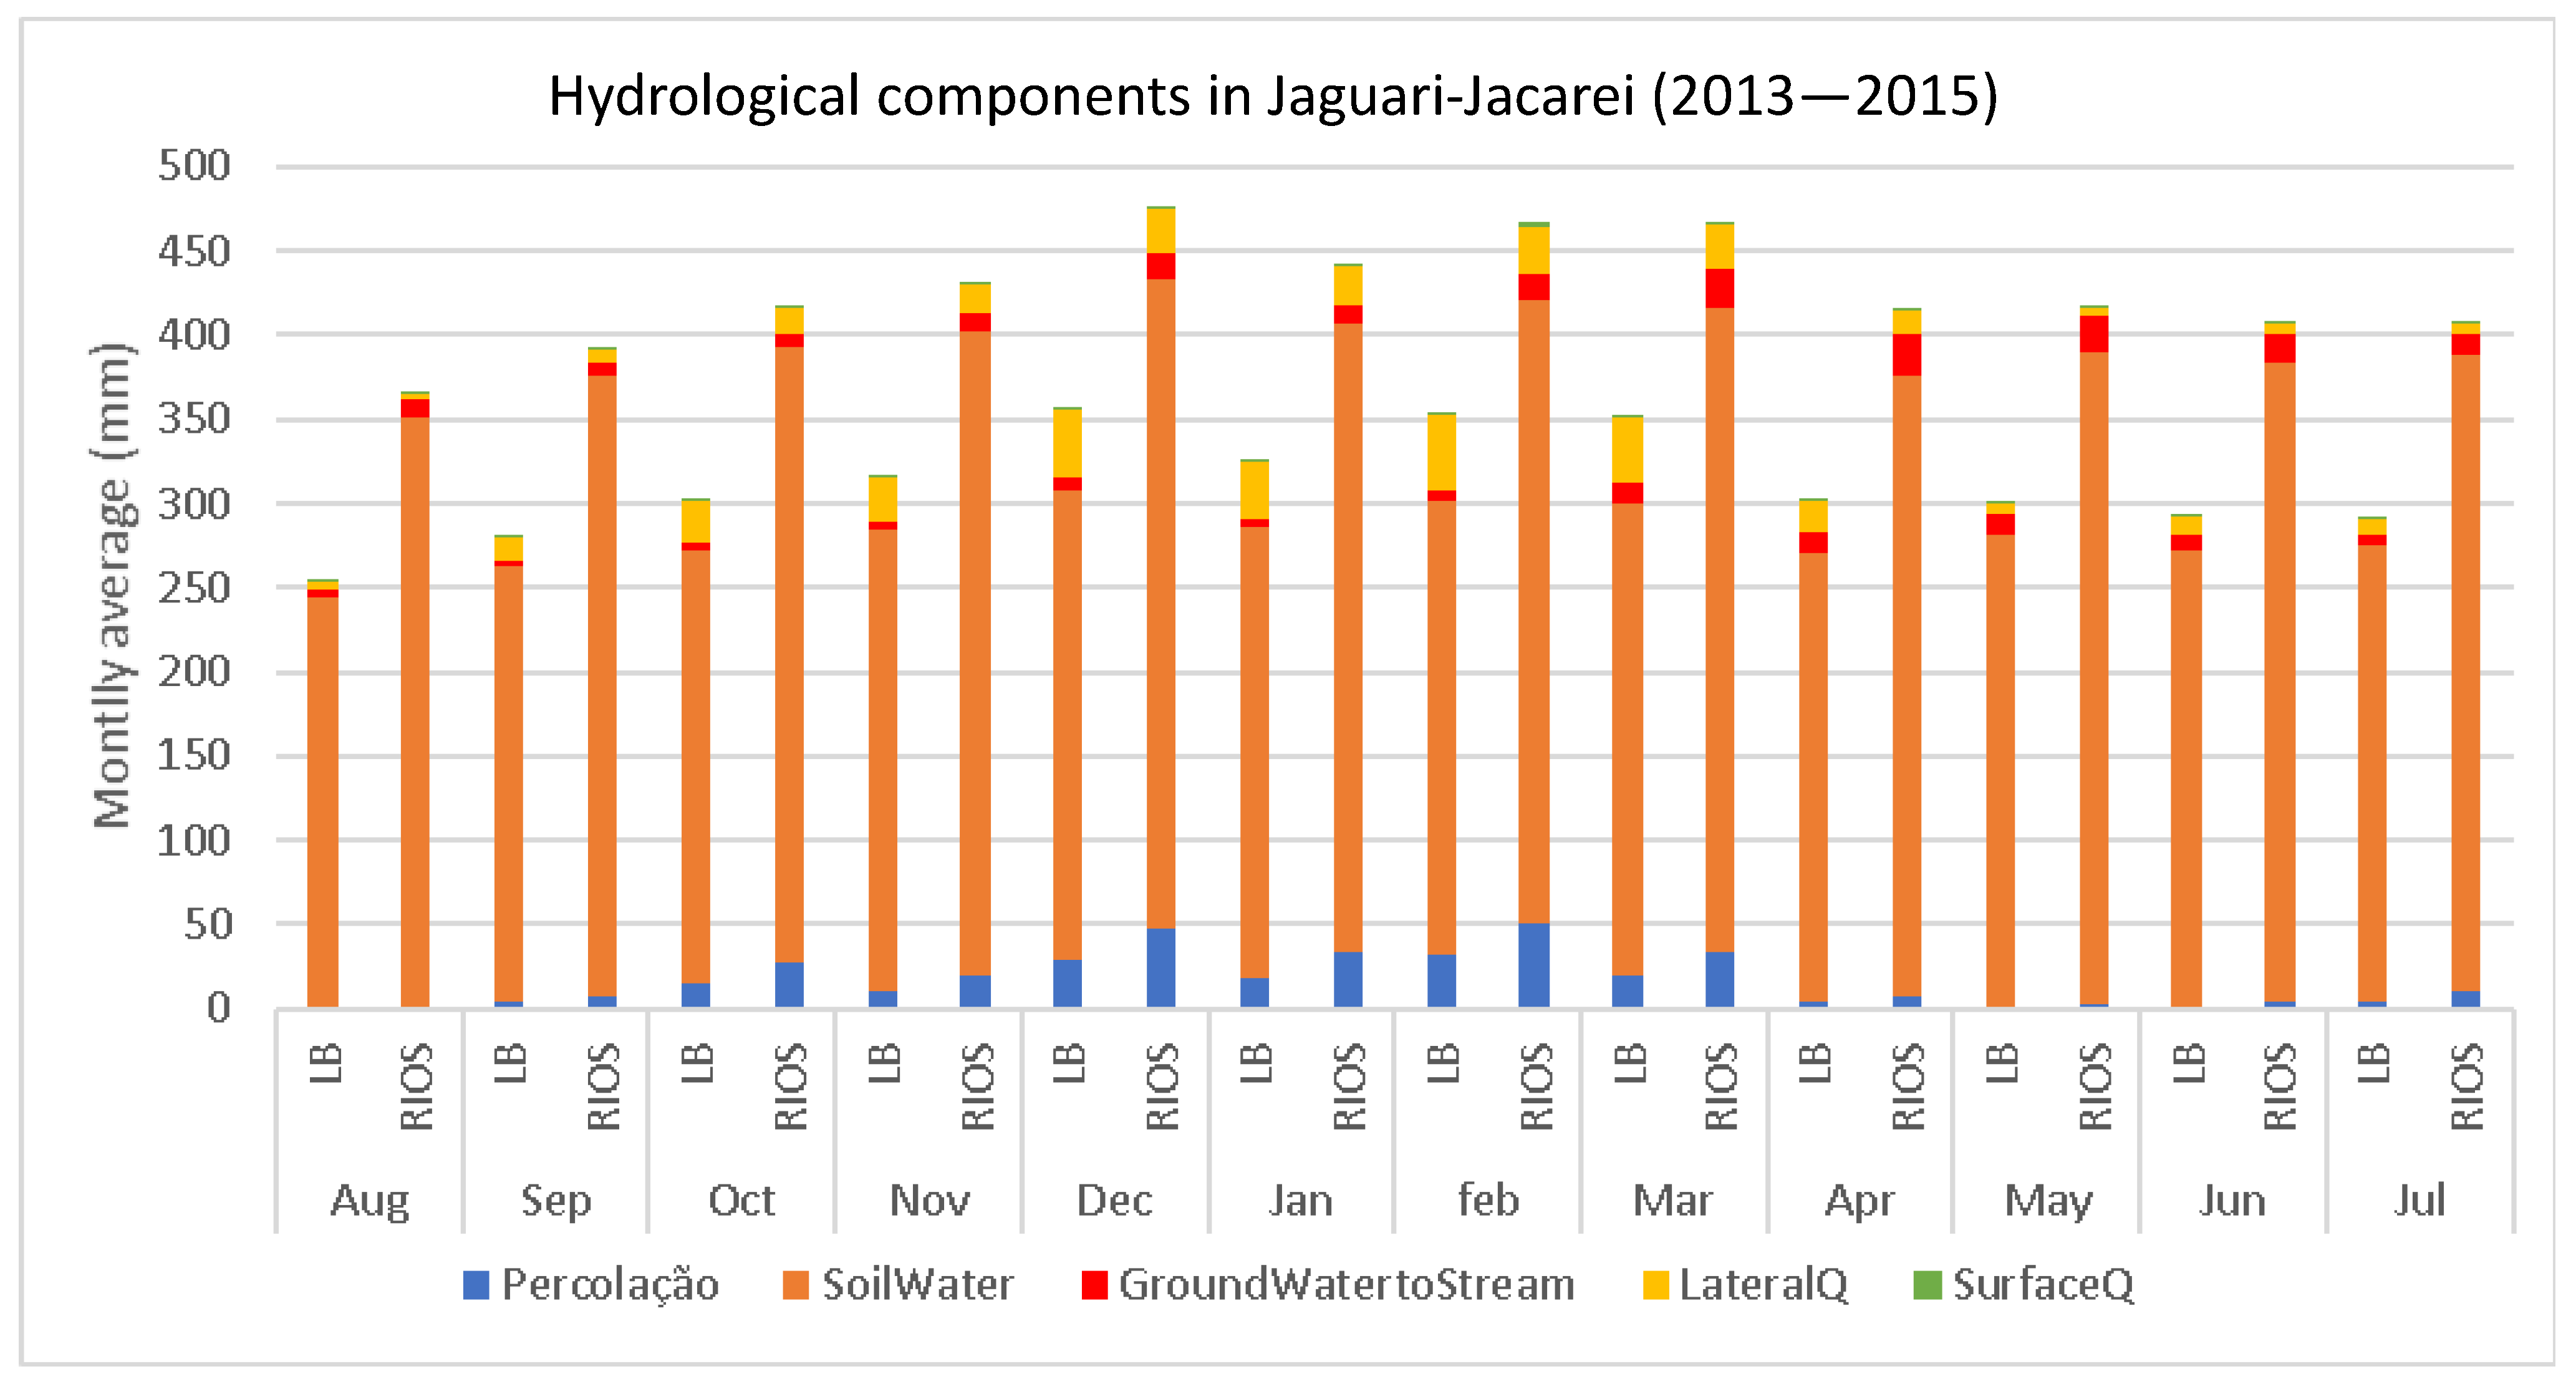
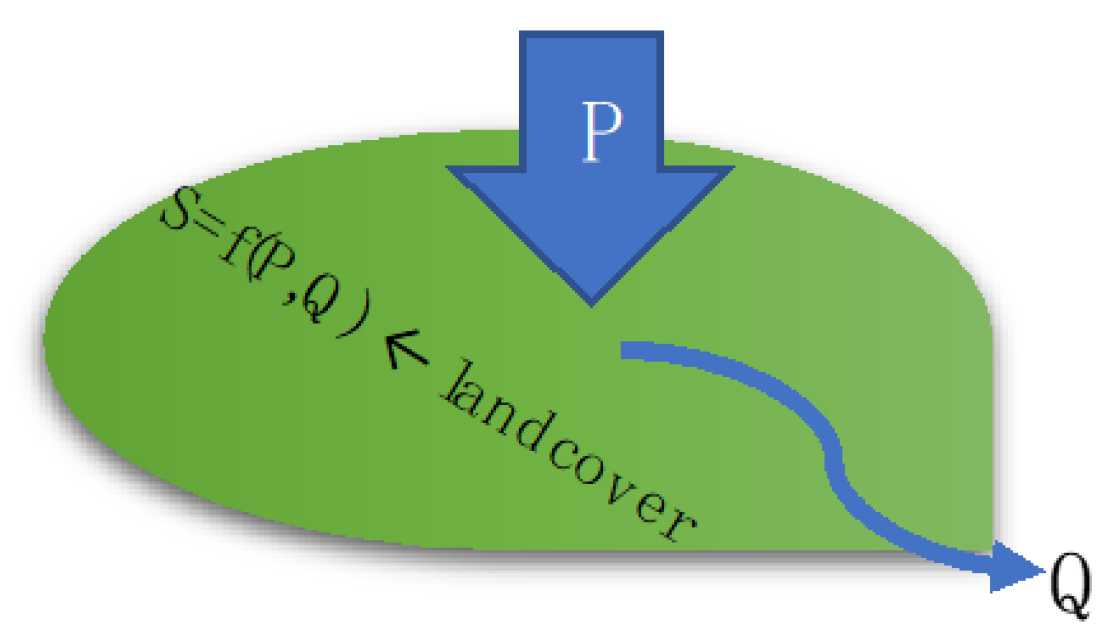
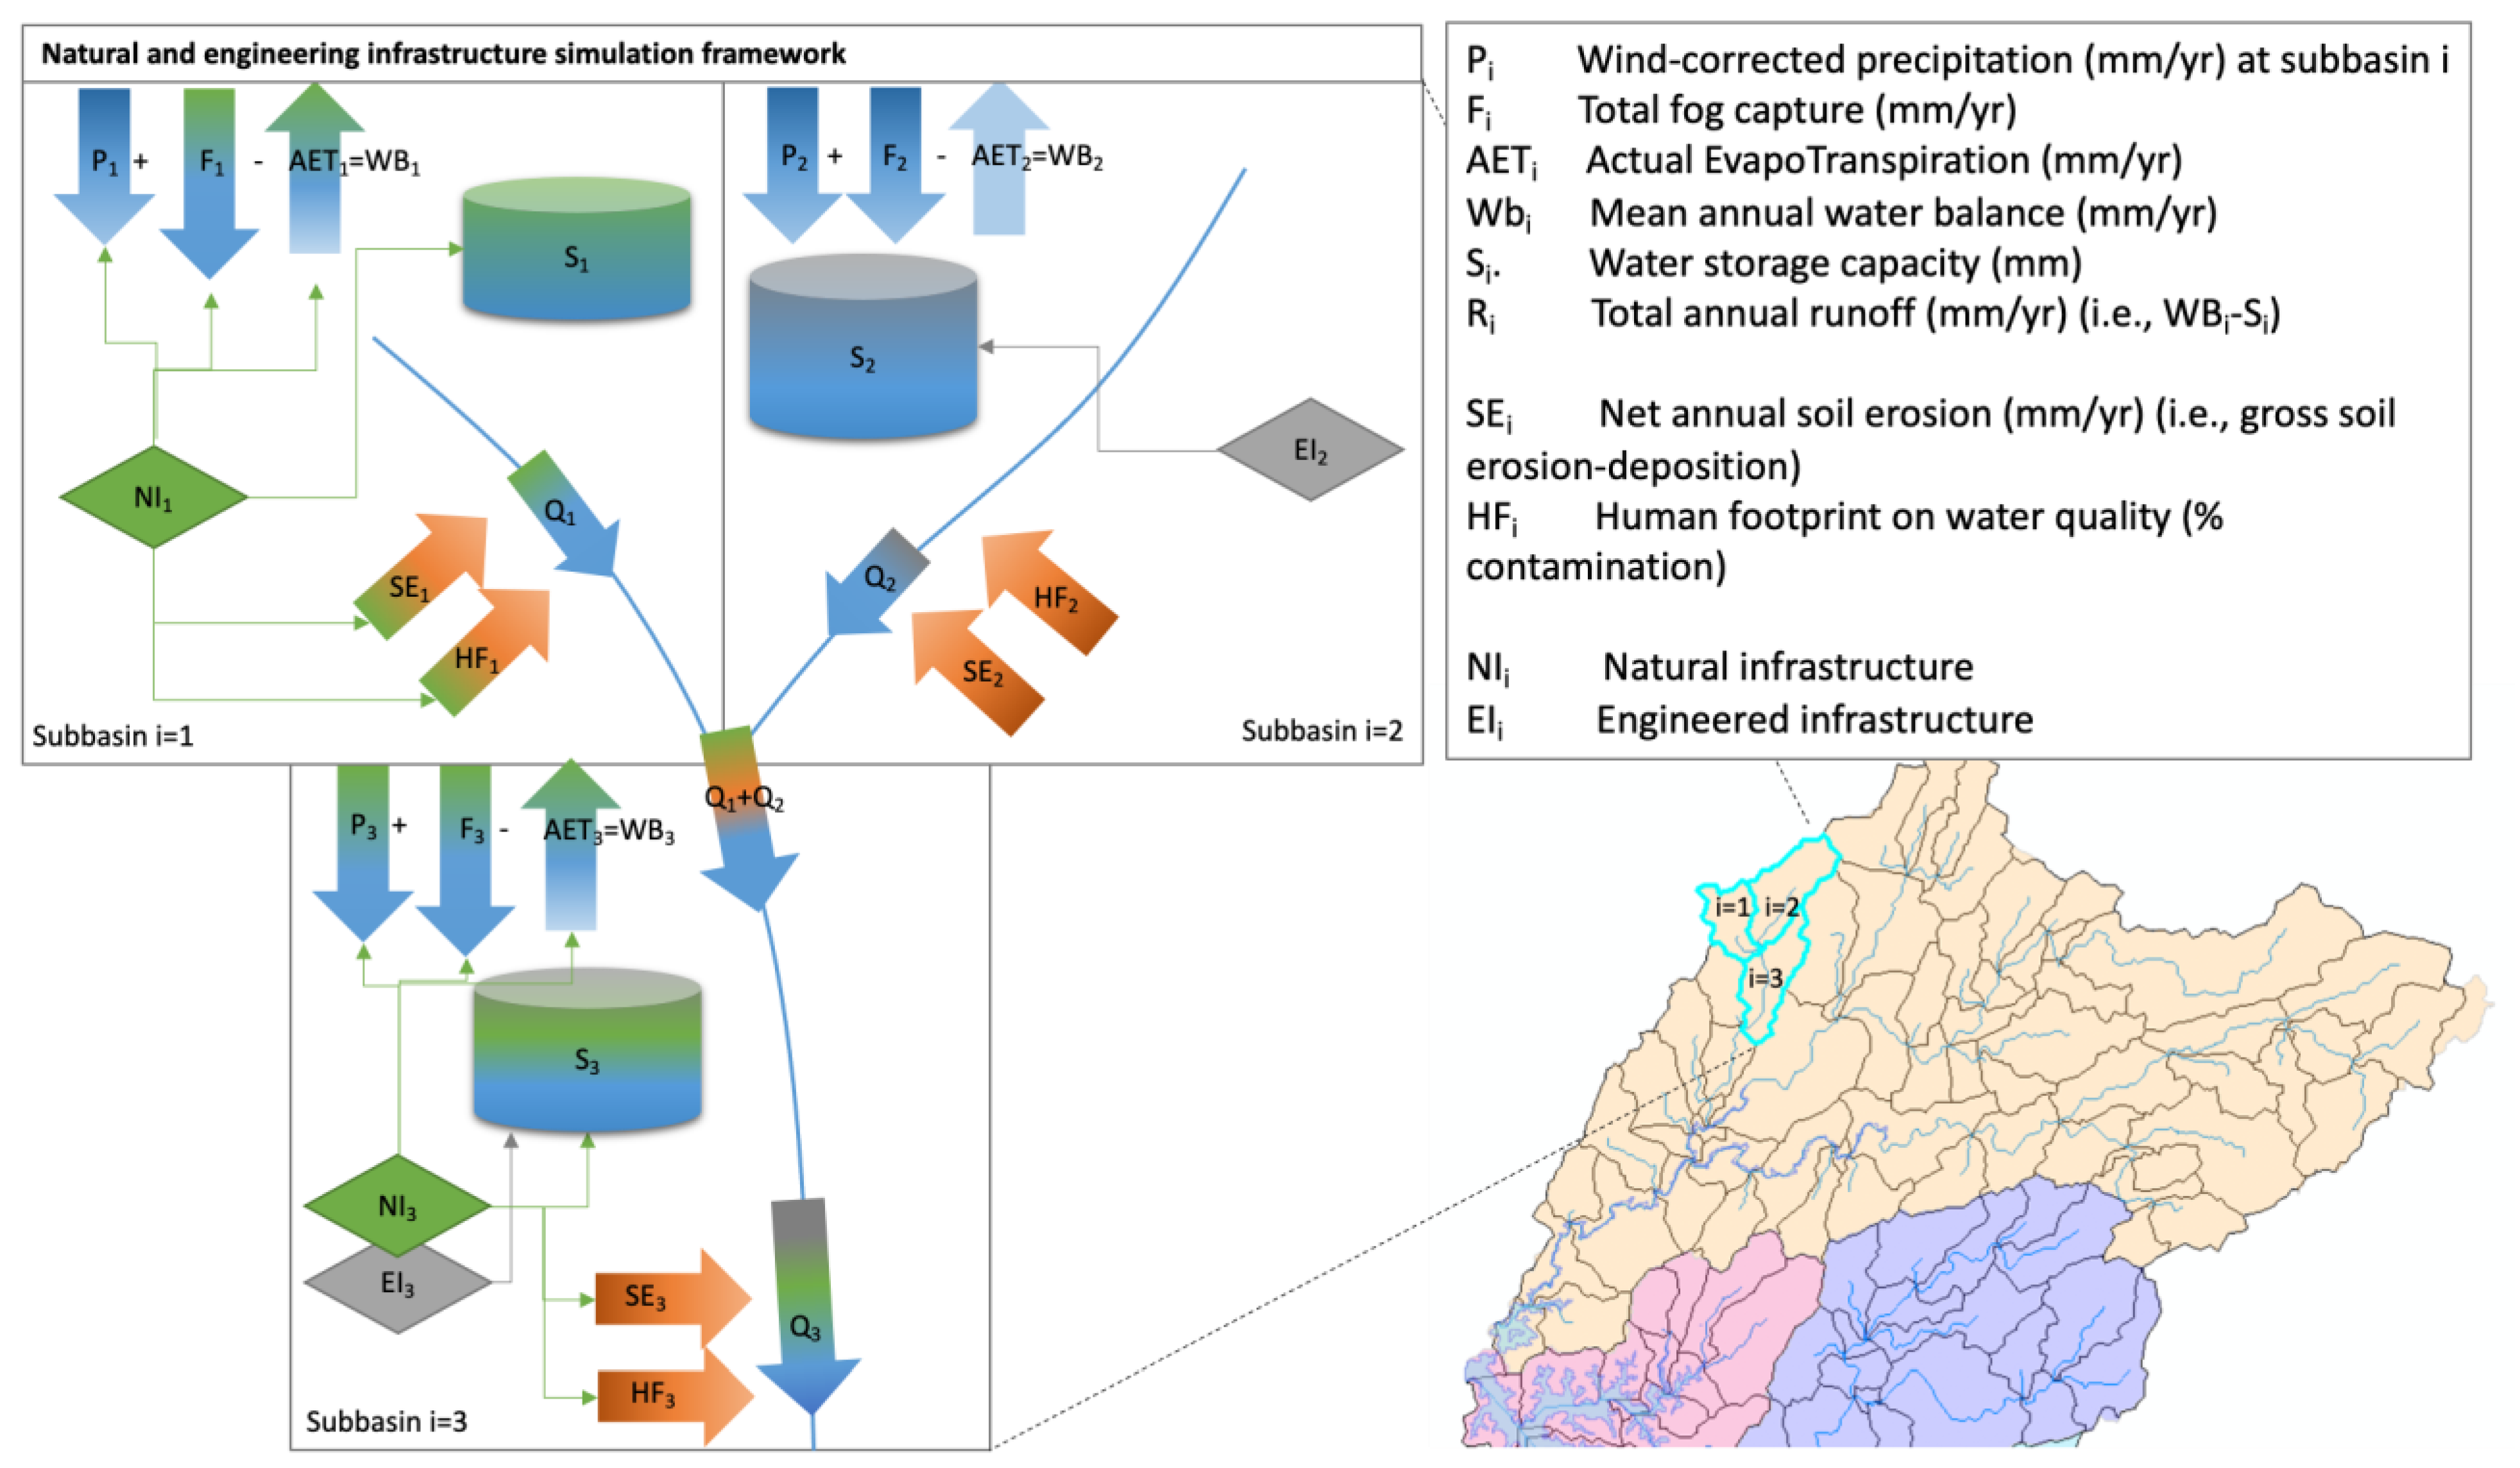
Appendix B. Reduced-Complexity Nature and Engineered Infrastructure Simulation Model
Appendix B.1. Model Structure

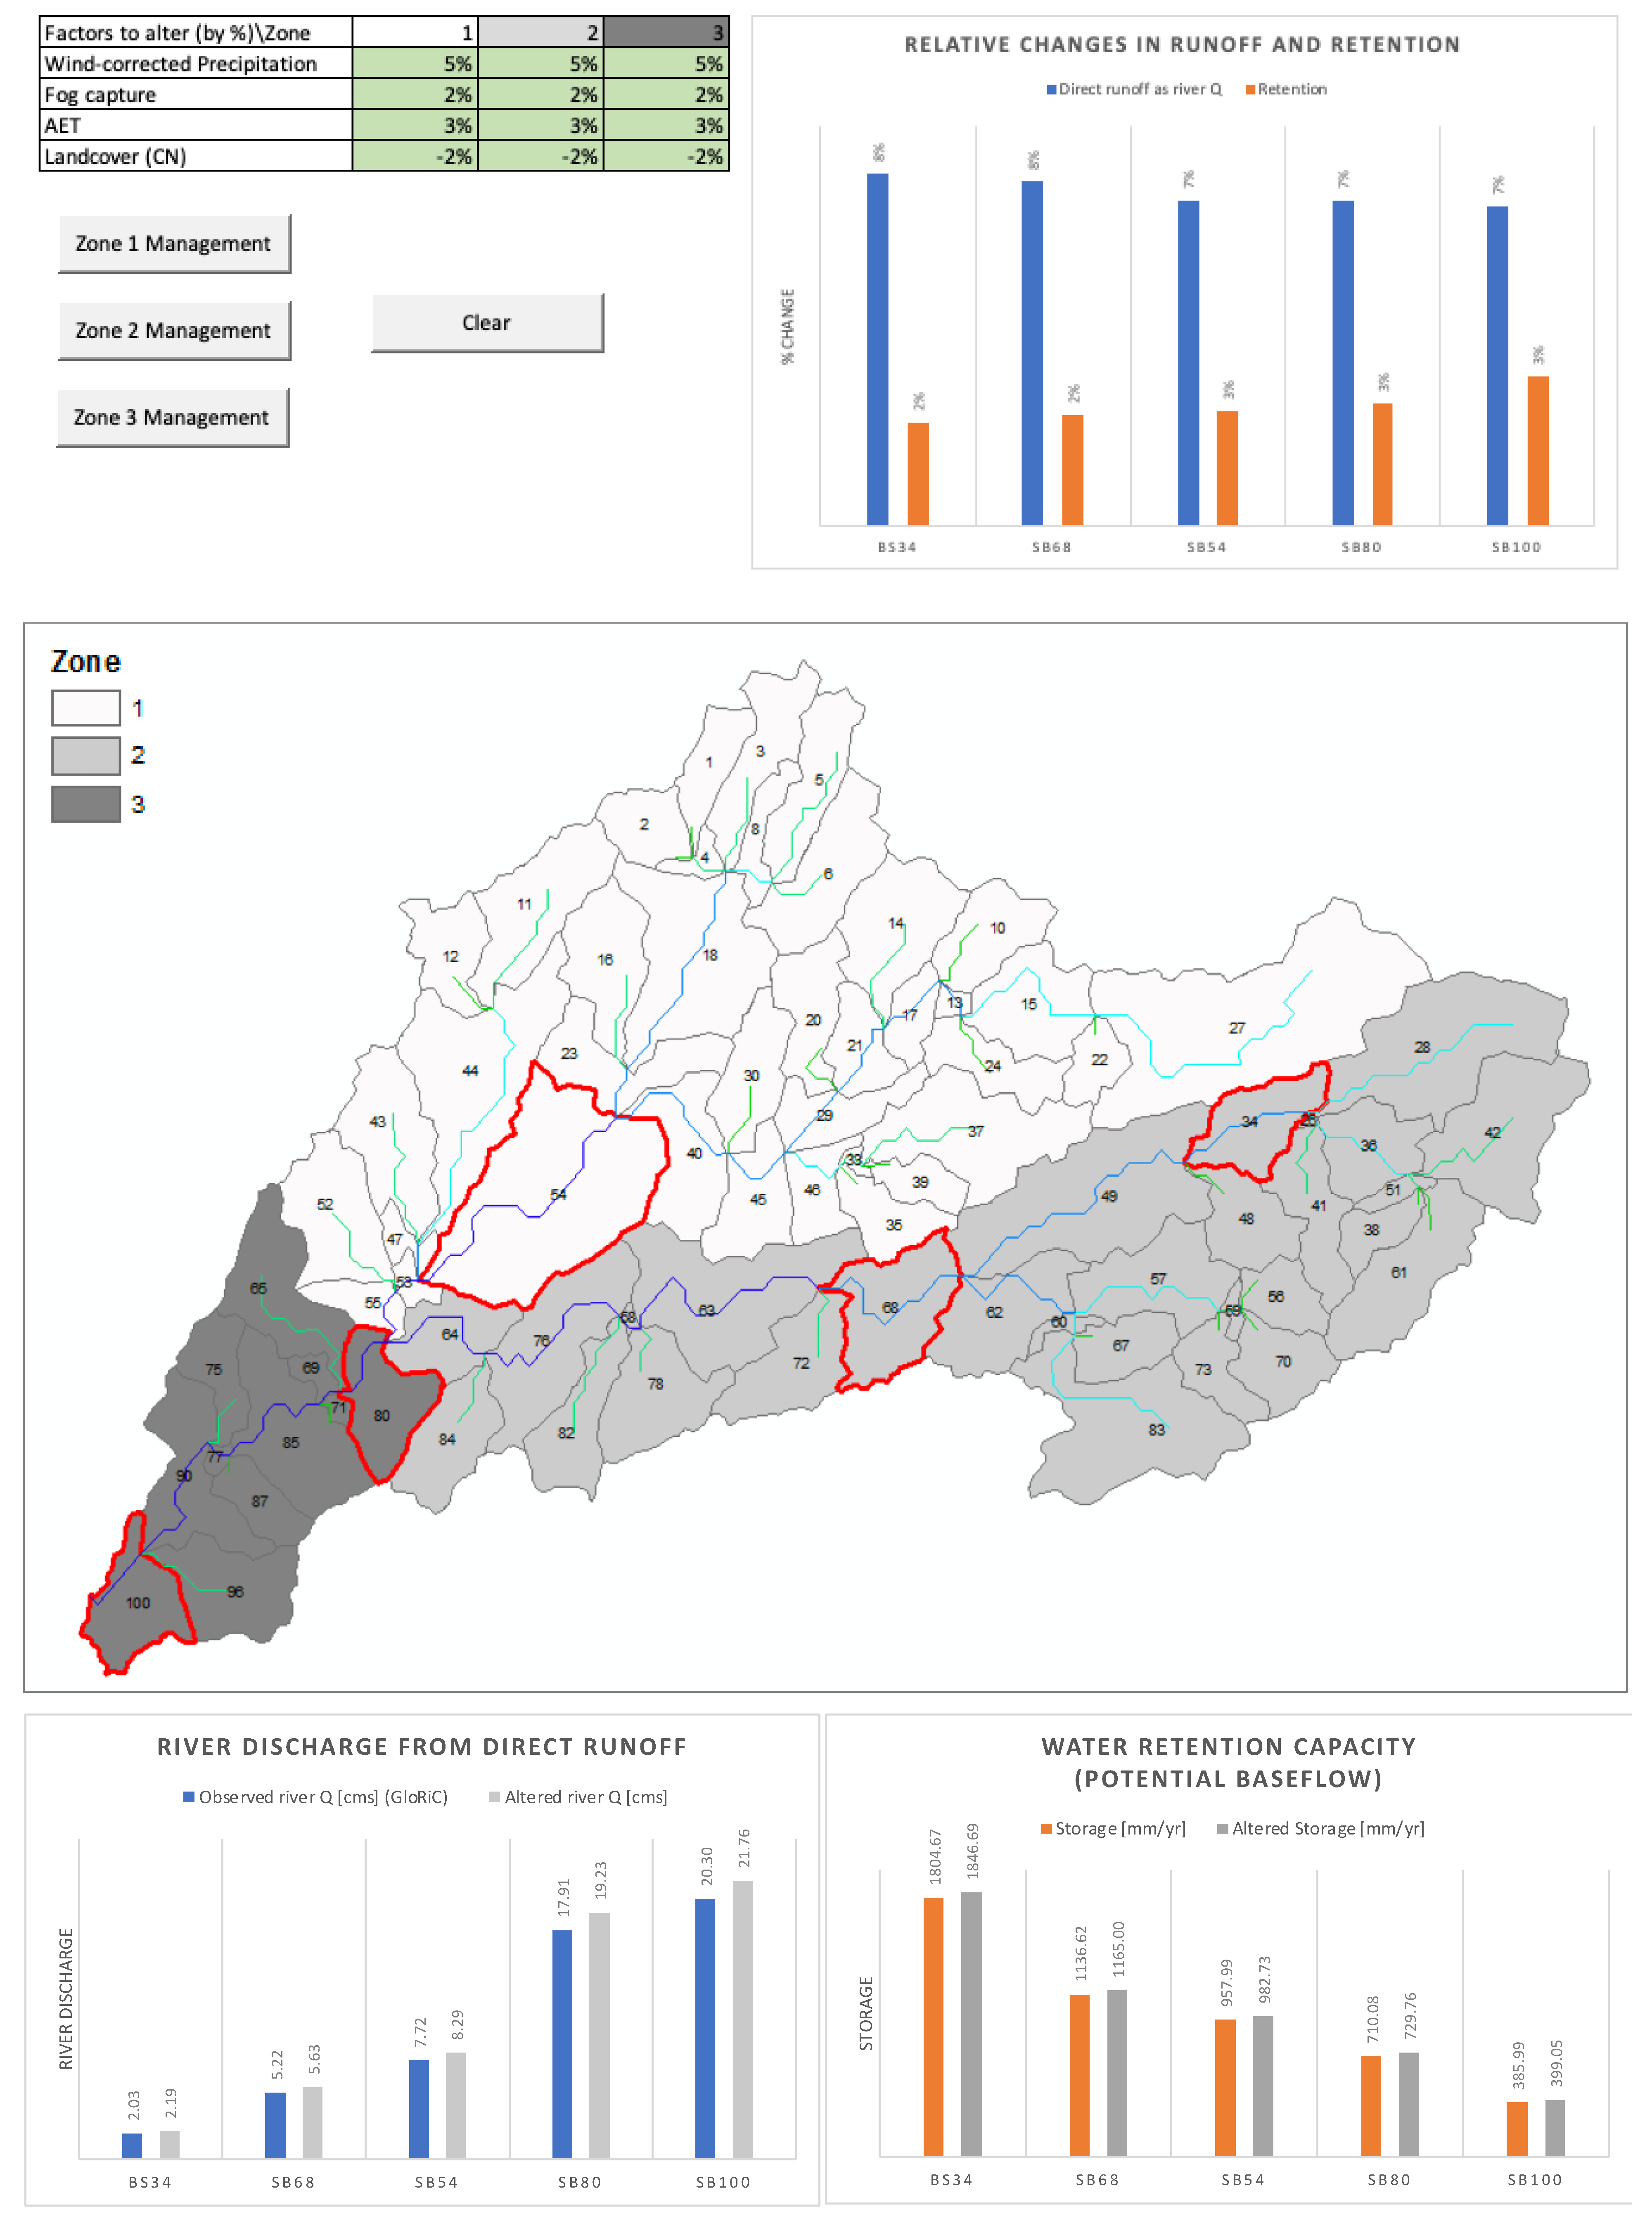
Appendix B.2. Model Interface: Jaguari Watershed Is Divided into Three Zones
- SB 54 in zone 1
- SB 34 and SB 68 in zone 2, and
- SB 80 and SB 100 in zone 3.


References
- IPCC. Climate Change 2022: Impacts, Adaptation and Vulnerability. 2022. Available online: https://www.ipcc.ch/report/ar6/wg2/ (accessed on 25 March 2022).
- Loucks, D.P. Sustainable Water Resources Management. Water Int. 2000, 25, 3–10. [Google Scholar] [CrossRef]
- United Nations World Water Assessment Programme. World Water Development Report 2018: Nature-Based Solutions for Water; UNESCO: Paris, France, 2018; Available online: http://www.unwater.org/publications/world-water-development-report-2018/ (accessed on 27 September 2018).
- Guston, D.H. Stabilizing the Boundary between US Politics and Science: The Rôle of the Office of Technology Transfer as a Boundary Organization. Soc. Stud. Sci. 1999, 29, 87–111. [Google Scholar] [CrossRef] [PubMed]
- Nel, J.L.; Roux, D.J.; Driver, A.; Hill, L.; Maherry, A.C.; Snaddon, K.; Petersen, C.R.; Smith-Adao, L.B.; Van Deventer, H.; Reyers, B. Knowledge co-production and boundary work to promote implementation of conservation plans. Conserv. Biol. 2015, 30, 176–188. [Google Scholar] [CrossRef] [PubMed]
- Acosta, E.; Cho, S.J.; Klemz, C.; Raepple, J.; Ciasca, B.; Bracale, H. Biophysical benefits simulation modeling framework for investments in Nature-based Solutions in São Paulo-Brazil water supply system. Water, Under Review.
- Ciasca, B.; Klemz, C.; Acosta, E.; Cho, S.J.; Kroeger, T.; Barreto, S.; Bracale, H.; Cesario, F. Economic cost of drought and potential benefits of investing in Nature-based Solutions: A study case in São Paulo, Brazil. Water, Under Review.
- Ribeiro, M.C.; Metzger, J.P.; Martensen, A.C.; Ponzoni, F.J.; Hirota, M.M. The Brazilian Atlantic Forest: How much is left, and how is the remaining forest distributed? Implications for conservation. Biol. Conserv. 2009, 142, 1141–1153. [Google Scholar] [CrossRef]
- Taffarello, D.; Calijuri, M.D.C.; Viani, R.A.G.; Marengo, J.A.; Mendiondo, E.M. Hydrological services in the Atlantic Forest, Brazil: An ecosystem-based adaptation using ecohydrological monitoring. Clim. Serv. 2017, 8, 1–16. [Google Scholar] [CrossRef]
- Rezende, C.L.; Scarano, F.R.; Assad, E.D.; Joly, C.A.; Metzger, J.P.; Strassburg, B.B.N.; Tabarelli, M.; Fonseca, G.A.; Mittermeier, R.A. From hotspot to hopespot: An opportunity for the Brazilian Atlantic Forest. Perspect. Ecol. Conserv. 2018, 16, 208–214. [Google Scholar] [CrossRef]
- Nobre, C.A.; Young, A.F.; Saldiva, P.H.N.; Orsini, J.A.M.; Nobre, A.D.; Ogura, A.T.; Thomaz, O.; Párraga, G.O.O.; da Silva, G.C.M.; Valverde, M.; et al. Vulnerability of Brazilian Megacities to Climate Change: The São Paulo Metropolitan Region; International Policy Centre for Inclusive Growth: Brasilia, DF, Brazil, May 2012; p. 161. Available online: https://ideas.repec.org/p/ipc/opager/161.html (accessed on 27 September 2018).
- Nobre, C.A.; Marengo, J.A.; Seluchi, M.E.; Cuartas, L.A.; Alves, L.M. Some Characteristics and Impacts of the Drought and Water Crisis in Southeastern Brazil during 2014 and 2015. J. Water Resour. Prot. 2016, 8, 252–262. [Google Scholar] [CrossRef] [Green Version]
- Empinotti, V.L.; Budds, J.; Aversa, M. Governance and water security: The role of the water institutional framework in the 2013–15 water crisis in São Paulo, Brazil. Geoforum 2018, 98, 46–54. [Google Scholar] [CrossRef] [Green Version]
- Ministério do Meio Ambiente. Governo Federal Formaliza Conservação de Floresta Nativa como Atividade Econômica. 2021. Available online: https://www.gov.br/mma/pt-br/assuntos/noticias/governo-federal-formaliza-conservacao-de-floresta-nativa-como-atividade-economica (accessed on 6 January 2021).
- Marengo, J.A.; Chou, S.C.; Kay, G.; Alves, L.M.; Pesquero, J.F.; Soares, W.R.; Santos, D.C.; Lyra, A.A.; Sueiro, G.; Betts, R.; et al. Development of regional future climate change scenarios in South America using the Eta CPTEC/HadCM3 climate change projections: Climatology and regional analyses for the Amazon, São Francisco and the Paraná River basins. Clim. Dyn. 2011, 38, 1829–1848. [Google Scholar] [CrossRef]
- United Nations Environment Programme, Green Infrastructure: Guide for Water Management; UNEP: Nairobi, Kenya, 2014; Available online: https://www.unep.org/resources/publication/green-infrastructure-guide-water-management (accessed on 25 February 2021).
- Douglass, J. RIOS. Natural Capital Project. 26 April 2019. Available online: https://naturalcapitalproject.stanford.edu/software/rios (accessed on 2 March 2022).
- Mulligan, M.; Burke, S.M. FIESTA Fog Interception for the Enhancement of Streamflow in Tropical Areas FinalTechnical Report for AMBIOTEK; Kings College London and AmbioTECK CIC: London, UK, 2004; Available online: http://www.policysupport.org/fiesta-fogint (accessed on 4 May 2021).
- Arnold, J.G.; Kiniry, J.R.; Srinivasan, R.; Williams, J.R. Soil and Water Assessment Tool: Input/Output File Documentation (Version 2009). TR-365. September 2011. Available online: http://swat.tamu.edu/media/19754/swat-io-2009.pdf (accessed on 11 April 2013).
- Ogden, F.L.; Crouch, T.D.; Stallard, R.F.; Hall, J.S. Effect of land cover and use on dry season river runoff, runoff efficiency, and peak storm runoff in the seasonal tropics of Central Panama. Water Resour. Res. 2013, 49, 8443–8462. [Google Scholar] [CrossRef]
- Yu, Z.; Man, X.; Duan, L.; Cai, T. Assessments of Impacts of Climate and Forest Change on Water Resources Using SWAT Model in a Subboreal Watershed in Northern Da Hinggan Mountains. Water 2020, 12, 1565. [Google Scholar] [CrossRef]
- Zabaleta, A.; Meaurio, M.; Ruiz, E.; Antigüedad, I. Simulation Climate Change Impact on Runoff and Sediment Yield in a Small Watershed in the Basque Country, Northern Spain. J. Environ. Qual. 2014, 43, 235–245. [Google Scholar] [CrossRef] [PubMed]
- Pfannerstill, M.; Guse, B.; Fohrer, N. A multi-storage groundwater concept for the SWAT model to emphasize nonlinear groundwater dynamics in lowland catchments. Hydrol. Process. 2013, 28, 5599–5612. [Google Scholar] [CrossRef]
- INSTITUTO BRASILEIRO DE GEOGRAFIA E ESTATÍSTICA. Produto Interno Bruto dos Município 2018; Sidra: Rio de Janeiro, Brazil, 2020. Available online: https://sidra.ibge.gov.br/pesquisa/pib-munic/tabelas (accessed on 3 July 2022).
- Giordano, R.; Pluchinotta, I.; Pagano, A.; Scrieciu, A.; Nanu, F. Enhancing nature-based solutions acceptance through stakeholders’ engagement in co-benefits identification and trade-offs analysis. Sci. Total Environ. 2020, 713, 136552. [Google Scholar] [CrossRef]
- Cassin, J.; Matthews, J.H. Chapter 1—Setting the scene: Nature-based solutions and water security. In Nature-Based Solutions and Water Security; Cassin, J., Matthews, J.H., Gunn, E.L., Eds.; Elsevier: Amsterdam, The Netherlands, 2021; pp. 3–18. [Google Scholar] [CrossRef]
- Seddon, N.; Smith, A.; Smith, P.; Key, I.; Chausson, A.; Girardin, C.; House, J.; Srivastava, S.; Turner, B. Getting the message right on nature-based solutions to climate change. Glob. Chang. Biol. 2021, 27, 1518–1546. [Google Scholar] [CrossRef]
- Browder, G.; Ozment, S.; Bescos, I.R.; Gartner, T.; Lange, G.-M. Integrating Green and Gray: Creating Next Generation Infrastructure; World Bank: Washington, DC, USA, 2019. [Google Scholar] [CrossRef]
- Weiland, S. Sustainability transitions in transition countries: Forest policy reforms in South-eastern Europe. Environ. Policy Gov. 2010, 20, 397–407. [Google Scholar] [CrossRef]
- Xi, W.; Wang, F.; Shi, P.; Dai, E.; Anoruo, A.O.; Bi, H.; Rahmlow, A.; He, B.; Li, W. Challenges to Sustainable Development in China: A Review of Six Large-Scale Forest Restoration and Land Conservation Programs. J. Sustain. For. 2014, 33, 435–453. [Google Scholar] [CrossRef]
- Tajuddin, T.; Supratman, S.; Salman, D.; Yusran, Y. Bridging social forestry and forest management units: Juxtaposing policy imaginaries with implementation practices in a case from Sulawesi. For. Soc. 2019, 3, 97–113. [Google Scholar] [CrossRef]
- Sahide, M.A.K.; Fisher, M.; Nasri, N.; Dharmiasih, W.; Verheijen, B.; Maryudi, A. Anticipating a new conservation bureaucracy? Land and power in Indonesia’s Essential Ecosystem Area policy. Land Use Policy 2020, 97, 104789. [Google Scholar] [CrossRef]
- Dominique, K.; Matthews, N.; Danielson, L.; Matthews, J.H. Chapter 6—Why governments embrace nature-based solutions: The policy rationale. In Nature-Based Solutions and Water Security; Cassin, J., Matthews, J.H., Gunn, E.L., Eds.; Elsevier: Amsterdam, The Netherlands, 2021; pp. 109–124. [Google Scholar] [CrossRef]
- Palmer, R.N. A History of Shared Vision Modeling in the ACT-ACF Comprehensive Study: A Modeler’s Perspective. In Coordination: Water Resources and Environment; ASCE: New York, NY, USA, 1998; pp. 221–226. [Google Scholar]
- US Army Corps of Engineers. Welcome to Shared Vision Planning. 13 February 2009. Available online: http://www.sharedvisionplanning.us/ (accessed on 5 October 2012).
- Cho, S.J.; Wilcock, P.R.; Belmont, P.; Gran, K.B.; Hobbs, B.F. Simulation Model for Collaborative Decision Making on Sediment Source Reduction in an Intensively Managed Watershed. Water Resour. Res. 2019, 55, 1544–1564. [Google Scholar] [CrossRef]
- Falconi, S.M.; Palmer, R.N. An interdisciplinary framework for participatory modeling design and evaluation—What makes models effective participatory decision tools? Water Resour. Res. 2017, 53, 1625–1645. [Google Scholar] [CrossRef]
- Megdal, S.B.; Eden, S.; Shamir, E. Water Governance, Stakeholder Engagement, and Sustainable Water Resources Management. Water 2017, 9, 190. [Google Scholar] [CrossRef] [Green Version]
- Barbosa, M.C.; Mushtaq, S.; Alam, K. Integrated water resources management: Are river basin committees in Brazil enabling effective stakeholder interaction? Environ. Sci. Policy 2017, 76, 1–11. [Google Scholar] [CrossRef]
- Cowie, G.M.; Borrett, S.R. Institutional perspectives on participation and information in water management. Environ. Model. Softw. 2005, 20, 469–483. [Google Scholar] [CrossRef]
- Voinov, A.; Bousquet, F. Modelling with stakeholders. Environ. Model. Softw. 2010, 25, 1268–1281. [Google Scholar] [CrossRef]
- Lacroix, K.E.M.; Megdal, S.B. Explore, Synthesize, and Repeat: Unraveling Complex Water Management Issues through the Stakeholder Engagement Wheel. Water 2016, 8, 118. [Google Scholar] [CrossRef] [Green Version]
- ABAR. O Papel Das Agências Reguladoras De Saneamento E Dos Prestadores De Serviços Na Proteção De Mananciais Para Segurança Hídrica; ABAR—Associação Brasileira de Agências de Regulação: Brasília, Brazil, 2021; Available online: https://abar.org.br/mdocs-posts/o-papel-das-agencias-reguladoras-de-saneamento-e-dos-prestadores-de-servicos-na-protecao-de-mananciais-para-seguranca-hidrica/ (accessed on 3 January 2023).
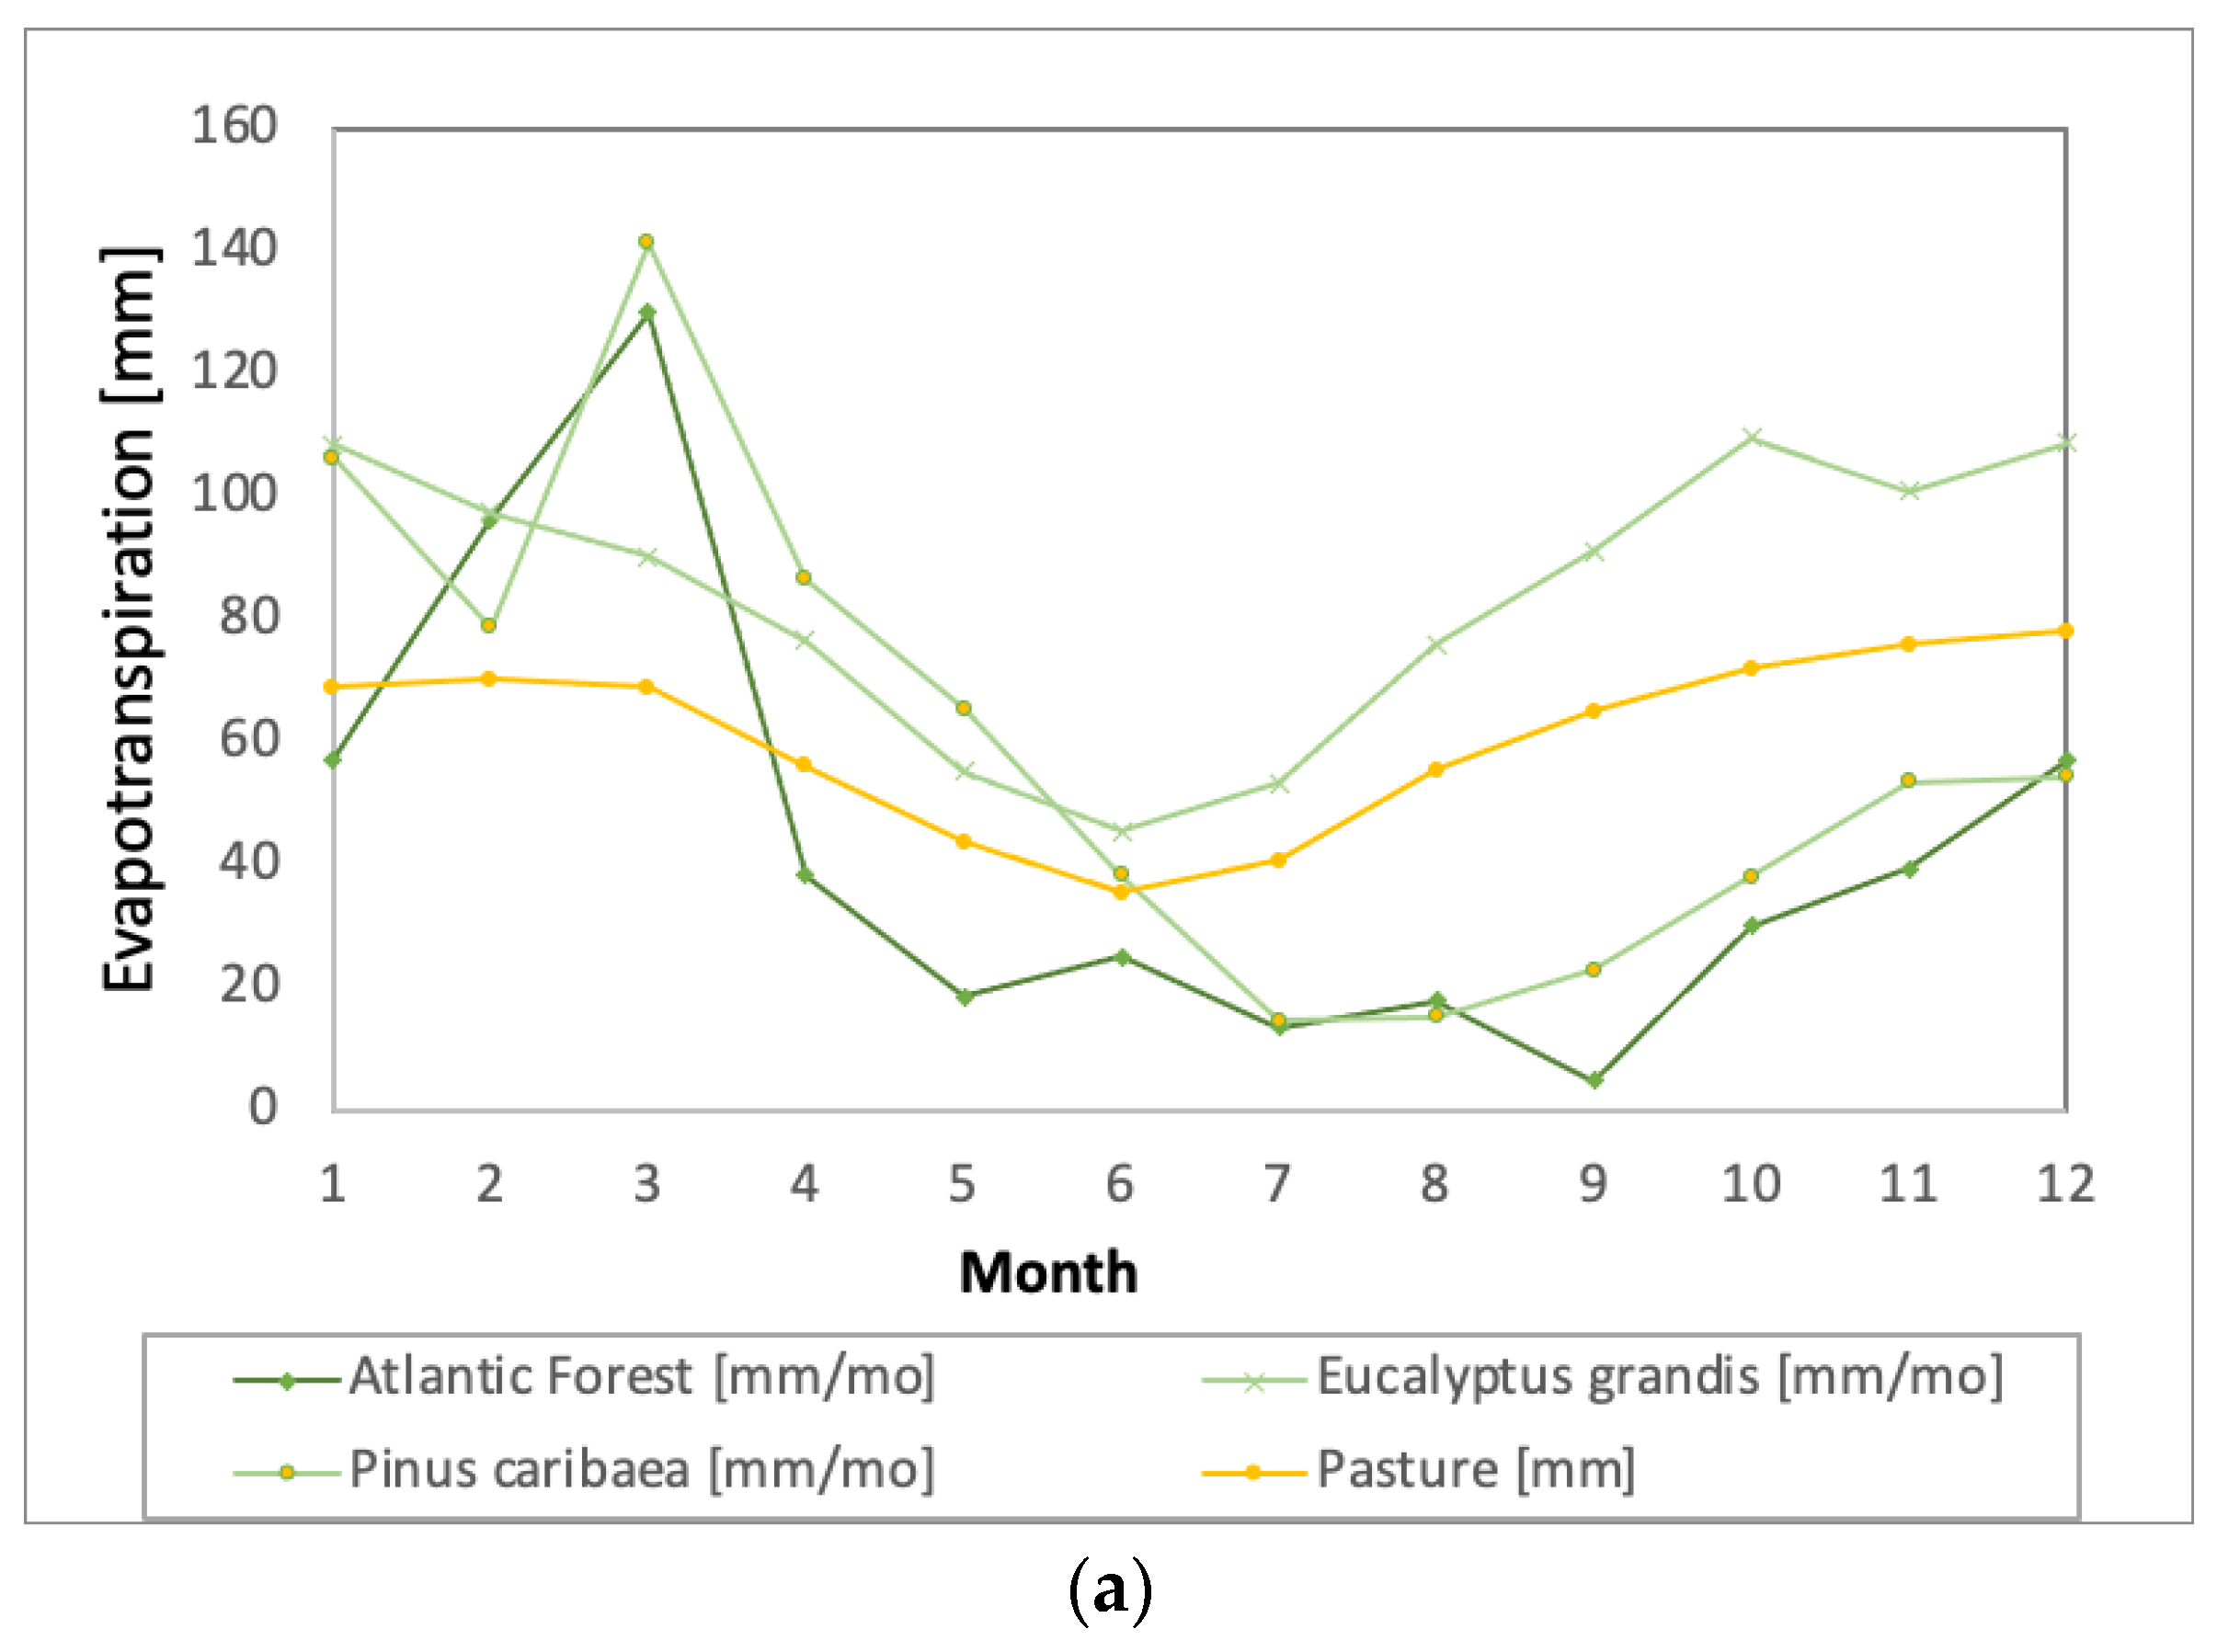
- Mattos, T.S.; de Oliveira, P.T.S.; Lucas, M.C.; Wendland, E. Groundwater Recharge Decrease Replacing Pasture by Eucalyptus Plantation. Water 2019, 11, 1213. [Google Scholar] [CrossRef]
- Lima, W.; Zakia, M.; Libardi, P.; Filho, A. Comparative evapotranspiration of Eucalyptus, pine, and natural ‘Cerrado’ vegetation measures by the soil water balance method. IPEP Int. 1990, 1, 5–11. [Google Scholar]
- da Silva, B.B.; Wilcox, B.P.; Silva, V.D.P.R.D.; Montenegro, S.M.G.L.; de Oliveira, L.M.M. Changes to the energy budget and evapotranspiration following conversion of tropical savannas to agricultural lands in São Paulo State, Brazil. Ecohydrology 2014, 8, 1272–1283. [Google Scholar] [CrossRef]
- Mulligan, M. WaterWorld: A self-parameterising, physically based model for application in data-poor but problem-rich environments globally. Hydrol. Res. 2012, 44, 748–769. [Google Scholar] [CrossRef]
- GloRiC. Available online: https://www.hydrosheds.org/products/gloric (accessed on 3 January 2023).


| Industry Gross Value Added (GVA) loss in municipalities on Cantareira System (USD 1000) | |||
| Municipalities | 2014 | 2015 | Total 2014–2015 |
| Bragança Paulista | 0 | 43.481 | 43.481 |
| Caieiras | 0 | 150.314 | 150.314 |
| Franco da Rocha | 4.104 | 73.653 | 77.757 |
| Joanópolis | 448 | 0 | 448 |
| Mairiporã | 9.044 | 13.839 | 22.882 |
| Nazaré Paulista | 0 | 3.728 | 3.728 |
| Piracaia | 906 | 3.078 | 3.984 |
| Vargem | 0 | 43.481 | 43.481 |
| Total | 14.502 | 288.092 | 302.594 |
| Water supply and sewage sector Net Value Added (NVA) loss in municipalities served by Cantareira System (USD 1000) | |||
| Municipalities | 2014 | 2015 | Total 2014–2015 |
| Caieiras | 650 | 600 | 1.250 |
| Francisco Morato | 708 | 706 | 1.414 |
| Franco da Rocha | 1.320 | 1.121 | 2.441 |
| Guarulhos | 5.359 | 5.230 | 10.589 |
| Osasco | 5.655 | 4.860 | 10.515 |
| Santo André | 2.654 | 2.572 | 5.226 |
| São Caetano do Sul | 2.871 | 2.579 | 5.451 |
| São Paulo | 58.663 | 51.602 | 110.265 |
| Total | 77.880 | 69.270 | 147.151 |
| Avoided costs in the industry with a RIOS scenario (USD 1000) | |
| 2014–2015 | |
| Industry GVA loss in the Cantareira System municipalities (I) | 302.691 |
| Industry GVA loss in the Cantareira System municipalities under the RIOS scenario (II) | 220.266 |
| Avoided industry GVA financial losses with the RIOS scenario (III = I–II) | 82.425 |
| Percentage of avoided industry GVA financial losses (%) (IV = III/I) | 27% |
| Avoided costs in the water supply and sanitation services with the RIOS scenario (USD 1000) | |
| 2014–2015 | |
| Loss of water and sanitation services NVA in the municipalities served by the Cantareira System (V) | 147.198 |
| Loss of water and sanitation services NVA in the municipalities served by the Cantareira System under the RIOS scenario (VI) | 105.590 |
| Avoided financial loss of water and sanitation services NVA with RIOS (VII = V–VI) | 41.608 |
| Percentage of avoided financial loss of water and sanitation services NVA with RIOS scenario (%) (VIII = VII/V) | 28% |
| Total avoided financial loss (IX = III + VII) | 124.032 |
| Percentage of total avoided financial loss (%) [X = IX/(I + V)] | 28% |
Disclaimer/Publisher’s Note: The statements, opinions and data contained in all publications are solely those of the individual author(s) and contributor(s) and not of MDPI and/or the editor(s). MDPI and/or the editor(s) disclaim responsibility for any injury to people or property resulting from any ideas, methods, instructions or products referred to in the content. |
© 2023 by the authors. Licensee MDPI, Basel, Switzerland. This article is an open access article distributed under the terms and conditions of the Creative Commons Attribution (CC BY) license (https://creativecommons.org/licenses/by/4.0/).
Share and Cite
Cho, S.J.; Klemz, C.; Barreto, S.; Raepple, J.; Bracale, H.; Acosta, E.A.; Rogéliz-Prada, C.A.; Ciasca, B.S. Collaborative Watershed Modeling as Stakeholder Engagement Tool for Science-Based Water Policy Assessment in São Paulo, Brazil. Water 2023, 15, 401. https://doi.org/10.3390/w15030401
Cho SJ, Klemz C, Barreto S, Raepple J, Bracale H, Acosta EA, Rogéliz-Prada CA, Ciasca BS. Collaborative Watershed Modeling as Stakeholder Engagement Tool for Science-Based Water Policy Assessment in São Paulo, Brazil. Water. 2023; 15(3):401. https://doi.org/10.3390/w15030401
Chicago/Turabian StyleCho, Se Jong, Claudio Klemz, Samuel Barreto, Justus Raepple, Henrique Bracale, Eileen Andrea Acosta, Carlos Andres Rogéliz-Prada, and Bruna S. Ciasca. 2023. "Collaborative Watershed Modeling as Stakeholder Engagement Tool for Science-Based Water Policy Assessment in São Paulo, Brazil" Water 15, no. 3: 401. https://doi.org/10.3390/w15030401