
Spatial-Temporal Dynamics of Anthropogenic Nitrogen Inputs in the Rapid Developing Chaohu Lake Basin
1
Key Laboratory of Watershed Geographic Sciences, Nanjing Institute of Geography and Limnology, Chinese Academy of Sciences, Nanjing 210008, China
2
University of Chinese Academy of Sciences, Beijing 100049, China
3
Institute of Geographic Sciences and Natural Resources Research, Chinese Academy of Sciences, Beijing 100049, China
*
Author to whom correspondence should be addressed.
Water 2023, 15(3), 414; https://doi.org/10.3390/w15030414
Submission received: 10 December 2022
/
Revised: 4 January 2023
/
Accepted: 11 January 2023
/
Published: 19 January 2023
(This article belongs to the Special Issue Urban Wastewater Treatment and Environmental Sustainability)
Abstract
:Due to the agricultural and industrial activities in rapidly urbanized basins, nitrogen (N) inputs have increased significantly, causing a variety of environmental issues. These challenges require an accurate assessment of the contributions of the driving factors, particularly in the Chaohu Lake Basin, which faces the double pressures of urban expansion and agricultural production. The research shows: (1) From 1990 to 2018, the trajectory of net anthropogenic N inputs (NANI) exhibited a three-stage pattern (uptrend stage, fluctuation stage, and downtrend stage), with an average value of 13,482 kg N km−2 year−1. The primary source was fertilizer N application, which made up approximately 79% of the NANI. Human food and animal feed imports, biological nitrogen fixation, and atmospheric N deposition composed 8%, 6%, and 6%, respectively. (2) Rapid urbanization enhanced the NANI in a short time stage. However, long-term analysis had shown a declining trend in nitrogen inputs, indicating that urbanization could improve fertilizer efficiency and introduce cleaner energy sources. (3) The NANI in urban watersheds were estimated at 20,700 kg N km−2 year−1, which was 3.4 times higher than in agricultural watersheds. Fertilizer N application was used in urban watersheds, as well as human food and animal feed imports. Urbanization drove the N input of food and feed mainly in urban watersheds but had no influence in agricultural watersheds and mixed watersheds. Since urban basins were the main source of nitrogen inputs, it was crucial to support environmental management efforts to reduce N pollution.
1. Introduction
Human activity has significantly changed the intensity of nitrogen (N), which dominates the anthropogenic modifications of the global N cycle [1,2]. Rapid economic and population growth has resulted in highly urbanized basins through the rapid urbanization process. Compared with traditional watersheds, highly urbanized watersheds maintain the nutritional needs of the population for food by occupying farmland [3]. Over the previous few decades, rapid urbanization reinforced N concentrations and a flux in basins [4,5], causing excessive nitrogen inputs to rivers [6], and 20–30% of riverine N input was exported. Since 1980, human-induced nutrient inputs have increased sharply, and most rivers and lakes have experienced a massive reduction in water quality [7,8]. Studies have shown that the percentage of non-agricultural nitrogen inputs in highly urbanized watersheds increased as the urbanization rate rose [9]. Therefore, the intensive agricultural contribution to nitrogen nutrients may no longer be the main factor of environmental issues. Therefore, it is necessary to improve our understanding of the relationships between urbanization and nitrogen inputs.
Of the affected basins, Chaohu Lake Basin was a microcosm of Chinese social-economic development and human activities. It was selected by the Chinese government in the 1990s as a priority control area due to its serious nutrient pollution [10]. The primary industry accounts for the absolute proportion and the economic growth rate in the last decade is 3.7 times that of the whole country [11]. Such rapid economic development of urbanization without supporting pollution prevention and a management system has caused agricultural land to sharply decrease. In addition, N inputs are changing over time and space because of socioeconomic statuses, the spatial heterogeneity of N sources, and local hydrological and meteorological conditions [12]. To better understand and mitigate N pollution, it is essential to assess N inputs from direct anthropogenic influence. The NANI were used to evaluate anthropogenic N inputs and potential environmental risks at the watershed, provincial, and national scales [13]. Studies focus on influential factors, such as population growth, food demand, urbanization, and diet change [14,15]. These studies address the driver analysis of N input from a watershed perspective and facilitate the development to control N inputs in the future [16].
The main research objectives of this paper include the following questions: (1) To evaluate the inputs and spatial–temporal distribution of the NANI. (2) To reveal the drive mechanism of anthropogenic nitrogen inputs under rapid urbanization. (3) To analyze the spatial heterogeneity of N inputs in different types of watersheds. This study can supply a more effective understanding of current water pollution and the main sources of pressure, aiming to construct diversity management mechanisms.
2. Materials and Methods
2.1. Study Area
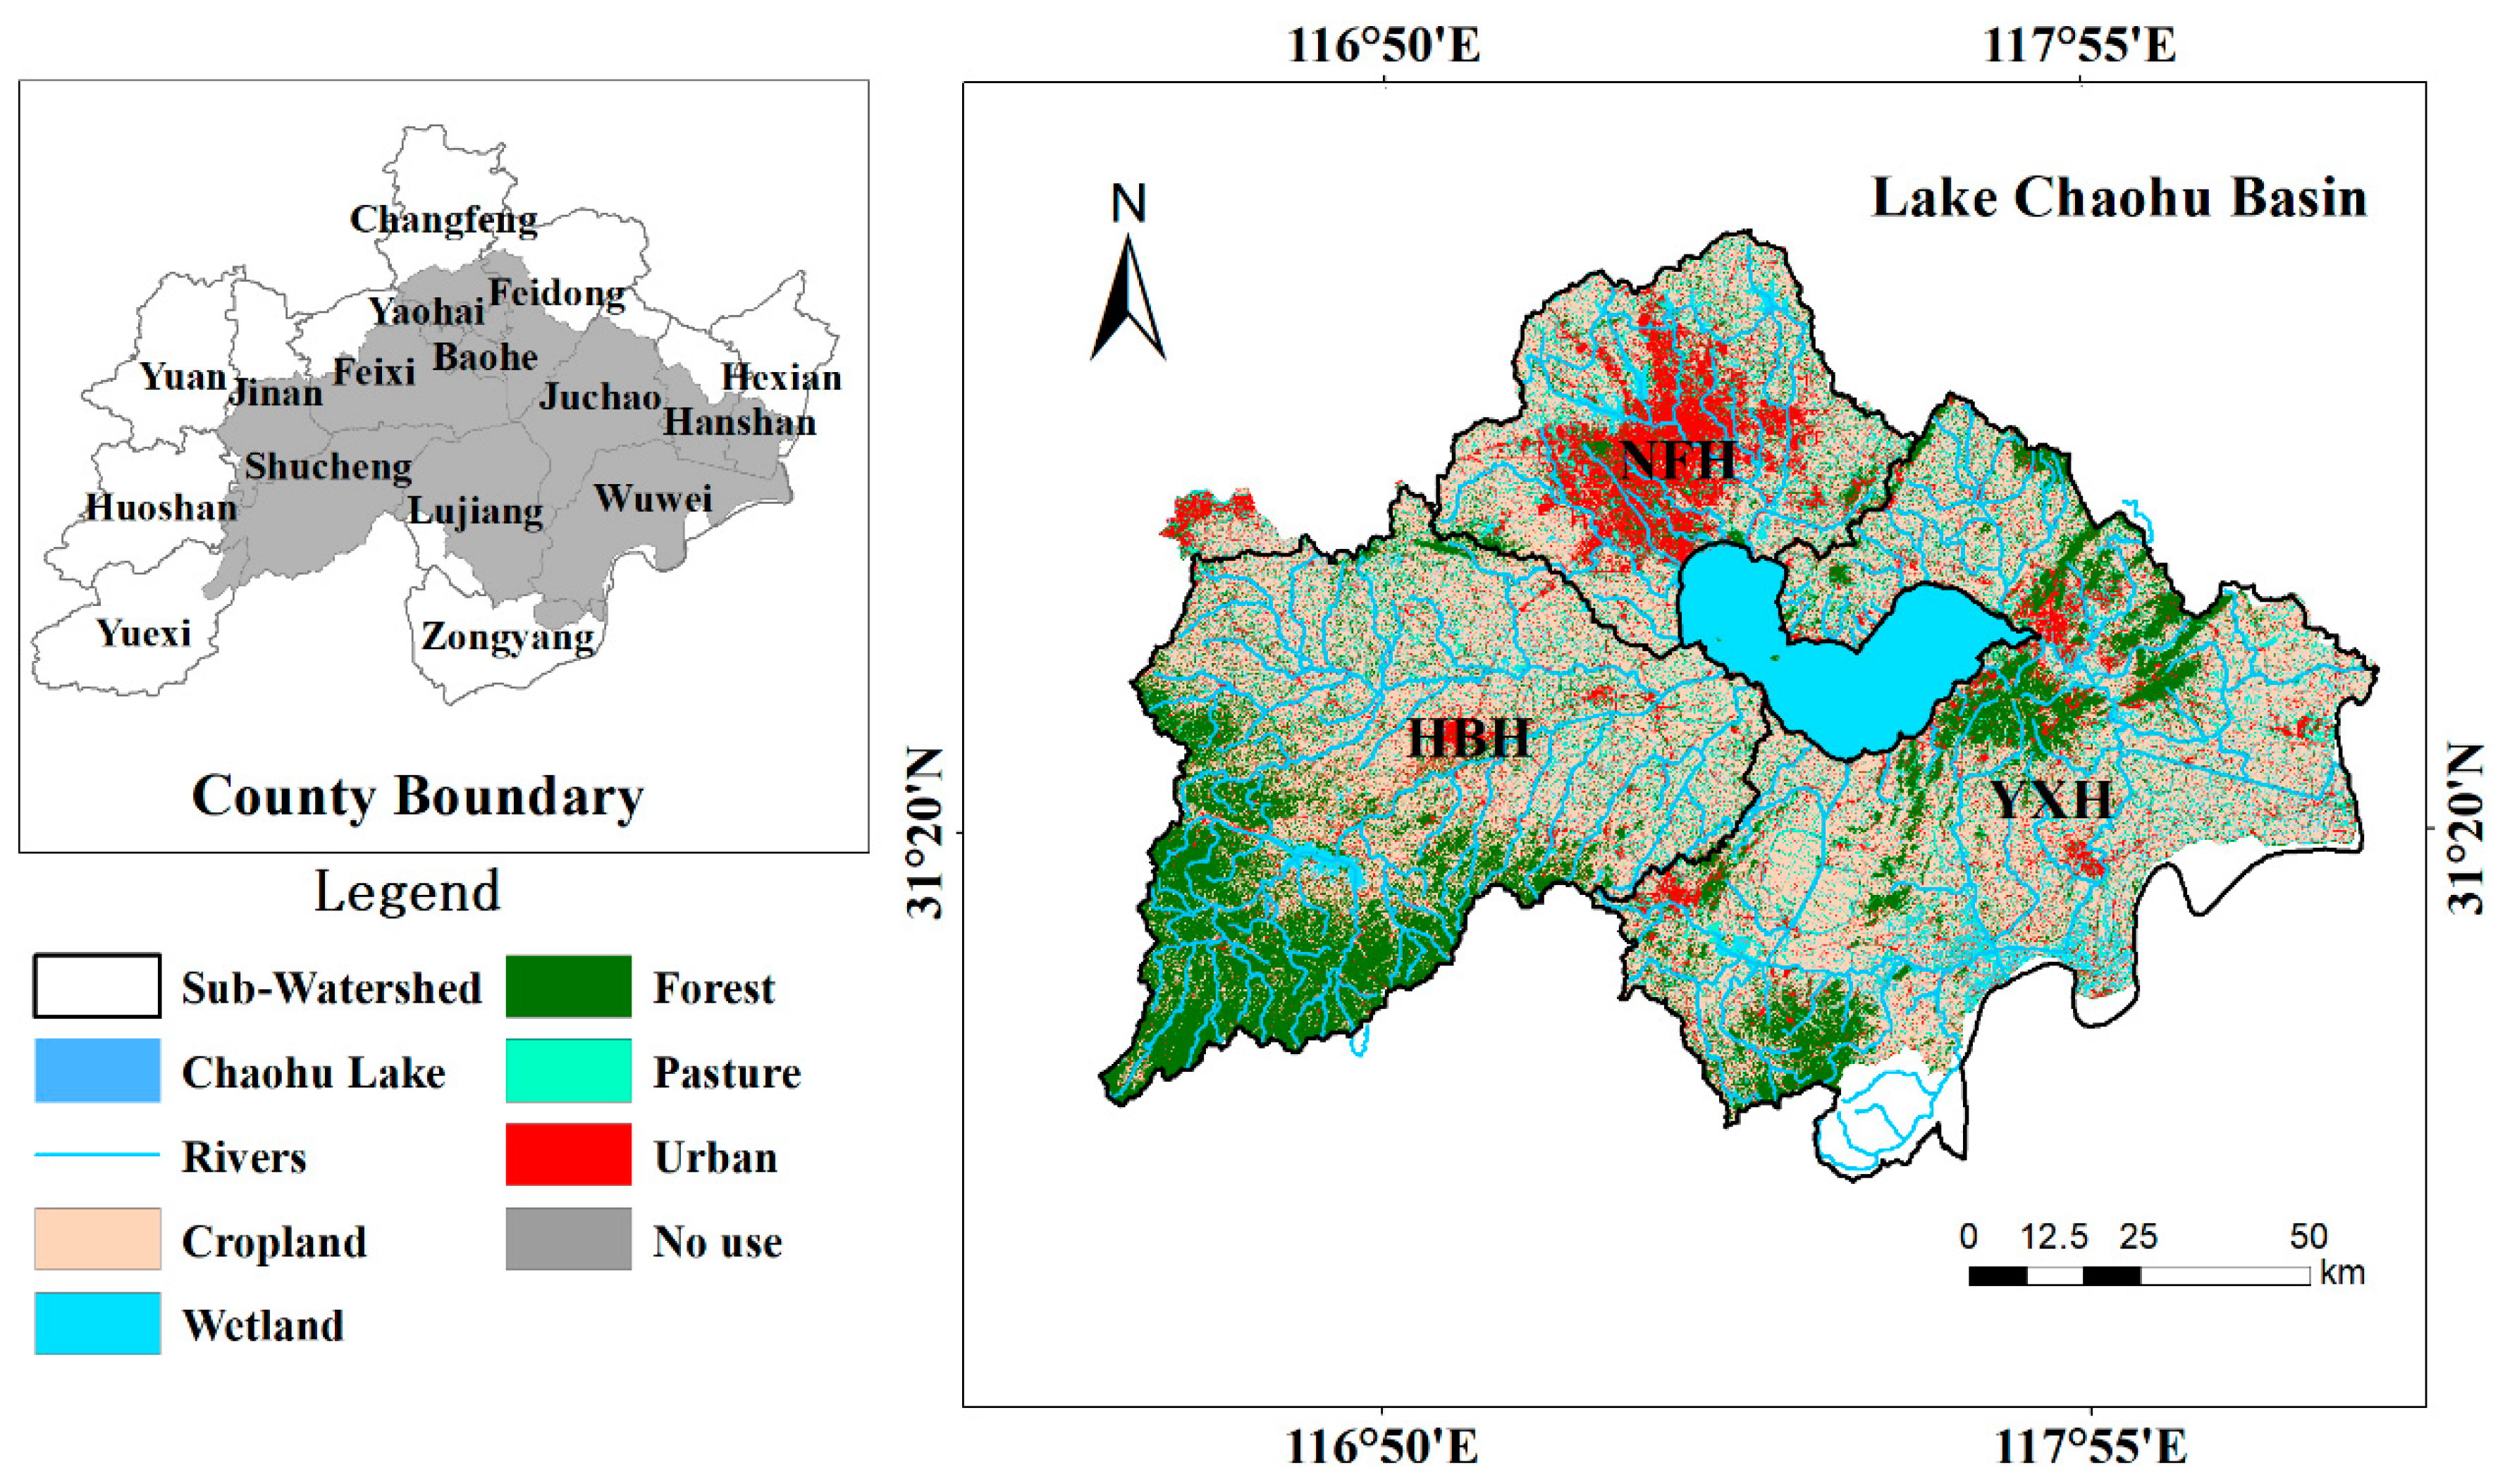
Chaohu Lake basin, situated in the central part of Anhui Province in China (30°58′40′′ N–32°06′00′′ N, 116°24′ 30′′ E–118°00′00′′, Figure 1), covers a total area of 13,500 km2 with altitudes ranging from −10 to 1632 m. Lake Chaohu (117°16′54″~117°51′46″, 31°25′28″~31°43′28″), which lies in the north of Hefei City, is a large shallow freshwater lake in the lower reaches of the Yangtze River, with an area of 770 km2. The main rivers that flow into Lake Chaohu include Hangbu, Fengle, Paihe, Shiwuli, and Nanfei Rivers. As the fifth-largest freshwater lake, Chaohu Lake is located in Hefei, an emerging city in inland China [17]. During the study period, the total population of the basin was more than 10,000,000, distributed among 15 districts and counties. The average population density of the Chaohu Lake basin increased from 521 persons per km2 in 1990 to 823 persons per km2 in 2018, approximately 1.6 times the nation’s average. The overall watershed urbanization percentage (calculated as the ratio of the urban population to the total population) ranged from 22% in 1990 to 52% in 2018. However, the urbanization rate indicated significant spatial variability, such as Hefei, whose rate reached 76% in 2018.
To analyze spatial differences, we used land cover data (5 × 5 m) to calculate the percentage provided by the local government. According to the percentage of land-use landscape, it can be divided into agricultural watershed (HBH River, farmland >60%), urban watershed (NFH River, cities > 20%), and mixed watershed (YHX River, farmland <60%, city <20%) [18,19].
2.2. Method for NANI Estimation
The NANI (net anthropogenic nitrogen inputs) have been widely used in assessing nitrogen in a watershed because it is simple and reliable [20]. As the principle of the NANI model calculation and parameter can be directly evaluated N inputs on a large scale and long-term average basis, it has been successfully applied in worldwide basins [21]. The NANI model is composed of four parts, N fertilizer application, food/feed net N input, atmospheric N deposition, and crop N fixation, each of the parts represent a significant source of N in watersheds [22].
The formulas for the estimation model of the NANI can be displayed as follows:
where NANI represents the net anthropogenic N inputs; Nchem represents the N fertilizer application (nitrogen fertilizer and compound fertilizer); Nfix represents the N fixation of crops; Ndep represents the atmospheric deposition of oxidized N (NOy), and Nim represents the net food/feed inputs of N (Figure 2). The unit for these four components is expressed in kilograms of N per square kilometer per year (kg N km−2 year−1) [23]. Sewage and animal wastes are not regarded as new inputs to a region as they are not newly fixed or imported nitrogen [24,25]. Nfix (mainly legumes) was estimated from the harvest area, and was the fixed rate per unit area for each crop type [26]. In the Chaohu Lake Basin, the main legume crops include soybean and peanuts, whose N fixation rates are 9600 kg N km−2 year−1 and 8000 kg N km−2 year−1, respectively [10]., defined as the sum of human food and livestock feed in N consumption, was calculated as N consumed by humans and livestock, after subtracting N production in the catchment based on a balanced food supply assumption [27,28]. Atmospheric deposition returning to the earth is mainly in the form of NHy, NOy, and organic N. According to a previous study [25], most of the NHy and organic N redeposits to the same basin from where they originated. Hence, only dry or wet NOy deposition was considered as new N inputs and only calculated oxidized N (NOx) deposition was considered for Ndep [29].
2.3. Data Collection
To ensure that the quality of the analysis and the proposed results were credible, our data collection was mainly obtained from the Statistical Yearbook of 15 counties from the local Statistics Department and Agriculture Bureau. Our data range was from 1990 to 2018, and the data are continuous. Data used include the population, nitrogen fertilizer applications (nitrogen fertilizer and compound fertilizer), yield and area of crops (rice, corn, wheat, soybean, peanut, vegetables, etc.), livestock quantity (cattle, sheep, pigs, and poultry), and aquiculture of every county. Although the basic data from the official Statistical Yearbook are highly credible, there is still missing data in some counties in earlier years before 2000. We refer to the annual agricultural Statistical Yearbook and Population census to eliminate possible errors. Data analysis, calculation, and display tools were completed in Excel, Rstudio, and Arcgis, respectively.
In this study, the land use-weighting method was used to distribute the NANI for the 15 counties considering the uneven land use patterns. Data for land use type since 1990 was derived from the Environment Data Cloud Platform Chinese Academy of Sciences (http://www.resdc.cn/ accessed on 9 December 2022). The amount of compound fertilizer can be calculated with N fertilizers by multiplying a factor r n (r n = 35.71%) [30]. Atmospheric N deposition is mainly composed of wet deposition and dry deposition, and the data can be obtained from a spatial dataset of atmospheric nitrogen deposition [31]. N content in various crop seeds, annual N emissions and production coefficient of human and animal were obtained from previous publications. More details of data sources and methods for disaggregating are discussed in the following sections.
3. Results
3.1. Temporal Variations in the NANI
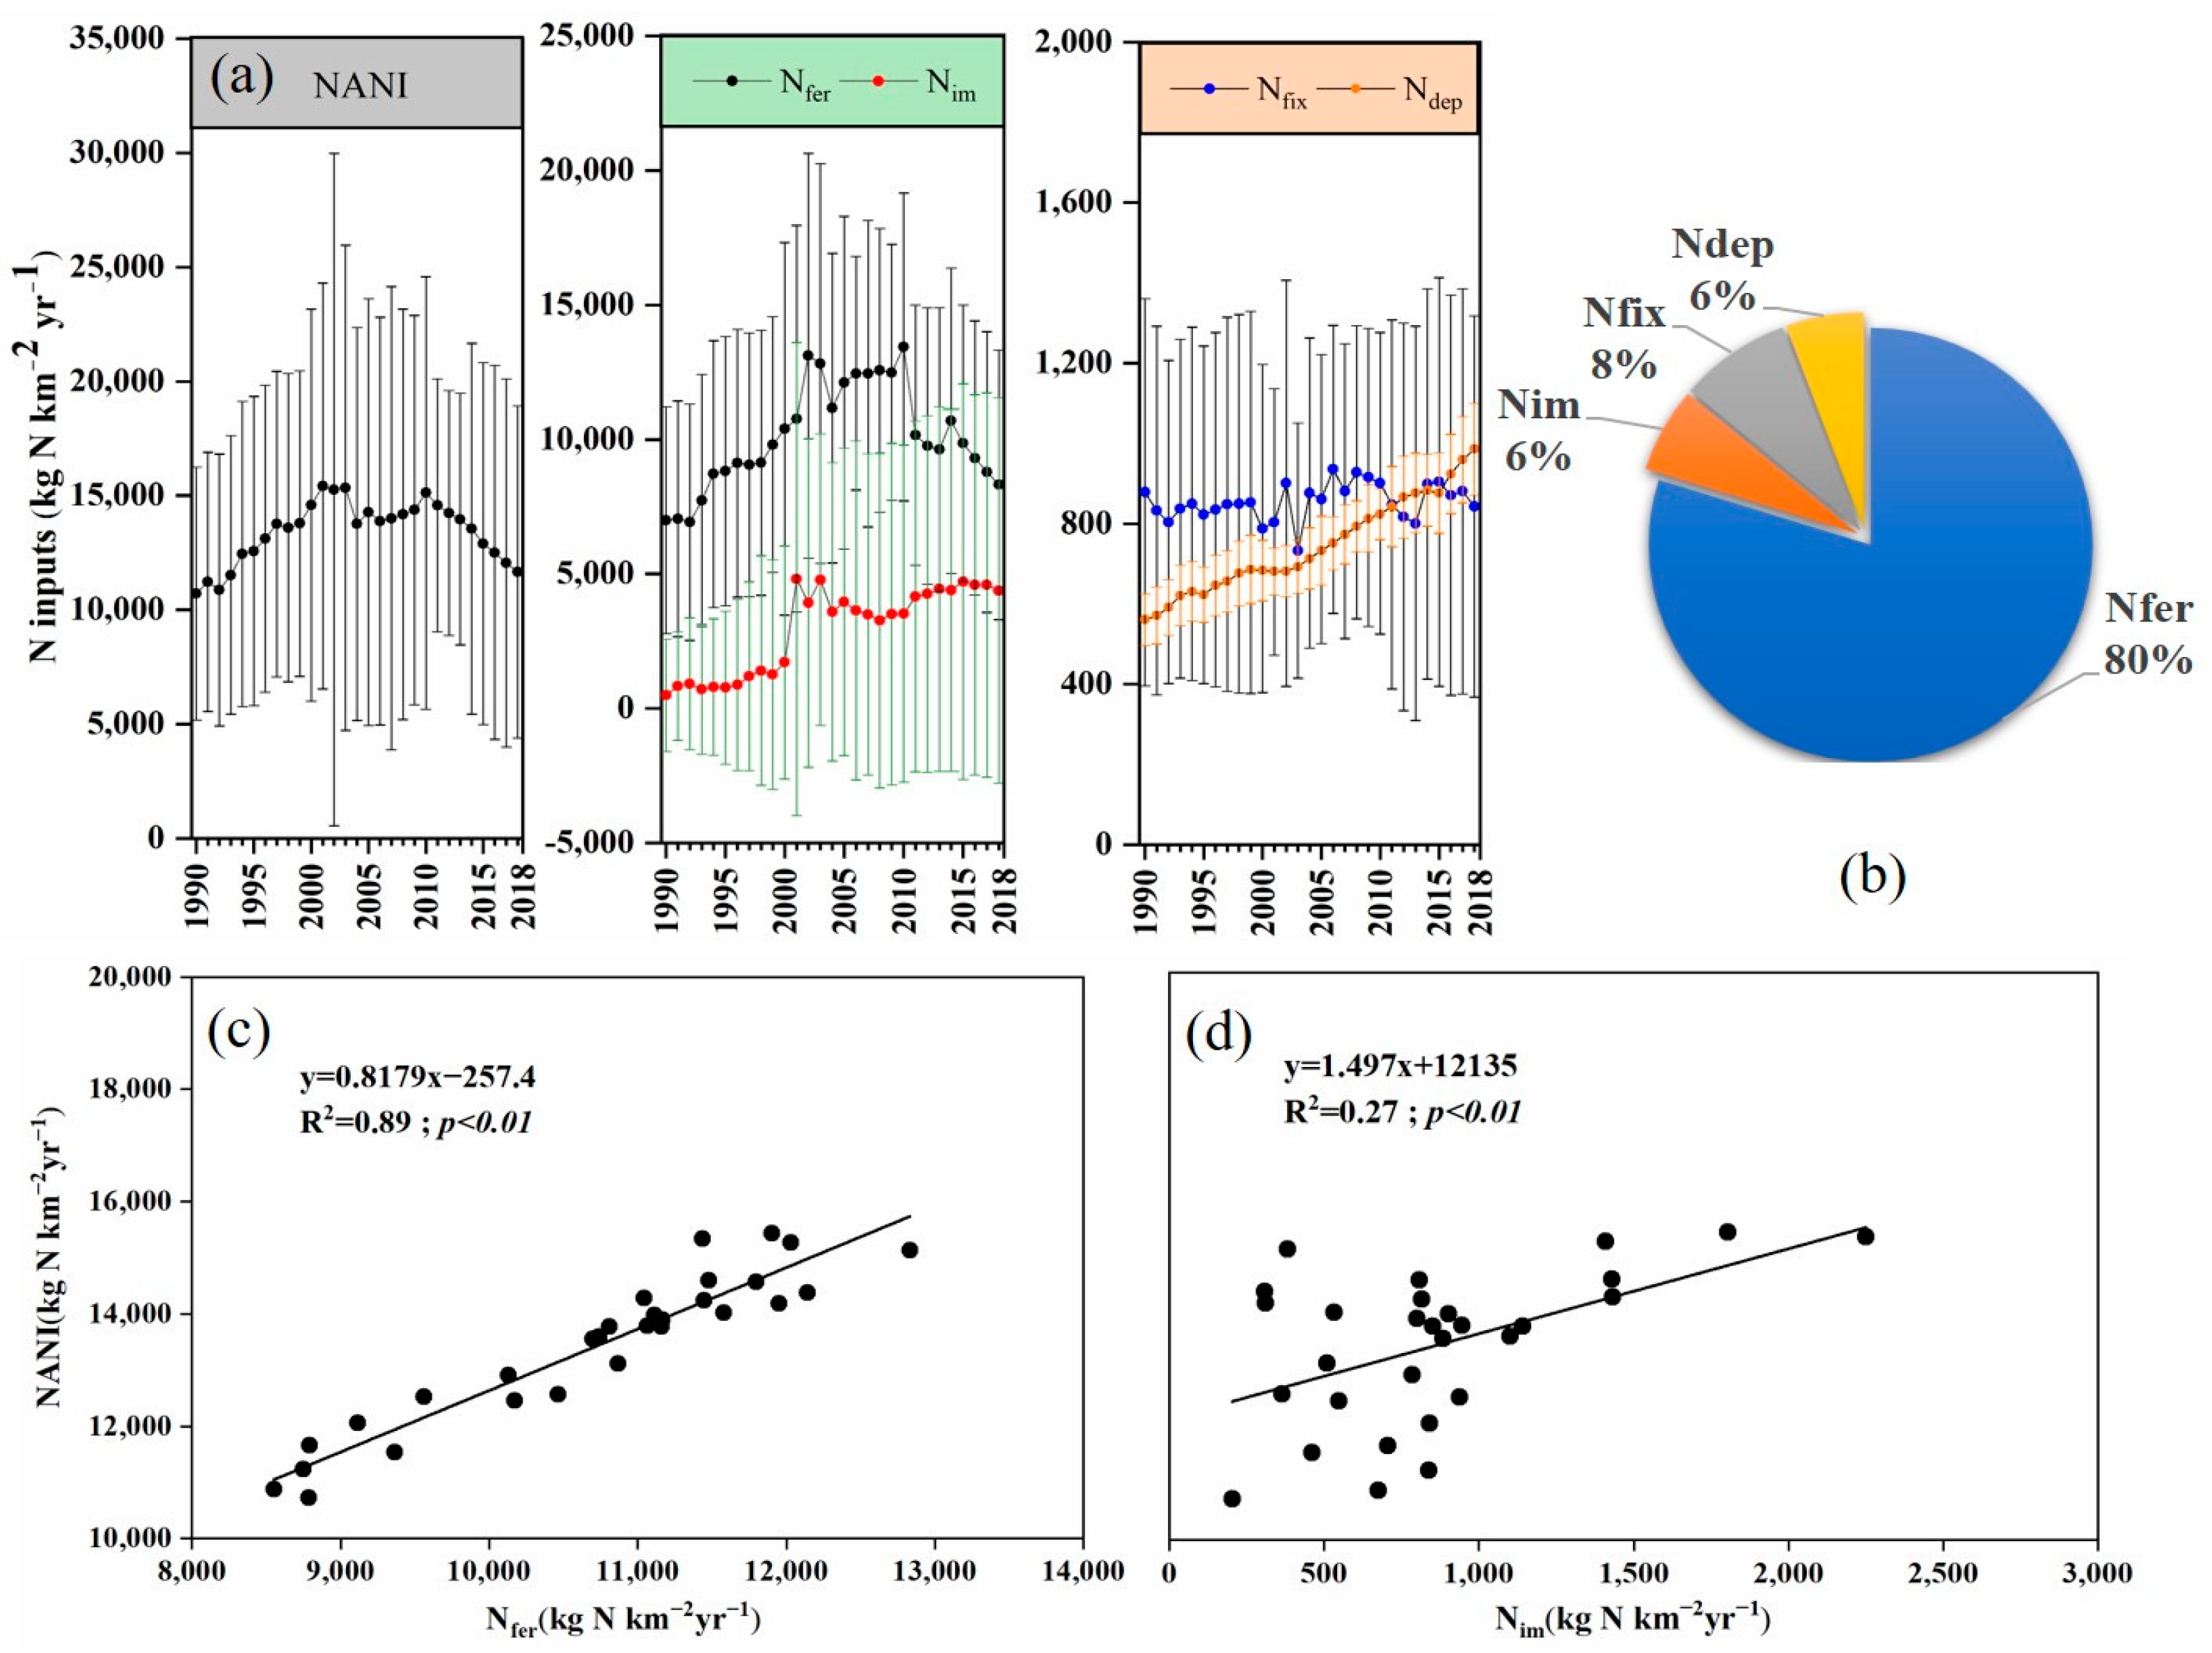
As a traditional agricultural area in the Yangtze River Basin, the NANI in the Chaohu Lake Basin increased from 10,721 kg N·km−2 year−1 to 11,660 kg N·km−2 year−1 during the study period (Figure 3a). The standard deviations of the NANI represent the values of 15 districts and counties within the Chaohu Lake Basin. The NANI were 15,124 kg N·km−2 year−1 in 2010, which is 8.7 times the world average and 3 times the average level in China [32]. Although data sources and scale conversions influenced results for the NANI, our consequences were close to relevant studies [33]. The N inputs of Anhui province [34] and Chaohu Lake basin were 13,121 kg N km−2 year−1,13,700 kg N km−2 year−1 in 2010, respectively. The temporal trend of nitrogen input was also similar to Huaihe River Basin at the same time [35]. Compared with other river basins in the same period, it was lower than the Huaihe and Taihu basins and higher than the Dianchi and Erhai basins [32]. The structure of the NANI was similar to other watersheds, and the proportion of fertilization appeared the highest, followed by food and feed input. The contribution of Nfer to the total nitrogen input decreased from 83% to 75%, and the Nim increased from 2% to 7%. This phenomenon was not unique to Chaohu Lake Basin, and similar results occurred in the Huaihe River Basin and Taihu Lake Basin [36,37].
The proportion of each component of the NANI was calculated by the average value from 1990 to 2018 (Figure 3b). Fertilizer N application was overwhelming in the whole basin, accounting for 79% of the total N input. Fertilizer N application reached 12,832 kg N km−2 year−1 in 2010, making up 85% of total N inputs. This indicates that a reasonable reduction in nitrogen fertilizer applications could effectively reduce the nitrogen inputs from human activities. Food and feed N imports increased significantly, accounting for 3–15% of the total N input. The proportion of biological nitrogen fixation and atmospheric deposition varied less, accounting for 8% and 6% of the total N input, respectively. A strong linear fit function of the NANI with fertilizer N application was observed (R2 = 0.89, p < 0.01), which illustrates that fertilizer N application occupies the absolute proportion since 1990 (Figure 3c). The NANI show a falling trend after 2010, mainly resulting from decreasing fertilizer N application. The relationship between the NANI and imports of N in feed was of minor importance (R2 = 0.26, p < 0.01) (Figure 3d).
The NANI exhibited a three-stage pattern from 1990 to 2018 in the Chaohu Lake Basin (Figure 3a). Each stage was related to socio-economic development and water pollution prevention in this region. There appears a rapid upward trend during the period 1990–2000; because insufficient pollution emission control measures and treatment effects were limited. Due to population gathering and agricultural development, it became the most polluted lake in China. The total nitrogen water quality in the lake reached the inferior V standard in this period [38]. Although the planned investment attended 5.14 billion yuan to Chaohu Lake water pollution treatment, the investment completion rate occupied only 45%. As the governmental level improved from 2000 to 2010, industrial structure adjustment and investment in special treatment planning increased gradually. In 2003, a catastrophic flood triggered a sharp reduction in crop yield, leading to the increased import of N in feed. In 2008, due to the acceleration of economic and urbanization development, the effects of the original control measures were not obvious. Subsequently, a significant and steady decline began from 15,124 kg N km−2 year−1 in 2010 to 11,660 kg N km−2 year−1 in 2018.
Since 2010, government departments have implemented policies to reduce nitrogen input, such as water pollution prevention and a zero-growth-fertilizer campaign [39]. The N fertilizer application rate increased approximately 200 times during 1949–2012, but the N use efficiency of crops was less than 50%, suggesting that most N from fertilizer application flowed away [12]. The urbanization rate of Hefei has nearly doubled in the past 20 years, which will inevitably bring more nitrogen input. These problems are a crisis that will challenge the local government on the environmental protection policy in the future.
3.2. Spatial Variations in the NANI
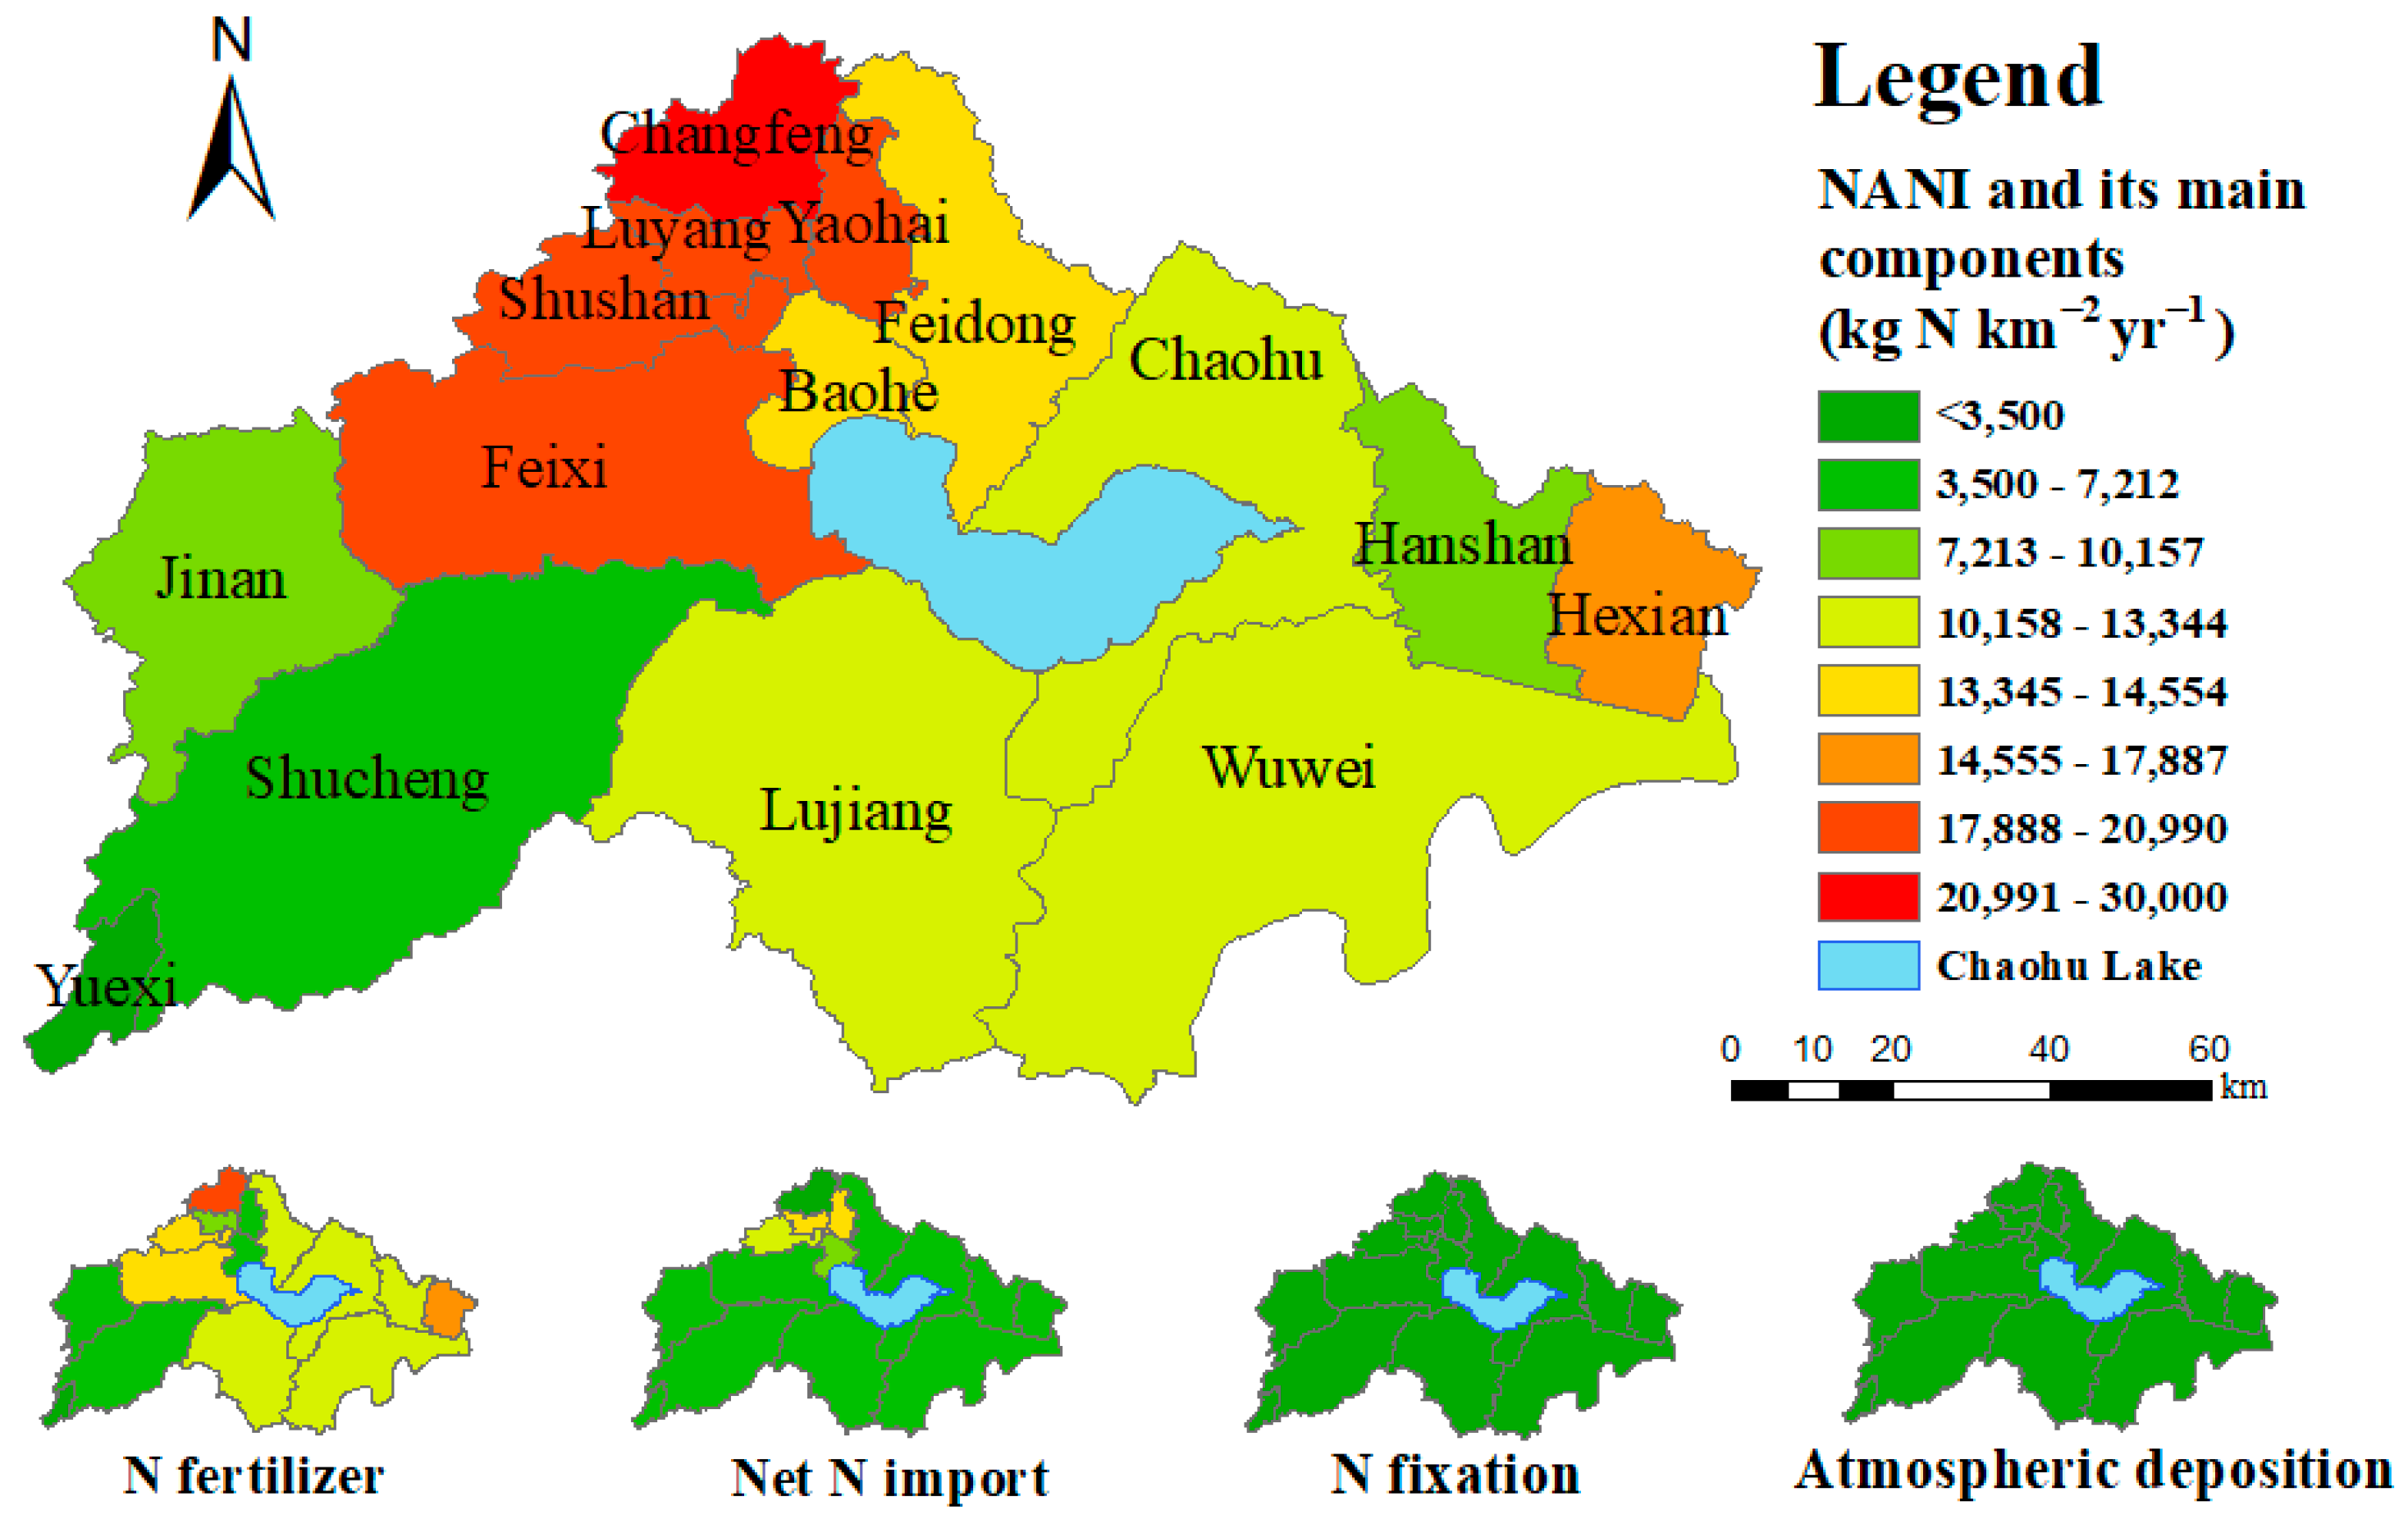
The spatial heterogeneity in the NANI varies in different regions of the Chaohu Lake Basin due to variations in social development. We use the county-level average value from 1990 to 2018 to analyze the spatial characteristics. The NANI in the 15 counties varied from 2654 to 26,728 kg N km−2 year−1; the highest values were concentrated in urban regions. The distributions at the county level showed that the NANI were high in the northwestern region where urban land and farmland were dominant, especially Yaohai, Luyang, and Shushan. The value attained 21,125 kg N km−2 year−1, 24,362 kg N km−2 year−1 and 26,728 kg N km−2 year−1, respectively (Figure 4). The distribution pattern of the main components (N fertilizer and N net import) was different from that of the NANI. The N fertilizer was concentrated in Changfeng and Feixi, but the N net import was concentrated in the city. The farmland and construction land in these areas were densely distributed, so the pressure on the ecological environment was more significant than in other regions. In contrast, the distribution of the NANI was low in the southwest (Shucheng) because the woodlands were widely distributed and were less disturbed by humans.
Results also show that the NANI intensity in the Hefei urban agglomeration area was much higher than in other regions [40,41]. However, with such a large proportion of agricultural fertilization in the watershed, was the main reason for the high NANI in urban areas only attributed to the food and feed inputs? What role did fertilization play in urban areas?
3.3. Driving Force for Analysis of the NANI in the Whole Basin
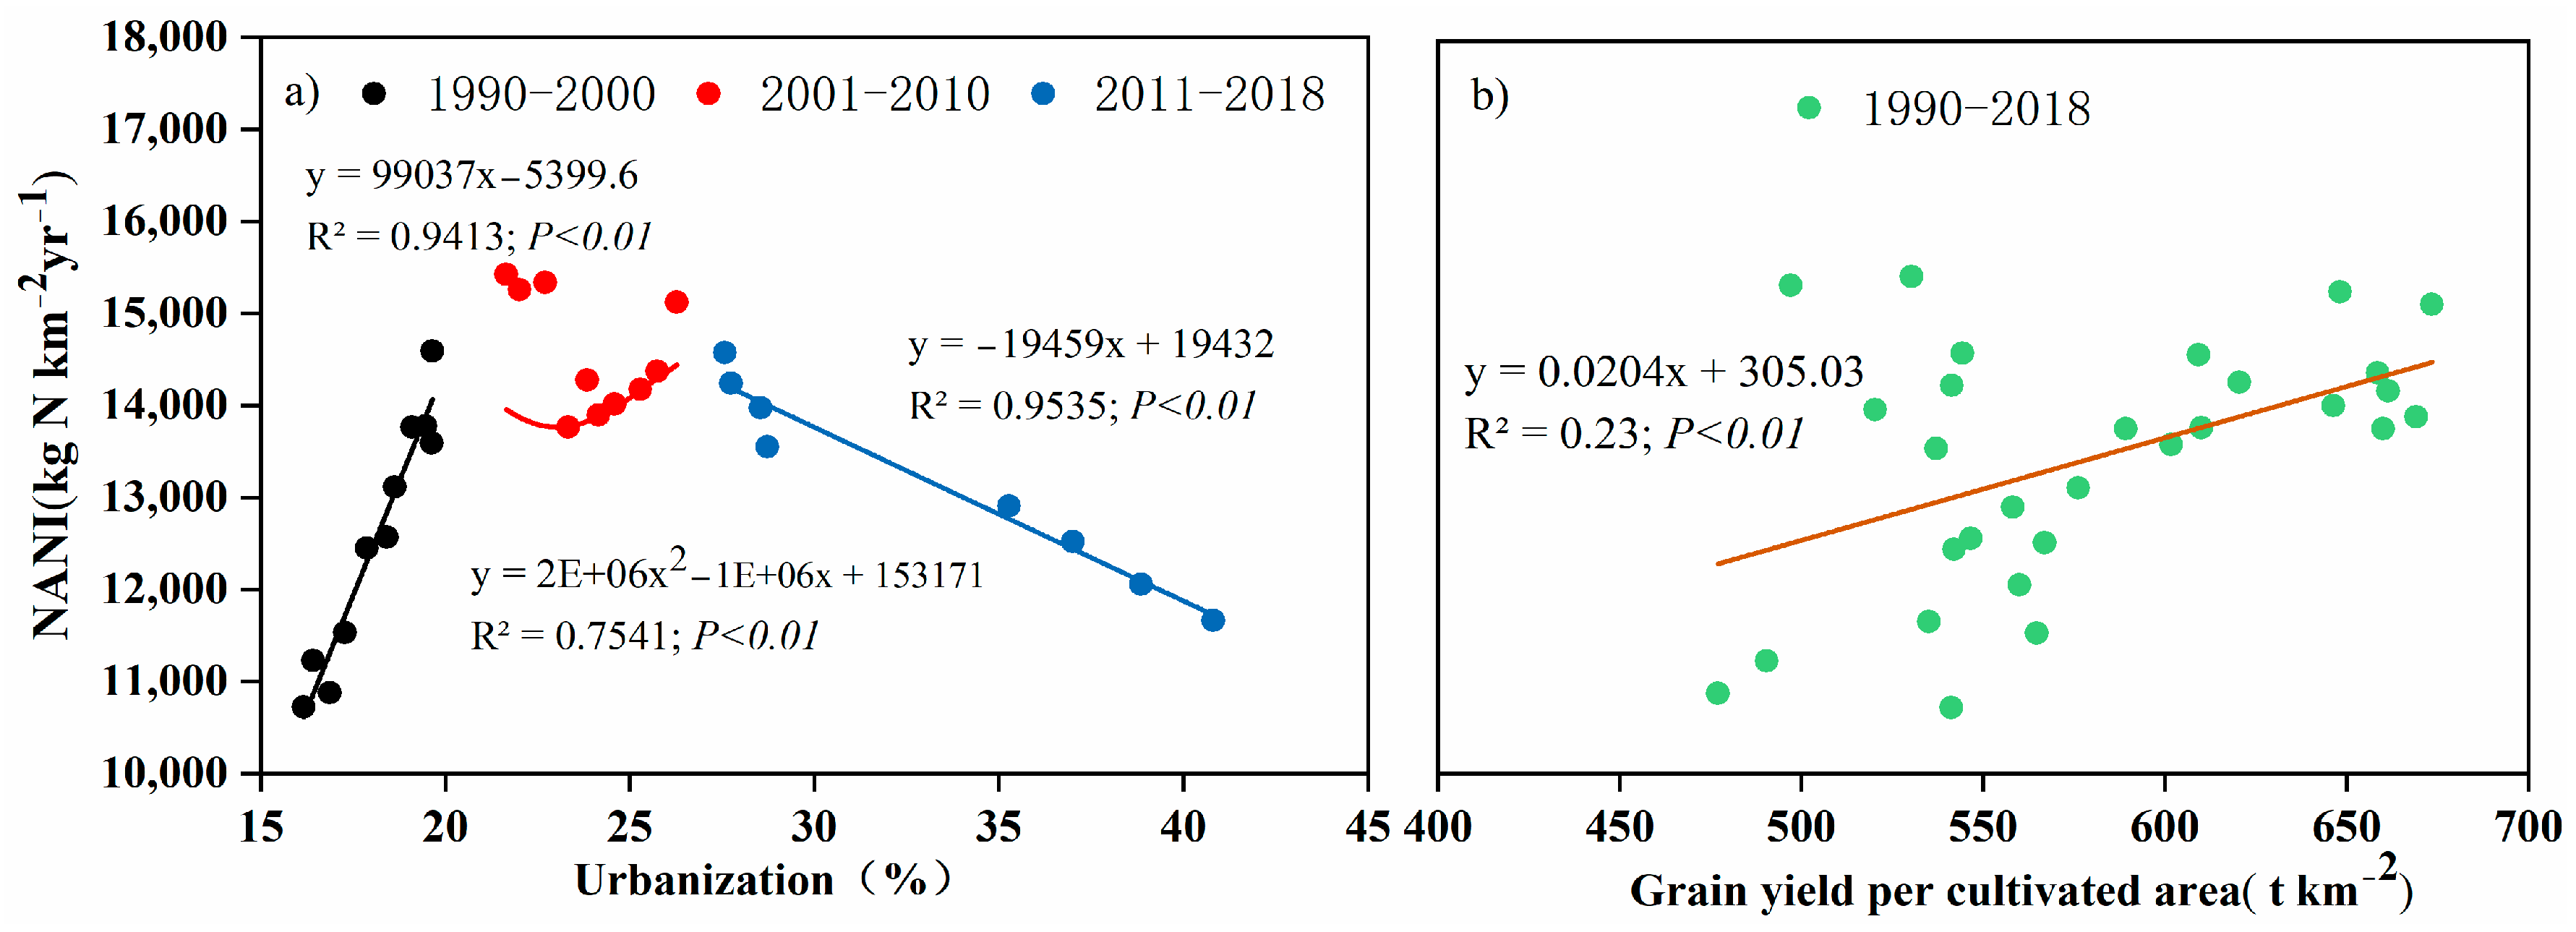
The quantities of the NANI exhibited a three-stage pattern over time (Figure 5a). In the uptrend stage (1990–2000), urbanization drove the rapid increase in nitrogen input because of lacking governance. The relationship between grain yield and the NANI was not significant (R2 = 0.23, p < 0.01). In the fluctuation stage (2001–2010), the speed of pollution prevention could not keep up with the speed of urbanization. In the downtrend stage (2011–2018), water pollution prevention measures from the perspective of the watershed were implemented, and the development of urbanization also promoted nitrogen reduction policies. Intense demands for grains in China, coupled with rapid economic growth and urbanization, have resulted in an increasing need for N [4]. The temporal variation of the NANI has fluctuated hugely over the past 30 years, demonstrating the effect of a rising trend in socioeconomic development on nitrogen input. The urbanization rate increased from 22% to 50% (increased by 23%) during 1990–2018, suggesting that the drivers of the NANI showed an apparent temporal change during the 30 years. Urbanization was considered to be the main driving force behind the increased NANI from 1990 to 2000 (R2 = 0.94, p < 0.01). In this period, lake Chaohu was already in a stage of heavy eutrophication, whose water quality had become worse than the surface water quality standard of Grade V. Benefiting from the country’s initial focus on the ecological environment, the government invested heavily in the treatment of the ecosystem in the 2000s. Urbanization showed a noisy and positive relationship with the NANI (R2 = 0.75, p < 0.01) from 2001 to 2010, suggesting that the treatment effect was not obvious. In 2007, nitrogen inputs in the urban rivers (Nanfei River, Shiwuli River, and Pai River) accounted for 72% of the whole basin [42].
After 2010, with measures for water pollution control in the Chaohu Lake Basin implemented, the NANI showed a rapid downward trend and a significant negative linear relationship with the growth rate of urbanization (R2 = 0.93, p < 0.01). The urbanization rate increased from 27% in 2011 to 43% in 2018. After a series of policies were implemented to reduce nitrogen input, including zero-growth fertilizer campaigns, the governance was unprecedentedly enhanced. As a result, nitrogen fertilization decreased from 16.4 tons to 11.3 tons during 2010–2018. Urbanization reduced fertilizer application by taking up more croplands. Meanwhile, urbanization promoted socio-economic development, leading to environmental pollution control investments increasing from 4.8 billion yuan in 2000 to 10.8 billion yuan in 2015 [43]. In this tendency, the effect of urbanization on nitrogen input will no longer be obvious in the future, and the driving factor of food production may begin to appear.
3.4. Characteristics and Driving Factors of Nitrogen Input in Three Sub-Catchments
The spatial heterogeneity of the NANI varies in different basins of the Chaohu lake basin because of economic and social development. The urbanization rate of the urban watersheds has increased from 38% to 66%, with an average of 52%, which is 3 times and 7.5 times that of agricultural watersheds and mixed watersheds, respectively. The urban basin was the main contribution area of the NANI, which was twice that of the other two basins (Figure 6). The apparent dominance of the NANI by fertilizer from urban watersheds seems confusing. How can urban watersheds dominate the NANI when the contribution was from Nfer This was because agricultural fertilization was also the dominant component of fertilization in urban areas. However, Nfer in urban watersheds had been basically the same as Nim, and the inputs of Nfer were even higher than Nim. The reason was that in the peripheral areas of the city, such as Shushan and Changfeng, a large amount of agricultural planting was distributed. The implementation of the experimental field exacerbated the input intensity of nitrogen fertilizer, especially in 2003–2010. The phenomenon reflects that the decisive intervention of human activities in urban watersheds not only has the problem of population aggregation but also has strong agricultural production activities. This also reflects that in the middle period of urbanization (2000–2010), the rapid development of urbanization in Hefei and imperfect management measures led to increased N input.
The LOWESS method refers to locally weighted polynomial regression, which was used to determine the dependence of y on x when “… the signal is embedded in noise” [44,45]. LOWESS analysis supported by linear regression showed that Nim was positively correlated with urbanization (Figure 7, p < 0.01). We believed that due to the large population in urban watersheds, it was necessary to introduce a large amount of food/feed nitrogen inputs. This conclusion was similar to the research of the basins with high population density and urbanization levels [46,47]. The result indicates that the inputs of N in urban watersheds were relatively high and the threats to the environment were significant. For agriculture and mixed watersheds, the urbanization rate was low (urbanization <20%). Hence, local agricultural production could meet the needs of local population and livestock, causing the impact of urbanization on Nim which was not obvious. Those changes reflect the decreased contribution of agriculture to N inputs.
The rapid development of urbanization has led to the rise in population and associated rapid increase of nitrogen input. At the same time, management measures and supporting facilities cannot keep up with development, resulting in excessive nitrogen input into the receiving water body, causing environmental problems such as the eutrophication of river [48]. At the same time, planting and animal husbandry are well developed, only 30% of crop consumption is used to meet population needs, and 70% of crop consumption is applied to animal feed [12]. The dual pressures of urbanization and food demand have led to a rapid increase in nitrogen input. The input of N far exceeds the storage capacity of the basin’s ecosystem, and excessive N is exported through the river. The main driving force of the NANI identified by the long-term series data is urbanization. In the long run, the process of urbanization can help reduce the nitrogen input generated by human activities.
4. Discussion
On a whole basin basis, the NANI have increased from 13,779 kg N km−2 year−1 in 1990 to 15,124 kg N km−2 year−1 in 2010. However, the rapid development of the urban basin has led to a rapid increase of imports of N in feed (Figure 7). Combined with the proportion from food and feed N imports, the total proportion of N inputs from the two sources accounts for more than 90% of the NANI for the basin. The main reason for the NANI change was directly related to the fertilizer N application and urbanization. Food security and urbanization were the main challenges.
During 1990–2010, N inputs from anthropogenic sources to agricultural basins had increased from 3680 kg N km−2 year−1 to 6464 kg N km−2 year−1 (Figure 6). Agriculture activities are intense in the southwest, and high-intensity fertilization combined with high precipitation and steep slopes were the main reason causing serious nitrogen loss in the water body. Furthermore, the mountain areas are mainly distributed in the southwest and middle-east area surrounding Chaohu Lake, where large surpluses of N can easily access the lake. These comprehensive natural and anthropogenic factors accelerate the N loss process. N inputs from urban basins increased from 5079 kg N km−2 year−1 to 13,064 kg N km−2 year−1 (Figure 6). Population density exceeded 3000 individuals per km−2 in 2018, compared to only 1500 individuals per km−2 in 1990, an increase of 1500 individuals per km−2 in three decades. Although N inputs have decreased after 2010, to feed the additional population, N inputs to the basin are required based on a balanced supply and demand. Similar to the spatial patterns of N input distribution, urban rivers are significant contributors to indirect N2O emissions, and the value is 10–20 times greater than other watersheds [49]. This is related to the concentration of the population and the great demand for food and feed. To deal with point source pollution, the local government constructed 18 municipal sewage plants in urban areas in 2012. However, the urban population will continue to surge, and the risk of point source pollution may continue to expand [47]. Consideration should be given to landscape retention measures such as ditches and wetlands to reduce nitrogen output and improve river water quality. The overall change in the water quality of Chaohu Lake in the past 30 years was consistent with the general trend of NANI changes, indicating that the NANI model was a reliable tool for exploring water quality.
It was worth noting that the article estimates the changes in the NANI through a long-term series, which accurately reflects the changes in nitrogen input in the past 30 years. However, as a reliable method for estimating non-point-source pollution, the NANI model has specific errors in urban areas with severe point source pollution. The northwestern part of the basin is a typical urban watershed with point source pollution. Fertilization and food feed account for the main proportion in urban watersheds, although urbanization decreases fertilization. However, the reduction of fertilization also means that the grain yield is reduced, and more food and feed inputs are needed. Feed/feed nitrogen inputs were discharged into the river basin by people, and finally discharged out of the river basin through urban domestic sewage. In this sense, the variations of point source inputs are also the reason for the nitrogen pollution of rivers in urban basins [50]. However, the problems of Chaohu are multiple, including the need to develop the economy, protect agriculture, and improve the water environment. The inherent tension between these problems will require the coordination of different goal-directed policies to make progress in the future. To solve the water problem in rapidly developing areas, it is no longer possible to further reduce nitrogen only from the perspective of sewage treatment plants and ecological construction. The solution must acknowledge the fundamental relationship between N and human activities.
5. Conclusions
This study determined the temporal and spatial heterogeneity of the NANI in the Chaohu Lake Basin and analyzed the driving effects of urbanization and food production in different types of watersheds. The time trend of the NANI includes an ascending trend (1990–2000), fluctuating trend (2001–2010), and falling trend (2011–2018), with an average value of 13,480 kg N km−2 year−1. From the perspective of the basin, the main driving force of the NANI is urban at different stages, with the relationship between the two showing positive correlation, volatility, and negative correlation. The relationship between food production and the NANI shows a positive correlation, but the relationship is weak. The overall spatial pattern of the NANI is high in the northwest, followed by the east, and low in the southwest. This pattern shows an obvious spatial heterogeneity of nitrogen input from human activities. The reason is closely related to factors such as land use, urbanization, and food production. Based on this characteristic, the basin is divided into urban, agricultural, and mixed basins. There is a hierarchy of the NANI values in different basins, with urban basin > mixed basin > agricultural basin. Although the trajectory of individual watersheds is generally consistent with that of the entire watershed, the driving mechanisms are different within the component watersheds. For urban regions, as urbanization increases, the governance level improves, and the occupation of cultivated land reduces the amount of fertilizer. Although more grain nitrogen input has been introduced, the demand is much lower than fertilization. It is necessary to pay attention to point source pollution and raise the standard of sewage treatment in urban watersheds. In agriculture and mixed watersheds, food production and livestock breeding management should start with policy transformation to improve fertilizer utilization and ecological compensation mechanisms.
Author Contributions
Conceptualization: F.Z. and H.L.; methodology: W.Z. and J.P.; software, validation, and formal analysis: F.Z.; investigation, resources, and data curation: F.Z. and Y.L.; writing—original draft preparation: F.Z.; writing, review, and editing: F.Z., H.L., W.Z. and Y.L. All authors have read and agreed to the published version of the manuscript.
Funding
This study was financially supported by the Major Science and Technology Program for water pollution control and treatment, China (No.2017ZX07603-01).
Conflicts of Interest
The authors declare no conflict of interest.
References
- Howarth, V.R.W. Nitrogen Limitation on Land and in the Sea: How Can It Occur? Biogeochemistry 1991, 13, 87–115. [Google Scholar]
- Galloway, J.N.; Schlesinger, W.H.; Levy, H.; Michaels, A.; Schnoor, J.L. Nitrogen Fixation: Anthropogenic Enhancement-Environmental Response. Glob. Biogeochem. Cycle. 1995, 9, 235–252. [Google Scholar] [CrossRef] [Green Version]
- Esculier, F.; Noe, J.L.; Barles, S.; Billen, G.; Creno, B.; Garnier, J.; Lesavre, J.; Petit, L.; Tabuchi, J.P. The biogeochemical imprint of human metabolism in Paris Megacity: A regionalized analysis of a water-agro-food system. J. Hydrol. 2019, 573, 1028–1045. [Google Scholar] [CrossRef] [Green Version]
- Feng, W.L.; Liu, Y.S.; Qu, L.L. Effect of land-centered urbanization on rural development: A regional analysis in China. Land Use Pol. 2019, 87, 4072. [Google Scholar] [CrossRef]
- Xie, C.; Huang, X.; Mu, H.Q.; Yin, W. Impacts of Land-Use Changes on the Lakes across the Yangtze Floodplain in China. Environ. Sci. Technol. 2017, 51, 3669–3677. [Google Scholar] [CrossRef]
- Viaroli, P.; Soana, E.; Pecora, S.; Laini, A.; Naldi, M.; Fano, E.A.; Nizzoli, D. Space and time variations of watershed N and P budgets and their relationships with reactive N and P loadings in a heavily impacted river basin (Po river, Northern Italy). Sci. Total Environ. 2018, 639, 1574–1587. [Google Scholar] [CrossRef]
- Zhang, W.S.; Swaney, D.P.; Li, X.Y.; Hong, B.; Howarth, R.W.; Ding, S.H. Anthropogenic point-source and non-point-source nitrogen inputs into Huai River basin and their impacts on riverine ammonia–nitrogen flux. Biogeosciences 2015, 12, 4275–4289. [Google Scholar] [CrossRef] [Green Version]
- Huang, J.C.; Lee, T.Y.; Lin, T.C.; Hein, T.; Lee, L.C.; Shih, Y.T.; Kao, S.J.; Shiah, F.K.; Lin, N.H. Effects of different N sources on riverine DIN export and retention in a subtropical high-standing island, Taiwan. Biogeosciences 2016, 13, 1787–1800. [Google Scholar] [CrossRef] [Green Version]
- Gold, A.C.; Thompson, S.P.; Piehler, M.F. The Effects of Urbanization and Retention-Based Stormwater Management on Coastal Plain Stream Nutrient Export. Water Resour. Res. 2019, 55, 7027–7046. [Google Scholar] [CrossRef]
- Zhang, Y.; Ni, H.; Bai, L.; Cheng, Q.; Zhang, H.; Wang, S.; Xie, M.; Zhao, D.; Su, H. The short-term association between air pollution and childhood asthma hospital admissions in urban areas of Hefei City in China: A time-series study. Environ. Res. 2019, 169, 510–516. [Google Scholar] [CrossRef]
- Pang, A.P.; Jiang, S.Y.; Yuan, Z.W. An approach to identify the spatiotemporal patterns of nitrogen flows in food production and consumption systems within watersheds. Sci. Total Environ. 2018, 624, 1004–1012. [Google Scholar] [CrossRef]
- Li, Y.; Yen, H.; Lei, Q.; Qiu, W.; Luo, J.; Lindsey, S.; Qin, L.; Zhai, L.; Wang, H.; Wu, S.; et al. Impact of human activities on phosphorus flows on an early eutrophic plateau: A case study in Southwest China. Sci. Total Environ. 2020, 714, 136851. [Google Scholar] [CrossRef]
- Liu, J.G.; Yang, H.; Savenije, H.H.G. China’s move to higher-meat diet hits water security. Nature 2008, 454, 397. [Google Scholar] [CrossRef] [PubMed] [Green Version]
- Gao, W.; Howarth, R.W.; Hong, B.; Swaney, D.P.; Guo, H.C. Estimating net anthropogenic nitrogen inputs (NANI) in the Lake Dianchi basin of China. Biogeosciences 2014, 11, 4577–4586. [Google Scholar] [CrossRef] [Green Version]
- Gao, W.; Howarth, R.W.; Swaney, D.P.; Hong, B.G.; Guo, H.C. Enhanced N input to Lake Dianchi Basin from 1980 to 2010: Drivers and consequences. Sci. Total Environ. 2015, 505, 376–384. [Google Scholar] [CrossRef] [PubMed]
- Zhao, W.; Zou, Y. Hefei: An emerging city in inland China. Cities 2018, 77, 158–169. [Google Scholar] [CrossRef]
- Zhang, W.; Li, H.; Xiao, Q.; Li, X. Urban rivers are hotspots of riverine greenhouse gas (N(2)O, CH(4), CO(2)) emissions in the mixed-landscape chaohu lake basin. Water Res. 2021, 189, 116624. [Google Scholar] [CrossRef]
- Cheng, H.; Lin, C.; Wang, L.; Xiong, J.; Peng, L.; Zhu, C. The Influence of Different Forest Characteristics on Non-point Source Pollution: A Case Study at Chaohu Basin, China. Int. J. Environ. Res. Public Health 2020, 17, 1790. [Google Scholar] [CrossRef] [Green Version]
- Hong, B.; Swaney, D.P.; Mccrackin, M.; Svanbäck, A. Advances in NANI and NAPI accounting for the Baltic drainage basin: Spatial and temporal trends and relationships to watershed TN and TP fluxes. Biogeochemistry 2017, 133, 245–261. [Google Scholar] [CrossRef] [Green Version]
- Hayakawa, A.; Woli, K.P.; Shimizu, M.; Nomaru, K.; Kuramochi, K.; Hatano, R. Nitrogen budget and relationships with riverine nitrogen exports of a dairy cattle farming catchment in eastern Hokkaido, Japan. Soil Sci. Plant Nutr. 2009, 55, 800–819. [Google Scholar] [CrossRef] [Green Version]
- Swaney, D.P.; Hong, B.; Selvam, A.P.; Howarth, R.W.; Ramesh, R.; Purvaja, R. Net anthropogenic nitrogen inputs and nitrogen fluxes from Indian watersheds: An initial assessment. J. Mar. Syst. 2015, 141, 45–58. [Google Scholar] [CrossRef]
- Borbor-Cordova, M.J.; Boyer, E.W.; McDowell, W.H.; Hall, C.A. Nitrogen and phosphorus budgets for a tropical watershed impacted by agricultural land use: Guayas, Ecuador. Biogeochemistry 2006, 79, 135–161. [Google Scholar] [CrossRef]
- Howarth, R.W.; Billen, G.; Swaney, D.; Townsend, A.; Jaworski, N.; Lajtha, K.; Downing, J.A.; Elmgren, R.; Caraco, N.; Jordan, T.; et al. Regional nitrogen budgets and riverine N&P fluxes for the drainages to the North Atlantic Ocean: Natural and human influences. Biogeochemistry 1996, 35, 75–139. [Google Scholar]
- Howarth, R.W. Human acceleration of the nitrogen cycle: Drivers, consequences, and steps toward solutions. Water Sci. Technol. 2004, 49, 7–13. [Google Scholar] [CrossRef] [PubMed]
- Han, H.J.; Allan, J.D.; Scavia, D. Influence of Climate and Human Activities on the Relationship between Watershed Nitrogen Input and River Export. Environ. Sci. Technol. 2009, 43, 1916–1922. [Google Scholar] [CrossRef]
- Galloway, J.N.; Townsend, A.R.; Erisman, J.W.; Bekunda, M.; Cai, Z.C.; Freney, J.R.; Martinelli, L.A.; Seitzinger, S.P.; Sutton, M.A. Transformation of the nitrogen cycle: Recent trends, questions, and potential solutions. Science 2008, 320, 889–892. [Google Scholar] [CrossRef] [Green Version]
- Duce, R.A.; LaRoche, J.; Altieri, K.; Arrigo, K.R.; Baker, A.R.; Capone, D.G.; Cornell, S.; Dentener, F.; Galloway, J.; Ganeshram, R.S.; et al. Impacts of atmospheric anthropogenic nitrogen on the open ocean. Science 2008, 320, 893–897. [Google Scholar] [CrossRef] [Green Version]
- Li, S.S.; Zhang, L.; Du, Y.; Liu, H.B.; Zhuang, Y.H.; Liu, S.Z. Evaluating Phosphorus Loss for Watershed Management: Integrating a Weighting Scheme of Watershed Heterogeneity into Export Coefficient Model. Environ. Model. Assess. 2016, 21, 657–668. [Google Scholar] [CrossRef]
- Jia, Y.; Wang, Q.; Zhu, J.; Chen, Z.; He, N.; Yu, G. A spatial and temporal dataset of atmospheric inorganic nitrogen wet deposition in China (1996–2015). China Sci. Data 2019, 4, 1. [Google Scholar]
- Gao, W.; Swaney, D.P.; Hong, B.; Howarth, R.W.; Liu, Y.; Guo, H. Evaluating anthropogenic N inputs to diverse lake basins: A case study of three Chinese lakes. Ambio 2015, 44, 635–646. [Google Scholar] [CrossRef] [Green Version]
- Fei, C.; Hou, L.; Min, L.; Zheng, Y.; Jiang, X. Net anthropogenic nitrogen inputs (NANI) into the Yangtze River basin and the relationship with riverine nitrogen export. J. Geophys. Res. Biogeosci. 2016, 121, 451–465. [Google Scholar]
- Han, Y.G.; Fan, Y.T.; Yang, P.L.; Wang, X.X.; Wang, Y.J.; Tian, J.X.; Xu, L.; Wang, C.Z. Net anthropogenic nitrogen inputs (NANI) index application in Mainland China. Geoderma 2014, 213, 87–94. [Google Scholar] [CrossRef]
- Zhang, W.; Li, X.; Swaney, D.P.; Du, X. Does food demand and rapid urbanization growth accelerate regional nitrogen inputs? J. Clean. Prod. 2016, 112, 1401–1409. [Google Scholar] [CrossRef]
- Min, P.; Lu, G. The influence of socio-economic development on water quality in the Dianchi Lake. Eng. Sci. 2010, 12, 117–122. [Google Scholar]
- Xinru, Z.; Sien, S.; Weixi, Y.; Fenzhu, H.; Xiufen, L.; Dali, W. Classification and Pollution Characteristic Analysis for Inflow Rivers of Chaohu Lake. J. Environ. Sci. 1992, 4, 112–113. [Google Scholar]
- Ho, K.C.; Teow, Y.H.; Sum, J.Y.; Ng, Z.J.; Mohammad, A.W. Water pathways through the ages: Integrated laundry wastewater treatment for pollution prevention. Sci. Total Environ. 2021, 760, 143966. [Google Scholar] [CrossRef]
- Xi, S.-S.; Zhou, C.-C.; Liu, G.-J.; Wu, L.; Wang, P.-H. Spatial and Temporal Distributions of Nitrogen and Phosphate in the Chaohu Lake. Environ. Sci. 2016, 37, 542–547. [Google Scholar]
- Ying, G.U.; Dongbao, S.U.N.; Qingsuo, W. Studies on Groundwater Nitrate Nitrogen Distribution and its Affecting Factors in Chao Lake Watershed. J. Agric. Sci. Technol. 2011, 13, 68–74. [Google Scholar]
- Yang, C.; Yang, P.; Geng, J.; Yin, H.; Chen, K. Sediment internal nutrient loading in the most polluted area of a shallow eutrophic lake (Lake Chaohu, China) and its contribution to lake eutrophication. Environ. Pollut. 2020, 262, 114292. [Google Scholar] [CrossRef]
- Zhong, F.; Wu, J.; Dai, Y.; Xiang, D.; Deng, Z.; Cheng, S. Responses of water quality and phytoplankton assemblages to remediation projects in two hypereutrophic tributaries of Chaohu Lake. J. Environ. Manag. 2019, 248, 109276. [Google Scholar] [CrossRef]
- Zhang, M.; Zhang, Y.; Yang, Z.; Wei, L.; Yang, W.; Chen, C.; Kong, F. Spatial and seasonal shifts in bloom-forming cyanobacteria in Lake Chaohu: Patterns and driving factors. Phycol. Res. 2015, 64, 44–55. [Google Scholar] [CrossRef]
- Cleveland, W.S. Robust Locally Weighted Regression and Smoothing Scatterplots. Am. Stat. Assoc. 1979, 74, 829–836. [Google Scholar] [CrossRef]
- Katz, D. Water use and economic growth: Reconsidering the Environmental Kuznets Curve relationship. J. Clean. Prod. 2015, 88, 205–213. [Google Scholar] [CrossRef]
- Mao, Y.; Zhang, H.; Tang, W.; Zhao, J.; Wang, Z.; Fan, A. Net anthropogenic nitrogen and phosphorus inputs in Pearl River Delta region (2008–2016). J. Environ. Manag. 2021, 282, 111952. [Google Scholar] [CrossRef]
- Lian, H.S.; Lei, Q.L.; Zhang, X.Y.; Haw, Y.; Wang, H.Y.; Zhai, L.M.; Liu, H.B.; Jr-Chuan, H.; Ren, T.Z.; Zhou, J.G.; et al. Effects of anthropogenic activities on long-term changes of nitrogen budget in a plain river network region: A case study in the Taihu Basin. Sci. Total Environ. 2018, 645, 1212–1220. [Google Scholar]
- Li, J.; Ma, R.; Xue, K.; Loiselle, S. Drivers to spatial and temporal dynamics of column integrated phytoplankton biomass in the shallow lake of Chaohu, China. Ecol. Indic. 2020, 109, 105812. [Google Scholar] [CrossRef]
- Zhang, W.; Li, H.; Xiao, Q.; Jiang, S.; Li, X. Surface nitrous oxide (N(2)O) concentrations and fluxes from different rivers draining contrasting landscapes: Spatio-temporal variability, controls, and implications based on IPCC emission factor. Environ. Pollut. 2020, 263, 114457. [Google Scholar] [CrossRef]
- Zhang, W.; Li, H.; Li, Y. Spatio-temporal dynamics of nitrogen and phosphorus input budgets in a global hotspot of anthropogenic inputs. Sci. Total Environ. 2019, 656, 1108–1120. [Google Scholar] [CrossRef]
- Jw, A.; Wza, B.; Stap, C.; Wy, A.; Wl, A. A multiscale analysis of urbanization effects on ecosystem services supply in an urban megaregion. Sci. Total Environ. 2019, 662, 824–833. [Google Scholar]
- Zou, L.; Liu, Y.; Wang, Y.; Hu, X. Assessment and analysis of agricultural non-point source pollution loads in China: 1978-2017. J. Environ. Manag. 2020, 263, 110–400. [Google Scholar] [CrossRef]
Figure 1.
Geographical location and land use of the Chaohu Lake Basin in 2018. (HBH, NFH, and YHX River stand for agricultural, urban, and mixed watersheds, respectively).
Figure 1.
Geographical location and land use of the Chaohu Lake Basin in 2018. (HBH, NFH, and YHX River stand for agricultural, urban, and mixed watersheds, respectively).

Figure 2.
Methodology of the estimating of the the NANI.

Figure 3.
Interannual changes in the NANI in Chaohu Lake basin from 1990–2018, (a) annual variations of NANI in 15 counties, (b) average component-ratio of the NANI from 1990 to 2018 (The proportion of each component of the NANI which was calculated by the average value from 1990 to 2018). (c) The correlation between the NANI and Nfer (d) the correlation between the NANI and Nim.

Figure 4.
NANI model and its components (Net N imports, N fertilizer, N fixation, and atmospheric deposition) spatial pattern of county level from 1990 to 2018 (We use the average value of the NANI model and its components from 1990 to 2018 to show.).
Figure 4.
NANI model and its components (Net N imports, N fertilizer, N fixation, and atmospheric deposition) spatial pattern of county level from 1990 to 2018 (We use the average value of the NANI model and its components from 1990 to 2018 to show.).

Figure 5.
The relationship between the NANI and urbanization (a) and grain yield (b) during the period 1990–2010 in Chaohu Lake Basin.
Figure 5.
The relationship between the NANI and urbanization (a) and grain yield (b) during the period 1990–2010 in Chaohu Lake Basin.

Figure 6.
Characteristics of nitrogen input in three sub-catchments from 1990 to 2018 (We used the sub-basin boundary to assess the NANI by county according to the area ratio.).
Figure 6.
Characteristics of nitrogen input in three sub-catchments from 1990 to 2018 (We used the sub-basin boundary to assess the NANI by county according to the area ratio.).

Figure 7.
The relationship between urbanization and the NANI, Nim in different types of watersheds.

Disclaimer/Publisher’s Note: The statements, opinions and data contained in all publications are solely those of the individual author(s) and contributor(s) and not of MDPI and/or the editor(s). MDPI and/or the editor(s) disclaim responsibility for any injury to people or property resulting from any ideas, methods, instructions or products referred to in the content. |
© 2023 by the authors. Licensee MDPI, Basel, Switzerland. This article is an open access article distributed under the terms and conditions of the Creative Commons Attribution (CC BY) license (https://creativecommons.org/licenses/by/4.0/).
Share and Cite
MDPI and ACS Style
Zhang, F.; Li, H.; Zhang, W.; Pang, J.; Li, Y. Spatial-Temporal Dynamics of Anthropogenic Nitrogen Inputs in the Rapid Developing Chaohu Lake Basin. Water 2023, 15, 414. https://doi.org/10.3390/w15030414
AMA Style
Zhang F, Li H, Zhang W, Pang J, Li Y. Spatial-Temporal Dynamics of Anthropogenic Nitrogen Inputs in the Rapid Developing Chaohu Lake Basin. Water. 2023; 15(3):414. https://doi.org/10.3390/w15030414
Chicago/Turabian StyleZhang, Fuxiang, Hengpeng Li, Wangshou Zhang, Jiaping Pang, and Ying Li. 2023. "Spatial-Temporal Dynamics of Anthropogenic Nitrogen Inputs in the Rapid Developing Chaohu Lake Basin" Water 15, no. 3: 414. https://doi.org/10.3390/w15030414
Note that from the first issue of 2016, this journal uses article numbers instead of page numbers. See further details here.