
Evaluation on the Current Situation of Integrated Treatment of Rural Sewage in China: A Case Study of Anhui Province

1
School of Social Audit, Nanjing Audit University, Nanjing 211815, China
2
School of Economics and Management, Jiangsu Maritime Institute, Nanjing 211170, China
*
Author to whom correspondence should be addressed.
Water 2023, 15(3), 415; https://doi.org/10.3390/w15030415
Submission received: 26 December 2022
/
Revised: 11 January 2023
/
Accepted: 13 January 2023
/
Published: 19 January 2023
(This article belongs to the Section Water Resources Management, Policy and Governance)
Abstract
:In 2017, China began to comprehensively control rural water pollution in two steps, and aims to complete the purification of rural domestic sewage by the end of 2030. The short-term goal was to implement rural drinking water safety as soon as possible, and the medium-term and long-term goals were to completely block all kinds of pollution sources. Based on the field survey data, a variety of mathematical models were established to evaluate the progress of rural sewage treatment, the operation efficiency of sewage treatment facilities and the current situation of water pollution in China. The results show that the short-term goal has been basically achieved. The rural tap water penetration rate has reached 98%, and about 95% of the water has reached the drinking standard. About 70% of the groundwater is safe for bathing. However, the rural economy is weak, the residence is scattered and the unit sewage treatment cost is high, so it is very difficult to implement rural sewage treatment. The implementation of medium-term and long-term goals is slow, especially the treatment rate of agricultural non-point source sewage and domestic sewage is generally low, and surface water such as rural ponds and reservoirs basically belongs to Class IV or Class V. The study found that the key to the poor effect and slow progress of sewage treatment is the lack of economic support. It is suggested that the government should further increase investment in rural sewage treatment facilities.
1. Introduction
The reforming and opening up has brought about rapid economic development in China, but also serious environmental pollution, of which water pollution is an important aspect. Around the end of the 1980s, water pollution first broke out in cities. Subsequently, water pollution problems in major rivers and rural areas began to break out slowly. In May 1984, the first Law of the People’s Republic of China on the Prevention and Control of Water Pollution was issued, and the Chinese government began to pay attention to the control of water pollution. The urban population is concentrated, so it is relatively easy to control water pollution. By the end of the 9th Five-Year Plan (China’s Five-Year Plan for national economic development began in 1953, and 1978 was the first year of the sixth Five-Year Plan), urban water pollution had been largely controlled. The Chinese government has begun to rectify the pollution of major rivers, but due to backward pollution control technology and insufficient experience and funds, the treatment effect has been poor. At the beginning of the 11th Five-Year Plan, the Chinese government began to promote the centralized treatment of industrial sewage and urban domestic sewage, and tried out the centralized treatment of rural domestic sewage. In 2015, the Action Plan for Water Pollution Prevention was formulated to systematically promote water pollution prevention, water ecological protection and water resource management. By the end of the 13th Five-Year Plan, the water quality of major rivers in China had improved. However, rural water pollution is like suffering from chronic diseases, which are not easy to recover from. The water in many rural ponds, reservoirs and even rivers has become black and smelly, and safe drinking water can hardly be found. Although the government soon launched the rural collective water supply plan, the implementation of the plan was slow and the water quality provided did not meet the drinking standards. In February 2019, the Minister of Agriculture and Rural Affairs Han, C. F. pointed out when talking about rural environmental pollution that according to statistics, 50% of the rural water supply failed to meet the drinking water standard, and about 400 million people in the country suffered from serious organic pollution of drinking water (China Agricultural News Network 28 February 2019). Many rural families had to dig wells to drink groundwater. However, the content of toxic substances in groundwater generally exceeded the standard; for example, arsenic was generally higher than the standard set by the World Health Organization (Phoenix News, 29 April 2018).
On the comprehensive treatment of rural water pollution, developed countries started early, and many countries have a set of sewage treatment systems and process technology suitable for their rural characteristics. For example, by the end of 1996, Japan had built 2000 small rural sewage treatment plants. At the end of the last century, Europe issued rural domestic sewage discharge standards. Spain has also promulgated the process selection of rural domestic sewage treatments, specified the detailed indicators of sewage discharge and required villages with 2000 people to complete the construction of a sewage treatment system by 2005 at the latest. Rural residents in South Korea live scattered, and most of them use small and simple wetland sewage treatment systems.
In 2017, China began to comprehensively rectify rural water pollution and put forward two goals for comprehensive treatment of water pollution. (1) The short-term goal is to fully implement the rural water supply plan as soon as possible and solve the problem of rural residents’ drinking water. According to the Voice of Rural China, by the end of 2018, more than 11.6 million rural water supply projects (centralized water supply rate (tap water popularity rate) = farmers receiving centralized water supply (farmers with tap water)/total farmers) were completed across the country, serving a population of 940 million, with a centralized water supply rate of 86% and a tap water penetration rate of 81%. (2) The medium- and long-term goal is to gradually block various pollution sources and gradually restore the ecology of the water body. In 2019, the mid-term and long-term goals were formally implemented gradually. To fully promote centralized treatment of rural domestic sewage requires township enterprises to build relatively intensively, and implement centralized sewage treatment. All breeding enterprises are required to stay away from water sources and establish a resource utilization system for livestock and poultry breeding wastes. They must strictly implement centralized treatment of rural domestic waste and promote the reduction of chemical fertilizers and pesticides in agricultural production. At present, the effect of centralized treatment of livestock and poultry manure and garbage is good. The comprehensive utilization rate of livestock and poultry manure nationwide has reached more than 75%, and the supporting rate of manure treatment facilities and equipment in large-scale farms has reached more than 95% [1]. In 2017, rural garbage centralized treatment was regarded as a system, and the garbage treatment rate reached 62.85% [2]. There are still many other problems, especially the effect of reducing the application of chemical fertilizers and pesticides is not obvious, and it is difficult to make major changes in the short term.
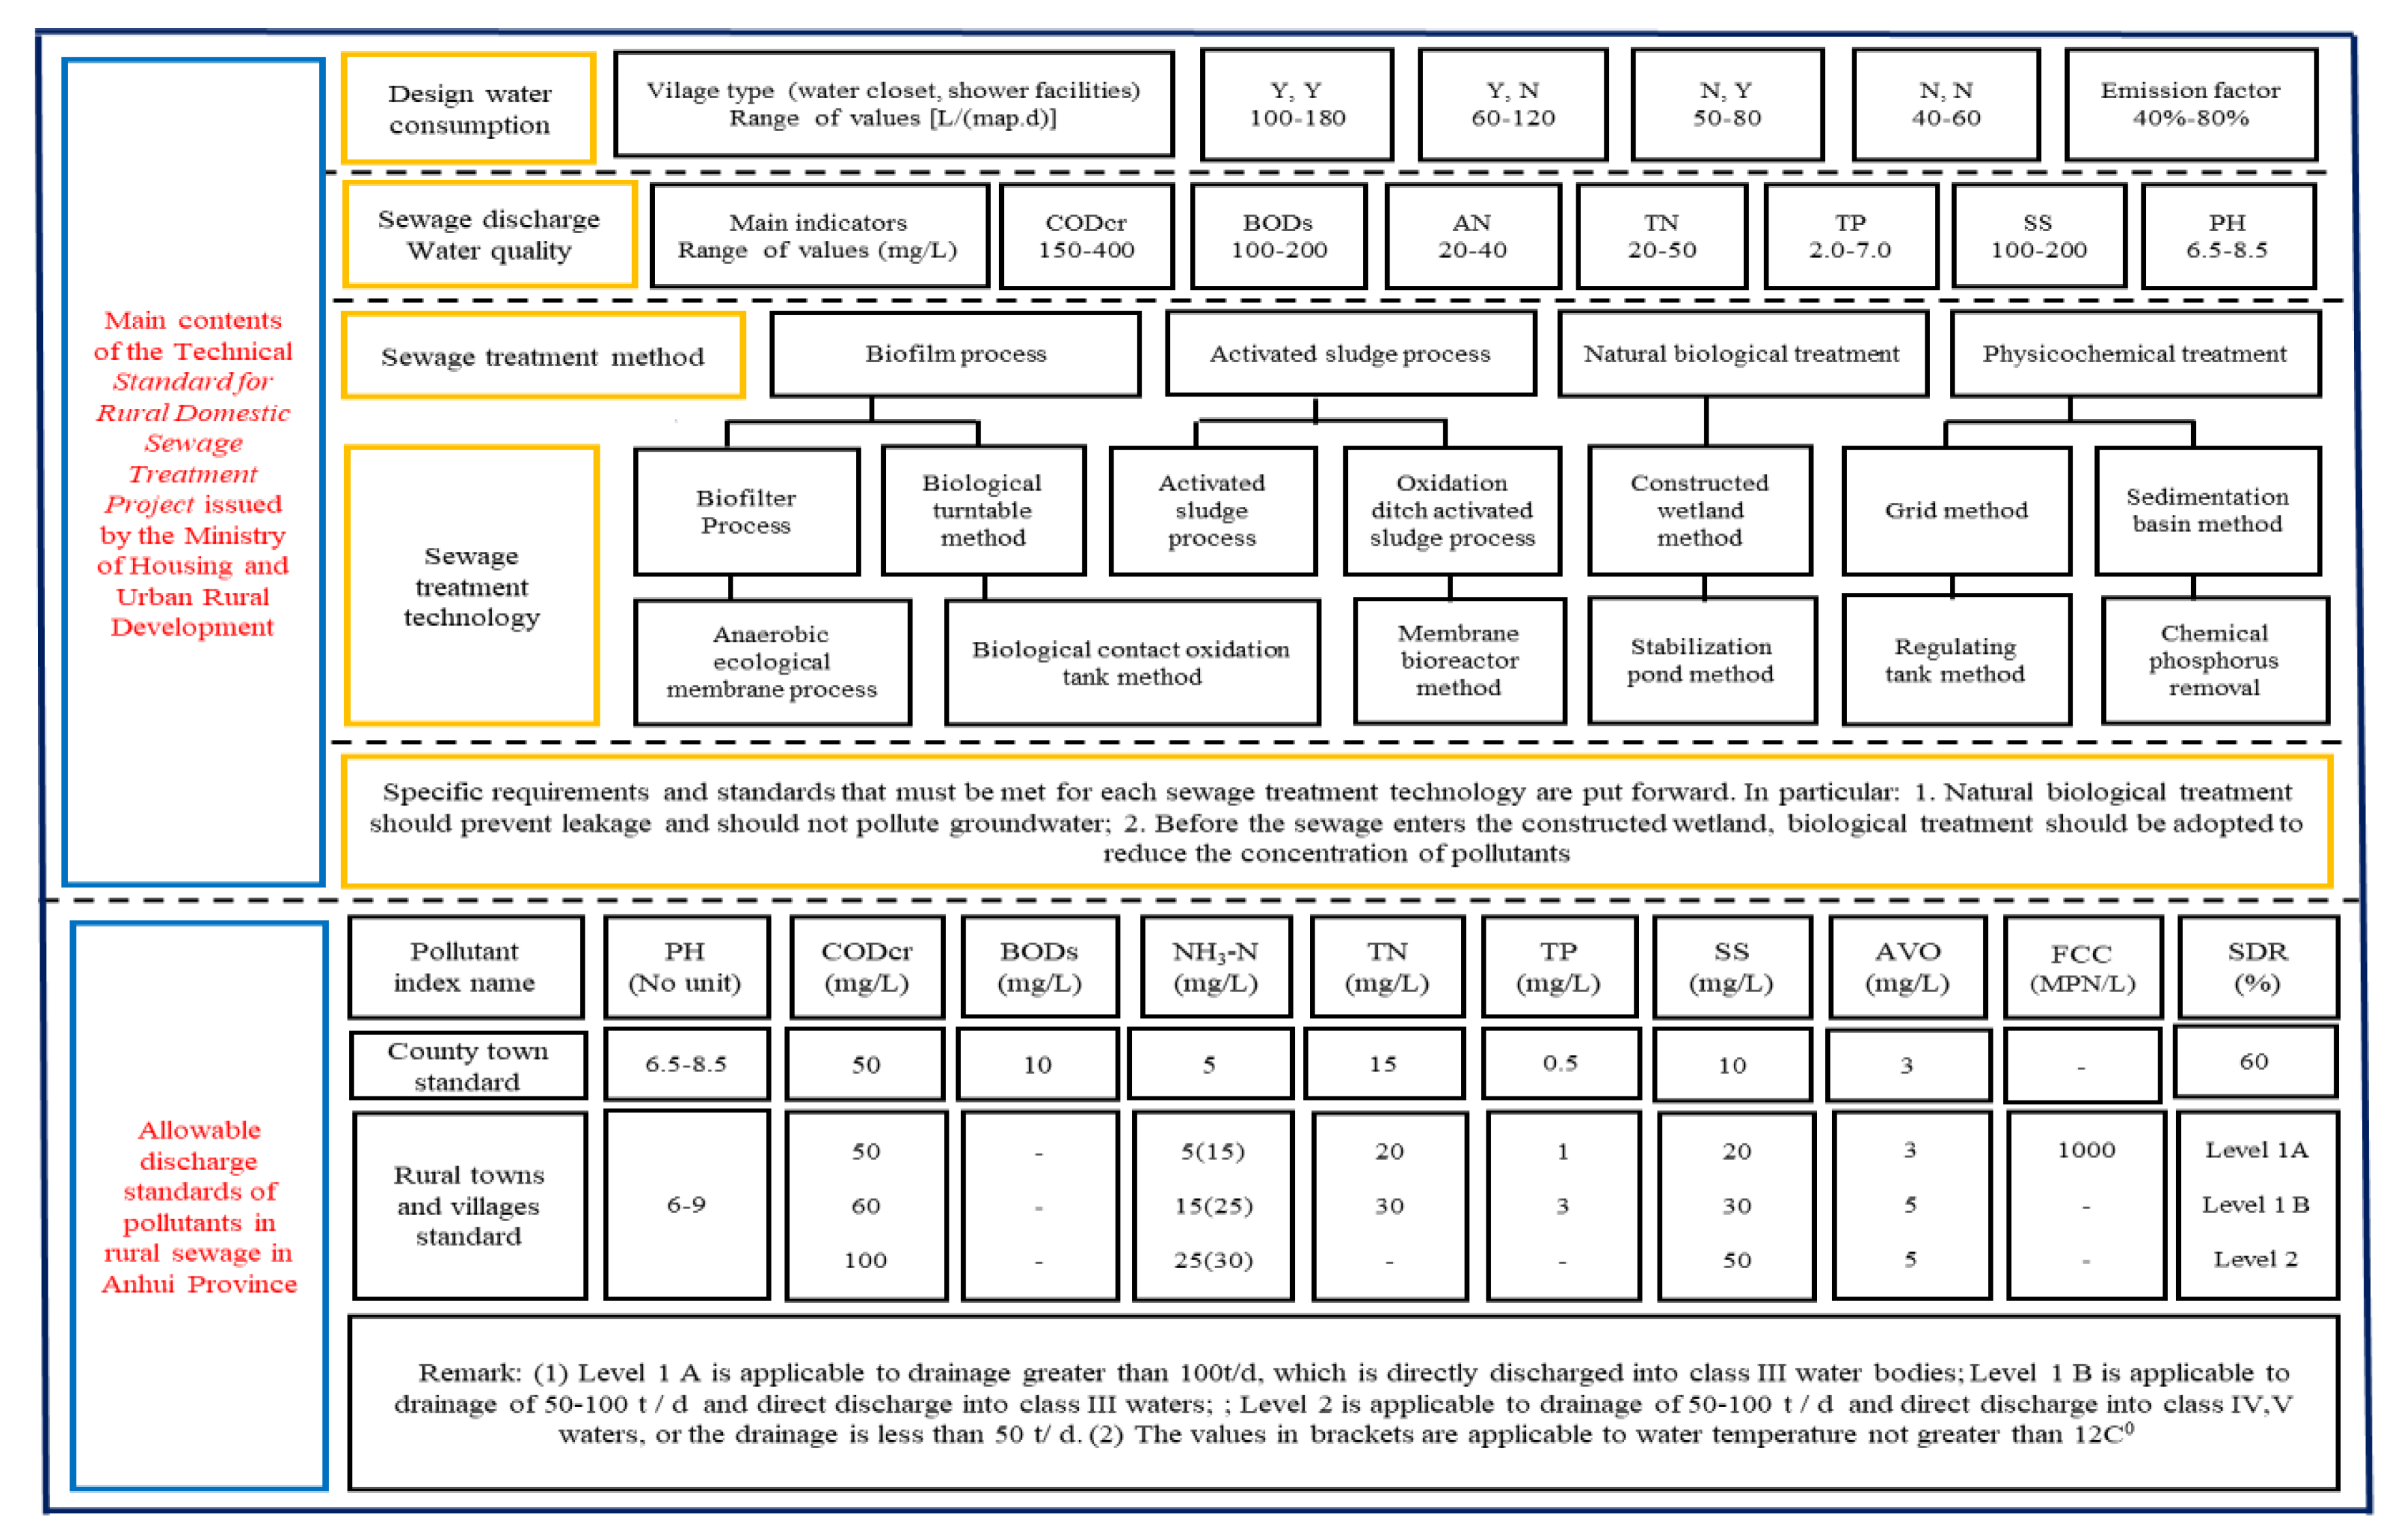
In April 2019, the Ministry of Housing and Urban Rural Development jointly issued the Technical Standard for Rural Domestic sewage Treatment Engineering (GB/T51347-2019). See Figure 1 for main contents. The emission standard includes three levels. The Ministry of Ecological Environment requires all regions to complete the local rural domestic sewage treatment plan by the end of 2020, and fully implement the rural domestic sewage purification and treatment goal by the end of 2030. Subsequently, all provinces and cities have successively formulated rural domestic sewage treatment plans, and the domestic sewage discharge standards are prepared according to the actual situation of the province. Among them, Shanghai only implements the first level standard, and Zhejiang has no third level standard. Zhejiang Province is the first province in China to comprehensively carry out rural domestic sewage treatment. So far, the rural domestic sewage treatment capacity that has been implemented nationwide is still very small compared with the total discharge, and most of it is concentrated in organic towns. According to the data of China’s Urban and Rural Construction Statistical Yearbook (2019), by the end of 2018, the average sewage treatment rate of township administrative units across the country was only 17.19%.
On the issue of rural water pollution and treatment, Chinese and foreign scholars have discussed it from different aspects, including:
- (1)
- Rural drinking water quality. Cotruvo, J.A., 2017 introduced the current world drinking water pollution situation [3]. Using the GIS-MCDA method, Silva, M.C.O. et al., 2022 discussed the risk of a water supply and sanitary sewage system in a city in Brazil’s semi-arid region [4]. Alver, A., 2019 discussed the efficiency evaluation of conventional drinking water treatment plants using the water quality index and health risk index [5]. Čeli, Ć.M. et al., 2020 assessed the occurrence and environmental risks of interfering compounds in drinking water, surface water and wastewater in Serbia [6]. Taking rural areas of Luzhou City as an example, Ji R. et al., 2018 introduced the unsanitary situation of rural drinking water in China and the endemic diseases caused by it and put forward policy suggestions for improving the water environment [7].
- (2)
- The experience of developed countries in improving rural water pollution and suggestions for rural sewage treatment in developing countries. Awad, H. et al., 2019 conducted an environmental and cost life cycle assessment on improving wastewater treatment in developing countries [8]. Liu, Y. et al., 2018 introduced the experience of rural domestic sewage treatment in the United States, Japan, Germany, Sweden and other developed countries [9]. Ziembawic, S. et al., 2021 studied the impact of landfill leachate on rural water pollution [10]. From the perspective of excessive chemical fertilizers and pesticides in agricultural production and nonstandard treatment of livestock and poultry manure in aquaculture, Chen, X.M. et al., 2016 analyzed the root causes of rural water pollution in China and put forward relevant policy recommendations to mitigate this pollution [11].
- (3)
- Technical discussion on rural sewage treatment, especially the use of extracts from agricultural and sideline products to implement low-cost treatment of sewage by simple methods. Diab, K.E. et al., 2021 introduced that the use of biocompatible MIP-202 Zr MOF tunable adsorbent can effectively purify the electro ion pollution in waste liquid [12]. Mohamed, S. et al., 2017 systematically introduced the technology of extracting low-cost adsorbent from agricultural and sideline products to enhance the absorption of pollutants in wastewater [13]. Marius, G.M. et al., 2021 studied the problem of sewage sludge treatment with materials activated by a low amount of alkaline hydroxide [14]. Saravanan, A. et al., 2021 gave a comprehensive introduction to the effective methods of removing toxic pollutants from wastewater that can work continuously for a long time [15]. Singh, S. et al., 2020 introduced the method of using low-cost adsorbent to remove inorganic impurities from wastewater [16]. There are many similar studies, for example, Salerno, F. et al., 2018 [17].
- (4)
- Assessment of the pollution of rivers, lakes and groundwater using mathematical models. Ashfaq, M. et al., 2019 studied the seasonal variation and risk assessment of pollutants in the Jiulong River and its estuary in China [18]. Triassi, M. et al., 2022 discussed the temporal and spatial distribution of pollutants in the aquatic environment of the Volturo River estuary in southern Italy [19]. El Osta, M. et al., 2022 discussed the suitability of groundwater drinking and irrigation in Al Mukarramah Province, Makkah, Saudi Arabia, using the water quality index and multivariate modeling [20]. Gad, M. et al., 2021, 2022 assessed the surface water quality of Qaroun Lake in Egypt and the Nile River, respectively, by using the comprehensive water quality index and multivariate modeling [21]. There are many similar studies (see [22,23,24,25]). Norouzi, H. et al., 2020 used the aquifer in the Miandoab plain in northwest Iran as a case to discuss the groundwater quality assessment by using the random forest method [26]. Pennino, M.J. et al., 2020 discussed the pattern and prediction of nitrate violations in drinking water across the United States [27]. Ratolojanahary, R. et al., 2019 established groundwater quality assessment models under the background of supervisory and non-supervisory mechanisms [28]. Shah, M.I. et al., 2021 studied the prediction of surface water quality based on the machine learning model of super parameter optimization with consistent big data [29].
We fully absorb the useful ingredients from the existing research results and conceive the overall idea of this study. This study takes Anhui Province as an example to systematically assess the progress of comprehensive treatment of rural water environment and the current situation of water pollution in China. The most important feature is to conduct an all-round analysis and assessment on the main pollution sources and treatment methods of rural water environment. Objectives to be achieved: First, analyze the main difficulties and influencing factors in promoting rural sewage treatment, and put forward policy suggestions on accelerating sewage treatment. Second, let the villagers know the current situation of rural water environment pollution quantitatively, and improve the villagers’ initiative in promoting water environment governance.
2. Overview of Rural Economic Environment and Water Environment Treatment in Anhui Province
Next, we take Anhui Province as an example to discuss the situation of rural water pollution control in China. Anhui is a moderately developed area on the whole. A total of 6 districts in Ma’anshan City and Hefei City have just reached the standard of developed areas, the rest of the counties have not exceeded the moderately developed level, and 19 counties have just been lifted out of poverty, which are listed as the key support objects of the province. In 2019, it ranked 11th in the national economic ranking and was representative in the rural areas of the country. Anhui Province governs 16 provincial cities, 9 county-level cities, 52 counties and 44 municipal districts. It connects Jiangsu and Zhejiang to the east, Hubei and Henan to the west, Jiangxi to the south and Shandong to the north. The whole province can be roughly divided into five natural regions: Huaibei plain; Jianghuai hills; Dabie Mountains in Western Anhui; riverside plain; and mountainous areas in southern Anhui. The economy of the plains along the Yangtze River is relatively developed, followed by the Jianghuai hills and the southern Anhui mountains, and the Huaibei plain and the western Anhui Dabie Mountains are relatively poor. It is a typical agricultural province with rich agricultural resources and a large proportion of agricultural products. The land area of the province is 139,600 square km, including 5.867 million hm2 of cultivated land, 3.733 million hm2 of forest land and 580,000 hm2 of aquaculture water. The permanent population of the province is about 61 million, including about 53 million people with rural registered residence. It is the main grain-producing province in China.
Anhui crosses the Yangtze River and the middle and lower reaches of the Huaihe River. Chaohu Lake in the province is one of the five largest freshwater lakes in China. Among them, Huaihe River and Chaohu Lake are part of the “three rivers and three lakes”, respectively, that China focuses on governance. According to the data of the Ministry of Water Resources, class IV, class V and inferior class V water in Huaihe River accounted for 32.5%, 9.3% and 16.3%, respectively, in 2018. The Huaihe River flows through Anhui with a total length of 401 km, a drainage area of 6.69 square km and 3.123 million hm2 of cultivated land. So far, Anhui Province has invested more than CNY 10 billion in the control of Huaihe River pollution. Chaohu Lake basin covers an area of 13,200 square km, with a population of 10.6 million and 493,000 hm2 of cultivated land. In order to control the water pollution of Chaohu Lake, the central and local governments successively invested CNY 11.07 billion in pollution control by the end of 2017. Now, the water quality of Huaihe River and Chaohu Lake has improved a lot, but they still cannot be used as drinking water sources. At present, Anhui Province pays special attention to the centralized treatment of rural sewage. The Department of Ecological Environment of Anhui Province issued the Discharge Standard of Water Pollutants for Rural Domestic Sewage Treatment Facilities (DB343527-2019) in December 2019 (see Figure 1). The main contents of the standard include emission limits of water pollutants from rural domestic sewage treatment facilities, monitoring and control requirements and implementation and supervision.
According to Anhui Daily, as reported on 21 December 2021, by the end of November 2021, Anhui province had completed the tasks of improving the quality and efficiency of domestic sewage treatment facilities in 332 township government stations, 626 rural sewage treatment tasks, 55 rural black and odorous water treatment tasks and 457 rural environmental remediation tasks.
For the convenience of description, the abbreviations of the main indicators involved in this paper are listed in Table 1.
Among them, “agricultural non-point source sewage” refers to the sewage discharged from agricultural production, mainly including eutrophic water bodies caused by nitrogen, phosphorus and potassium fertilizers, and polluted water bodies caused by high-residue and difficult-to-degrade pesticides. “Sewage treated in a simple way” refers to the sewage discharged after simple filtration or disinfection treatment with low cost unsystematic or non-standard sedimentation tanks, stabilization ponds, etc. Some rural livestock and poultry farms, township enterprises, rural hospitals, small market towns, etc., have not yet built qualified sewage treatment facilities, so the sewage is temporarily treated simply, such as in the method introduced in the literature [14].
3. Materials and Methods
3.1. Methodology
3.1.1. Determine the Weight of Evaluation Indicators
In this paper, according to the characteristics of different types of indicators, the AHP method or entropy weight method is used to determine their weights, and all calculations are made with Mathematica software.
Situation 1. Steps of AHP method for weight calculation
The Analytical Hierarchy Process method is generally used to determine the weight of multiple lower level indicators to reflect the upper level indicators [30]. For example, we calculate the weight of Level II indicators with respect to Level I indicator , and record it as .
- (i)
- Establish an expert group composed of m people, let each expert compare the importance of indicators in pairs, and construct a positive reciprocal judgment matrix. Let the matrix constructed by the k-th judge be as follows:where indicates that the k-th expert considers the degree of importance of indicator relative to indicator . Noting .
- (ii)
- Calculate the maximum characteristic value of , and check the consistency of . Calculate the value of index , where , and is given in Table 2 below.
When , we think that is more satisfied (otherwise reconstruct and ).
- (iii)
- The characteristic vector of matrix corresponding to the is calculated with a simple method, where . By uniting the vector , we can obtain .
For example, find . Because there is no reliable statistical data at all, it can only be determined by subjectively comparing the possible proportion of each two types of sewage. We have established a five-member expert group. Based on the judgment matrix given by them, we obtain
Because the is more satisfactory, we obtain . Similarly, we can obtain (listed in square brackets after in Table 2 and in Table 3).
Situation 2. Steps of weight calculation by entropy weight method
“Entropy” is a measure reflecting the disorder degree of the system in information theory. Entropy can be used to judge the dispersion degree of an index. In many comprehensive evaluation problems, people use the entropy value of the index to determine the weight [31]. Similarly, we find Suppose the standardized index value of index in the j-th participating unit is .
- (i)
- Unitize vector That is, for the i-th index, calculate the proportion of the index value of the j-th participating unit
- (ii)
- Calculate the entropy of the indicator
- (iii)
- Calculate difference coefficient of indicator
The greater the difference between indicator values , the smaller the entropy of indicator , and the greater the difference coefficient of indicator is.
- (iv)
- The weights of each indicator can be obtained by normalizing the coefficient of difference: .
3.1.2. Fuzzy Comprehensive Evaluation Method
The concept of fuzzy sets was put forward by American automatic control expert Professor Zadeh L. A. in 1965 to express the uncertainty of things [32]. If the water pollution degree is divided into several grades, the boundary of these grades must be fuzzy, and it is suitable to use the fuzzy comprehensive evaluation model to evaluate it. Generally, let the advantages and disadvantages of primary index involve n secondary indexes (factors) , and their weight vector about index is . The quality of all factors is divided into grades, . The membership function of the j-th participating unit factor is .
Let
be the fuzzy evaluation matrix of factor of the j-th participating unit. Calculating fuzzy product
where
The is the multiplication sign of fuzzy numbers, which means the minimum value; the is the addition sign of fuzzy numbers, which means the maximum value.
Let
then the quality of factor of the j-th participating unit is evaluated as .
3.1.3. Grey Correlation Coefficient and Correlation Degree
The grey system theory was first proposed by Professor Deng J of China in 1982 to study the “grey” system between “white box” and “black box”, with some information known and some information unknown [33]. Correlation analysis is research content of a grey system.
Definition 1.
There are reference series and m associated series
Let
is the k-th correlation coefficient of the correlation sequence , and is the correlation degree of the correlation sequence to the reference sequence .
When , it is considered that has a stronger correlation with than . .
3.2. Data Collection and Sorting
3.2.1. Data Collection
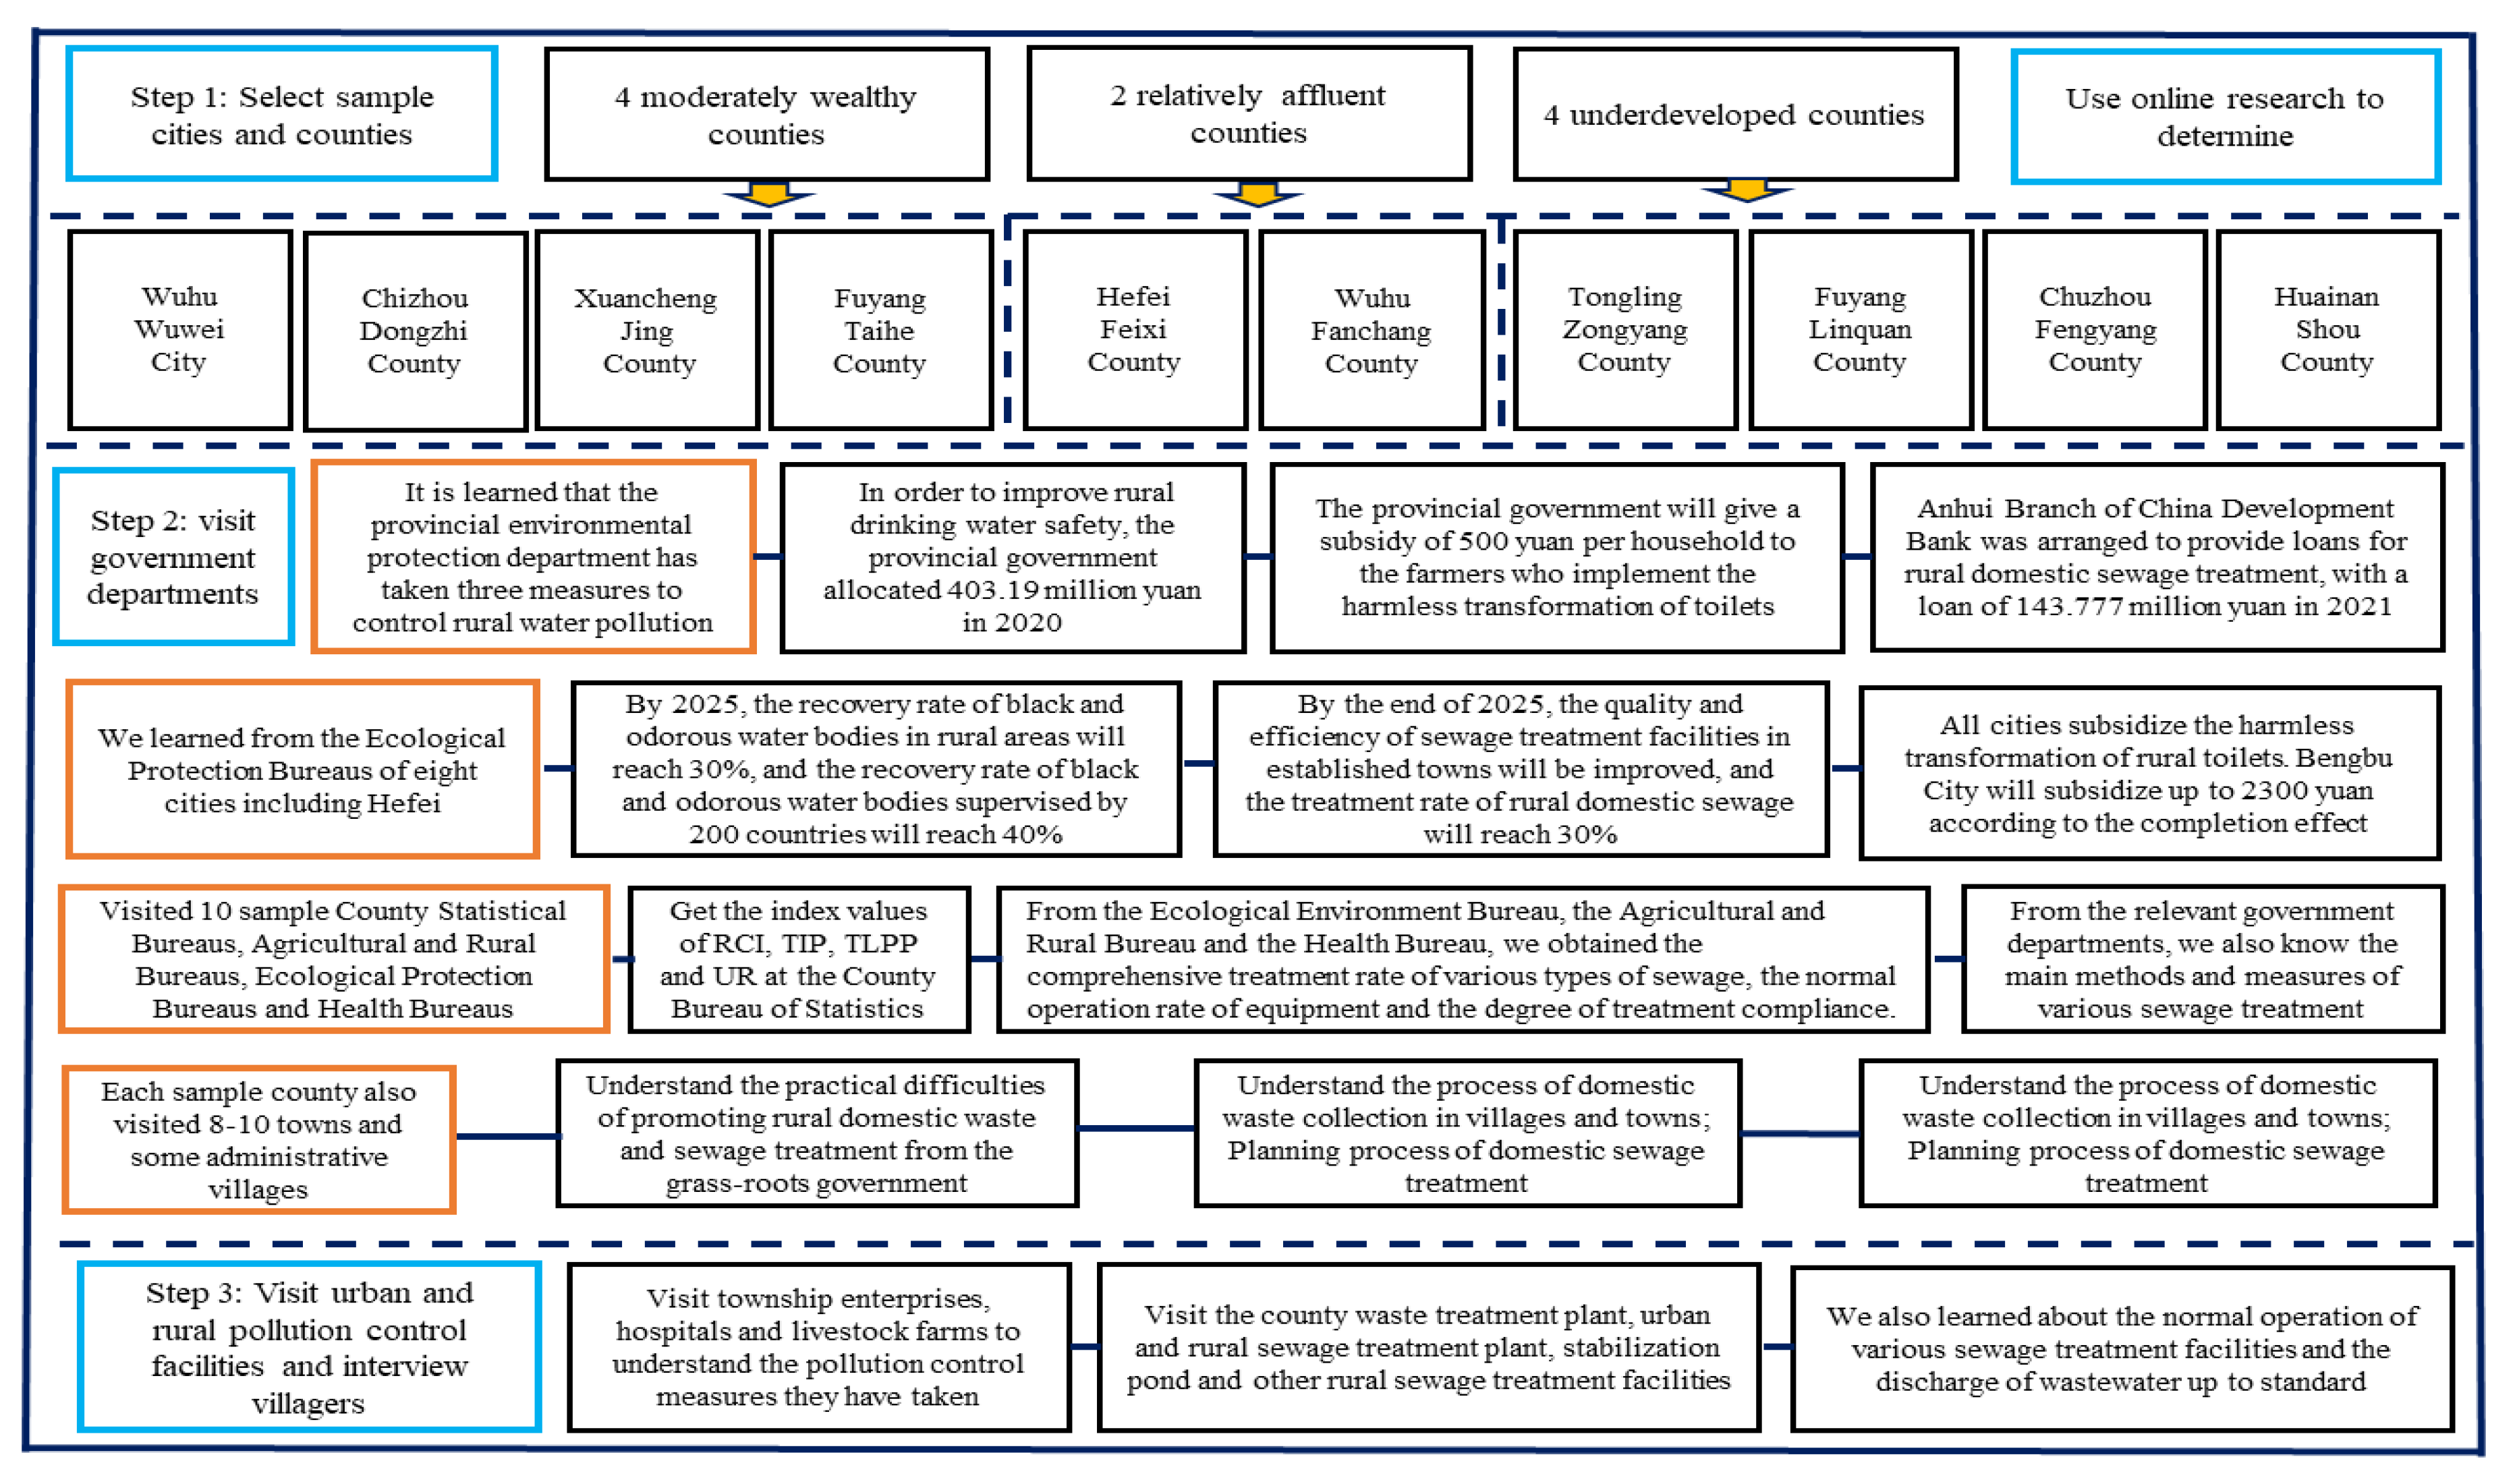
According to the online survey, we have a preliminary understanding of the economic development of each county. From July to August 2021, our research group arranged 20 students to be divided into 5 groups to conduct investigations in 8 cities and 10 counties (cities) under their jurisdiction in Anhui Province. They collected data related to the treatment of rural water pollution, including the relationship between the level of economic development and the progress of water pollution treatment. In order to make the surveyed counties as representative as possible, we sampled regions with different levels of economic development. The main contents and basic route of the survey are shown in Figure 2. The survey method mainly adopts interviews and questionnaires, and the main data obtained are as follows.
- (i)
- Overall situation of rural sewage treatment
All villages had been connected to tap water, and at least 98% of households had used tap water (only a few households were unwilling to pay the opening fee). Among the 10 sample counties, except Linquan County, the sewage treatment rate of all the county towns had reached more than 90%, and the effluent from the sewage treatment plant in the county seat adopted the Level I B standard in GB18918-2002. Many organic towns had combined with nearby township enterprises and some surrounding villages to use large-scale sewage treatment plants to treat sewage. The corresponding standards in DB343527-2019 were adopted for the effluent of township enterprises, rural hospitals, rural towns and villages and the sewage treatment facilities below the village level. Sewage from rural hospitals was generally subject to professional medical disinfection treatment before entering sewage treatment facilities.
Large livestock and poultry farms were far away from residential areas and important water sources according to regulations, and had independent sewage treatment facilities, mainly using biogas digesters and other biochemical equipment. Many villages with scattered residents, such as Linquan County and Jing County, where most of the villages were located in the mountains, try to use buried sewage treatment facilities. All counties attached great importance to the control of agricultural non-point source sewage, and mainly took two measures: (1) Establish an ecological agricultural park, gradually promote the use of organic fertilizer instead of chemical fertilizer and experimental biological pest control technology and reduce the use of chemical fertilizers and pesticides. (2) Constructed wetlands will be built downstream of farmland to prevent farmland sewage from flowing directly into the water source. Effluent water shall meet the Grade 2 standard in DB343527-2019. In addition, in each sample county, in some township streets, township enterprises, livestock and poultry farms and hospitals that have not yet established standardized sewage treatment facilities, simple sewage treatment facilities have been established as required to disinfect and filter the harmful substances in the generated sewage before discharge. The standard rate of tailwater is generally 30–55%.
- (ii)
- Disparities in sewage treatment in different regions with different economic development levels
In economically developed counties, the urbanization rate is high, township enterprises are relatively concentrated and the implementation of sewage treatment is progressing smoothly. For example, the comprehensive sewage treatment in Fanchang County and Feixi County has been promoted rapidly. In underdeveloped counties, only a few villages and towns with well-developed township enterprises have taken the lead in establishing sewage treatment facilities with some surrounding villages and towns under the leadership of township enterprises. It is difficult to promote comprehensive sewage treatment in economically underdeveloped villages, especially those “hollow villages” that appear somewhat depressed. For example, Zongyang County is the first batch of poverty-stricken counties in China, and the progress of various sewage treatment processes is relatively slow. There is a special case in underdeveloped areas. Shou County has just removed the hat of a poor county, but the progress of all kinds of sewage treatment is only second to that of developed counties. All villages and towns in the county have completed the domestic sewage treatment plan, and it is proposed to adopt the PPP (Public Private Partnership) mode for operation. The main reason is that the tap water intake of Shou County cannot avoid the seriously polluted Huaihe River, and the county government attaches great importance to promoting rural domestic sewage treatment.
Linquan County is located in the northwest border of Anhui Province, where there are 6 rivers in vertical and horizontal directions, and the waterway transportation is developed, but it is difficult to control water pollution. At present, it is a provincial key support county in Anhui Province. In 2019, Fuyang Municipal Government gave Linquan County a one-time compensation of CNY 7.5 million to promote sewage treatment. Due to the scattered residential areas, many rural households adopted underground and other small sewage treatment facilities. In addition, 33 rural hospitals had adopted small- and medium-sized sewage treatment equipment, with an average sewage treatment capacity of 50 m3/d. Hefei, the provincial capital, had invested about CNY 1.7 billion in the construction, transformation, operation and maintenance of rural domestic sewage treatment facilities. A total of 65 resident sewage treatment plants of township governments and 491 village-level sewage treatment facilities were inspected, covering all township governments and 833 central villages in the city. The treatment modes such as centralized collection of pipe networks and combined decentralized treatment were adopted, and the integrated treatment of “manure + water” was realized.
In order to speed up the promotion of domestic sewage treatment and ensure the normal operation of existing sewage treatment facilities, all counties had begun to charge sewage charges for two categories of residents: first, for households who join the public sewage treatment and, second, for households that have not participated in sewage treatment and directly discharge sewage. The charging standard is generally CNY 0.85 per ton according to the consumption of tap water. The overall planning of domestic sewage treatment in all counties has been basically completed and is planned to be implemented over many years. On average, about 10% of sewage treatment facilities are under construction.
- (iii)
- Quantitative data
From relevant government departments, we have collected all the quantitative data needed, which are listed in Table 3. See Section 3.3.4 for the operation analysis of sewage treatment facilities. and are used to represent the “up to standard operation rate”, “operation rate” and “tailwater up to standard rate” of Class sewage treatment facilities, respectively. . Since most counties do not have complete statistical data on indicators and , we estimate the values of these two indicators based on the reference data provided by relevant government departments, combined with the information obtained by visiting some sewage treatment facilities and interviewing villagers. We also visited 8–10 villages and towns in each sample county and visited some rural sewage treatment facilities. As there is no publicly available data on the compliance of rural tap water and the quality of surface water and groundwater, we chose to conduct a questionnaire survey on the quality of tap water, groundwater and surface water. Surface water quality includes (1) water quality of rural small rivers, (2) pond reservoir water quality and (3) water quality of paddy fields and aquaculture ponds. In each county, 200 questionnaires were distributed to villagers, which introduced the five classification standards of surface water. Three options were set for tap water: normal, obvious sediment, peculiar smell or discoloration. Three options were set for the quality of groundwater (mainly well water): normal, peculiar smell and discoloration. Four options were set for each of the three surface water quality indicators: Class I–III, class IV, class V, inferior class V. There were 18 options in total. Each respondent was required to give an interval [a, b] estimate of the probability of each option, b–a as small as possible or only give an estimate. At least 176 valid questionnaires were collected by each county, and the maximum was 191.
3.2.2. Data Sorting
The quantitative data obtained from the survey are sorted out and calculated and listed in Table 3. The “average” in the last column is the weighted average calculated based on the population proportion of each county. In addition, based on the experience data provided by the environmental protection department, the average proportion of harmful substances in domestic garbage is 26.25%. Based on this, we assume that if the harmless treatment rate of domestic garbage is increased by 1%, the pollution in the rainwater used for washing garbage can be reduced by 0.2%. Agricultural wastes mainly include chemical fertilizers and pesticide packaging materials. Local governments have encouraged and forced farmers to send these wastes to professional recycling departments for disinfection, but the amount of discarded wastes is still large every year. It is estimated that when the recovery rate is increased by 1%, 0.16% of the pollution in the rainwater washing these wastes can be reduced. The harmless transformation of toilets is being promoted in rural areas. According to government personnel, the transformation rate is increased by 1%, which can reduce the pollution of surface water around toilets by 0.09%. Therefore, we take
Because the 18 options of the five indicators in the questionnaire are fuzzy, it is suitable to use the convex membership function method to sort out the collected data. We take 10 cells of equal length, , , and record the 10 cells as . Suppose that a county takes back m valid questionnaires, and for the i-th option , the m intervals given in the questionnaire are , respectively. In these intervals, there are not empty intersected with , and there are not empty intersected with , and so on. There are not empty finally intersected with . Using to represent the i-th option, we can obtain the convex membership number of .
Let
and we have
We call the standardized convex membership number of . By direct calculation, we obtain expected value and variance
We set the value of as , and use to judge the reliability of the questionnaire results. For example, the three options of tap water quality in Fanchang County are sorted as: (0.891, 0.056, 0.022), and then united as (0.920, 0.058, 0.022).
3.3. Assessment of Rural Water Environment Pollution and Treatment
3.3.1. Progress Evaluation of Comprehensive Treatment of Rural Sewage
According to the data in Table 3, we can calculate the values of comprehensive evaluation indicators and See Table 4 and Figure 3 for the results.
Where
It can be seen from Table 3 that (1) all sewage treatment rates in Fanchang County and Feixi County, the only two economically developed counties, are significantly higher than those in other counties. The implementation of rural sewage treatment needs economic support. (2) Only professional breeding farms have a relatively high sewage treatment rate. (3) The sewage treatment rate of most township enterprises is around 50%, and the lowest is only 45%. The sewage treatment rate of most rural hospitals is lower than 40%, with only 15.8% and 18.9% in two counties. (4) The treatment rate of rural domestic sewage in two counties is only 12.8% and 15.9%, respectively. If county towns and market towns are not included, the two counties with the lowest rural domestic sewage treatment rates will only reach 1.8% and 1.9% (see ). (5) The highest control rate of agricultural non-point source water pollution is only 6.5%, and the lowest is only 4%. The treatment of agricultural non-point source pollution is still in the trial stage. The proportion of agricultural ecological gardens and agricultural ecological wetlands in the sample counties in the total area of cultivated land is too small.
3.3.2. Comprehensive Evaluation of Rural Water Environment Pollution
On the whole, the water environment pollution in rural areas is still relatively serious. We evaluated this from three aspects, and the results are listed in Table 5 and Figure 4.
Situation 1: Surface water quality assessment
According to our investigation from the Agricultural and Rural Bureau of each county, the proportion of different types of water surfaces in the area of rural surface water is about 15% for small rivers, 8% for ponds and reservoirs and 77% for paddy fields and aquaculture ponds. Therefore, we take , and use Equations (1)–(3) to obtain the surface water grade and probability of 10 sample counties. We record I–III, IV, V and inferior V as and , respectively. The basic scores of the category are . If the comprehensive grade of surface water in a county is , and the probability is , the final score is
Situation 2: Groundwater quality evaluation
Because tap water and domestic sewage discharge need to be charged, especially in many places, domestic sewage discharge is charged according to the proportion of tap water consumption. Before running water, many households built wells to drink groundwater. Now, they still use tap water as little as possible. They usually use groundwater for laundry, bathing and feeding animals. We take the three states of groundwater, normal, smelly and discolored, as 90, 80 and 70 points, respectively, and then calculate the expected value of the groundwater score for each county.
Situation 3: Tap water quality evaluation
We take the three states of tap water, normal, obvious sediment, peculiar smell or discoloration, as 100, 90 and 80 points, respectively, and then calculate the expected score of tap water in each county.
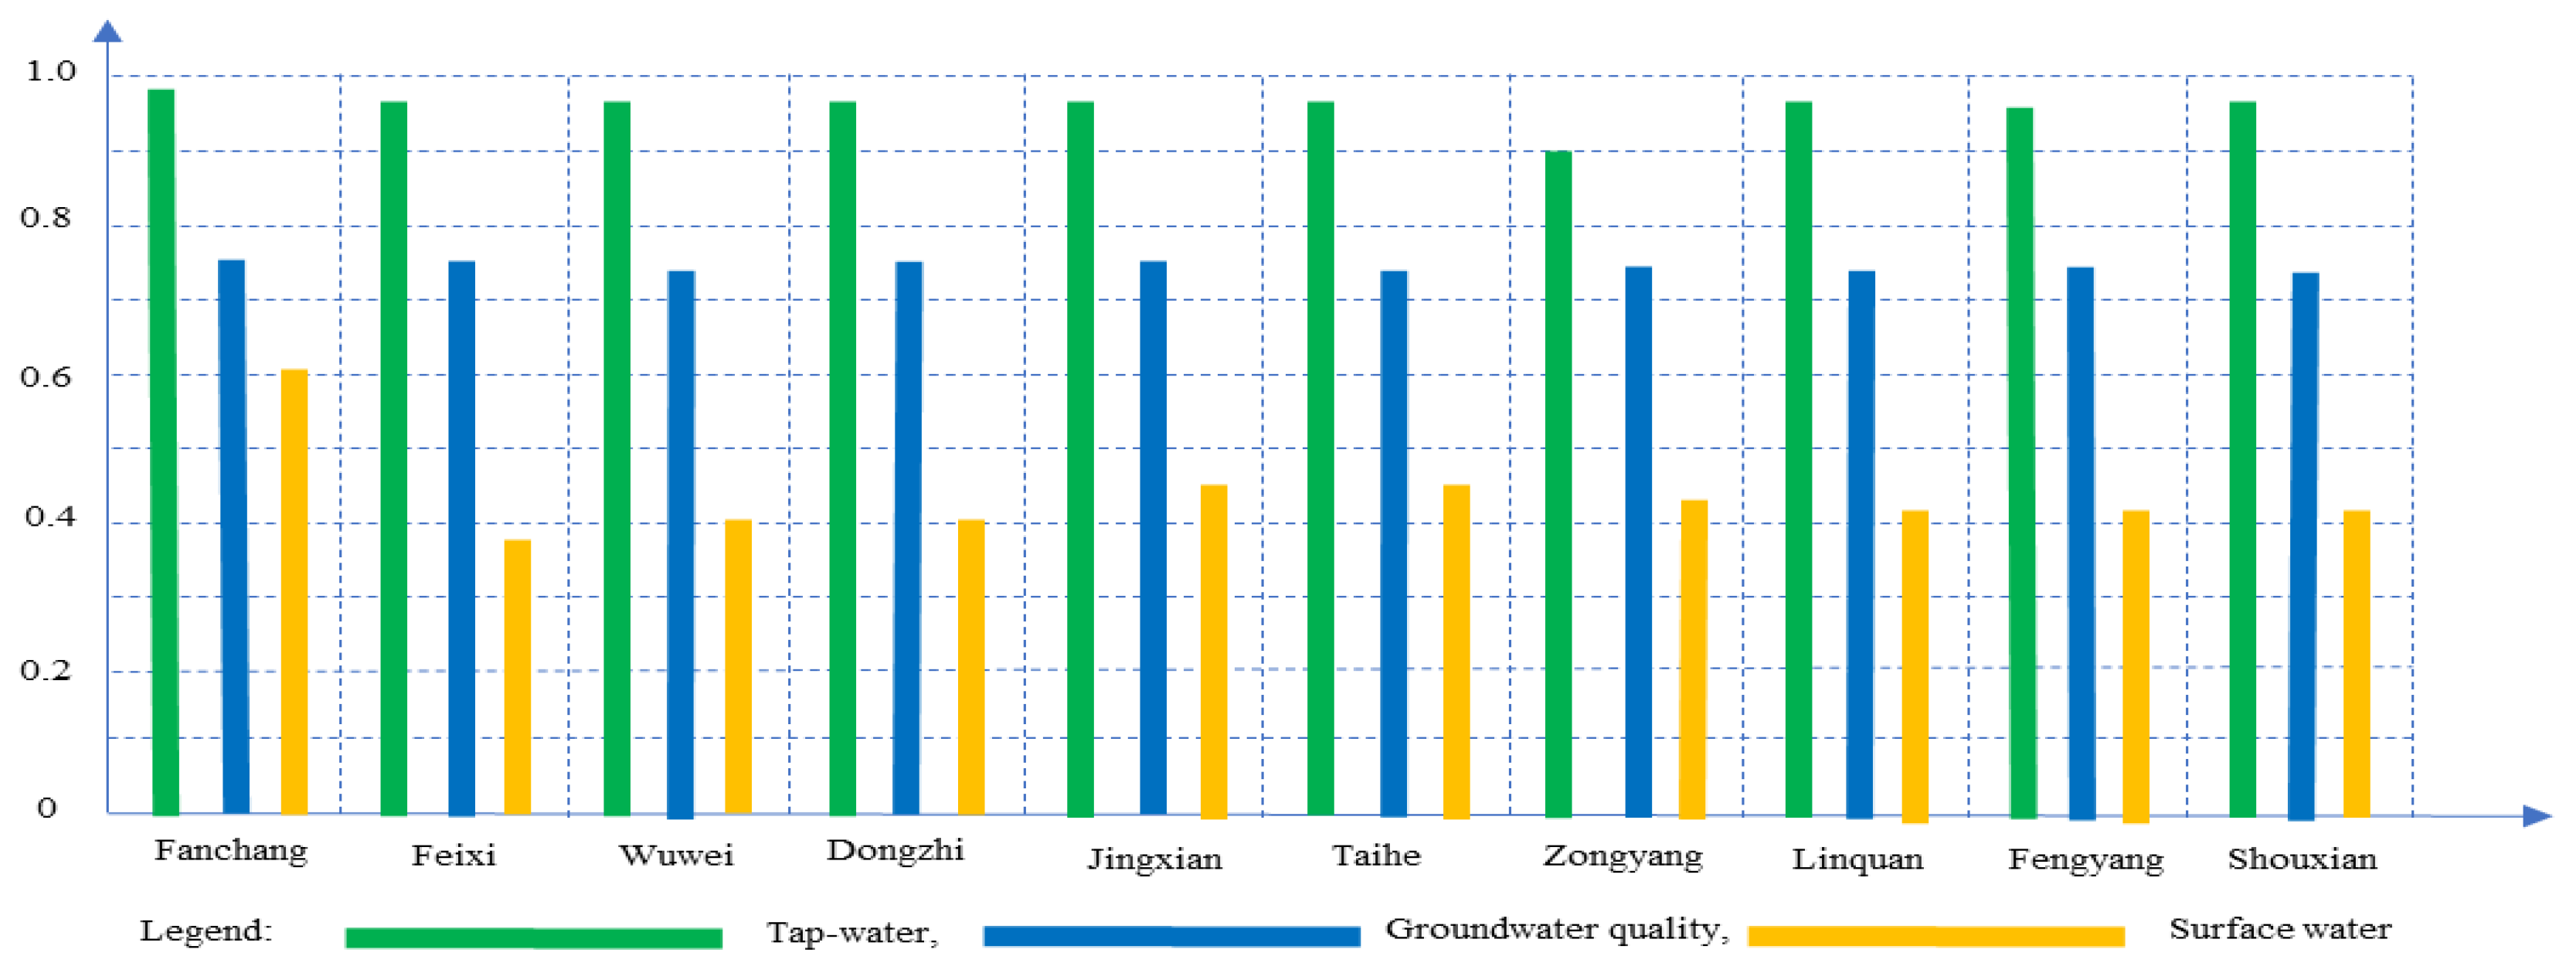
The qualified rate of tap water in all counties has reached more than 90%, and the majority of counties have reached more than 95%. The quality of groundwater used by villagers for washing clothes or bathing is basically around 75 points. The surface water quality of rural ponds and reservoirs is generally poor, and can only reach Level IV or V. Since 2017, China has comprehensively implemented rural water environment governance, which has not achieved good results in general. The water quality of ponds and reservoirs is still generally poor and cannot be used as domestic water. In particular, the control rate of agricultural non-point source pollution is very low, and the water body is still seriously polluted by fertilizers and pesticides, which directly harms surface water and indirectly affects groundwater. Fortunately, since 2020, people’s drinking water has basically been guaranteed to be safe.
Remark 1.
Surface water is generally divided into five categories: Class I is applicable to source water and nature reserves; Class II is applicable to the primary protection zone of centralized drinking water sources, precious fish protection zones and fish and shrimp spawning zones; Class III is applicable to secondary protection areas of centralized drinking water sources, general fish protection areas and swimming areas; Class IV is applicable to general industrial water use areas and entertainment water areas that are not in direct contact with human bodies; Class V is applicable to agricultural water use areas and areas with general landscape requirements.
3.3.3. Correlation between Sewage Treatment Progress and Regional Economy
Take “RCI” and “PIT” as the reference sequence and , respectively, and take ANSR, OSTR, FTR, SRST and DSR (implementation) as the correlation sequence, and record them as and , respectively. In order to avoid the huge difference between the numbers, the RCI was converted to 1.0, 0.98885, 0.76954, 0.65996, 0.64505, 0.55327, 0.55502, 0.52068, 0.52641, 0.49996, while PIT conversion was 0.15910, 0.28566, 0.63078, 0.62515, 0.61390, 0.50542, 0.71916, 0.92447, 0.43552, 1.0. From Equation (4), we obtain all the correlation coefficients (see Table 6).
Because we conclude that the order of the degree of association between the treatment progress of the five main types of sewage and RCI is It shows that the rural per capita income has a great impact on livestock and poultry farms, township enterprises and agricultural non-point source water pollution control. In fact, in rural areas with high per capita income, livestock and poultry breeding and township enterprises have formed large-scale production, which makes it easier to treat the sewage produced in production in a centralized manner. At the same time, it also pays attention to the control of agricultural non-point source water pollution. Because , we conclude that the order of the degree of association between the treatment progress of the five main types of sewage and PIT is . It shows that the proportion of the primary industry has a great impact on the sewage treatment of rural domestic sewage, rural hospitals and township enterprises. The proportion of the primary industry belongs to the inverse index. The smaller the index value, the more developed the secondary and tertiary industries. People’s living standards and public health conditions are also better. It is relatively easy to jointly treat domestic sewage, hospital sewage and enterprise sewage.
In addition, indicates that the relationship between rural sewage treatment indicators and RCI is greater than PIT. The key to water environment treatment is the need for economic support. The rural per capita income directly reflects the regional economic level, while the proportion of the primary industry indirectly reflects the economic strength. However, Shou County is a special case. Although it is an underdeveloped area, with low per capita income in rural areas, a significant proportion of primary industries and poor development of township enterprises, rural domestic sewage treatment has been promoted rapidly. The main reason is that Shou County is close to the Huaihe River, which is still seriously polluted. Water pollution directly affects the drinking water source of Shou County. People in Shou County are generally concerned about rural water environment treatment.
3.3.4. Evaluation of Operation Status of Rural Sewage Treatment Facilities
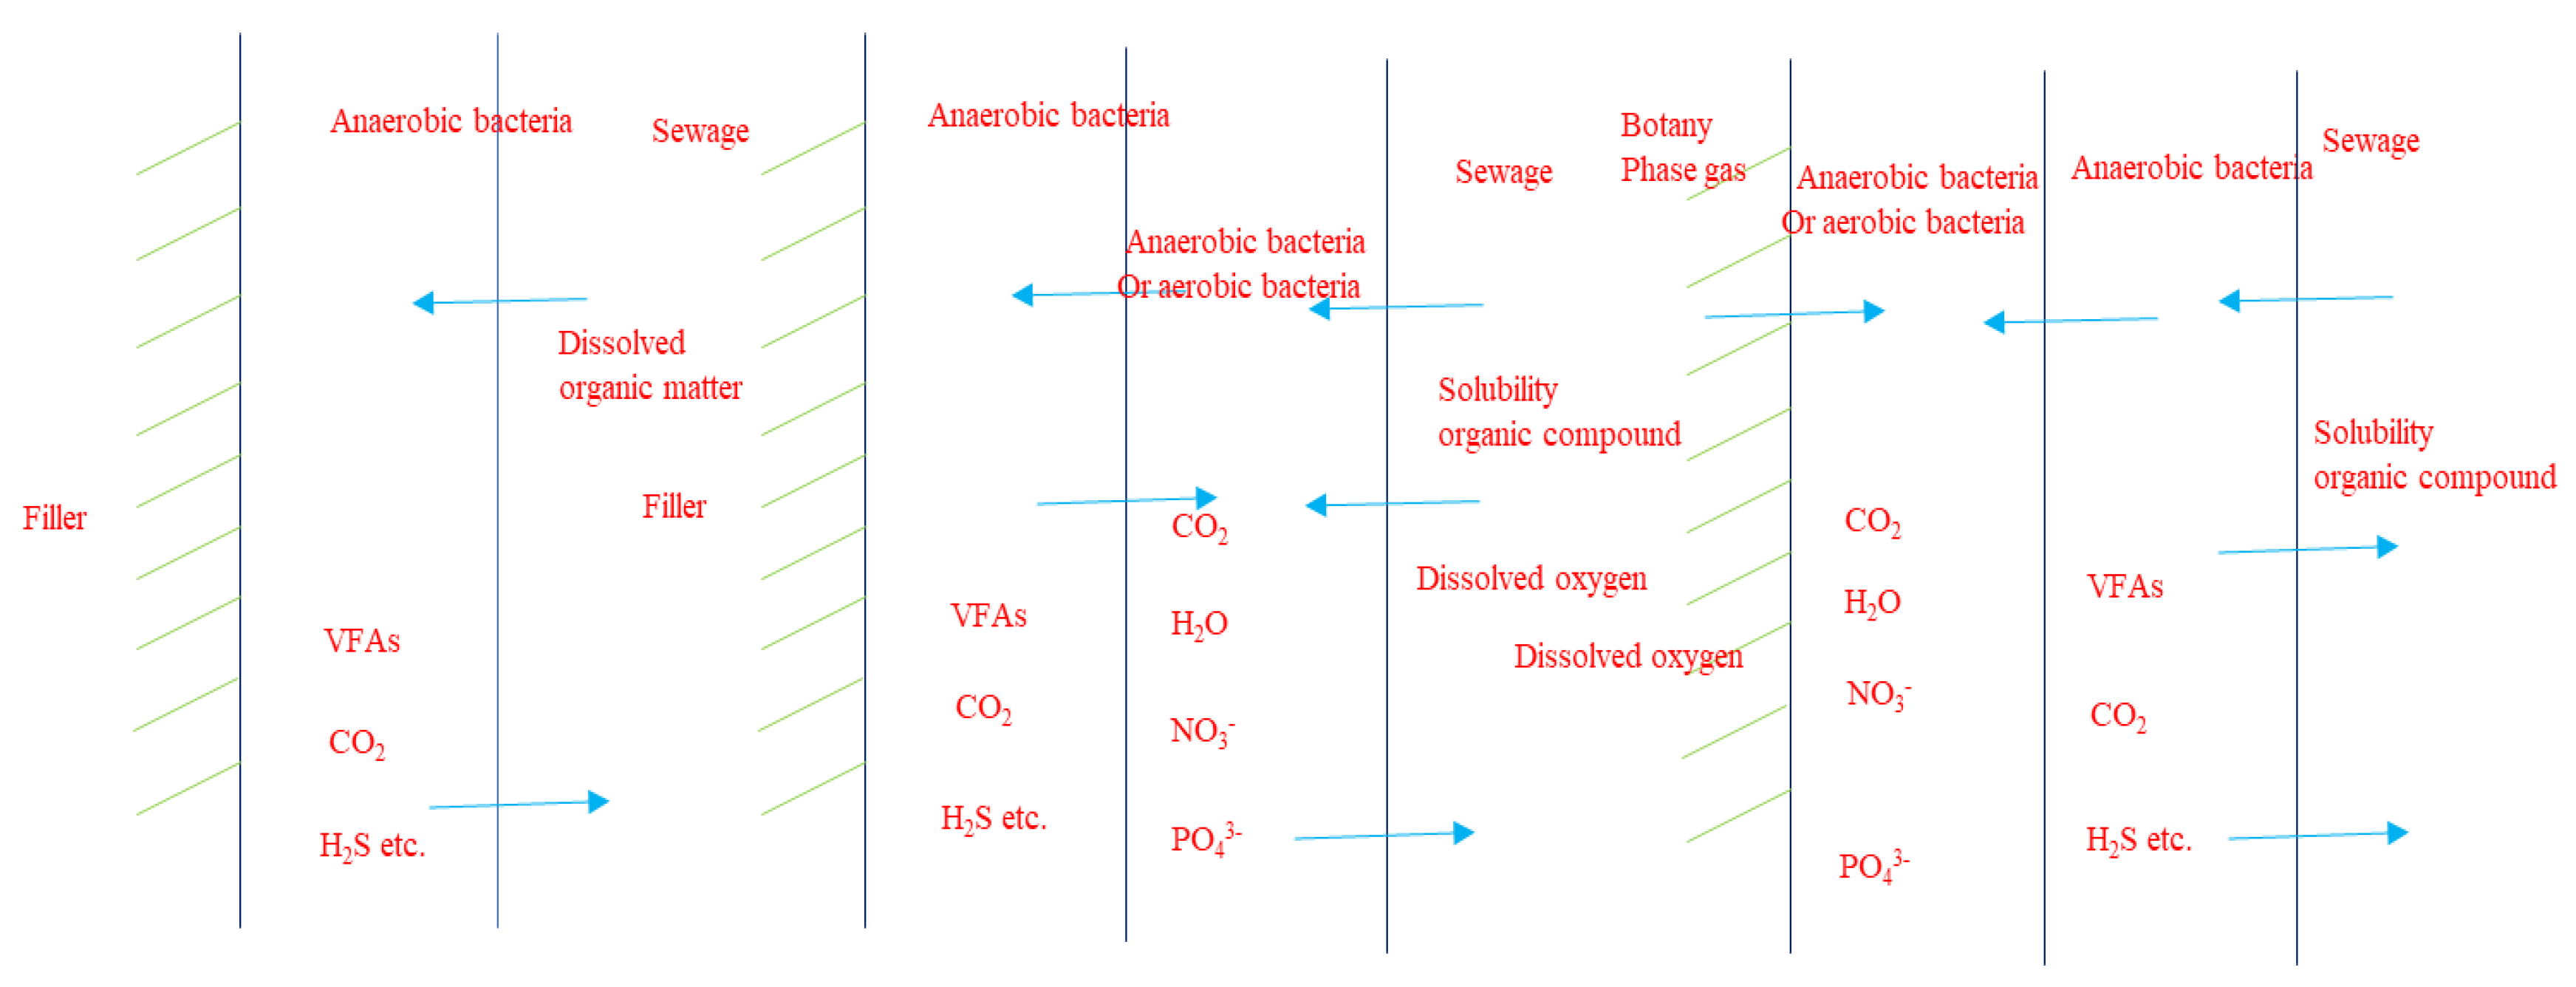
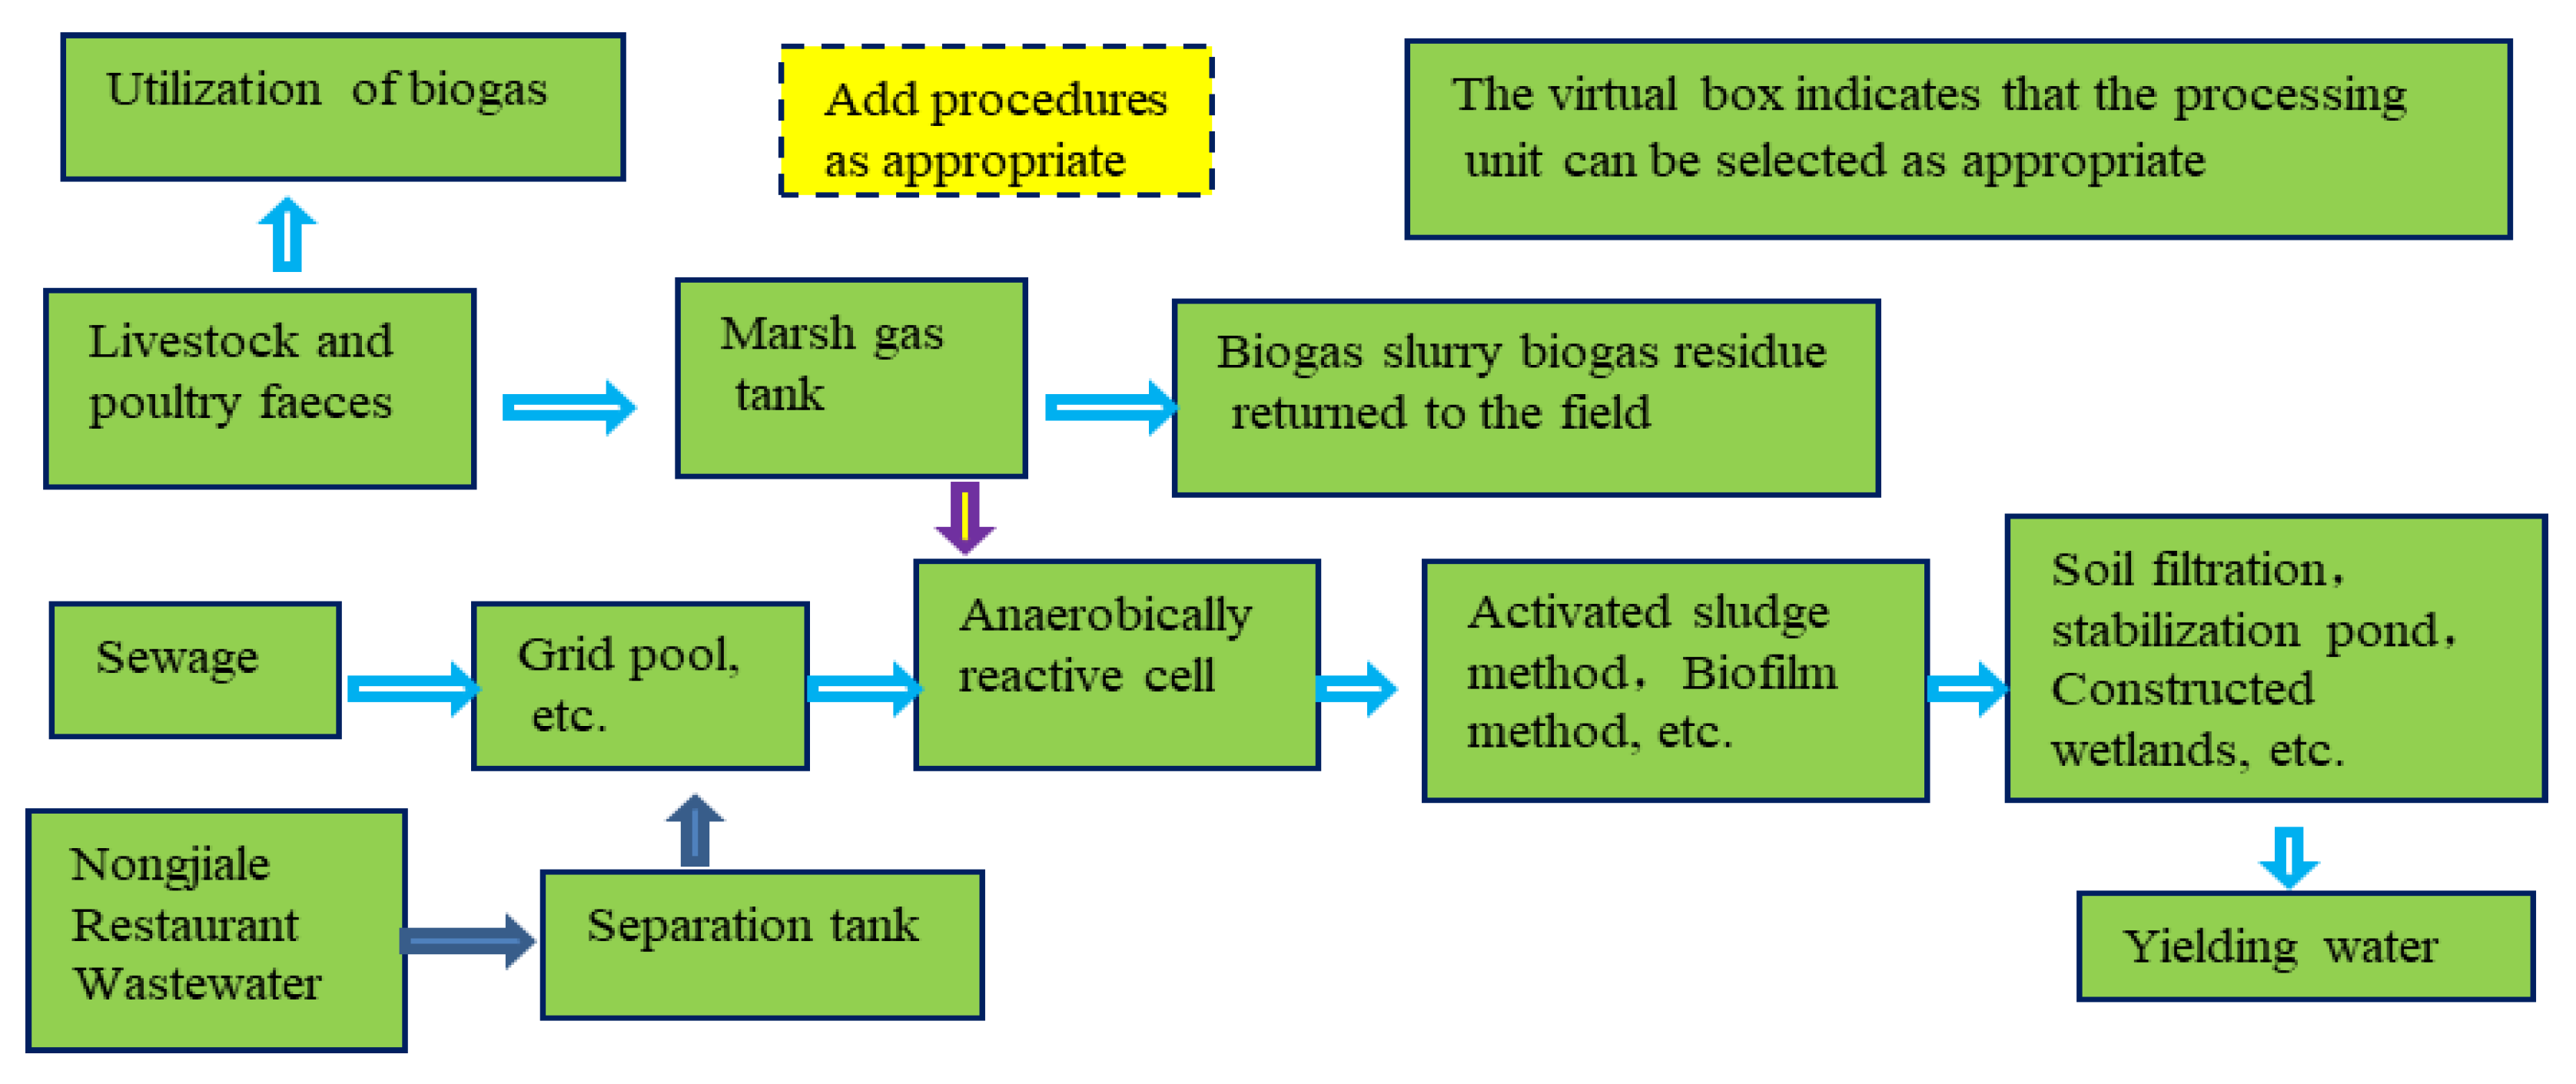
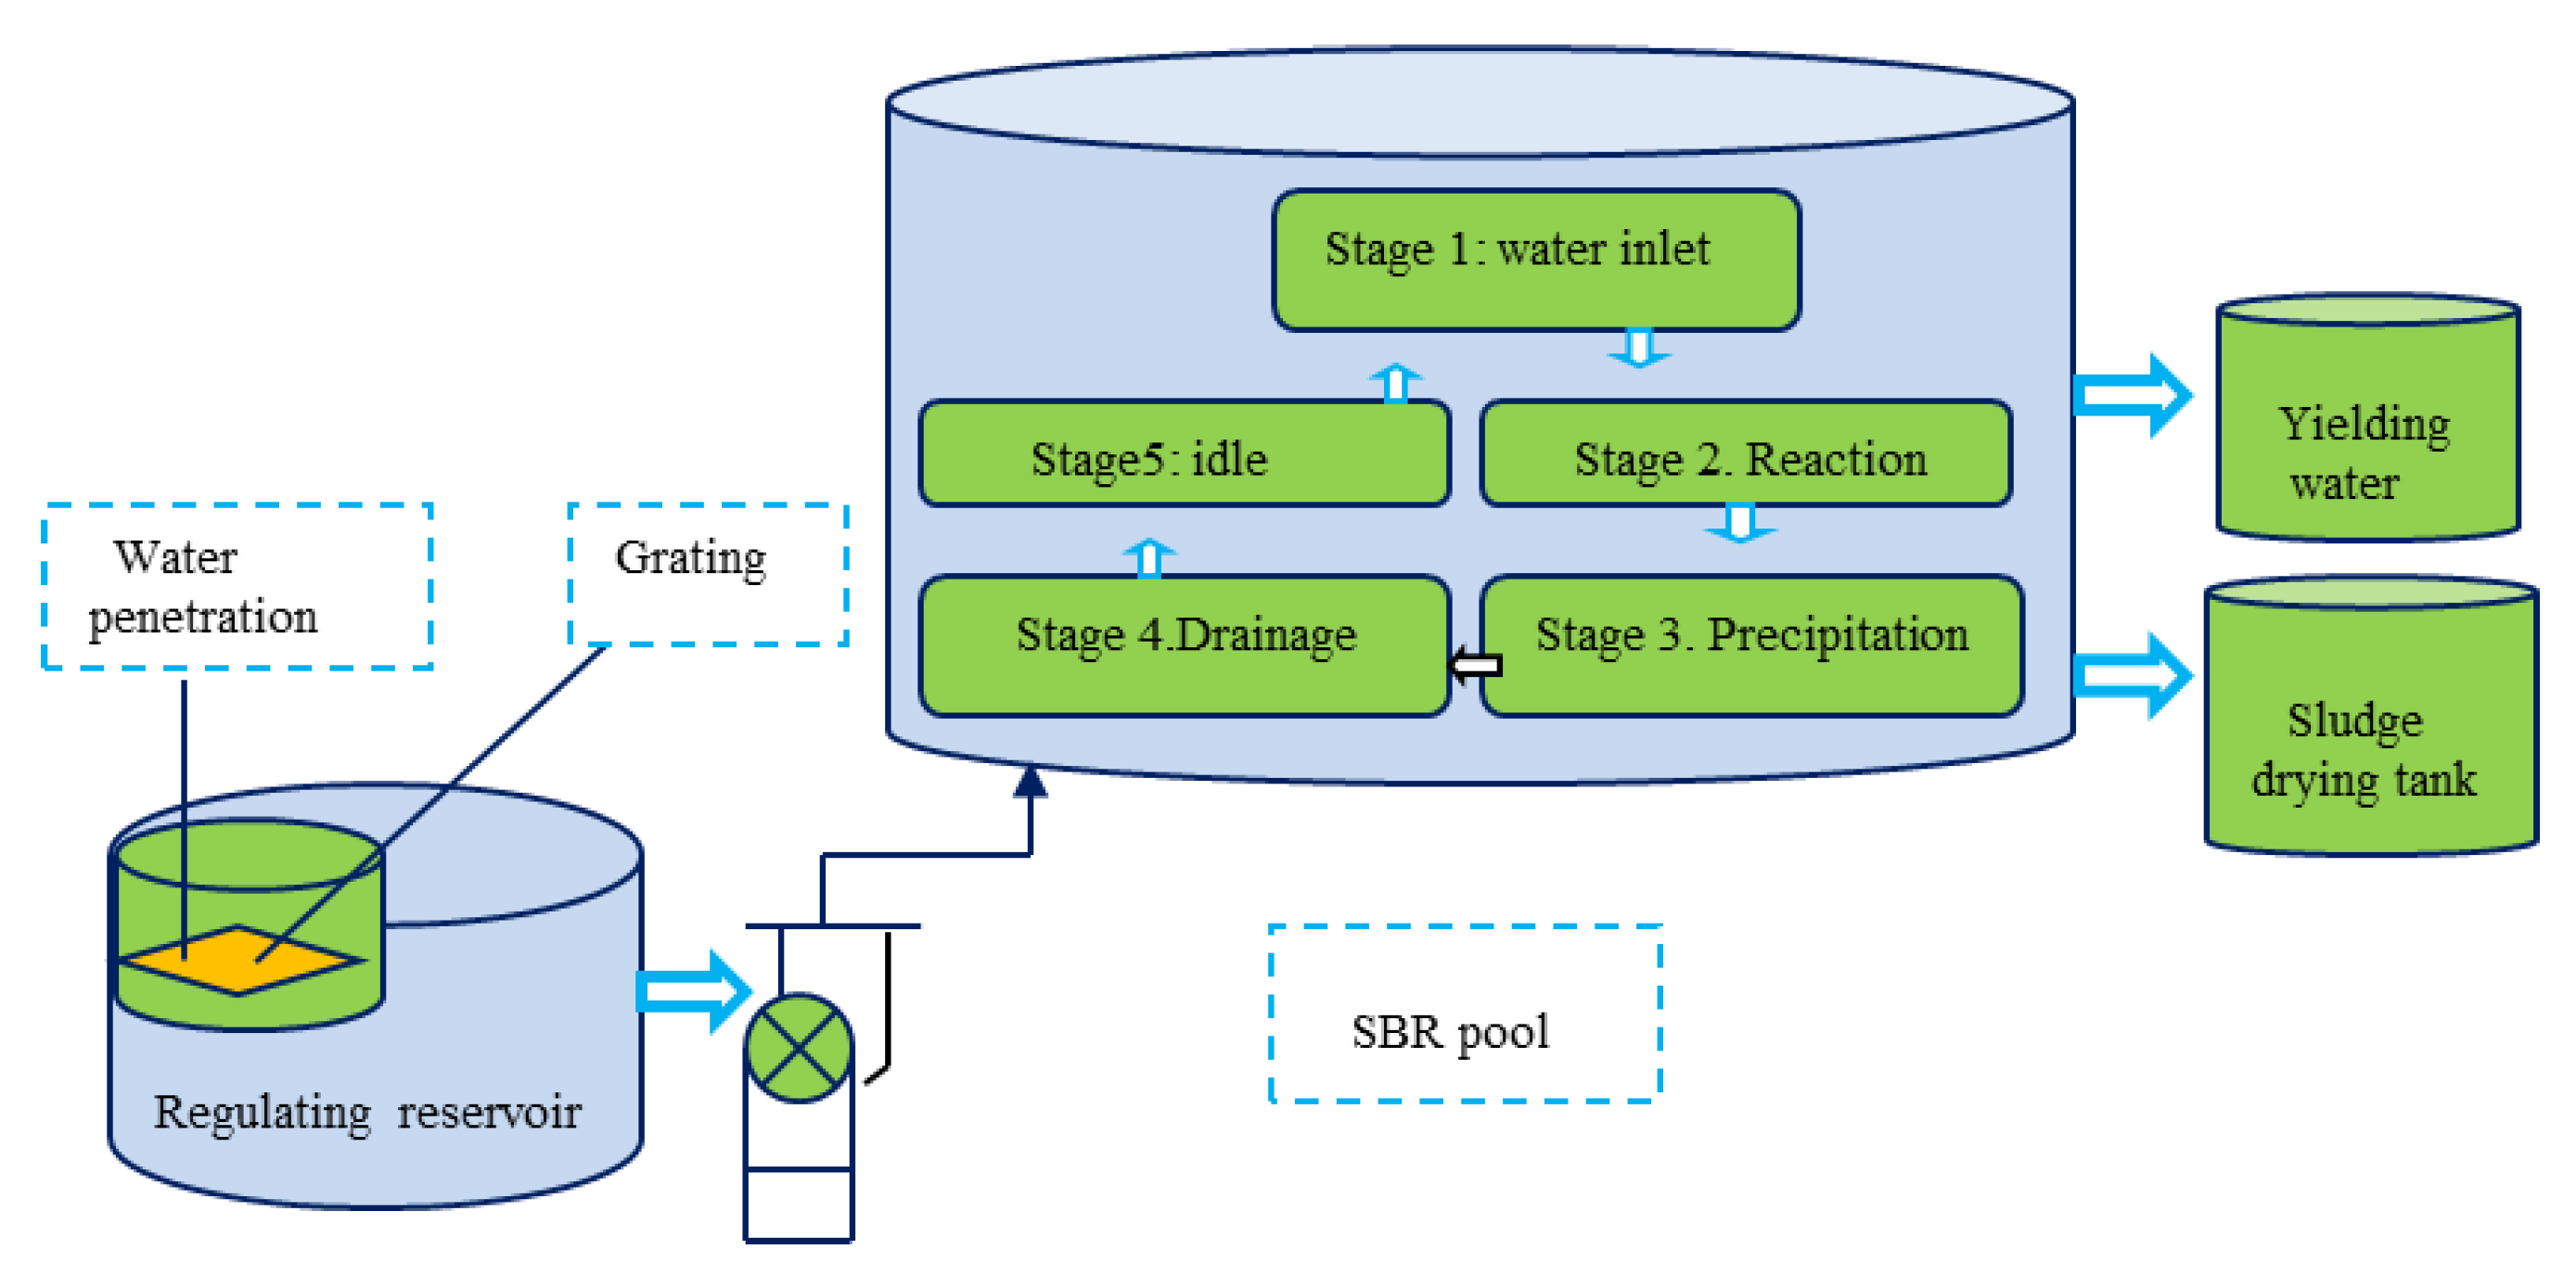
According to GB/T51347-2019, rural sewage treatment technology can be basically classified into two categories. The first is the wetland-type ecological treatment system, including (1) constructed wetland (see Figure 5), (2) ecological ditch and (3) stabilization pond. Constructed wetland is a kind of artificial sewage treatment tank similar to a swamp. Sewage treatment is implemented through the optimal combination of physical, chemical and biological effects in the system. The sewage is put into the water-resistant and swampy wetlands planted with reeds, cattails, etc., in a controlled manner. The purpose of purifying the sewage and improving the ecological environment is achieved through the infiltration of soil and the comprehensive ecological effect of the aquatic plants and animals cultivated. The principle of the ecological ditch and stabilization pond is similar to that of artificial wetland, but the scale is slightly small. The second is the equipment-type biological treatment system, including (1) anaerobic hydrolysis technology. The main features are no power or micro power and low energy consumption, such as a no-power buried domestic sewage treatment device. The disadvantage is that the biological treatment efficiency is low, especially the removal rate of nitrogen and phosphorus is very low. (2) Biological oxidation contact technology, namely, the aerobic biofilm method. In practical application, according to the characteristics of sewage, a variety of technology combination modes should be adopted to treat sewage. At present, there are mainly four modes adopted in many places: (A) anaerobic biological treatment and ecological engineering; (B) anaerobic biological treatment, aerobic biological treatment and ecological engineering; (C) biogas digester, anaerobic biological treatment, aerobic biological treatment and artificial wetland (see Figure 6); and (D) integrated package equipment (see Figure 7).
Among them, (A) is mainly applicable to one or more families, usually buried underground; (B) is suitable for small- and medium-sized enterprises, rural hospitals or collective use; (C) is applicable to livestock and poultry farms; and (D) is suitable for large sewage treatment plants.
Rural sewage treatment facilities are generally small in scale, and the construction cost and operating cost of equipment are far higher than those of cities and towns, which are more than twice that of cities and towns in many places. In many rural areas, sewage treatment facilities are “unaffordable” and “poorly managed”, causing some rural sewage treatment facilities to fail to operate normally. The reasons are as follows: First, there is a lack of sufficient funds for operation and maintenance. Not only households but also some local governments have defaulted on sewage charges. Many sewage treatment facilities cannot be maintained in time, especially wetland facilities. It is necessary to regularly check and remove the nutrients deposited underwater, adjust the substrate and dredge the inlet and outlet pipes. However, these situations are often ignored, affecting the operation effect. Second, the operation of many rural sewage treatment facilities lacks supervision. For example, the maintenance management system of small buried household facilities is not sound, and failures cannot be found and repaired in time. Some private livestock and poultry farms built their own sewage treatment facilities, which not only failed to meet the standard, but also could not be regularly detected and repaired, affecting the normal operation. Third, in many rural areas, the number of township enterprises is small and the total scale is small. The sewage treatment facilities of township enterprises often fail to meet the standards. From the perspective of promoting local economic development, local governments and local villagers strongly demand that these township enterprises not be banned.
According to the data of the Hefei Ecological Protection Bureau, the normal operation rate of rural sewage treatment facilities in Hefei was only 36% at the end of 2018 and 91% by 2020. Among the 10 sample counties, only Fanchang County announced that the operation rate of all sewage treatment facilities had reached 100%, while other counties had no statistical data on the normal operation rate of rural sewage facilities. In addition, there are some completed sewage treatment facilities. Due to lack of funds, the supporting pipeline project has not been completed for a long time and cannot be put into use. In particular, due to the impact of COVID-19, some projects under construction are at a standstill.
3.4. Results and Discussion
According to Table 4 and Figure 3, the treatment rate of the five main types of sewage is still relatively low on the whole. The vast majority of counties have not yet reached 30%, only two economically developed counties have reached more than 40%, and the highest is only 58.63%. The standard rate of tailwater after agricultural non-point source sewage treatment is basically 70–80%, and the standard rate of tailwater treated by simple facilities is only 30–55%. According to Table 6 and Figure 4, the safety of drinking water in rural areas has been basically guaranteed. Groundwater can only be used for washing and bathing. The quality of surface water is still very poor, generally only reaching Class IV or Class V.
In addition, the correlation coefficient between and is
It shows that the treatment rate of the five main types of sewage is highly negatively correlated with the simple treatment rate of sewage. That is to say, the counties with insufficient sewage treated by standardized facilities often adopt simple treatment methods to treat sewage. Fanchang County and Feixi County, with relatively developed economies, have made faster progress in sewage treatment than other counties. It can be seen from the indicators in Table 3 that the up to standard operation rate of the five main types of sewage treatment facilities in each county is basically about 90%. Section 3.3.3 shows that the progress and effect of rural sewage treatment are most closely related to “rural per capita income”, followed by “proportion of primary industry”. In addition, the operation effect of sewage treatment facilities also highly depends on the economic strength of various regions.
For the rural areas with scattered residences and a weak economy, the comprehensive implementation of sewage treatment is indeed a hard nut to crack in the new rural construction. Specifically, (1) the cost of laying sewage pipelines in cities is about twice that of purification facilities, and the cost of pipelines in rural areas is generally 3–4 times, or even more than 4 times, that of purification facilities. (2) The population is scattered, and the sewage treatment facilities are only suitable for miniaturization. Many organic towns also have a small population, and it is difficult to include remote villages. The per capita equipment cost is high, the purification cost is higher than that of cities, the household income of farmers is generally lower than that of cities and towns and the financial capacity of local governments is also lower than that of cities. (3) Small sewage treatment systems have low adaptability to population changes, it is difficult to reasonably select the capacity of equipment and the operation and management costs are high. It is still quite difficult to achieve the goal of fully implementing rural domestic sewage treatment by the end of 2030. Therefore, the key to promoting rural sewage treatment is to significantly increase farmers’ income, and more importantly, the government needs to increase investment in rural sewage treatment facilities.
4. Summary
In 2017, the Chinese government proposed two goals to promote rural sewage treatment. The short-term goal has achieved good results. By the end of 2021, the rural tap water penetration rate reached more than 98%, and about 95% of the rural tap water reaches the drinking standard. The implementation of the medium-term and long-term goals is slow, especially the treatment rate of agricultural non-point source sewage and domestic sewage is generally low, and surface water such as rural ponds and reservoirs basically belongs to Class IV or Class V. On 23 April 2022, the Ministry of Ecology and Environment answered a reporter from the Southern Weekend, saying that the comprehensive treatment rate of rural sewage in 2021 will be only 28%. Moreover, the standard operation rate of all sewage treatment facilities is generally only about 90%.
The promotion of rural water pollution control is relatively smooth only in economically affluent areas. The construction of sewage treatment facilities requires a large amount of government investment, and many local governments lack financial resources. In particular, some underdeveloped areas are still in the stage of propaganda and planning. In addition, the treatment of agricultural non-point source sewage caused by irrational application of chemical fertilizers and pesticides should be a difficult problem. Unless there is a major breakthrough in the agricultural production mode, it is difficult to make a major improvement in the short term. Wang H.C., the director of the Low-carbon Water Environment Technology Research Center of Renmin University of China, said that at present, there is no mature treatment technology for rural domestic sewage treatment, which basically applies urban treatment methods directly. The cost of small-scale operation is high, and the energy consumption per unit operation is high, resulting in the problem of “affordable construction, unable operation”. Secondly, the water volume changes greatly day and night, the sewage discharge is discontinuous, and the water volume change coefficient is much larger than that of the city, which also increases the difficulty of building rural sewage treatment facilities [33].
This study also has two deficiencies. First, there is not much research and application of sewage reuse (such as irrigation or fish farming) in China. This is actually a topic worthy of attention. The second is how to improve and implement the charging policy of sewage treatment and ensure the normal operation of sewage treatment facilities. The scale of rural sewage treatment facilities is small, and the unit sewage treatment cost is higher than that of the city. It is unfair to charge higher than that of the city, and the local government cannot afford lower than that of the city. This is an important issue related to people’s livelihood, and no one has paid attention to it at present.
Author Contributions
W.X. proposed the subject, conceived the research framework, method, operation software calculation and drafted the full text. W.X. and Z.L. discussed and analyzed the survey results. Z.L. led the students to carry out the survey, collate and manage the data, and review the English version. Finally, they reviewed the full text together. The project funds are jointly obtained. All authors have read and agreed to the published version of the manuscript.
Funding
This work is partially supported by National Social Science Fund Project (19BJL035); Jiangsu Social Science Foundation Project (22EYD002).
Data Availability Statement
Not applicable.
Conflicts of Interest
This research only uses the government project fund, and has no economic disputes with any organization or individual.
References
- Du, J.; Jin, H.W.; Chen, L.D. Development status and trend analysis of livestock and poultry waste resource utilization equipment industry. Chin. Cows 2019, 11, 47–50. [Google Scholar]
- Wang, M.G.; Yang, H.Q. Dilemma analysis and legal countermeasures of rural domestic waste disposal. Manag. J. 2020, 1, 100–101. [Google Scholar]
- Cotruvo, J.A. WHO guidelines for drinking water quality: Frst addendum to the fourth edition. J.-Am. Water Work. Assoc. 2017, 109, 2–39. [Google Scholar]
- Silva, M.C.O.; Vasconcelos, R.S.; Cirilo, J.A. Risk mapping of water supply and sanitary sewage systems in a city in the Brazilian Semi-Arid Region using GIS-MCDA. Water 2022, 14, 3251. [Google Scholar] [CrossRef]
- Alver, A. Evaluation of conventional drinking water treatment plant efficiency according to water quality index and health risk assessment. Environ. Sci. Pollut. Control Ser. 2019, 26, 27225–27238. [Google Scholar] [CrossRef]
- Čelić, M.; Škrbić, B.D.; Insa, S.; Živančev, J.; Gros, M.; Petrović, M. Occurrence and assessment of environmental risks of endocrine disrupting compounds in drinking, surface and wastewaters in Serbia. Environ. Pollut. 2020, 262, 114344. [Google Scholar] [CrossRef]
- Ji, R.; Zou, Y.F.; Dong, W.T.; Yang, M.R.; Zhang, Q.; Zhang, X.Q. Investigation on the pollution of untreated drinking water and common diseases in rural areas of Naxi District, Luzhou city. Green Technol. 2018, 18, 54–58. [Google Scholar]
- Awad, H.; Gar Alalm, M.; El-Etriby, H.K. Environmental and cost life cycle assessment of different alternatives for improvement of wastewater treatment plants in developing countries. Sci. Total Environ. 2019, 660, 57–68. [Google Scholar] [CrossRef]
- Liu, Y. Management measures and Enlightenment of municipal sewage treatment in Sweden. Environ. Pollut. Prev. 2016, 38, 81–85. [Google Scholar]
- Ziembowicz, S.; Kida, M.; Koszelnik, P.; Czarnota, J.; Miąsik, M. Fenton-like degradation of di-n-butyl phthalate in landfill leachate by endogenous catalysts or iron, copper and manganese loaded bottom sediments. Environ. Nanotechnol. Monit. Manag. 2021, 16, 100551. [Google Scholar] [CrossRef]
- Chen, X.M.; Wang, C.L.; Bo, R. Current Situation of Pesticide Use in China and Countermeasures. Pestic. Sci. Manag. 2016, 37, 4–8. [Google Scholar]
- Diab, K.E.; Salama, E.; Hassan, H.S.; El-moneim, A.; Elkady, M.F. Biocompatible MIP-202 Zr-MOF tunable sorbent for cost-effective decontamination of anionic and cationic pollutants from waste solutions. Sci. Rep. 2021, 11, 1–13. [Google Scholar] [CrossRef] [PubMed]
- Mohamed, S.; Jacek, N.; Andrzej, G. Low-cost Adsorbents Derived from Agricultural By-products/Wastes for Enhancing Contaminant Uptakes from Wastewater: A Review. Pol. J. Environ. Stud. 2017, 26, 479–510. [Google Scholar]
- Marius, G.M.; Anca, Z.; Simona, O.; Bucura, F.; Raboaca, M.S.; Filote, C.; Ionete, R.E.; Niculescu, V.C.; Constantinescu, M. Sewage Sludge Derived Materials for CO2 Adsorption. Appl. Sci. 2021, 11, 7139. [Google Scholar] [CrossRef]
- Saravanan, A.; Senthil, K.P.; Jeevanantham, S.; Karishma, S.; Tajsabreen, B.; Yaashikaa, P.R.; Reshma, B. Effective water/wastewater treatment methodologies for toxic pollutants removal: Processes and applications towards sustainable development. Chemosphere 2021, 280, 130595. [Google Scholar] [CrossRef]
- Singh, S.; Wasewar, K.L.; Kansal, S.K. Low-cost adsorbents for removal of inorganic impurities from wastewater. In Inorganic Pollutants in Water; Elsevier: Amsterdam, The Netherlands, 2020; Chapter 10; pp. 173–203. [Google Scholar]
- Salerno, F.; Gaetano, V.; Gianni, T. Urbanization and climate change impacts on surface water quality: Enhancing the resilience by reducing impervious surfaces. Water Res. 2018, 144, 491–502. [Google Scholar] [CrossRef]
- Ashfaq, M.; Sun, Q.; Ma, C.; Rashid, A.; Li, Y.; Mulla, S.I.; Yu, C.P. Occurrence, seasonal variation and risk evaluation of selected endocrine disrupting compounds and their transformation products in Jiulong river and estuary, China. Mar. Pollut. Bull. 2019, 145, 370–376. [Google Scholar] [CrossRef]
- Triassi, M.; Montuori, P.; Provvisiero, D.P.; De Rosa, E.; Di Duca, F.; Sarnacchiaro, P.; Díez, S. Occurrence and spatial-temporal distribution of atrazine and its metabolites in the aquatic environment of the Volturno River estuary, southern Italy. Sci. Total Environ. 2022, 803, 149972. [Google Scholar] [CrossRef]
- El Osta, M.; Masoud, M.; Alqarawy, A.; Elsayed, S.; Gad, M. Groundwater suitability for drinking and irrigation using water quality indices and multivariate modeling in makkah Al-Mukarramah province, Saudi Arabia. Water 2022, 14, 483. [Google Scholar] [CrossRef]
- Gad, M.; Abou El-Safa, M.M.; Farouk, M.; Hussein, H.; Alnemari, A.M.; Elsayed, S.; Khalifa, M.M.; Moghanm, F.S.; Eid, E.M.; Saleh, A.H. Integration of water quality indices and multivariate modeling for assessing surface water quality in Qaroun lake, Egypt. Water 2021, 13, 2258. [Google Scholar] [CrossRef]
- Jabbar, F.K.; Grote, K. Statistical assessment of nonpoint source pollution in agricultural watersheds in the Lower Grand River watershed, MO, USA. Environ. Sci. Pollut. Control Ser. 2019, 26, 1487–1506. [Google Scholar] [CrossRef] [Green Version]
- Khan, R.; Jhariya, D.C. Groundwater quality assessment for drinking purpose in Raipur city, Chhattisgarh using water quality index and geographic information system. J. Geol. Soc. India. 2017, 90, 69–76. [Google Scholar] [CrossRef]
- Nong, X.Z.; Shao, D.G.; Zhong, H.; Liang, J.K. Evaluation of water quality in the South-to-North Water Diversion Project of China using the water quality index (WQI) method. Water Res. 2020, 178, 115781. [Google Scholar] [CrossRef]
- Marín Celestino, A.E.; Martínez Cruz, D.A.; Otazo Sánchez, E.M.; Gavi Reyes, F.; Vásquez Soto, D. Groundwater quality assessment: An improved approach to K-means clustering, principal component analysis and spatial analysis: A case study. Water 2018, 10, 437. [Google Scholar] [CrossRef] [Green Version]
- Norouzi, H.; Moghaddam, A.A. Groundwater quality assessment using random forest method based on groundwater quality indices (case study: Miandoab plain aquifer, NW of Iran). Arabian J. Geosci. 2020, 13, 912. [Google Scholar] [CrossRef]
- Pennino, M.J.; Leibowitz, S.G.; Compton, J.E.; Hill, R.A.; Sado, R.D. Patterns and predictions of drinking water nitrate violations across the conterminous United States. Sci. Total Environ. 2020, 722, 137661. [Google Scholar] [CrossRef]
- Ratolojanahary, R.; Hou´e, N.R.; Medjaher, K.; Dauriac, F.; Sebilo, M. Groundwater quality assessment combining supervised and unsupervised methods. IFAC Pap. Online 2019, 52, 340–345. [Google Scholar] [CrossRef]
- Shah, M.I.; Javed, M.F.; Alqahtani, A.; Aldrees, A. Environmental assessment-based surface water quality prediction using hyper-parameter optimized machine learning models based on consistent big data. Process Saf. Environ. Protect. 2021, 151, 324–340. [Google Scholar] [CrossRef]
- Xu, W.; Sun, T. Risk assessment and analysis of harmful residues in edible agricultural products in China: Take Anhui Province as an example. Environ. Sci. Pollut. Res. 2021, 28, 54317–54338. [Google Scholar] [CrossRef]
- Xu, W.; Xu, F.; Liu, Y.Z.; Zhang, D. Assessment of Rural Ecological Environment Development in China’s Moderately Developed Areas: A Case Study of Xinxiang, Henan Province. Environ. Monit. Assess. 2021, 193, 1–25. [Google Scholar] [CrossRef] [PubMed]
- Deng, J.L. Basic Method of Grey System; Huazhong University of Technology Press: Wuhan, China, 1987; pp. 19–41. [Google Scholar]
- Xia, J.; Zuo, Q.T. 40 Years of Water Resources Utilization and Protection in China (1978–2018). Urban Environ. Res. 2018, 6, 1850022. [Google Scholar]
Figure 1.
Main contents of Technical Standards for Rural Domestic Sewage Treatment Engineering.

Figure 2.
Research process of 10 sample counties (cities) in Anhui.

Figure 3.
Progress of water pollution control in 10 sample counties in 2020.

Figure 4.
Quality of rural tap water, groundwater and surface water in 10 sample counties.

Figure 5.
Schematic diagram of transfer and transformation of various substances in Constructed Wetland.
Figure 5.
Schematic diagram of transfer and transformation of various substances in Constructed Wetland.

Figure 6.
Biogas digester, anaerobic biological treatment, aerobic biological treatment and constructed wetland.
Figure 6.
Biogas digester, anaerobic biological treatment, aerobic biological treatment and constructed wetland.

Figure 7.
Integrated complete equipment process.


Table 1.
Abbreviations of some indicator names.
| CODcr | Chemical oxygen demand | BODs | Biochemical oxygen demand |
| SS | Suspended matter | AVO | Animal and vegetable oil |
| NH3-N | Ammonia nitrogen | TN | Total nitrogen |
| TP | Total phosphorus | FCC | Fecal coliform count |
| SDR | Sediment rate | TLPP | Total population |
| UR | Urbanization rate | RCI | Rural per capita disposable income |
| PIT | Proportion of primary industry in the total | Treatment rate of five types of main sewage | |
| Indirect treatment rate of surface sewage | Ratio of sewage treated by simple method | ||
| Comprehensive sewage treatment rate | Farm sewage treatment rate | ||
| Sewage discharge rate up to standard of township enterprises hospitals | Comprehensive sewage treatment rate of rural hospitals | ||
| Domestic sewage treatment rate | Agricultural non-point sewage treatment rate | ||
| Sewage rate reduced by centralized garbage treatment | Sewage rate reduced by agricultural waste recycling | ||
| Sewage rate reduced by transformation of rural toilets farms | Simple sewage treatment of livestock and poultry | ||
| Simple sewage treatment rate of township enterprises | Other simple treatment sewage rate | ||
| Rural domestic sewage treatment rate | Urban domestic sewage treatment rate | ||
| Treatment rate of rural domestic garbage | Urban domestic waste treatment rate | ||
| Recycling rate of agricultural wastes | Rural toilet transformation rate |
Table 2.
Numerical tables of compatibility test .
| n | 3 | 4 | 5 | 6 | 7 | 8 | 9 |
|---|---|---|---|---|---|---|---|
| RI | 0.58 | 0.90 | 1.12 | 1.24 | 1.32 | 1.40 | 1.45 |
Table 3.
Economic development and water pollution control of 10 sample counties in 2020 Relative units: %.
Table 3.
Economic development and water pollution control of 10 sample counties in 2020 Relative units: %.
| County Average | Fanchang | Feixi | Wuwei | Dongzhi | Jingxian | Taihe | Zongyang | Linquan | Fenyang | Shouxian | Average |
|---|---|---|---|---|---|---|---|---|---|---|---|
| TTPP (10,000) | 27.96 | 84.69 | 118.62 | 54.6 | 27.6 | 138.0 | 71.9 | 230.7 | 79.23 | 139.92 | |
| UR | 59.86 | 65.4 | 68.31 | 55.6 | 56.33 | 46.2 | 57.0 | 30.46 | 49.91 | 42.9 | |
| RCI (CNY) | 26,357 | 26,062 | 20,282 | 17,394 | 17,001 | 14,582 | 14,628 | 13,723 | 13,837 | 13,177 | |
| PIT | 3.96 | 7.11 | 15.70 | 15.56 | 15.28 | 12.58 | 17.9 | 23.01 | 10.84 | 24.89 | 16.82 |
| 16.21 | 12.2 | 10.1 | 9.8 | 6.5 | 4.6 | 1.9 | 5.8 | 1.8 | 8.7 | 7.06 | |
| 68 | 67.8 | 65 | 62 | 61.5 | 62 | 64 | 60.2 | 60 | 63 | 62.73 | |
| 86 | 86 | 84.2 | 82.4 | 75.2 | 73.2 | 74 | 72.3 | 71.1 | 80.1 | 77.26 | |
| [0.1730] | 80 | 81 | 61 | 56 | 58 | 52 | 51 | 51 | 62 | 65 | 58.87 |
| 98 | 98.3 | 95.06 | 96.03 | 92.12 | 90.25 | 89.3 | 88.36 | 88.32 | 91.2 | 91.59 | |
| [0.2463] | 70 | 88 | 54 | 46 | 49 | 45 | 48 | 56 | 57 | 54.02 | |
| 97.5 | 96.3 | 95.06 | 92.16 | 89.3 | 88.35 | 88.35 | 90.24 | 89.3 | 93.12 | 91.57 | |
| [0.0526] | 71.2 | 78.5 | 42.1 | 42.4 | 27.6 | 22.3 | 15.8 | 36.5 | 18.9 | 27.5 | 35.64 |
| 96.04 | 95.2 | 95 | 93.1 | 96.04 | 92.15 | 91.2 | 96.04 | 90.25 | 91.2 | 93.59 | |
| [0.3217] | 60.98 | 58.85 | 24.51 | 26 | 20.13 | 16.61 | 20 | 12.8 | 15.92 | 25.39 | 23.70 |
| 98.6 | 98.5 | 97.02 | 94.08 | 89.24 | 89.3 | 90.24 | 94.5 | 91.4 | 93.1 | 94.87 | |
| [0.2664] | 6.1 | 6.5 | 5.8 | 5.3 | 4.7 | 5.4 | 5.2 | 4.6 | 4.0 | 4.4 | 5.01 |
| 80 | 81 | 79 | 76 | 73 | 74 | 70 | 73 | 70 | 71 | 74.18 | |
| [0.4884] | 5 | 3 | 8.5 | 12.6 | 18.5 | 21 | 20.8 | 21 | 22 | 21.4 | 17.03 |
| 48 | 50 | 45 | 45 | 43 | 45 | 41 | 44 | 44 | 45 | 44.85 | |
| [0.2935] | 9 | 8.5 | 10 | 15.2 | 15.6 | 20.4 | 20.7 | 24.8 | 25.5 | 28 | 19.91 |
| 55 | 54.3 | 52 | 64 | 62.5 | 53 | 53 | 52.5 | 50.4 | 54 | 52.90 | |
| [0.2181] | 4 | 4.5 | 4.8 | 6.3 | 7.5 | 8 | 11 | 11.5 | 9.6 | 8.4 | 8.32 |
| 35 | 35 | 33 | 30 | 32 | 35 | 32 | 32 | 31.5 | 32 | 32.74 | |
| [0.2740] | 15.05 | 14.82 | 14.22 | 14.21 | 13.50 | 13.61 | 13.66 | 13.72 | 13.11 | 14.55 | 13.98 |
| [0.2181] | 15.2 | 15.3 | 14.4 | 14.59 | 14.26 | 14.45 | 13.71 | 13.58 | 13.98 | 13.76 | 14.14 |
| [0.5079] | 8.38 | 8.84 | 8.6 | 8.33 | 8.0 | 9.0 | 8.66 | 8.83 | 8.28 | 7.2 | 8.48 |
Table 4.
Actual progress of sewage treatment in 10 sample counties. Units: %.
| County Average | Fanchang | Feixi | Wuwei | Dongzhi | Jingxian | Taihe | Zongyang | Linquan | Fenyang | Shouxian | Average |
|---|---|---|---|---|---|---|---|---|---|---|---|
| [0.68615] | 54.61 | 58.63 | 33.65 | 30.76 | 28.11 | 25.70 | 25.20 | 25.09 | 28.11 | 33.07 | 31.49 |
| [0.30573] | 2.93 | 2.43 | 3.74 | 5.59 | 6.75 | 8.40 | 8.15 | 9.14 | 9.16 | 9.73 | 7.47 |
| [0.00812] | 11.70 | 11.89 | 11.40 | 11.31 | 10.87 | 11.45 | 11.13 | 11.21 | 10.85 | 10.64 | 11.22 |
Table 5.
Rural water environment quality of 10 sample counties in 2020.
| Tap Water Quality | Groundwater Quality | Rural Small River | Pond, Reservoir | Farmland, Aquaculture Pond | |
|---|---|---|---|---|---|
| Fanchang | (0.920, 0.058, 0.022) | (0.115, 0.436, 0.449) | (0.802, 0.181, 0.013, 0.004) | (0.654, 0.223, 0.120, 0.003) | (0.011, 0.543, 0.332, 0.114) |
| Score (grade) | 98.98 | 76.66 | Surface water (overall) | 60.84 | (IV, 0.543) |
| Feixi | (0.901, 0.067, 0.032) | (0.142, 0.421, 0.437) | (0.805, 0.142, 0.021, 0.032) | (0.584, 0.203, 0.210, 0.003) | (0.045, 0.273, 0.421, 0.261) |
| Score (grade) | 96.386 | 77.05 | Surface water (overall) | 38.42 | (V, 0.421) |
| Wuwei | (0.851, 0.120, 0.029) | (0.065, 0.517, 0.418) | (0.630, 0.213, 0.135, 0.022) | (0.412, 0.136, 0.201, 0.251) | (0.008, 0.113, 0.523, 0.356) |
| Score (grade) | 98.22 | 76.47 | Surface water (overall) | 40.46 | (V, 0.523) |
| Dongzhi | (0.853, 0.105, 0.042) | (0.024, 0.524, 0.452) | (0.541, 0.323, 0.122, 0.014) | (0.332, 0.223, 0.203, 0.242) | (0.001, 0.025, 0.741, 0.233) |
| Score (grade) | 98.11 | 75.72 | Surface water (overall) | 40.46 | (V, 0.523) |
| Jingxian | (0.807, 0.092, 0.101) | (0.015, 0.531, 0.454) | (0.552, 0.341, 0.104, 0.003) | (0.284, 0.291, 0.214, 0.285) | (0.002, 0.030, 0.772, 0.196) |
| Score (grade) | 97.06 | 75.61 | Surface water (overall) | 45.4 | (V, 0.77) |
| Taihe | (0.802, 0.102, 0.096) | (0.025, 0.511, 0.464) | (0.521, 0.324, 0.110, 0.045) | (0.275, 0.301, 0.221, 0.203) | (0.002, 0.028, 0.752, 0.218) |
| Score (grade) | 97.06 | 76.31 | Surface water (overall) | 45.04 | (V, 0.752) |
| Zongyang | (0.604, 0.251, 0.145) | (0.011, 0.541, 0.448) | (0.332, 0.215, 0.212, 0.241) | (0.211, 0.257, 0.242, 0.290) | (0.001, 0.032, 0.688, 0.279) |
| Score (grade) | 94.59 | 75.63 | Surface water (overall) | 43.76 | (V, 0.688) |
| Linquan | (0.781, 0.204, 0.015) | (0.005, 0.522, 0.473) | (0.232, 0.221, 0.242, 0.305) | (0.201, 0.313, 0.106, 0.380) | (0.001, 0.025, 0.691, 0.283) |
| Score (grade) | 97.66 | 75.32 | Surface water (overall) | 42.82 | (V, 0.691) |
| Fengyang | (0.792, 0.204, 0.004) | (0.024, 0.527, 0.449) | (0.701, 0.112, 0.133, 0.054) | (0.310, 0.312, 0.112, 0.266) | (0.002, 0.022, 0.642, 0.334) |
| Score (grade) | 96.98 | 75.75 | Surface water (overall) | 43.84 | (V, 0.642) |
| Shouxian | (0.771, 0.210, 0.019) | (0.017, 0.516, 0.467) | (0.692, 0.231, 0.064, 0.013) | (0.224, 0.323, 0.225, 0.228) | (0.001, 0.019, 0.652, 0.328) |
| Score (grade) | 97.52 | 75.50 | Surface water (overall) | 43.04 | (V, 0.652) |
Table 6.
Correlation coefficients between RCI, PIT and progress on the treatment of the five main types of sewage.
Table 6.
Correlation coefficients between RCI, PIT and progress on the treatment of the five main types of sewage.
| 0.61946 | 0.7300 | 0.75336 | 0.83587 | 0.89319 | 0.95267 | 0.92978 | 1.00000 | 0.84577 | 0.76540 | |
| 0.61113 | 0.82243 | 0.67506 | 0.70607 | 0.75900 | 0.89633 | 0.82817 | 0.938103 | 0.95203 | 0.88452 | |
| 0.62115 | 0.70183 | 0.57370 | 0.66869 | 0.55923 | 0.58724 | 0.54063 | 0.75820 | 0.58187 | 0.67968 | |
| 0.54505 | 0.53850 | 0.46950 | 0.53875 | 0.51217 | 0.54704 | 0.56905 | 0.54343 | 0.56050 | 0.6589 | |
| 0.34135 | 0.34633 | 0.40869 | 0.70598 | 0.87598 | 0.85671 | 0.89332 | 0.90336 | 0.86181 | 0.92033 | |
| Correlation Coefficient of | ||||||||||
| 0.64090 | 0.52434 | 0.02078 | 0.06515 | 0.03390 | 0.01458 | 0.20916 | 0.41447 | 0.18448 | 0.35000 | |
| 0.54090 | 0.59434 | 0.09078 | 0.16515 | 0.12390 | 0.01542 | 0.26916 | 0.44447 | 0.12448 | 0.43000 | |
| 0.55290 | 0.49934 | 0.20978 | 0.20115 | 0.33790 | 0.28242 | 0.56116 | 0.55947 | 0.24652 | 0.72500 | |
| 0.45070 | 0.30284 | 0.38568 | 0.36515 | 0.41260 | 0.33932 | 0.51916 | 0.79647 | 0.27632 | 0.74610 | |
| 0.04710 | 0.16566 | 0.52978 | 0.23485 | 0.04390 | 0.13458 | 0.09916 | 0.34447 | 0.17448 | 0.45000 | |
Disclaimer/Publisher’s Note: The statements, opinions and data contained in all publications are solely those of the individual author(s) and contributor(s) and not of MDPI and/or the editor(s). MDPI and/or the editor(s) disclaim responsibility for any injury to people or property resulting from any ideas, methods, instructions or products referred to in the content. |
© 2023 by the authors. Licensee MDPI, Basel, Switzerland. This article is an open access article distributed under the terms and conditions of the Creative Commons Attribution (CC BY) license (https://creativecommons.org/licenses/by/4.0/).
Share and Cite
MDPI and ACS Style
Xu, W.; Liu, Z. Evaluation on the Current Situation of Integrated Treatment of Rural Sewage in China: A Case Study of Anhui Province. Water 2023, 15, 415. https://doi.org/10.3390/w15030415
AMA Style
Xu W, Liu Z. Evaluation on the Current Situation of Integrated Treatment of Rural Sewage in China: A Case Study of Anhui Province. Water. 2023; 15(3):415. https://doi.org/10.3390/w15030415
Chicago/Turabian StyleXu, Wei, and Zhulin Liu. 2023. "Evaluation on the Current Situation of Integrated Treatment of Rural Sewage in China: A Case Study of Anhui Province" Water 15, no. 3: 415. https://doi.org/10.3390/w15030415
Note that from the first issue of 2016, this journal uses article numbers instead of page numbers. See further details here.