
Hydrogeophysical and Hydrochemical Assessment of the Northeastern Coastal Aquifer of Egypt for Desalination Suitability

 , , and
Abstract
:1. Introduction
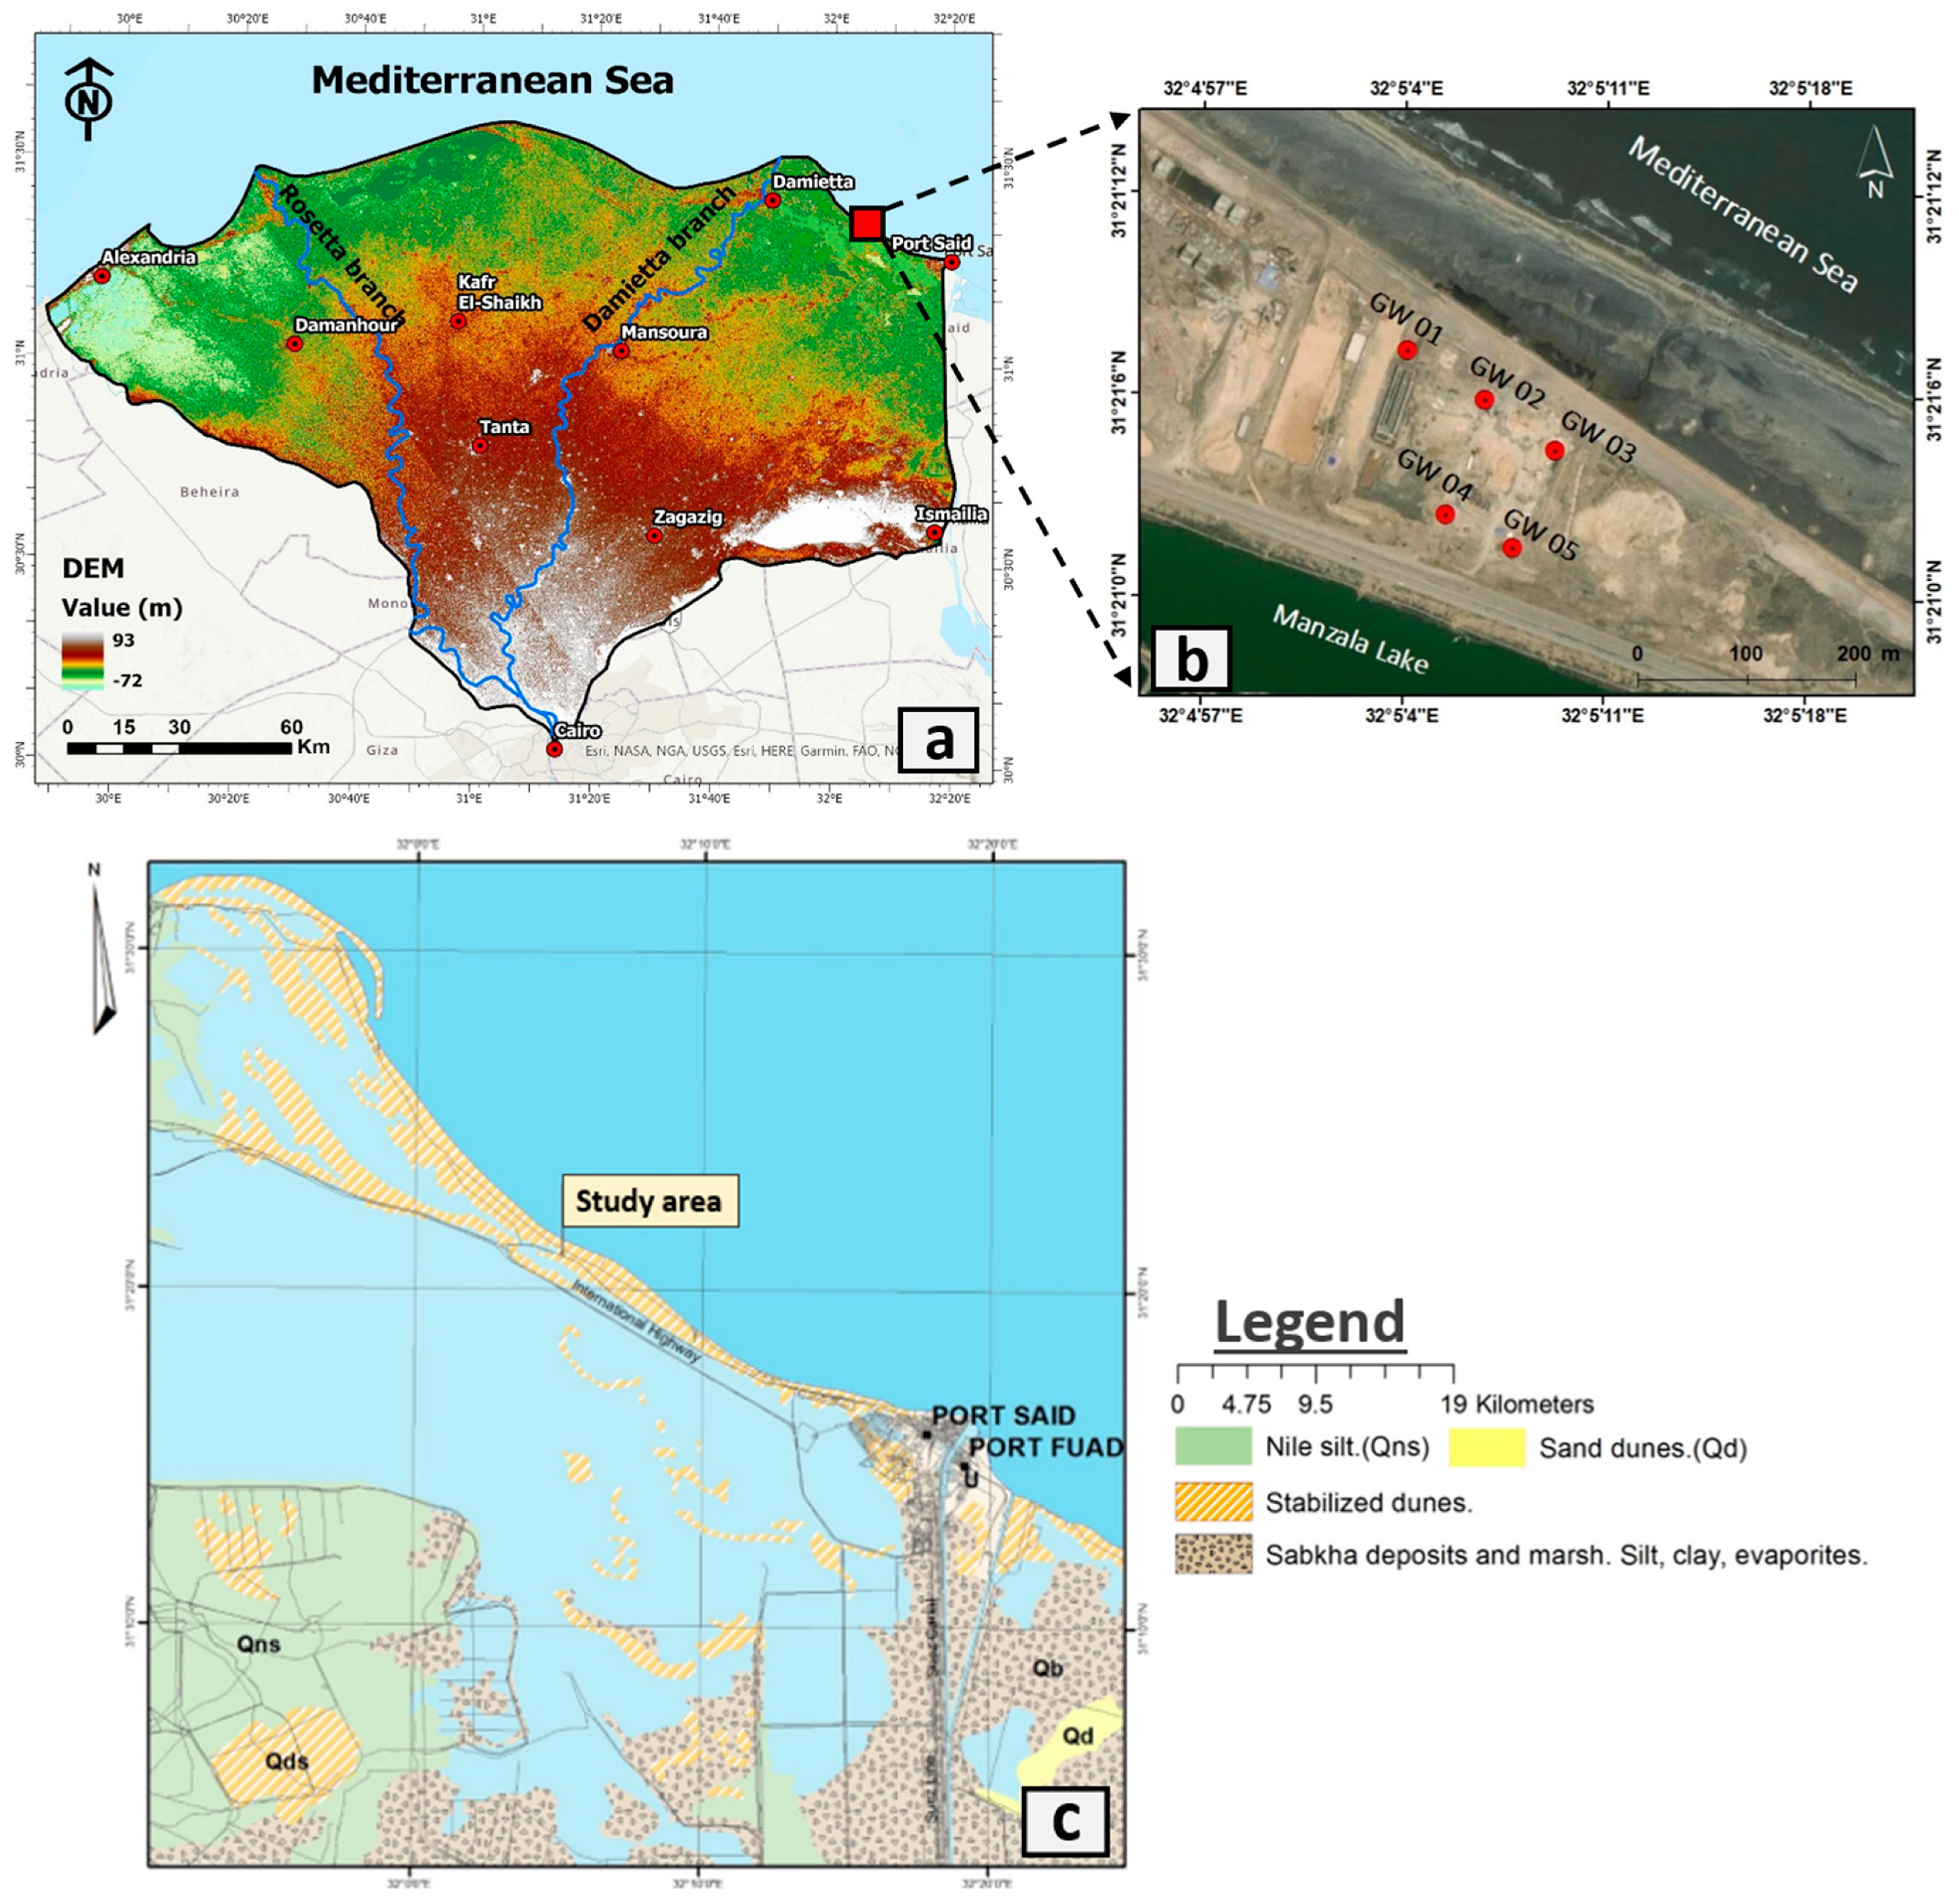
2. The Study Area
2.1. Geological Setting
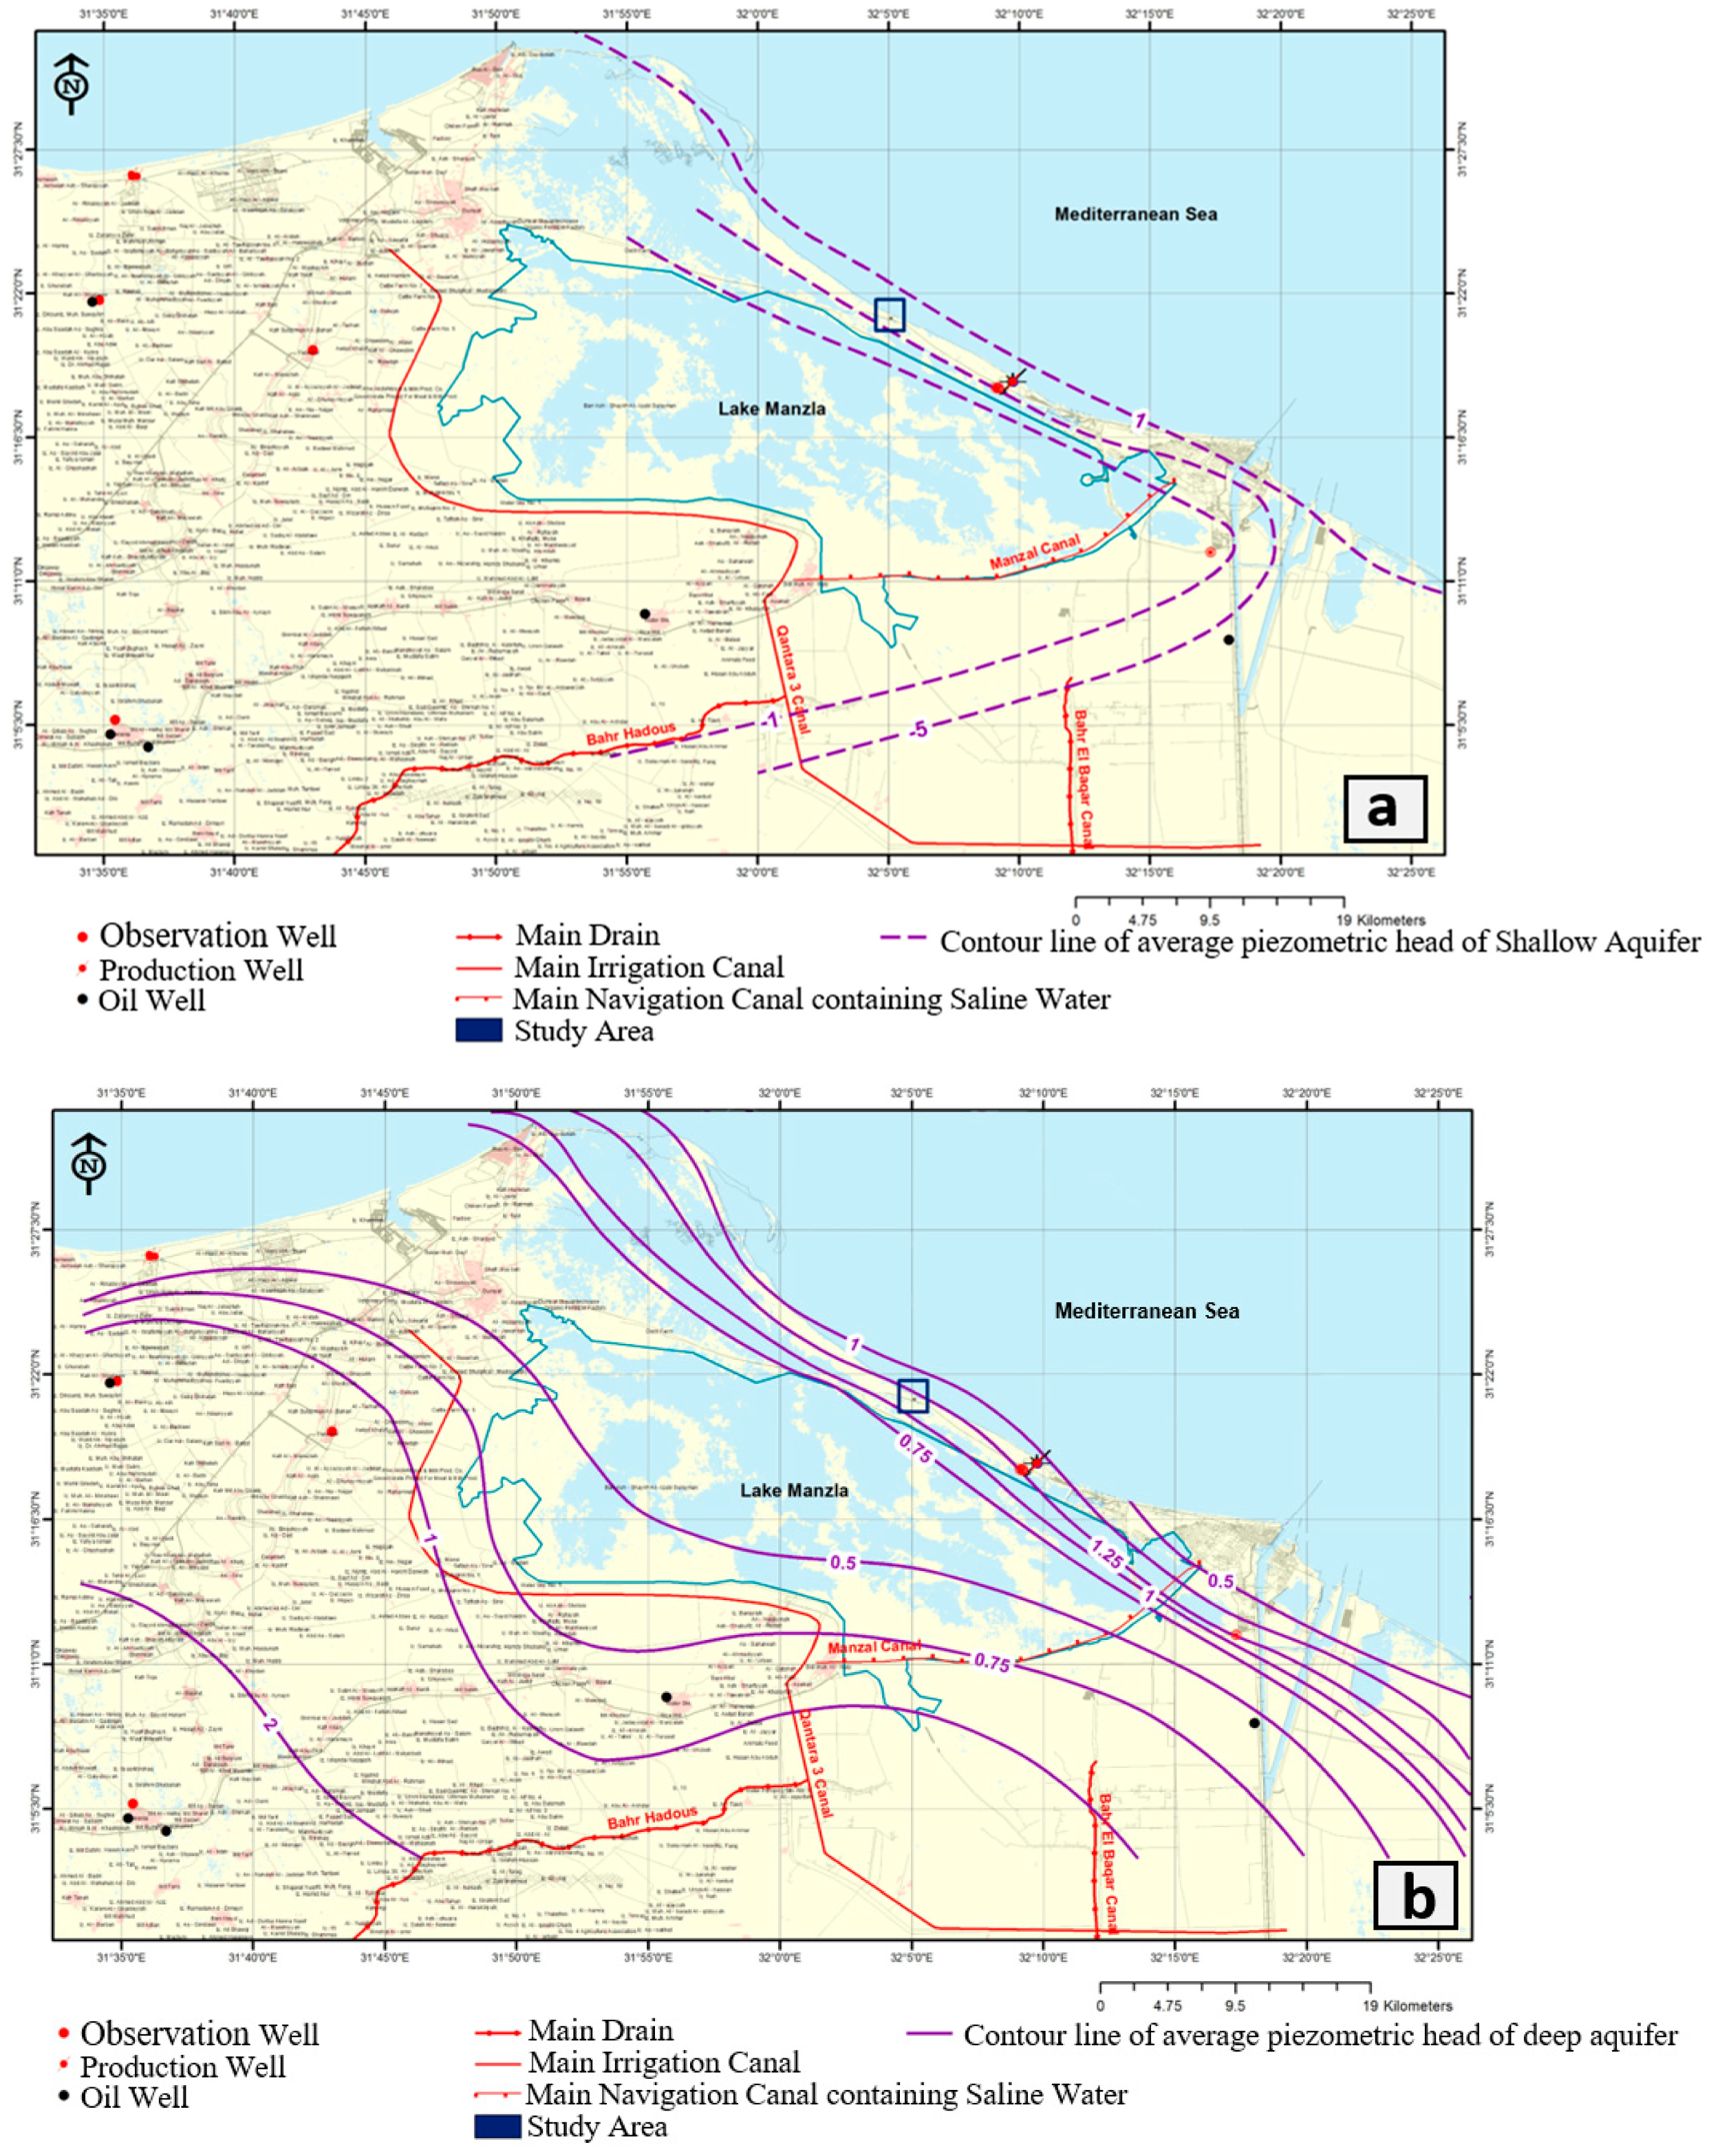
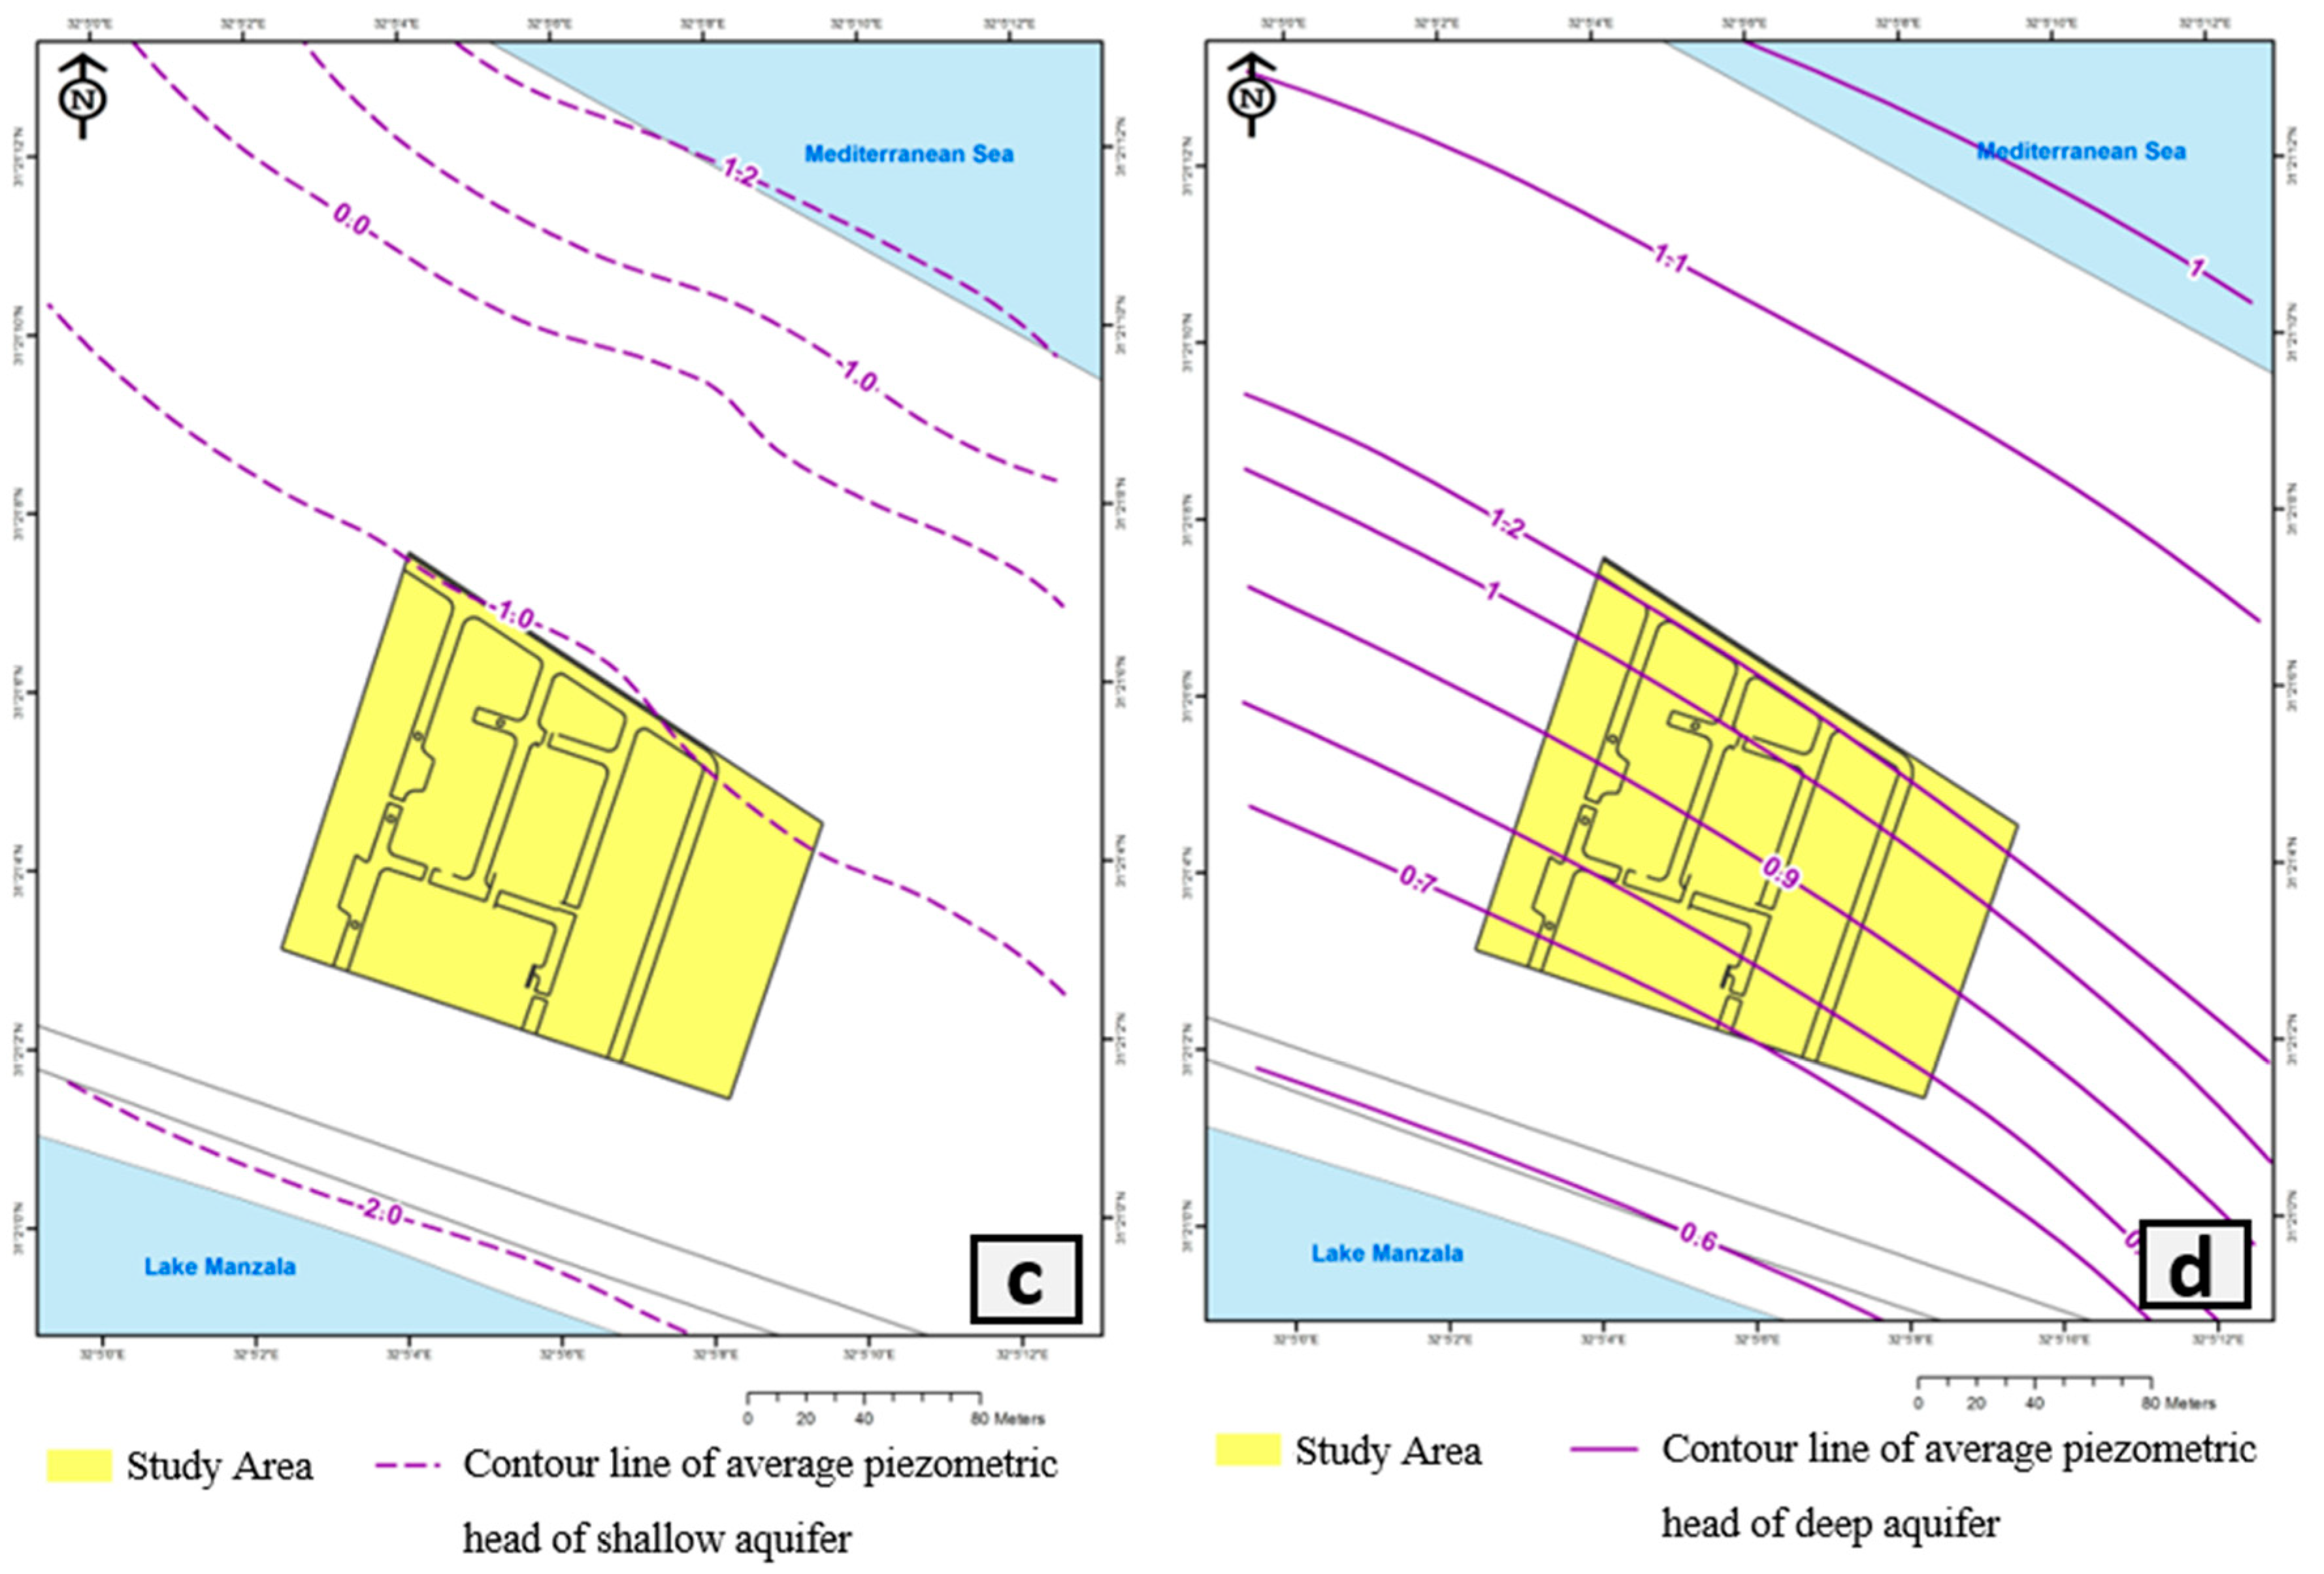
2.2. Hydrogeological Setting
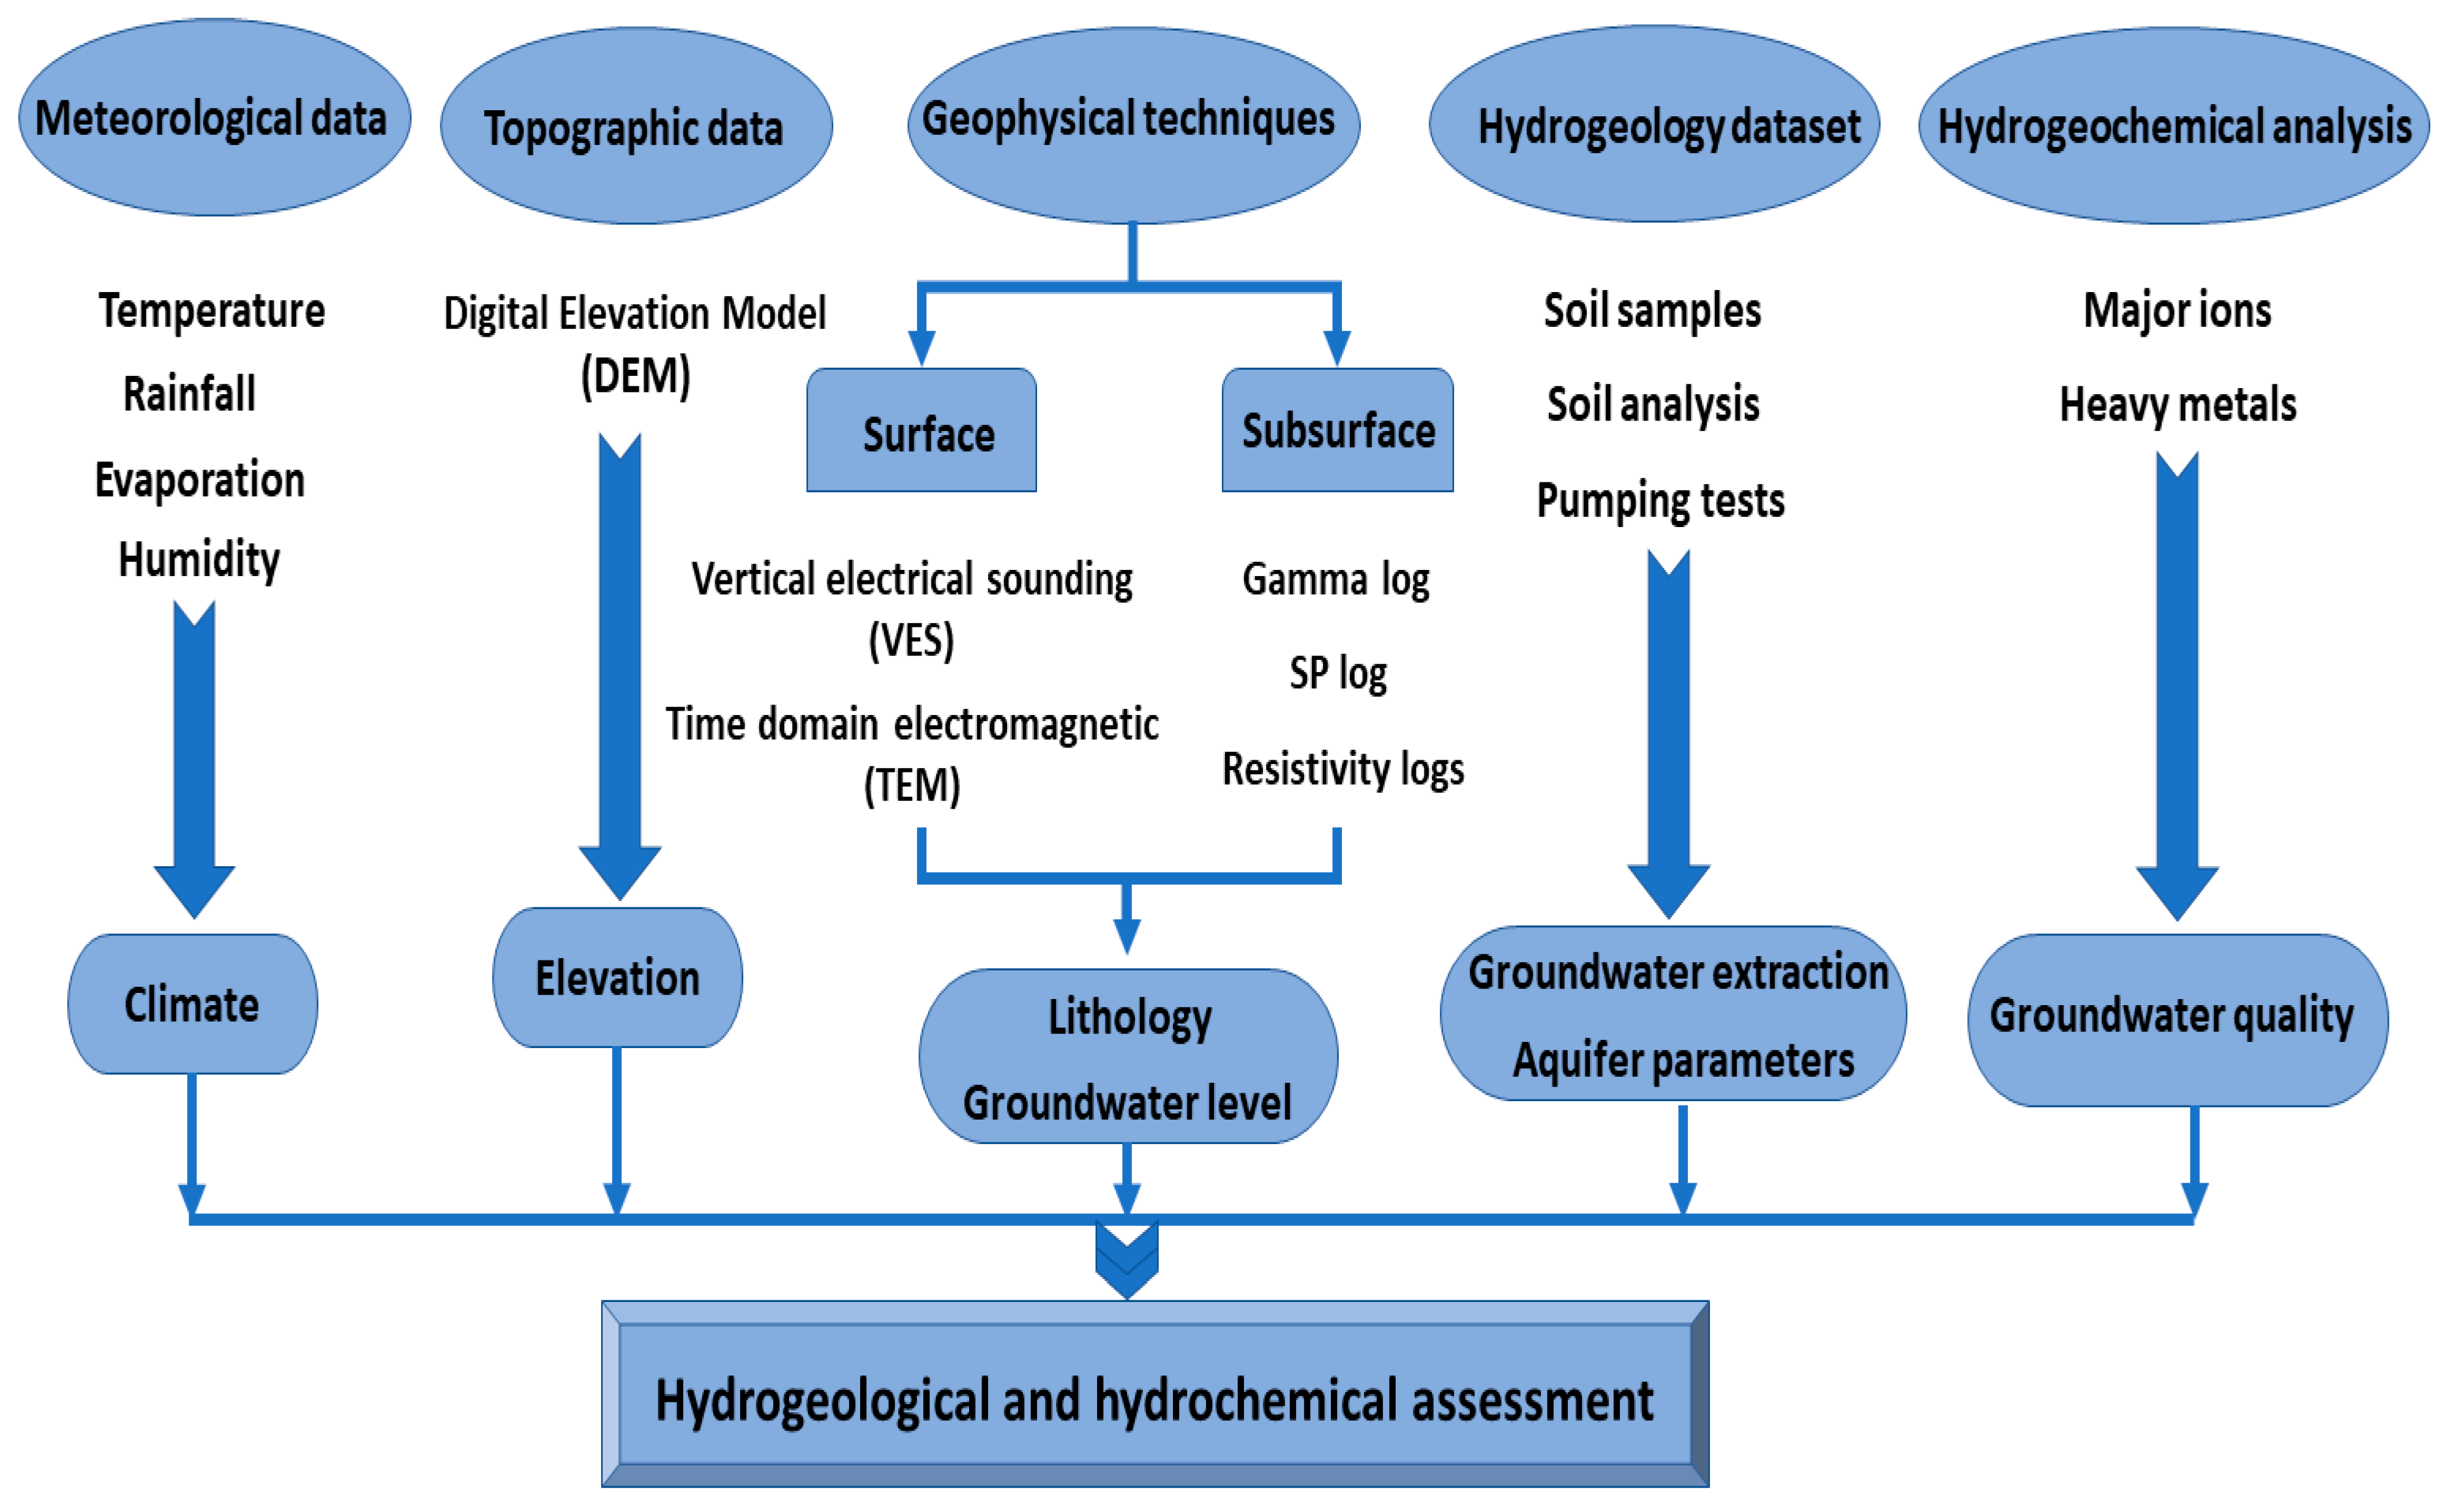
3. Materials and Methods
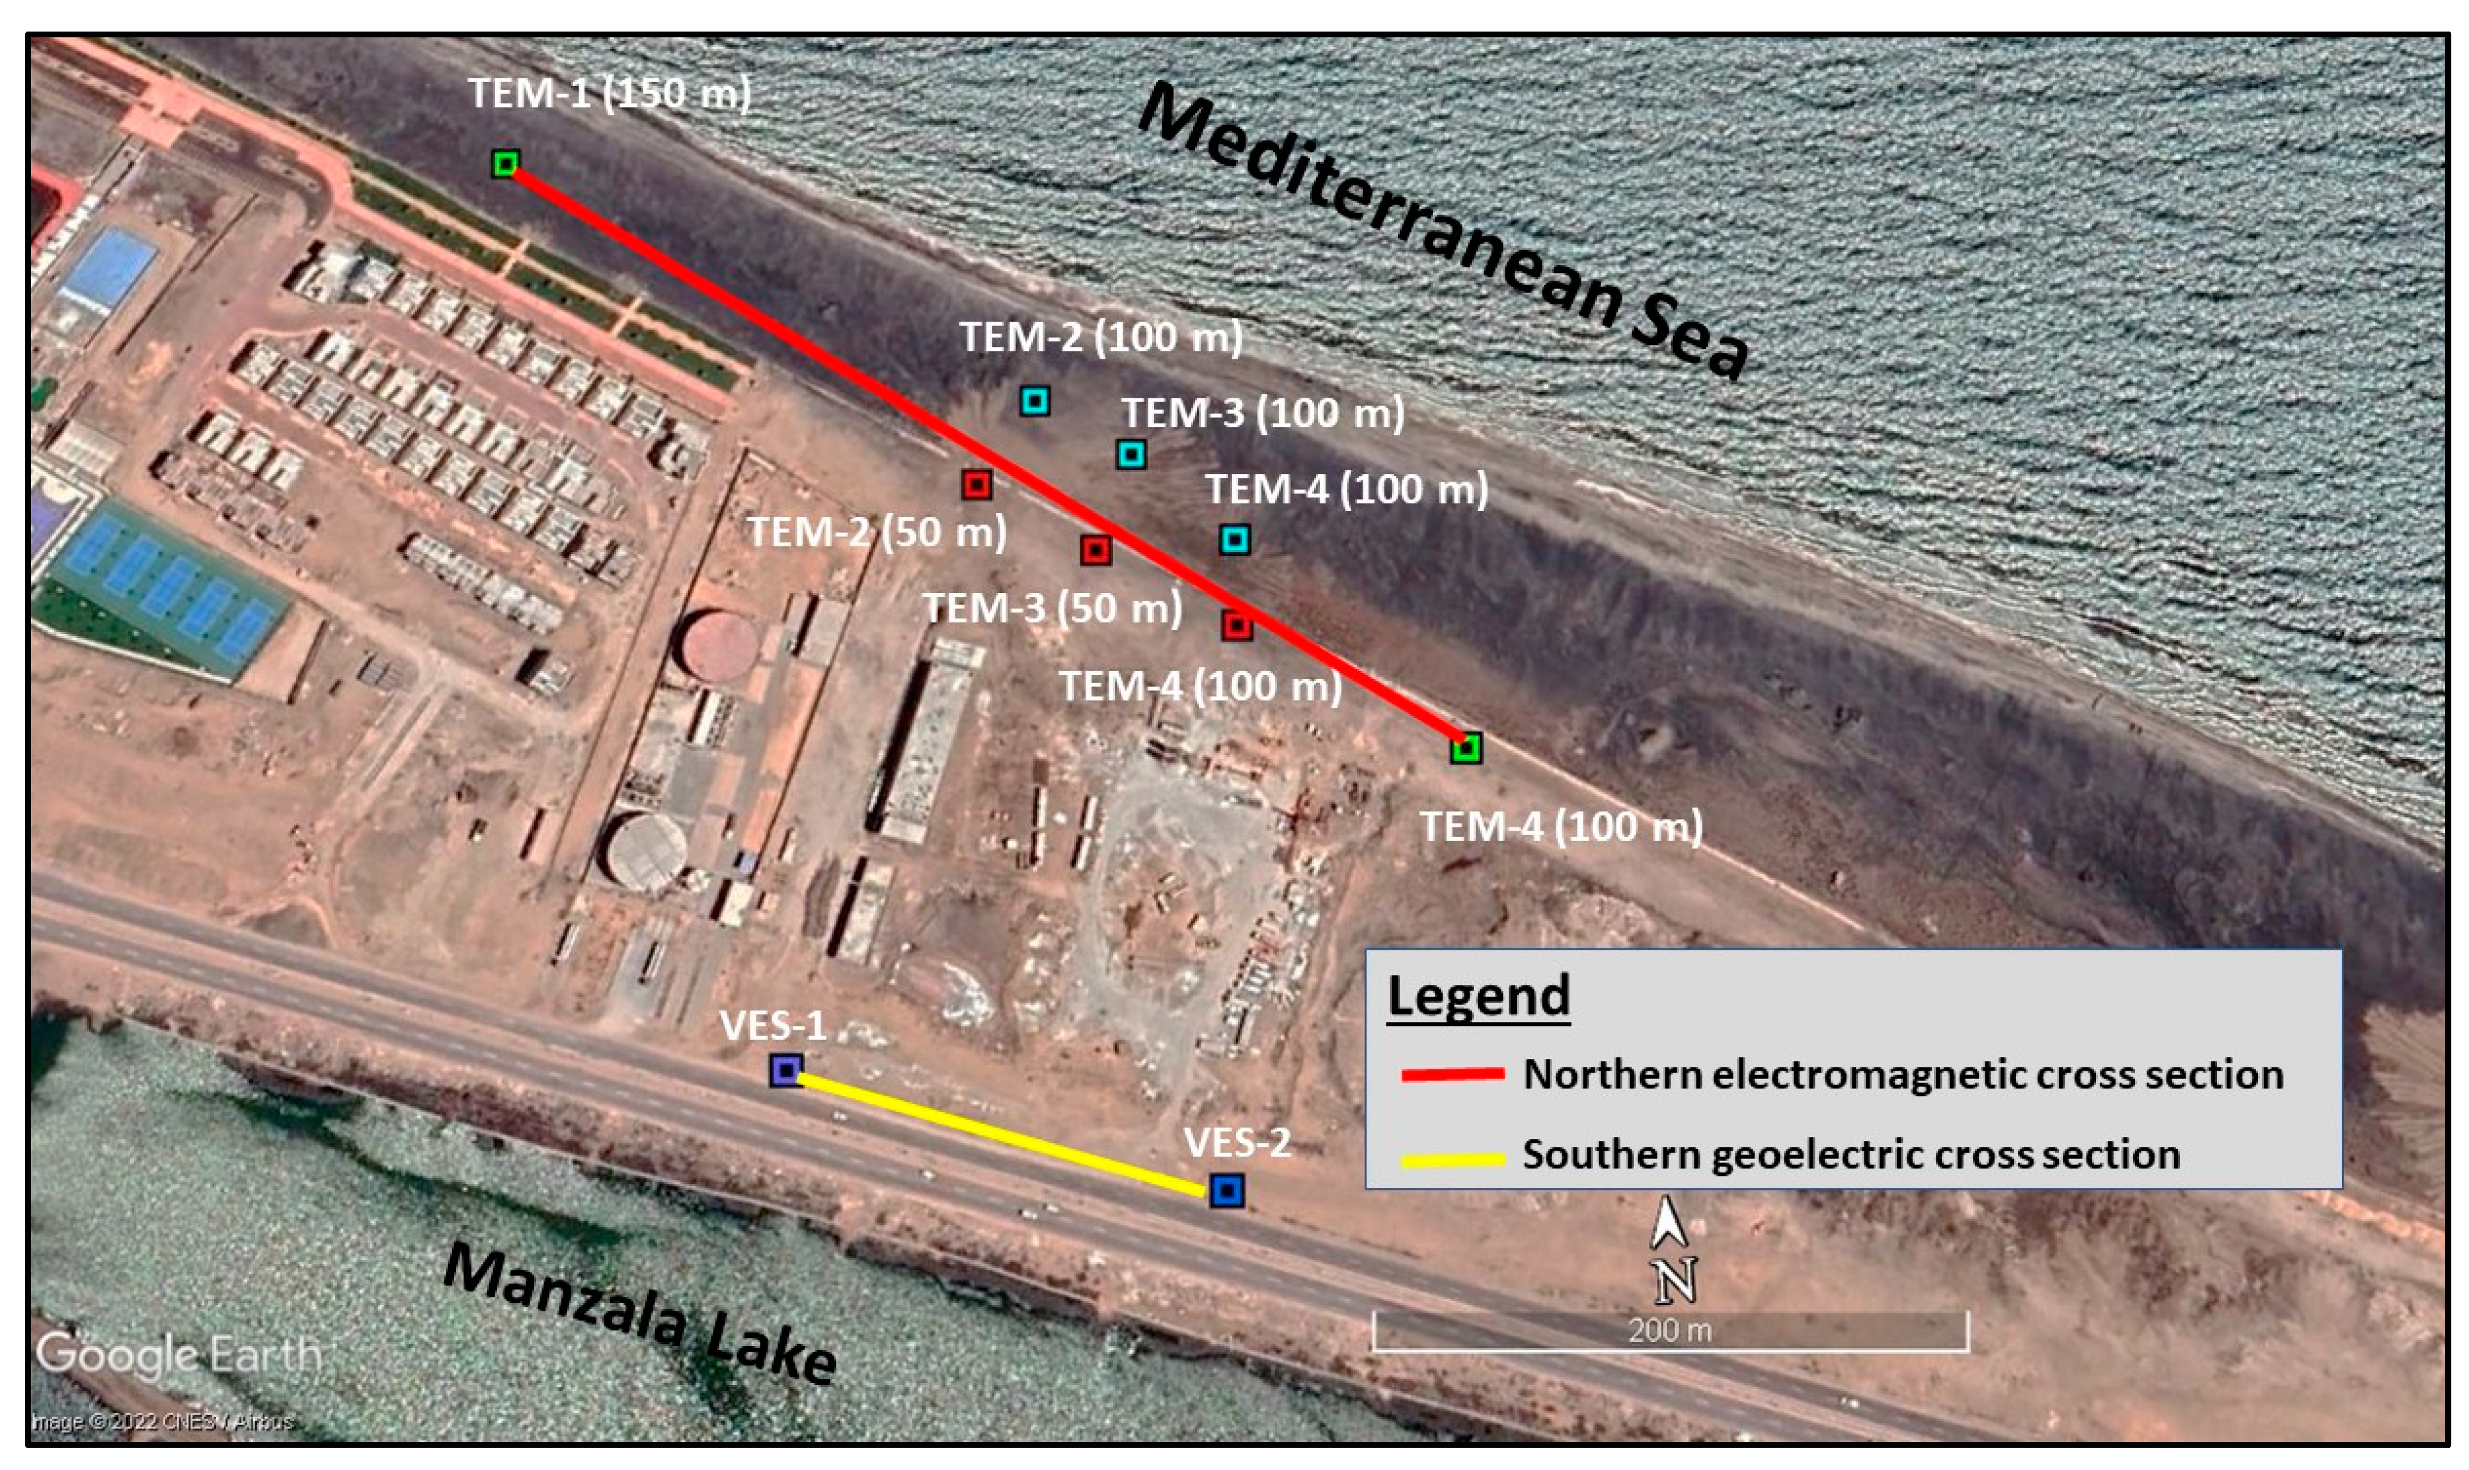
3.1. Geophysical Techniques
3.1.1. Resistivity and Time Domain Electromagnetic Methods
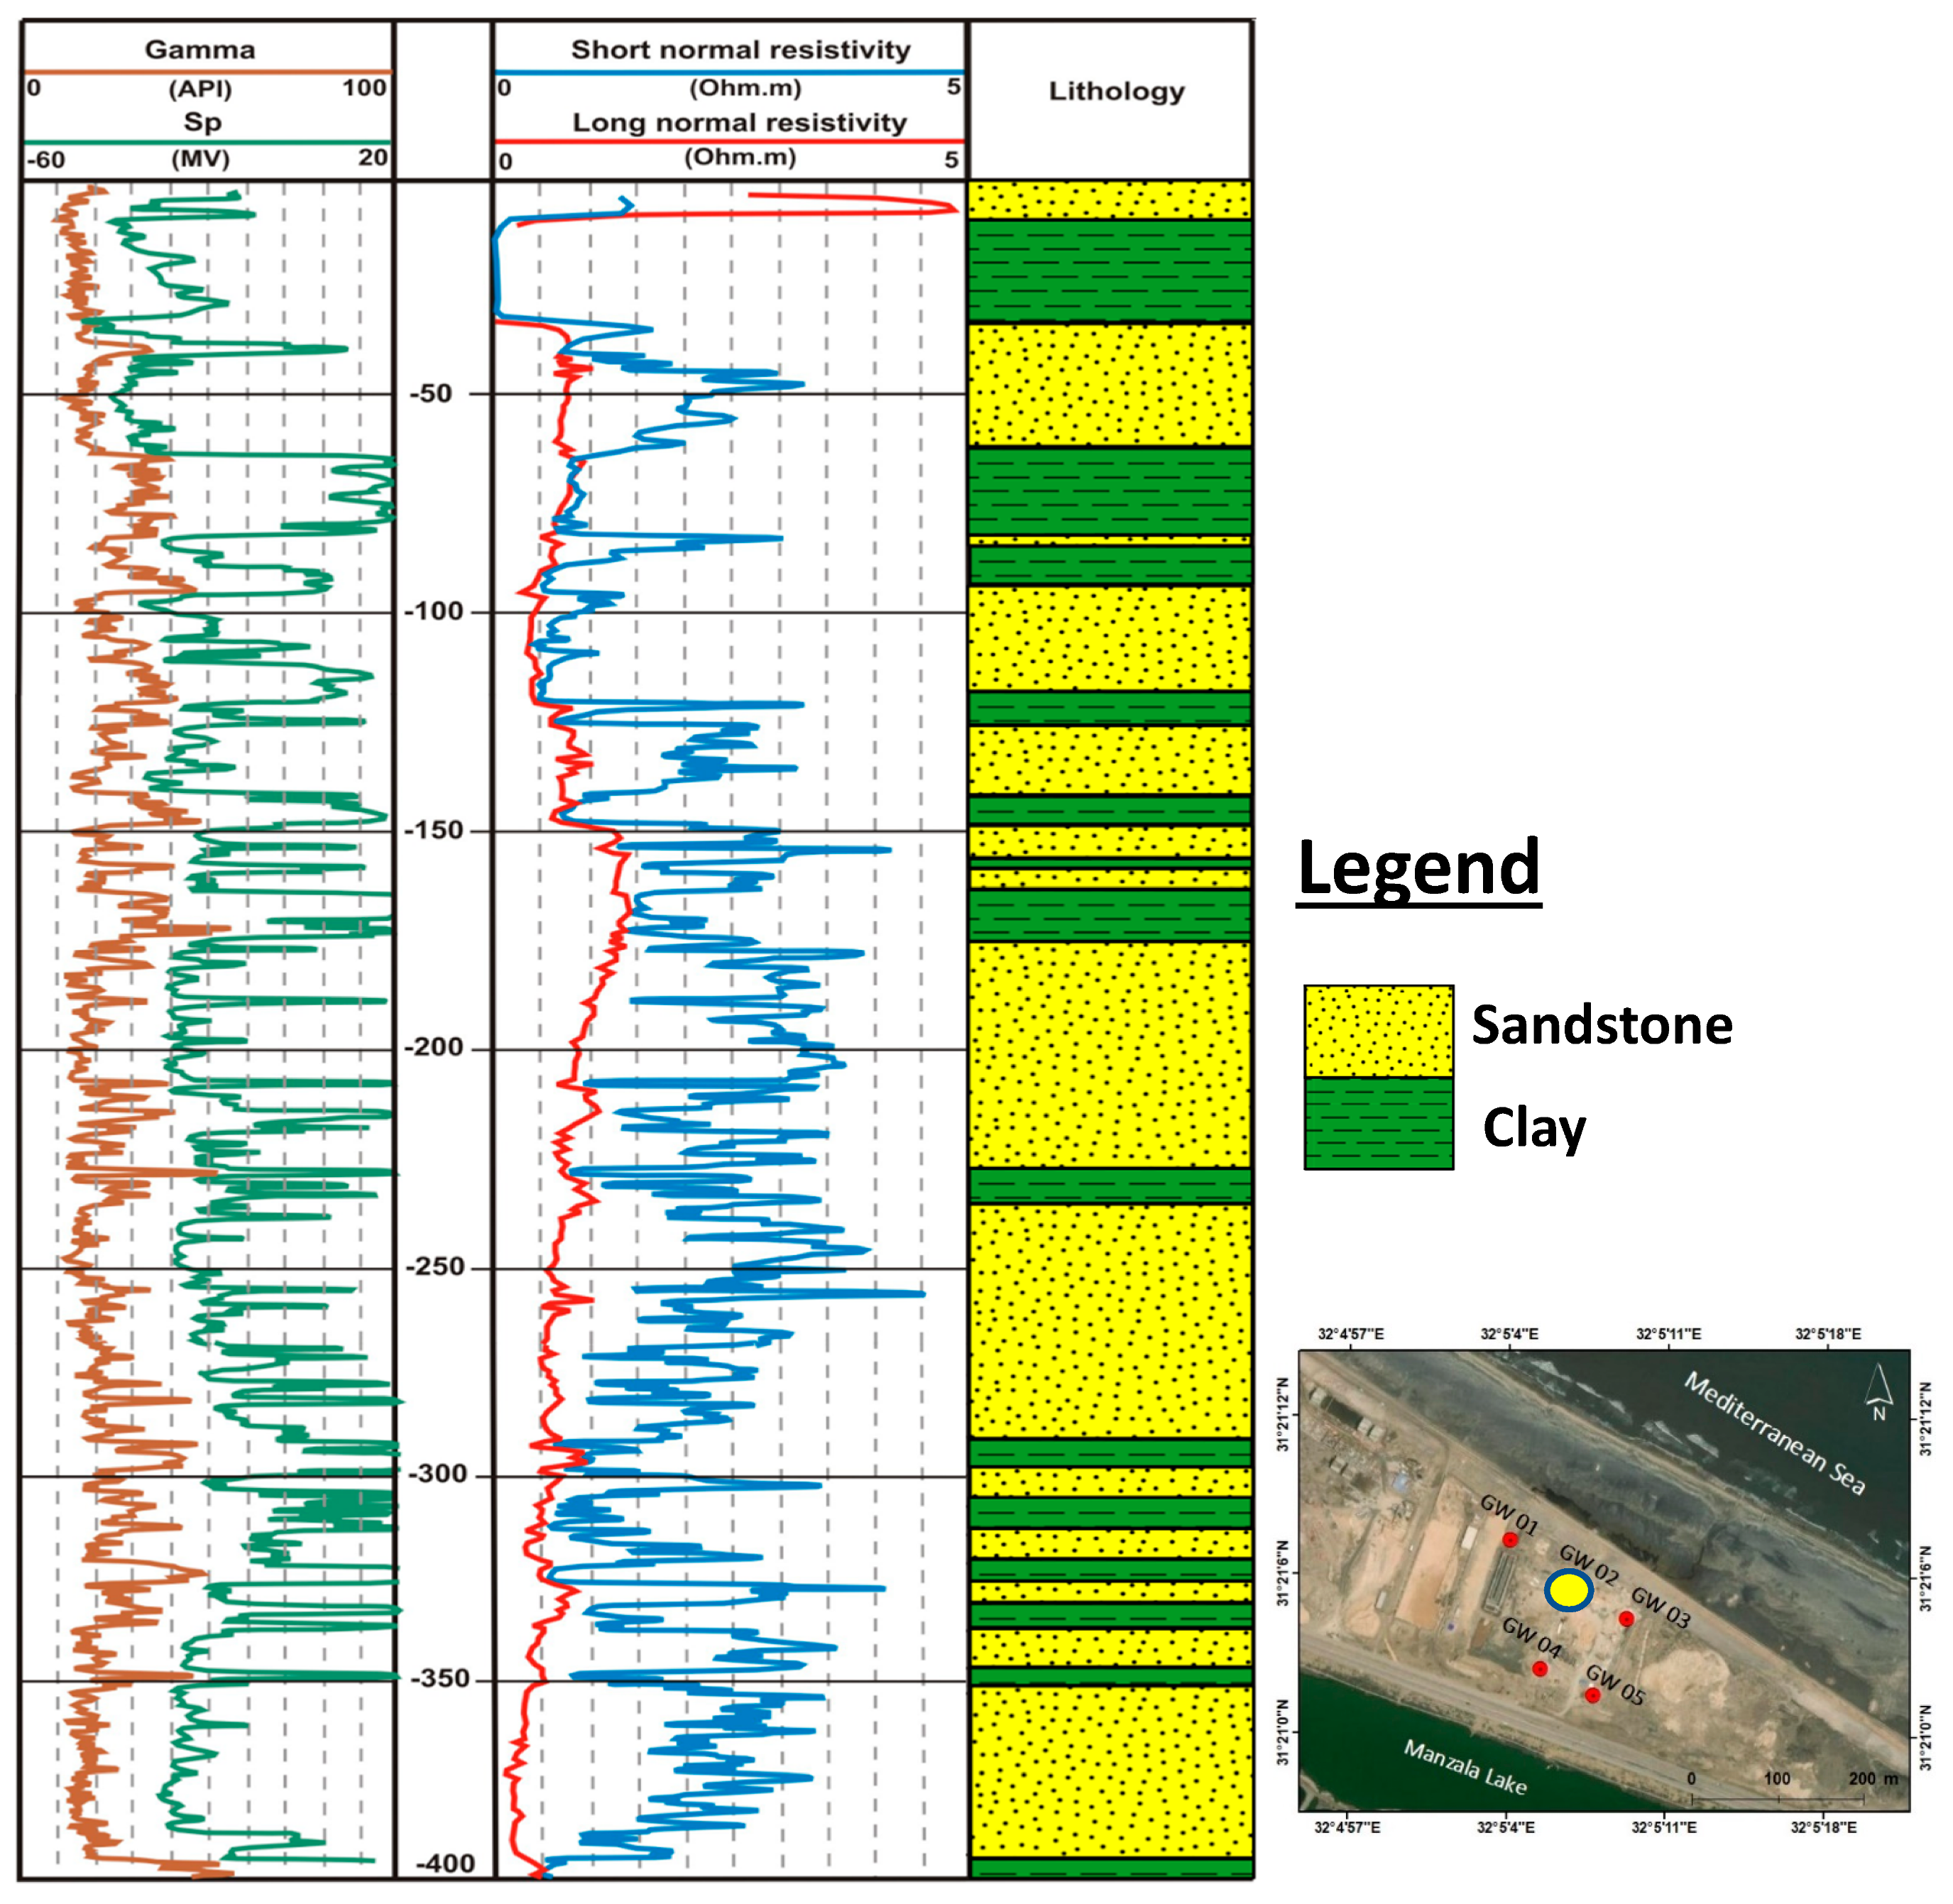
3.1.2. Well Logging
3.2. Hydrogeological Characterization
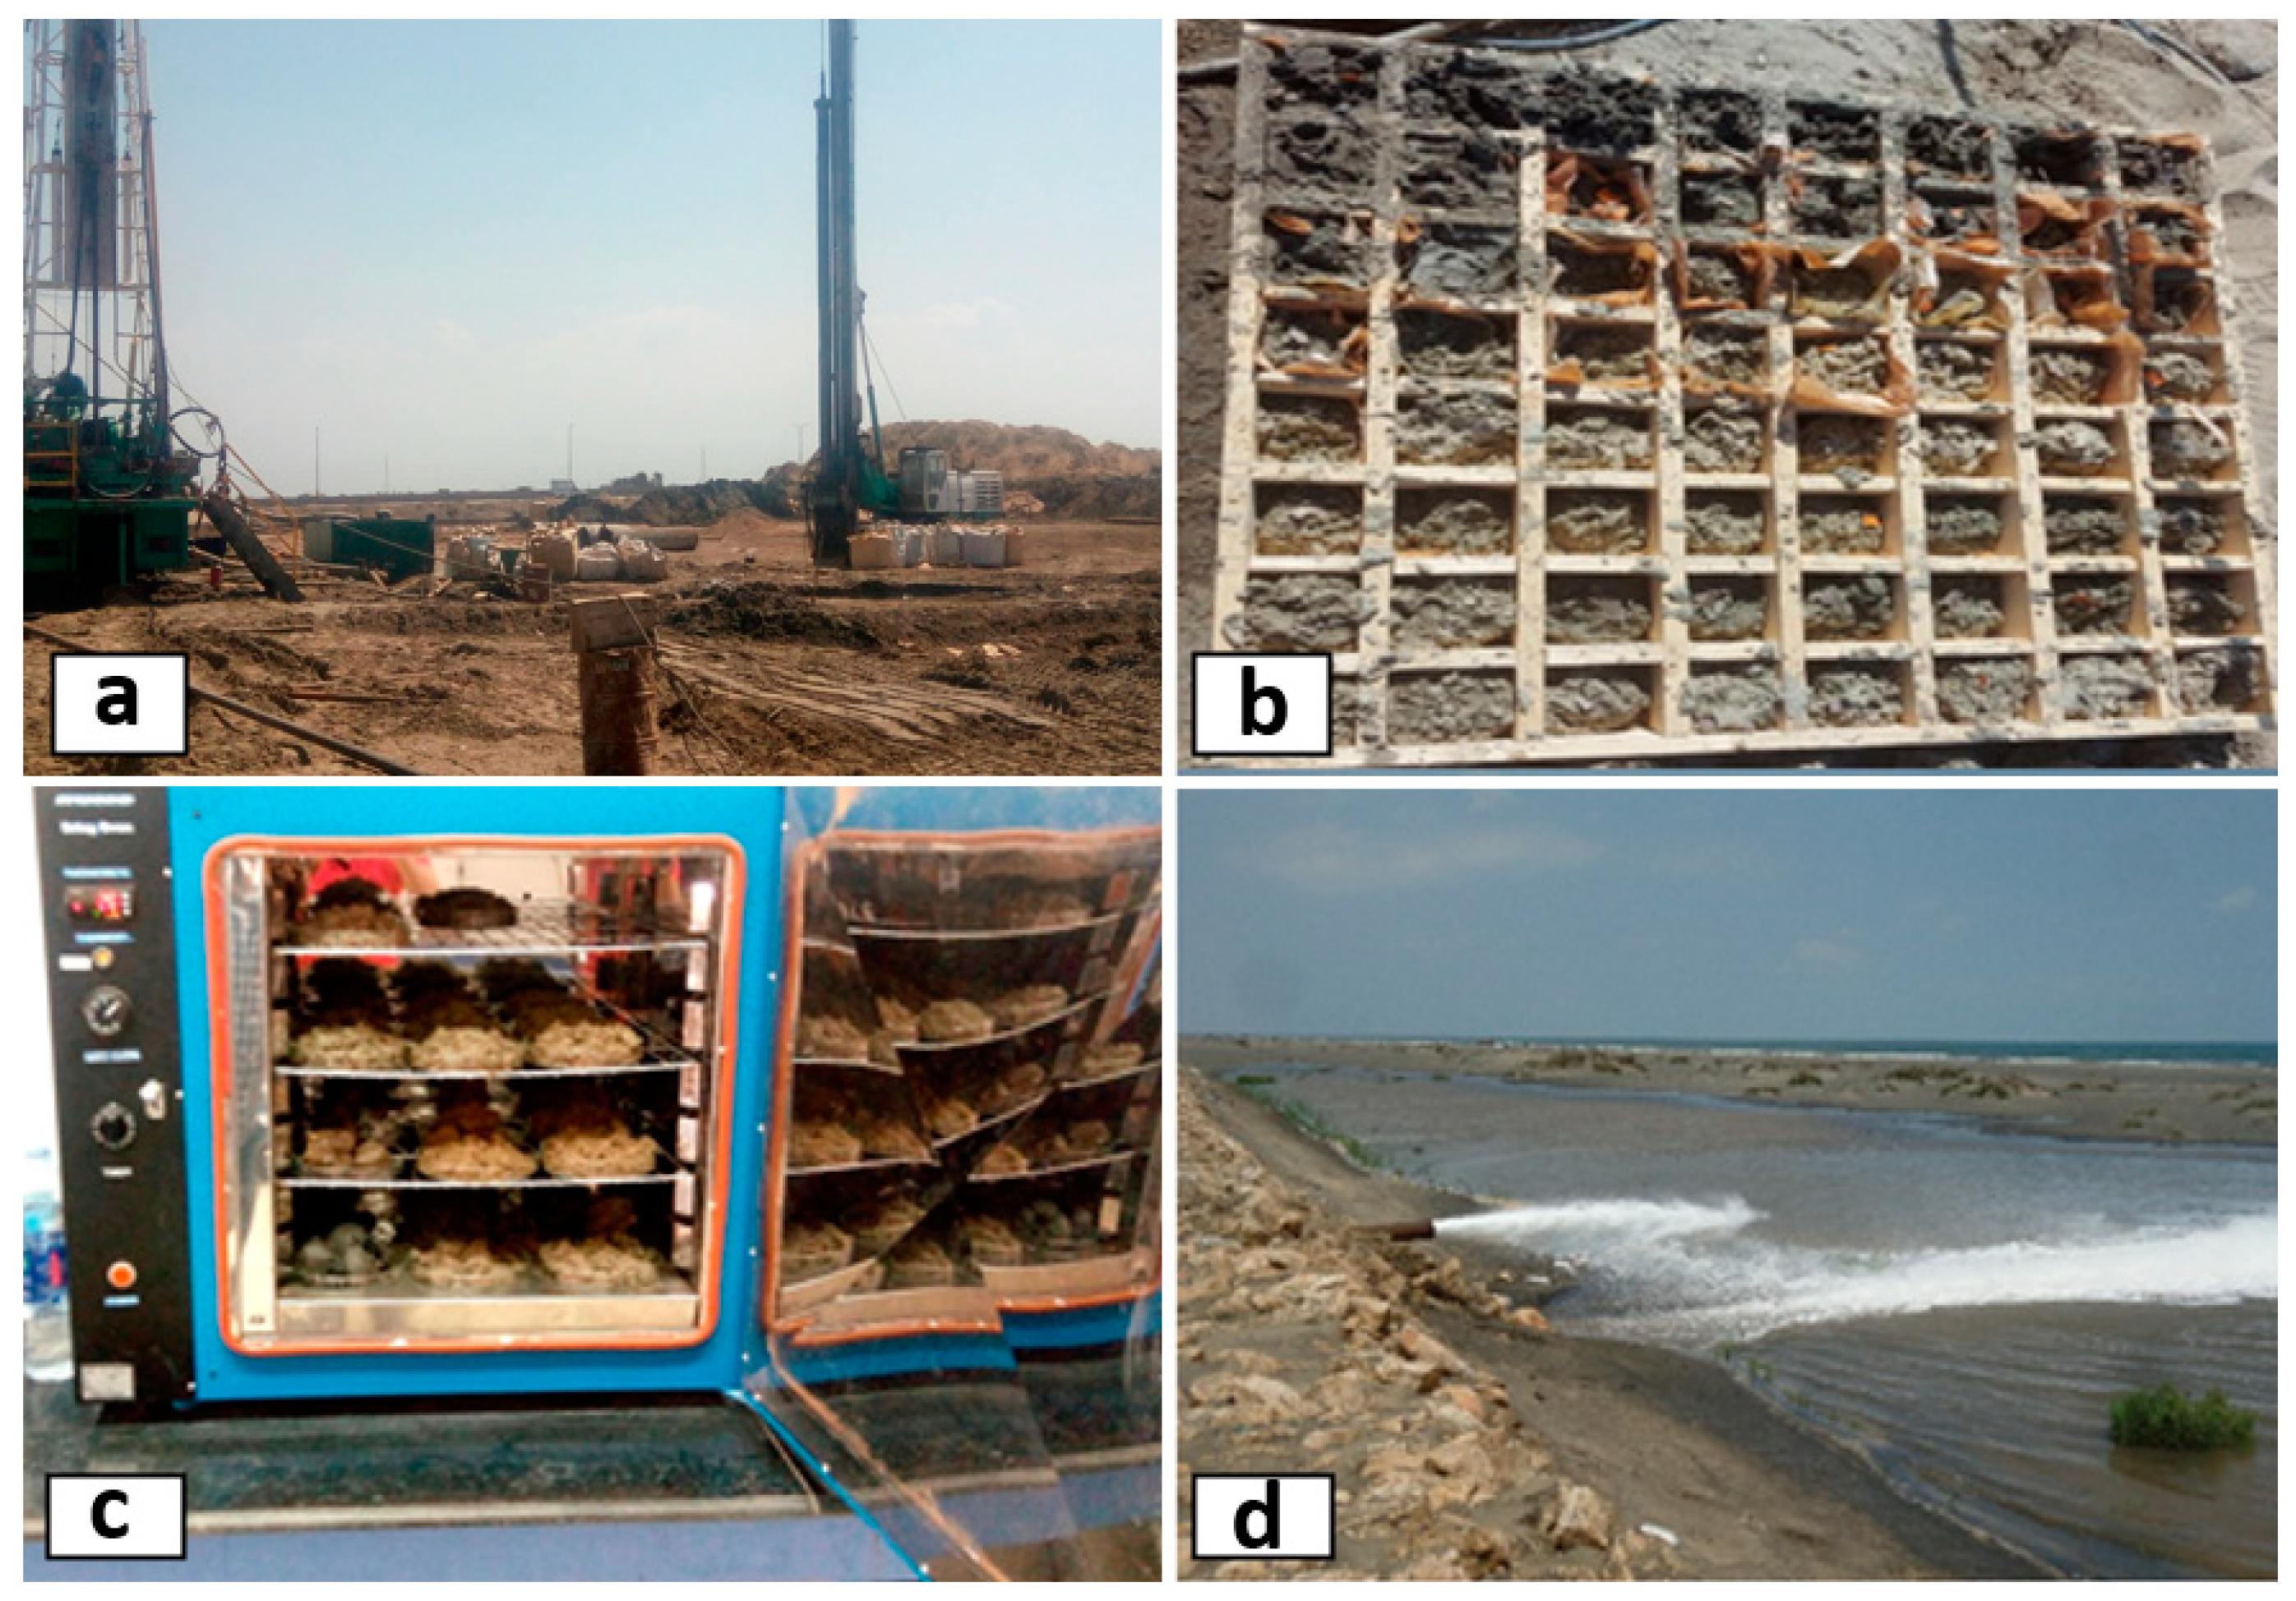
3.2.1. Sediment Analysis
- GW01: At depths of 5, 10, 35, 50, and 60 m;
- GW05: At depths of 5, 40, 45, 50, 55, and 60 m;
- GW 02: At depths of 120, 140, 180, 250, 270, 300, and 320 m;
- GW03: At depths of 110, 150, 200, and 210 m;
- GW04: At depths of 360, 370, 390, and 380 m.
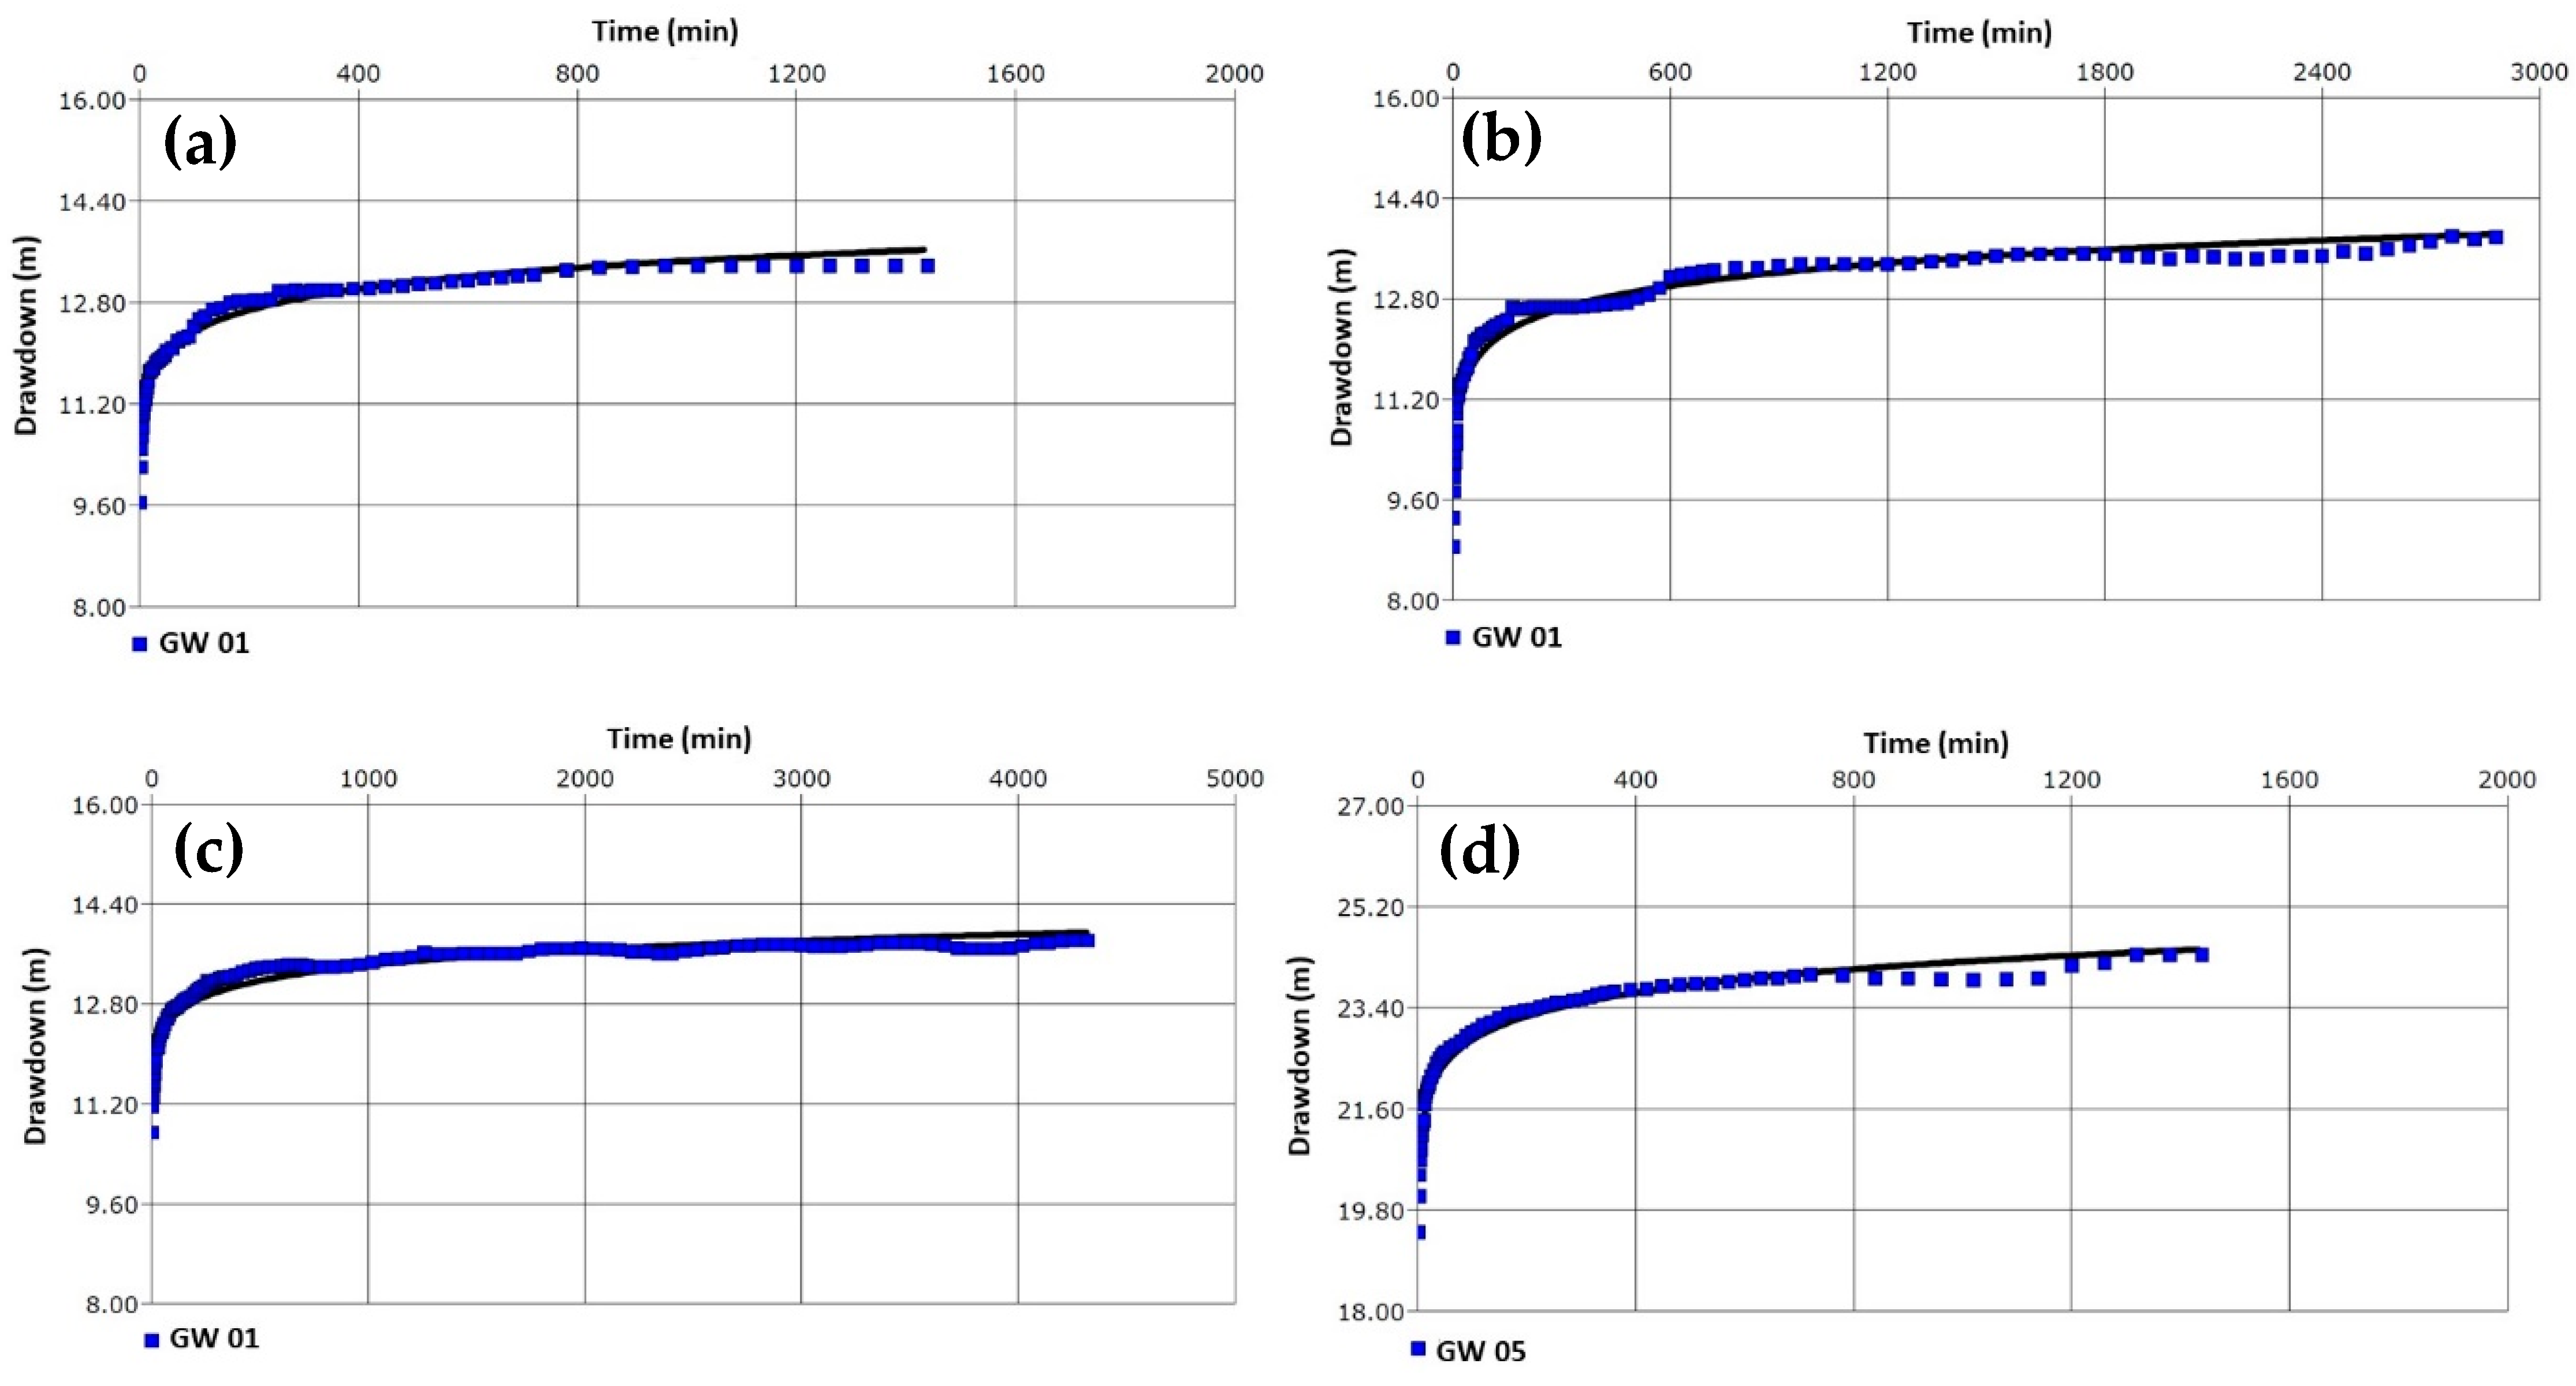
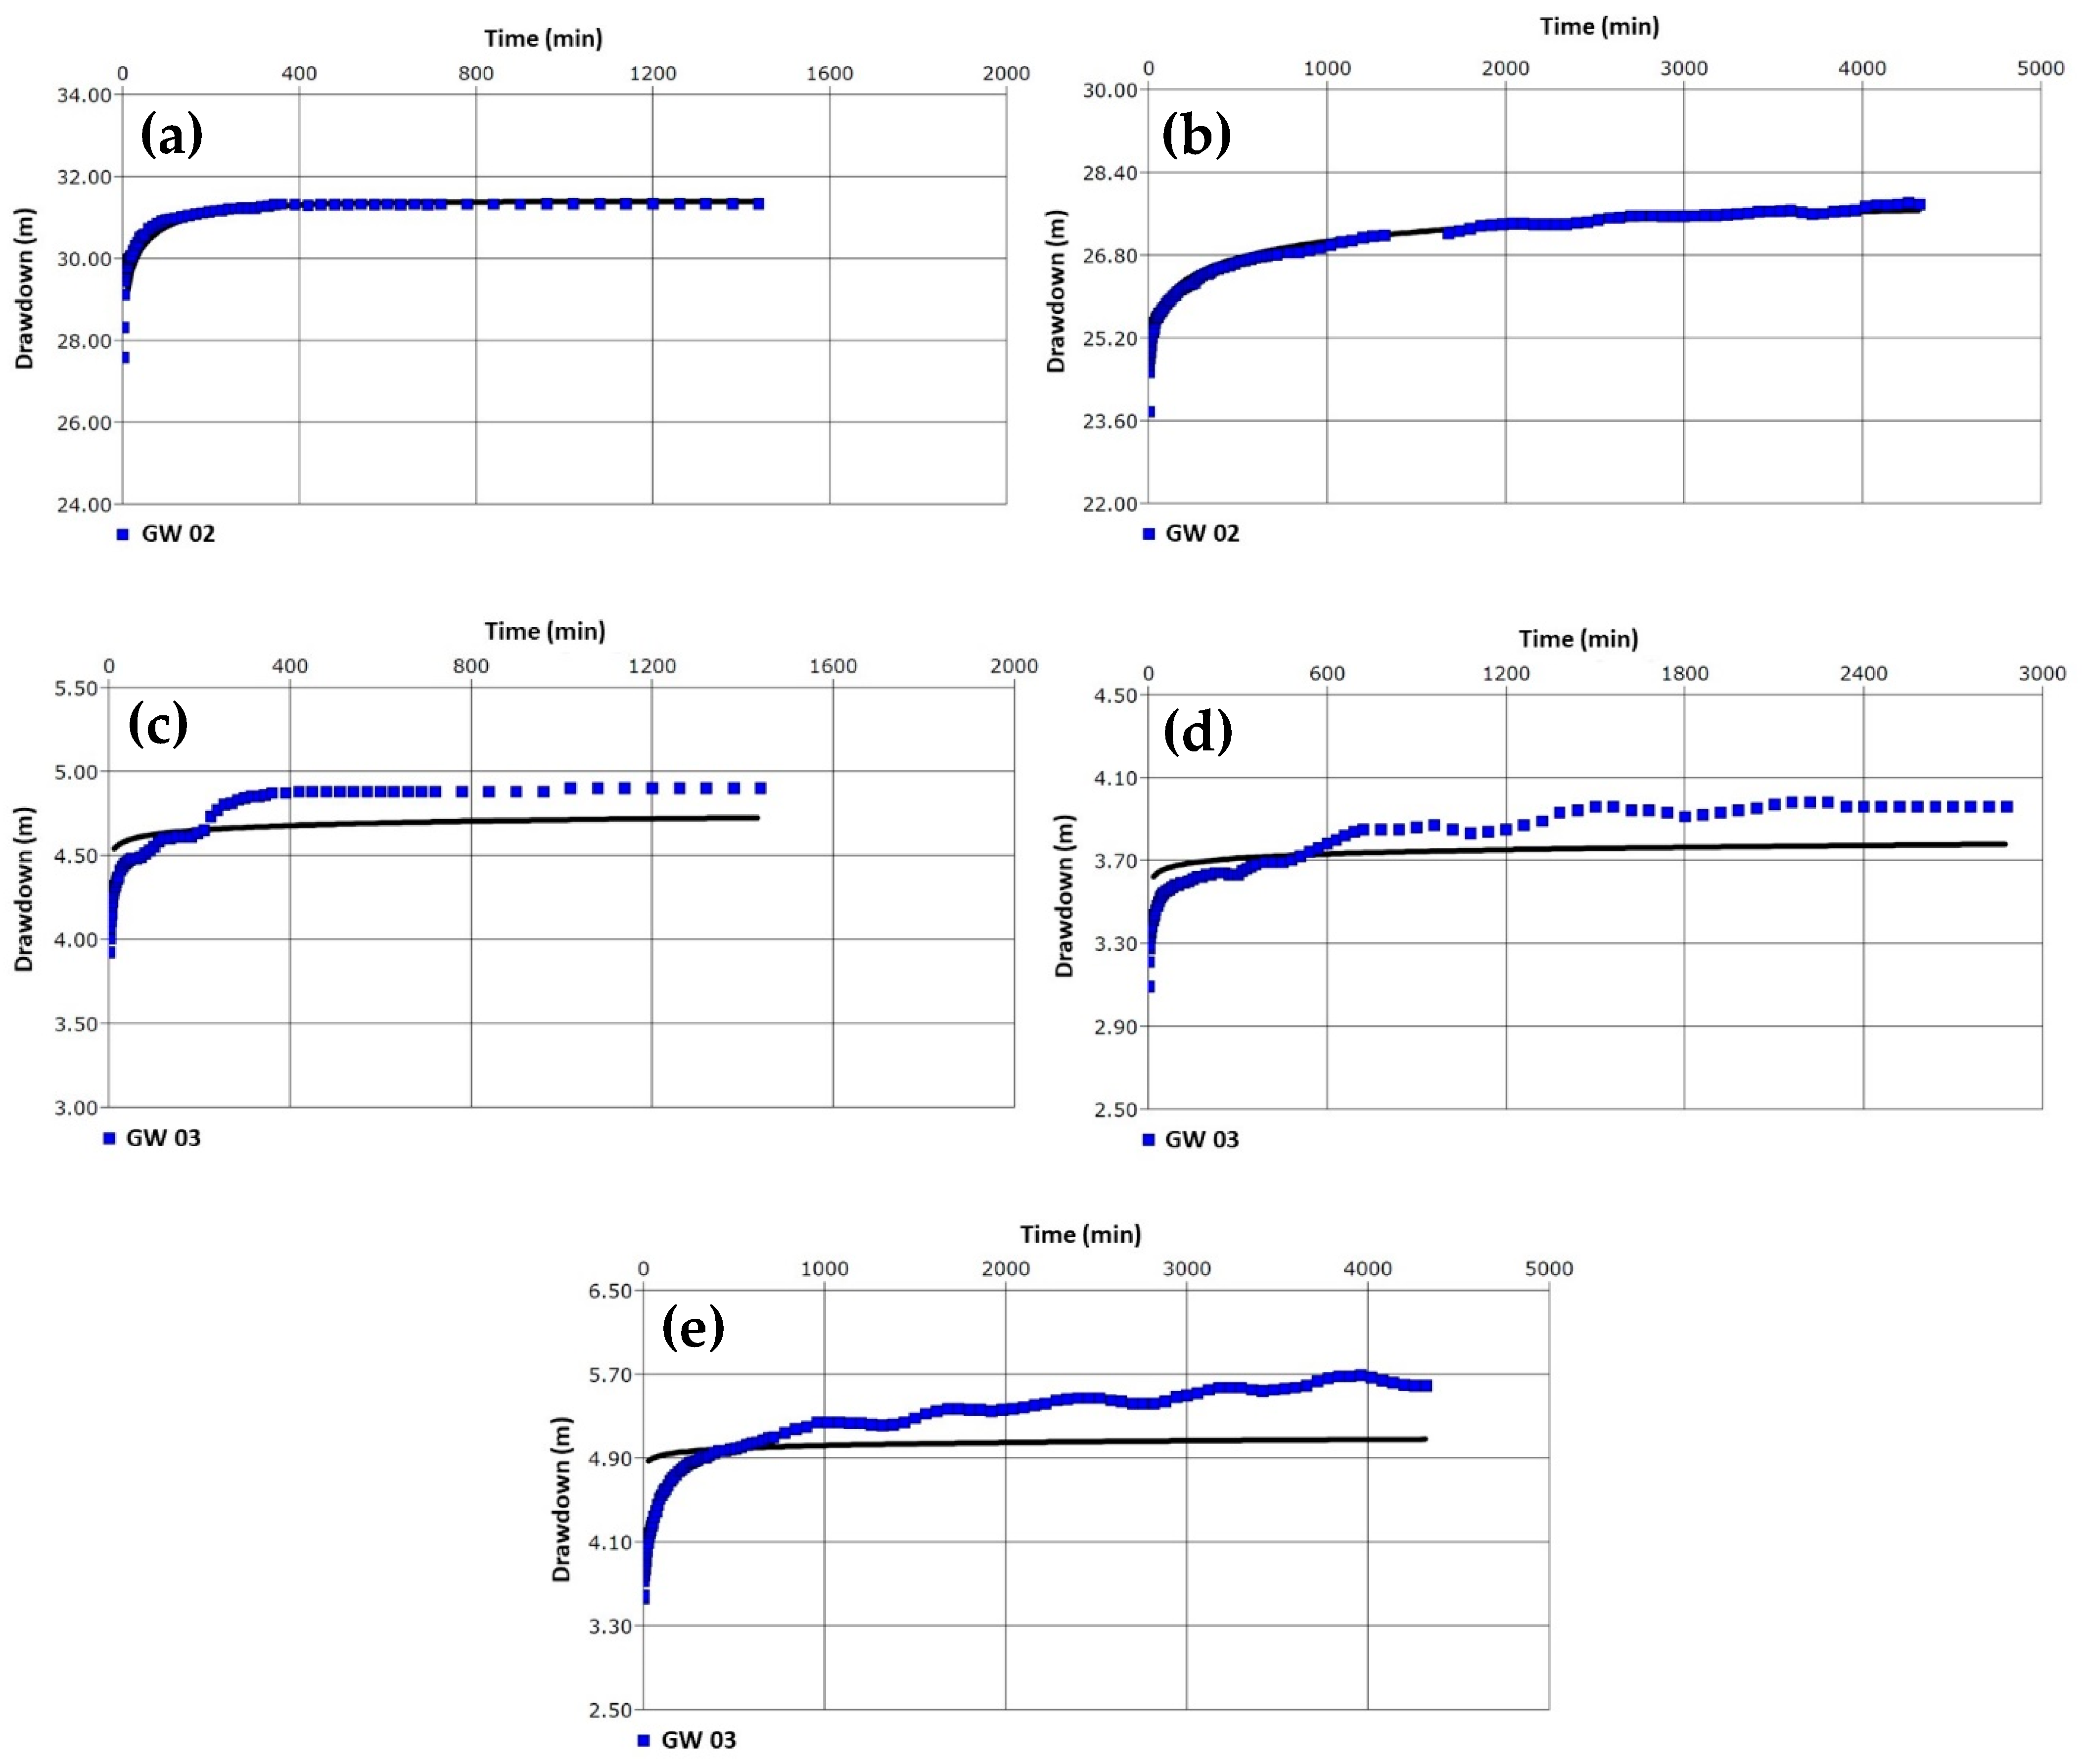
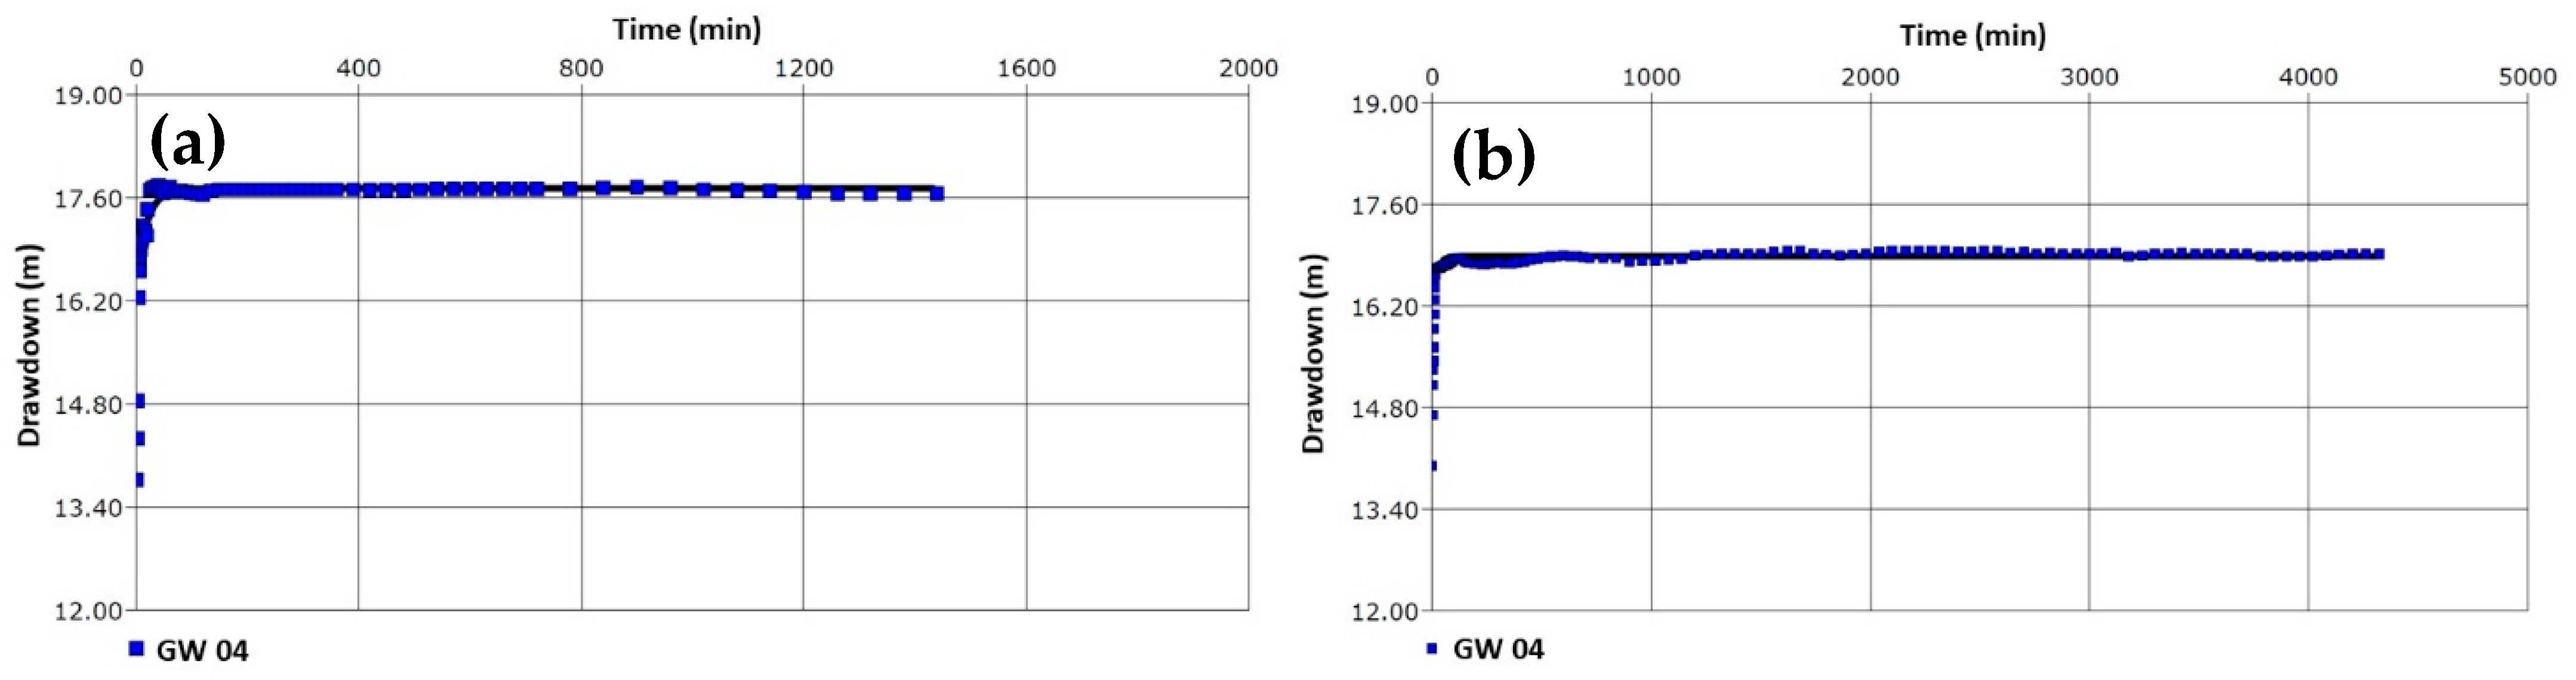
3.2.2. Pumping Test
- GW01: Based on Theis’s pumping analysis with Jacob’s correction for unconfined aquifers;
- GW05: Based on Theis’s pumping tests with Jacob’s correction for unconfined aquifers;
- GW02: In accordance with Theis’s pumping analysis for confined aquifers;
- GW03: Based on Hantush’s analysis of pumping tests for leaky confined aquifers;
- GW04: In accordance with Theis’s analysis of pumping tests for confined aquifers.
3.2.3. Groundwater Sampling and Analysis
- The W1 water sample was collected from well GW01;
- The W2 and W3 water samples were collected from well GW05;
- The W4 and W5 water samples were collected from well GW02;
- The W6 water sample was collected from well GW03.
4. Results
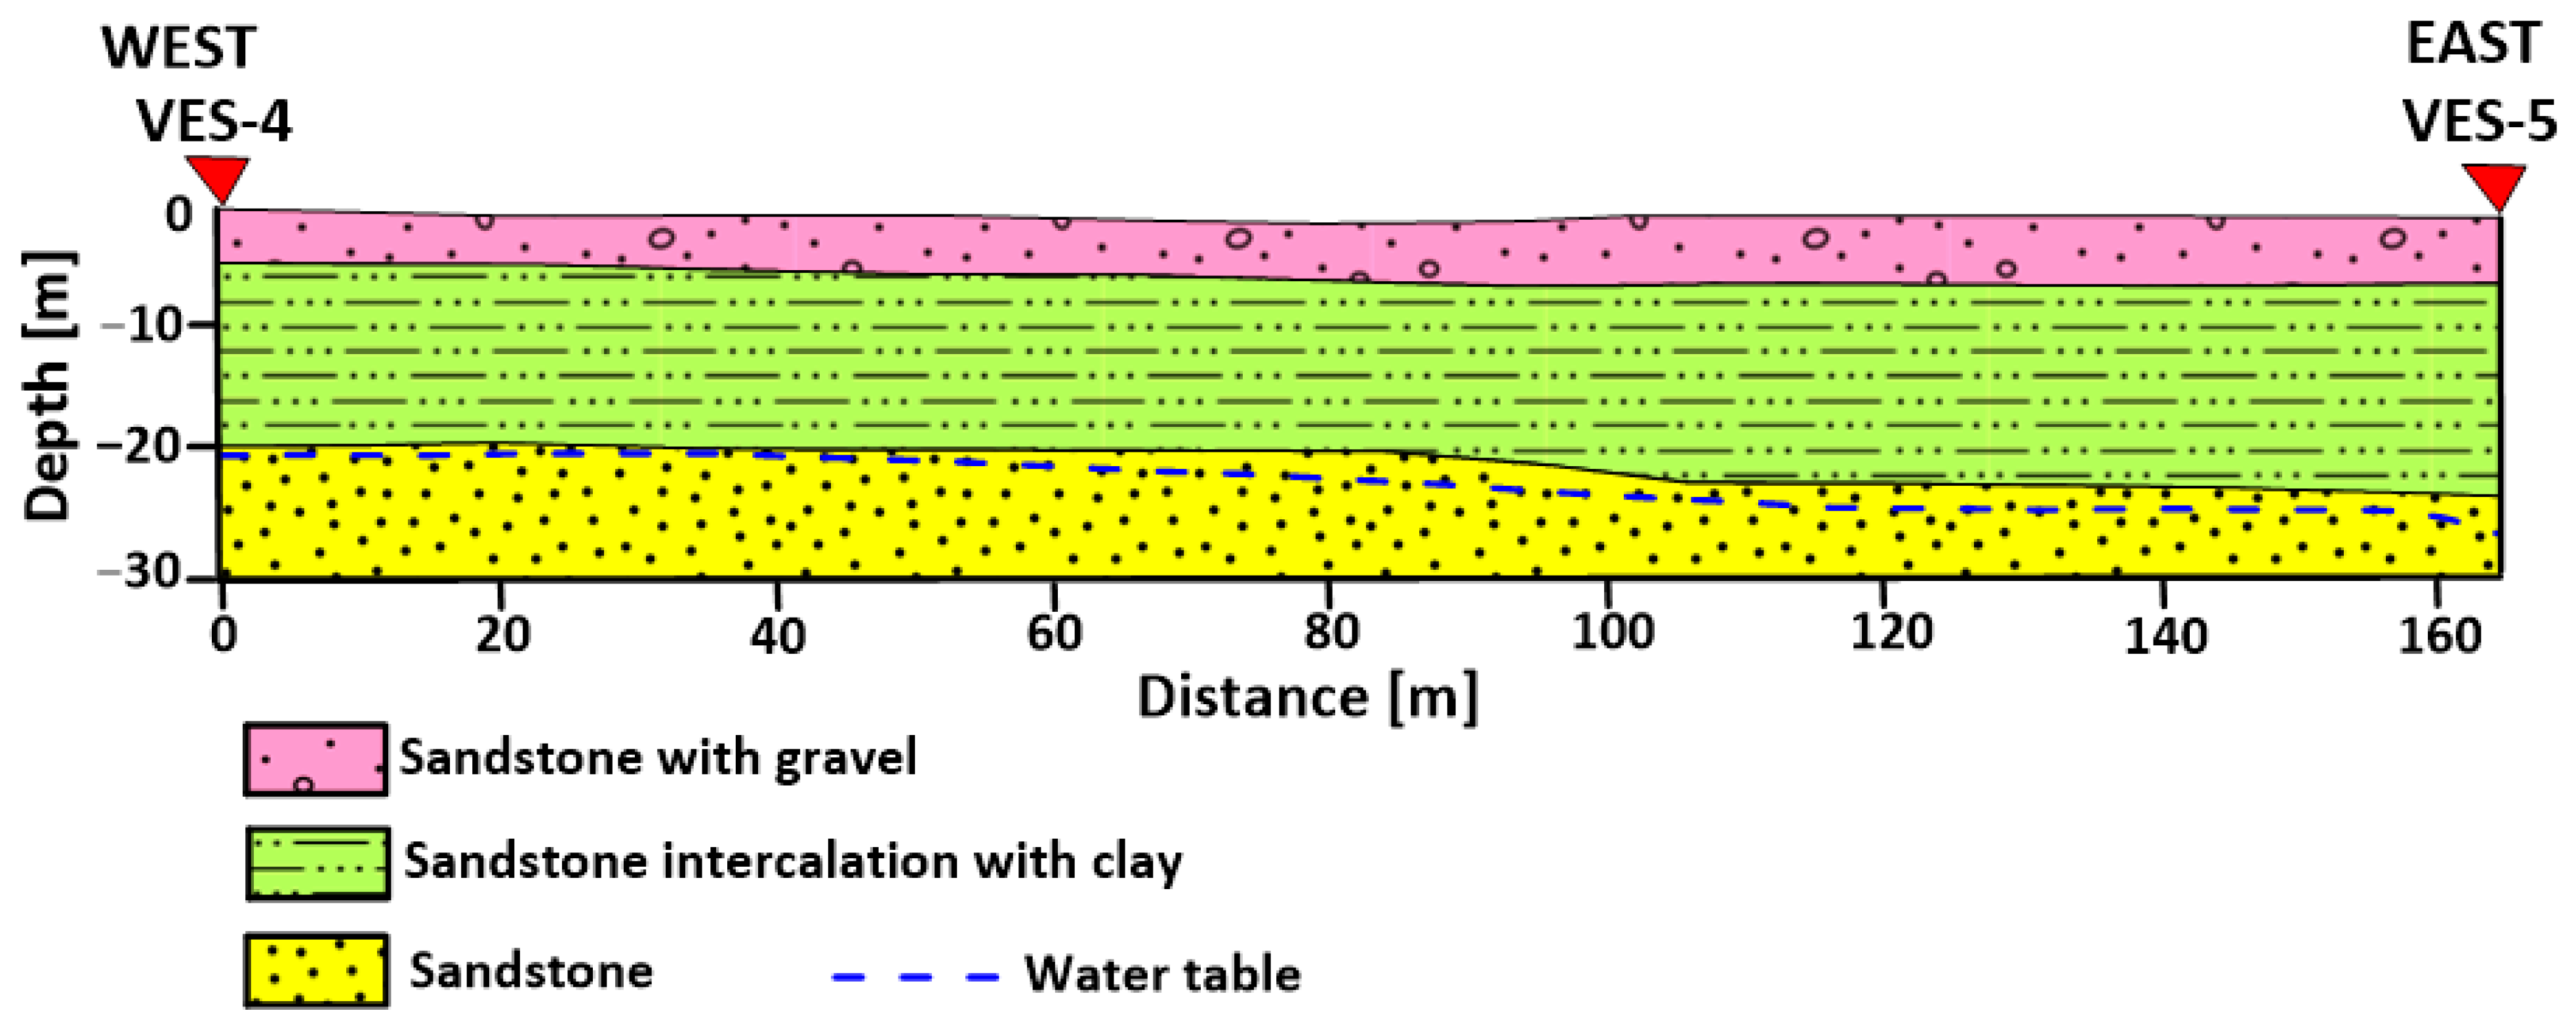
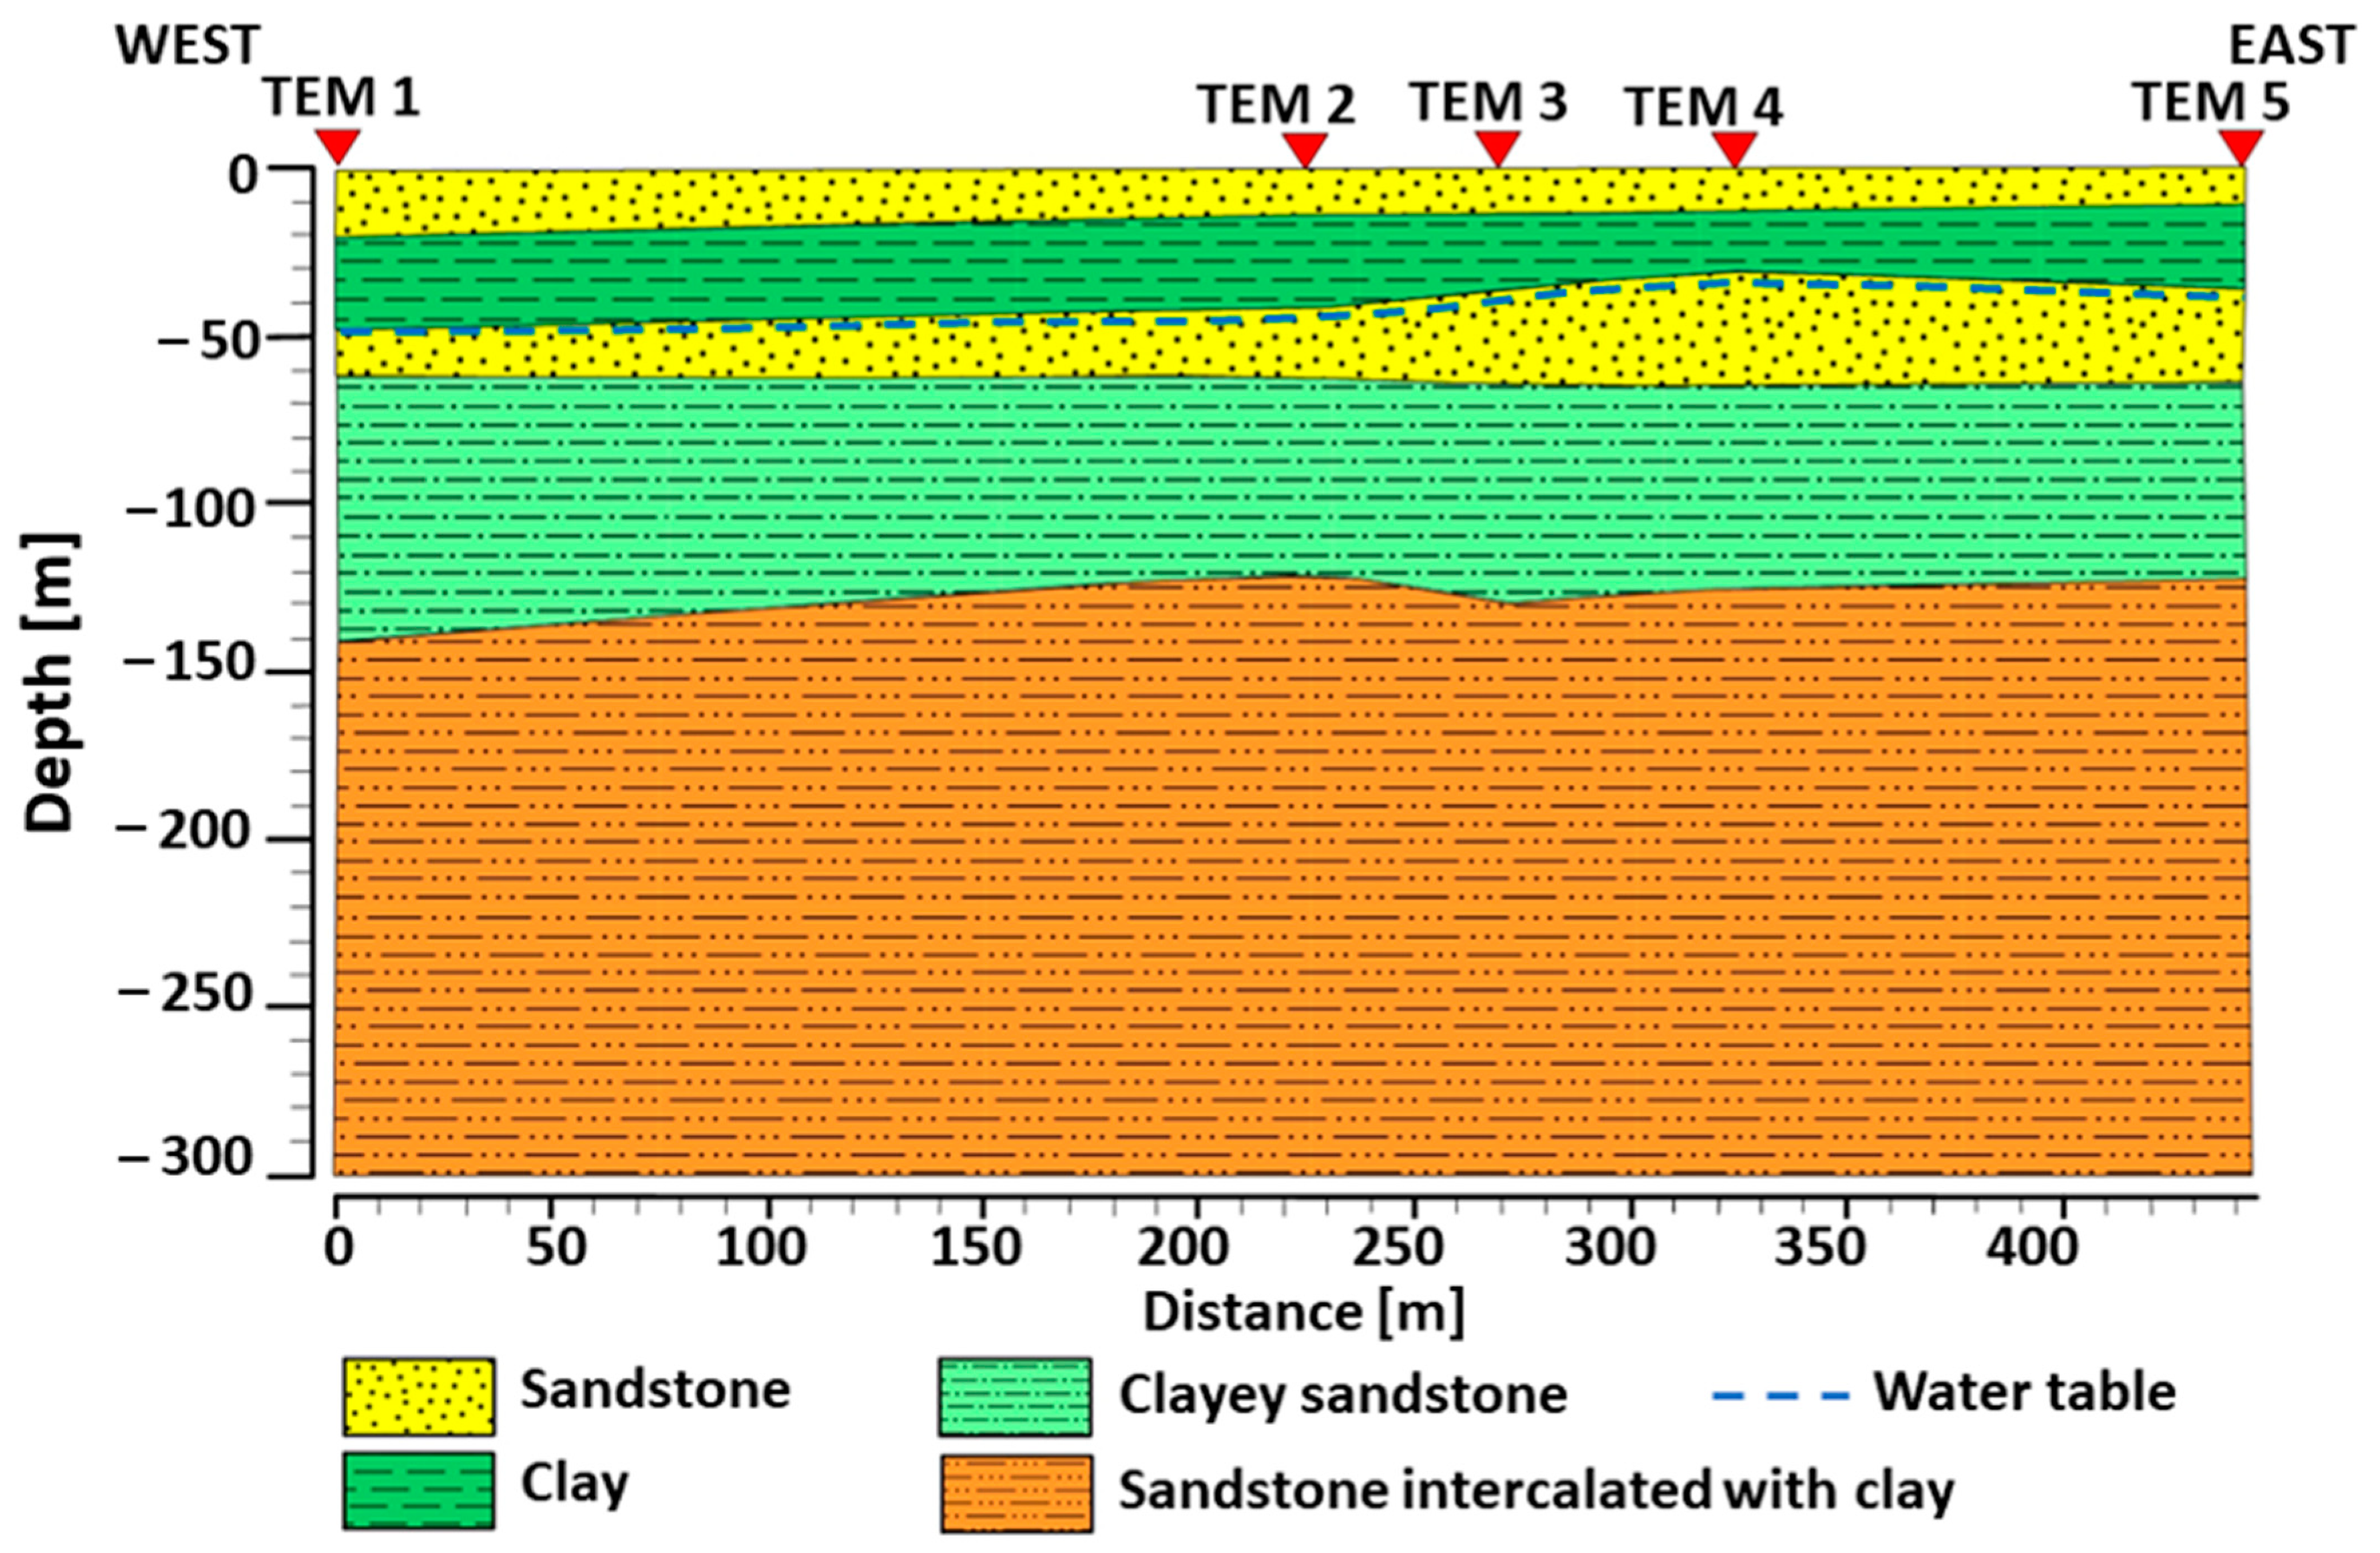
4.1. Subsurface Lithology
- The first layer (A) ranges from 0 to 90 m in depth and is composed of medium to fine sandstone with intercalation of clay layers;
- The second layer (B) ranges from 110 to 310 m depth and is composed of coarse to medium sandstone;
- The third layer (C) ranges from 330 to 500 m in depth and composed of coarse to medium sandstone.
4.2. Aquifer Parameters
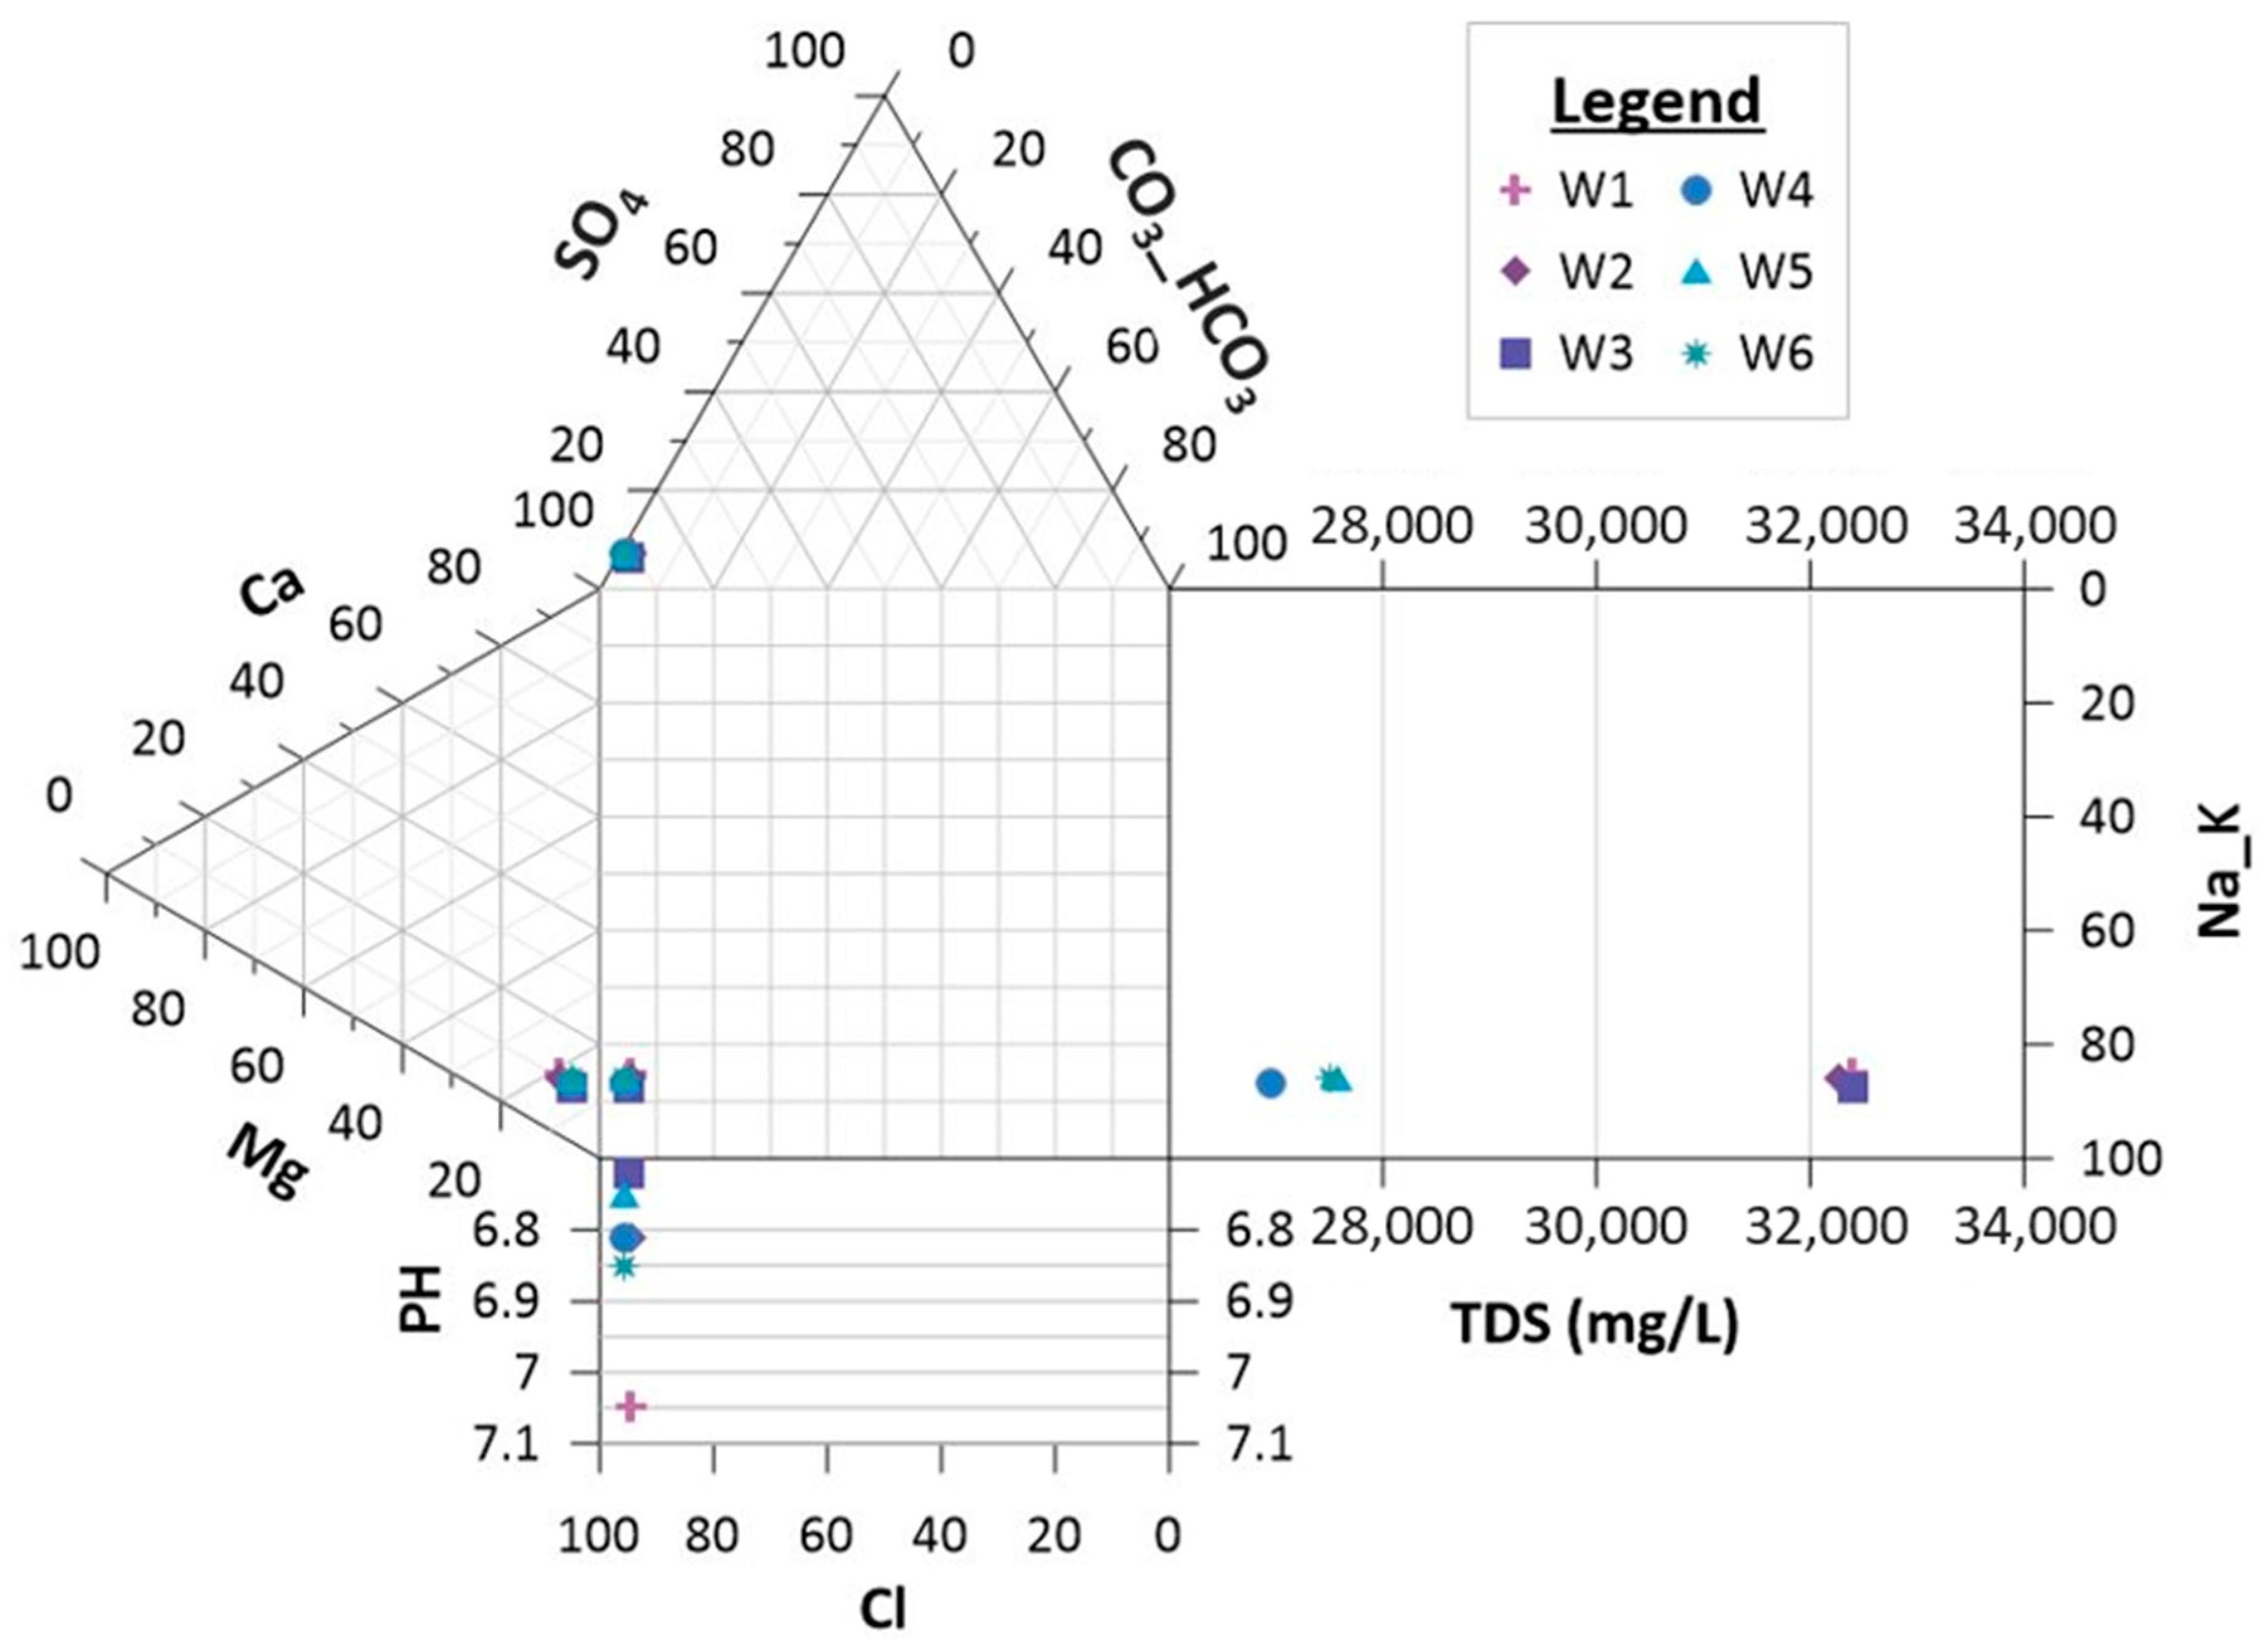
4.3. Physicochemical Characteristics of Groundwater
5. Conclusions
Author Contributions
Funding
Institutional Review Board Statement
Informed Consent Statement
Data Availability Statement
Conflicts of Interest
References
- Gleick, P.H. Global Freshwater Resources: Soft-Path Solutions for the 21st Century. Science 2003, 302, 1524–1528. [Google Scholar] [CrossRef] [PubMed] [Green Version]
- Hoekstra, A.Y.; Mekonnen, M.M. The Water Footprint of Humanity. Proc. Natl. Acad. Sci USA 2012, 109, 3232–3237. [Google Scholar] [CrossRef] [PubMed] [Green Version]
- Aboel Ghar, M.; Shalaby, A.; Tateishi, R. Agricultural Land Monitoring in the Egyptian Nile Delta Using Landsat Data. Int. J. Environ. Stud. 2004, 61, 651–657. [Google Scholar] [CrossRef]
- El-Sadek, A. Water Desalination: An Imperative Measure for Water Security in Egypt. Desalination 2010, 250, 876–884. [Google Scholar] [CrossRef]
- Ghaffour, N.; Missimer, T.M.; Amy, G.L. Technical Review and Evaluation of the Economics of Water Desalination: Current and Future Challenges for Better Water Supply Sustainability. Desalination 2013, 309, 197–207. [Google Scholar] [CrossRef] [Green Version]
- Bhojwani, S.; Topolski, K.; Mukherjee, R.; Sengupta, D.; El-Halwagi, M.M. Technology Review and Data Analysis for Cost Assessment of Water Treatment Systems. Sci. Total Environ. 2019, 651, 2749–2761. [Google Scholar] [CrossRef]
- Park, K.; Kim, J.; Yang, D.R.; Hong, S. Towards a Low-Energy Seawater Reverse Osmosis Desalination Plant: A Review and Theoretical Analysis for Future Directions. J. Memb. Sci. 2020, 595, 117607. [Google Scholar] [CrossRef]
- Boumaiza, L.; Chesnaux, R.; Drias, T.; Walter, J.; Huneau, F.; Garel, E.; Knoeller, K.; Stumpp, C. Identifying Groundwater Degradation Sources in a Mediterranean Coastal Area Experiencing Significant Multi-Origin Stresses. Sci. Total Environ. 2020, 746, 141203. [Google Scholar] [CrossRef]
- El-Magd, I.A.; Zakzouk, M.; Ali, E.M.; Abdulaziz, A.M. An Open Source Approach for Near-Real Time Mapping of Oil Spills along the Mediterranean Coast of Egypt. Remote Sens. 2021, 13, 2733. [Google Scholar] [CrossRef]
- Sherif, M.M.; Singh, V.P. Effect of Climate Change on Sea Water Intrusion in Coastal Aquifers. Hydrol. Process. 1999, 13, 1277–1287. [Google Scholar] [CrossRef]
- Bear, J.; Cheng, A.H.-D.; Sorek, S.; Ouazar, D.; Herrera, I. Seawater Intrusion in Coastal Aquifers: Concepts, Methods and Practices; Springer Science & Business Media: Berlin, Germany, 1999; Volume 14, ISBN 0792355733. [Google Scholar]
- Pennington, B.T.; Sturt, F.; Wilson, P.; Rowland, J.; Brown, A.G. The Fluvial Evolution of the Holocene Nile Delta. Quat. Sci. Rev. 2017, 170, 212–231. [Google Scholar] [CrossRef] [Green Version]
- Dahab, K.A. Hydrogeological Evolution of the Nile Delta after the High Dam Construction. Ph.D. Dissertation, Geology Department, Faculty of Science, Menoufia University, Menoufia, Egypt, 1993. [Google Scholar]
- Farid, M.S. Management of Groundwater System in the Nile Delta. Ph.D. Thesis, Cairo University, Giza, Egypt, 1985. [Google Scholar]
- Stanley, D.J. Subsidence in the Northeastern Nile Delta: Rapid Rates, Possible Causes, and Consequences. Science 1988, 240, 497–500. [Google Scholar] [CrossRef]
- Stanley, J.-D.; Clemente, P.L. Increased Land Subsidence and Sea-Level Rise Are Submerging Egypt’s Nile Delta Coastal Margin. GSA Today 2017, 27, 4–11. [Google Scholar] [CrossRef] [Green Version]
- Geriesh, M.H.; Balke, K.-D.; El-Rayes, A.E.; Mansour, B.M. Implications of Climate Change on the Groundwater Flow Regime and Geochemistry of the Nile Delta, Egypt. J. Coast. Conserv. 2015, 19, 589–608. [Google Scholar] [CrossRef]
- Abdel-Moati, M.A.R.; El-Sammak, A.A. Man-Made Impact on the Geochemistry of the Nile Delta Lakes. A Study of Metals Concentrations in Sediments. Water. Air. Soil Pollut. 1997, 97, 413–429. [Google Scholar] [CrossRef]
- Abd-Elhamid, H.; Javadi, A.; Abdelaty, I.; Sherif, M. Simulation of Seawater Intrusion in the Nile Delta Aquifer under the Conditions of Climate Change. Hydrol. Res. 2016, 47, 1198–1210. [Google Scholar] [CrossRef]
- Mabrouk, M.; Jonoski, A.; Oude Essink, G.H.P.; Uhlenbrook, S. Assessing the Fresh–Saline Groundwater Distribution in the Nile Delta Aquifer Using a 3D Variable-Density Groundwater Flow Model. Water 2019, 11, 1946. [Google Scholar] [CrossRef] [Green Version]
- Martínez, D.; Bocanegra, E. Hydrogeochemistry and Cation-Exchange Processes in the Coastal Aquifer of Mar Del Plata, Argentina. Hydrogeol. J. 2002, 10, 393–408. [Google Scholar] [CrossRef]
- Andersen, M.S.; Nyvang, V.; Jakobsen, R.; Postma, D. Geochemical Processes and Solute Transport at the Seawater/Freshwater Interface of a Sandy Aquifer. Geochim. Cosmochim. Acta 2005, 69, 3979–3994. [Google Scholar] [CrossRef]
- Ataie-Ashtiani, B.; Volker, R.E.; Lockington, D.A. Tidal Effects on Sea Water Intrusion in Unconfined Aquifers. J. Hydrol. 1999, 216, 17–31. [Google Scholar] [CrossRef]
- Zhang, Q.; Wang, Z. Spatial Prediction of Loose Aquifer Water Abundance Mapping Based on a Hybrid Statistical Learning Approach. Earth Sci. Inform. 2021, 14, 1349–1365. [Google Scholar] [CrossRef]
- Riolo, A. Maltese Experience in the Application of Desalination Technology. Desalination 2001, 136, 115–124. [Google Scholar] [CrossRef]
- Missimer, T.M.; Ghaffour, N.; Dehwah, A.H.A.; Rachman, R.; Maliva, R.G.; Amy, G. Subsurface Intakes for Seawater Reverse Osmosis Facilities: Capacity Limitation, Water Quality Improvement, and Economics. Desalination 2013, 322, 37–51. [Google Scholar] [CrossRef]
- Sola, F.; Vallejos, A.; López-Geta, J.A.; Pulido-Bosch, A. The Role of Aquifer Media in Improving the Quality of Seawater Feed to Desalination Plants. Water Resour. Manag. 2013, 27, 1377–1392. [Google Scholar] [CrossRef]
- Park, N.; Kim, S.; Shi, L.; Song, S. Field Validation of Simulation-Optimization Model for Protecting Excessive Pumping Wells. In Proceedings of the 20th Salt Water Intrusion Meeting, Naples, FL, USA, 23–27 June 2008. [Google Scholar]
- Park, N.; Lei, C.; Chanjong, L. Analytical Method for Preliminary Management of Pumping and Injection in Coastal Areas. In Proceedings of the 20th Salt Water Intrusion Meeting, Naples, FL, USA, 23–27 June 2008. [Google Scholar]
- Thammanu, S.; Marod, D.; Han, H.; Bhusal, N.; Asanok, L.; Ketdee, P.; Gaewsingha, N.; Lee, S.; Chung, J. The Influence of Environmental Factors on Species Composition and Distribution in a Community Forest in Northern Thailand. J. For. Res. 2021, 32, 649–662. [Google Scholar] [CrossRef]
- Wu, Q.; Jiang, X.; Lu, Q.; Li, J.; Chen, J. Changes in Soil Organic Carbon and Aggregate Stability Following a Chronosequence of Liriodendron Chinense Plantations. J. For. Res. 2021, 32, 355–362. [Google Scholar] [CrossRef]
- Liao, C.; Tian, Q.; Liu, F. Nitrogen Availability Regulates Deep Soil Priming Effect by Changing Microbial Metabolic Efficiency in a Subtropical Forest. J. For. Res. 2021, 32, 713–723. [Google Scholar] [CrossRef]
- Shahabi, M.P.; McHugh, A.; Ho, G. Environmental and Economic Assessment of Beach Well Intake versus Open Intake for Seawater Reverse Osmosis Desalination. Desalination 2015, 357, 259–266. [Google Scholar] [CrossRef]
- Pulido-Bosch, A.; Vallejos, A.; Sola, F. Methods to Supply Seawater to Desalination Plants along the Spanish Mediterranean Coast and Their Associated Issues. Environ. Earth Sci. 2019, 78, 322. [Google Scholar] [CrossRef]
- Dehwah, A.H.A.; Al-Mashharawi, S.; Kammourie, N.; Missimer, T.M. Impact of Well Intake Systems on Bacterial, Algae, and Organic Carbon Reduction in SWRO Desalination Systems, SAWACO, Jeddah, Saudi Arabia. Desalin. Water Treat. 2015, 55, 2594–2600. [Google Scholar] [CrossRef]
- Abdel-Jawad, M.; Ebrahim, S. Beachwell Seawater Intake as Feed for an RO Desalting System. Desalination 1994, 99, 57–71. [Google Scholar] [CrossRef]
- Rachman, R.M.; Li, S.; Missimer, T.M. SWRO Feed Water Quality Improvement Using Subsurface Intakes in Oman, Spain, Turks and Caicos Islands, and Saudi Arabia. Desalination 2014, 351, 88–100. [Google Scholar] [CrossRef]
- EEAA. Egypt Second National Communication under the United Nations Framework Convention on Climate Change (UNFCCC); EEAA: Cairo, Egypt, 2010. [Google Scholar]
- Negm, A.M.; Sakr, S.; Abd-Elaty, I.; Abd-Elhamid, H.F. An Overview of Groundwater Resources in Nile Delta Aquifer. In Groundwater in the Nile Delta; Springer: Berlin/Heidelberg, Germany, 2018; pp. 3–44. [Google Scholar]
- Website. Available online: https://www.worldweatheronline.com/port-said-weather-averages/bur-said/eg.aspx (accessed on 18 May 2021).
- Zaghloul, Z.M.; Taha, A.A.; Hegab, O.; El Fawal, F. The Neogene-Quaternary Sedimentary Basins of the Nile Delta. Egypt. J. Geol. 1977, 21, 1–19. [Google Scholar]
- El-Fayoumy, I.F. Geology of Groundwater Supplies in the Eastern Region of the Nile Delta and Its Extension in North Sinai. Ph.D. Thesis, Faculty of Science, Cairo University, Cairo, Egypt, 1968. [Google Scholar]
- Abdelfattah, M.; Abu-Bakr, H.A.-A.; Gaber, A.; Geriesh, M.H.; Elnaggar, A.Y.; El Nahhas, N.; Hassan, T.M. Proposing the Optimum Withdrawing Scenarios to Provide the Western Coastal Area of Port Said, Egypt, with Sufficient Groundwater with Less Salinity. Water 2021, 13, 3359. [Google Scholar] [CrossRef]
- Sestini, G. Nile Delta: A Review of Depositional Environments and Geological History. Geol. Soc. Lond. Spec. Publ. 1989, 41, 99–127. [Google Scholar] [CrossRef]
- RIGW. Hydrogeological Map of Nile Delta, Scale 1: 500,000, 1st ed.; (Nile Delta). 1992.
- Rider, M. The Geological Interpretation of Well Logs Second Edition; Rider–French Consult. Ltd.: Sutherland, UK, 2000; pp. 126–128. [Google Scholar]
- Telford, W.M.; Telford, W.M.; Geldart, L.P.; Sheriff, R.E. Applied Geophysics; Cambridge University Press: Cambridge, UK, 1990; ISBN 0521339383. [Google Scholar]
- Fiser-Nagy, Á.; Varga-Tóth, I.; Tóth, T.M. Lithology Identification Using Open-Hole Well-Log Data in the Metamorphic Kiskunhalas-NE Hydrocarbon Reservoir, South Hungary. Acta Geod. Geophys. 2014, 49, 57–78. [Google Scholar] [CrossRef] [Green Version]
- Das, B.; Chatterjee, R. Well Log Data Analysis for Lithology and Fluid Identification in Krishna-Godavari Basin, India. Arab. J. Geosci. 2018, 11, 231. [Google Scholar] [CrossRef]
- Ellis, D.V.; Singer, J.M. Well Logging for Earth Scientists; Springer: Berlin/Heidelberg, Germany, 2007; Volume 692. [Google Scholar]
- El-Khodre, A.S.; Bedaiwy, M.N.A. Experimental Characterization of Physio-Chemical, Hydrodynamic and Mechanical Properties of Two Typical Egyptian Soils. Tishreen Univ. J. Res. Sci. Stud. Sci. Ser. 2008, 30, 169–191. [Google Scholar]
- APHA. Standard Methods for the Examination of Water and Wastewater; American Public Health Association, American Water Works Association, Water Environment Federation: Washington, DC, USA, 2005. [Google Scholar]
- Durov, S.A. Natural Waters and Graphical Representation of Their Composition: Doklady Akademii Nauk. Union Sov. Social. Repub. 1948, 59, 87–90. [Google Scholar]
- WHO. Guidelines for Drinking-Water Quality; WHO: Geneva, Switzerland, 2011; Volume 216, pp. 303–304. [Google Scholar]
- Currell, M.; Cartwright, I.; Raveggi, M.; Han, D. Controls on Elevated Fluoride and Arsenic Concentrations in Groundwater from the Yuncheng Basin, China. Appl. Geochem. 2011, 26, 540–552. [Google Scholar] [CrossRef]
- Li, P.; Qian, H.; Wu, J.; Chen, J.; Zhang, Y.; Zhang, H. Occurrence and Hydrogeochemistry of Fluoride in Alluvial Aquifer of Weihe River, China. Environ. Earth Sci. 2014, 71, 3133–3145. [Google Scholar] [CrossRef]
- Wu, J.; Li, P.; Qian, H. Hydrochemical Characterization of Drinking Groundwater with Special Reference to Fluoride in an Arid Area of China and the Control of Aquifer Leakage on Its Concentrations. Environ. Earth Sci. 2015, 73, 8575–8588. [Google Scholar] [CrossRef]


| Continuous Pumping Tests | In Situ Chemical Parameters | Hydrogeological Parameters | |||||||||
|---|---|---|---|---|---|---|---|---|---|---|---|
| Discharge Rate (m3/h) | Drawdown (m) | Time (hour) | Layer | T (°C) | pH | EC (mS/cm) | Av. n (%) | Av. K (m/Day) | T (m2/Day) | Av. S (m2/Day) | |
| GW01 | 250 | 13.38 | 24,48,72 | Sandstone (A) | 24.1–28.3 | 7.3–7.34 | 44.5–44.8 | 22 | 5.8–12.7 | 586–1270 | 2.1 × 10⁻³ |
| GW05 | 300 | 24.34 | 24 | 26.1–27.5 | 7.71–7.89 | 44.13–45.1 | |||||
| GW02 | 300 | 31.33 | 24,72 | Sandstone (B) | 26.8–29.3 | 7.13–7.21 | 74.12–74.44 | 27.5 | 7.6–11.7 | 763–1170 | 1.8 × 10⁻³ |
| GW03 | 120 | 4.9 | 24,48,72 | 26.6–28.1 | 7.28–7.34 | 36.75–39.65 | |||||
| GW04 | 300 | 16.87 | 24,72 | Sandstone (C) | 27.1–28.6 | 7.15–7.21 | 74.12–74.38 | 25 | 11.1–19.5 | 1110–1950 | 5.3 × 10⁻³ |
| Physicochemical Parameters | Unit | Layer (A) | Layer (B) | WHO, 2011 | ||||||
|---|---|---|---|---|---|---|---|---|---|---|
| W1 | W2 | W3 | Average | W4 | W5 | W6 | Average | |||
| pH | ----- | 7.05 | 6.81 | 6.72 | 6.86 | 6.81 | 6.75 | 6.85 | 6.8 | 6.5–8.5 |
| TDS | mg/L | 32,410 | 32,270 | 32,410 | 32,363 | 26,950 | 27,580 | 27,510 | 27,346 | 1000 |
| Major Cations | ||||||||||
| Calcium (Ca2+) | mg/L | 658 | 617 | 555 | 610 | 525 | 569 | 565 | 553 | 75 |
| Magnesium (Mg2+) | mg/L | 241 | 241 | 220 | 234 | 210 | 216 | 220 | 215 | 30 |
| Sodium (Na+) | mg/L | 9100 | 9250 | 9550 | 9300 | 7850 | 7950 | 7950 | 7916 | 200 |
| Potassium (K+) | mg/L | 300 | 290 | 210 | 266 | 170 | 175 | 180 | 175 | 10 |
| Major Anions | ||||||||||
| Carbonate (CO3−) | mg/L | 0 | 0 | 0 | 0 | 0 | 0 | 0 | 0 | |
| Bicarbonate (HCO3−) | mg/L | 575 | 580 | 600 | 585 | 165 | 156 | 150 | 157 | 300 |
| Sulfate (SO42−) | mg/L | 1499 | 1495 | 1320 | 1438 | 1255 | 1300 | 1320 | 1291 | 250 |
| Chloride (Cl−) | mg/L | 14,005 | 14,214 | 14,720 | 14,313 | 12,100 | 12,200 | 12,250 | 12,183 | 250 |
| Nitrite (NO2−) | mg/L | <0.2 | <0.2 | <0.2 | <0.2 | <0.2 | <0.2 | |||
| Nitrate (NO3−) | mg/L | 74 | 137 | 72 | 94 | 43 | 48 | 46 | 45 | 50 |
| Fluoride (F−) | mg/L | 1 | 0.92 | <0.05 | 0.65 | 0.11 | 0.42 | 0.54 | 0.35 | 1.5 |
| Heavy Metals | ||||||||||
| Aluminum (Al) | mg/L | 0.029 | 0.007 | 0.017 | 0.017 | 0.047 | <0.007 | 0.04 | 0.1 | |
| Antimony (Sb) | mg/L | <0.009 | <0.009 | <0.009 | <0.009 | <0.009 | <0.009 | |||
| Arsenic (As) | mg/L | <0.002 | <0.002 | <0.002 | <0.026 | <0.026 | <0.026 | 0.01 | ||
| Barium (Ba) | mg/L | 0.038 | 0.039 | 0.036 | 0.037 | 0.078 | 0.092 | 0.109 | 0.093 | 0.7 |
| Cadmium (Cd) | mg/L | 0.003 | <0.002 | <0.002 | <0.002 | <0.002 | <0.002 | 0.003 | ||
| Chromium (Cr) | mg/L | <0.002 | <0.002 | <0.002 | <0.002 | <0.002 | <0.002 | |||
| Cobalt (Co) | mg/L | <0.003 | 0.003 | 0.003 | <0.003 | <0.003 | <0.003 | |||
| Copper (Cu) | mg/L | 0.085 | 0.008 | 0.031 | 0.041 | 0.026 | 0.024 | 0.015 | 0.021 | 2 |
| Iron (Fe) | mg/L | 0.238 | 0.227 | 0.393 | 0.286 | 0.086 | 0.194 | 0.047 | 0.109 | 0.1 |
| Lead (Pb) | mg/L | <0.007 | <0.007 | <0.007 | <0.007 | <0.007 | <0.007 | 0.01 | ||
| Manganese (Mn) | mg/L | 1.163 | 1.188 | 1.19 | 1.18 | 1.545 | 1.599 | 1.663 | 1.6 | 0.05 |
| Nickel (Ni) | mg/L | 0.009 | 0.011 | 0.008 | 0.028 | 0.01 | 0.01 | 0.01 | 0.01 | 0.07 |
| Selenium (Se) | mg/L | <0.007 | <0.007 | <0.007 | <0.007 | <0.007 | <0.007 | 0.04 | ||
Disclaimer/Publisher’s Note: The statements, opinions and data contained in all publications are solely those of the individual author(s) and contributor(s) and not of MDPI and/or the editor(s). MDPI and/or the editor(s) disclaim responsibility for any injury to people or property resulting from any ideas, methods, instructions or products referred to in the content. |
© 2023 by the authors. Licensee MDPI, Basel, Switzerland. This article is an open access article distributed under the terms and conditions of the Creative Commons Attribution (CC BY) license (https://creativecommons.org/licenses/by/4.0/).
Share and Cite
Abdelfattah, M.; Abu-Bakr, H.A.-A.; Mewafy, F.M.; Hassan, T.M.; Geriesh, M.H.; Saber, M.; Gaber, A. Hydrogeophysical and Hydrochemical Assessment of the Northeastern Coastal Aquifer of Egypt for Desalination Suitability. Water 2023, 15, 423. https://doi.org/10.3390/w15030423
Abdelfattah M, Abu-Bakr HA-A, Mewafy FM, Hassan TM, Geriesh MH, Saber M, Gaber A. Hydrogeophysical and Hydrochemical Assessment of the Northeastern Coastal Aquifer of Egypt for Desalination Suitability. Water. 2023; 15(3):423. https://doi.org/10.3390/w15030423
Chicago/Turabian StyleAbdelfattah, Mohamed, Heba Abdel-Aziz Abu-Bakr, Farag M. Mewafy, Taher Mohammed Hassan, Mohamed H. Geriesh, Mohamed Saber, and Ahmed Gaber. 2023. "Hydrogeophysical and Hydrochemical Assessment of the Northeastern Coastal Aquifer of Egypt for Desalination Suitability" Water 15, no. 3: 423. https://doi.org/10.3390/w15030423