
Know to Predict, Forecast to Warn: A Review of Flood Risk Prediction Tools


1
Africa Centre of Excellence in Coastal Resilience (ACECoR), University of Cape Coast, Cape Coast 00223, Ghana
2
Department of Fisheries and Aquatic Sciences, School of Biological Sciences, University of Cape Coast, Cape Coast 00233, Ghana
3
Department of Maritime Business Administration, Texas A & M University, 200 Seawolf Pkwy, Galveston, TX 77554, USA
*
Author to whom correspondence should be addressed.
Water 2023, 15(3), 427; https://doi.org/10.3390/w15030427
Submission received: 18 November 2022
/
Revised: 6 January 2023
/
Accepted: 9 January 2023
/
Published: 20 January 2023
(This article belongs to the Section Hydrology)
Abstract
:Flood prediction has advanced significantly in terms of technique and capacity to achieve policymakers’ objectives of accurate forecast and identification of flood-prone and impacted areas. Flood prediction tools are critical for flood hazard and risk management. However, numerous reviews on flood modelling have focused on individual models. This study presents a state-of-the-art review of flood prediction tools with a focus on analyzing the chronological growth of the research in the field of flood prediction, the evolutionary trends in flood prediction, analysing the strengths and weaknesses of each tool, and finally identifying the significant gaps for future studies. The article conducted a review and meta-analysis of 1101 research articles indexed by the Scopus database in the last five years (2017–2022) using Biblioshiny in r. The study drew an up-to-date picture of the recent developments, emerging topical trends, and gaps for future studies. The finding shows that machine learning models are widely used in flood prediction, while Probabilistic models like Copula and Bayesian Network (B.N.) play significant roles in the uncertainty assessment of flood risk, and should be explored since these events are uncertain. It was also found that the advancement of the remote sensing, geographic information system (GIS) and cloud computing provides the best platform to integrate data and tools for flood prediction. However, more research should be conducted in Africa, South Africa and Australia, where less work is done and the potential of the probabilistic models in flood prediction should be explored.
1. Introduction
Disaster management is evolving toward current technologies, just like other fields. Flooding results from a sudden surface water runoff onto typically dry land. This phenomenon is one of the most hazardous natural disasters globally due to its impact on the socio-economic and environmental sectors of the economy. Ref. [1] opined that flooding has significant political implications and threatens both emerging and developed economies [2]. Predictive analysis of future flood hazards shows that climate change and weak preparedness in many locations likely result in historical levels of flood-related damage [3]. Flood occurrences around the world are rising, necessitating comprehensive catastrophe risk management. Globally, flooding is now an essential hydrological topic [4,5]. The vulnerability of the environment, national politics and economies are affected by flooding in a very negative way [6].
The effects of climate change are projected to increase the occurrence and intensity of natural disasters [7,8,9]. Extreme weather conditions increase the likelihood of heavy downpours, warming ice and sea surface temperatures to increase sea levels [10,11,12,13]. From Table 1, flooding accounts for 21% of total lives claimed from 1900–2021. Flooding is a chronic natural disaster that has devastated human life and properties, totalling 24% of all-natural disasters (refer to Table 2). Climate Change (CC) and development/infrastructure projects in high-risk locations have increased the global uncertainty, frequency and intensity of flood dangers [14,15,16,17].
To control floods, knowledge of the causes of the flood is essential. Floods caused by heavy precipitation, unusually high tides, severe winds, and higher sea levels are driven by anthropogenic climate change and present a significant challenge for many coastal communities. These surges have numerous negative consequences, that is, flooding, loss of life and land, damage and loss of buildings and infrastructure, increased erosion, saltwater intrusion, changing ecosystems, and reduced biodiversity. The consequences of rising sea levels are significant because coastal zones are densely populated areas, have significant population growth, and are economically important [19]. The increasing potential for storm surge and coastal flooding puts communities residing in these coastal areas at risk for loss of life and damage to infrastructure systems. In addition, low-elevation areas on the coast are more vulnerable to storm surges and coastal flooding in the face of sea-level rise.
To reduce the impacts of flooding, requisite information is required before floods. Flood prediction models have played a crucial role in hazard analysis [20,21] and managing severe flood events [22,23] through flood awareness creation and adoption of prevention strategies [23,24]. However, countries or regions susceptible to regular floods, especially coastal communities, need valid and reliable flood vulnerability maps and plans for long-term flood risk assessment [6]. At the moment, flood vulnerability maps or models are crucial because of the dynamic nature of climate conditions.
Predicting flood lead time and occurrence remains challenging [25,26,27], considering the numerous parameters of the environment that influence flood events. As a result, the need for advanced systems for short- and long-term floods [3] and other hydrological event predictions need to be emphasised to minimise damage [27] and increase resilience [28]. However, most significant flood prediction models are data-specific and rely on several simple assumptions [27,29,30]. Thus, methodologies such as event-driven, empirical black box, lumped and distributed, stochastic, deterministic, continuous, and hybrids are used to simulate complex mathematical representations of physical and morphodynamic processes and basin behaviour [27]. Operational flood forecasting systems form a crucial part of ‘preparedness’ strategies for disastrous flood events by providing early warnings several days ahead, giving flood forecasting services, civil protection authorities and the public adequate preparation time and thus reducing the impacts of the flood [31].
In literature, [32] reviewed Bayesian flood forecasting, [27,33] examined the machine learning model used in flood prediction, and [34,35] studied numerical models’ application in flood modelling. This study is a comparative review of three categories of flood prediction tools, with the importance of the advancement of GIS and remote sensing highlighted.
There are a plethora of published articles and book chapters that provide comprehensive reviews on flood prediction. In addition, thematic evaluations of numerous flood prediction methods have been published, covering methodological and spatial scale concerns, uncertainty, mapping, world scale risk analyses and assessments, and economic impact, among others [36]. Nonetheless, these theme studies offer a snapshot or a limited perspective on flood prediction. Consequently, they do not permit us to understand the chronological evolution of this subdiscipline or to interpret the new application themes and emerging topics in this field. Hence an evidence synthesis approach employs structured, transparent, comprehensive approaches to combine the findings of previous studies and provide the full scope of the study [37].
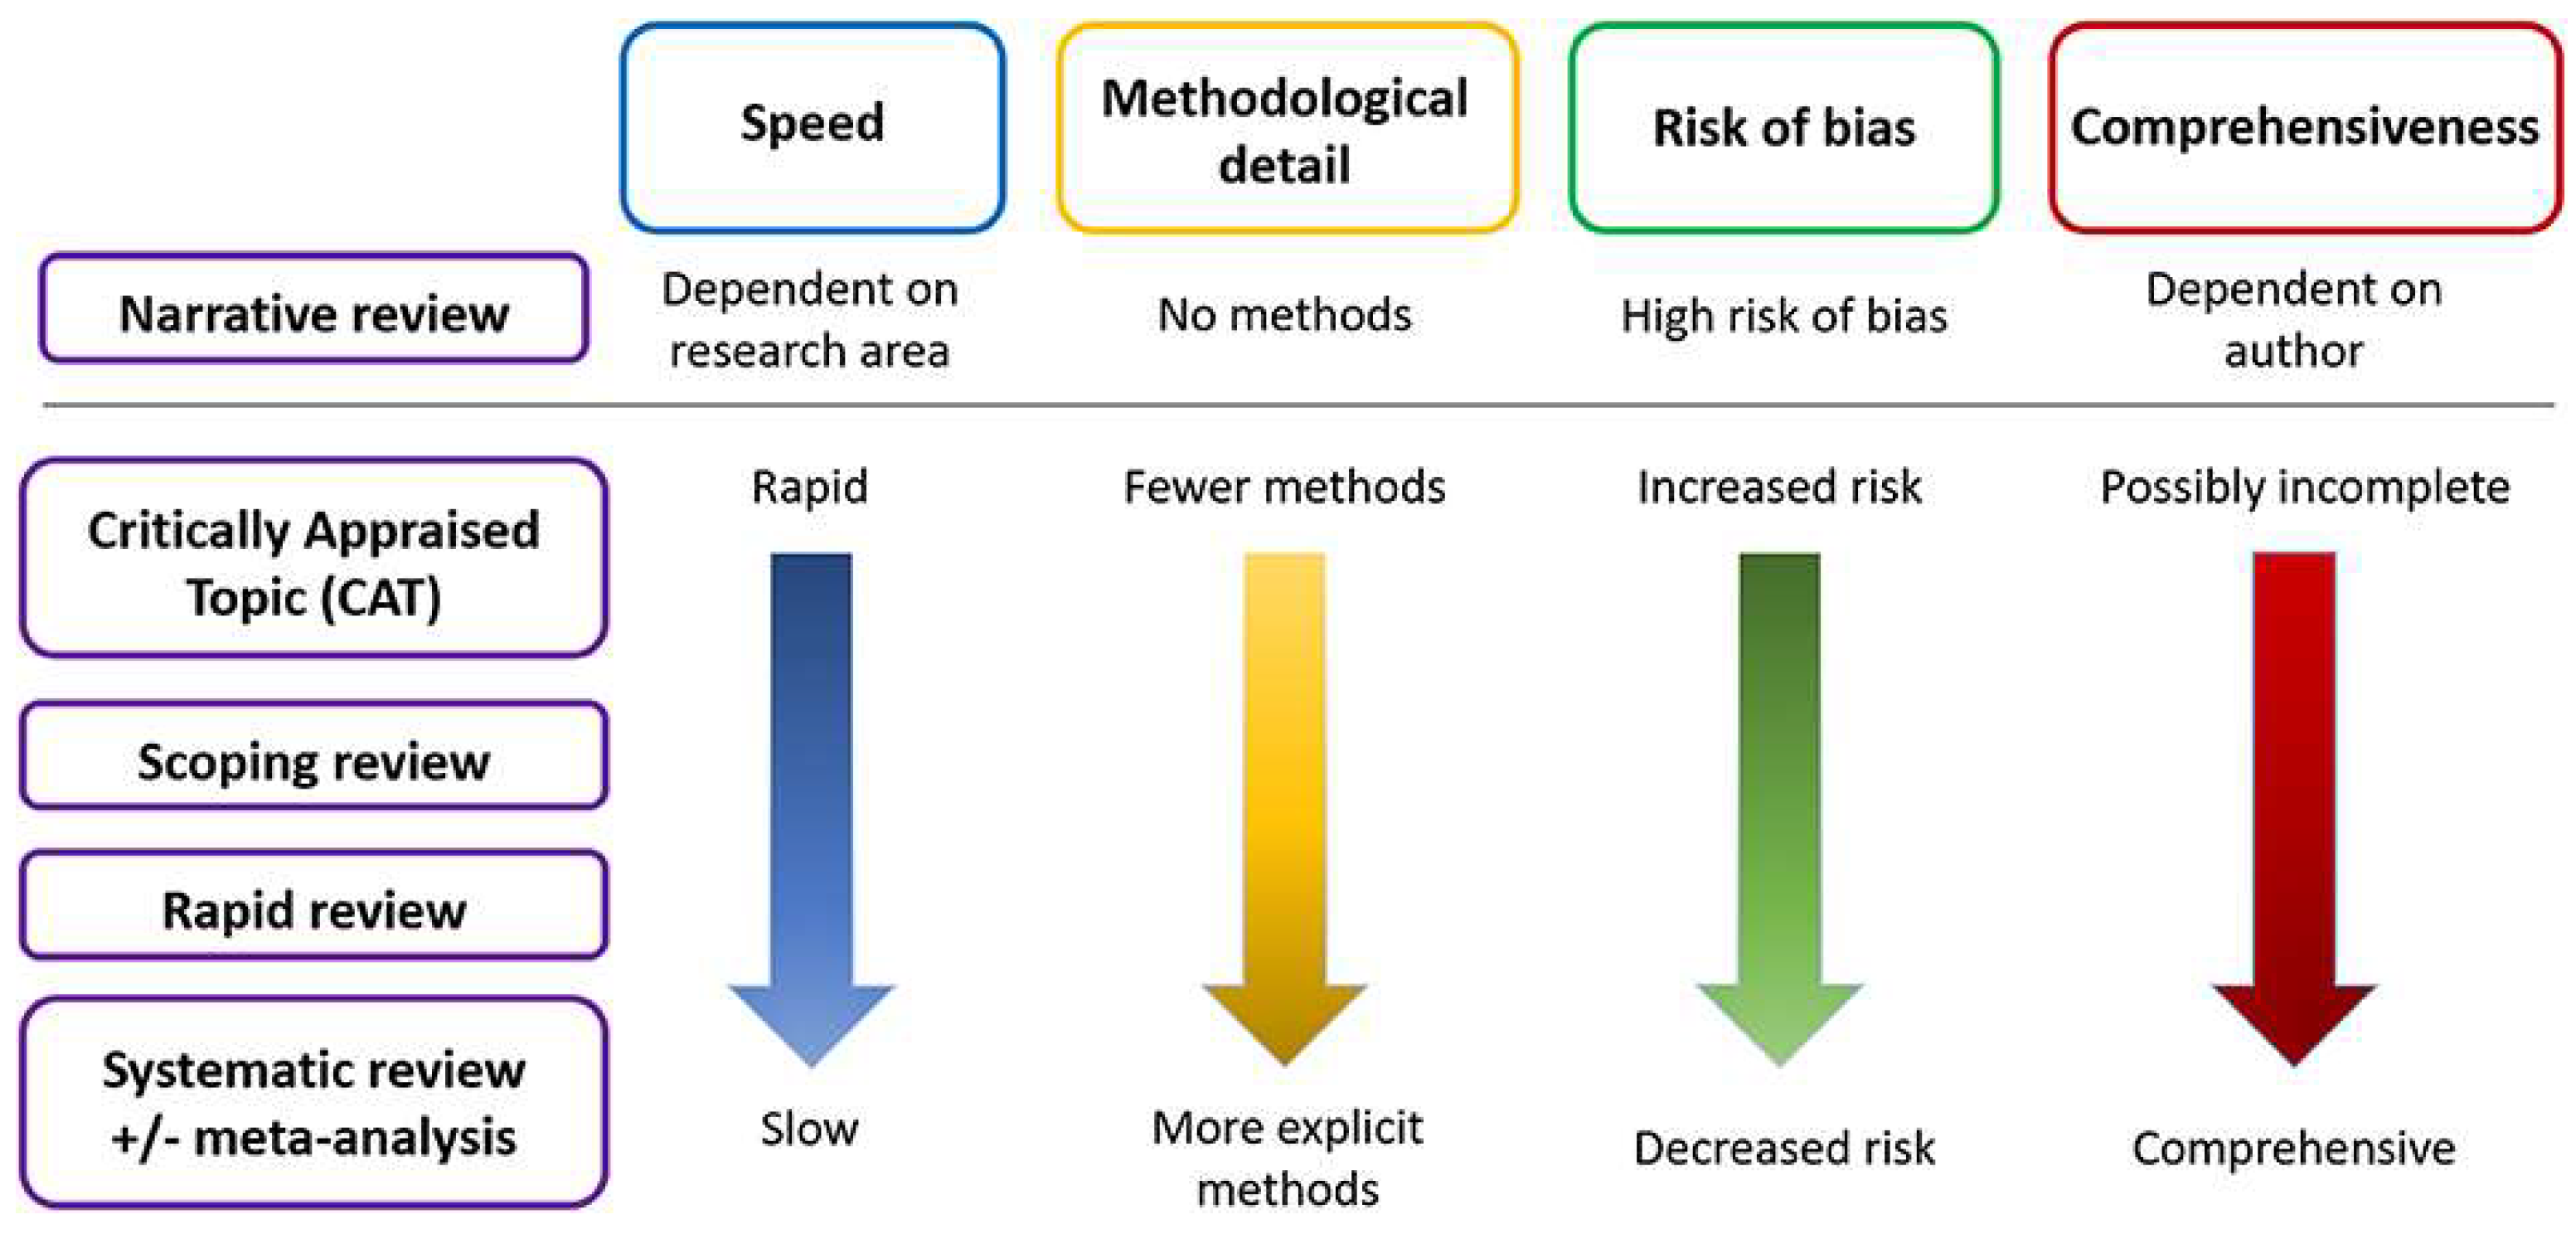
Evidence synthesis reveals research question knowledge. It claims evidence based on research. Thus, it is essential to use study findings in personal and public decision-making. There are many approaches: Systematic, Meta-analysis, Traditional Narrative, Scoping, Umbrella, Critically appraised Topics (CAT), Rapid Reviews and so forth. Ref. [38] compared the common types of evidence synthesis approaches in terms of speed, methodological robustness, risk of bias and comprehensiveness, as shown in Figure 1.
For this study, a systematic review with meta-analysis and bibliometric evaluation was done because this method has robust guidelines and statistical methods that aim to identify, evaluate, and methodically compile research findings [39,40]. This approach has a view to limit bias and random error, producing more accurate results from which inferences can be derived and decisions made [41]. Though there are other alternative methods of evaluating literature like Scientometrics, Webometrics/Cybermetrics, Informetrics and Altmetrics, [42] bibliometrics evaluation is much preferred in this study. A bibliometric evaluation of scientific databases containing the entire body of technical literature can reveal the evolution of global flood risk analysis and assessment efforts [36].
Bibliometrics evaluation or analysis is the study of the measurement of scientific communication and is a valuable tool for assessing and understanding published knowledge [43,44]. It shows how literature has changed and how different fields of knowledge are related. It also talks about how productive an author is [45,46,47], how much they work together [48,49,50], and how their impact [51,52,53].
Bibliometric methods help determine research priorities [54,55,56,57,58,59] relevant and current research problems (research gaps) [54,57,60,61,62], track science and technology [63]; allocate funds and reward scientific excellence [64,65]. Meta-analyses give high-level information, and an awareness of its trends may contribute to an overall comprehension of the field. To comprehend research trends in a given subject or subfield and evaluate citation as a measure of influence, bibliometric analysis was conducted.
This study, therefore, presents a comprehensive review of the state-of-art flood prediction tools applied globally and a meta-analysis using the bibliometrics evaluation. The study aims to; 1. analyse the chronological growth of the research in the field of flood prediction, 2. what are the evolutionary trends in flood prediction, 3. assess the strengths and weakness of flood prediction tools and applications in line with vulnerable communities, 4. identifying significant gaps for future studies. This study further emphasises the importance of the advancements in geographic information science (GIS) and remote sensing in the discourse of flood prediction tools.
2. Materials and Methods
This study is focused extensively on journal articles published in journals indexed by the Scopus database [66] until 24 March 2022. The Scopus database covers nearly 36,377 titles from approximately 11,678 publishers and 34,346 peer-reviewed journals [67,68,69]. The study is limited to works published in scientific journals by researchers utilising the Scopus database even though [70] mentioned the importance of exploring multiple databases for relevant material, this approach has drawbacks. Because not all interfaces use the same field codes or proximity operators, converting a search strategy for use in other interfaces and search syntaxes takes time. Another major challenge when translating is that different databases use different thesaurus phrases. In addition, it is time-consuming for reviewers, as they are required to scan more titles and abstracts, the majority of which are likely irrelevant. Worth noting is that access to databases is frequently restricted and only available through paid subscriptions [70]. The authors’ choice of Scopus was based on the recommendation of [71,72] as the most reputable and efficient search engine for systematic literature reviews and search accuracy in Scopus is more credible and reliable than other search engines such as Google Scholar and Web of Science. The study was conducted from 1 January 2017 to 24 March 2022.
2.1. Search Strategy
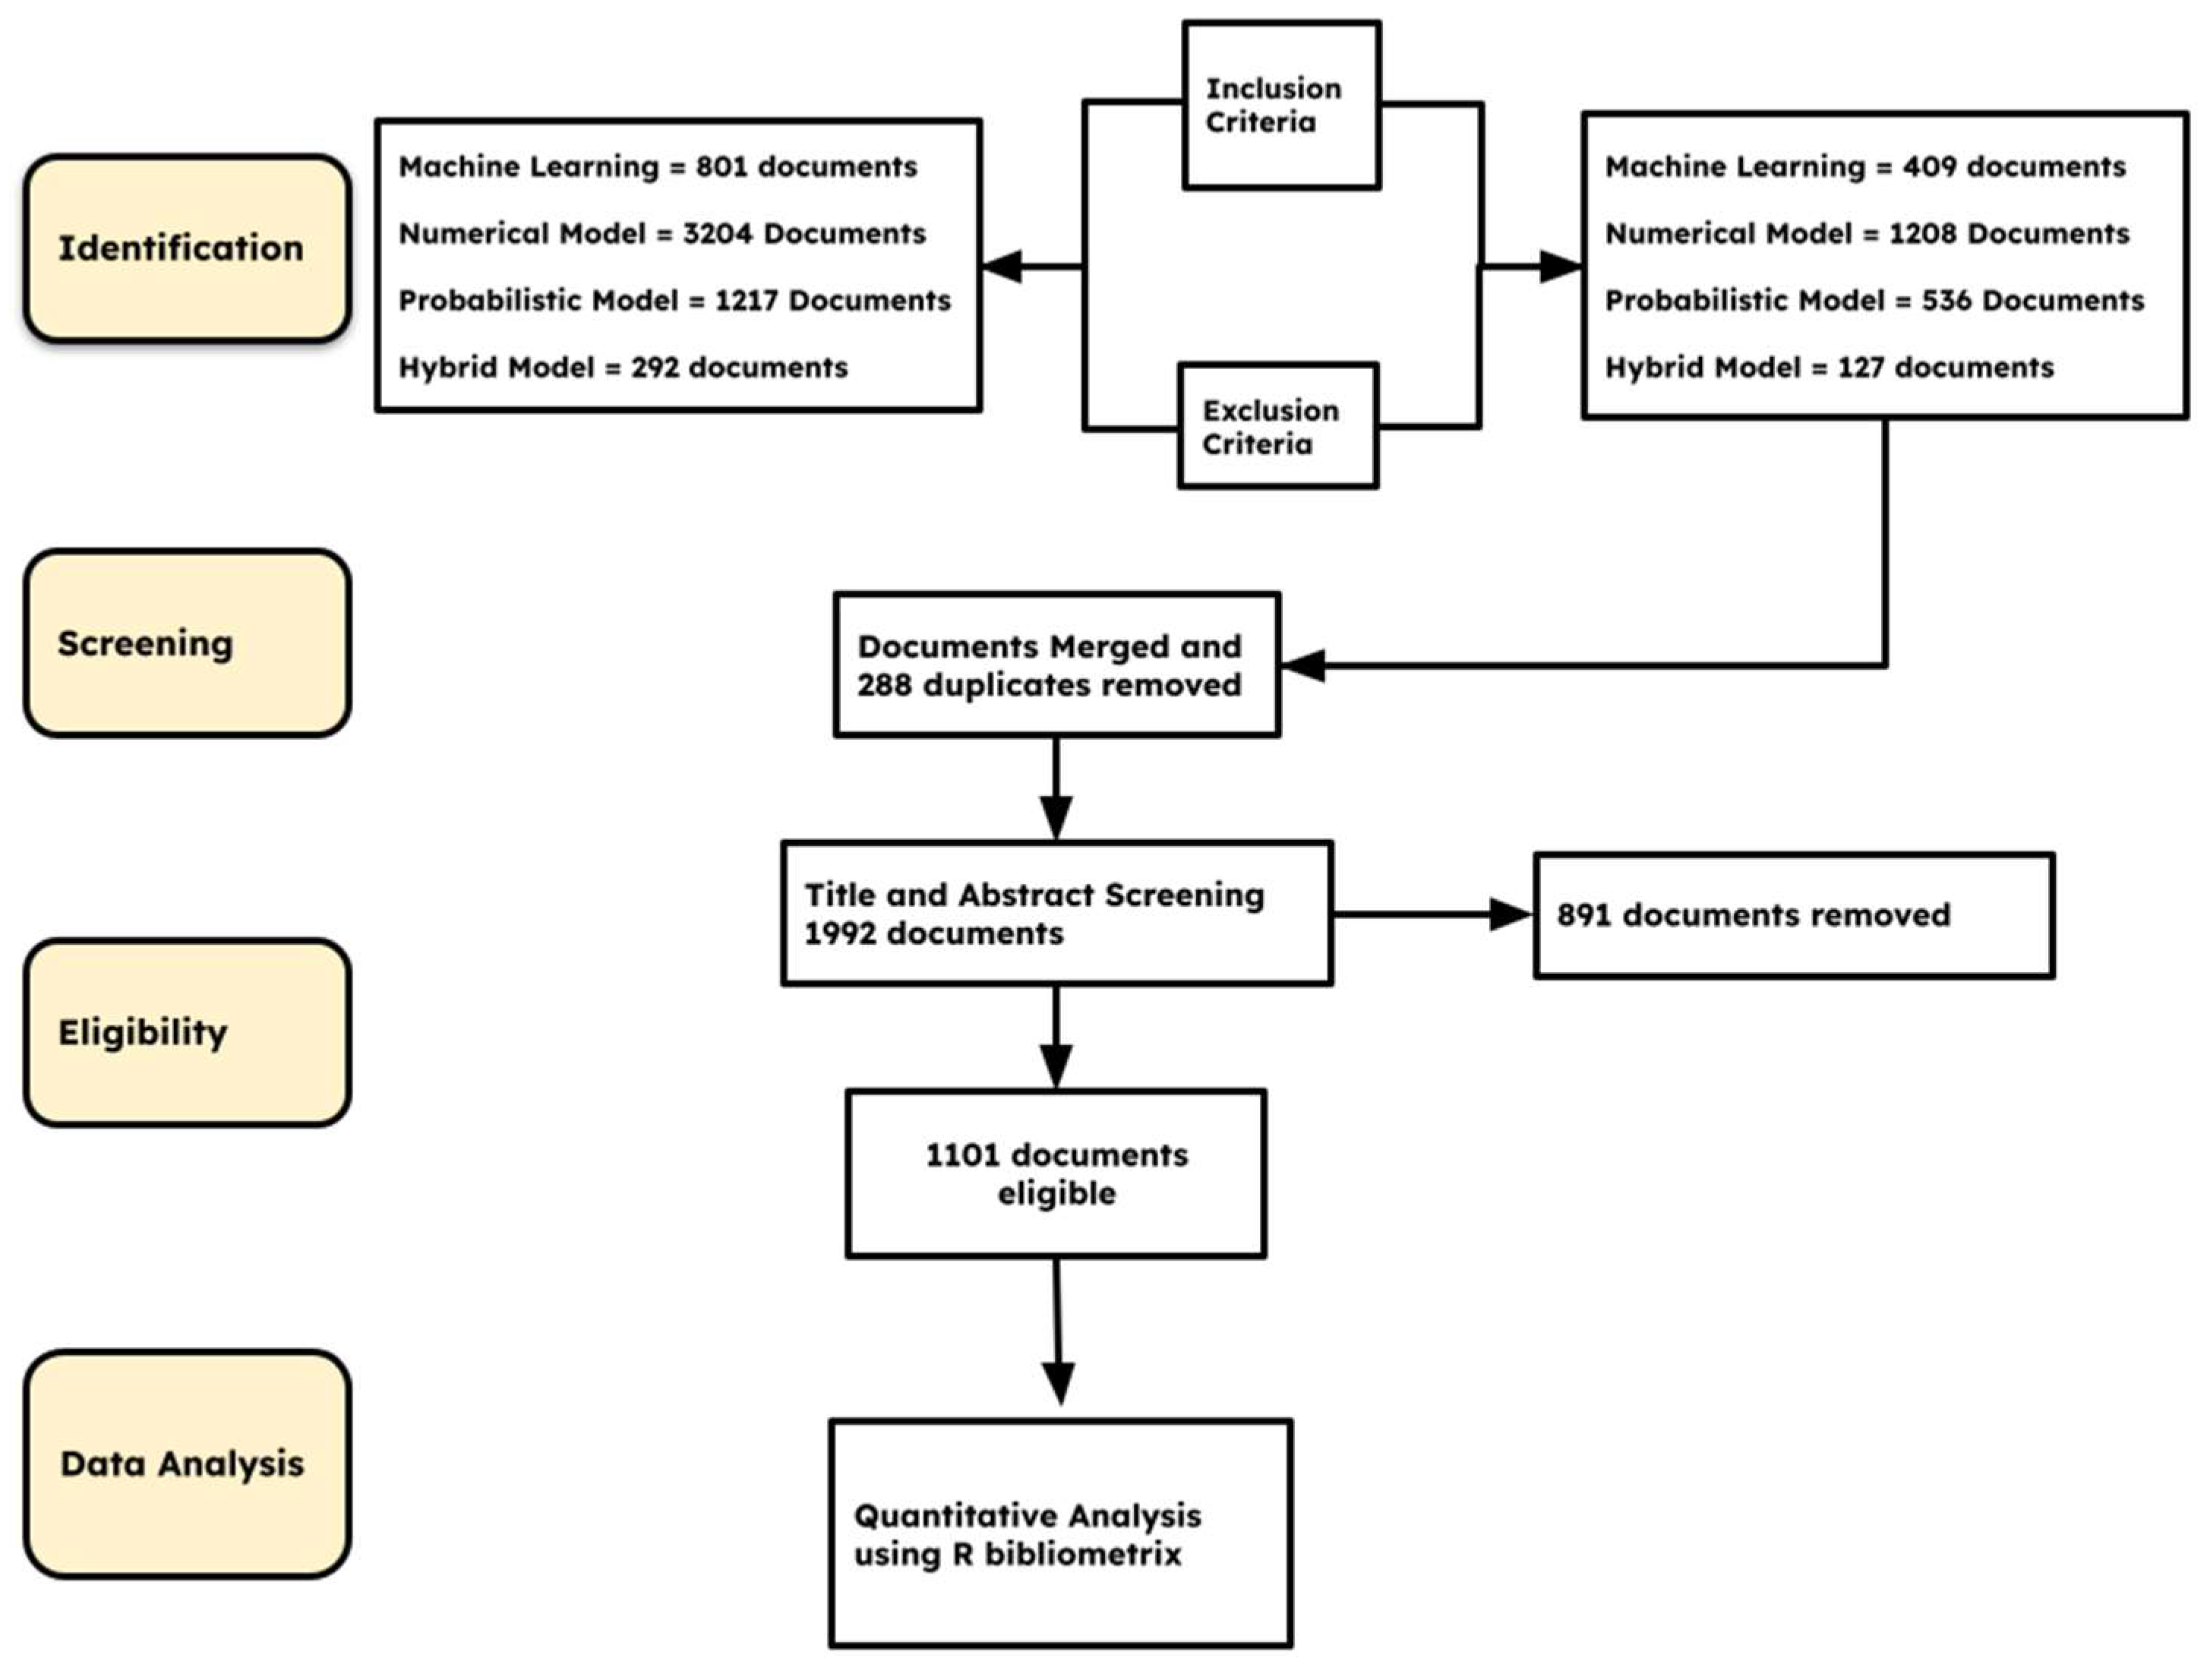
The search for relevant literature is an essential part of any systematic review. Not only does the literature search process influence the results of a systematic review, but it is also the underlying mechanism that presents the available data (relevant literature) for analysis. The data are needed to perform screening, data extraction, and qualitative or quantitative synthesis. To minimise bias, the literature search must be robust and reproducible. To do this analysis, the first step is to create a schema outlining the most significant procedures to follow when searching systematically for the documents needed to conduct the analysis. Figure 2 highlights the steps of systematic development of the bibliometric analysis focused on flood prediction.
The search query conducted for the four different tools was:
- Keywords search for Machine Learning Models: (“Machine Learning” OR ml OR “Artificial Neural Networks” OR ann OR “neuro-fuzzy” OR “adaptive neuro-fuzzy inference systems” OR anfis OR “support vector machines” OR svm OR “wavelet neural networks” OR wnn OR “multilayer perceptron” OR mlp OR “Random Forest” OR rf) AND (flood OR hydrodynamics) AND (risk OR vulnerability OR susceptibility OR hazard) AND (estimation OR mapping OR simulation OR prediction OR modelling OR forecasting).
- Keywords search for Numerical Models: (“Numerical model” OR “Numerical Modelling” OR 1d OR 2d OR 3d OR “Coupled 1D/2D” OR “Statistical Modelling” OR “Statistical Model”) AND (flood OR hydrodynamics) AND (risk OR vulnerability OR susceptibility OR hazard) AND (estimation OR mapping OR simulation OR prediction OR modelling OR forecasting)
- Keywords search for Probabilistic Models: (“Bayesian Network” OR “Bayesian Belief Network” OR bayes* OR bn OR bbf OR ahp OR “Multi-Criteria Decision Analysis” OR mcda OR “Analytic Hierarchy Process” OR ahp OR “Monte Carlo” OR mcmc OR “cellular automata” OR “Probabilistic models” OR “probabilistic graphical models” OR pgm) AND (flood OR hydrodynamics) AND (risk OR vulnerability OR susceptibility OR hazard) AND (estimation OR mapping OR simulation OR prediction OR modelling OR forecasting)
- Keywords search for Hybrid Models: (“hybrid model” OR “Hybrid tool*” OR hybrid*) AND (flood OR hydrodynamics) AND (risk OR vulnerability OR susceptibility OR hazard) AND (estimation OR mapping OR simulation OR prediction OR modelling OR forecasting)
2.2. Data Pre-Processing and Cleaning
After searching for articles containing TITLE-ABS-KEY, 5514 research works addressing various elements of flood-related prediction models were identified, of which 3204 documents related to Numerical Models, 801 for Machine Learning Models, and Probabilistic Models contributed to 1217 and 292 for hybrid models. To refine,
- “Limit to” filter was used to state the inclusion criteria: Publication Year: 2017–2022; Document Type: Article; Publication Stage: Final; Source Type: Journal and Language: English.
- An “Exclude” filter was used to eliminate articles with keywords like Aneurysm, Oil spills, Polymer flooding, landslide, Debris flow, Material Flow, Heavy Metal, pollutants and so forth.
- This resulted in the retention of only 2280 records.
- These 2280 records were merged in the R console, and 288 duplicates were removed.
- A cursory examination of the resulting titles revealed that they mostly matched the suggested purpose of examining the various approaches utilized in flood research.
- The publications were then analyzed with the Biblioshiny app in R according to Figure 2 to generate the graphs and charts.
Figure 2.
Illustration of the search strategy for this review study.

3. Results/Discussion
3.1. Chronological Growth of the Research in the Field of Flood Prediction
3.1.1. Descriptive Findings
Table 3 shows the descriptive Information of the data used in the analytics. Of the 5514 documents, and 1101 the 5514 documents searched, 1101 met the inclusion and exclusion criteria. About 1101 documents were published in 311 journals indexed by Scopus, with the average number of citations per document as 14.5. The average citations per year per document and average year from the publication of these articles are 3.717 and 2.31. In addition, 3535 authors authored these documents used for the analytics, with 24 documents authored as single authors while the remaining 3511 were multi-authored.
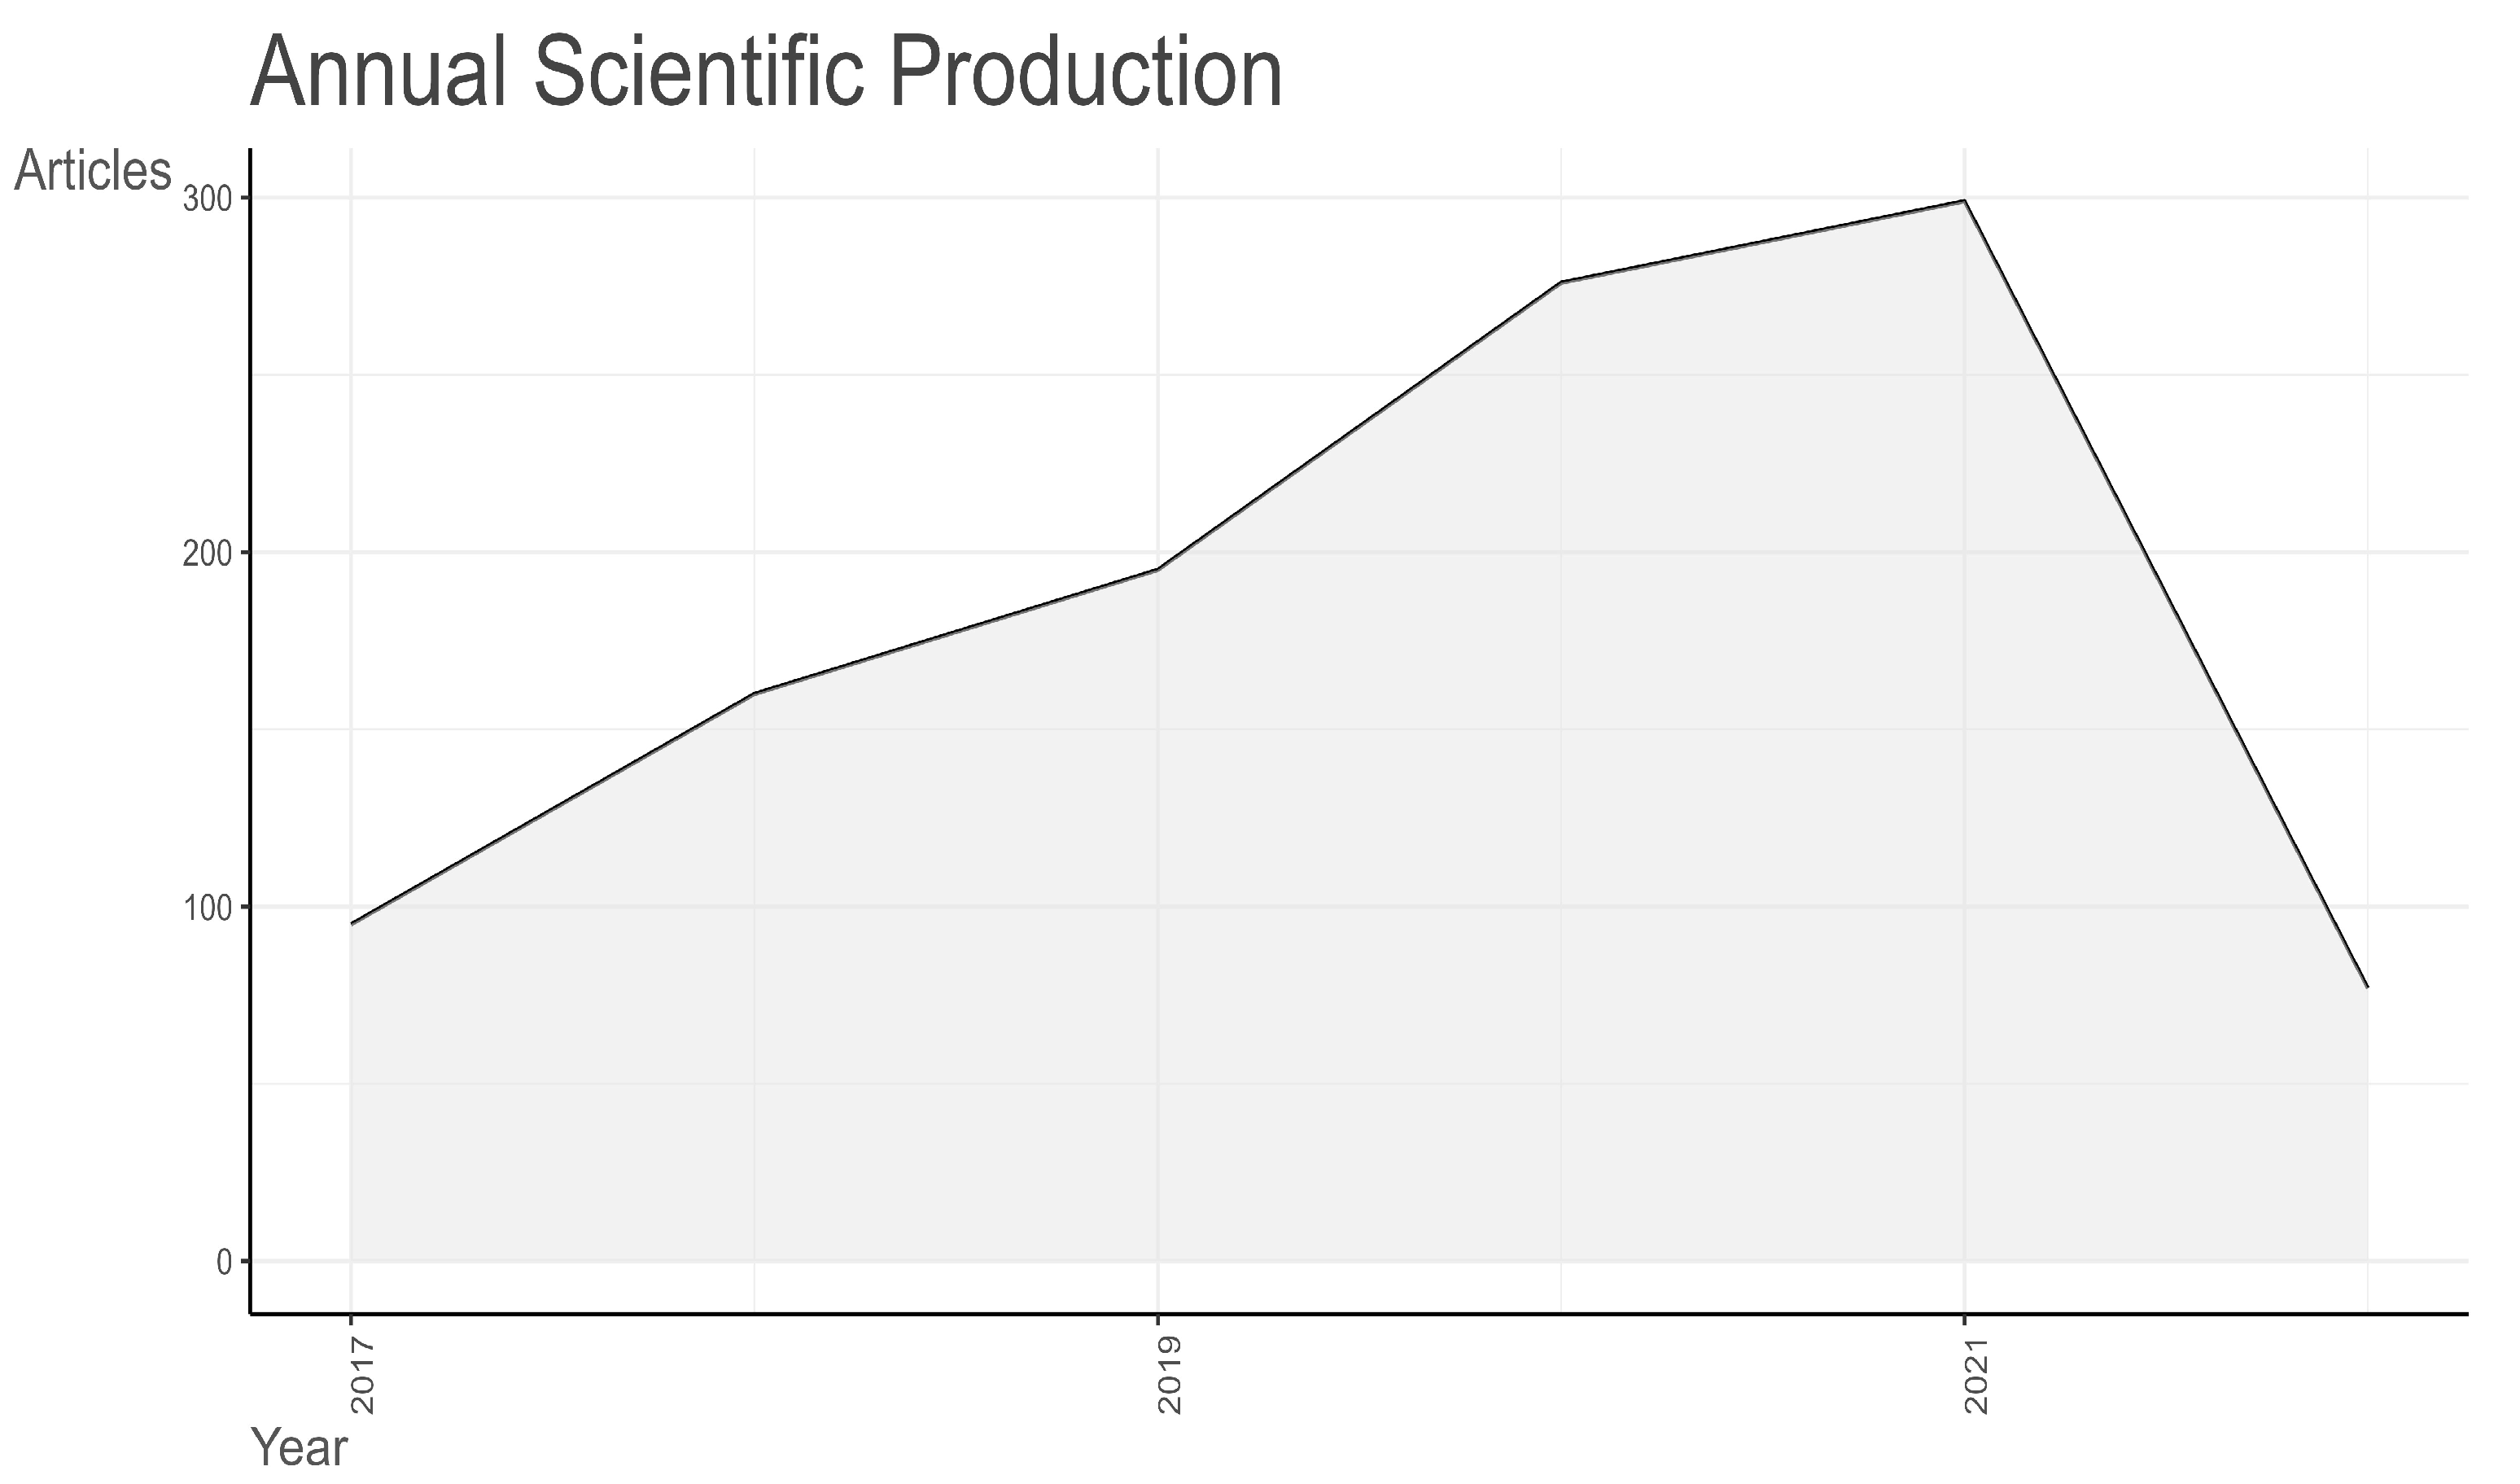
3.1.2. Annual Growth of the Research
Figure 3 below shows a graph of scholarly publications’ global annual chronological growth with flood prediction tools for 2017–2022. There is a gradual increase in publication records, from 95 articles in 2017 to 299 articles in 2021 and 77 articles in the first quarter of 2022, as shown in Table 2. This represents an increase of 42.94% annual growth rate from 2017 to 2021. This implies that at least 43 articles are published annually on Flood prediction tools, with 77 scholarly publications in the first quarter of 2022.
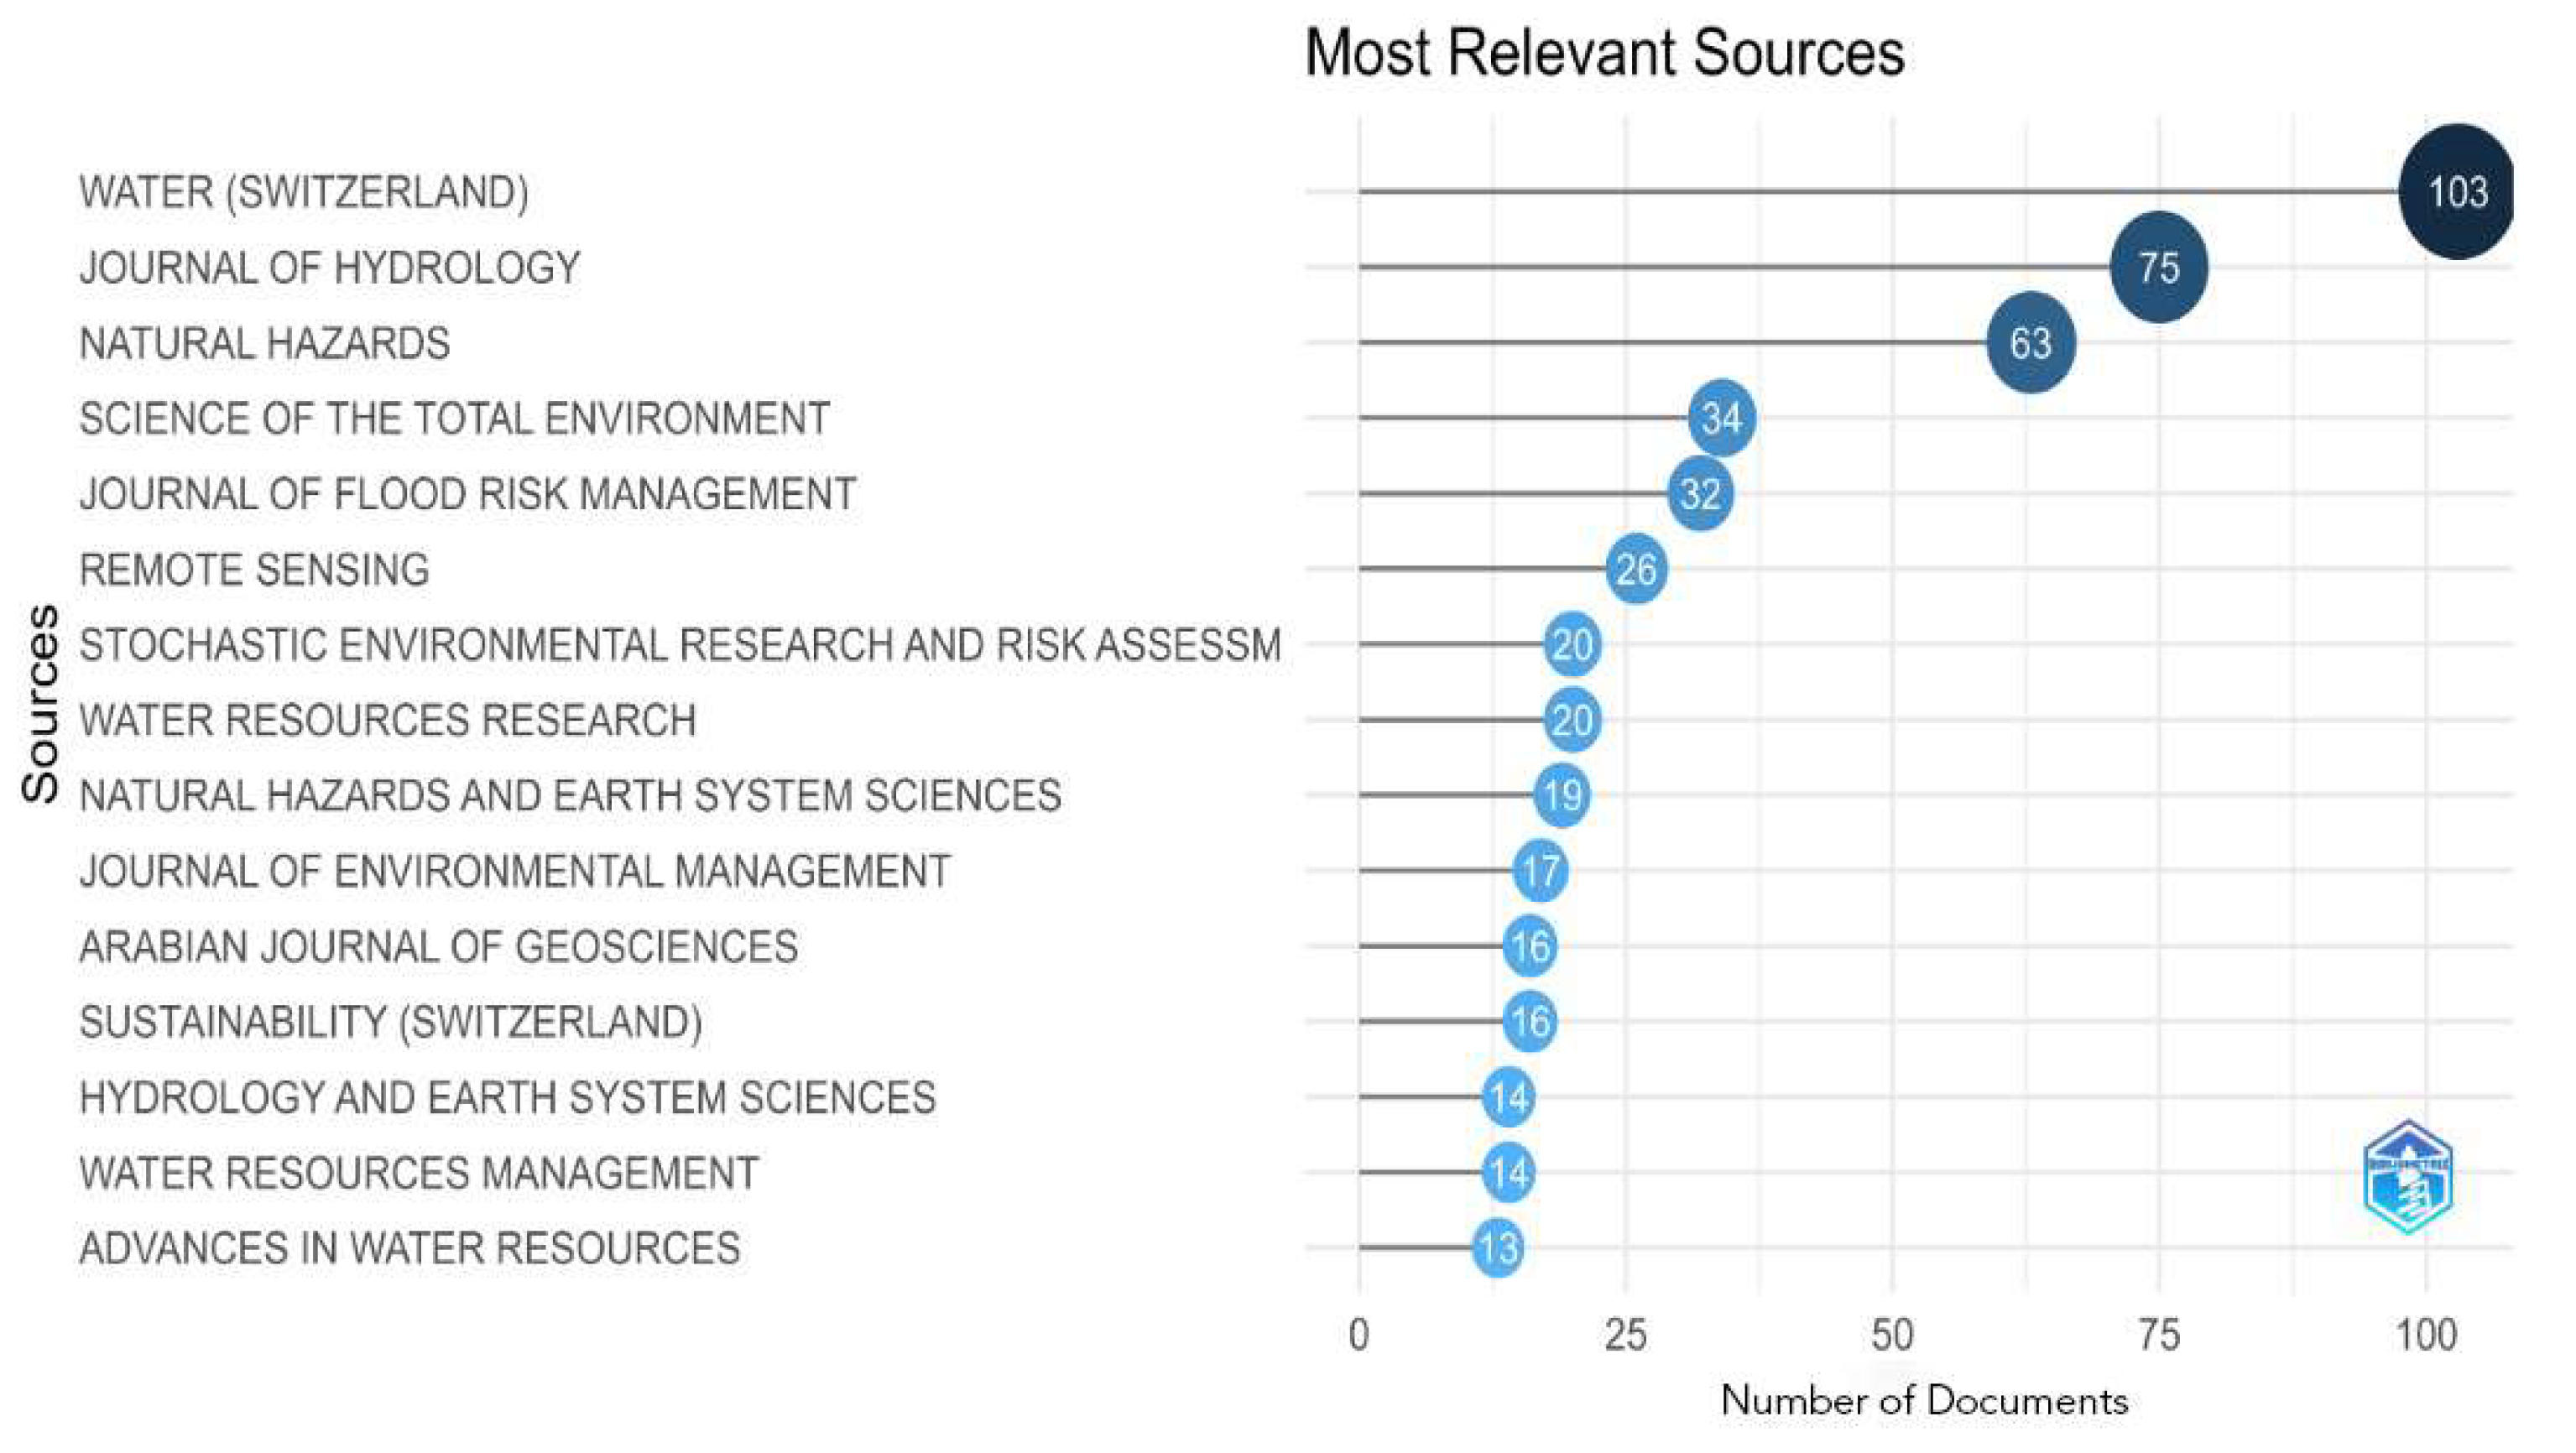
3.1.3. Most Relevant Sources
Figure 4 presents the top 15 most relevant journals that active researchers in Flood prediction published. Water (Switzerland), Journal of Hydrology, Natural Hazards, Science of Total Environment, and Journal of Flood Risk Management are the top five journals active researchers in flood risk-related topics publish inactive researchers in flood risk-related topics. All five journals account for 27.88% of the 1,101 studies examined.
3.2. Evolutionary Trends in Flood Prediction
3.2.1. Trending Topics
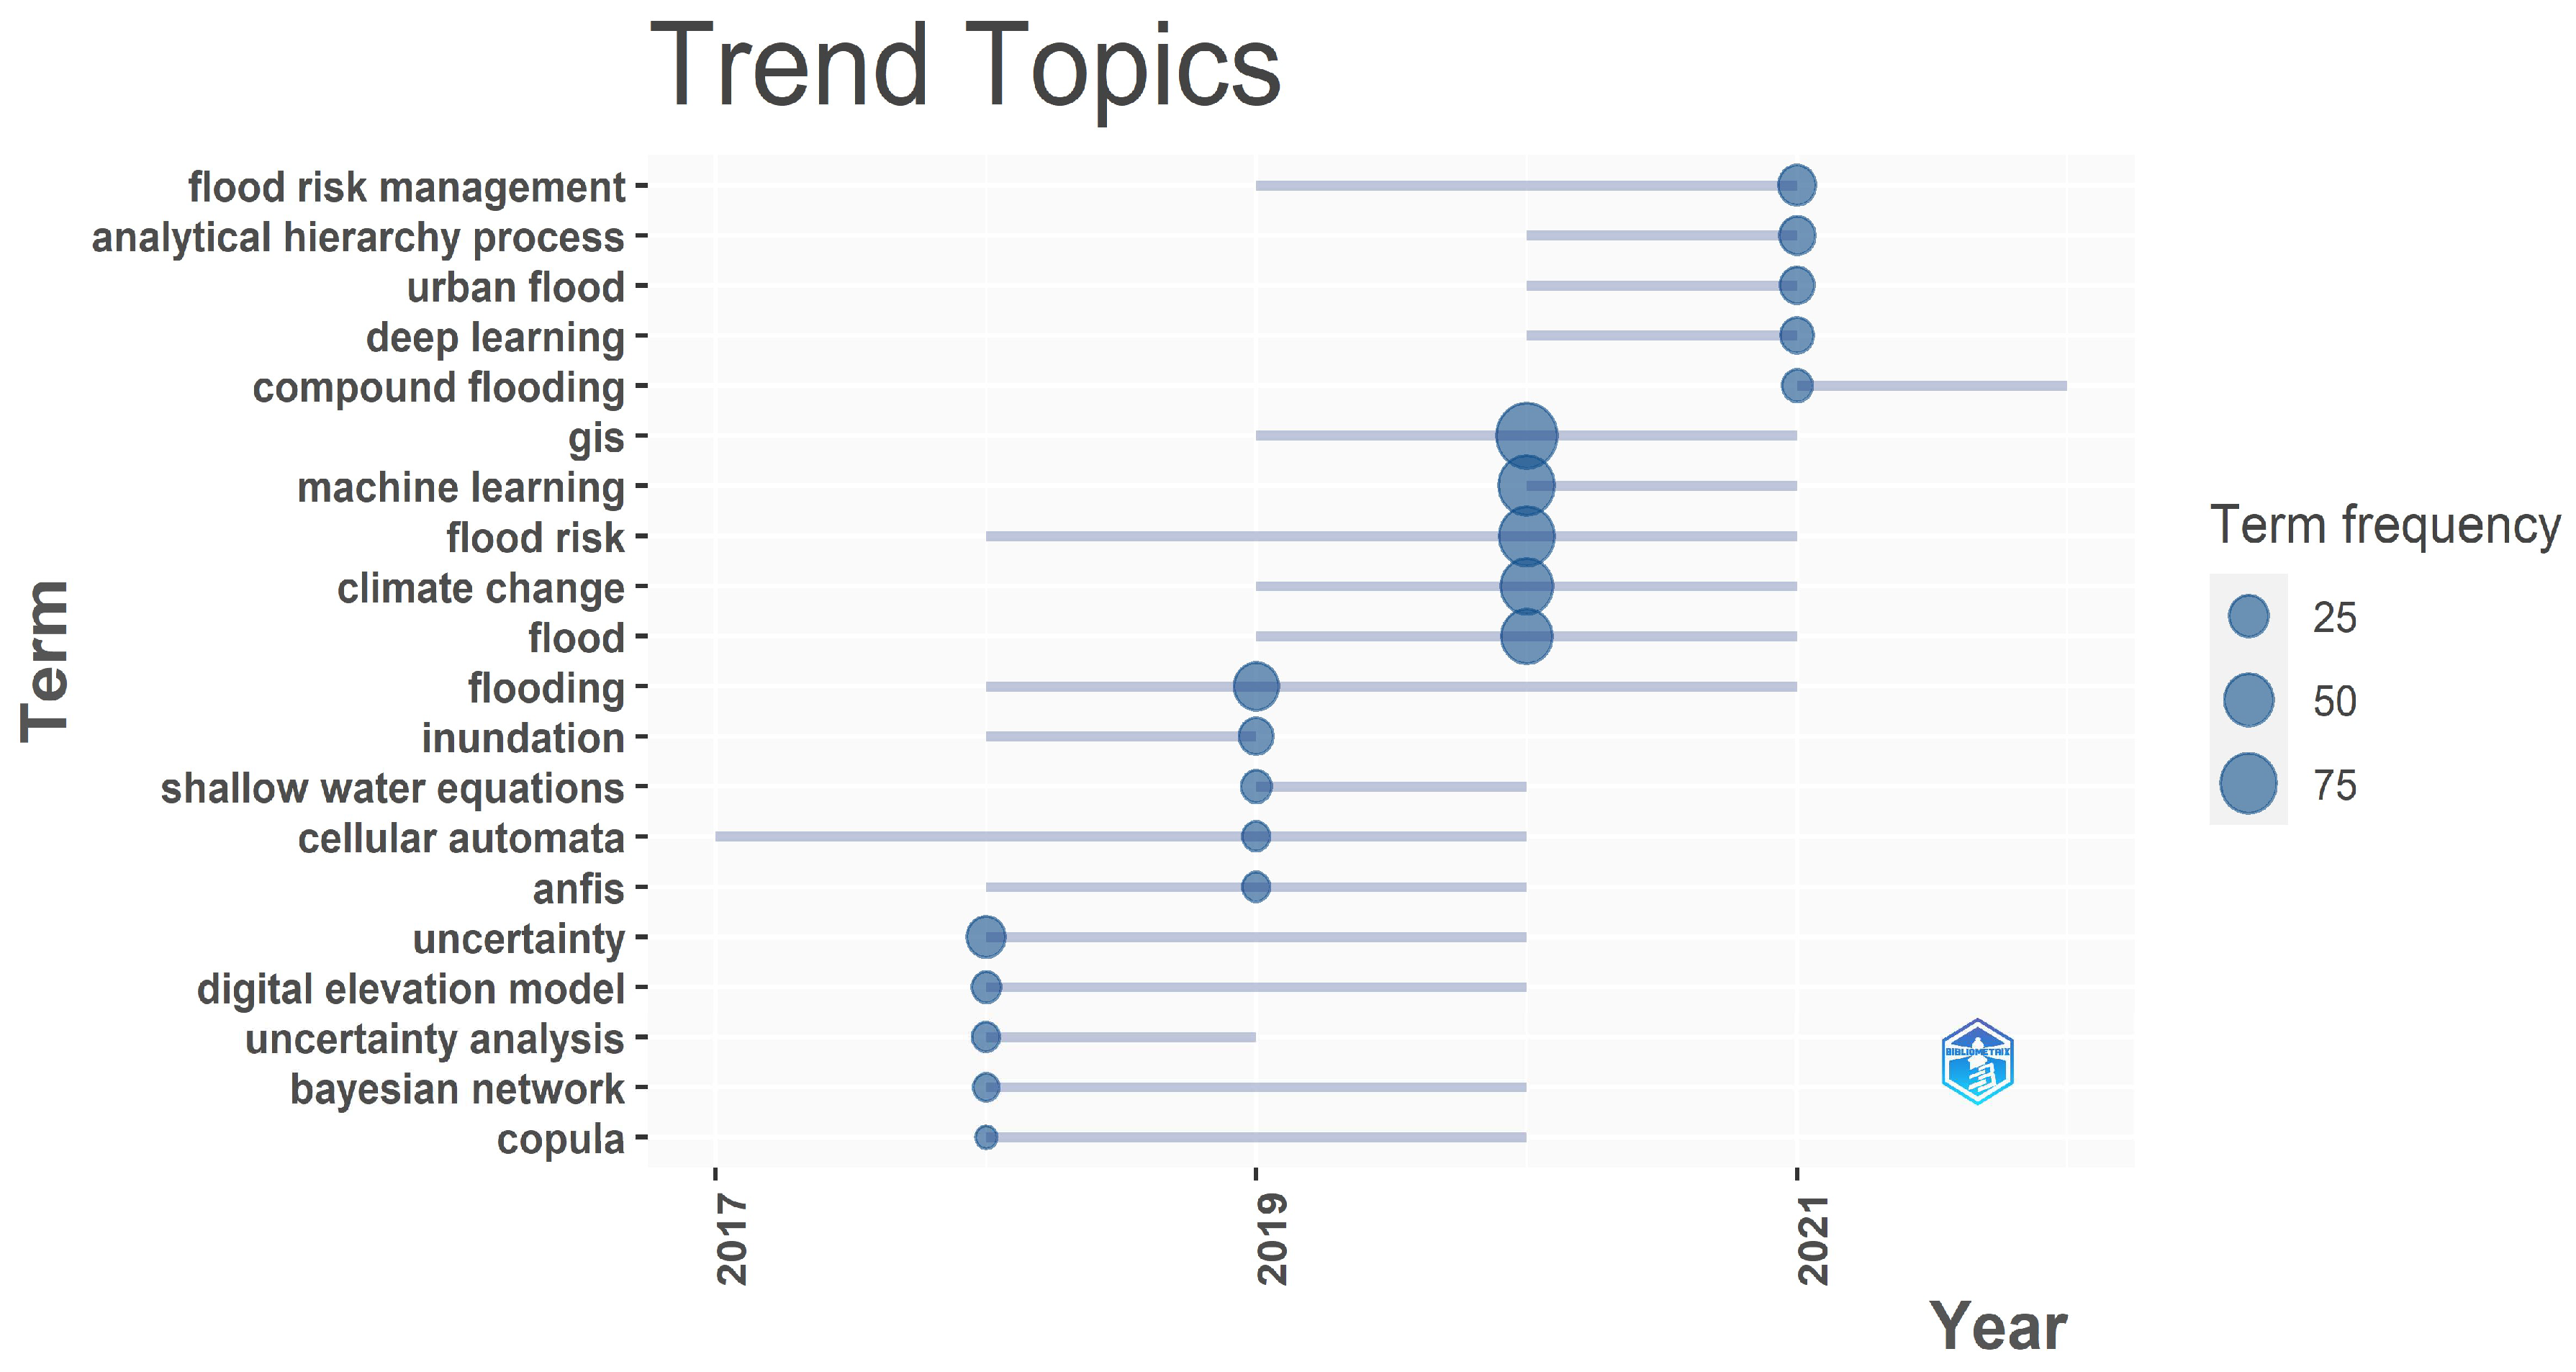
A trend topic analysis was conducted by further analysing the keywords used by authors to reflect their topic interests. The trend topic plot in Figure 5, created using the primary keywords used by the authors of the publications, demonstrates a gradual change in the approach to flood prediction from 2017 to 2022. Articles published between 2017 and 2022 were used to generate trend topics. The graphical parameters setting used in the analysis are the author’s keywords with a minimum word frequency of 5, and the number of words to be considered per year is 5. The lines reflect the years in which that term was used; a bubble on the line emphasizes the most frequent instance of that word being used in that year. The size of the bubbles indicates the frequency with which each term is researched; the more significant the bubble, the more frequently it is researched.
It is interesting to observe how the trend was generated. In 2018, the most frequent word was “Uncertainty”, then “Digital Elevation Model”, followed by “Uncertainty Analysis”, “Bayesian Network”, and finally “Copula”, then the research evolved. In 2019, “Flooding”, “inundation”, “shallow water equations”, “Cellular Automata”, and “ANFIS” were explored more. In 2020, there was almost equal attention to the keywords “GIS”, “Machine Learning”, “Flood risk”, “Climate Change”, and “Flood”, then “Flood risk management was the centre of attention in 2021, followed by “Analytic Hierarchy Process”, “Urban Flood”, “Deep learning”, and “Compounding flooding”.
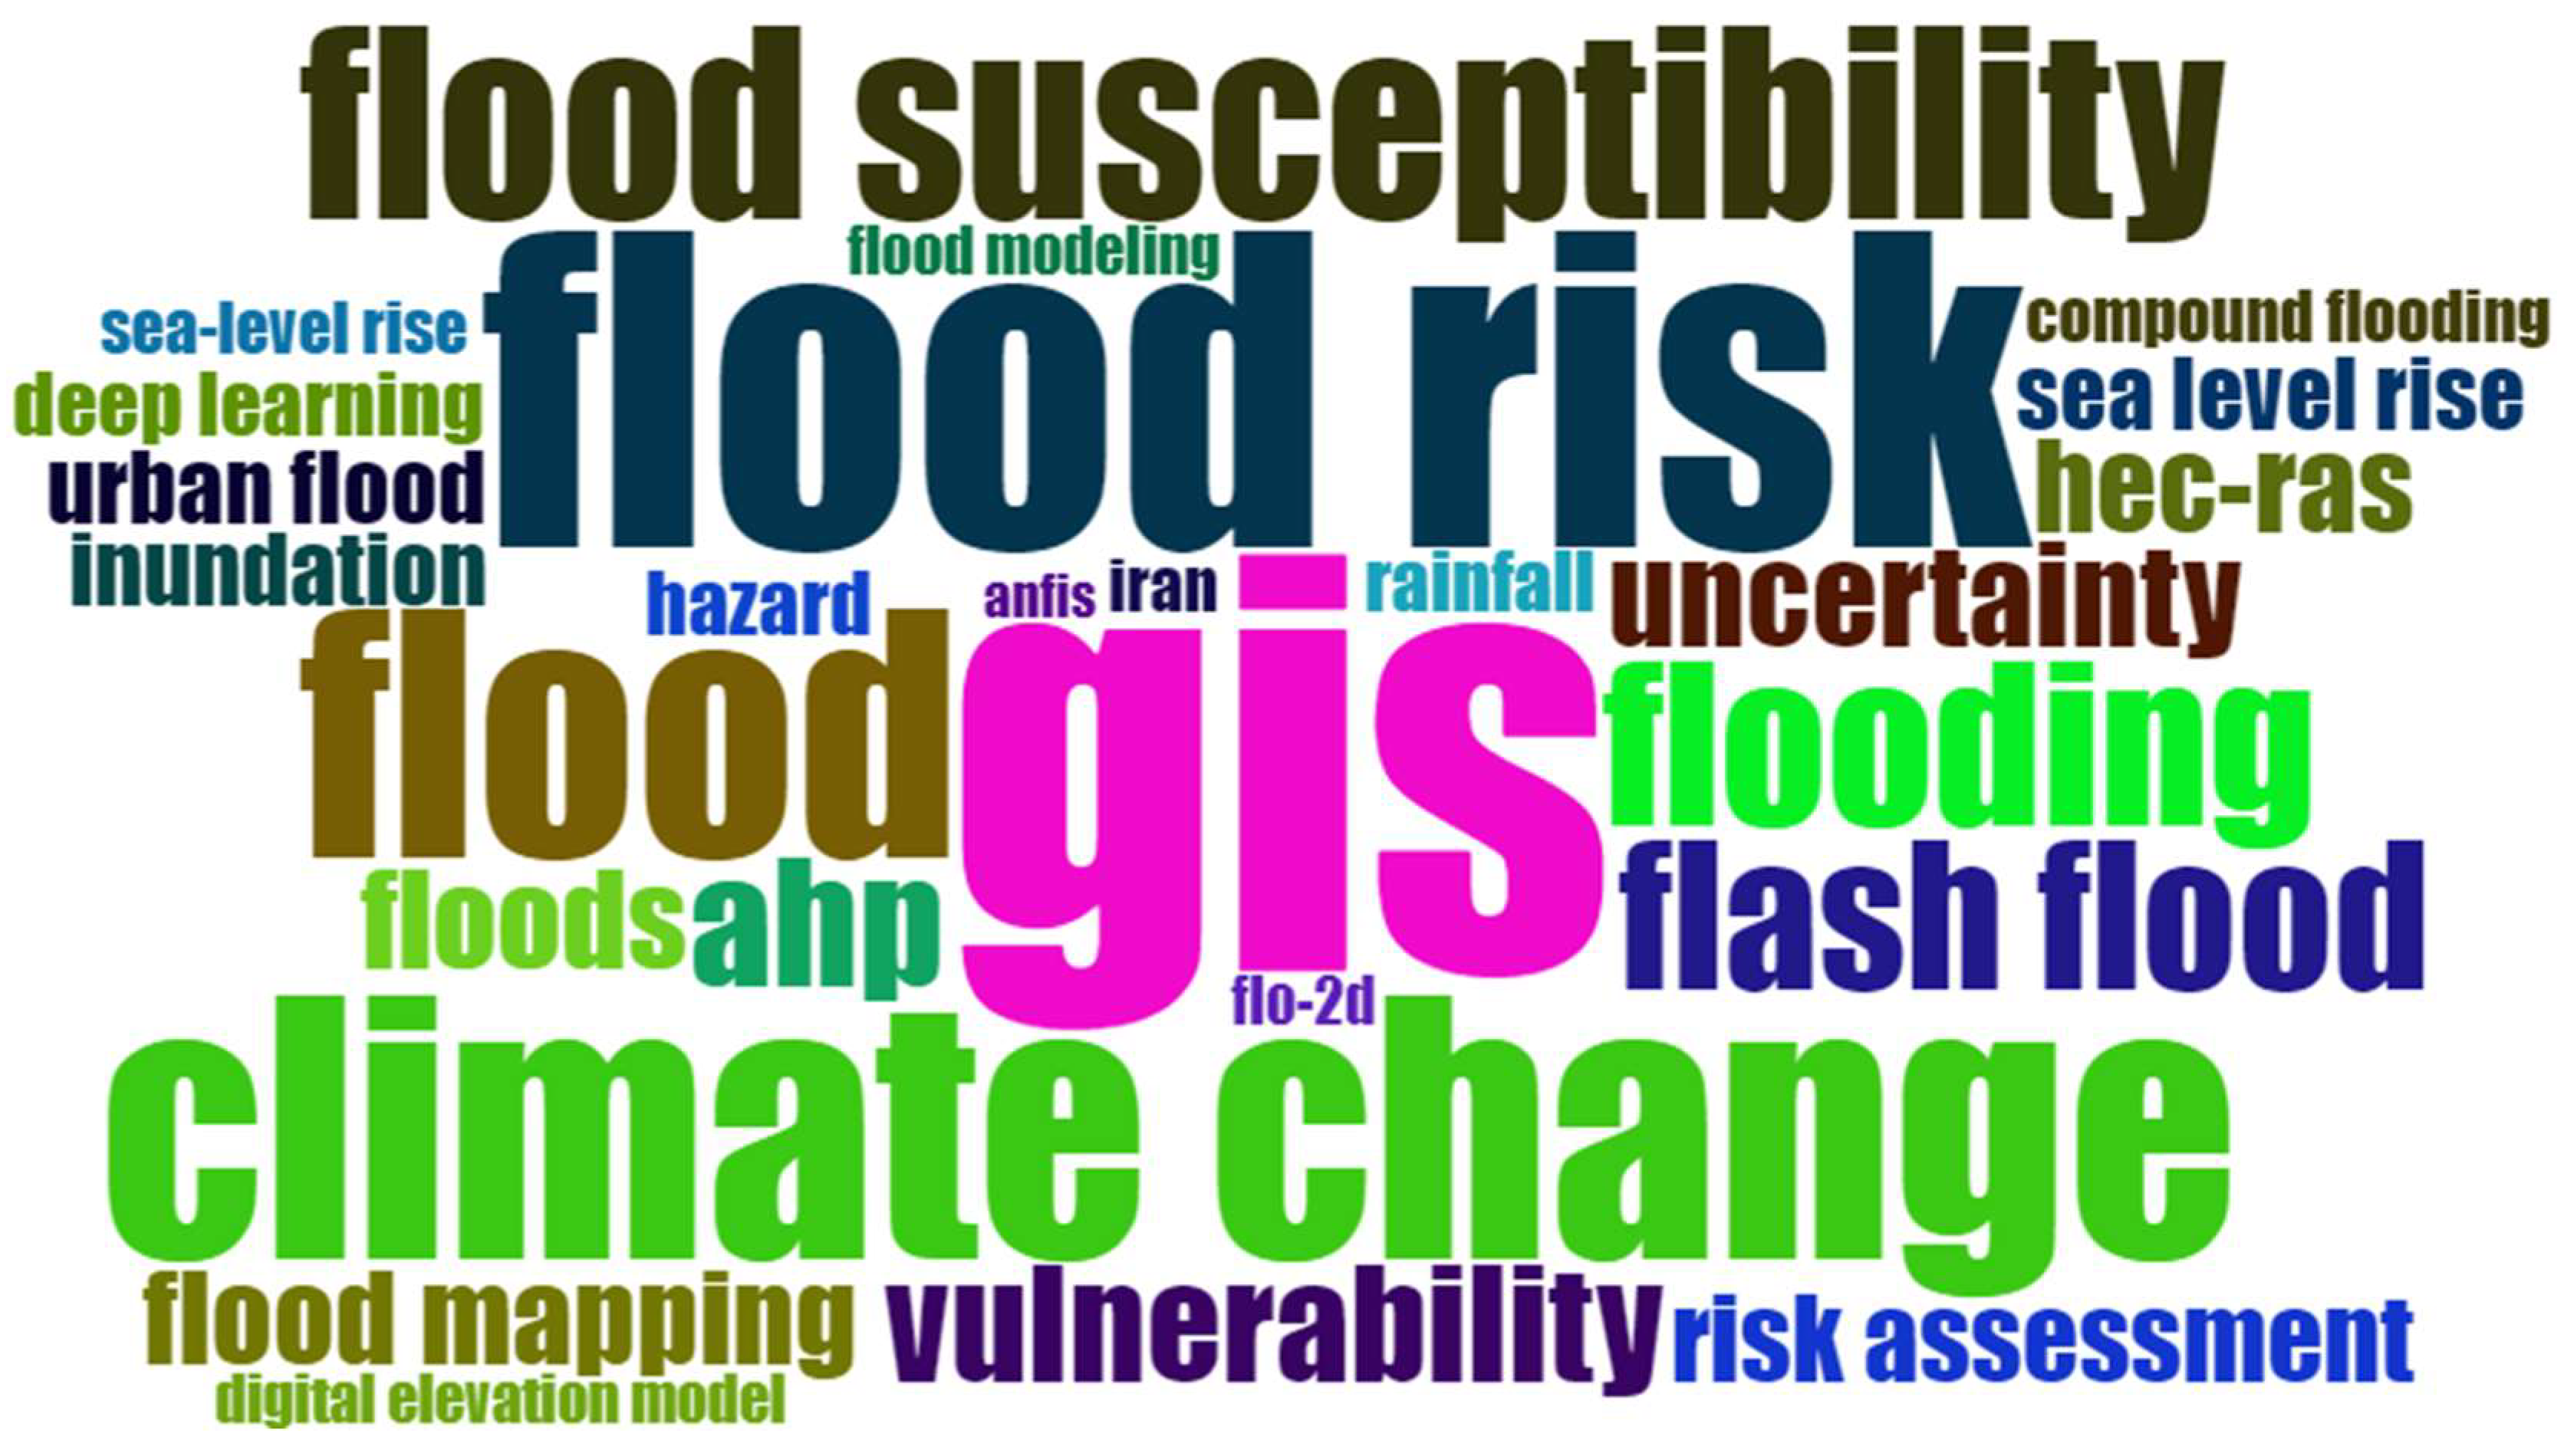
The trend topic shows a change point in the approaches to flood prediction. In 2018, the concentration of the research was on dealing with the uncertainty of the flood hence the use of tools based on probability theory: Bayesian Network and Copula. The focus changed in 2019 to mapping flood inundation using tools like cellular Automata, shallow water equations and an Adaptive neuro-fuzzy inference system. GIS with integrated Machine Learning tools became prominent in flood prediction in 2020, while Analytic hierarchy process and deep learning tools emerged in 2020 and became prominent in flood prediction in 2021. Figure 6 emphasizes the importance of GIS in flood susceptibility, flood risk and climate change research.
3.2.2. Keywords Co-Occurrence
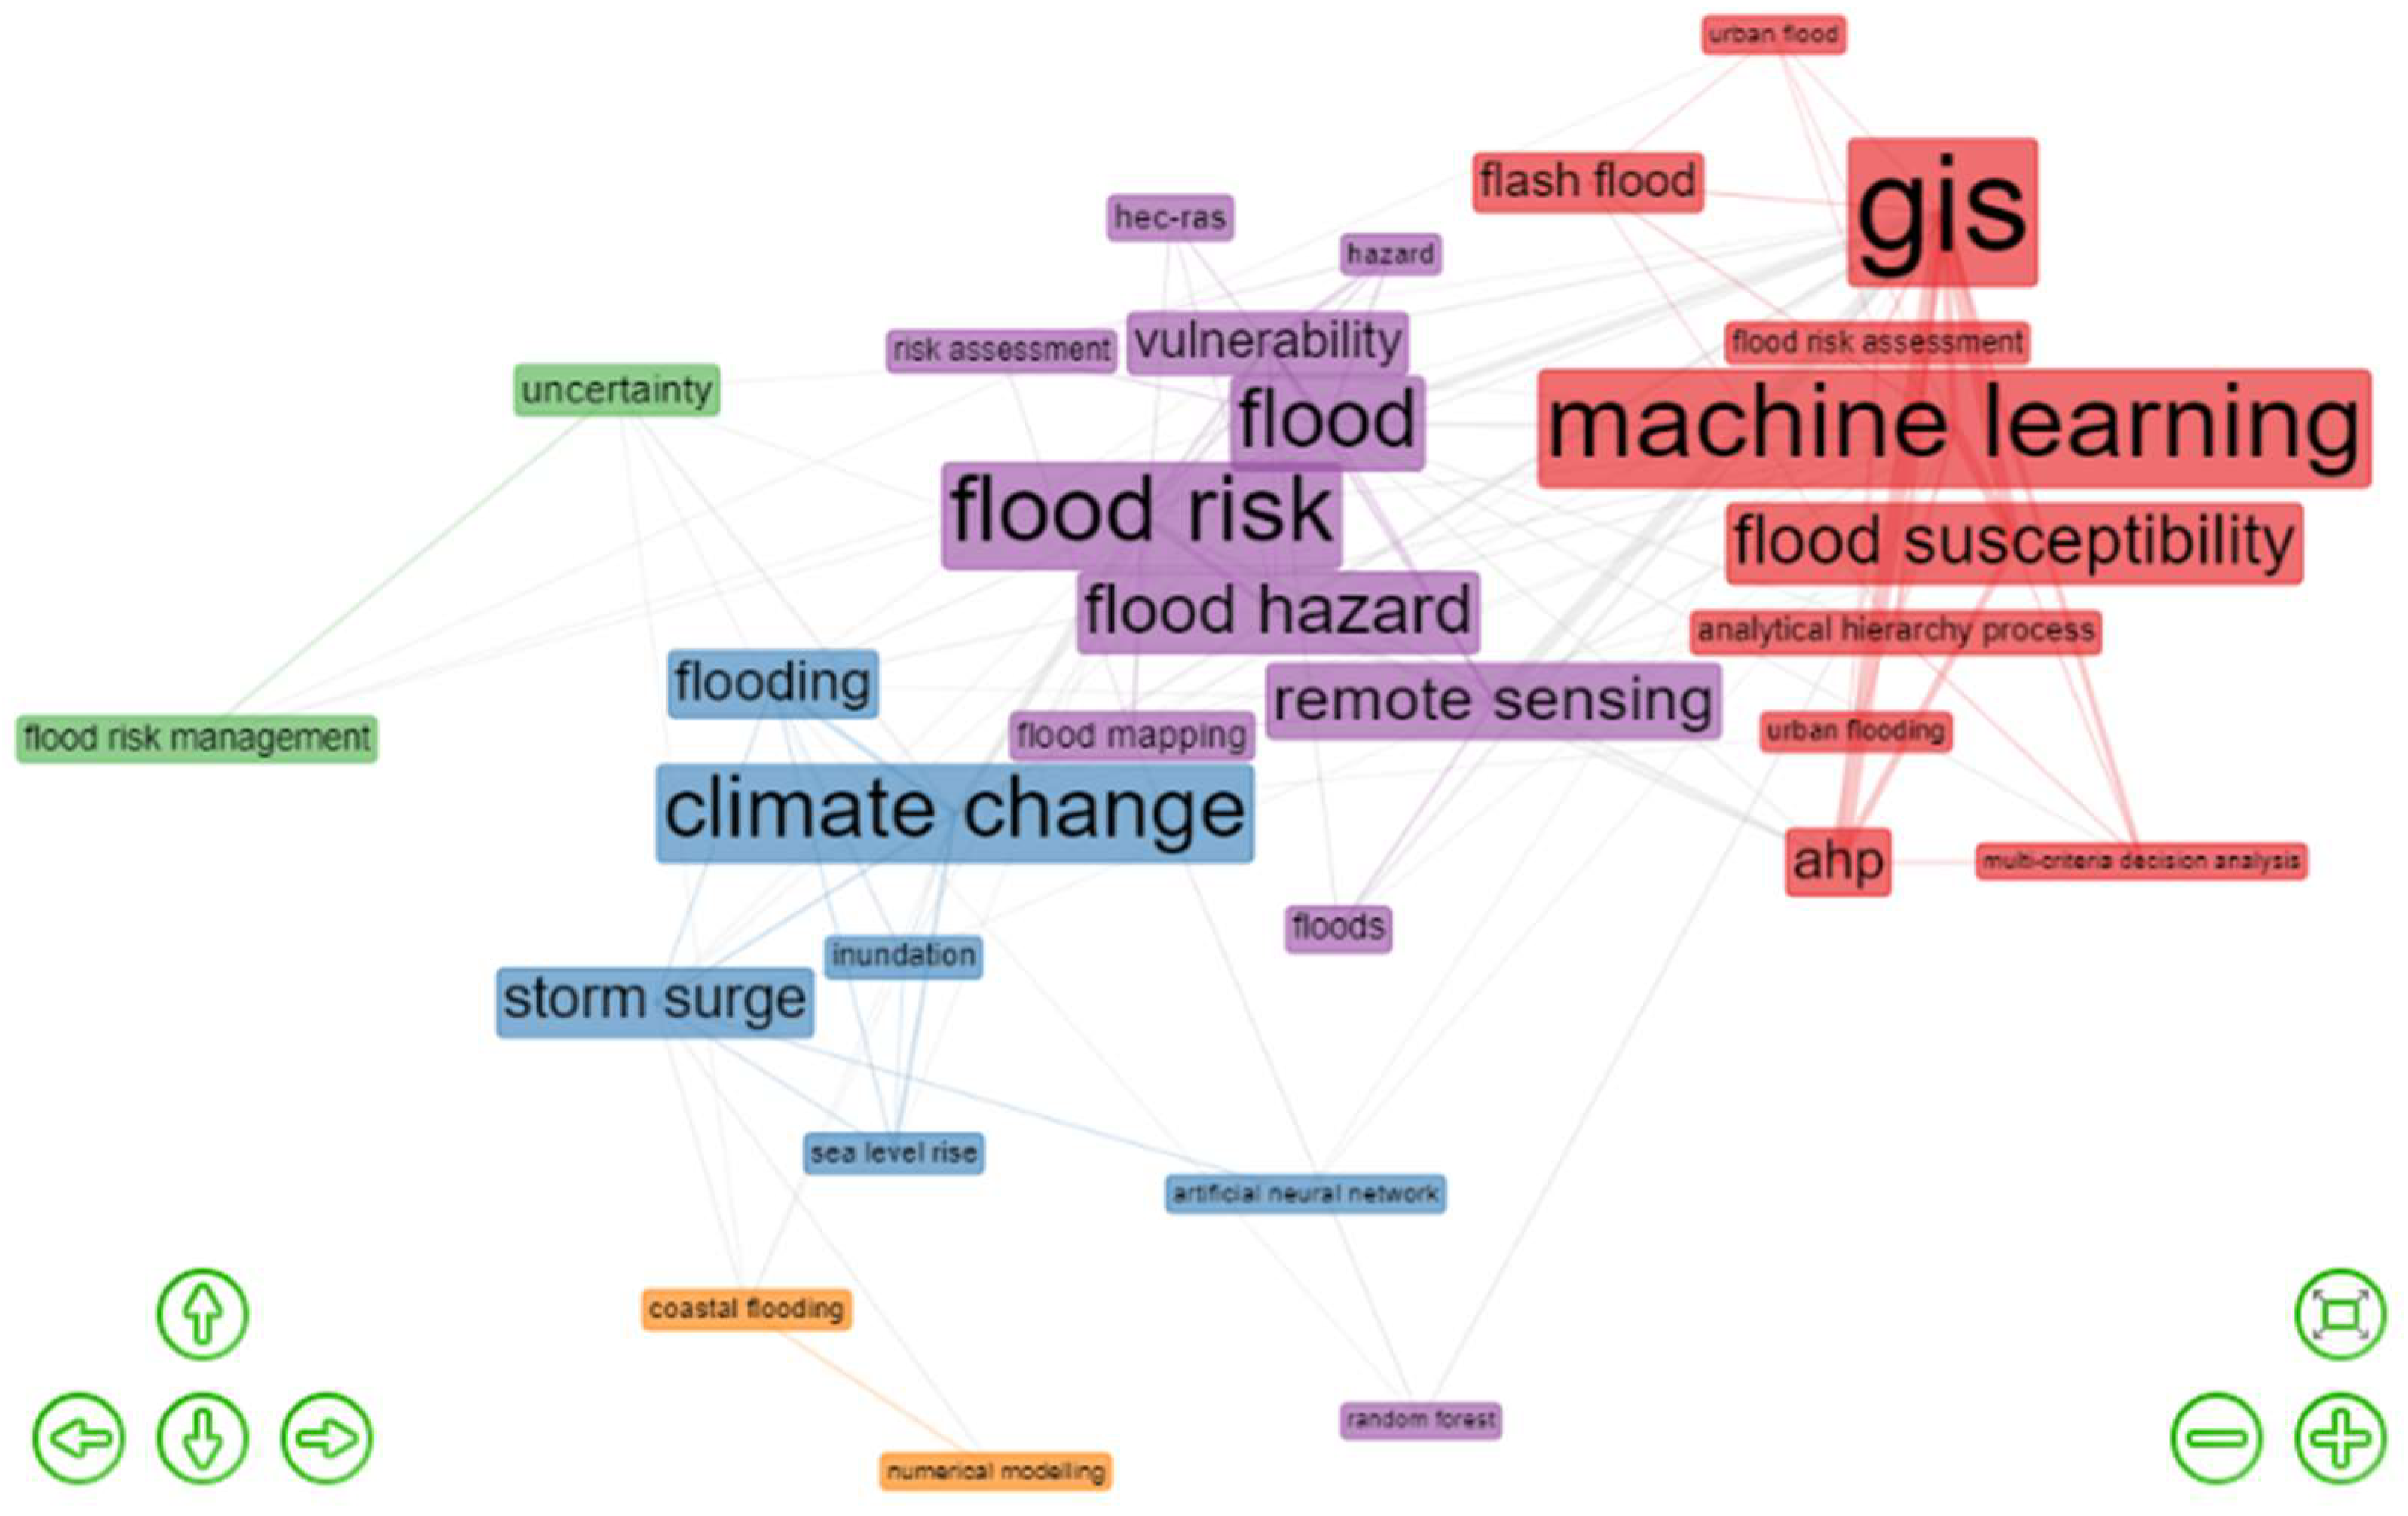
The co-occurrence map was created using the 30 most recurring authors’ keywords extracted from the articles included in this study. Authors, like abstracts, use keywords to direct attention to their articles and help describe their works’ focus. Themes in the collections can be better understood or aggregated by analyzing or mapping the authors’ keywords in the data frame. The co-occurrence of keywords is another semantic similarity measure; this is important for determining the context of words used across the network. The co-occurrence network of authors’ keywords is shown in Figure 7. Additionally, co-occurrence analysis provides valuable Information on other emerging subjects in the researched area and the connections among the main topics discussed in our dataset. The keyword co-occurrence map primarily visualizes the occurrence of terms based on their prevalence and the evolution of their popularity over time. The keywords are nodes and links between two words if mentioned in the same publication. The thickness or wideness of a node or label reflects the number of contributions in which the pair appears, and the colours reflect keywords with consistency among them. Five clusters are recognized:
- (1)
- the red cluster focuses on keywords related to hazards like storm surges, sea level rise, climate change, flooding, and uncertainty.
- (2)
- the green cluster focuses on keywords tools for risk assessment, random forest, flood mapping, HEC-RAS, remote sensing and so forth.
- (3)
- the blue cluster focuses on types of flooding and tools like urban flooding, flashing flooding, GIS, machine learning, multi-criteria decision analysis, analytic hierarchical process and so forth.
- (4)
- the violet cluster has two keywords of numerical modelling and coastal flooding and
- (5)
- the orange cluster with uncertainty and flood risk management.
3.2.3. Mapping Conceptual Structure: Factorial Analysis
Co-word Analysis is a technique for analyzing the co-occurrences of keywords and mapping and clustering terms extracted from bibliographic metadata such as keywords, titles, or abstracts to examine the interdependence among categorical variables and emerging research trends in the disciplines under study. Co-word analysis can be performed through dimensionality reduction techniques such as correspondence analysis (C.A.), multidimensional scaling (MDS) and multiple correspondence analysis (MCA). The analysis was conducted using Multiple Correspondence Analysis (MCA), to create a map of the field’s conceptual structure. We also used K-means clustering to group related concepts together. K-means clustering was used over hierarchical clustering because the K-means approach determines the clusters based on euclidean distances, is simple to implement and interpret and is best for large datasets. MCA is a method for graphically and mathematically assessing sets of categorical variables. Through this method, we can learn more about the relationships between a group of categorical data and identify previously unknown latent components. The result is interpreted by looking at the proximity of the displayed words in Figure 8, which measures how similarly distributed the words are. Data dimensions are reduced with this strategy, allowing for two-dimensional displays to highlight commonalities. Research topics that are less frequently discussed are represented by terms more evenly dispersed around the map. In contrast, terms closer to the map’s centre have received increasing attention in recent years. The conceptual structure map identifies two clusters of keywords (Figure 8):
- the “Red cluster” has over 40 keywords, including Artificial Neural Networks, numerical modelling, Hydrologic Engineering Center’s River Analysis System (HEC RAS), GIS, Remote Sensing, flood risk management, storm surge, coastal flooding, uncertainty, sea level rise, and so forth. In addition, we can identify main themes associated with flood prediction, like analysis tools, data, natural hazards, and disasters.
- the “Blue cluster” has 3 keywords associated with probabilistic tools: Analytic Hierarchal Process (AHP), Multi-criteria decision analysis and flood susceptibility.
From the MCA, we could speculate that the red cluster represents a more relevant and trending topic than the other cluster since the keywords contained in this cluster are more than in the blue cluster.
3.2.4. Thematic Mapping
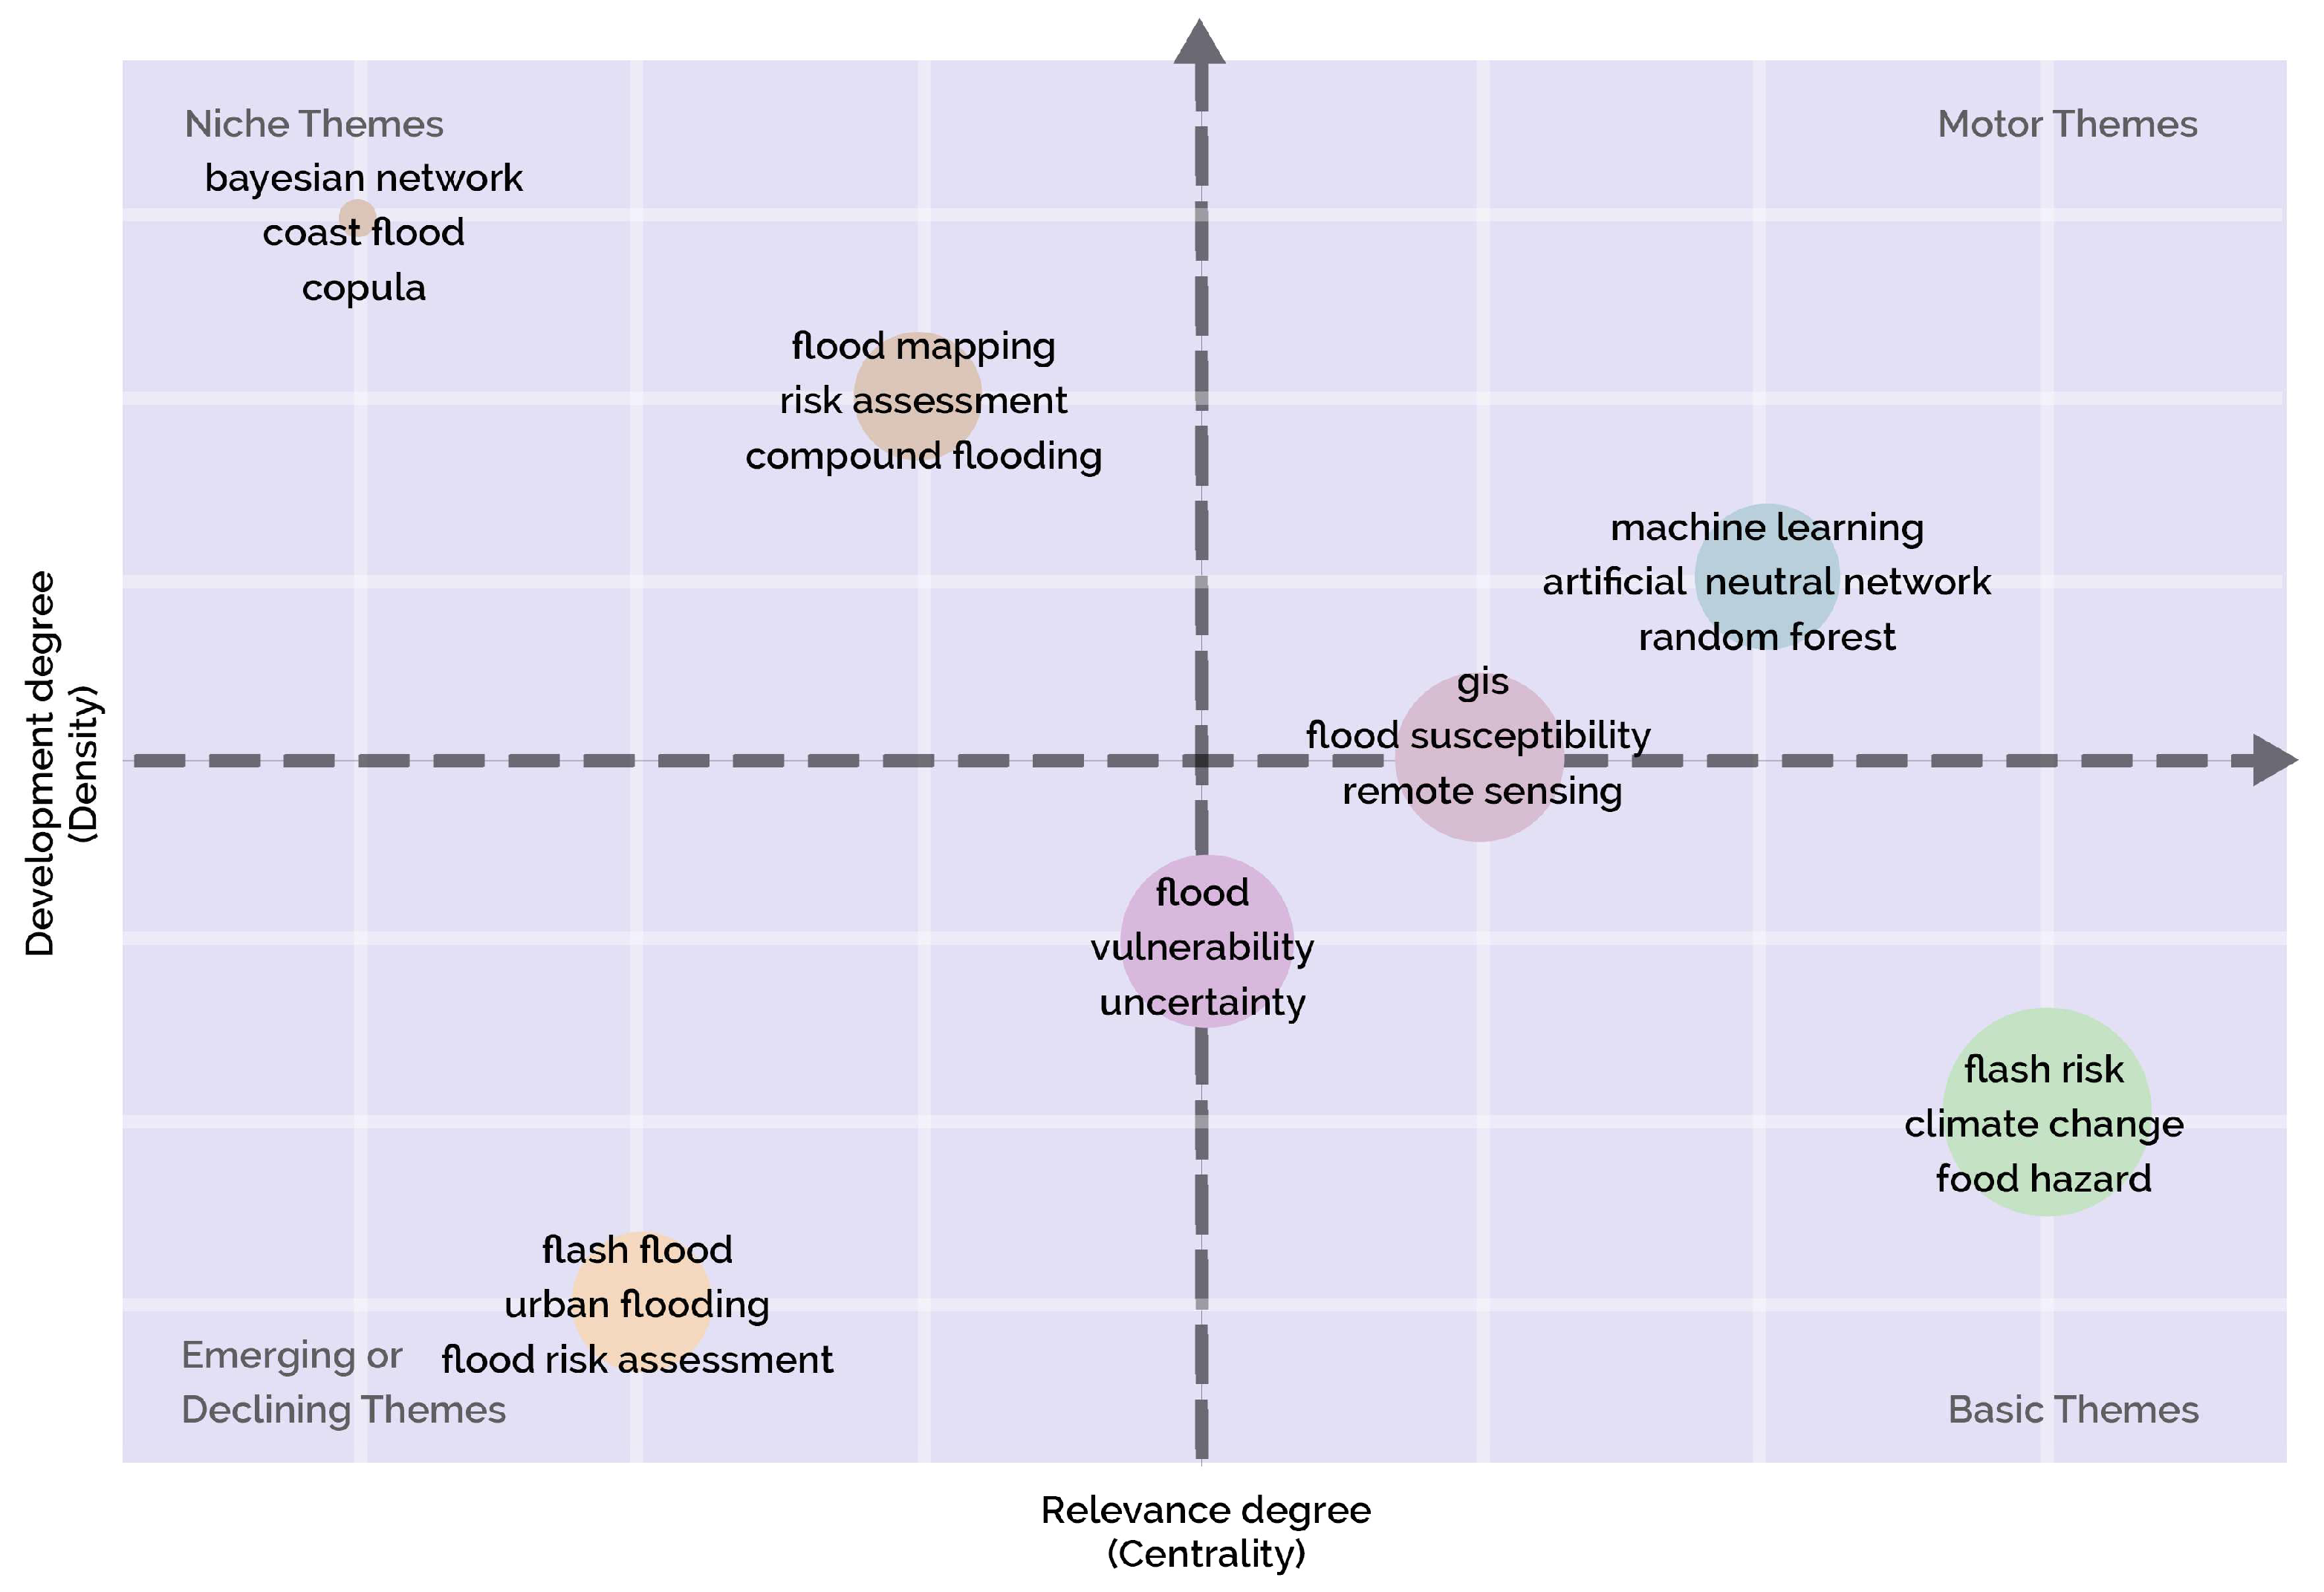
Thematic map illustrating clusters and Author’s Keywords from 2017 to 2022 determined by the co-occurrence network. The X-axis indicates the centrality of a network cluster (i.e., its degree of interaction with other clusters) and, thus, the theme’s prominence [73]. The Y axis represents density (i.e., it quantifies the internal strength of a cluster network, which can be interpreted as a proxy for the theme’s development) [73]. Accordingly, the first quadrant identifies motor themes (i.e., well-developed and significant themes for structuring a research field). In contrast, the second quadrant identifies highly developed and isolated themes (i.e., themes of limited significance for the field). The third quadrant identifies emerging, or declining themes (i.e., themes that are weakly developed and marginal), and the fourth quadrant identifies fundamental and transversal themes (i.e., they concern general topics that are transversal to different research areas of the field) [73].
In the thematic map in Figure 9, seven clusters were identified in the four quadrants with axes, namely the Relevance degree (Centrality) and Development degree (Density). A cluster with higher values of centrality and density is positioned in the first quadrant, known as “Motor or Hot Themes”. It included words like Machine Learning, Artificial Neural Network and Random Forest as the most recurrent tools in the literature. This implies a well-developed and vital tool in flood prediction research. A second cluster with good values for both centrality and density is another well-developed (used) tool that includes GIS and Remote sensing, with flood susceptibility as the most co-occurring words. Finally, flood risk, Climate Change and flood hazard are in the second quadrant, known as “Basic Themes”. A low centrality and high density characterize them. This implies a well-developed area of research but is limited in importance to the flood prediction tool since they are not tools but the phenomenon of measure.
The Bayesian Network (B.N.) cluster, Copula and Coastal flooding, is characterized by very high centrality and very low density, which indicates a tool well-developed and widely used in other fields of prediction but least used in flood prediction or forecasting. The map also indicates a close association between Coastal Flooding, B.N. and Copula tools.
3.3. Spatial Distribution of the Research
The data extracted shows the research covered every continent from 73 unique countries with 1062 articles representing 96.46% of mentioned locations and shown in Figure 10 and Figure 11, with Asia having 393 articles representing 37.01%, with Europe placing second with 380 articles (35.78%), 175 (16.48%) for North America with only USA and Canada, 44 (4.14%) for Africa, South America and Australia accounting for 31 (2.92%) and 39 (3.67%) respectively. Following the analysis, we found China and USA were the most researched areas, with 156 and 141 publications, respectively. Africa has its most publication from Algeria and Morocco with 7 each and Nigeria and Egypt with 6 and 5 respectively. Ghana has two (2) publications which look to map flood-prone and hazardous areas using Landsat images and random forest (Machine Learning) in Nasia watersheds, and the second used Analytical Hierarchical Process (AHP) and Multi-criteria methods (MCM) (Probabilistic Models) in Densu watersheds in Ghana. The analysis revealed that the African, Australian and South American regions are underrepresented in flood prediction research.
4. State-of-the-Art Review of Flood Prediction Tools
Scientists, through time, have been studying the processes involved in natural disasters like flooding, which is of utmost importance to many due to its increased occurrence [74]. Through research, flooding risk has been understood from mathematical equations (De Saint Venant (S.V.) equations [75] and, recently, computer models. The purpose of the models is to assess, test possible scenarios and predict their occurrence, which will aid in developing strategies for mitigating their impact.
4.1. Machine Learning in Flood Prediction
Machine learning is the ability of a computer to grasp data structures mathematically or statistically [76]. The basic component of a machine learning model consists of (1) data extraction, (2) preprocessing and feature selection, (3) building the model (choice of algorithm), (4) training, (5) evaluation, (6) testing or prediction, as shown in Figure 12. In machine learning (ML) flood prediction models, historical flood records are combined with real-time cumulative data from various rain gauges or other sensing devices. The dataset mainly consists of rainfall and water level data collected using terrestrial rain gauges and recent remote sensing technologies, such as satellites, multisensory systems, and radars [77,78]. Other data inputs for flood prediction include the area’s slope under consideration, atmospheric pressure, geomorphology, land use, river density and proximity, and so forth. Data for coastal flooding may include bathymetry, tides, current and wave heights, and so forth. Individual data sets are trained, validated, verified, and tested to accomplish the model construction. Machine learning approaches are easy to hybridise to form new techniques that will harness the strength of each method. Ref. [27] indicated that the main weaknesses in ML approaches are related to accuracy, uncertainty, performance, and resilience and suggested hybridising them to improve their capability. The various ML models and flood modelling strategies are extensively detailed in the following paragraphs.
4.1.1. Neural Networks
Neural Networks are mathematical models that consist of a collection of small computing units interconnected by a network of connections [79]. Neural networks are currently widely applied in various research fields due to the networks’ ability to attempt to imitate the capabilities of human brains [80,81,82], which enhances their performance [83]. Since the turn of the century, neural networks have been utilised as a theoretically viable alternative to physical-based conventional models [84]. While using machine learning models, the Artificial Neural Network (ANN), the umbrella architecture for all neural networks [85], appears to be a good alternative. ANN is a crucial component of machine learning research and development nowadays. Since the 1990s, ANN algorithms have been the most widely used flood prediction approach due to the high fault tolerance and accurate approximation of outcome [27]. Compared to most conventional models, ANN has the best generalisation ability and speed of any modelling technique [27]. In flood prediction, ANN will be preferred to hydrodynamic models because ANN provides a fast and flexible data integration technique in model development and analysis [86]. Hence as concluded by [87], ANN is a simple, cost-effective, and reliable way to predict floods accurately. In contrast with other predictive models, ANN does not place constraints on input variables like knowing how distributed a variable is [88]. ANN has been applied in forecasting the likelihood of flooding at Dangola Station, Sudan [86], storm surge and typhoon floods in Longdong northeastern Taiwan [89]; determining river flow time series in Three Gorges and Gaochang, China [90], rainfall-runoff analysis in Hoshangabad Basin, India [91], streamflow forecasting in Western USA [92], flowing estimation in Mino-Sil and Segura water basins in Spain [93] and water quality prediction in Johor River, Malaysia [94].
4.1.2. Trees-Based Models (TbM)
The trees-based algorithm is among the most effective machine learning algorithms because it is simple, easy to understand, does not need parameters, and can handle data of different types [22,95,96]. In a tree-based algorithm, a decision tree is made from a set of labelled training instances, shown by a tuple of attribute values and a class label. First, the training data are split into separate subsets based on the values of the splitting attribute. Then, the algorithm goes through each subset in a loop until all the instances in a subset belong to the same class [97]. Since TbM are fast algorithms, they became prevalent in analysing and simulating group floods. Some TbM used in flood modelling in the literature include the Classification and Regression Tree (CART) applied in Iran to predict precipitation [98], the application of Random Forests in evaluating short-term daily streamflow in rainfall and snowmelt-driven watershed in Pacific Northwest region (USA and Canada) [99], application of Logistic Model Tree (LMT), Reduced Error Pruning Tree (REPT) and Alternating Decision Tree (ADTree) to model flash flood susceptibility in Iran [100] and flash flood susceptibility modelling using naïve Bayes tree (nBT) in the United Arab Emirates [101].
4.1.3. Support Vector Machine (SVM)
Support Vector Machine is a supervised learning machine that uses the statistical learning theory and the structural risk minimisation rule [102]. SVM’s training process assigns new non-probabilistic binary linear classifiers that minimise empirical classification error and maximise geometric margin [103]. SVM uses previous data to predict the future. SVMs are effective ML algorithms for flood prediction [104,105]. Hydrologists favour SVM and SVR over ANNs for flood prediction [27]. Thus, they are employed in several flood prediction instances with promising findings, excellent generalisation ability, and better performance than ANNs, for example, extreme rainfall, precipitation, rainfall-runoff, reservoir inflow, streamflow, flood quantiles, flood time-series, and soil moisture.
4.1.4. Ensemble Prediction System (EPS)
Ensemble Prediction Systems are finite sets of different models that offer more flexibility. EPS are efficient for N forecasting systems. N is the number of model probability distribution realisations [27]. EPS uses multiple ML algorithms and an automated assessment and weighting mechanism to improve performance [27]. Weighting speeds up performance evaluation while managing and evaluating ensemble algorithms quickly and automatically. As a result, EPS can increase flood modelling performance. As classifier ensembles, EPSs may employ numerous fast-learning or statistical methods, such as ANNs, MLP, D.T.s, rotation forest (R.F.) bootstrap, and boosting, enabling greater accuracy and robustness [27]. Based on the prediction rate, ensemble prediction systems can be used to quantify flood likelihood. Verifying probability determines the quality of ML ensembles.
4.1.5. Examples of Machine Learning Applications in Flood Prediction
- Case Study 1: Flood Susceptibility Mapping using Convolutional Neural Network Frameworks
The study by [106] proposed the use of the conventional neural network (CNN) to assess flood susceptibility in China’s Shangyou County. The model was constructed with inputs from 13 triggering factors, namely: normalised vegetation difference index (NDVI), topographic wetness index (TWI), rainfall, soil, land use, stream power index (SPI), sediment transport index (STI), altitude, slope, aspect, curvature, lithology and proximity to rivers. These factors were related to the historical flood events in Shangyou County. The proposed model produced a more reliable result of AUC 0.022–0.054 higher than the Support Vector Machine (SVM)-based model. The CNN model was able to improve the prediction capabilities of the SVM model by 0.021–0.051 AUC. The significance of the study was that the authors proposed a method that can enhance mitigation and the management of flood events.
- Case Study 2: Deep Learning Data-Intelligence Model Based on Adjusted Forecasting Window Scale: Application in Daily Streamflow Simulation
In this study, [107] applied the Long Short-Term Memory (LSTM) model in Tensorflow to predict the rate of flow of water from the Kelantan river in the northwestern region of Malaysia Penisula. The developed model tries to predict the flow rate of the river using daily rainfall and flow rate data acquired from the hydrological stations in the study area. The study observed the following: (a) the developed LSTM model captured accurate streamflow time series and also performed better than other ML models whether the stream was smooth in the dry season or highly fluctuated in the rainy season; (b) the performance and the convergence speed of the LSTM model’s prediction improved with increases in training data sets; (c) according to performance indices, extending the training set alone cannot optimise the prediction performance of the generated LSTM model. The LSTM model may overfit data; (d) the model was observed to be less sensitive to missing historical data. This is a major advantage to using the model, especially in areas where there are inconsistencies in historical records; and (e) although the stability and accuracy of the prediction performance of the developed LSTM model slightly decrease as the time spans become larger, from the perspective of performance indices, each experimental group can also obtain good prediction results that still meet the requirement for high-accuracy streamflow prediction. This capability allows the LSTM model to forecast streamflow over various timescales.
4.2. Numerical Modelling in Flood Prediction
Numerical modelling is primarily related to the procedures used to mathematically solve a set of equations (algebraic or differential equations). Numerical models visualise and simplify the complexities in the physical systems and estimate accurate spatio-temporal changes over large areas [108]. The process involved in numerical modelling includes: 1. With the suitable assumption formulated, construction of the physical problem into a mathematical model; 2. development of a suitable numerical model; 3. implementing the model to obtain results; 4. the results propose feasible solutions by analysing charts, tables, graphs and animation derived from the results [108]. Due to these advantages, numerous numerical models have been developed to simulate flood inundation [109,110] and are categorised by a. empirical methods, such as measurements and remote sensing; b. hydrodynamic models; and c. conceptual models for extensive floodplains [110,111]. Numerical models are applied widely in hydrological modelling and river modelling [108]. Hydrological modelling focuses on modelling individual parameters within the hydrological system using small-scale physical models, mathematical equations and computer simulations. Based on the dimensions of the systems of interest, numerical models are classified as follows.
4.2.1. One-Dimensional Flood Models (1D)
ISIS-1D, TUFLOW-1D, MIKE 11, and HEC-RAS are examples of one-dimensional flood models. One-dimensional models are the simplest and represent the flow channel in the centreline and floodplain as a series of cross-sections [111]. However, they cannot anticipate water surges precisely enough to mimic urban flood events [112]. Several flood models are simple, computationally efficient, and simple to parameterize by using field surveying methods. However, more complex flood models are distributed topographically and do not account for friction. One-dimensional models, which simplify the issue, omit a key flood hydraulic component frequently encountered in urban floods. One-dimensional models simplify the problem. However, the capability of one-dimensional models to comprehend hydrological processes is severely limited because they need fewer input data and are unable to estimate water surges in the case of urban flooding [35]. Table A1 summarizes the strengths and weaknesses of 1D numerical models in flood modelling.
4.2.2. Two-Dimensional Flood Models
Two-dimensional flood models can accurately depict flow in small-scale topographical features, which is significant in urban flood modelling [113]. Two-dimensional flood models include LISFLOW-FP, ISIS-2D, JFLOW, MIKE-21, SOBEK, TELEMAC-2D, TUFLOW-2D, FLO-2D, RRI, DIUAST-TVD, and so forth. Table A2 highlights some examples of 2D models with their strengths and weaknesses. These models solve flood problems in two-dimensional, that is, lateral flows and along the river.
4.2.3. Three-Dimensional Flood Models
For a 3D model, a three-dimensional floodwater movement is simulated using the Navier–Stokes equations. Constructing a representative model of water flow mechanics, particularly significant in metropolitan areas, requires using three-dimensional models. Table A3 highlight some of the strengths and weaknesses of 3D models used in flood modelling. [114] applied a 3D non-hydrostatic Reynolds-Averaged Naviers–Stokes (RANS) model to simulate flooding events in the Iowa river. In addition, a 3D numerical Semi-implicit Cross-scale Hydroscience Integrated System Model (SCHISM) was applied in the Three Gorges in China to propagate floods [115]. Ref. [114] compared 1D and 2D models with 3D models. They highlighted that the accuracy of results from the 3D models improved due to the use of finer meshes to ensure the challenges regarding large-scale topographical features of the data input.
4.2.4. Comparison of the Numerical Models
While the one-dimensional (1D) modelling approach is limited to flow simulation, the recent development in remote sensing has accelerated the spread of two-dimensional (2D) models. On the other hand, three-dimensional (3D) models are specific to situations [35] to achieve accurate results from the complexity of 2D and also because of 3D models’ high-quality data and modelling expertise [116]. However, in three-dimensional and two-dimensional models, a lack of high-performance computing resources and external calibration limits the use of three-dimensional models. Additionally, researchers tend to hybridise 1D and 2D models to harness to strengths of both models in modelling floods. Table A4 highlight the strengths and weaknesses of some coupled 1D/2D models. Taking an example of [117], they used the HEC-RAS, a 1D/2D model, to predict flooding in Guneysu Basin, Turkey, where upstream gauged stations were absent.
Numerical models have not been exploited much to predict real-time floods across a large catchment at a high resolution because they require a lot of computing power [118]. Hence, numerical models are time-consuming [119,120,121,122] and need high computational resources and infrastructure for their deployment and performance [120,121].
4.2.5. Examples of Numerical Models in Flood Predictions
- Case study 1: Dynamic 3D simulation of flood risk based on the integration of spatio-temporal GIS and hydrodynamic models
Dynamic visual simulation of flood risk is critical for scientific and intelligent emergency management of flood disasters, in which data quality, availability, visualisation, and interoperability are important. To achieve proper data flow, calculation processes, operation flow, and system functionalities, [123] developed an integrated Geographic Information System (GIS) equipped with one-dimensional (1D) and two-dimensional (2D) hydrodynamic models. The study site was modelled using oblique photography-based 3D modelling technology (including the hydraulic engineering facilities). Based on the digital earth platform, a multisource spatio-temporal data platform dynamically simulates flood risk. A dynamic visual simulation and flood risk management decision support system for the Xiashan Reservoir was created using spatio-temporal computation. Flood simulation calculations, dynamic visual simulations, downstream river channels and dam-break flood simulations proved this integration strategy. The proposed methods increase flood risk simulation and decision support. This study’s methodologies and the system can simulate and manage flood risk.
- Case study 2: Flood Hazard Assessment and Mapping of River Swat Using Hecras 2d Model and High resolution 12 m TanDEMX DEM WorldDEM
Northern Pakistan’s Swat valley is prone to periodic flooding and was severely damaged by the Flood in 2010. In response to the flood mitigation strategies in Swat Valley, [124] modelled a stretch of the River Swat which was 60 kilometre long (Khwazakhela Bridge–Chakdara Bridge) using a 2D HEC-RAS model and a WorldDEM which was of 12 m resolution. The model was calibrated and validated using Manning’s “n” values, the flood stage at the Chakdara Bridge, and satellite imagery-based Flood2010-observed extent for the single historical maximum flood occurrence, namely Flood2010. In addition, the sensitivity of the flood model to the DEM was assessed, and the simulated maximum depth was 12, 13, 14, and 25 m for the 12 m WorldDEM, 30 m SRTM, 30 m ALOS, and 30 m ASTER DEMs, respectively. Based on the observed hydrograph during Flood2010, 2-, 5-, 10-, 25-, 50-, and 100-year return periods were calculated. The model was then simulated using the entire momentum equation for 2-, 5-, 10-, 25-, 50-, and 100-year return periods. For the development of flood hazard maps, simulated extents based on the 12 m WorldDEM were employed. Exposure of land cover to engineered flood events demonstrates that agricultural lands were mainly affected by floods. Generated flood hazard maps will make it possible for policymakers to integrate flood hazard assessment into the planning and development process for the purpose of reducing the risk of flooding in Swat Valley.
4.3. Probabilistic Models in Flood Prediction
Probabilistic models (like Bayesian, AHP and Monte Carlo) have received much interest recently and have been made possible by increasing computational power, faster networks, and cheaper memory [125]. Probabilistic models use probability distributions to account for these components [125]. Probabilistic models are especially significant since they underpin much work in machine learning, A.I., and data analysis. Their formulation and solution are based on probability theory and sum and product rules. However, even the simplest models can become analytically and computationally intractable [125]. The commonly used probabilistic tools in flood predicting in the literature are categorised into Bayesian and Multi-Criteria Decision Analysis (MCDA).
4.3.1. Multi-Criteria Decision Analysis (MCDA)
Multi-Criteria Decision Analysis, also known as the Multiscale Analysis Decision Method, or MCDM, is a subfield of functional research that explicitly considers multiple conflicting criteria in decision-making. MCDM is used to find the optimal answer to situations involving elements typical of everyday life. Multi-Criteria Decision Analysis (MCDA) is a popular and effective technique for handling complex decision-making problems [126]. Decision-making involves obtaining relevant information, considering several potential outcomes, and deciding which option is best. Organizing the pertinent information and outlining the alternatives is the primary focus of using a decision-making process broken down into steps. We considered carefully, and contributed to the decision-making process [127]. Multi-Criteria Decision Analysis, or MCDA for short, is one of the most well-known and widely used approaches to resolving complex decision-making challenges [126]. Multi-Criteria Decision Analyis (MCDA) approaches used in flood susceptibility mapping include the Analytic Hierarchy Process (AHP), Additive Ratio Assessment (ARAS), Combinative Distance-based Assessment (CODAS), Complex Proportional Assessment (COPRAS), Evaluation Based on Distance from Average Solution (EDAS), Internal Value Fuzzy Rough Number (IVFRN), Multi-Objective optimisation by Ratio Analysis (MOORA), Simple Additive Weighting (SAW), Technique for Order Preference by Similarity to the Ideal Solution (TOPSIS), and VlseKriterijuska Optimizacija I Komoromisno Resenje (VIKOR). Most of the time, the MCDM approaches are applied in a fuzzy environment; hence, fuzzy was added to the approaches, such as Fuzzy AHP, Fuzzy-VIKOR, Fuzzy ANP. This section examines six different MCDM techniques found in the literature that focus on mapping or predicting flood susceptibility.
Decision-Making Trial and Evaluation Laboratory (DEMATEL)
DEMATEL is a form of structural modelling approach that helps analyse the cause-and-effect linkages among the constituents of a system, and analysis is done by looking at the system [128] It is used in decision-making to construct and investigate the correlations between variables, and this methodology has been extensively considered one of the finest for determining interactions among variables [129]. DEMATEL’s basic processes include building an assessment hierarchy, selecting an expert team, calculating the total relationship matrix, defining the degree of influence, and calculating interdependencies to generate the entire relationship’s impact map [128]. DEMATEL has been applied by [130] to assess the vulnerability of watersheds to flood in Kurdistan province, located in the northwest of Iran by integrating with ANP and Fuzzy theories. In India, [131] reported policymakers’ effective use of DEMATEL in evaluating the risk associated with hydrometeorological extreme events like coastal flooding in the delta of West Bengal. In applying DEMATEL in an urbanised setting, [132] applied DEMATEL in conjunction with ANP and VIKOR (Visekriterijumska Optimizacija I Kompromisno Resenje) to assess flood risk in Istanbul, Turkey.
Technique for Order Preference by Similarity to the Ideal Solution (TOPSIS)
TOPSIS was designed to tackle multiple-criteria decision-making (MCDM) problems where the chosen alternative solution is closest to the positive ideal solution and farthest from the negative ideal solution [133]. The positive ideal solution maximises benefit and minimises expense; the negative ideal solution maximises cost and minimises benefit [134]. The positive ideal solution includes all the most satisfactory possible criteria values, whereas the negative ideal solution includes all the worst [126]. The alternatives are rated based on their similarity to an ideal solution, which may not exist and alternatives with the highest similarity to the best solution are rated highest and used to rank other alternatives [135]. The geometric distance is evaluated as an index value, with the most significant attributes closer to one and the least significant attributes closer to zero [136]. TOPSIS’ significant advantage over other techniques is the ability to quickly find the best alternative above other methods with minimal input from decision-makers [135,137,138]. Ref. [139] in a study on implementing TOPSIS, based analysis on five flood vulnerability alternatives classes and five vulnerability factors (criteria). The flood vulnerability classes were very low, low, moderate, high, and very high. In contrast, the vulnerability factors used were the quality of the building, population density, urban density, socio-economic conditions and history of the building. A normalised decision matrix on a scale of 1 to 9 was quantified with expert opinions and weights assigned to each criterion for each alternative through AHP. Then, a weighted normalised decision matrix is generated to produce a positive and negative ideal solution. The best alternative is determined after ranking all alternatives based on the relative proximity to the ideal solution based on a classification value ranging between 1, representing the suitable solution (low flood vulnerability) and 0 representing the inappropriate solution (high flood vulnerability). An urban flood vulnerability map is finally produced from the classification.
Preference-Ranking Organization Method for Enrichment Evaluation (PROMETHEE)
PROMETHEE is based on an outranking strategy, which ranks and selects one or a set of alternative actions from among all feasible alternative solutions while considering numerous sets of criteria that often conflict with one another [140]. The outranking strategy compares parameter alternatives and creates a preferential function to compare alternative pairs on each criterion [141]. Thus, preference functions are built on the numerical difference between alternatives to describe the decision maker’s preference [141,142]. The linear piecewise functions range from 0 to 1 [141,142]. A greater function value means a more significant preference difference. There is no preferential differential when the value is zero [141]. Utilising this method, one can evaluate the various options by pairwise comparing the preference function values given a set of predetermined standards [140,143]. The preference function ranks the available choices to determine the most excellent solution [144]. Simplicity, clarity, and equilibrium are the three primary characteristics contributing to the method’s applicability [140,145,146]. The PROMETHEE approach can be utilised for the partial ranking of the set of options and the full ranking of those alternatives [140]. Ref. [147] in simulating the urban flooding in Urmia city in Iran, used the PROMETHEE II approach to rank the 22 sub-catchments to evaluate their potential to produce surface runoffs.
Analytical Hierarchical Process (AHP)
The Analytic Hierarchy Process, also known as AHP, is a theory that was to quantify tangible and intangible decision variables through paired comparisons based on expert knowledge on a fundamental scale ranging from 1 to 9 [148]. Pairwise comparisons can be used as a measurement tool, allowing a valid scale of priorities to be derived. AHP integrate multiple factors to make the appropriate decision [149]. The choice is logical, methodical, and accurate. The pairwise comparison method (PCM) prioritises the variables by indicating the weight of each criterion. These variables used as input data for estimating future flood risk include and are not limited to (a) morphological: Elevation, slope, profile curvature, distance from rivers and so forth.; (b) hydrometeorological: river network density, rainfall, stream power index (SPI) and so forth.; (c) Land Use Land Cover (LULC) dynamic: LULC, NDVI and so forth.; (d) Permeability: soil type, soil moisture, topographic wetness index (TWI) and so forth.; (e) anthropogenic indices: Population density, distance from road and so forth. All these variables will be defined and pre-processed into raster format, with weights estimated and ranked based on expert judgement. A flood susceptibility map will be generated within a GIS environment. The AHP has a simple framework that can address the complexity of real-world issues like flooding and other natural hazards [150]. It is easily compatible with other qualitative and quantitative methods [151,152], thus why it is integrated chiefly with geospatial techniques [152].
Furthermore, the strength of AHP lies in the ability to build consensus among stakeholders [153,154]. For the limitations of AHP; 1. The 9-scale-based decision is time-consuming [155], 2. AHP is highly biased and does not take care of uncertainties [156] and 3. In the event of many pairwise comparisons, a consensus building within the decision-maker is difficult [157].
Analytical Network Process (ANP)
ANP replaces hierarchical structures with networks [158] by computing the independence between complex decision elements and offers all the benefits of AHP, including simplicity, flexibility, and the opportunity to review consistency in judgments [159]. Interaction is enabled between members of the same cluster (inner dependence) and elements of separate clusters (external dependence) [160]. With the interconnectedness of network elements, complex real-world situations can be modelled accurately [160]. However, the hierarchical analysis assumes that higher levels are independent of lower levels, and in many decision-making processes, decision variables cannot be modelled hierarchically and independently unless combined hence the introduction of ANP [161]. To minimise flood damages, analysis of flood vulnerability and risk assessment is a key strategy. A combination of physical and social variables whose potential to be harmed during the time of floods must be selected for analysis. While hazards are a potential threat to the population and Environment, the risk is an interplay between hazard and vulnerability. Therefore, an understanding of the hazards and risks is key. AHP and the weighted linear combination could be used to functionalise the conceptual model within a GIS framework to conduct vulnerability analysis and risk assessment of flooding. To delineate the flood risk zones, a composite vulnerability index map would be prepared on Physical Vulnerability Index, Social Vulnerability Index and Coping Capacity Index. Relative to AHP, ANP utilises the relationship between the decision variables in the decision process and is flexible in rank reversal when alternatives are removed or new alternatives are added. ANP is a simple tool that helps grasp interrelationships between variables and aids decision-makers in building consensus [159]. Ref. [161] applied ANP in mapping flood susceptibility in Saqqez city in Iran, while [162] applied ANP in Perlis, Malaysia. ANPs are mostly combined with other MCMD approaches in the case of [163], who combined IVFRN-AHP and DEMATEL to model flood vulnerability in Anambra state, Nigeria. For limitations: 1. It is challenging to prioritise network variables and decision alternatives using this strategy; 2. because the procedure is cyclical, computing the priorities is a complex task, and finally, the feedback loops and interrelations between variable nodes complicate result verification [159].
4.3.2. Bayesian Network (B.N.)
Bayesian Network is an acyclic graphical probabilistic model of nodes and arcs for understanding the uncertainty of an event, where the nodes represent the random variables, and the arcs reflect direct links between the variables and conditional probabilities for the random variables [55]. The value of the node may be continuous or discrete. Widely used nodes are discrete and are in the form of ordered values, Boolean or integral values [164]. B.N. is based on Bayes’ theorem, the mathematical that governs the propagation of probabilities based on the conditional dependency based on the conditional dependence of variables and data to yield posterior probabilities. The posterior distribution is determined by combining a prior distribution with observational data in a likelihood function and can forecast future occurrences [165]. By their graphical nature, B.N.s can automatically extract probabilistic information from data. Additionally, the quantitative strength of the connections in a B.N. structure automatically updates the variables’ probabilistic beliefs as new information becomes available.
4.3.3. Examples of Probabilistic Models in Flood Prediction
- Case study 1: Towards Flood Risk Mapping Based on Multitiered Decision-Making in a Densely Urbanized Metropolitan City of Istanbul.
Ref. [132] proposed a framework to map flood risk using the Multi-Criteria Decision Analysis method (AHP, ANP, DEMATEL and VIKOR). This study uses MCDM methodologies and focus group discussions (FGDs) with 10 Istanbul FRM practitioners to select flood-prone regions. The 10 influencing factors were inputted as data for the evaluation and clustered into two, namely: vulnerability and Hazard clusters. The hazard cluster was AHP-evaluated to start the decision framework evaluation. Since the vulnerability cluster had interrelationships, but the hazard cluster had independent criteria, the ANP approach was used. The vulnerability cluster comprises susceptible structures, population density, vulnerable population, education level, and income level. In contrast, the hazard cluster includes a stormwater pipe network, slope, imperviousness, storm event return period, and distance to water. The DEMATEL technique modified the weights from the ANP. The DEMATEL approach is a more robust alternative to the ANP method for drawing network diagrams. DEMATEL can identify problem sources and countermeasures, making it an excellent alternative to existing MCDM methods. This study assessed vulnerability cluster criteria using DEMATEL-ANP. DEMATEL analysis used FGD judgements and their arithmetic means (average matrix). Normalisation (normalised direct relation matrix) and a total relation matrix calculation followed. VIKOR analysis was used for alternative prioritising at the last stage of the evaluation. AHP-DEMATEL-ANP analysis and district ratings created the choice matrix (captured from statistics and related institutions). The data attributed to each district for each criterion were merged with the estimated weights for each criterion to perform a VIKOR analysis. A flood risk map of Istanbul was created using 10 different criteria. The findings revealed that the most densely populated and urbanised parts of Istanbul are at significant risk of flooding. The robustness of the chosen approach and the stability of the calculated findings were demonstrated through sensitivity analysis of the VIKOR method. The findings of this study have the potential to make a significant contribution to the decision-making bodies of the city. This will enable those bodies to effectively allocate resources, choose the risk mitigation measures that are most appropriate, and give priority to districts that have a high risk of flooding.
- Case study 2: Assessing urban flood disaster risk using the Bayesian network model and GIS applications.
To determine the likelihood of a flood disaster occurring, [123] proposed using a method that combines the Bayesian network (BN) model and the geographic information system (GIS). This approach can quantify uncertainty, as well as the capacity to capture potential relationships between factors that have an impact on a flood disaster, and it makes use of both data- and knowledge-based sources. The approach provided was used in a case study to estimate the risk of a flood disaster and to diagnose the reason for a flood disaster that occurred in Zhengzhou City. A comprehensive questionnaire survey was designed to gather ideas on the recent impacts of floods in the study area to identify the primary factors that are directly or indirectly affecting urban flood disasters. This was done to identify the main factors affecting directly or indirectly urban flood disasters. The BN model for urban flood disasters was constructed using historical case data. The risk of a flood disaster occurring in Zhengzhou City from the 16 to 20 August 2018 was projected and evaluated. The influencing factors directly or indirectly affecting urban flood disasters were topography, climatology, river network, and land cover. Based on the identified risk factors, the BN model for evaluating flood hazard risk was established. The technical procedure consisted of two steps: structure learning and parameter learning, also known as training. Using a directed acyclic graph, the BN structure graph displays the probable relationships between factors impacting flood disasters. The case study showed that the BN model’s relative error for very-low, low, moderate, high, and very high risk was 12.57%, 13.21%, 2.23%, 19.63%, and 21.65%, respectively, demonstrating its discriminative power. Zhengzhou City’s flood disaster risk decreases from the middle to the surroundings based on risk level distribution. This paper’s methodology differs from earlier studies that estimate flood disaster risk deterministically, offering decision-makers more insight into the analysis’ uncertainty, which has ramifications for risk assessment and management of urban flood disasters.
5. Discussion
5.1. Review on the Flood Prediction Tools
We have reviewed the flood prediction tools presented in the literature under three categories: Machine Learning, Numerical Modelling and Probabilistic modelling.
Machine Learning, a subfield of artificial intelligence, is becoming an essential tool for automatically generating flood forecasts [27]. Computational algorithms are beneficial for creating flood predictions in vulnerable river basins and the effects of floods on neighbouring districts [105]. In addition to generating predictions, machine-learning models can map and monitor flood events while providing cost-effective remedies [3,27]. However, historical flood records and real-time data from many rain gauges are needed to make an ML-based flood prediction model. Therefore, besides rain gauges, satellites, radars, or other multisensory systems have been developed to measure water level and rainfall.
Conversely, ML can predict flood exposure from remote sensing data and increase flood response from ML applications on social media data (crowdsourcing). Though the machine learning model has many advantages, a high-performing ML model is only as good as the quality and quantity of data available. Sometimes, various data sets are required for model training. Therefore, the performance of an ML model improves as more data becomes available. Ref. [33] pointed out that a machine learning model learns to extract patterns from input data during the training process. Therefore, its performance is contingent on the quality of the input data we offer. If the data are noisy or lack patterns, we cannot expect the ML model to produce satisfactory results. The further problem is that a model trained on a particular dataset may not produce the same results on different datasets. Because each geographical region has unique characteristics, we cannot expect a model to predict every event it has ever observed. To improve these limitations associated with ML models, researchers have prescribed integrating ML-based models with expert knowledge to improve the structural and parameter learning process, improving the model’s efficiency. Since every model has strengths and weaknesses, hybridising them will ensure harnessing the participating models’ strengths to improve the prediction model’s accuracy.
Unlike deterministic models, probabilistic models provide a probability distribution as a solution [166]. These models recognise that enough data may not be available for decision-making, and almost always, some element of chance is involved. Probabilistic models are primarily presented in graphical models, using graph theory to solve uncertainty and complexity in real-world problems. These graphical models are merged with probability theory to form the probabilistic graphical models (PGM) [167]. The concept of modularity is fundamental to graphical models—a complex system is formed from simpler ones. Probability theory connects these smaller parts, maintaining system consistency and connecting models to data. Probabilistic models were reviewed under two groups: Bayesian Networks and Multi-Criteria Decision-Making.
Since flood-related disasters create complex problems, solving these problems requires expertise from multidisciplinary areas. This has popularised Multi-Criteria Decision Analysis (MCDA) to analyse the risks associated with floods. In a scenario, there exist different alternative flood risk solutions. MCDA methods choose the best alternative solution through weighting criteria and preferencing ranking combinations. Bayesian modelling is advancing rapidly in ecological and environmental management [168], especially flood prediction, due to: (a) B. N. is less sensitivity to small data, (b) the opportunity to combine data with expert knowledge (structural learning) in the prediction modelling, (c) no need for computers with high computational power, hence less expensive to operate, (d) the fast responses to requests [169].
Numerical modelling has been at the heart of flood risk forecasting. Unfortunately, the existing models, irrespective of their geographic scope, level of sophistication, or dimensions, contain characteristics and errors that render them unsuitable for application in many locations, including those in which flooding is unquestionably an issue. Flood modelling is essential for FRM, even though these economically disadvantaged places face scientific challenges and a lack of readily available data. These inherent characteristics and errors introduce uncertainty and systematic errors, which need to be quantified and included in the model calibration. Uncertainty is fundamental in research but is especially prevalent in current assessments of numerical flood models. Due to data, methodology, and theory discrepancies, the accuracy of results from these models has been threatened, as concluded by [69,107]. Calibration decreases model uncertainty by seeking accurate parameters to ensure the model’s accuracy. Calibration must be done within uncertainty limits to apply a model to any setting. Scholars have investigated various flood calibration methods over the decades and have found that current flood models do not approach a calibration limit. They are regularly recalibrated. A challenge is the unavailability of the necessary calibration data for flood modelling and risk assessment studies. The challenge of the calibration data has improved due to the advances in remote sensing. Table A5 summarises the comparison of the three categories of models under seven factors: Cost of operation, Dealing with Uncertainty, the accuracy of Prediction (Reliability), Data requirement, Access, ability to integrate with the models (hybridisation) and the lead time of the model.
5.2. Importance of GIS and Remote Sensing in Flood Prediction
The review identified the strong emergence of geographical information science and remote sensing in flood prediction. In terms of flood forecasting, mapping, and emergency response, conventional hydrological monitoring methods have limited utility. Rain and stream gauge station operation costs might be exorbitant for larger nations [170]. Countries must be able to collect information independently across international borders to provide appropriate flood warnings. Moreover, gauge stations only measure the water’s height, not the flood’s magnitude. Satellites and aircraft equipped with remote sensors can supply the necessary data. The data produces information on natural disasters’ spatial and temporal attributes and a region of interest, which can occasionally be generated in real-time. The occurrence of flooding depends on the region’s physical characteristics, such as area extent, nature of the surface (topography), geology, and land cover [116]. Some locations are inaccessible, hence unable to be mapped by the conventional hydrological monitoring methods.
Satellite and airborne photos are used to capture features in these catastrophe zones. These photos are processed to predict whether a region may flood. Remote sensing technology extracts flood zone characteristics and predicts disaster and event issues. Flood risk maps can be created using remotely sensed data. This technique offers Near Real-time flood Inundation Mapping, Flood Damage Assessment, Flood Hazard Zone Mapping, Vulnerability Analysis and data Input for flood modelling and prediction. Data generated from remote sensing are the integration of data from a wide variety of sensors that operate at various wavelengths is necessary to realise the full potential of R.S. for applications relevant to flood forecasting [116]. The advancements in remote sensing (R.S.) technology, especially the high-resolution and high-precision input data such as aerial (UAV), LiDAR and SAR, and the availability of greater processing capacity, have improved the speed of two- and three-dimensional models.
Remote-sensed data are analysed in the GIS environment. The Geographic Information System (GIS) offers a variety of visualisation products that can be helpful for flood prediction and warning. Some examples of these products include depicting areas that are expected to be submerged and the movement of a flood wave. GIS provides a suitable platform to integrate Machine Learning, Probabilistic and Numerical tools to predict and monitor floods and their related impact efficiently. Data from remote sensing used by all other tools for flood prediction include Digital Elevation Models, Land use land cover, Soil moisture and Water storage, Precipitation measurement, Inundation maps, sea surface temperature, and so forth.
Multiple satellite platforms are currently in orbit and collecting multitemporal, multisensor, and multiscale data on local, regional and global scales. Table A6 summarises some of the sensors and their data production as input for flood prediction models. In addition to the satellite platforms, software and hardware capabilities for processing satellite data have advanced significantly in recent years, which is particularly essential in the era of Big-EO Data while Table A7 gives the full meanings of the abbreviations in Table A6. This requires high computational power, and due to the limitations presented by hardware, cloud computing platforms like Google Earth Engine (GEE) provide unlimited computational resources for big-EO data analysis. GEE provides potent tools and E.O. data that are especially useful for applications aimed at prevention, risk management, and damage estimation [171]. GEE is accessed and controlled using a web-based accessible application programming interface (API), and there is a web-based interactive development environment (IDE) that permits rapid prototyping and viewing of outcomes [172]. GEE provides a supercomputing-based platform to empower remote sensing experts and a more comprehensive range of professionals who lack the expertise to use traditional supercomputers and cloud services to solve environmental challenges [172].
6. Research Trends, Hotspots, and Conclusions
Flood is one of the natural disasters that affect areas extensively due to low topography, sea level rise, frequency of rainfall and so forth, which results in the loss of lives, damage of properties and loss/damage to socio-economic activities of the affected areas. This study systematically investigated tools for flood prediction from 1101 articles from the literature to make a solid and coherent analysis of the various categories of flood prediction tools. The methodological evolutions and trending research topics were highlighted. The study presented an overview of these tools as applied in various countries throughout the globe and discussed their advantages and disadvantages. As a result, we have been able to satisfy the four objectives set out in the introduction of this paper. We found an exponential increase in the studies on flood prediction over the short period between 2017 and March 2022 (Objective 1).
For the second objective, three significant trends were reported in the literature on trend topics. First, probabilistic models such as Copula and B.N. were found to play significant roles in the uncertainty assessment of flood risk. Secondly, the focus on recent research trends reveals that Machine learning Models are widely used in flood prediction with the development of deep learning tools. Thirdly, we also revealed the emergence of spatial flood prediction with the growing usage of GIS. Due to the ease at which GIS platforms integrate any algorithms be it numerical models (like, RAS HEC and so forth.) or probabilistic models like AHP or Machine or Deep Learning, researchers are developing an affinity for the use of this tool. Finally, the advancements in remote sensing (R.S.) technology, especially the high resolution and high precision input data such as aerial (UAV), LiDAR and SAR, provided data input for mapping floods and the emergence of GIS as the best platform for incorporating all forms of the tools and data for analysis and visualization. Table A5 summarizes the strengths and weakness of the tools as fulfilment of the third objective.
The gaps were mined from the literature (Objective 4). From the trend plots (Figure 5), Thematic map (Figure 9) and Spatial Distribution map (Figure 10 and Figure 11), the following gaps were identified for further exploration. Firstly, we found out that Probabilistic models of Bayesian networks and Copula have high relevance in predicting floods, as confirmed by [173], that Bayesian Networks are superior in prediction and interpretability capabilities and uncertainty in floods but are rarely used by researchers, especially coastal flooding, and even less used due to the complexities when many variables are analyzed. Furthermore, expert knowledge is required to build a B.N. model. It is considered another major challenge because the Bayesian Network is less used. Secondly, the geographical gap was also identified with fewer works from Africa, South America and Australia. Lastly, the potential of spatial flood prediction is rapidly developing and must be fully explored to represent the hazard and better interpretation visually.
This research contains potential limitations. The search was restricted to 2017–2022 (March 2022), due to the focus of the analysis of the most recent tools used in flood prediction, and as such, the empirical findings made are restricted to this given period. Another limitation is that data for analysis were extracted from the Scopus database, of which coverage may have an influence, in comparison to whether other databases were included. However, justification for utilising Scopus was established in the methodology; thus, the selection of this data set did not affect the findings. Lastly, only documents written in English were considered and there may be other documents published in other languages.
Author Contributions
K.T.A.-A.: Conceptualization, Methodology, Writing-Original Draft, and M.K.A. and D.B.A.: Writing-Review and Editing and Supervision. All authors have read and agreed to the published version of the manuscript.
Funding
This research was funded by the Africa Centre of Excellence in Coastal Resilience (ACECoR), University of Cape Coast with support from the World Bank and the Government of Ghana, World Bank ACE Grant Number is credit number 6389-G.
Institutional Review Board Statement
Not applicable.
Informed Consent Statement
Not applicable.
Data Availability Statement
No new data were created or analyzed in this study. Data sharing is not applicable to this article.
Acknowledgments
This paper is part of a PhD thesis under the Africa Centre of Excellence in Coastal Resilience (ACECoR), the University of Cape Coast, with the support of the World Bank and the Government of Ghana. We are grateful for their support.
Conflicts of Interest
The authors declare no conflict of interest.
Appendix A

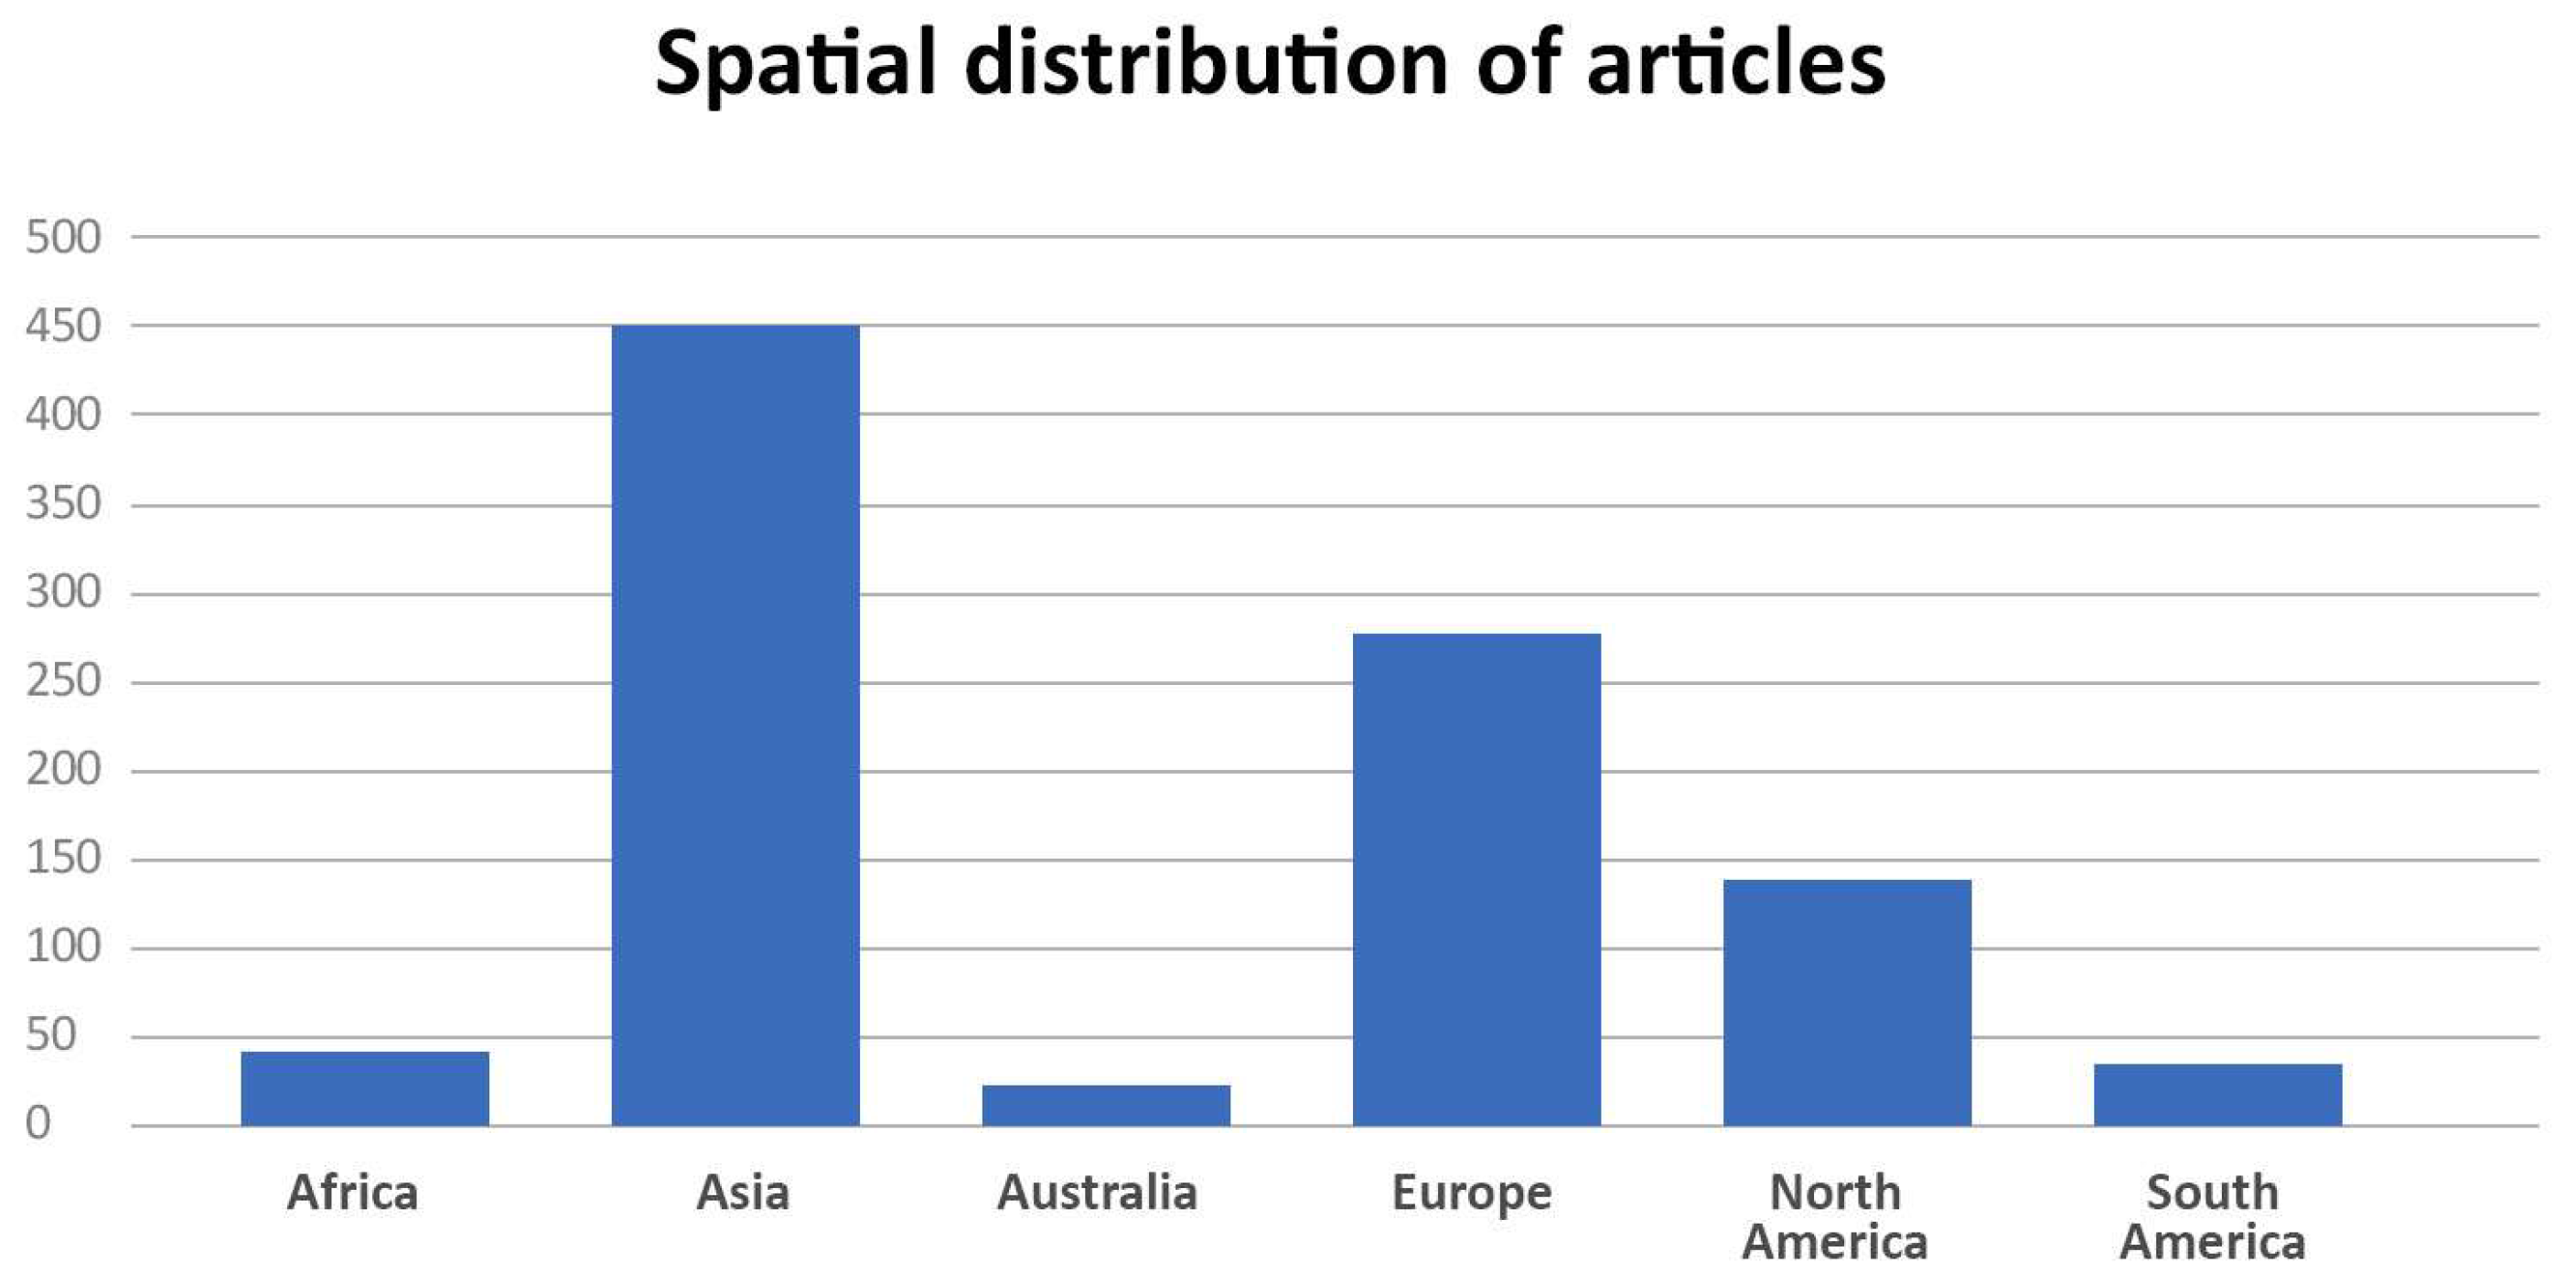
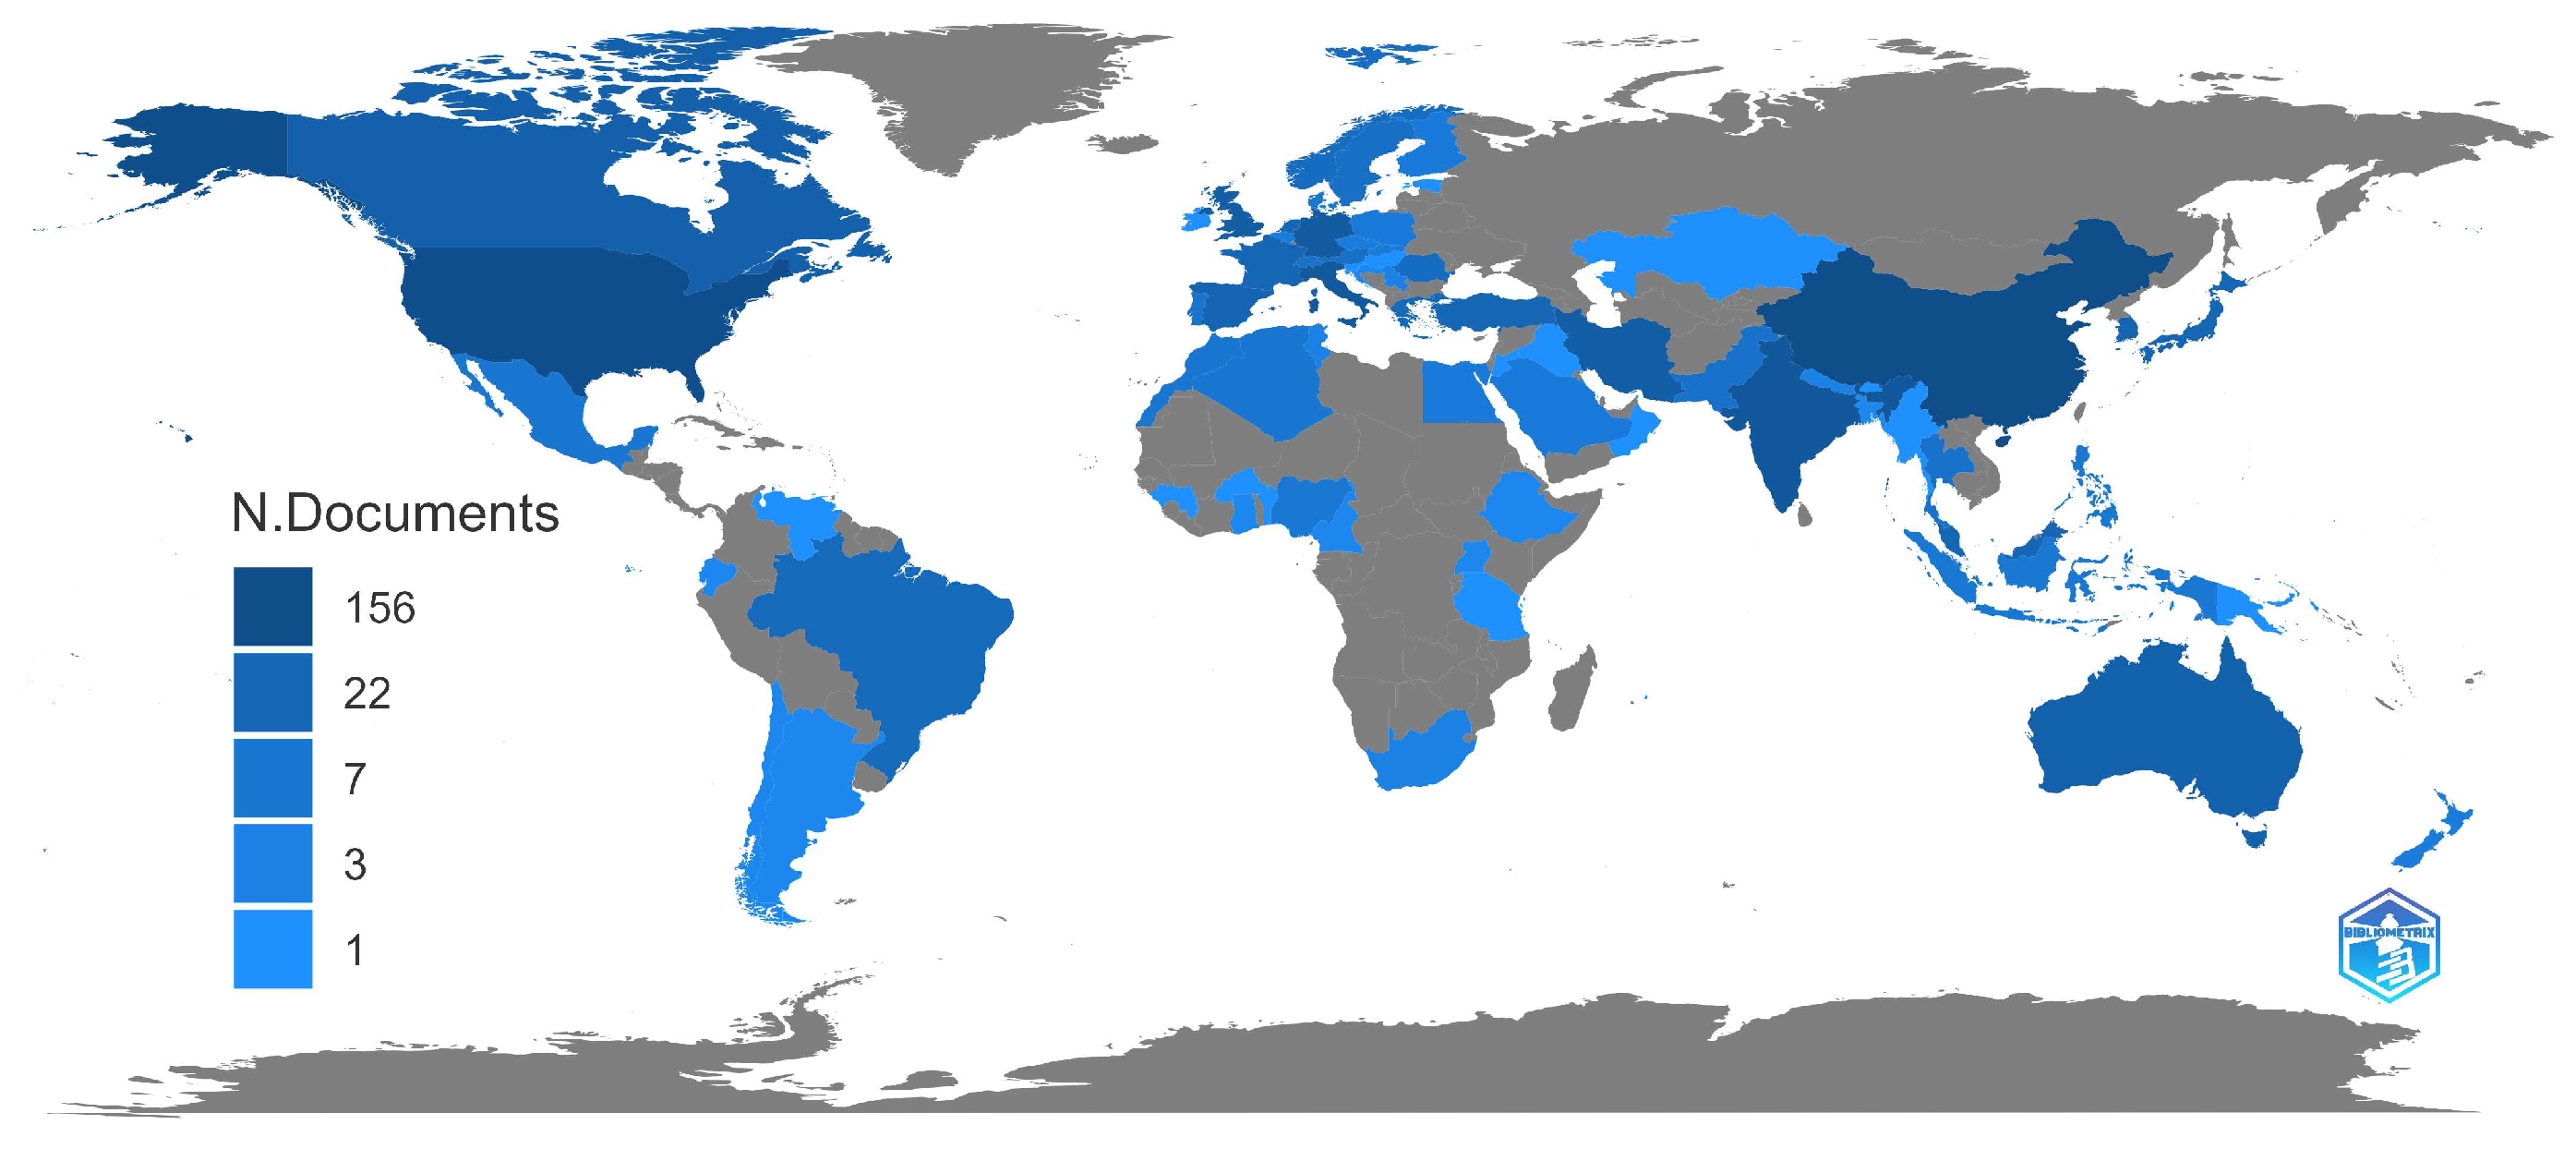
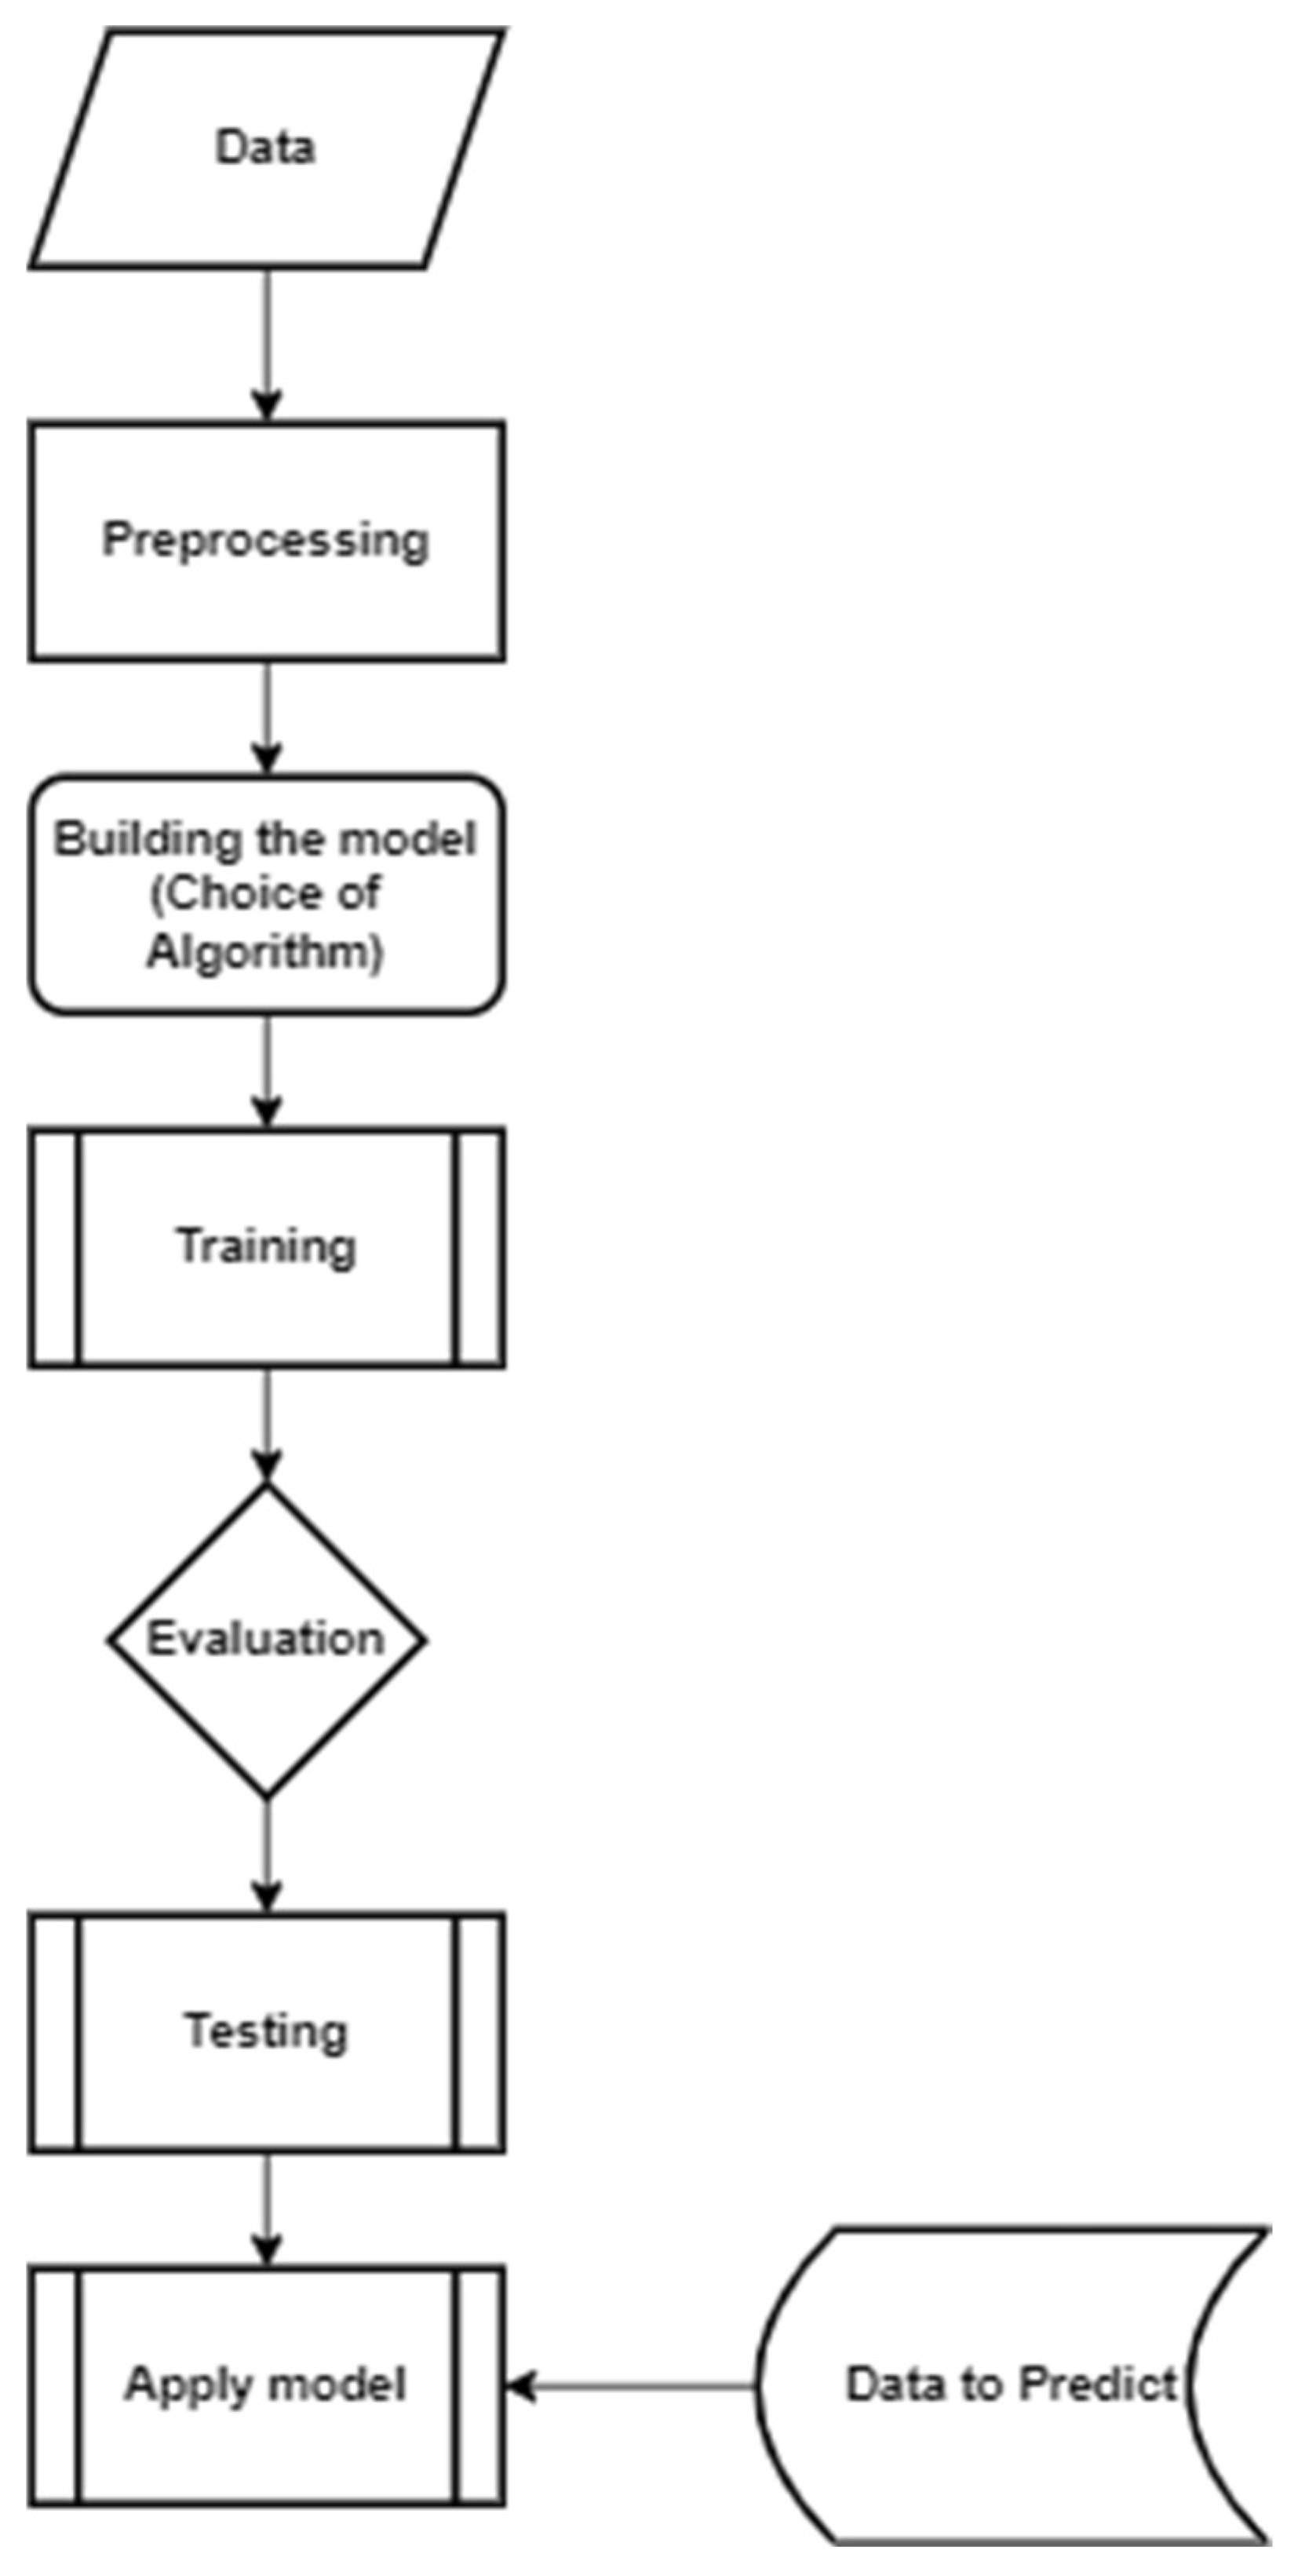
Table A1.
Summary of the one-dimensional (1D) numerical tool in flood modelling.
| Dimension of Model | Examples | Strengths | Limitation | Access |
|---|---|---|---|---|
| 1D | HEC-RAS | Easy to set up and flexible | Not stable in a multidimensional environment | Open Source |
| ISIS | Suited for transitional, unsteady, | Not suitable for dynamic flood simulation | Commercial | |
| Steady, sub and super critical flows | Assume velocity perpendicular to | |||
| cross-section | ||||
| MIKE II | Simulate unsteady flows | Unable to model supercritical flow | Commercial | |
| in open channel | ||||
| TUFLOW-1D | Fast Computation | Uncertainty in results | Commercial | |
| Able to effectively link capability | ||||
| domains | ||||
Table A2.
Summary of the two-dimensional (2D) numerical tool in flood modelling.
| Dimension of Model | Examples | Strengths | Limitation | Commercial/ Open Source |
|---|---|---|---|---|
| 2D | FLO-2D | Suitable for urban and river flood | Unable to compute for bridges or culverts | Open Source |
| combine hydraulic and hydrologic | Inability to simulate shock waves, hydraulic | |||
| modelling | flows and rapid flows | |||
| Spatio-temporal resolution depends | ||||
| on grid size and discharge flux | ||||
| JFLOW | Suitable for coarse resolution | Unable to simulate small-scale effects during | Commercial | |
| data | flooding | |||
| It is simple and has good accuracy | Conditional stability via CFL condition | |||
| TUFLOW-2D | Able to effectively link capability | Slow | Commercial | |
| domains | ||||
| Captures bulk flows dynamically. | ||||
| TELEMAC | Performs best under | |||
| The permanent and transient condition | Conditionally Stable | |||
| MIKE 21 | Simulate bulk flows, flow velocity | Courant-Friedrich-Lévy (CFL) number | Commercial | |
| in various direction | affect the simulation time and stability of | |||
| the model | ||||
| Calibration needed | ||||
| CADDIES | Simulation is done quickly | Validation module unavailable | Open Source | |
| DIVAST | Unconditionally Stable | Simulation lacks the ability to capture shock | Commercial | |
| Constant time step | ||||
| SOBEK | Capable of handling wet and dry, | Conditionally stable | Commercial | |
| varying spatial surfaces, Wind | ||||
| friction and roughness | ||||
| TRENT | Ability to capture shock | Stable at CFL condition, using adaptive time | ||
| stepping | Commercial | |||
Table A3.
Summary of the three-dimensional (3D) numerical tool in flood modelling.
| Dimension of Model | Examples | Strengths | Limitation | Access |
|---|---|---|---|---|
| 3D | TELEMAC | Captures 3D hydrodynamic features | Conditional stable | Open Source |
| of area | ||||
| DELFT-3D | Suitable for Coastal, river | |||
| TUFLOW FV | Stratification allowed | Computational | ||
| Allow for 3D model geometry | ||||
| Density and Velocity distribution | ||||
| are inherently 3D | ||||
Table A4.
Summary of the Coupled 1 and 2-dimensional numerical tools in flood modelling.
| Dimension of Model | Examples | Strengths | Limitation | Access |
|---|---|---|---|---|
| Coupled 1D and 2D | MIKE FLOOD | Real-time simulation of the river, | Calibration of model needed | Commercial |
| coastal and urban floods | Not well suitable in terms of many places | |||
| satisfactory | applications | |||
| MIKE URBAN 2010 | Suitable for Urban floods and has | Urban to capture shock, supercritical flows | Commercial | |
| GIS capabilities | and other hydrodynamic phenomena | |||
| HEC-HMS | Capable of being used in a number | Unsuitable for simulating dynamic flood | Open Source | |
| of hydrological applications | condition | |||
| Integrates with other software | ||||
| like GIS | ||||
| GUFIN | GIS capabilities and suitable for | Unavailability of validation module | Open Source | |
| Urban flood | ||||
Table A5.
Comparison of the Prediction models.
| Factors to Consider | Prediction Models | ||
|---|---|---|---|
| Machine Learning | Probabilistic | Numerical | |
| Cost of Operation | Moderate | Low | High |
| Dealing of Uncertainty | High | Very high | Moderately |
| Accuracy of Prediction | High | Very high | Low |
| Data requirement | Highly data-driven | Less sensitive to data | Highly data-driven |
| Access | Mostly Open Source | Mostly Open Source | Mostly Commercial |
| Hybridization | Very High | High | Moderately |
| Model Lead Time | Fast | Very Fast | Slow |
Table A6.
Summary of Remote Sensing Sensors and data input products.
| Data Products | Some Sensors/Satellite Missions |
|---|---|
| Soil Moisture | SSM/I, AMSR-E. SMAP. SMOS |
| Groundwater | GRACE, GRACE FO |
| Water storage (Volume) | MODIS, Landsat, SPOT, SRTM, GRACE, ICESat |
| Precipitation | TRMM, GPM, IMERG |
| Evapotranspiration | MODIS, Landsat, GRACE |
| Flooding | MODIS, UAV, SMAP, SMOS, Sentinel 1A/2A, GRACE, ASTAR and so forth |
| Discharge from rivers and lakes | MODIS, SRTM, Landsat, ICESat, Sentinel 1, 2 and 3, UAV |
| Sea Surface Temperature | Sentinel 6 |
| Sea level | TOPEX/Poseidon, Jason 1, Jason 2, Jason 3 and Sentinel 6 |
| Significant Wave Height | TOPEX/Poseidon, Jason 1, Jason 2 and Jason 3 |
| DEM | SRTM, Sentinel 1, ASTER, GLAS, ICESat, ALOS, Tandem-X |
Table A7.
List of Abbreviations.
| Abbreviations | Full Meaning |
|---|---|
| ALOS | Advanced Land Observing Satellite |
| AMSR-E | Advanced Microwave Scanning Radiometer |
| ASTER | Advanced Spaceborne Thermal Emission and Reflection Radiometer |
| GLAS | Geosecience Lasar Altimeter System |
| GPM | Global Precipitation Measurement |
| GRACE | Gravity Recovery and Climate Experiment |
| GRACE-FO | Gravity Recovery and Climate Experiment Follow-On |
| ICESat | Ice, Cloud, and land Elevation Satellite |
| IMERG | Integrated Multi-satellitE Retrievals for GPM |
| MODIS | Moderate Resolution Imaging Spectroradiometer |
| SSM/I | Special Sensor Microwave Imager |
| SMAP | Soil Moisture Active Passive |
| SMOS | Soil Moisture and Ocean Salinity |
| SPOT | Satellite Pour l’Observation de la Terre |
| SRTM | Shuttle Radar Topography Mission |
| TRMM | Tropical Rainfall Measuring Mission |
| UAV | Unmanned Aerial Vehicle |
References
- Pralle, S. Drawing lines: FEMA and the politics of mapping flood zones. Clim. Chang. 2019, 152, 227–237. [Google Scholar] [CrossRef]
- Echendu, A.J. The impact of flooding on Nigeria’s sustainable development goals (SDGs). Ecosyst. Health Sustain. 2020, 6, 1791735. [Google Scholar] [CrossRef]
- Munawar, H.S.; Hammad, A.W.; Waller, S.T. A review on flood management technologies related to image processing and machine learning. Autom. Constr. 2021, 132, 103916. [Google Scholar] [CrossRef]
- Xu, L.; Gober, P.; Wheater, H.S.; Kajikawa, Y. Reframing socio-hydrological research to include a social science perspective. J. Hydrol. 2018, 563, 76–83. [Google Scholar] [CrossRef]
- Pham, B.T.; Phong, T.V.; Nguyen, H.D.; Qi, C.; Al-Ansari, N.; Amini, A.; Ho, L.S.; Tuyen, T.T.; Yen, H.P.; Ly, H.; et al. A comparative study of kernel logistic regression, radial basis function classifier, multinomial naive Bayes, and logistic model tree for flash flood susceptibility mapping. Water 2020, 12, 239. [Google Scholar] [CrossRef] [Green Version]
- Williams, L.; Arguillas, M.J.B.; Arguillas, F. Major storms, rising tides, and wet feet: Adapting to flood risk in the Philippines. Int. J. Disaster Risk Reduct. 2020, 50, 101810. [Google Scholar] [CrossRef]
- AghaKouchak, A.; Chiang, F.; Huning, L.S.; Love, C.A.; Mallakpour, I.; Mazdiyasni, O.; Moftakhari, H.; Papalexiou, S.M.; Ragno, E.; Sadegh, M. Climate extremes and compound hazards in a warming world. Annu. Rev. Earth Planet. Sci. 2020, 48, 519–548. [Google Scholar] [CrossRef] [Green Version]
- Coronese, M.; Lamperti, F.; Keller, K.; Chiaromonte, F.; Roventini, A. Evidence for sharp increase in the economic damages of extreme natural disasters. Proc. Natl. Acad. Sci. USA 2019, 116, 21450–21455. [Google Scholar] [CrossRef] [Green Version]
- Wang, K.; Zhang, A. Climate change, natural disasters and adaptation investments: Inter-and intra-port competition and cooperation. Transp. Res. Part B Methodol. 2018, 117, 158–189. [Google Scholar] [CrossRef]
- Ding, Y.; Mu, C.; Wu, T.; Hu, G.; Zou, D.; Wang, D.; Li, W.; Wu, X. Increasing cryospheric hazards in a warming climate. Earth Sci. Rev. 2021, 213, 103500. [Google Scholar] [CrossRef]
- Kekeh, M.; Akpinar-Elci, M.; Allen, M.J. Sea level rise and coastal communities. In Extreme Weather Events and Human Health; Springer: Cham, Switzerland, 2020; pp. 171–184. [Google Scholar]
- Hereher, M.E. Assessment of climate change impacts on sea surface temperatures and sea level rise—The Arabian Gulf. Climate 2020, 8, 50. [Google Scholar] [CrossRef] [Green Version]
- Trenberth, K.E. Climate change caused by human activities is happening and it already has major consequences. J. Energy Nat. Resour. Law 2018, 36, 463–481. [Google Scholar] [CrossRef]
- Ngenyam Bang, H.; Church Burton, N. Contemporary flood risk perceptions in England: Implications for flood risk management foresight. Clim. Risk Manag. 2021, 32, 100317. [Google Scholar] [CrossRef]
- Denchak, M. Flooding and Climate Change. Natural Resources Defence Council Website. 2019. Available online: https://www.nrdc.org/stories/flooding-and-climate-change-everything-you-need-know (accessed on 25 August 2019).
- Wing, O.E.; Bates, P.D.; Smith, A.M.; Sampson, C.C.; Johnson, K.A.; Fargione, J.; Morefield, P. Estimates of present and future flood risk in the conterminous United States. Environ. Res. Lett. 2018, 13, 034023. [Google Scholar] [CrossRef]
- Ozger, M. Assessment of flood damage behaviour in connection with large-scale climate indices. J. Flood Risk Manag. 2017, 10, 79–86. [Google Scholar] [CrossRef] [Green Version]
- EM-DAT, CRED. EM-DAT Public. Retrieved from Emergency Events Database (EM-DAT) of The Centre for Research on the Epidemiology of Disaster (CRED). Available online: https://www.emdat.be/ (accessed on 20 February 2022).
- Breili, K.; Simpson, M.J.R.; Klokkervold, E.; Roaldsdotter Ravndal, O. High-accuracy coastal flood mapping for Norway using lidar data. Nat. Hazards Earth Syst. Sci. 2020, 20, 673–694. [Google Scholar] [CrossRef] [Green Version]
- Eini, M.; Kaboli, H.S.; Rashidian, M.; Hedayat, H. Hazard and vulnerability in urban flood risk mapping: Machine learning techniques and considering the role of urban districts. Int. J. Disaster Risk Reduct. 2020, 50, 101687. [Google Scholar] [CrossRef]
- Darabi, H.; Choubin, B.; Rahmati, O.; Haghighi, A.T.; Pradhan, B.; Kløve, B. Urban flood risk mapping using the GARP and QUEST models: A comparative study of machine learning techniques. J. Hydrol. 2019, 569, 142–154. [Google Scholar] [CrossRef]
- Wang, H.; Sanchez-Molina, J.A.; Li, M.; Rodríguez Díaz, F. Improving the performance of vegetable leaf wetness duration models in greenhouses using decision tree learning. Water 2019, 11, 158. [Google Scholar] [CrossRef] [Green Version]
- Dilshad, A.; Muhammad, A. Flood hazards and factors influencing household flood perception and mitigation strategies in Pakistan. Environ. Sci. Pollut. Res. Int. 2020, 27, 15375–15387. [Google Scholar]
- Shah, A.A.; Ye, J.; Abid, M.; Khan, J.; Amir, S.M. Flood hazards: Household vulnerability and resilience in disaster-prone districts of Khyber Pakhtunkhwa province, Pakistan. Nat. Hazards 2018, 93, 147–165. [Google Scholar] [CrossRef]
- Towfiqul Islam, A.R.; Talukdar, S.; Mahato, S.; Kundu, S.; Eibek, K.U.; Pham, Q.B.; Kuriqi, A.; Linh, N.T. Flood susceptibility modelling using advanced ensemble machine learning models. Geosci. Front. 2021, 12, 101075. [Google Scholar] [CrossRef]
- Talukdar, S.; Ghose, B.; Shahfahad; Salam, R.; Mahato, S.; Pham, Q.B.; Linh, N.T.; Costache, R.; Avand, M. Flood susceptibility modeling in Teesta river basin, Bangladesh using novel ensembles of bagging algorithms. Stoch. Environ. Res. Risk Assess. 2020, 34, 2277–2300. [Google Scholar] [CrossRef]
- Mosavi, A.; Ozturk, P.; Chau, K.W. Flood prediction using machine learning models: Literature review. Water 2018, 10, 1536. [Google Scholar] [CrossRef] [Green Version]
- Grimaldi, S.; Schumann, G.P.; Shokri, A.; Walker, J.P.; Pauwels, V.R.N. Challenges, opportunities, and pitfalls for global coupled hydrologic-hydraulic modeling of floods. Water Resour. Res. 2019, 55, 5277–5300. [Google Scholar] [CrossRef] [Green Version]
- Hussain, F.; Wu, R.S.; Wang, J.X. Comparative study of very short-term flood forecasting using physics-based numerical model and data-driven prediction model. Nat. Hazards 2021, 107, 249–284. [Google Scholar] [CrossRef]
- Sankaranarayanan, S.; Prabhakar, M.; Satish, S.; Jain, P.; Ramprasad, A.; Krishnan, A. Flood prediction based on weather parameters using deep learning. J. Water Clim. Chang. 2020, 11, 1766–1783. [Google Scholar] [CrossRef]
- Fakhruddin, B.S.; Gluckman, P.; Bardsley, A.; Griffiths, G.; McElroy, A. Creating resilient communities with medium-range hazard warning systems. Prog. Disaster Sci. 2021, 12, 100203. [Google Scholar] [CrossRef]
- Han, S.; Coulibaly, P. Bayesian flood forecasting methods: A review. J. Hydrol. 2017, 551, 340–351. [Google Scholar] [CrossRef]
- Bayat, M.; Tavakkoli, O. Application of machine learning in flood forecasting. Future Technol. 2022, 1, 1–6. [Google Scholar] [CrossRef]
- Nkwunonwo, U.C.; Whitworth, M.; Baily, B. A review of the current status of flood modelling for urban flood risk management in the developing countries. Sci. Afr. 2020, 7, e00269. [Google Scholar] [CrossRef]
- Jodhani, K.H.; Patel, D.; Madhavan, N. A review on analysis of flood modelling using different numerical models. Mater. Today Proc. 2021. [CrossRef]
- Díez-Herrero, A.; Garrote, J. Flood risk analysis and assessment, applications and uncertainties: A bibliometric review. Water 2020, 12, 2050. [Google Scholar] [CrossRef]
- Gough, D.; Davies, P.; Jamtvedt, G.; Langlois, E.; Littell, J.; Lotfi, T.; Masset, E.; Merlin, T.; Pullin, A.S.; Ritskes-Hoitinga, M.; et al. Evidence synthesis international (ESI): Position statement. Syst. Rev. 2020, 9, 155. [Google Scholar] [CrossRef]
- Brennan, M.L.; Arlt, S.P.; Belshaw, Z.; Buckley, L.; Corah, L.; Doit, H.; Fajt, V.R.; Grindlay, D.J.; Moberly, H.K.; Morrow, L.D.; et al. Critically appraised topics (CATs) in veterinary medicine: Applying evidence in clinical practice. Front. Vet. Sci. 2020, 7, 314. [Google Scholar] [CrossRef] [PubMed]
- Grant, M.J.; Booth, A. A typology of reviews: An analysis of 14 review types and associated methodologies. Health Inf. Libr. J. 2009, 26, 91–108. [Google Scholar] [CrossRef]
- O’Gorman, C.S.; Macken, A.P.; Cullen, W.; Saunders, J.; Dunne, C.P.; Higgins, M.F. What are the differences between a literature search, a literature review, a systematic review and a meta-analysis? And why is a systematic review considered to be so good? Ir. Med. J. 2013, 106, 8–19. [Google Scholar]
- Munn, Z.; Peters, M.D.; Stern, C.; Tufanaru, C.; McArthur, A.; Aromataris, E. Systematic review or scoping review? Guidance for authors when choosing between a systematic or scoping review approach. BMC Med. Res. Methodol. 2018, 18, 143. [Google Scholar] [CrossRef]
- Chellappandi, P.; Vijayakumar, C.S. Bibliometrics, Scientometrics, Webometrics/Cybermetrics, Informetrics and Altmetrics--An Emerging Field in Library and Information Science Research. Shanlax Int. J. Educ. 2018, 7, 5–8. [Google Scholar]
- Van Raan, A. Measuring science: Basic principles and application of advanced bibliometrics. In Springer Handbook of Science and Technology Indicators; Springer: Cham, Switzerland, 2019; pp. 237–280. [Google Scholar]
- Hincapie, M.; Diaz, C.; Valencia, A.; Contero, M.; Güemes-Castorena, D. Educational applications of augmented reality: A bibliometric study. Comput. Electr. Eng. 2021, 93, 107289. [Google Scholar] [CrossRef]
- Aman, VA new bibliometric approach to measure knowledge transfer of internationally mobile scientists. Scientometrics 2018, 117, 227–247. [CrossRef]
- López-Robles, J.R.; Cobo, M.J.; Gutiérrez-Salcedo, M.; Martínez-Sánchez, M.A.; Gamboa-Rosales, N.K.; Herrera-Viedma, E. 30th Anniversary of Applied Intelligence: A combination of bibliometrics and thematic analysis using SciMAT. Appl. Intell. 2021, 51, 6547–6568. [Google Scholar] [CrossRef]
- Soliman, M.; Lyulyov, O.; Shvindina, H.; Figueiredo, R.; Pimonenko, T. Scientific output of the European Journal of Tourism Research: A bibliometric overview and visualization. Eur. J. Tour. Res. 2021, 28, 2801. [Google Scholar] [CrossRef]
- Nadhiroh, I.M.; Hardiyati, R.; Amelia, M.; Handayani, T. Mathematics and statistics related studies in Indonesia using co-authorship network analysis. Int. J. Adv. Intell. Inform. 2018, 4, 142–153. [Google Scholar] [CrossRef]
- Akudinobi, E.A.; Kilmarx, P.H. Bibliometric analysis of sub-Saharan African and S.U.S. authorship in publications about sub-Saharan Africa funded by the Fogarty International Center, 2008–2020. BMJ Glob. Health 2022, 7, e009466. [Google Scholar] [CrossRef] [PubMed]
- Ullah, M.; Shahid, A.; Din, I.U.; Roman, M.; Assam, M.; Fayaz, M.; Ghadi, Y.; Aljuaid, H. Analyzing Interdisciplinary Research Using Co-Authorship Networks. Complexity 2022, 2022, 2524491. [Google Scholar] [CrossRef]
- Mihăilă, B.E. The impact of transnational co-authorship on the scientific quality of academic researchers-Case Studies: Slovenia, Poland and Romania. Int. Rev. Soc. Res. 2018, 8, 129–142. [Google Scholar] [CrossRef] [Green Version]
- Hart, K.L.; Perlis, R.H. Authorship inequality: A bibliometric study of the concentration of authorship among a diminishing number of individuals in high-impact medical journals, 2008–2019. BMJ Open 2021, 11, e046002. [Google Scholar] [CrossRef]
- Ullah, A.; Ameen, K. Relating research growth, authorship patterns and publishing outlets: A bibliometric study of LIS articles produced by Pakistani authors. Scientometrics 2021, 126, 8029–8047. [Google Scholar] [CrossRef]
- Beshyah, W.S.; Beshyah, S.A. Bibliometric analysis of the literature on Ramadan fasting and diabetes in the past three decades (1989–2018). Diabetes Res. Clin. Pract. 2019, 151, 313–322. [Google Scholar] [CrossRef] [Green Version]
- Yang, Y.; Gao, X.; Guo, Z.; Chen, D. Learning Bayesian networks using the constrained maximum a posteriori probability method. Pattern Recognition 2019, 91, 123–134. [Google Scholar] [CrossRef]
- Praveen, K.V.; Singh, A.; Kumar, P.; Jha, G.K.; Kingsly, I. Advancing with fertilizers in Indian agriculture: Trends, challenges, and research priorities. Agric. Econ. Res. 2020, 33, 49–60. [Google Scholar] [CrossRef]
- Mani, N.S.; Hayes, B.E.; Dodd, A.; Yu, F.; Cawley, M.A. New data-related roles for librarians: Using bibliometric analysis and visualization to increase visibility of research impact. In Handbook of Research on Knowledge and Organization Systems in Library and Information Science; IGI Global: Hershey, PA, USA, 2021; pp. 317–345. [Google Scholar]
- Sweileh, W.M. Global research activity on elder abuse: A bibliometric analysis (1950–2017). J. Immigr. Minor. Health 2021, 23, 79–87. [Google Scholar] [CrossRef] [PubMed]
- Yao, J.; Guo, X.; Wang, L.; Jiang, H. Understanding green consumption: A literature review based on factor analysis and bibliometric method. Sustainability 2022, 14, 8324. [Google Scholar] [CrossRef]
- de Oliveira, O.J.; da Silva, F.F.; Juliani, F.; Barbosa, L.C.F.M.; Nunhes, T.V. Bibliometric method for mapping the state-of-the-art and identifying research gaps and trends in literature: An essential instrument to support the development of scientific projects. In Scientometrics Recent Advances; IntechOpen: London, UK, 2019. [Google Scholar]
- Huertas-Valdivia, I.; Ferrari, A.M.; Settembre-Blundo, D.; García-Muiña, F.E. Social life-cycle assessment: A review by bibliometric analysis. Sustainability 2020, 12, 6211. [Google Scholar] [CrossRef]
- Tarragona, J.; de Gracia, A.; Cabeza, L.F. Bibliometric analysis of smart control applications in thermal energy storage systems. A model predictive control approach. J. Energy Storage 2020, 32, 101704. [Google Scholar] [CrossRef]
- Marinescu, C.; Cicea, C.; Colesca, S.E. Tracking biofuels-innovation relationship through scientific and technological advances. Manag. Res. Pract. 2019, 11, 31–44. [Google Scholar]
- Zacharewicz, T.; Lepori, B.; Reale, E.; Jonkers, K. Performance-based research funding in U.E.U. Member States—A comparative assessment. Sci. Public Policy 2019, 46, 105–115. [Google Scholar] [CrossRef]
- Mejia, C.; Wu, M.; Zhang, Y.; Kajikawa, Y. Exploring topics in bibliometric research through citation networks and semantic analysis. Front. Res. Metr. Anal. 2021, 6, 742311. [Google Scholar] [CrossRef]
- Scopus. Available online: https://www.scopus.com/home.uri (accessed on 24 March 2022).
- Aboelela, M.A.; Alrefaey, A.K. Lidocaine versus magnesium sulfate infusion during isoflurane anesthesia for brain tumor resection, effect on minimum alveolar concentration reduction guided by bispectral index: A prospective randomized controlled trial. Signa Vitae 2022, 18, 108–114. [Google Scholar]
- Kim, D.W.; Jo, Y.H.; Park, S.M.; Lee, D.K.; Jang, D.H. Neurological pupil index during cardiopulmonary resuscitation is associated with admission to ICU in non-traumatic out-of-hospital cardiac arrest patients. Signa Vitae 2022, 1, 7. [Google Scholar]
- Panes, P.; Macariola, M.A.; Niervo, C.; Maghanoy, A.G.; Garcia, K.P.; Ignacio, J.J. A bibliometric approach for analyzing the potential role of waste-derived nanoparticles in the upstream oil and gas industry. Clean. Eng. Technol. 2022, 8, 100468. [Google Scholar] [CrossRef]
- Bramer, W.M.; Rethlefsen, M.L.; Kleijnen, J.; Franco, O.H. Optimal database combinations for literature searches in systematic reviews: A prospective exploratory study. Systematic Rev. 2017, 6, 245. [Google Scholar] [CrossRef] [PubMed]
- Zhang, Y.C.; Luo, W.Z.; Shan, M.; Pan, D.W.; Mu, W.J. Systematic analysis of PPP research in construction journals: From 2009 to 2019. Eng. Constr. Archit. Manag. 2020, 27, 3309–3339. [Google Scholar] [CrossRef]
- Kukah, A.S.; Akomea-Frimpong, I.; Jin, X.; Osei-Kyei, R. Emotional intelligence (EI) research in the construction industry: A review and future directions. Eng. Constr. Archit. Manag. 2021, 29, 4267–4286. [Google Scholar]
- Aria, M.; Alterisio, A.; Scandurra, A.; Pinelli, C.; D’Aniello, B. The scholar’s best friend: Research trends in dog cognitive and behavioral studies. Anim. Cogn. 2021, 24, 541–553. [Google Scholar] [CrossRef]
- Paprotny, D.; Sebastian, A.; Morales-Nápoles, O.; Jonkman, S.N. Trends in flood losses in Europe over the past 150 years. Nat. Commun. 2018, 9, 1985. [Google Scholar] [CrossRef]
- Tayfur, G.; Singh, V.P.; Moramarco, T.; Barbetta, S. Flood hydrograph prediction using machine learning methods. Water 2018, 10, 968. [Google Scholar] [CrossRef] [Green Version]
- Farizawani, A.; Puteh, M.; Marina, Y.; Rivaie, A. A review of artificial neural network learning rule based on multiple variant of conjugate gradient approaches. J. Phys. Conf. Ser. 2020, 1529, 022040. [Google Scholar] [CrossRef]
- Sheffield, J.; Wood, E.F.; Pan, M.; Beck, H.; Coccia, G.; Serrat-Capdevila, A.; Verbist, K. Satellite remote sensing for water resources management: Potential for supporting sustainable development in data-poor regions. Water Resour. Res. 2018, 54, 9724–9758. [Google Scholar] [CrossRef] [Green Version]
- Cui, Y.; Chen, X.; Gao, J.; Yan, B.; Tang, G.; Hong, Y. Global water cycle and remote sensing big data: Overview, challenge, and opportunities. Big Earth Data 2018, 2, 282–297. [Google Scholar] [CrossRef] [Green Version]
- Sui, X.; Wu, Q.; Liu, J.; Chen, Q.; Gu, G. A review of optical neural networks. IEEE Access 2020, 8, 70773–70783. [Google Scholar] [CrossRef]
- Gurney, K. An Introduction to Neural Networks; CRC Press: Boca Raton, FL, USA, 2018. [Google Scholar]
- Kamilaris, A.; Prenafeta-Boldú, F.X. Deep learning in agriculture: A survey. Comput. Electron. Agric. 2018, 147, 70–90. [Google Scholar] [CrossRef] [Green Version]
- Prieto, A.; Prieto, B.; Ortigosa, E.M.; Ros, E.; Pelayo, F.; Ortega, J.; Rojas, I. Neural networks: An overview of early research, current frameworks and new challenges. Neurocomputing 2016, 214, 242–268. [Google Scholar] [CrossRef]
- Mohsen, H.; El-Dahshan, E.-S.A.; El-Horbaty, E.-S.M.; Salem, A.-B.M. Classification using deep learning neural networks for brain tumors. Future Comput. Inform. J. 2018, 3, 68–71. [Google Scholar] [CrossRef]
- Nápoles, G.; Vanhoenshoven, F.; Vanhoof, K. Short-term cognitive networks, flexible reasoning and nonsynaptic learning. Neural Netw. 2019, 115, 72–81. [Google Scholar] [CrossRef] [Green Version]
- Batina, L.; Bhasin, S.; Jap, D.; Picek, S. CSI neural network: Using side-channels to recover your artificial neural network information. Cryptol. Eprint Arch. 2018, 477, 1–15. [Google Scholar]
- Elsafi, S.H. Artificial neural networks (ANNs) for flood forecasting at Dongola Station in the River Nile, Sudan. Alex. Eng. J. 2014, 53, 655–662. [Google Scholar] [CrossRef]
- Mazumder, M.T.R.; Gupta, B.C. Flood Forecasting Using Artificial Neural Network (ANNs): A Case study of Jamuna River. In AGU Fall Meeting Abstracts; AGU Fall Meeting: New Orleans, LA, USA, 2021; Volume 2021, p. NH35F–12. [Google Scholar]
- Vijay, S.; Kamaraj, K. Prediction of water quality index in drinking water distribution system using activation functions based Ann. Water Resour. Manag. 2021, 35, 535–553. [Google Scholar] [CrossRef]
- Chao, W.T.; Young, C.C.; Hsu, T.W.; Liu, W.C.; Liu, C.Y. Long-lead-time prediction of storm surge using artificial neural networks and effective typhoon parameters: Revisit and deeper insight. Water 2020, 12, 2394. [Google Scholar] [CrossRef]
- Feng, Z.K.; Niu, W.J. Hybrid artificial neural network and cooperation search algorithm for nonlinear river flow time series forecasting in humid and semi-humid regions. Knowl. Based Syst. 2021, 211, 106580. [Google Scholar] [CrossRef]
- Poonia, V.; Tiwari, H.L. Rainfall-runoff modeling for the Hoshangabad Basin of Narmada River using artificial neural network. Arab. J. Geosci. 2020, 13, 944. [Google Scholar] [CrossRef]
- Hunt, K.M.; Matthews, G.R.; Pappenberger, F.; Prudhomme, C. Using a long short-term memory (LSTM) neural network to boost river streamflow forecasts over the western United States. Hydrol. Earth Syst. Sci. Discuss. 2022, 26, 5449–5472. [Google Scholar] [CrossRef]
- Jimeno-Sáez, P.; Senent-Aparicio, J.; Pérez-Sánchez, J.; Pulido-Velazquez, D. A comparison of SWAT and ANN models for daily runoff simulation in different climatic zones of peninsular Spain. Water 2018, 10, 192. [Google Scholar] [CrossRef] [Green Version]
- Najah Ahmed, A.; Binti Othman, F.; Abdulmohsin Afan, H.; Khaleel Ibrahim, R.; Ming Fai, C.; Shabbir Hossain, M.; Ehteram, M.; Elshafie, A. Machine learning methods for better water quality prediction. J. Hydrol. 2019, 578, 124084. [Google Scholar] [CrossRef]
- Yogi, G. Performance Analysis of Attribute Selection Methods in Decision Tree Induction. Master’s Thesis, Department of Computer Science & Information Technology, Tribhuvan University, Kathmandu, Nepal, 3 April 2018. [Google Scholar]
- Nguyen, H.H.X.; Dang, T.K.; Nguyen, N.D. A Hybrid Approach Using Decision Tree and Multiple Linear Regression for Predicting Students’ Performance. In International Conference on Future Data and Security Engineering; Springer: Singapore, 2021; pp. 23–35. [Google Scholar]
- Rutkowski, L.; Jaworski, M.; Duda, P. Decision trees in data stream mining. In Stream Data Mining: Algorithms and Their Probabilistic Properties; Springer: Cham, Switzerland, 2020; pp. 37–50. [Google Scholar]
- Choubin, B.; Zehtabian, G.; Azareh, A.; Rafiei-Sardooi, E.; Sajedi-Hosseini, F.; Kişi, Ö. Precipitation forecasting using classification and regression trees (CART) model: A comparative study of different approaches. Environ. Earth Sci. 2018, 77, 314. [Google Scholar] [CrossRef]
- Pham, L.T.; Luo, L.; Finley, A. Evaluation of random forests for short-term daily streamflow forecasting in rainfall-and snowmelt-driven watersheds. Hydrol. Earth Syst. Sci. 2021, 25, 2997–3015. [Google Scholar] [CrossRef]
- Khosravi, K.; Pham, B.T.; Chapi, K.; Shirzadi, A.; Shahabi, H.; Revhaug, I.; Prakash, I.; Tien Bui, D. A comparative assessment of decision trees algorithms for flash flood susceptibility modeling at Haraz watershed, Northern Iran. Sci. Total Environ. 2018, 627, 744–755. [Google Scholar] [CrossRef]
- Elmahdy, S.; Ali, T.; Mohamed, M. Flash Flood Susceptibility modeling and magnitude index using machine learning and geohydrological models: A modified hybrid approach. Remote Sens. 2020, 12, 2695. [Google Scholar] [CrossRef]
- de Mello, R.F.; Ponti, M.A. Statistical Learning Theory. In Machine Learning; Springer: Cham, Switzerland, 2019; p. 75. [Google Scholar]
- Savithri, V.; Ruso, T.; Diana, J.I.; Prasanna, S.; Hariharan, G. Crow Intelligence Estimation using Artificial Intelligence. Ann. Rom. Soc. Cell Biol. 2021, 25, 10620–10629. [Google Scholar]
- Sahana, M.; Rehman, S.; Sajjad, H.; Hong, H. Exploring effectiveness of frequency ratio and support vector machine models in storm surge flood susceptibility assessment: A study of Sundarban Biosphere Reserve, India. Catena 2020, 189, 104450. [Google Scholar] [CrossRef]
- Zehra, N. Prediction Analysis of Floods Using Machine Learning Algorithms (NARX & SVM). Int. J. Sci. Basic Appl. Res. 2020, 4531, 24–34. [Google Scholar]
- Wang, Y.; Fang, Z.; Hong, H.; Peng, L. Flood susceptibility mapping using convolutional neural network frameworks. J. Hydrol. 2020, 582, 124482. [Google Scholar] [CrossRef]
- Fu, M.; Fan, T.; Ding, Z.A.; Salih, S.Q.; Al-Ansari, N.; Yaseen, Z.M. Deep learning data-intelligence model based on adjusted forecasting window scale: Application in daily streamflow simulation. IEEE Access 2020, 8, 32632–32651. [Google Scholar] [CrossRef]
- Anees, M.T.; Abdullah, K.; Nawawi, M.N.M.; Ab Rahman, N.N.N.; Piah, A.R.M.; Zakaria, N.A.; Syakir, M.I.; Omar, A.M. Numerical modelling techniques for flood analysis. J. Afr. Earth Sci. 2016, 124, 478–486. [Google Scholar] [CrossRef]
- Son, A.L.; Kim, B.; Han, K.Y. A simple and robust method for simultaneous consideration of overland and underground space in urban flood modeling. Water 2016, 8, 494. [Google Scholar] [CrossRef] [Green Version]
- Hu, R.; Fang, F.; Salinas, P.; Pain, C.C.; Domingo, N.S.; Mark, O. Numerical simulation of floods from multiple sources using an adaptive anisotropic unstructured mesh method. Adv. Water Resour. 2019, 123, 173–188. [Google Scholar] [CrossRef]
- Teng, J.; Vaze, J.; Dutta, D.; Marvanek, S. Rapid inundation modelling in large floodplains using LiDAR DEM. Water Resour. Manag. 2015, 29, 2619–2636. [Google Scholar] [CrossRef]
- Guo, K.; Guan, M.; Yu, D. Urban surface water flood modelling—A comprehensive review of current models and future challenges. Hydrol. Earth Syst. Sci. 2021, 25, 2843–2860. [Google Scholar] [CrossRef]
- de Almeida, G.A.; Bates, P.; Ozdemir, H. Modelling urban floods at submetre resolution: Challenges or opportunities for flood risk management? J. Flood Risk Manag. 2018, 11, S855–S865. [Google Scholar] [CrossRef]
- Munoz, D.H.; Constantinescu, G. A fully 3-D numerical model to predict flood wave propagation and assess the efficiency of flood protection measures. Adv. Water Resour. 2018, 122, 148–165. [Google Scholar] [CrossRef]
- Zhang, B.; Wu, B.; Ren, S.; Zhang, R.; Zhang, W.; Ren, J.; Chen, Y. Large-scale 3D numerical modelling of flood propagation and sediment transport and operational strategy in the Three Gorges Reservoir, China. J. Hydro-Environ. Res. 2021, 36, 33–49. [Google Scholar] [CrossRef]
- Jain, S.K.; Mani, P.; Jain, S.K.; Prakash, P.; Singh, V.P.; Tullos, D.; Kumar, S.; Agarwal, S.P.; Dimri, A.P. A brief review of flood forecasting techniques and their applications. Int. J. River Basin Manag. 2018, 16, 329–344. [Google Scholar] [CrossRef]
- Kaya, C.M.; Tayfur, G.; Gungor, O. Predicting flood plain inundation for natural channels having no upstream gauged stations. J. Water Clim. Chang. 2019, 10, 360–372. [Google Scholar] [CrossRef] [Green Version]
- Ming, X.; Liang, Q.; Xia, X.; Li, D.; Fowler, H.J. Real-time flood forecasting based on a high-performance 2-D hydrodynamic model and numerical weather predictions. Water Resour. Res. 2020, 56, e2019WR025583. [Google Scholar] [CrossRef]
- Rios, V.S.; Avansi, G.D.; Schiozer, D.J. Practical workflow to improve numerical performance in time-consuming reservoir simulation models using submodels and shorter period of time. J. Pet. Sci. Eng. 2020, 195, 107547. [Google Scholar] [CrossRef]
- Spiliopoulos, G.; Bereta, K.; Zissis, D.; Memos, C.; Makris, C.; Metallinos, A.; Kafarebas, T.; Chondros, M.; Emmanouilidou, M.; Papadimitriou, A.; et al. A big data framework for modelling and simulating high-resolution hydrodynamic models in sea harbours. In Proceedings of the Global Oceans 2020: Singapore—U.S. Gulf Coast, Biloxi, MS, USA, 5–30 October 2020. [Google Scholar] [CrossRef]
- Chondros, M.; Metallinos, A.; Papadimitriou, A.; Memos, C.; Tsoukala, V. A coastal flood early-warning system based on offshore sea state forecasts and artificial neural networks. J. Mar. Sci. Eng. 2021, 9, 1272. [Google Scholar] [CrossRef]
- Maschio, C.; Avansi, G.D.; da Silva, F.B.M.; Schiozer, D.J. Data assimilation for uncertainty reduction using different fidelity numerical models. J. Pet. Sci. Eng. 2022, 209, 109851. [Google Scholar] [CrossRef]
- Wu, Z.; Shen, Y.; Wang, H.; Wu, M. Assessing urban flood disaster risk using Bayesian network model and GIS applications. Geomat. Nat. Hazards Risk 2019, 10, 2163–2184. [Google Scholar] [CrossRef]
- Farooq, M.; Shafique, M.; Khattak, M.S. Flood hazard assessment and mapping of River Swat using HEC-RAS 2D model and high-resolution 12-m TanDEM-X DEM (WorldDEM). Nat. Hazards 2019, 97, 477–492. [Google Scholar] [CrossRef]
- Bezbradica, M.; Crane, M.; Ruskin, H.J. Release modelling of nanoencapsulated food ingredients by probabilistic models: Cellular automata and Monte Carlo methods. In Release and Bioavailability of Nanoencapsulated Food Ingredients; Academic Press: Cambridge, MA, USA, 2020; pp. 273–309. [Google Scholar] [CrossRef]
- Arabameri, A.; Rezaei, K.; Cerdà, A.; Conoscenti, C.; Kalantari, Z. A comparison of statistical methods and multi-criteria decision making to map flood hazard susceptibility in Northern Iran. Sci. Total Environ 2019, 660, 443–458. [Google Scholar] [CrossRef] [PubMed]
- Sriram, S.; Ramachandran, M.; Chinnasamy, S.; Mathivanan, G. A Review on Multi-Criteria Decision-Making and Its Application. REST J. Emerg. Trends Model. Manuf. 2022, 7, 101–107. [Google Scholar]
- Thakkar, J.J. Decision-making trial and evaluation laboratory (DEMATEL). In Multi-Criteria Decision Making; Springer: Singapore, 2021; pp. 139–159. [Google Scholar]
- Kadoić, N.; Divjak, B.; Begičević Ređep, N. Integrating the DEMATEL with the analytic network process for effective decision-making. Cent. Eur. J. Oper. Res. 2019, 27, 653–678. [Google Scholar] [CrossRef]
- Kanani-Sadat, Y.; Arabsheibani, R.; Karimipour, F.; Nasseri, M. A new approach to flood susceptibility assessment in data-scarce and ungauged regions based on GIS-based hybrid multi criteria decision-making method. J. Hydrol. 2019, 572, 17–31. [Google Scholar] [CrossRef]
- Mondal, M.; Biswas, A.; Haldar, S.; Mandal, S.; Mandal, P.; Bhattacharya, S.; Paul, S. Rural livelihood risk to hydro-meteorological extreme events: Empirical evidence from Indian Sundarban applying IPCC-AR5 and DEMATEL methodology. Int. J. Disaster Risk Reduct. 2022, 77, 103100. [Google Scholar] [CrossRef]
- Ekmekcioğlu, Ö.; Koc, K.; Özger, M. Towards flood risk mapping based on multi-tiered decision making in a densely urbanized metropolitan city of Istanbul. Sustain. Cities Soc. 2022, 80, 103759. [Google Scholar] [CrossRef]
- Azhar, N.A.; Radzi, N.A.; Wan Ahmad, W.S.H.M. Multi-criteria Decision Making: A Systematic Review. Recent Adv. Electr. Electron. Eng. Former. Recent Pat. Electr. Electron. Eng. 2021, 14, 779–801. [Google Scholar] [CrossRef]
- Skvarciany, V.; Vidžiūnaitė, S. Decent work and economic growth: The case study of the BRICS countries. Forum Sci. Oeconomia 2022, 10, 73–89. [Google Scholar]
- Thakkar, J.J. Technique for order preference and similarity to ideal solution (TOPSIS). In Multi-Criteria Decision Making; Springer: Singapore, 2021; pp. 83–91. [Google Scholar]
- Huang, C.N.; Lo, H.W. A Hybrid Z-Based MADM Model for the Evaluation of Urban Resilience. Math. Probl. Eng. 2021, 2021, 9474753. [Google Scholar] [CrossRef]
- Mahmood, A.; Arshad Ali, A.; Nazam, M.; Nazim, M. Developing an interplay among the psychological barriers for the adoption of industry 4.0 phenomenon. PLoS ONE 2021, 16, e0255115. [Google Scholar] [CrossRef]
- Irfan, M.; Elavarasan, R.M.; Ahmad, M.; Mohsin, M.; Dagar, V.; Hao, Y. Prioritizing and overcoming biomass energy barriers: Application of AHP and G-TOPSIS approaches. Technol. Forecast. Soc. Chang. 2022, 177, 121524. [Google Scholar] [CrossRef]
- Rafiei-Sardooi, E.; Azareh, A.; Choubin, B.; Mosavi, A.H.; Clague, J.J. Evaluating urban flood risk using hybrid method of TOPSIS and machine learning. Int. J. Disaster Risk Reduct. 2021, 66, 102614. [Google Scholar] [CrossRef]
- Thakkar, J.J. Preference Ranking organisation Method for Enrichment Evaluations (PROMETHEE). In Multi-Criteria Decision Making; Springer: Singapore, 2021; pp. 119–127. [Google Scholar]
- Uzun, B.; Almasri, A.; Uzun Ozsahin, D. Preference rankings organisation method for enrichment evaluation (PROMETHEE). In Application of Multi-Criteria Decision Analysis in Environmental and Civil Engineering; Springer: Cham, Switzerland, 2021; pp. 37–41. [Google Scholar]
- Abdullah, L.; Chan, W.; Afshari, A. Application of PROMETHEE method for green supplier selection: A comparative result based on preference functions. J. Ind. Eng. Int. 2019, 15, 271–285. [Google Scholar] [CrossRef] [Green Version]
- Díaz, H.; Loughney, S.; Wang, J.; Soares, C.G. Comparison of multicriteria analysis techniques for decision making on floating offshore wind farms site selection. Ocean. Eng. 2022, 248, 110751. [Google Scholar] [CrossRef]
- Mohdiwale, S.; Sahu, M.; Sinha, G.R.; Bajaj, V. Automated cognitive workload assessment using logical teaching learning-based optimization and PROMETHEE multi-criteria decision making approach. IEEE Sens. J. 2020, 20, 13629–13637. [Google Scholar] [CrossRef]
- Uğur, L.O. Selection of architecture company with PROMETHEE method. Repozytorium CeON 2018, 2018, 239–257. [Google Scholar]
- Moreira, M.Â.L.; de Araújo Costa, I.P.; Pereira, M.T.; Dos Santos, M.; Gomes, C.F.S.; Muradas, F.M. PROMETHEE-SAPEVO-M1 a Hybrid approach based on ordinal and cardinal inputs: Multi-Criteria evaluation of helicopters to support brazilian navy operations. Algorithms 2021, 14, 140. [Google Scholar] [CrossRef]
- Babaei, S.; Ghazavi, R.; Erfanian, M. Urban flood simulation and prioritization of critical urban sub-catchments using SWMM model and PROMETHEE II approach. Phys. Chem. Earth Parts A/B/C 2018, 105, 3–11. [Google Scholar] [CrossRef]
- Ramík, J. Pairwise Comparisons Method; Lecture Notes in Economics and Mathematical Systems; Springer: Cham, Switzerland, 2020; Volume 10, pp. 978–983. [Google Scholar]
- Faregh, W.; Benkhaled, A. GIS-based multicriteria approach for flood risk assessment in Sigus city, east Algeria. Arab. J. Geosci. 2021, 14, 1152. [Google Scholar] [CrossRef]
- Spanidis, P.M.; Roumpos, C.; Pavloudakis, F. A fuzzy-AHP methodology for Planning the risk management of Natural hazards in surface mining projects. Sustainability 2021, 13, 2369. [Google Scholar] [CrossRef]
- Li, Y.; Wei, M.; Liu, L.; Yu, B.; Dong, Z.; Xue, Q. Evaluation of the effectiveness of VOC-contaminated soil preparation based on AHP-CRITIC-TOPSIS model. Chemosphere 2021, 271, 129571. [Google Scholar] [CrossRef] [PubMed]
- Goumrasa, A.; Guendouz, M.; Guettouche, M.S.; Belaroui, A. Flood hazard susceptibility assessment in Chiffa wadi watershed and along the first section of Algeria North–South highway using GIS and AHP method. Appl. Geomat. 2021, 13, 565–585. [Google Scholar] [CrossRef]
- Kwatra, S.; Kumar, A.; Sharma, S.; Sharma, P. Stakeholder participation in prioritizing sustainability issues at regional level using analytic hierarchy process (AHP) technique: A case study of Goa, India. Environ. Sustain. Indic. 2021, 11, 100116. [Google Scholar] [CrossRef]
- Marović, I.; Perić, M.; Hanak, T. A multi-criteria decision support concept for selecting the optimal contractor. Appl. Sci. 2021, 11, 1660. [Google Scholar] [CrossRef]
- Mohanty, L.; Maiti, S. Probability of glacial lake outburst flooding in the Himalaya. Resour. Environ. Sustain. 2021, 5, 100031. [Google Scholar] [CrossRef]
- Dahri, N.; Yousfi, R.; Bouamrane, A.; Abida, H.; Pham, Q.B.; Derdous, O. Comparison of analytic network process and artificial neural network models for flash flood susceptibility assessment. J. Afr. Earth Sci. 2022, 193, 104576. [Google Scholar] [CrossRef]
- Thakkar, J.J. Analytic Hierarchy Process (AHP). In Multi-Criteria Decision Making; Springer: Singapore, 2021; pp. 33–62. [Google Scholar]
- Peng, K.H.; Tzeng, G.H. Exploring heritage tourism performance improvement for making sustainable development strategies using the hybrid-modified MADM model. Curr. Issues Tour. 2019, 22, 921–947. [Google Scholar] [CrossRef]
- Thakkar, J.J. Analytic Network Process (ANP). In Multi-Criteria Decision Making; Springer: Singapore, 2021; pp. 63–82. [Google Scholar]
- Kovačević, M.S.; Librić, L.; Ivoš, G.; Cerić, A. Application of reliability analysis for risk ranking in a levee reconstruction project. Sustainability 2020, 12, 1404. [Google Scholar] [CrossRef] [Green Version]
- Yariyan, P.; Avand, M.; Abbaspour, R.A.; Torabi Haghighi, A.; Costache, R.; Ghorbanzadeh, O.; Janizadeh, S.; Blaschke, T. Flood susceptibility mapping using an improved analytic network process with statistical models. Geomat. Nat. Hazards Risk 2020, 11, 2282–2314. [Google Scholar] [CrossRef]
- Dano, U.L.; Balogun, A.-L.; Matori, A.-N.; Wan Yusouf, K.; Abubakar, I.R.; Said Mohamed, M.A.; Aina, Y.A.; Pradhan, B. Flood Susceptibility Mapping Using GIS-Based Analytic Network Process: A Case Study of Perlis, Malaysia. Water 2019, 11, 615. [Google Scholar] [CrossRef] [Green Version]
- Chukwuma, E.; Okonkwo, C.; Ojediran, J.; Anizoba, D.; Ubah, J.; Nwachukwu, C. A GIS based flood vulnerability modelling of Anambra state using an integrated IVFRN-DEMATEL-ANP model. Heliyon 2021, 7, e08048. [Google Scholar] [CrossRef] [PubMed]
- Zhang, G.; Thai, V.V. Expert elicitation and Bayesian Network modeling for shipping accidents: A literature review. Saf. Sci. 2016, 87, 53–62. [Google Scholar] [CrossRef]
- Van de Schoot, R.; Depaoli, S.; King, R.; Kramer, B.; Märtens, K.; Tadesse, M.G.; Vannucci, M.; Gelman, A.; Veen, D.; Willemsen, J.; et al. Publisher correction: Bayesian statistics and modelling. Nat. Rev. Methods Prim. 2021, 1, 1. [Google Scholar] [CrossRef]
- Wilson, A.G.; Izmailov, P. Bayesian deep learning and a probabilistic perspective of generalization. Adv. Neural Inf. Process. Syst. 2020, 33, 4697–4708. [Google Scholar]
- Keprate, A.; Moslemian, R. Multiscale Damage Modelling of Composite Materials Using Bayesian Network. In Proceedings of the 1st International Conference on Structural Damage Modelling and Assessment; Springer: Singapore, 2021; pp. 135–150. [Google Scholar]
- Marcot, B.G.; Penman, T.D. Advances in Bayesian network modelling: Integration of modelling technologies. Environ. Model. Softw. 2019, 111, 386–393. [Google Scholar]
- Goodarzi, L.; Banihabib, M.E.; Roozbahani, A.; Dietrich, J. Bayesian network model for flood forecasting based on atmospheric ensemble forecasts. Nat. Hazards Earth Syst. Sci. 2019, 19, 2513–2524. [Google Scholar] [CrossRef] [Green Version]
- Klemas, V. Remote sensing of floods and flood-prone areas: An overview. J. Coast. Res. 2015, 31, 1005–1013. [Google Scholar] [CrossRef] [Green Version]
- Fattore, C.; Abate, N.; Faridani, F.; Masini, N.; Lasaponara, R. Google earth engine as multisensor open-source tool for supporting the preservation of archaeological areas: The case study of flood and fire mapping in Metaponto, Italy. Sensors 2021, 21, 1791. [Google Scholar] [CrossRef]
- Gorelick, N.; Hancher, M.; Dixon, M.; Ilyushchenko, S.; Thau, D.; Moore, R. Google Earth Engine: Planetary-scale geospatial analysis for everyone. Remote Sens. Environ. 2017, 202, 18–27. [Google Scholar] [CrossRef]
- Li, M.; Liu, K. Probabilistic prediction of significant wave height using dynamic Bayesian network and information flow. Water 2020, 20, 2075. [Google Scholar] [CrossRef]
Figure 1.
Comparison between the common types of evidence synthesis approaches (Adopted from Brennan et al., 2020 [38]).
Figure 1.
Comparison between the common types of evidence synthesis approaches (Adopted from Brennan et al., 2020 [38]).

Figure 3.
Production growth of research articles relating to flood prediction tools.

Figure 4.
Most Relevant Sources.

Figure 5.
The trending topics plot in the Flood prediction 2017–2022.

Figure 6.
Word cloud.

Figure 7.
Author’s Keywords Co-occurrence Network.

Figure 8.
Conceptual structure Map according to Multiple Correspondence Analysis (MCA).

Figure 9.
Thematic map showing clusters and the Author’s Keywords.

Figure 10.
A graph of country production of articles used for this research.

Figure 11.
Spatial distribution of articles used for this research.

Figure 12.
Machine learning model.

Table 1.
Global total casualties of flooding as against natural disasters from 1900–2021.
| Natural Disaster | Flooding | Percentage | |
|---|---|---|---|
| Deaths | 32,447,171 | 6,994,878 | 21.56 |
| Injured | 10,213,349 | 1,374,664 | 13.46 |
| The number of people affected | 8,142,696,037 | 3,798,244,028 | 46.65 |
| Number of people made homeless | 178,110,836 | 93,636,158 | 52.57 |
| Total people affected | 8,331,020,222 | 3,893,254,850 | 46.73 |
Notes: Source: [18] Emergency Events Database (EM-DAT) of The Centre for Research on the Epidemiology of Disaster (CRED). Available online: https://www.emdat.be/ (accessed on 20 February 2022).
Table 2.
Economic cost of flooding as against natural disasters.
| Natural Disaster | Flooding | Percentage | |
|---|---|---|---|
| Reconstruction Costs (‘000 US$) | 74,159,793 | 3,314,993 | 4.47 |
| Reconstruction Costs, Adjusted (‘000 US$) | 100,209,663 | 4,017,467 | 4.01 |
| Insured Damages (‘000 US$) | 875,638,961 | 89,040,096 | 10.17 |
| Insured Damages, Adjusted (‘000 US$) | 1,097,861,950 | 102,014,849 | 9.29 |
| Total Damages (‘000 US$) | 3,867,165,532 | 923,505,982 | 23.88 |
| Total Damages, Adjusted (‘000 US$) | 5,477,706,724 | 1,335,436,720 | 24.38 |
Notes: Source: [18], Emergency Events Database (EM-DAT) of The Centre for Research on the Epidemiology of Disaster (CRED). Available online: https://www.emdat.be/ (accessed on 20 February 2022).
Table 3.
Main Information about the data.
| Description | Results |
|---|---|
| Timespan | 2017–2022 |
| Sources (Journals) | 311 |
| Documents | 1101 |
| Average years from publication | 2.32 |
| Average citations per document | 14.51 |
| Average citations per year per doc | 3.72 |
| References | 59,827 |
| Article | 1101 |
| Author’s Keywords (DE) | 3104 |
| Authors | 3535 |
| Author Appearances | 5118 |
| Authors of single-authored documents | 24 |
| Authors of multi-authored documents | 3511 |
| Single-authored documents | 29 |
| Documents per Author | 0.311 |
| Authors per Document | 3.21 |
| Co-Authors per Documents | 4.65 |
| Collaboration Index | 3.28 |
Disclaimer/Publisher’s Note: The statements, opinions and data contained in all publications are solely those of the individual author(s) and contributor(s) and not of MDPI and/or the editor(s). MDPI and/or the editor(s) disclaim responsibility for any injury to people or property resulting from any ideas, methods, instructions or products referred to in the content. |
© 2023 by the authors. Licensee MDPI, Basel, Switzerland. This article is an open access article distributed under the terms and conditions of the Creative Commons Attribution (CC BY) license (https://creativecommons.org/licenses/by/4.0/).
Share and Cite
MDPI and ACS Style
Antwi-Agyakwa, K.T.; Afenyo, M.K.; Angnuureng, D.B. Know to Predict, Forecast to Warn: A Review of Flood Risk Prediction Tools. Water 2023, 15, 427. https://doi.org/10.3390/w15030427
AMA Style
Antwi-Agyakwa KT, Afenyo MK, Angnuureng DB. Know to Predict, Forecast to Warn: A Review of Flood Risk Prediction Tools. Water. 2023; 15(3):427. https://doi.org/10.3390/w15030427
Chicago/Turabian StyleAntwi-Agyakwa, Kwesi Twum, Mawuli Kwaku Afenyo, and Donatus Bapentire Angnuureng. 2023. "Know to Predict, Forecast to Warn: A Review of Flood Risk Prediction Tools" Water 15, no. 3: 427. https://doi.org/10.3390/w15030427
Note that from the first issue of 2016, this journal uses article numbers instead of page numbers. See further details here.