
Influencing Factors of Submarine Scouring and Siltation Changes in Offshore Area of Shandong Peninsula
by
 ,
,
Zhuoli Zhang
1,2,3,
Wei Gao
2,3,
Ping Li
2,3,*,
Jie Liu
2,3,
Yuanqin Xu
2,3,
Xia Wei
1,2,3 and
Anlong Li
1 1
College of Marine Geosciences, Ocean University of China, Qingdao 266100, China
2
Key Laboratory of Marine Geology and Metallogeny, First Institute of Oceanography, MNR, Qingdao 266061, China
3
Laboratory for Marine Geology, Pilot National Laboratory for Marine Science and Technology (Qingdao), Qingdao 266237, China
*
Author to whom correspondence should be addressed.
Water 2023, 15(3), 435; https://doi.org/10.3390/w15030435
Submission received: 21 October 2022
/
Revised: 1 January 2023
/
Accepted: 4 January 2023
/
Published: 21 January 2023
(This article belongs to the Special Issue Coastal Geomorphological Changes from Past to Present)
Abstract
:This study constructs a digital elevation model of the coastal waters of the Shandong Peninsula using GIS-based interpolation methods to investigate the 15-year characteristics of seabed scouring and siltation. It utilizes depth data of the Shandong Peninsula’s offshore area between 2004 and 2006 and 2017 and 2019. The results indicated that the Shandong Peninsula’s coastal-water seabed is characterized by integral siltation and local point scouring. In addition, the northwest Shandong Peninsula is dominated by siltation, mainly distributed between 2 and 5 m isobaths, with the largest siltation area located in Laizhou Bay. The net volume of siltation is 2.13 × 10⁸ m3, the siltation rate is 0.152 × 10⁸ m3.a−1, and the scouring is concentrated in the estuary and the west coast of Laizhou Bay. Scouring and siltation balance generally characterize the seabed in the northern coastal waters of the Shandong Peninsula, and the degree of scouring and siltation is weak. The siltation occurs primarily near the land area, while scouring occurs as the sea deepens. In the northeast of the Shandong Peninsula, the degree of scouring and siltation is extreme, and their distribution range is small, whereas in the south, siltation is distributed in large bays and straight coastal offshore waters, and its degree is relatively weak. At the southernmost end of the study area, the scouring and siltation in Jiaozhou Bay are spatially distributed and balanced. In reality, the key factors affecting the distribution of coastal-seabed scouring and siltation are materials transported by river sediment, coastal scouring, and human activities.
1. Introduction
Coastal areas play a vital role in the social and economic development of seaside countries and are also the most active area for human activities [1,2,3,4]. A total of 65% of the world’s cities with populations of more than 5 million people are located in coastal lowlands 10 m below sea level [5,6,7], and 1.4 billion people and 20% of the world’s land area are within 100 km of a coast. These have become increasingly sensitive to natural disasters due to rising sea levels, climate change, storm surges, and human activities, which endanger the sustainable development of society and the economy [8,9]. Changes in seabed scouring and siltation represent the transportation process of terrestrial materials in the seabed, which is of great significance to the stability of the nearshore geological environment. Therefore, studies on the scouring and siltation of underwater bank slopes are crucial for protecting coastal zones [10]. There are two methods for studying the changes in underwater scouring and siltation. One is by constructing a digital elevation model using spatial interpolation techniques to investigate the variations in underwater topography [11]. The other is to examine the changes in topography under different conditions utilizing numerical simulations [12,13].
From the Zhangweixin River estuary in the north to the Xiuzhen River estuary in the south, the Shandong Peninsula coastal area rises to form the Shandong Peninsula’s shallow-shelf sea. The water area has a depth of 20 m and is about 27,778 km2. The peninsula comprises bedrock, sandy, silty muddy, and artificial coast, and several substances enter the sea from the Yellow River. At the same time, coastal substances are continuously transported to the sea by hydrodynamic forces, such as waves and tidal currents, forming the typical coastal sedimentary system of the Shandong Peninsula. Some studies on beach scouring, geological geomorphology, and material transport regarding scouring and siltation change have been conducted in the Shandong Peninsula [12,13,14,15,16,17] and neighboring areas [18,19,20]. However, there are fewer investigations on the overall seabed scouring changes in the coastal waters of the Shandong Peninsula.
This study uses offshore depth data from the Shandong Peninsula to develop a seabed digital elevation model (DEM) utilizing ArcGIS tools, which analyzes two time periods (2004–2006 and 2017–2019). It analyzes the generated DEM to characterize the variation in coastal-seabed erosion and deposition along the Shandong Peninsula over the past 15 years. In addition, this paper discusses the effect of various factors, combined with the changes in isobaths, on the distribution of seabed erosion and deposition during the period.
2. Materials and Methods
2.1. Study Area
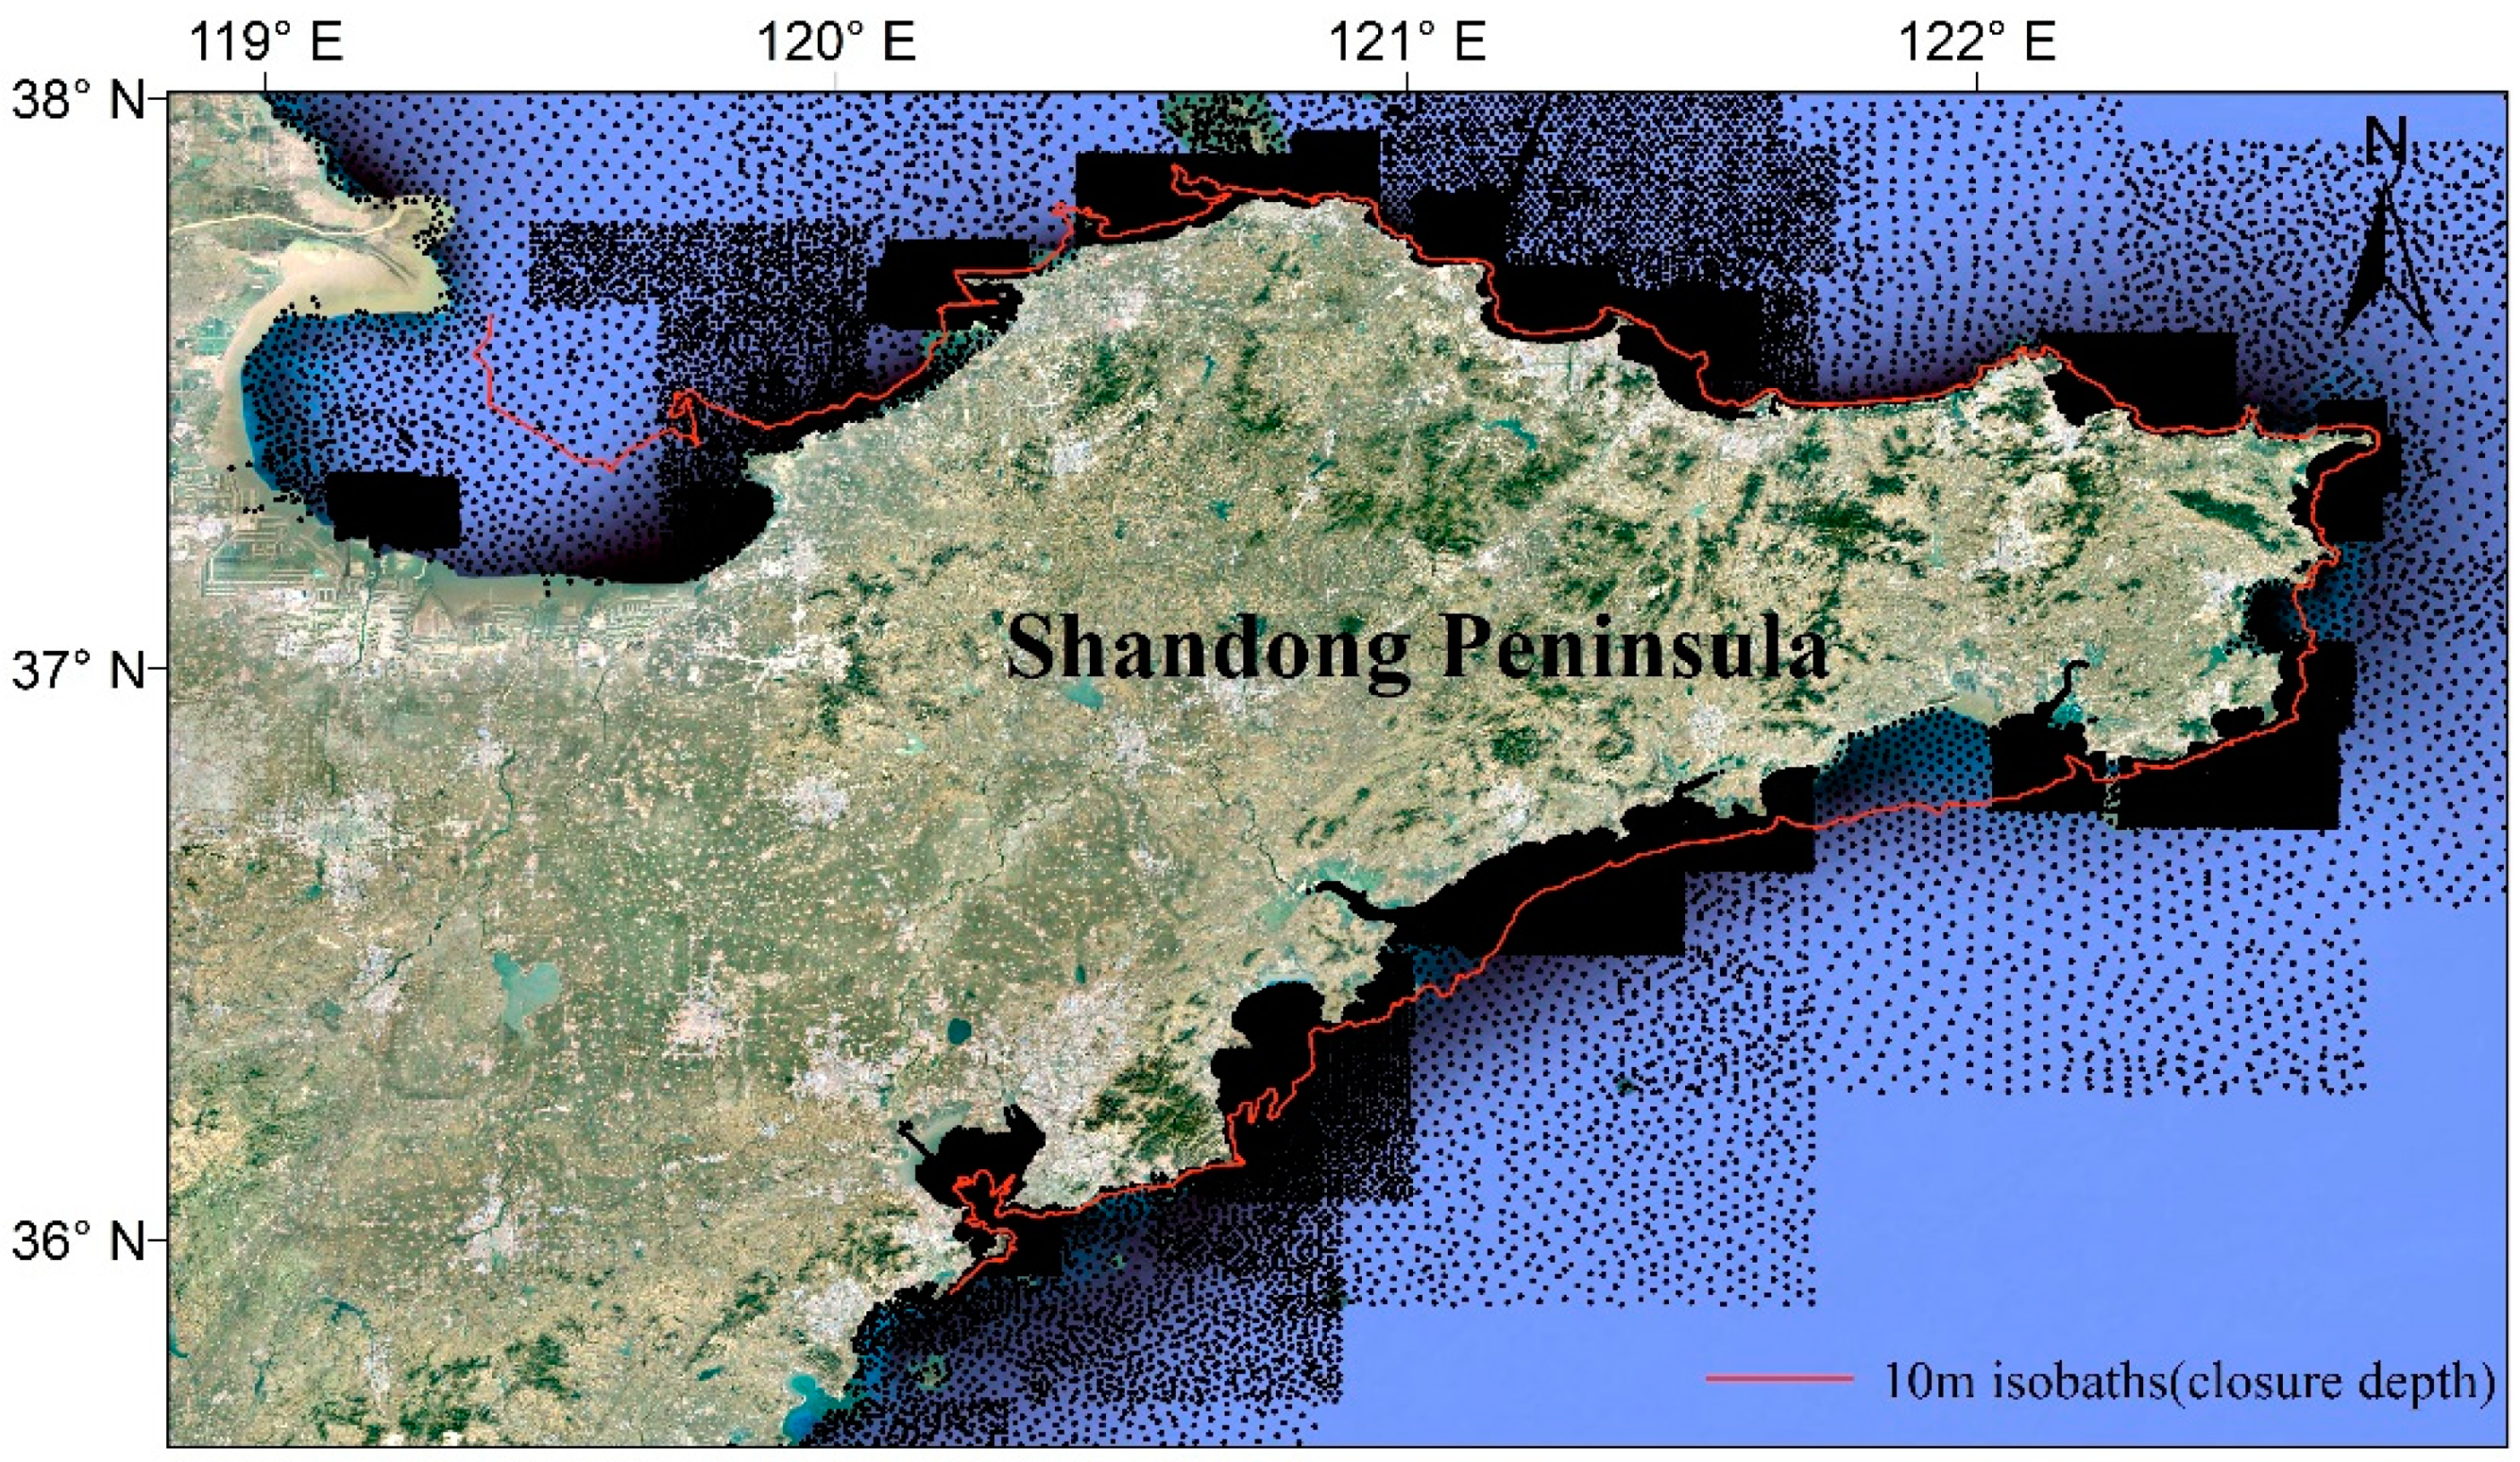
The coastline length of the Shandong Peninsula accounts for one-sixth of the total coastline length of mainland China, and the shallow offshore area accounts for a large proportion. For studies of coastal-zone evolution, the closure depth is usually monitored in the beach profile. Closure depth is the water depth limit at which waves significantly affect the formation of bottom sediments and the shaping of underwater bank slopes. At the closure depth, the coastal profile has no obvious geomorphological multi-year or seasonal changes. Above the closure depth, the coastal profile shows significant scouring and siltation changes within a specific range and represents the advanced-retreat changes in the shoreline on the plane [21]. By considering the closure depth and the coverage range of the data, the study area is Shandong Peninsula’s offshore area, that is, area between 0–10 m contour along the coast from Laizhou Bay to Jiaozhou Bay in two time periods, from 2004 to 2006 and from 2017 to 2019, as shown in Figure 1.
2.2. Data Sources
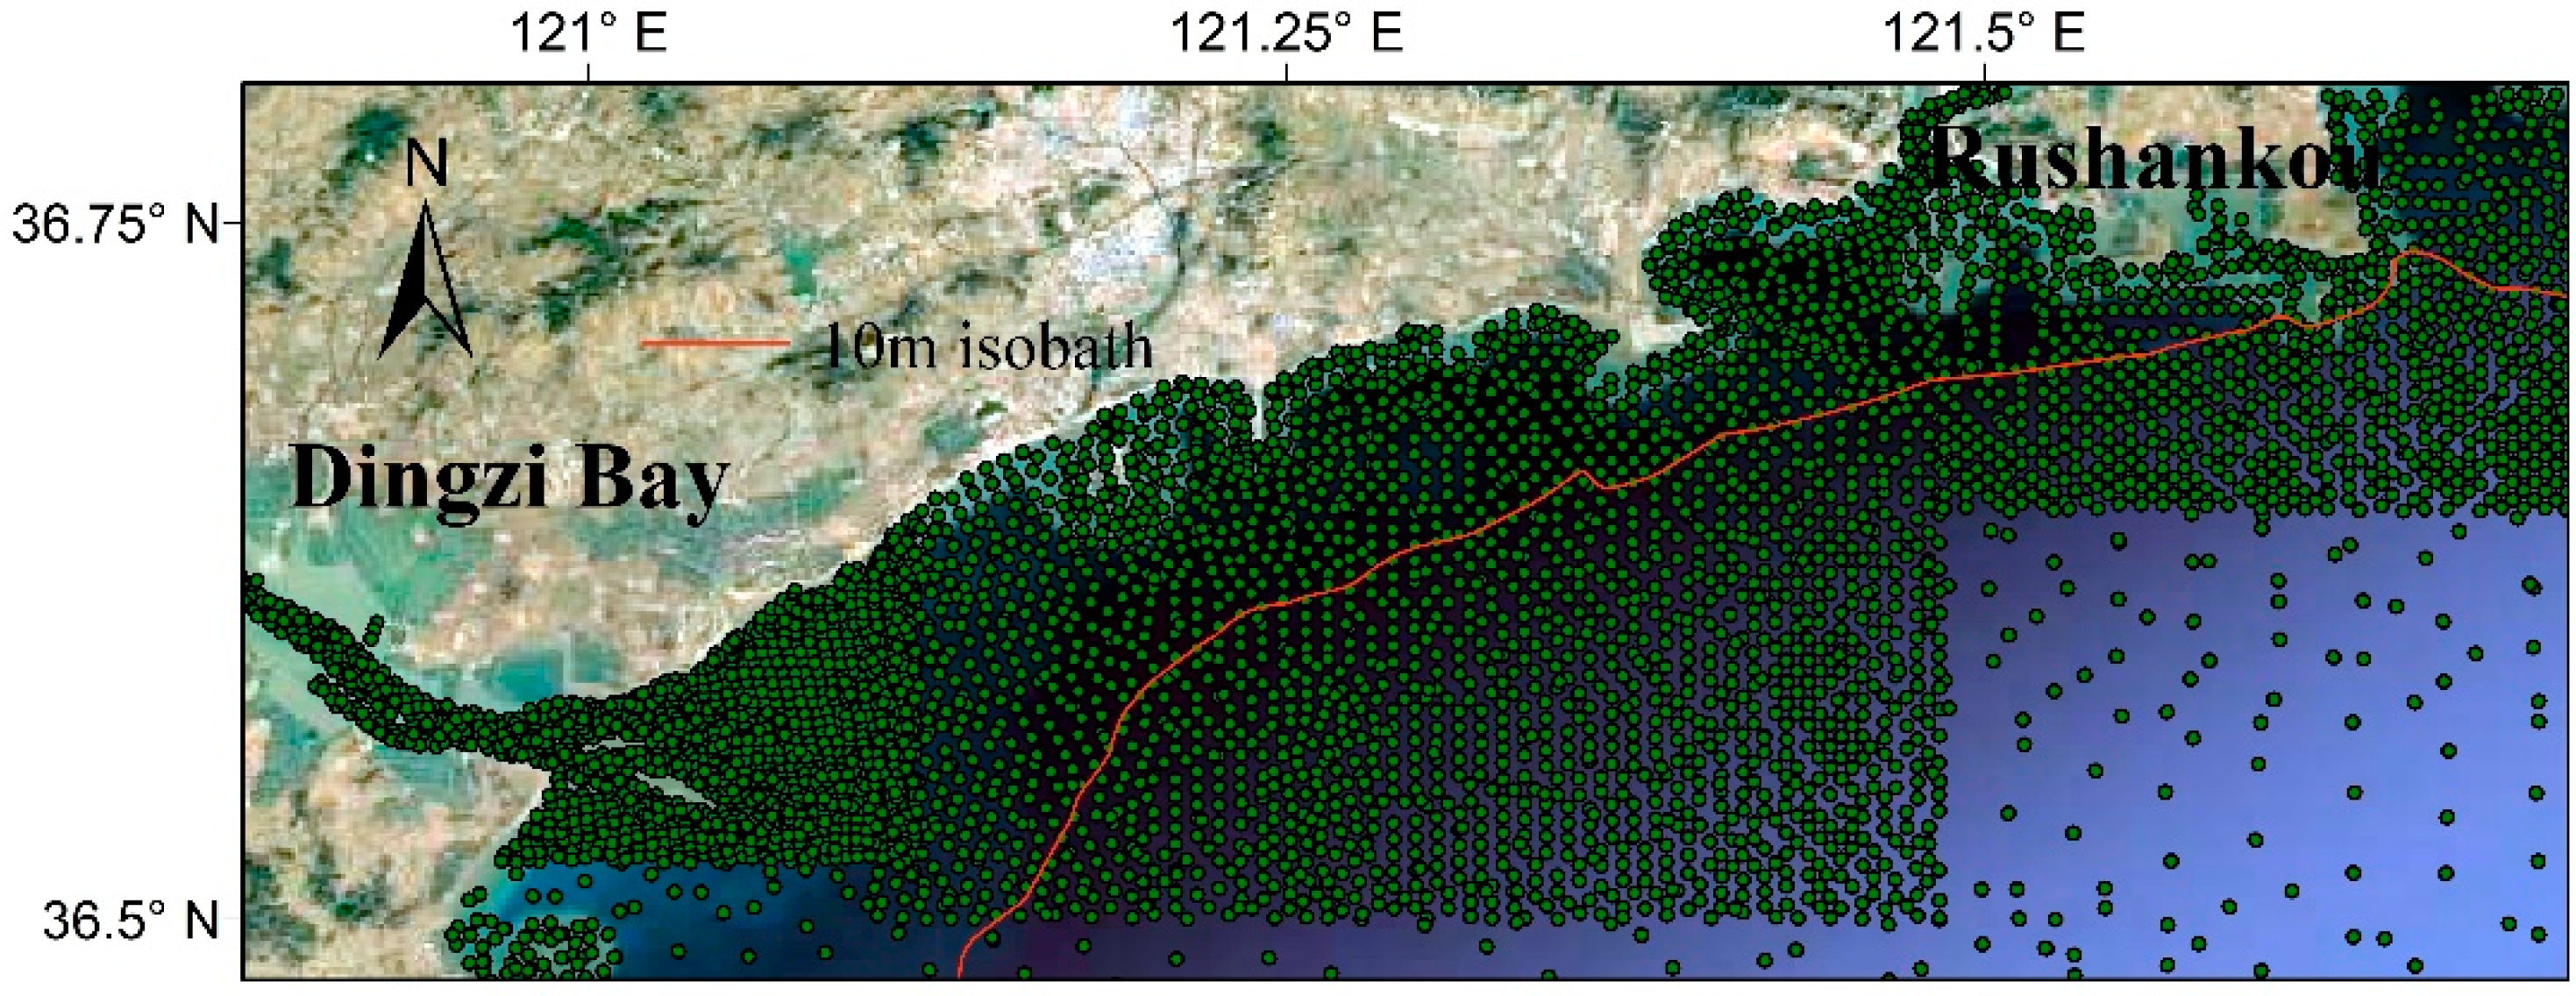
The research data were collected from electronic navigational charts (ENC). They were created by the Chinese Naval Hydrographic Office (CNHO) and complied with the Transfer Standard for Digital Hydrographic Data (S-57). The data’s depth value adheres to the A1 standard (the highest depth precision), and its position accuracy conforms to China’s sea-lane survey specification (GB 12327–1998). The study’s data were captured from measured points at water depths in the Shandong peninsula at two periods. The water-depth datum plane is the theoretical-depth datum plane, the lowest tide level, and the spatial reference system is the world geodetic system 1984 (WGS84) (Table 1). The water-depth data was divided into seven sections according to geographical region: Laizhou Bay, Diaolongzui to Miaodao Strait, Luanjiakou Port to Taozi Bay, Taozi Bay to Yangma Island, Weihai Port to Jinghai Bay, and Rushankou to Dingzi Bay and Jiaozhou Bay, and their scouring and siltation changes were studied. Figure 2 depicts the distribution of dots in the Shandong peninsula (2019). In the study area, the density of sounding-point data is higher (Figure 3), allowing a more accurate simulation of the seabed topography near the coast. In addition, data were densified in areas where the coastline has undergone significant tortuous changes, which can improve the quality of DEM in the offshore area and increase the realism of the research results.
2.3. Research Methods
Based on previous studies, observing the change in coastal profiles is the most extensive method to study scouring and siltation [11]. Some researchers used geographic information systems (GIS) technology or numerical simulations to investigate local scouring and siltation changes [11,12,13]. No one has yet used GIS to investigate the variation trend of scouring and deposition in a large range in China. This study defines the two-phase water-depth data points in the WGS84 reference system using the ArcGIS platform. In addition, it establishes the two-phase water-depth digital elevation models (DEM) according to the determined research areas (Figure 2 and Figure 3). In general, many spatial interpolation methods are used [22,23,24], and Table 2 compares these approaches. Inverse distance weighted (IDW), kriging, and triangular irregular network (TIN) are three common algorithms, while others are typically not used for water-depth elevation interpolation. Inverse distance weighted (IDW) is unsuitable for interpolating water depth because the dots are not evenly distributed [25]. Kriging interpolation has a good interpolation effect [22,26]. A triangular irregular network can cause the terrain to appear triangular and artificial due to the TIN’s construction [26,27,28]. This research selected the kriging to construct DEM since it accurately visualizes terrain features (Figure 4). In addition, the universal kriging (UK) technique was applied during the DEM construction process to analyze the original data and remove the first-order trend. The model function of UK is a stable model semi-variation function. The search neighborhood is four sectors, each containing 2–5 factors. The accuracy of DEMs was evaluated using the cross-validation methods. Table 2 lists the error descriptions of all DEM surfaces.
After eliminating abnormal areas, contour lines of 2, 5, and 10 m were extracted from two DEM periods, and the contour changes at different depths were computed. It determined the DEM’s change trends by geometrically calculating the values between each pixel in the grid. Then, the variation characteristics of the sea area’s terrain can be derived. On this basis, the volume and area of each region’s scouring and silting, as well as their net scouring and silting volume, were calculated using the method of filling and cutting. The topographic change properties of the cross-section in a typical scouring–siltation area were obtained by extracting the elevation-change data in the selected cross-section, and Figure 1 shows the distribution of the cross-section.
3. Results
By overlaying and analyzing Shandong Peninsula’s DEM and contour data from 2004 to 2006 and 2017 to 2019, it was demonstrated that the seabed in the coastal waters is predominantly silted, and the local scour is dotted. The siltation area and volume west of Laizhou Bay are the largest at 6.59 × 10⁸ m2 and 3.8 × 10⁸ m3, respectively, and the net siltation volume is 2.13 × 10⁸ m3. It was discovered that the greatest siltation thickness value is in the sea area around Chengshantou (17.9 m). However, the siltation area is small due to its steep slope, point-like scouring, and siltation distribution characteristics. The maximum scouring area occurs between Taozi Bay and Yangma Island. The volume of net scouring is 0.10 × 10⁸ m3, and the scouring rate is 0.007 × 10⁸ m3.a−1 (Table 3).
3.1. Characteristics of Submarine Scouring and Siltation in Northern Shandong Peninsula
In the northern part of the Shandong Peninsula, seabed topography is comprised mainly of siltation. From Laizhou Bay to Miaodao Strait in the southern Yellow River estuary, siltation is widely distributed, shows a broad range of planar siltation, and is also thick. Scour is spread in the estuary of the bay and around artificial structures. In the coastal waters to the east of the Miaodao strait, siltation and scouring are characterized by point distribution, and the degree is low; however, the seabed near the straight coastline is roughly balanced.
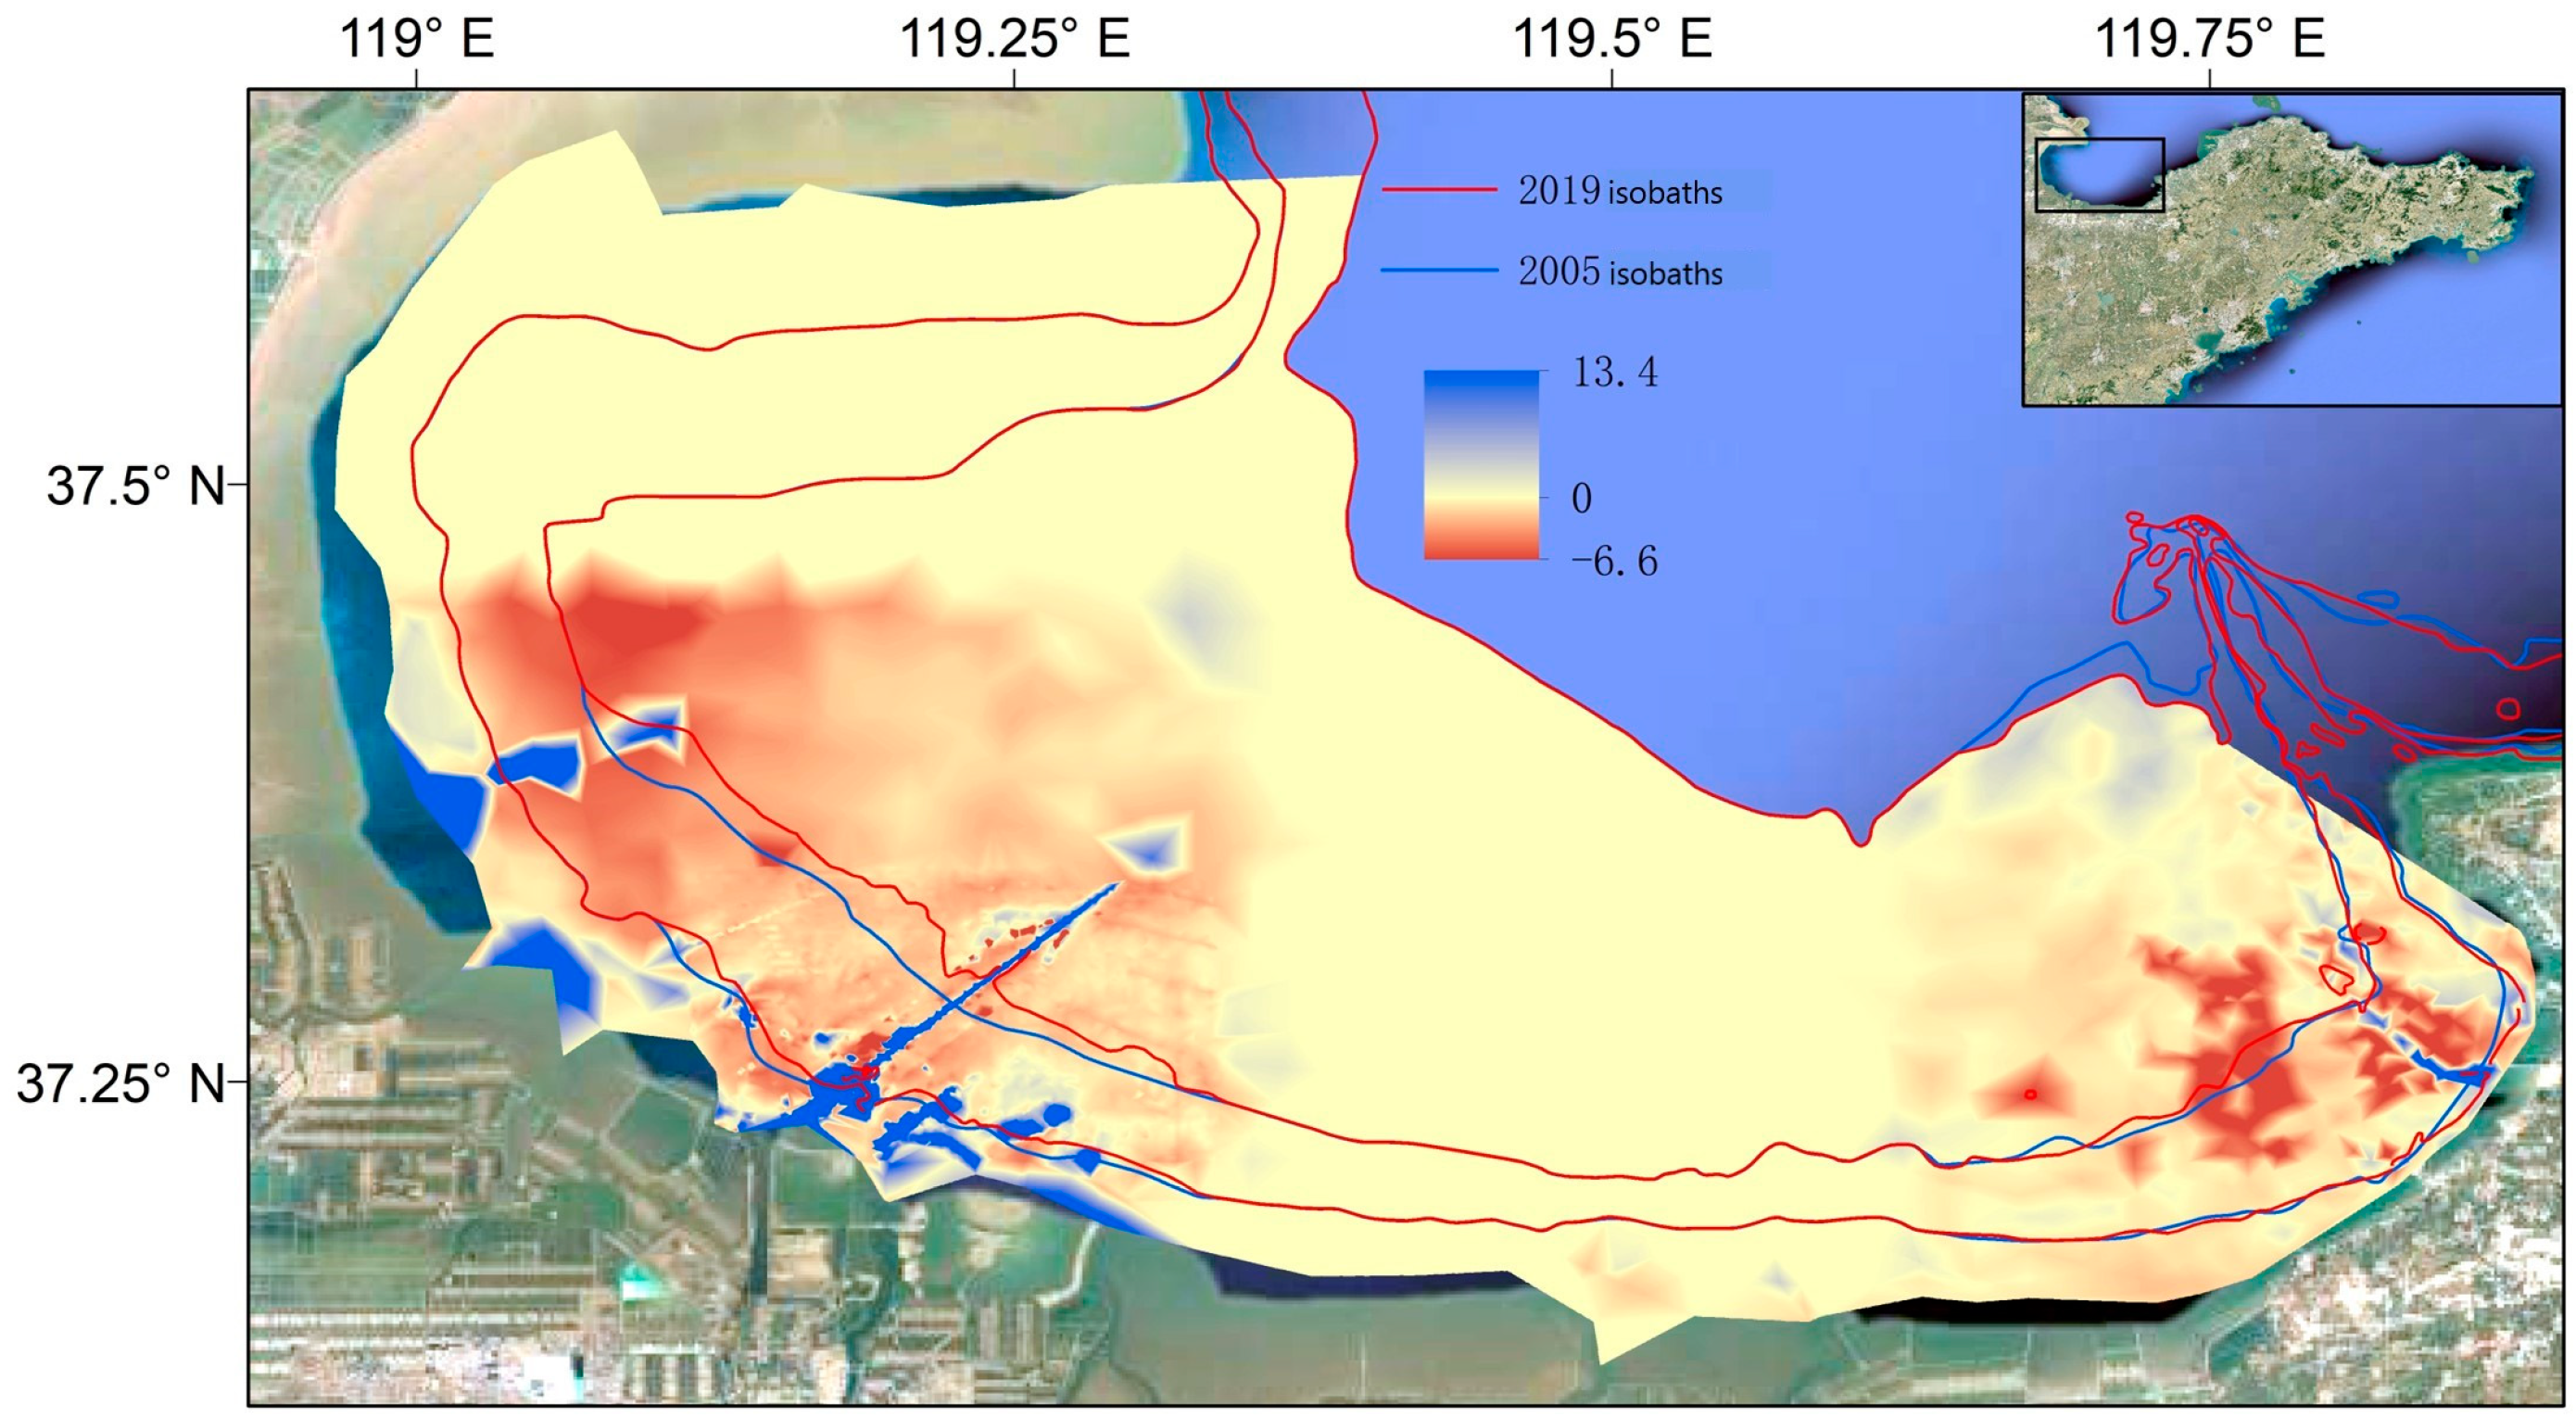
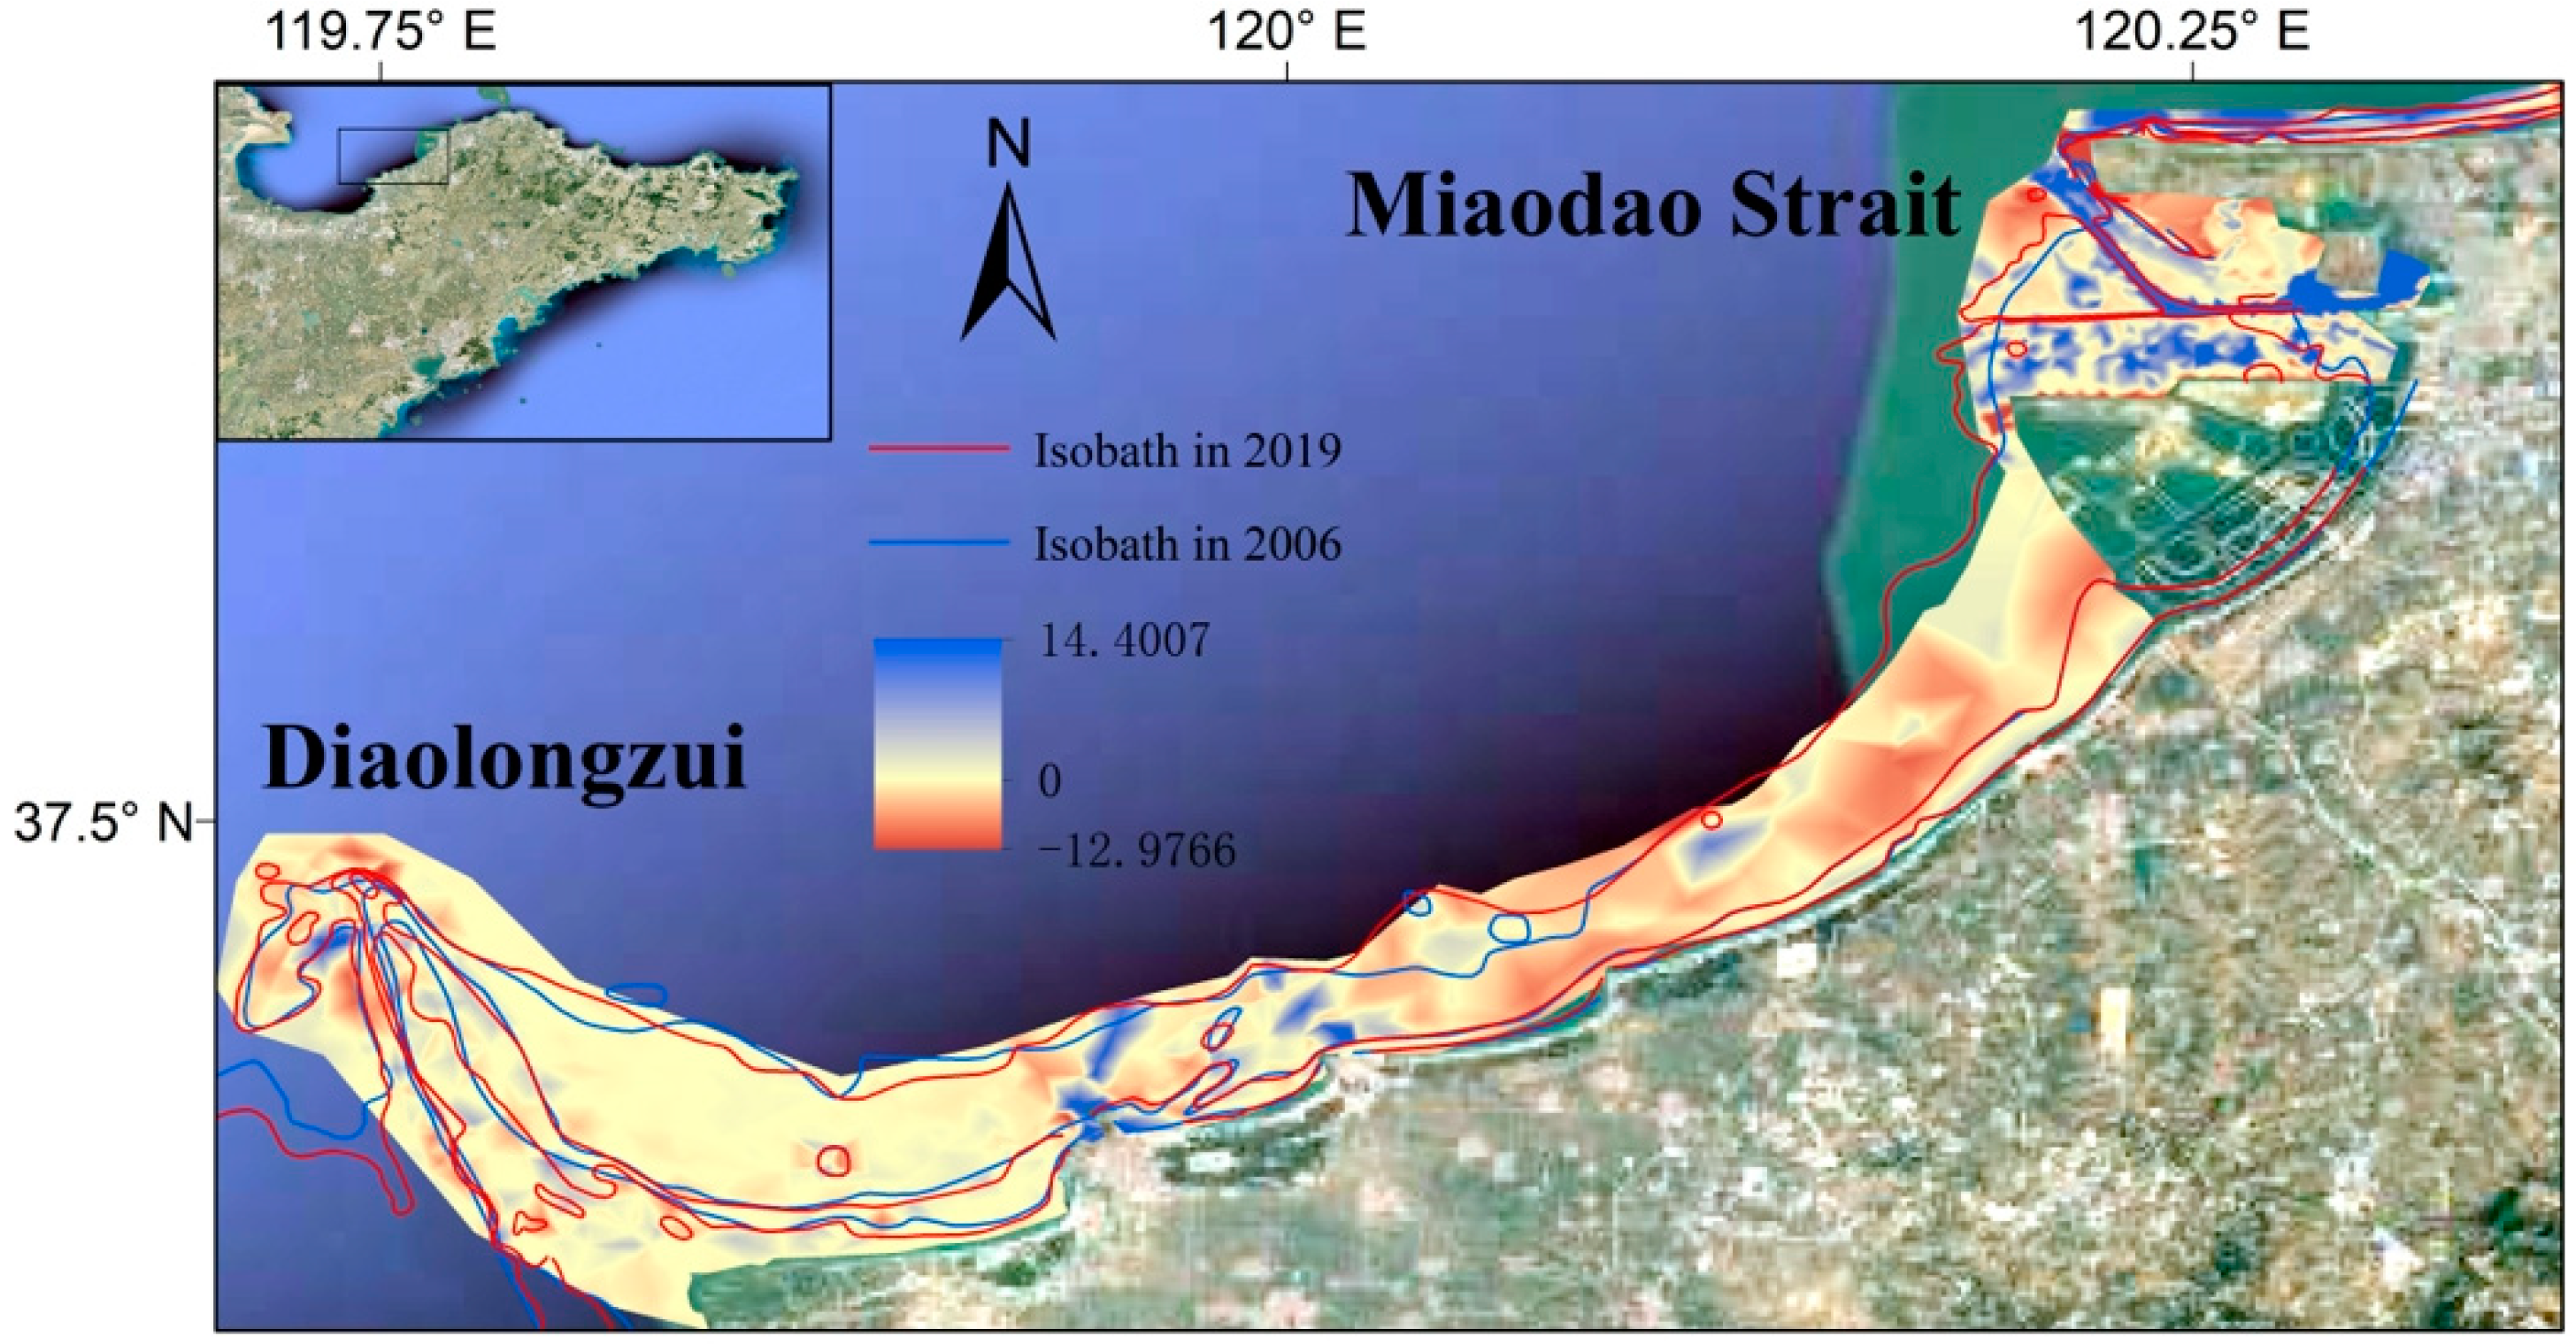
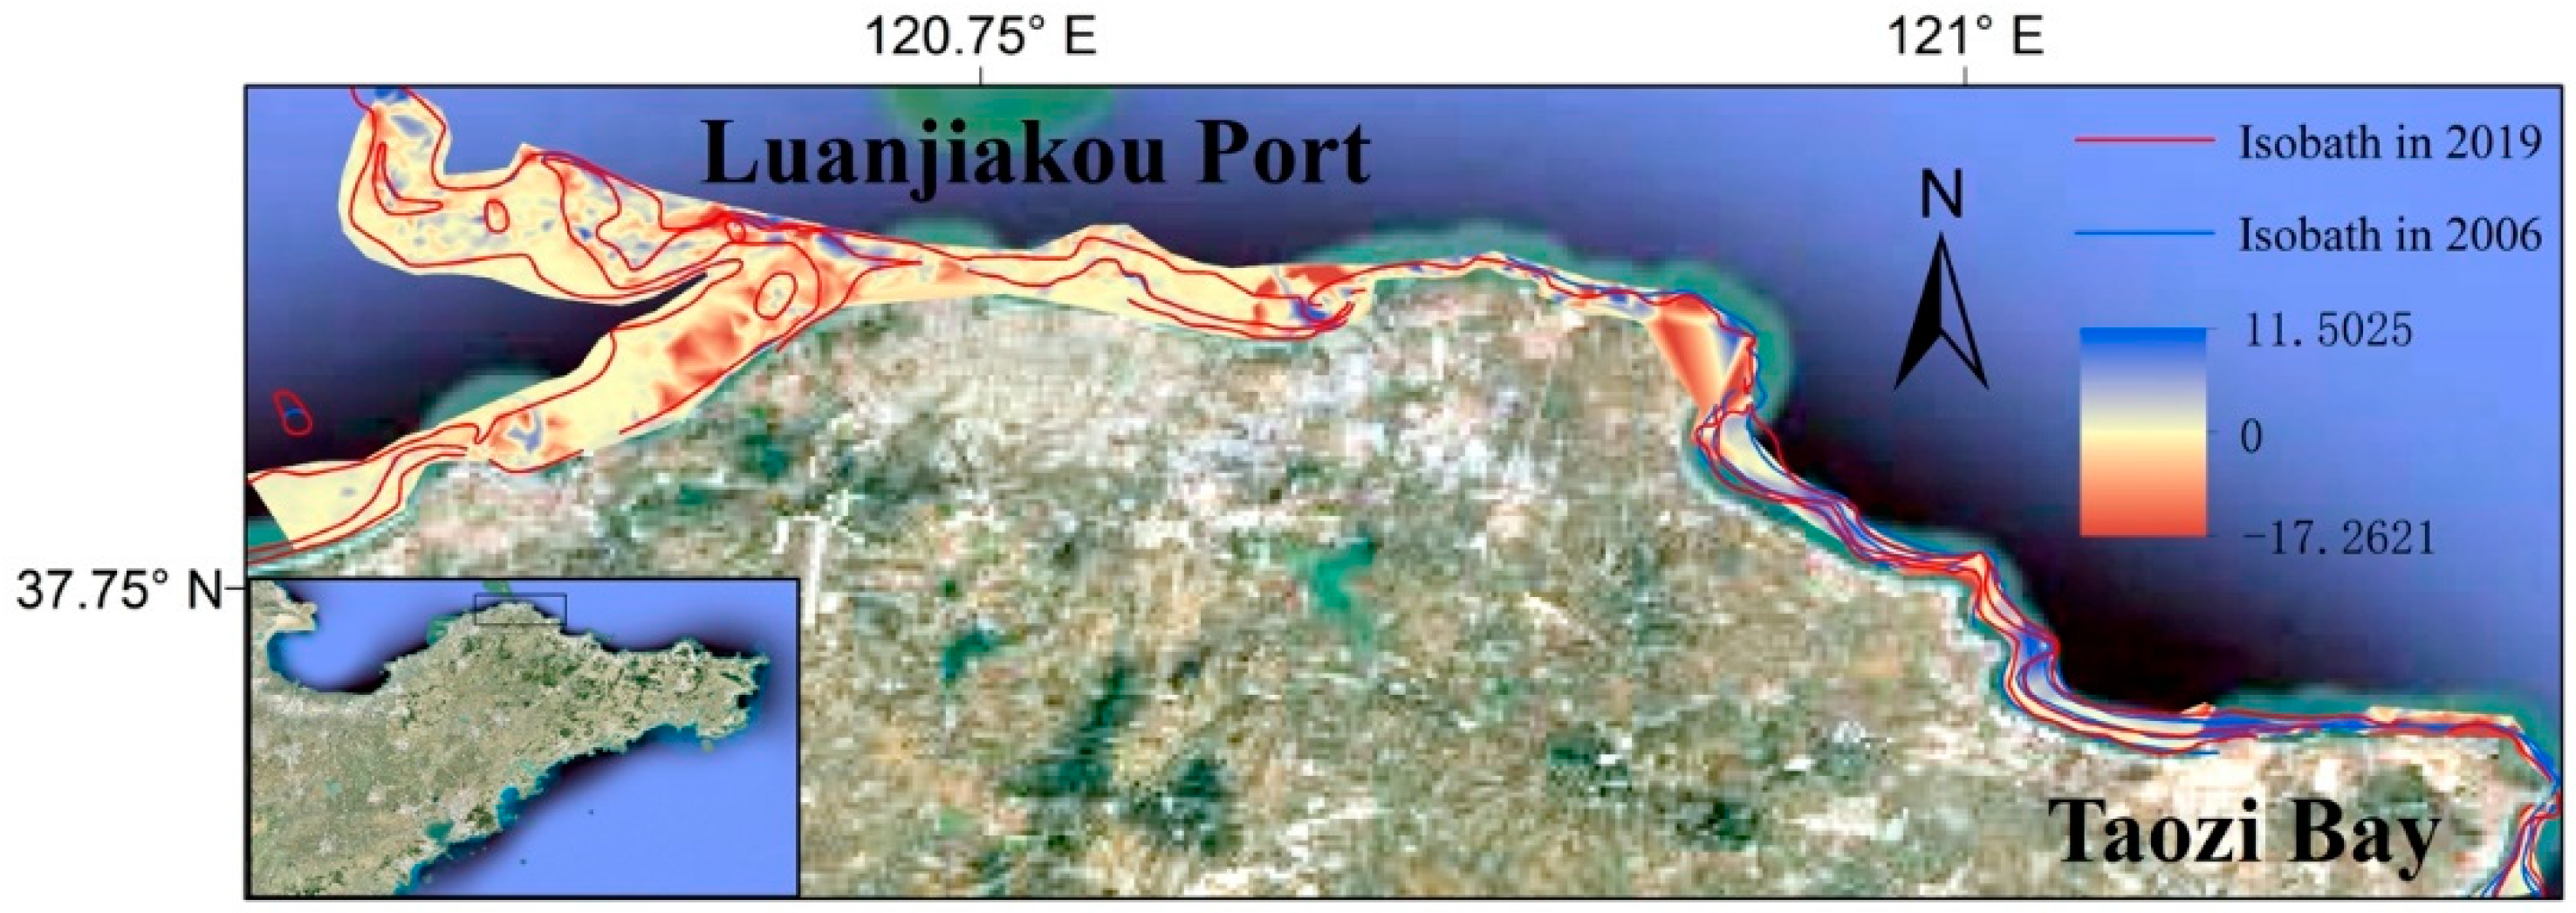
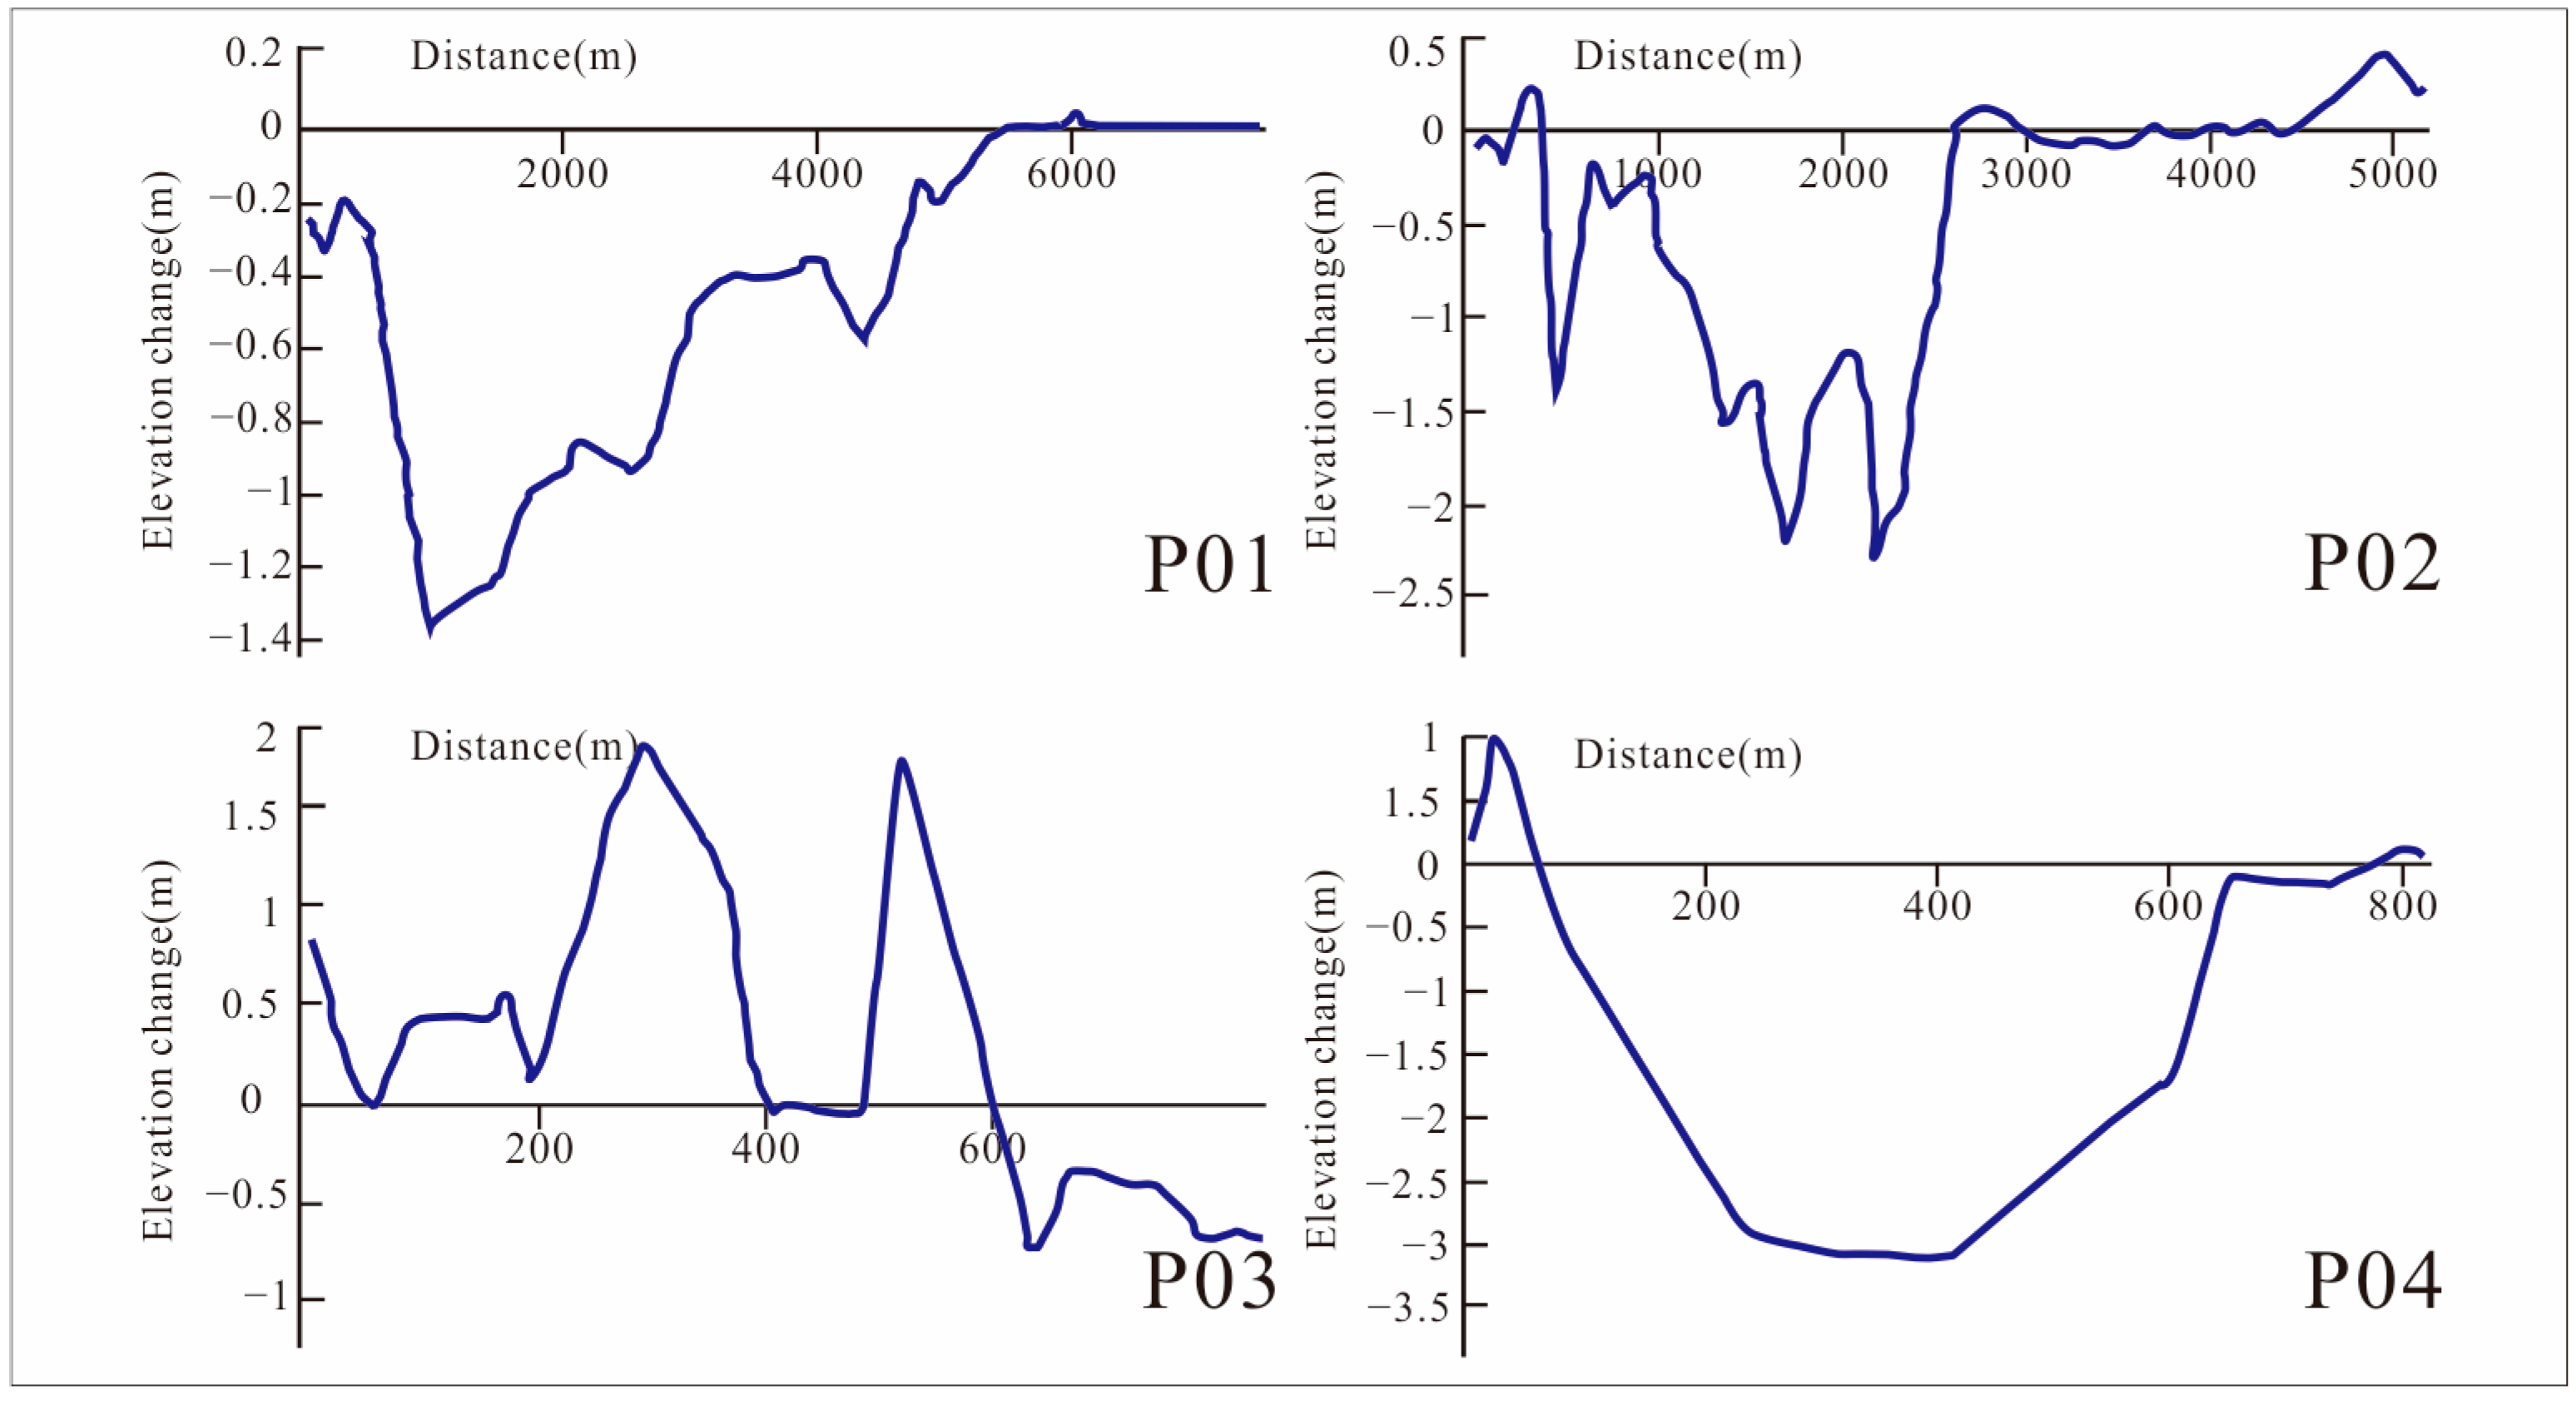
In Laizhou Bay’s sea area, the 2, 5, and 10 m isobaths slope toward the sea. On the northern side, scouring is distributed between 2 and 5 m isobaths, and siltation is spread between 5 and 10 m. The bay’s west and east sides are characterized by siltation (Figure 5). The topographic changes are concentrated between the 2 and 5 m isobaths. The scouring is mainly distributed between the estuary of the river entering sea and the nearshore part of Laizhou Bay’s west side. In the sea area between Diaolongzui and Miaodao Strait, near Diaolongzui, the 2 and 5 m isobaths shrink toward the land, while the 10 m isobath exhibits both forward and backward characteristics, with an overall scouring and siltation balance. Scouring and siltation are observed between 5 and 10 m water depths, though mainly siltation (Figure 6). In the sea area between Luanjiakou Port and Taozi Bay, there is no apparent change in the contour line around Luanjiakou Port. In another area, the 2, 5, and 10 m contour lines have both backward and forward characteristics. There is scouring and siltation in the middle part. The siltation is concentrated in the nearby sea area. The area’s nearshore and 10 m isobaths are all scoured, and the overall scouring and siltation are balanced. (Figure 7). Figure 8 and Figure 9 show the elevation change of the cross-section.
3.2. Characteristics of Submarine Scouring and Siltation in Northeastern Shandong Peninsula
Siltation mainly occurs in Shandong Peninsula’s northeast coastal region, specifically in the sea area characterized by a 0–10 m isobath along Weihai City’s coast. In most sea areas, the distribution of scouring and siltation exhibits point-like characteristics, alternating and strong. The scouring and siltation are particularly high at the corner of the northern Shandong Peninsula. However, due to the steep terrain in the area, the sea area below 10 m is minimal and characterized by a point-like distribution. The planar siltation or scouring characteristics are weak in several larger bays, such as at Rongcheng, Sanggou, and Jinghai. Except for Jinghai Bay, the major bays exhibit a balance between scouring and siltation.
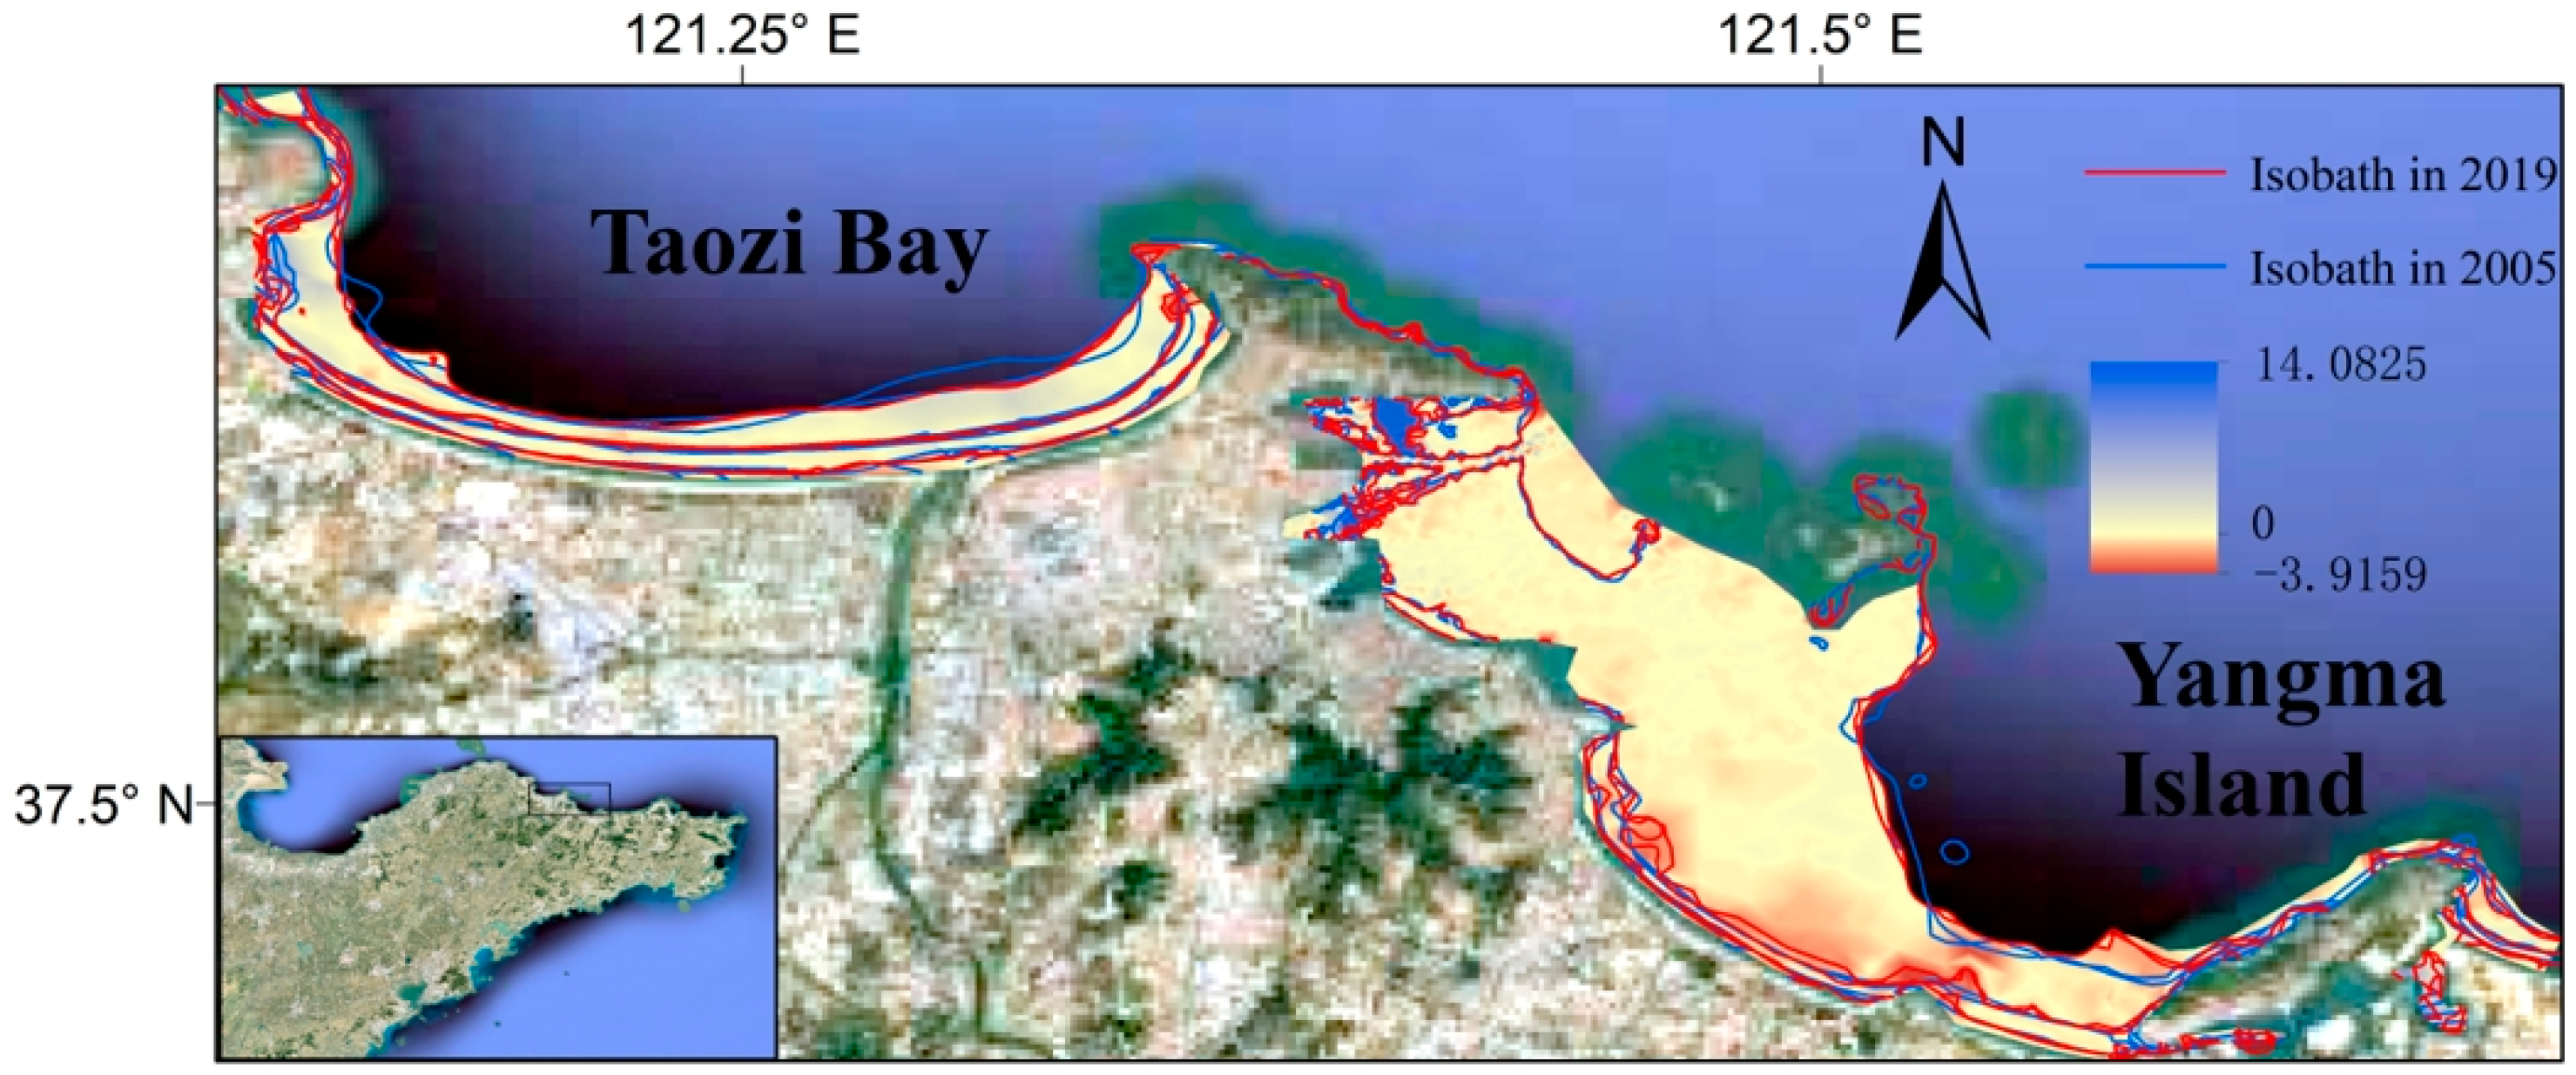
The 2 and 5 m isobaths in Taozi Bay during the two periods advance and retreat slightly. The nearshore is silting and gradually changes to scouring toward the sea. Moreover, the nearshore scouring on the west side is intense, and the overall change is not large. The 10 m isobath has both forward and backward characteristics on both sides of the bay, and the overall scouring and siltation are balanced. The contour line in the eastern part is complex due to a project’s construction, and the scouring and siltation distribution on the west side a complex. In addition, there is also scouring and siltation on the south side, and the local scouring is particularly strong, whereas the siltation is primarily deposited and the degree is low (Figure 10).
Along Weihai City’s coast, the 10 m isobath moves toward the sea in most areas. In Jinghai Bay, the 2 and 5 m isobaths also move toward the sea, whereas in other areas there are no discernible isobath changes (Figure 11). The scouring and siltation levels in the coastal area are generally balanced. In the area from Chengshantou to Jinghai Bay, the siltation is widely distributed in the larger bays, and some areas show scouring; however, the scouring and siltation degree is low. The sea area between the bays demonstrates intense scouring and siltation levels. At the south of Chengshantou, the nearshore scouring and siltation levels are balanced, and siltation is weak near the 10 m isobath. In Sanggou Bay, the local nearshore siltation distribution is significant, and the 5–10 m isobaths have low scouring levels. Considerable amounts of nearshore siltation are observed on the southeast side and strong scouring near the 10 m isobath. Nearshore and close to the bay’s 10 m isobath siltation is indicated, and the middle sea area shows weak scouring. In addition, most of Jinghai Bay is covered in weak siltation.
3.3. Characteristics of Submarine Scouring and Siltation in Southern Shandong Peninsula
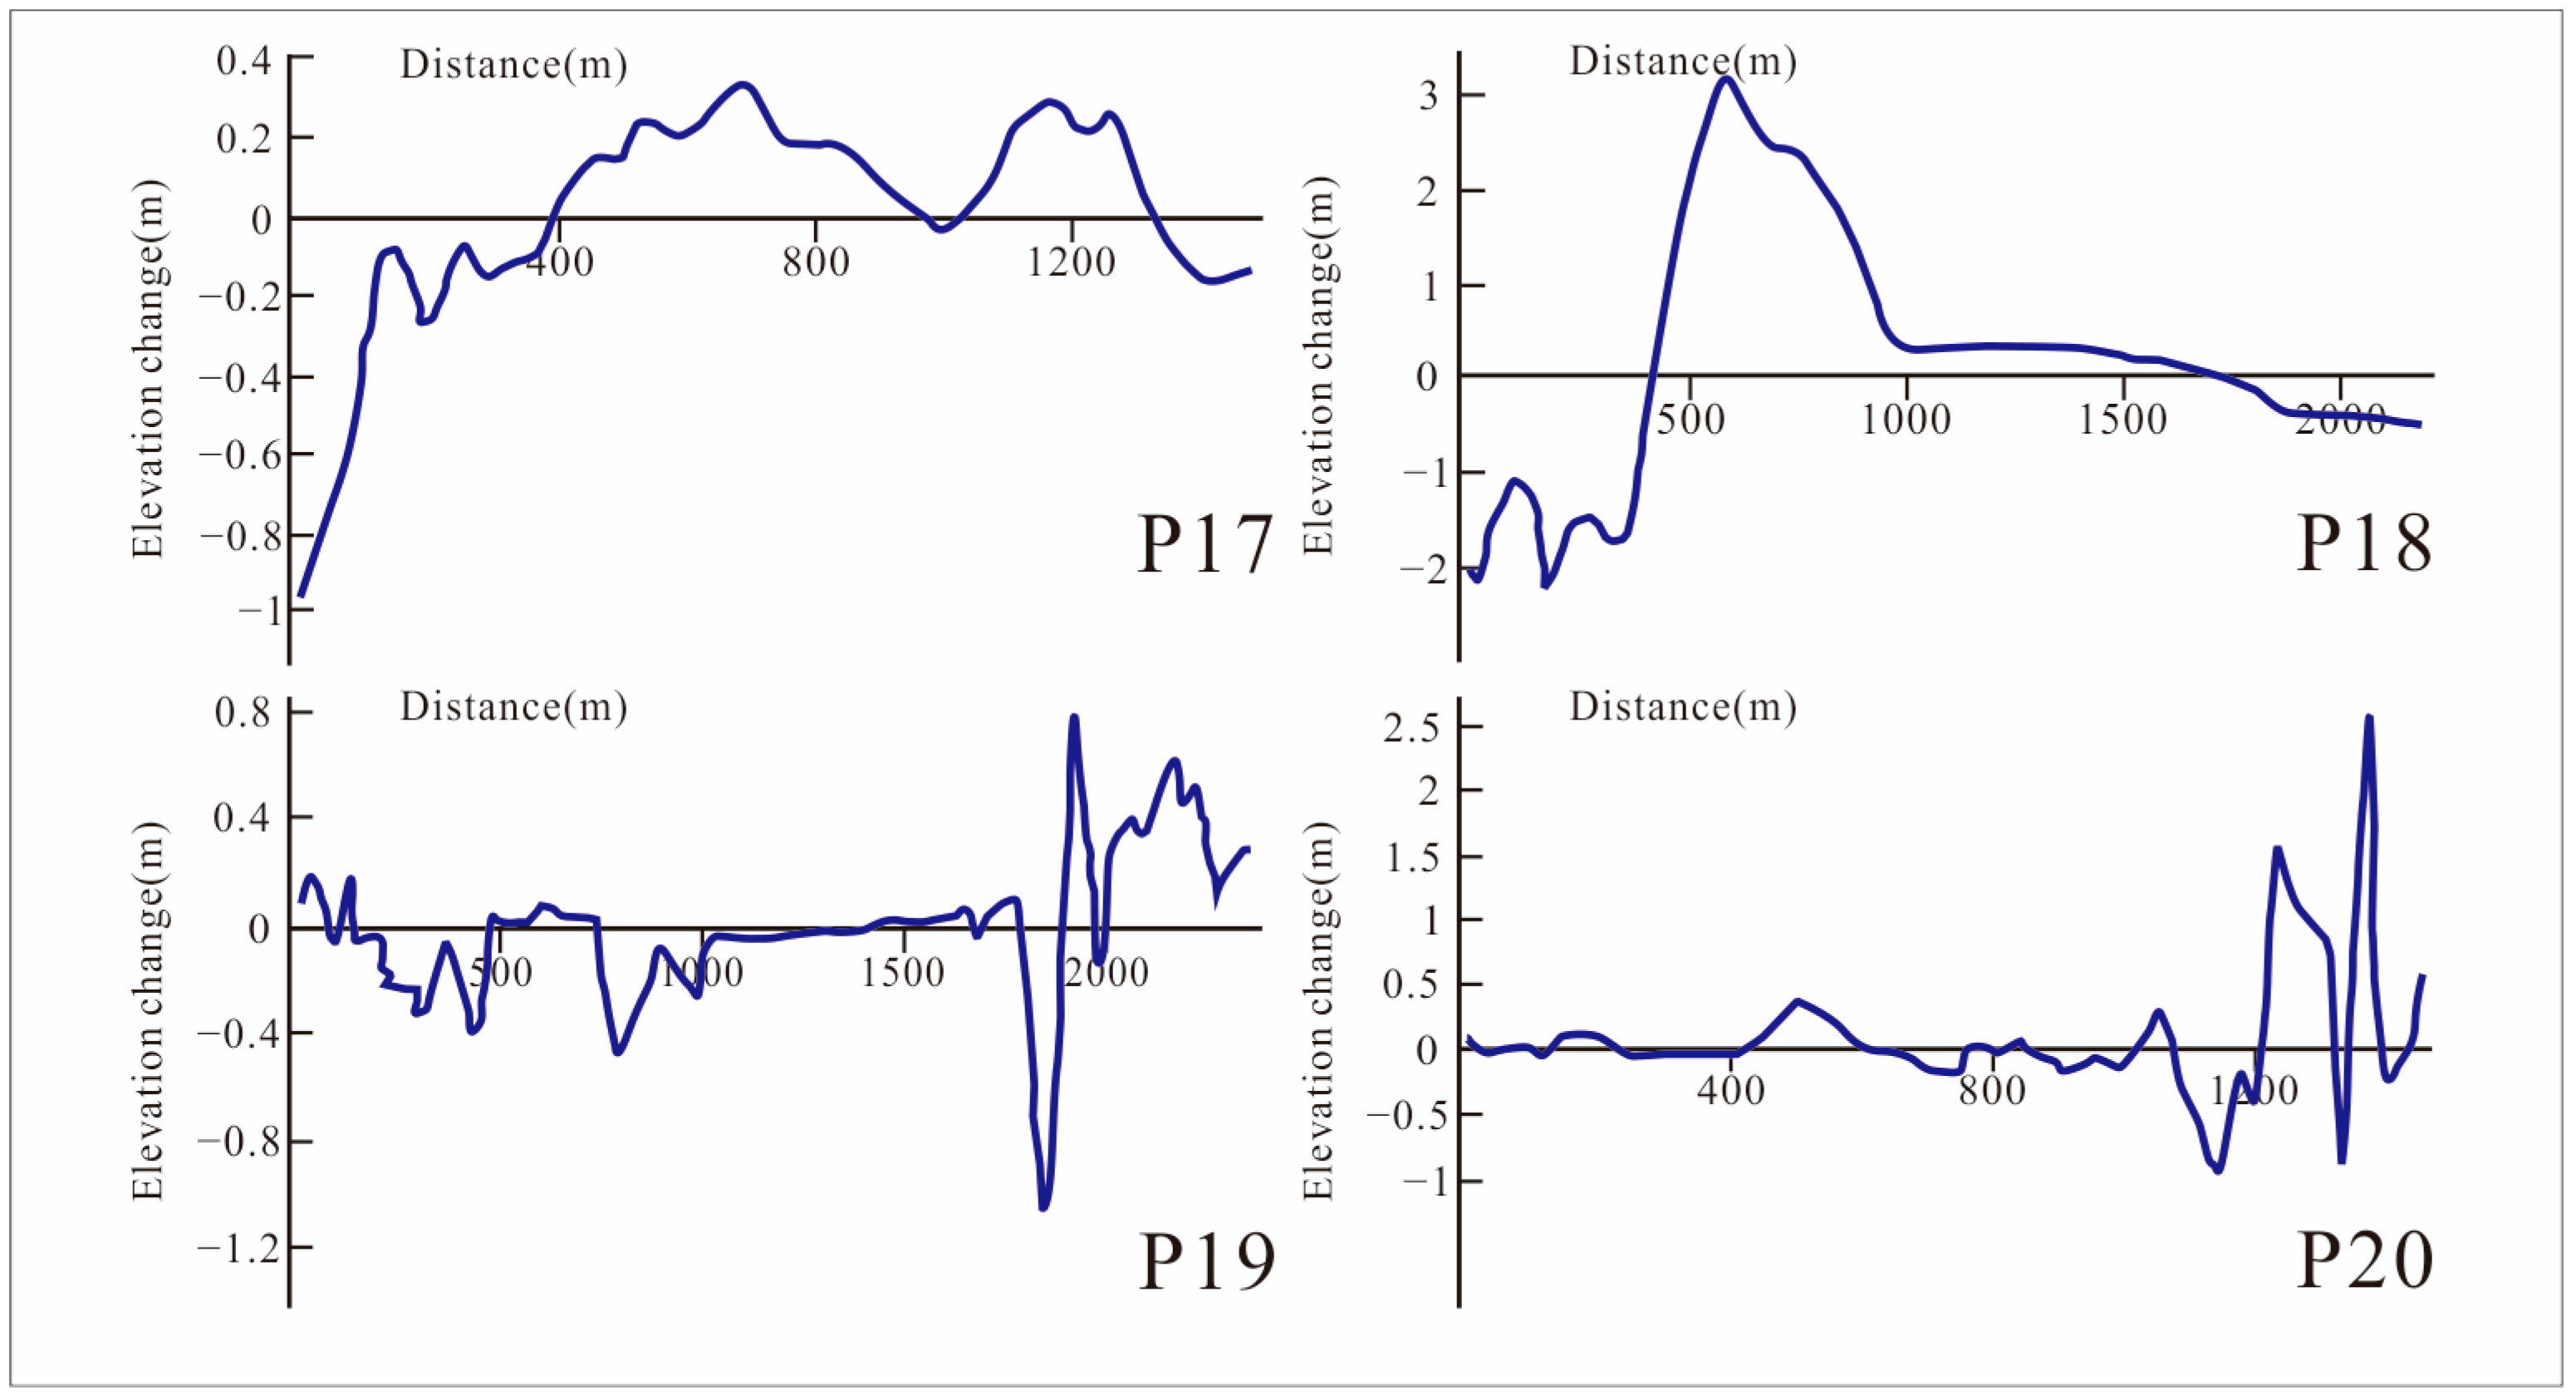
From the west of Jinghai Bay in the south of the Shandong Peninsula to Jiaozhou Bay in Qingdao, the scouring and siltation distribution is segmented in the area shallower than the 10 m isobath. The main distribution area is between Rushankou and Dingzi Bay in Haiyang City and between Jiaozhou Bay and Laoshantou in Qingdao City, and there is almost no change in scouring and siltation topography in other sea areas. The scouring and siltation distribution between Rushankou and Dingzi Bay is planar, which is related to the distribution of the isobaths. Typically, siltation in the 2–5 m isobaths and scouring in the 5–10 m isobaths are observed, in addition to dotted distribution and alternates in Jiaozhou Bay and the sea area in Laoshantou. The siltation of the entire south bank occurs primarily in Dingzi Bay, and the siltation intensity is enormous and concentrated on both sides of the estuary.
There is no apparent change in the contour line between Rushankou and Dingzi Bay, but the local 10 m contour line retreats to land or advances to sea. The scouring and siltation in the interval are balanced, and the topographic changes are minimal (Figure 14). In the region, there is widespread siltation in the nearshore of the coast. In the middle section of Dingzi Bay’s estuary, there is intense scouring between the 2 and 5 m isobaths and a wide range of weak scouring between the 5 and 10 m isobaths. There is strong siltation between nearshore and the 5–10 m isobaths and scouring between the 2 and 5 m isobaths around Rushankou. In Jiaozhou Bay, the contour changes between the two periods are insignificant, and the scouring and siltation are generally balanced (Figure 14). In the Jiaozhou Bay area, scouring and siltation are common; however, the degree is light. The areas with scouring are often accompanied by siltation. In general, the terrain of scouring and siltation in the area does not change much. There is significant scouring and siltation along the coast of Qingdao on both sides of Jiaozhou Bay, and the distribution area is smaller than Jiaozhou Bay. Figure 15 shows the elevation change of the cross-section.
4. Discussion
4.1. Influence of River Sediment Transport on Scouring and Silting of Nearshore Seabed in Shandong Peninsula
Based on the 2020 China River Sediment Bulletin, the runoff of the Yellow River will be 212.9 × 10⁸ m3 in 2020, and the annual average sediment transport will be 1.14 × 10⁸ tons over the next ten years. Compared to the Yellow River, the sediment transport of other rivers in the Shandong Peninsula is negligible [29,30,31,32], indicating that most of the material silted in the offshore area comes from the Yellow river.
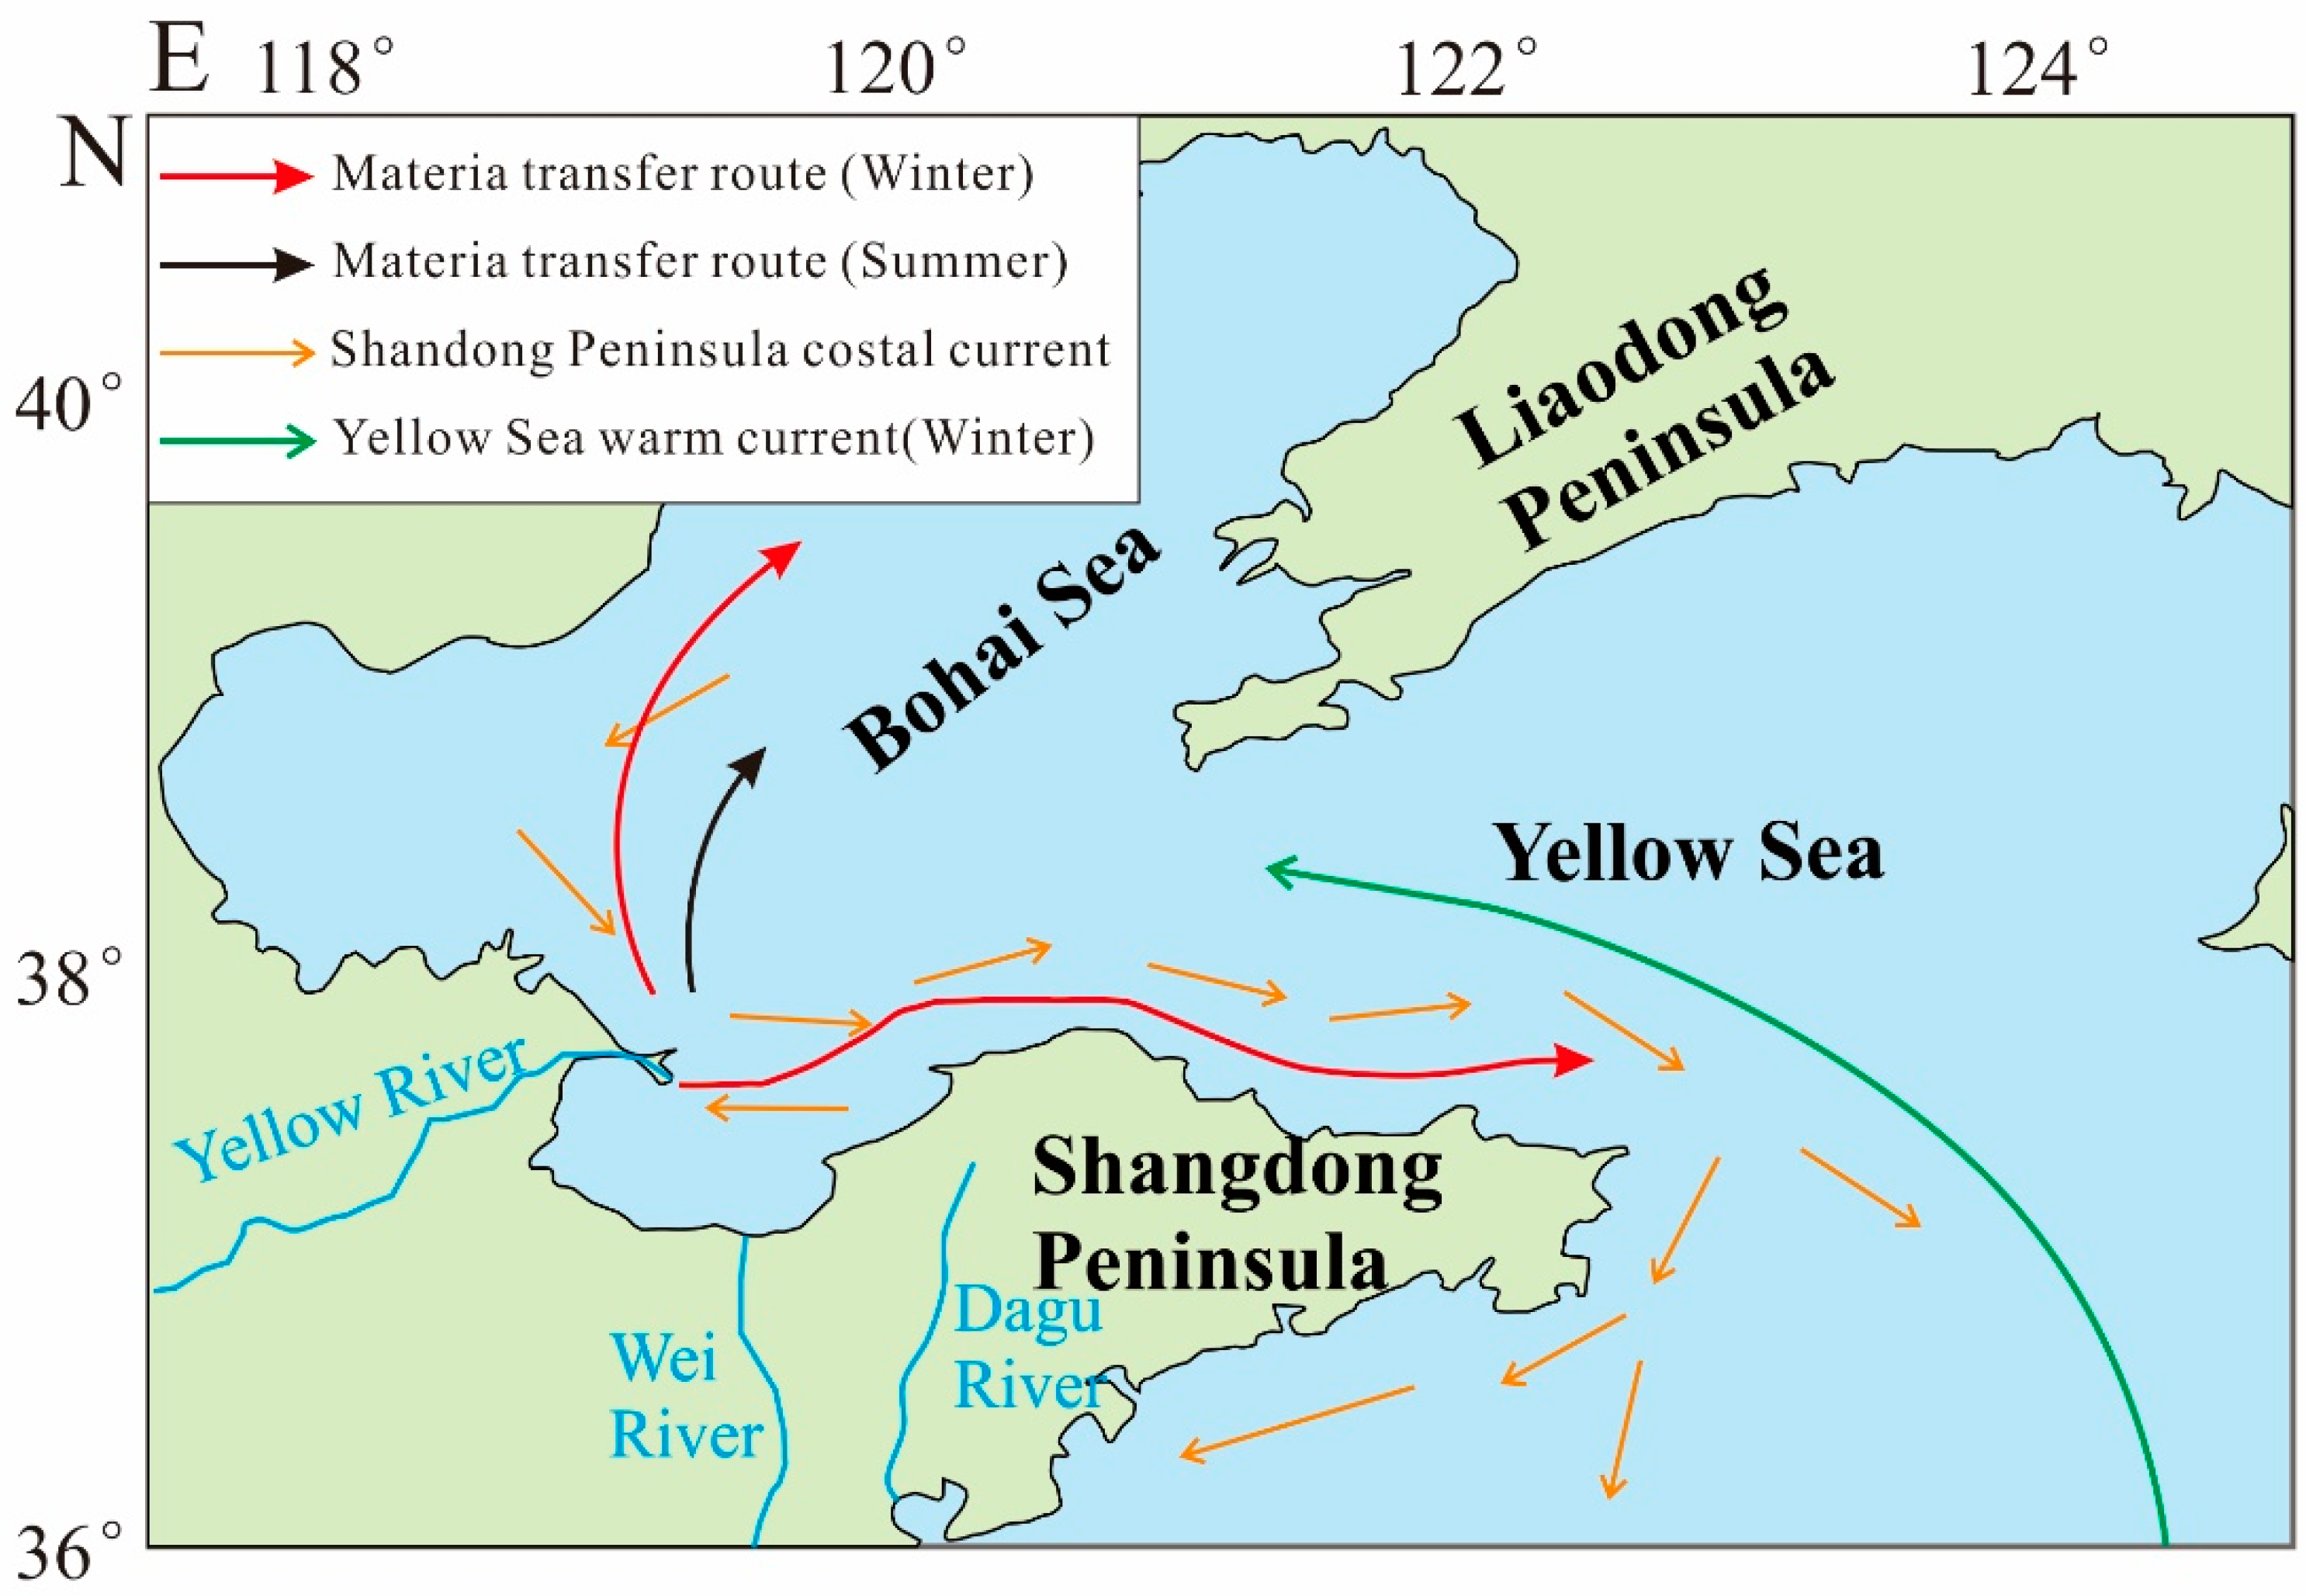
The results of studies of sediment grain sizes and trace elements in Shandong Peninsula’s coastal area revealed that about 70% of the material entering the Yellow River estuary is deposited in the nearby sea area [20,29,33,34,35] (Figure 16). Consequently, Laizhou Bay has become the siltation with the greatest magnitude in the study area. Due to coastal currents, the materials transported by the Yellow River are partially deposited in Shandong Peninsula’s northern sea area, which extends from Diaolongzui to Yantai City’s Zhifu District. The Yellow Sea warm current deposits material in the Chengshantou sea area to form a dense siltation zone in a small region. The coastal current carried the remaining material around Chengshantou and continued to move southward to the east of Laoshantou. The sediment carried into the sea by small- and medium-sized rivers also affects the source of the material to some extent. In Dingzi Bay, the region’s main siltation occurs on both sides of the estuary, and these deposited materials primarily come from the sediment transported by the river.
4.2. Effects of Coastal Erosive Material Transport on the Scouring and Silting of the Nearshore Seabed of Shandong Peninsula
The material transported by the river is a major source of siltation in the Shandong Peninsula’s coastal waters. Siltation on the peninsula’s northern side is primarily material transported by the Yellow River, while on the eastern and southern sides the influence of the Yellow River is weakened. In contrast, the amount of sediment transported into the sea by small- and medium-sized rivers is also small. The impacts of coastal scouring are more significant for transporting material. Most of the beaches in Shandong Peninsula’s coastal areas have been eroded due to extensive siltation in the coastal waters. In the peninsula’s northern area, the scouring degree is high. For example, scouring in the east of Laizhou Bay is very strong, while in the north of Weihai City the coastal scouring is generally weak (though there is still a strong scouring point). On Shandong Peninsula’s south side, the scouring degree is low, whereas Haiyang City’s coastal scouring is strong and densely distributed, and the scouring on both sides of Jiaozhou Bay is also weak.
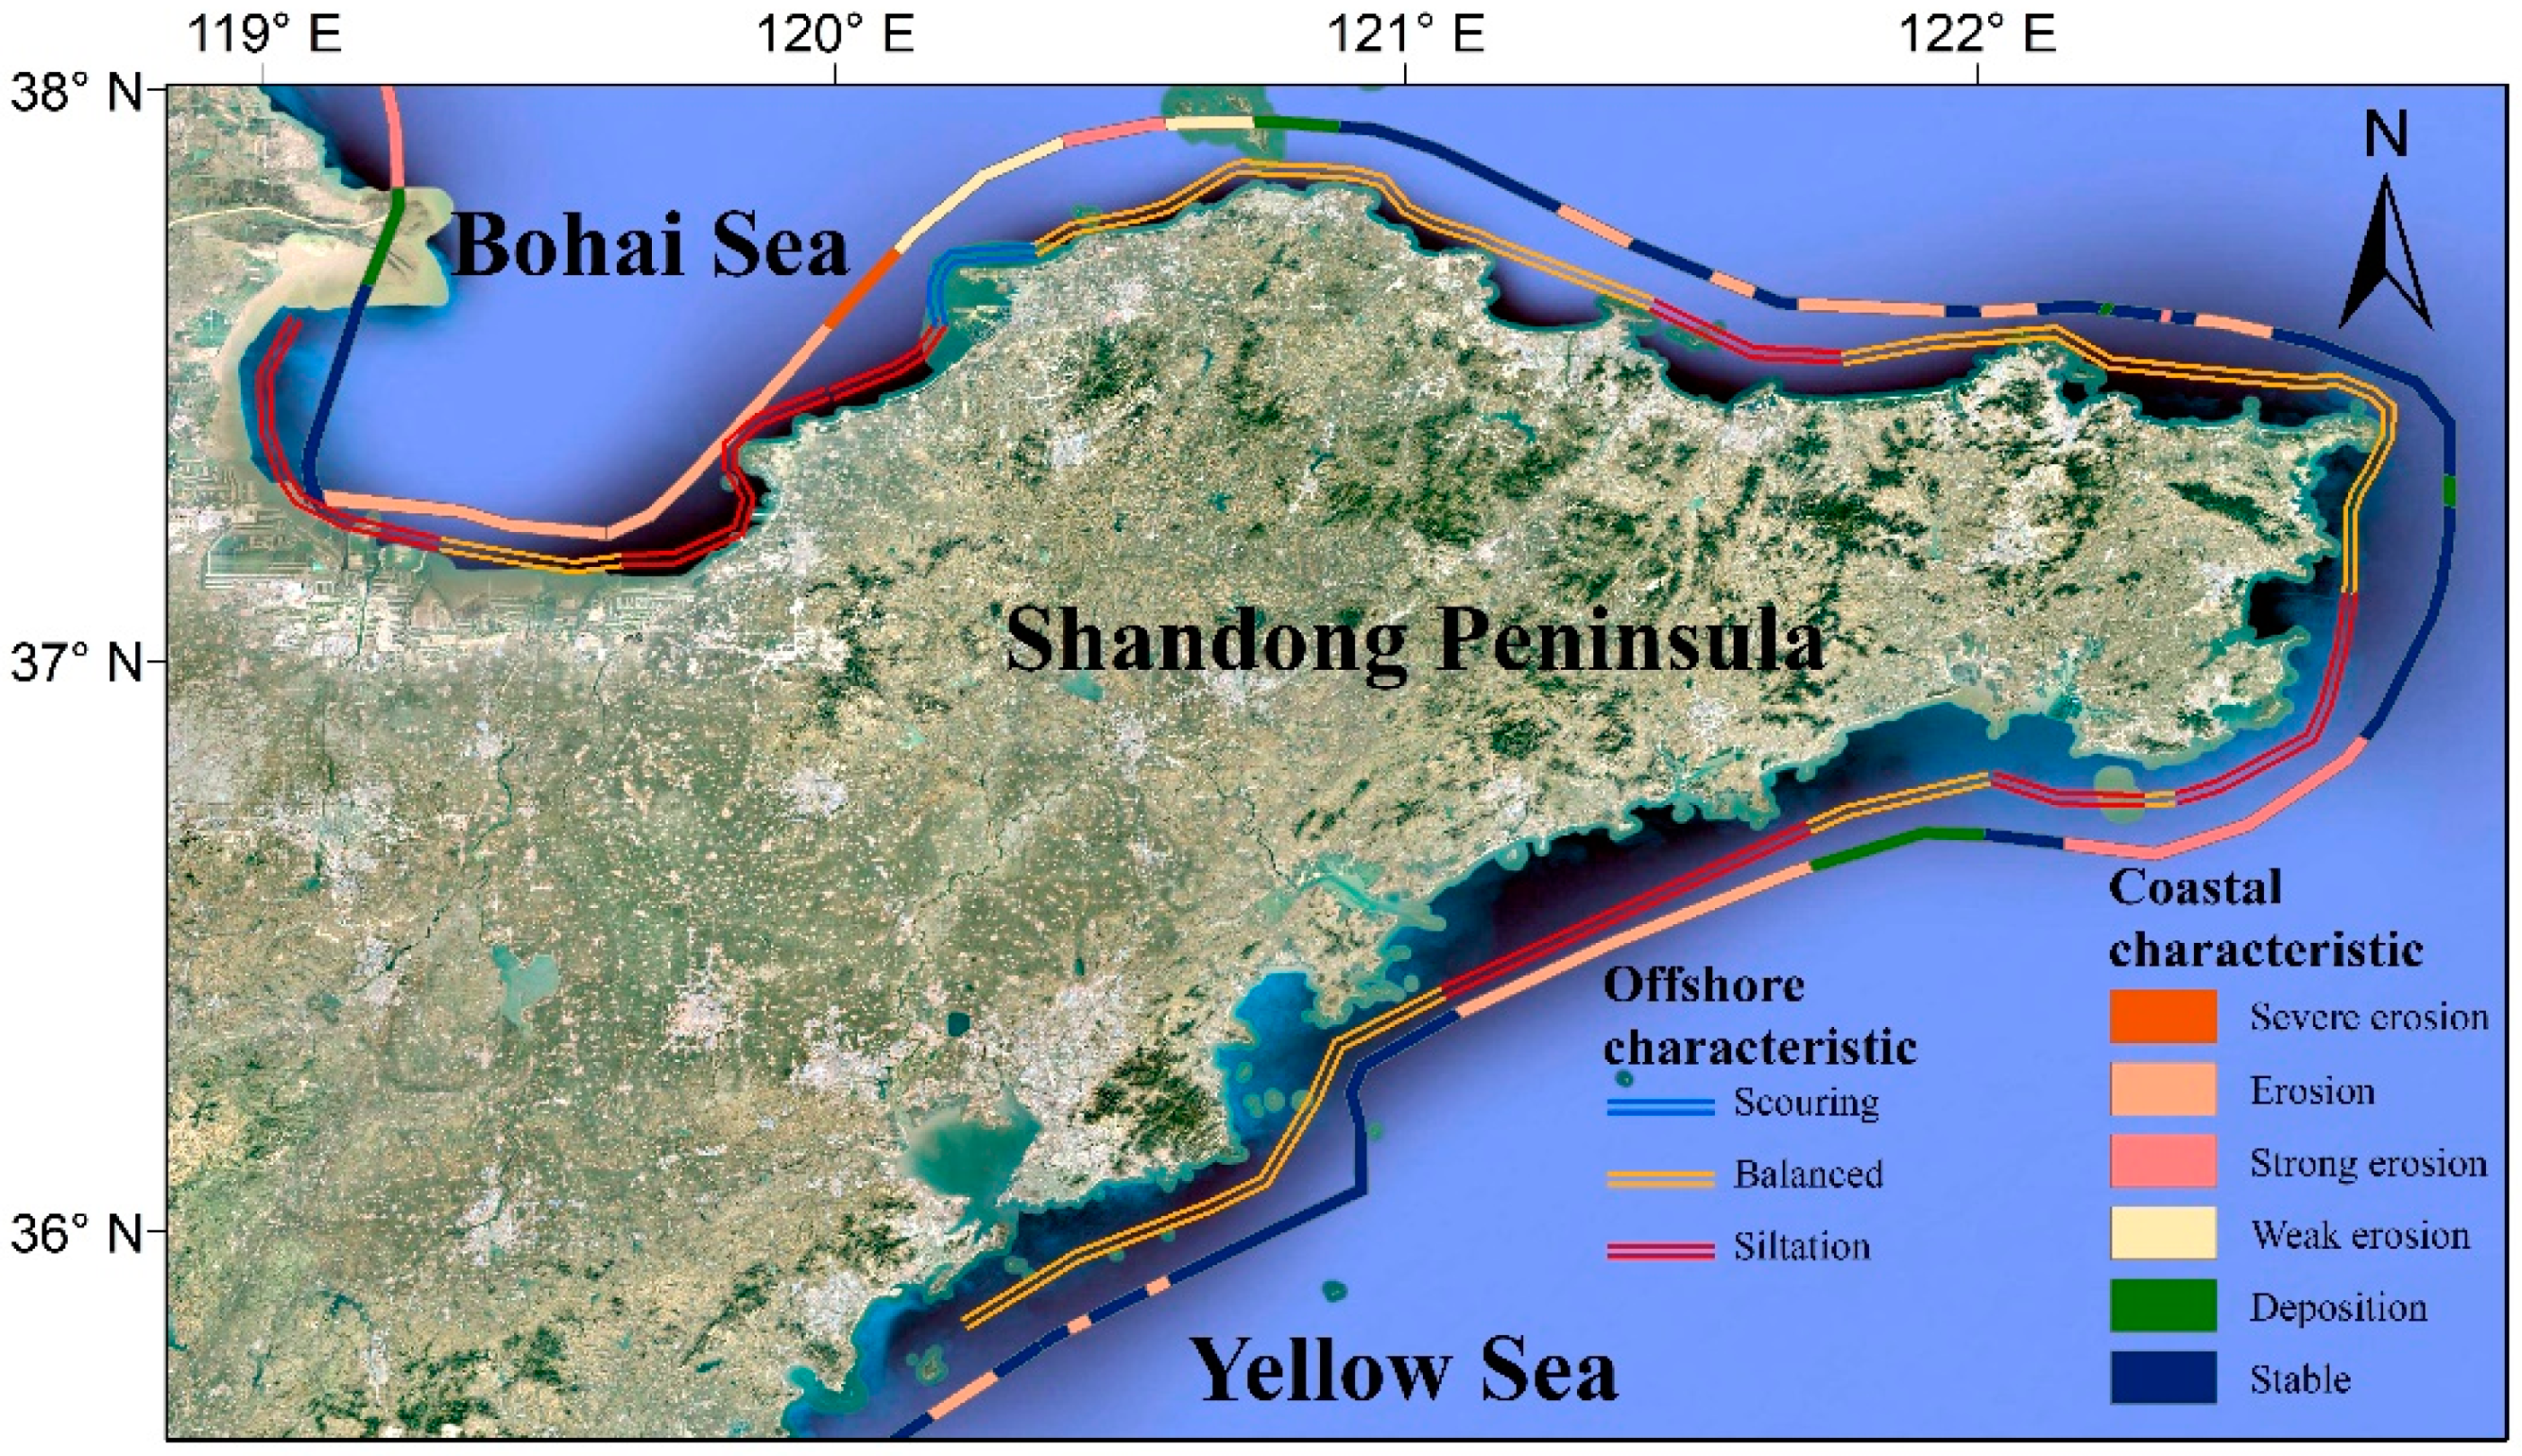
Shandong Peninsula’s sandy coast is widely distributed, and 76% of it has undergone serious erosion [33], with an annual scouring rate of about 1 m.a−1, especially in the fine-grained sandy section of the straight coastline, where the scouring is severe. In addition, a large amount of coastal scouring material accumulated in the coastal waters. The coastal scouring is very strong in the strait from Diaolongzui to Miaodao and along the coast to the south of the artificial port. There is scouring in the coastal area under hydrodynamic forces. As the offshore distance increases, the range of strong siltation also expands. The silt-mud shoreline is mainly distributed in the bays at Dingzi, Jiaozhou, and Laizhou, and the silt-mud shoreline in Laizhou Bay is spread on the south bank. The coastal scouring at Dingzi Bay is intense, corresponding to the high siltation in its sea area. Compared to the two periods analyzed at Jiaozhou Bay, the length of the silty bank section is shorter and more stable, and the scouring and siltation are also relatively balanced between the two periods. Compared to silt and sandy shorelines, bedrock shorelines are more stable; furthermore, the bedrock shoreline, in addition to the bay shoreline, is relatively stable or slightly forward, and all open coasts are subject to varying degrees of scouring corresponding to the sea’s silt distribution. In Shandong Peninsula’s severely eroded coastal sections, siltation is generally present in the sea areas, while the scouring and siltation are balanced in the offshore areas of the stable coastal zone (Figure 17).
4.3. Effects of Human Activities on Scouring and Silting of Coastal Seabed of Shandong Peninsula
Human activity is one of the primary causes of coastal erosion and changes in seabed topography [36,37,38,39,40]. Over the past two decades, the length of Shandong Peninsula’s artificial coastline has considerably increased, mainly due to the construction of coastal projects, such as port terminals. In this process, the truncation of the artificial coastline has reduced the total coastline length of the Shandong Peninsula.
Between the two periods, we observed that Shandong Peninsula’s coast has both forward and backward characteristics; however, it is mainly forward. As mentioned above, river sediment transportation and coastal scouring are the main factors affecting the overall distribution of scouring and siltation; however, local point scouring is primarily caused by human activities elsewhere in the region.
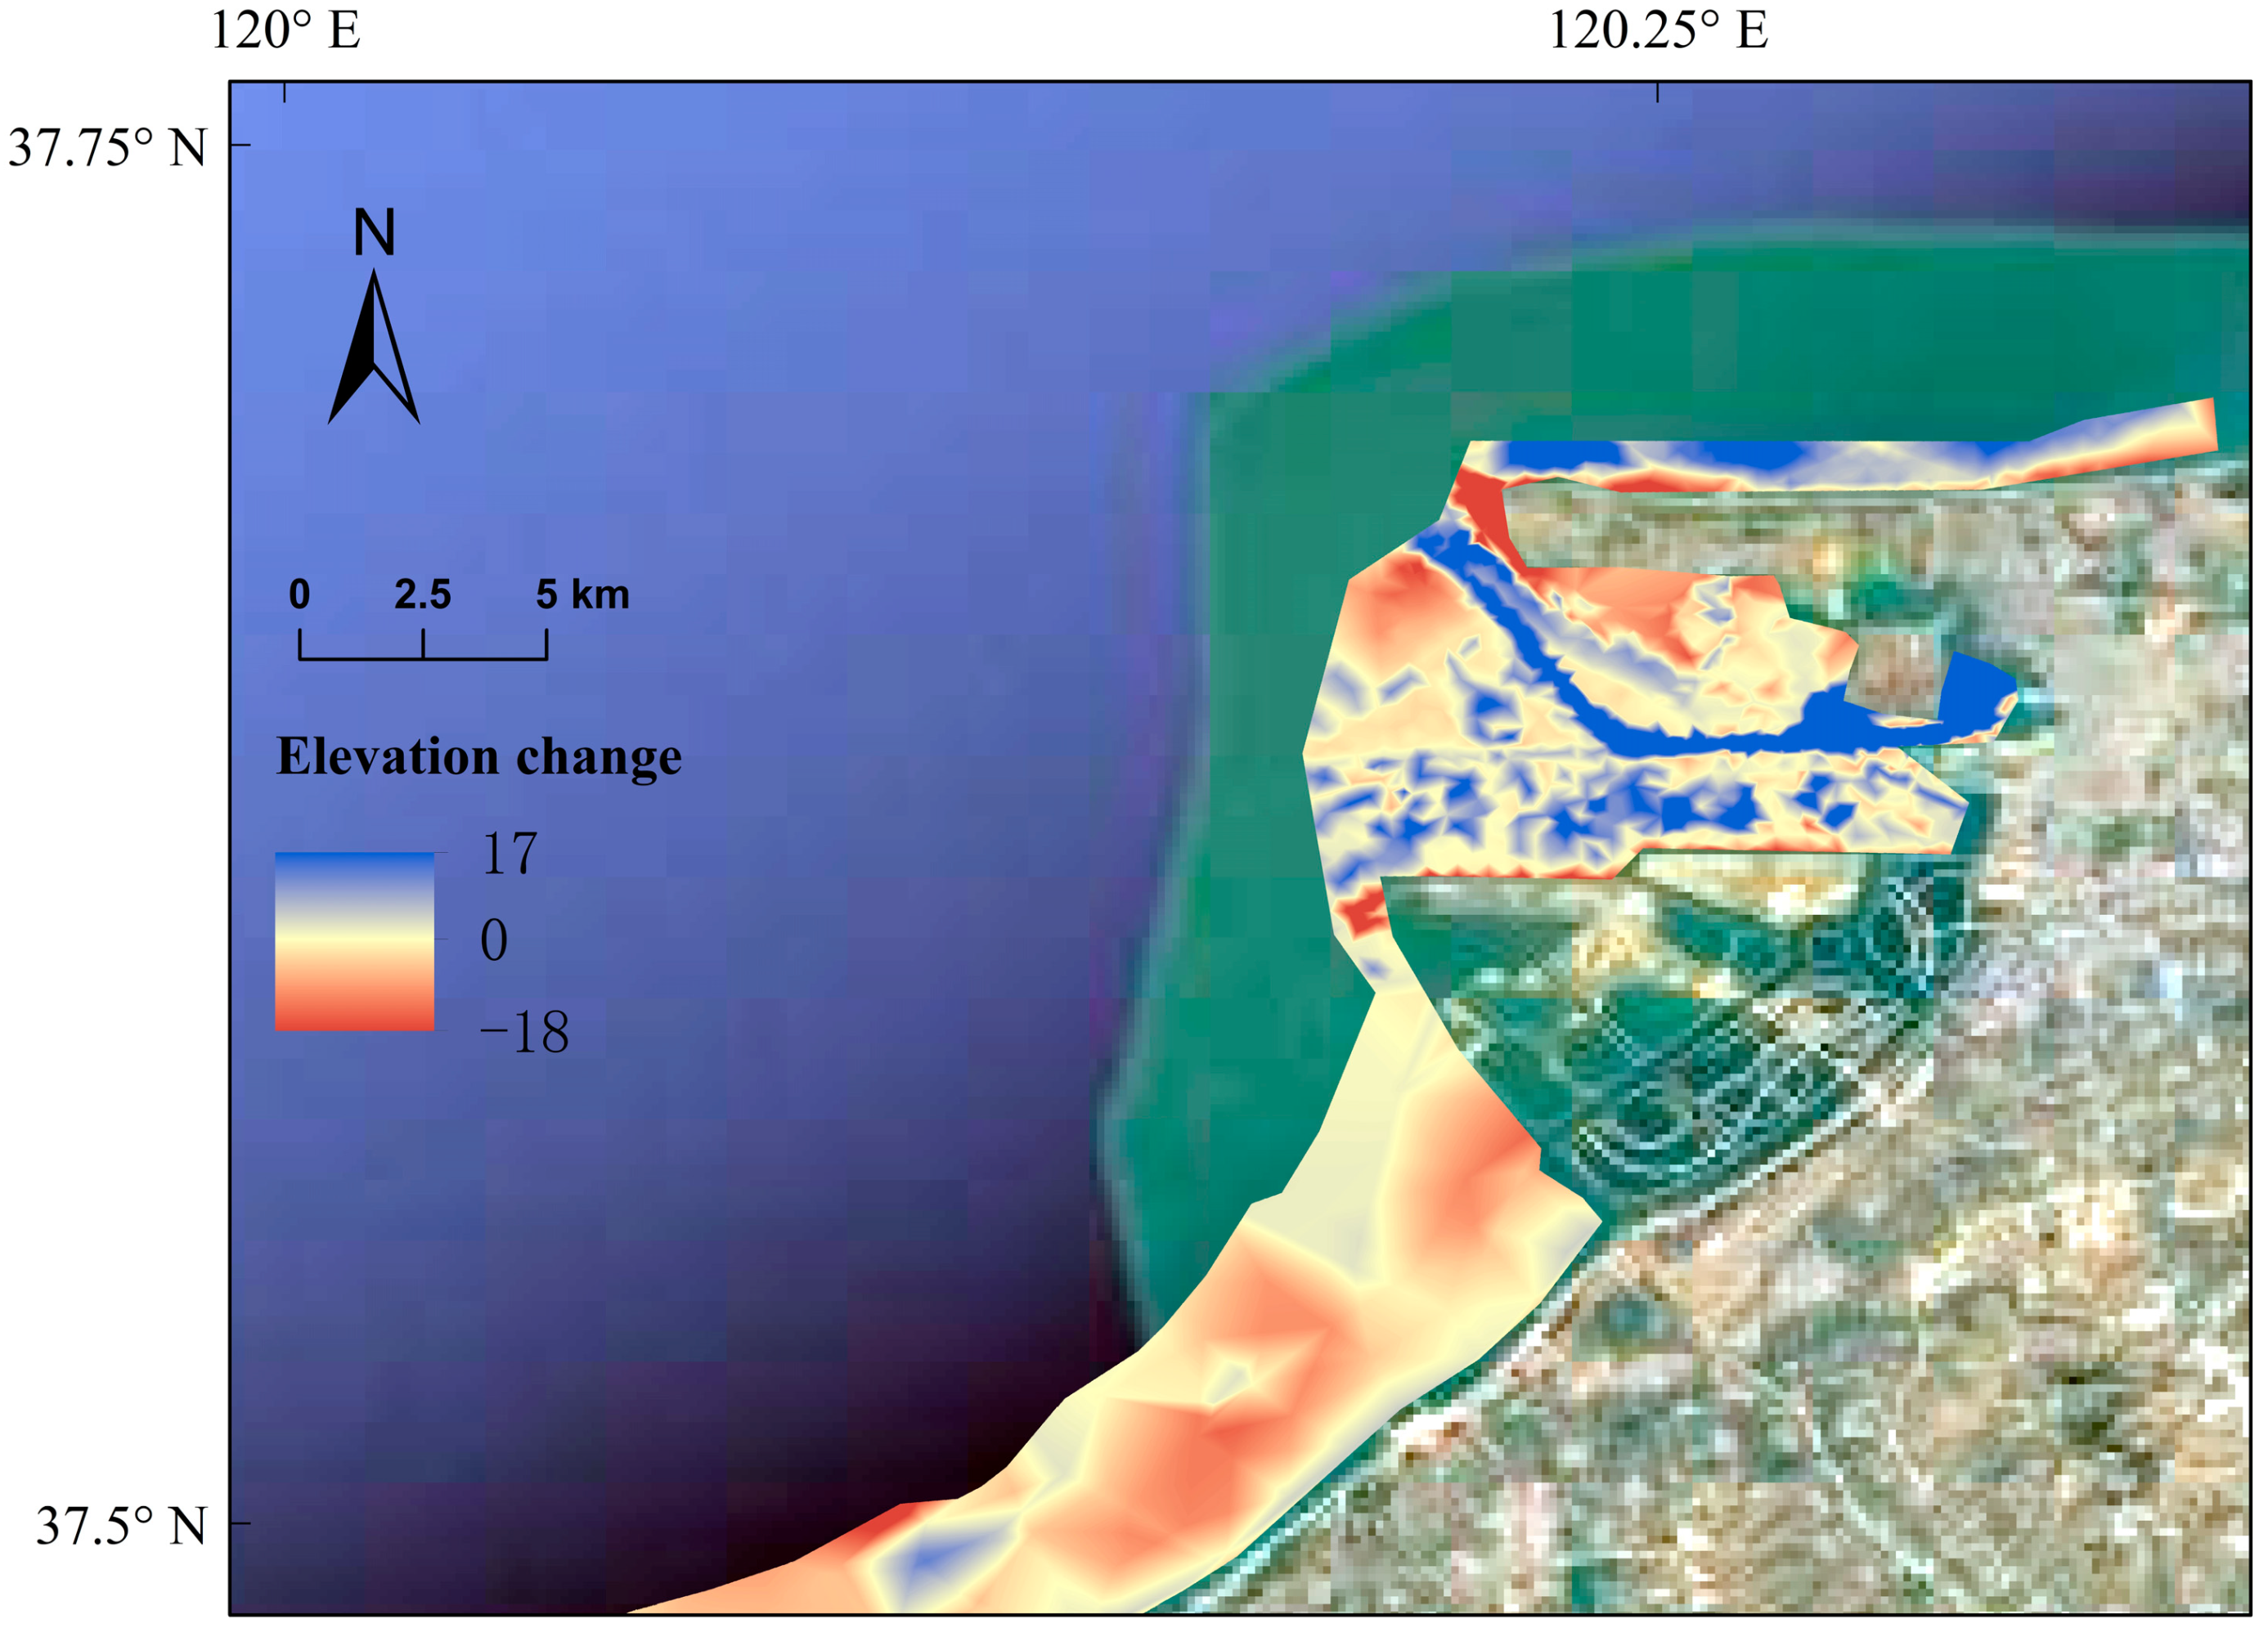
In the late 20th century, the estuary of the Yellow River changed from southeast to northeast on the northern side of Laizhou Bay due to human activities. The estuary’s alteration has changed the trend of scouring and siltation in the offshore area. In the offshore area of the Yellow River Delta, except for the siltation of the mouth bar and its vicinity, other sea areas are essentially in a state of erosion, and there is a seabed scouring and siltation transition zone around the current mouth bar (Figure 18 and Figure 19). The volume of scouring and siltation is equivalent, so the isobaths in this area are unaffected.
On Laizhou Bay’s west side, a wide range of siltation distribution processes are present, including two significant scouring areas corresponding to the spur dike of the Guangli Estuary and the breakwater of Weifang Port. The presence of breakwater in the area changes the hydrodynamic environment, which reduces siltation. Scouring is intense around the breakwater due to waves and tides. At the same time, the hydrodynamic force is particularly strong at the dam head, and is manifested as massive regional scouring. The eastern side of Laizhou Bay also shows a scouring trend which manifests as strip scouring because of the construction of artificial ports (Figure 18). Yantai’s west side, on the south side of the Miaodao Strait, is affected by the construction of an artificial island. The wave action on the west side of the artificial island is weakened, showing a silting trend. On the northern side of the artificial island, the front end of the reclamation project is attributed to the pick-up and wave breaking, which enhance the tidal current and wave action [12], producing a strong scouring trend in the surrounding area of the Miaodao Strait. In Yantai’s northern sea area, there were no significant coastal changes during the study period, and the overall trend is balanced or slightly silted. Nearshore erosion has intensified in recent years along the coast of Weihai City due to the influence of coastal engineering construction, resulting in siltation in large bays, especially in Jinghai Bay, where siltation is most widely distributed. Two phases of new port construction were completed after 2008 in the Jinghai Bay port area. However, new coastal projects, such as dikes, berths, breakwaters, and waterways, have exacerbated coastal erosion. The impact of the Yellow River is weakened on the Shandong Peninsula’s south bank, and the source of the siltation material is coastal erosion [32]. Human production activities, such as beach aquaculture and coastal reclamation projects, are widespread in the coastal waters of Haiyang City. Most of the sandy, eroding sections along the coast of Haiyang City result from these activities. In addition, siltation is dispersed beneath the water of an offshore area of the flat coastline that stretches from Rushankou to Dingzi Bay. In general, two aspects of human activity affect the distribution of erosion and deposition. First, offshore aquaculture, reclamation, and other factors impact the stability of the coast, resulting in increased coastal erosion and material transport, leading to coastal deposition. Second, the construction of dams and artificial islands in the sea area has changed the regional hydrodynamic environment, which has exacerbated underwater erosion [41,42,43,44].
5. Conclusions
This study investigated the changes in scouring and siltation in Shandong Peninsula’s coastal waters using water-depth data from two periods. The following are the main conclusions:
- (1)
- The amount of silt on the seabed in Shandong Peninsula’s coastal waters has increased over the past 15 years. The contour of the siltation area also exhibits a significant trend toward the sea. The siltation trend is greatest in the north, and the siltation degree in the east and south is weaker. Many balanced scouring and siltation areas have no significant underwater topography changes. The west side of Laizhou Bay is the coastal area of the Shandong Peninsula with the largest siltation area and amount of siltation. The siltation area was 6.59 × 10⁸ m2, the siltation volume was 3.8 × 10⁸ m3, and the net siltation volume was 2.13 × 10⁸ m3. The maximum siltation thickness was distributed in the sea area around Chengshantou, and the maximum siltation thickness was 17.9 m.
- (2)
- Shandong Peninsula’s coastal waters exhibit the characteristics of point scouring. Its scouring area is generally located in the port and other coastal engineering areas or distributed in the high marine dynamic and siltation areas. The maximum scouring area is from Taozi Bay to Yangma Island, with a scouring amount of 0.10 × 10⁸ m3.
- (3)
- The primary material sources of scouring and siltation in the coastal waters of the Shandong Peninsula are river sediment and coastal scouring transport, which affect the overall scouring and siltation distribution. River sediment mainly comes from the Yellow River, and the greatest influence extends from Laizhou Bay to the north bank of Zhifu District. After passing through the mountain, the material is mainly transported from coastal scouring areas to underwater. Changes in seabed scouring and siltation are positively correlated with variations in coastal scouring intensity. At the same time, coastal engineering and reclamation, in addition to other human activities, seriously increase changes in scouring and siltation.
Author Contributions
Methodology, Z.Z., W.G. and P.L.; formal analysis, Z.Z. and W.G.; investigation, Z.Z., P.L., W.G., J.L., Y.X. and X.W.; data analysis and statistics, Z.Z., W.G., P.L., J.L., Y.X. and X.W., writing—original draft preparation, Z.Z.; writing—review and editing, Z.Z., W.G., P.L. and A.L.; funding acquisition, W.G. All authors have read and agreed to the published version of the manuscript.
Funding
This research was funded by the National Key Research and Development Program of China (Grant No.2022YFC3106103), the Shandong Provincial Natural Science Foundation, China (Grant No. ZR2021MD098), the Marine S&T Fund of Shandong Province for Pilot National Laboratory for Marine Science and Technology (Qingdao) (Grant No.2018SDKJ0503-3), and the Public Science and Technology Research Funds Projects of Ocean (Grant No.201005010).
Institutional Review Board Statement
Not applicable.
Informed Consent Statement
Not applicable.
Data Availability Statement
All supporting data for this study are reported in the manuscript.
Conflicts of Interest
The authors declare no conflict of interest.
References
- Balica, S.F.; Wright, N.G.; Van Der Meulen, F. A flood vulnerability index for coastal cities and its use in assessing climate change impacts. Nat. Hazards 2012, 64, 73–105. [Google Scholar] [CrossRef]
- McGranahan, G.; Balk, D.; Anderson, B. The rising tide: Assessing the risks of climate change and human settlements in low elevation coastal zones. Environ. Urban. 2007, 19, 17–37. [Google Scholar] [CrossRef]
- Neumann, B.; Vafeidis, A.T.; Zimmermann, J.; Nicholls, R.J. Future Coastal Population Growth and Exposure to Sea-Level Rise and Coastal Flooding—A Global Assessment. PLoS ONE 2015, 10, e0131375. [Google Scholar] [CrossRef] [PubMed]
- Cao, C.; Cai, F.; Qi, H.; Liu, J.; Lei, G.; Zhu, K.; Mao, Z. Coastal Erosion Vulnerability in Mainland China Based on Fuzzy Evaluation of Cloud Models. Front. Mar. Sci. 2022, 8, 790664. [Google Scholar] [CrossRef]
- Ranasinghe, R. Assessing climate change impacts on open sandy coasts: A review. Earth-Sci. Rev. 2016, 160, 320–332. [Google Scholar] [CrossRef]
- Ranasinghe, R.; Wu, C.S.; Conallin, J.; Duong, T.M.; Anthony, E.J. Disentangling the relative impacts of climate change and human activities on fluvial sediment supply to the coast by the world’s large rivers: Pearl River Basin, China. Sci. Rep. 2019, 9, 9236. [Google Scholar] [CrossRef]
- Le Cozannet, G.; Bulteau, T.; Castelle, B.; Ranasinghe, R.; Wöppelmann, G.; Rohmer, J.; Bernon, N.; Idier, D.; Louisor, J.; Salas-Y-Mélia, D. Author Correction: Quantifying uncertainties of sandy shoreline change projections as sea level rises. Sci. Rep. 2019, 9, 6186. [Google Scholar] [CrossRef]
- Hinkel, J.; Lincke, D.; Vafeidis, A.T.; Perrette, M.; Nicholls, R.J.; Tol, R.S.J.; Marzeion, B.; Fettweis, X.; Ionescu, C.; Levermann, A. Coastal flood damage and adaptation costs under 21st century sea-level rise. Proc. Natl. Acad. Sci. USA 2014, 111, 3292–3297. [Google Scholar] [CrossRef]
- Vörösmarty, C.J.; Meybeck, M.; Fekete, B.; Sharma, K.; Green, P.; Syvitski, J.P. Anthropogenic sediment retention: Major global impact from registered river impoundments. Glob. Planet. Chang. 2003, 39, 169–190. [Google Scholar] [CrossRef]
- Williams, A.; Rangel-Buitrago, N.; Pranzini, E.; Anfuso, G. The management of coastal erosion. Ocean Coast. Manag. 2018, 156, 4–20. [Google Scholar] [CrossRef]
- Xie, D.F.; Pan, C.H.; Cao, Y.; Zhang, B. Decadal variations in the erosion/deposition pattern of the Hangzhou Bay and their mechanism in recent 50a. Acta Oceanol. Sin. 2013, 35, 121–128. [Google Scholar]
- Zhou, G.Z.; Feng, X.L.; Liu, J.; Liu, X.; Xu, F. Prediction of erosion evolution and deposition in the east coast of the Laizhou Bay after the implemention of the coastal planning. Mar. Sci. 2014, 38, 15–19. [Google Scholar]
- Zhao, B. Study on Characteristic and Influence Factors of Erosion and Deposition in Sanshan Island-Diaolongzui Area, Laizhou. Master’s Thesis, Ocean University of China, Qingdao, China, 2014. [Google Scholar]
- Yu, J.K.; Ren, Z.H.; Zhan, C.; Zhang, Y.C.; Geng, W.Q.; Wang, Q. Erosion-deposition analysis of underwater slope on lagoon and sand barriers in the Swan Lake, Rongcheng, Shandong province. J. Trop. Oceanogr. 2022, 41, 61–70. Available online: https://kns.cnki.net/kcms/detail/44.1500.p.20211122.1324.002.html (accessed on 21 April 2022).
- Li, M.; Wang, Q.; Zhang, A.; Liu, Y. Study on the geomorphic evolution of the muddy coast along the southern-western Laizhou Bay over the past 50 years. Mar. Sci. Bull. 2013, 32, 141–151. [Google Scholar]
- Wang, L.X.; Li, X.Y.; Wang, Q.; Zhan, C.; Guo, W.J.; Zhang, J.B.; Li, Q.; Zhang, Z.C. Study on profile evolution in the Eastern Coast of Laizhou Bay. Trans. Oceanol. Limnol. 2020, 6, 44–52. [Google Scholar] [CrossRef]
- He, K.; Shi, B.; Li, C.H.; Liang, J.H. Study on the Evolution of Scouring and Deposition for Dredging Engineering in Tangdao Bay. Period. Ocean. Univ. China 2019, 49, 117–124. [Google Scholar] [CrossRef]
- Li, G.X.; Gong, L.X.; Yang, J.C.; Dong, D. Beach erosion along the coast of Shangdong province and protection countermeasures. Mar. Geol. Quat. Geol. 2013, 33, 35–46. [Google Scholar] [CrossRef]
- Wu, Z. Sedimentary Geomorphology and Quality Evaluation of Typical Beaches in Weihai. Coast. Eng. 2019, 38, 52–62. [Google Scholar]
- Liu, L. Spatial and Temporal Distribution Characteristics and Formation Mechanism of Total Suspended Solid in the Coastal Area of Shandong Peninsula. Master’s Thesis, The Institute of Oceanology, Chinese Academy of Sciences, Qingdao, China, 2019. [Google Scholar]
- Chen, X.Q.; Chen, J.Y. A study of closure depth on the profiles ofthe changjiang deltaic coast on the fundamental problems associatedwith bruun rule and its application. Acta Geogr. Sin. 1998, 53, 37–45. [Google Scholar]
- Arun, P.V. A terrain-based hybrid approach towards DEM interpolation. Ann. GIS 2013, 19, 245–252. [Google Scholar] [CrossRef]
- Jin, L.; Heap, A.D. A review of comparative studies of spatial interpolation methods in environmental sciences: Performance and impact factors. Ecol. Inform. 2011, 6, 228–241. [Google Scholar]
- Arun, P. A comparative analysis of different DEM interpolation methods. Egypt. J. Remote. Sens. Space Sci. 2013, 16, 133–139. [Google Scholar] [CrossRef]
- Ali, O.; Ghazal, N.; Hassoon, K. Bathymetry of Iraqi Territorial Water (Coast of Faw Peninsula) by Using GIS Techniques (IDW and Kriging Interpolation Methods). Indian J. Sci. 2018, 9, 14635–14645. [Google Scholar]
- Walsh, L. Digital Topography: Should You Choose a TIN or Raster Interpolation of the Landscape? Available online: https://serc.carleton.edu/vignettes/collection/42681.html (accessed on 15 April 2022).
- Khosravipour, A.; Isenburg, M.; Skidmore, A.K.; Wang, T. Creating Better Digital Surface Models from LiDAR Points. In Proceedings of the 36th Asian Conference on Remote Sensing 2015 (ACRS 2015), Quezon City, Philippines, 19–23 October 2015. [Google Scholar]
- Polat, N.; Uysal, M.; Toprak, A. An investigation of DEM generation process based on LiDAR data filtering, decimation, and interpolation methods for an urban area. Measurement 2015, 75, 50–56. [Google Scholar] [CrossRef]
- Miao, X.M.; Zhu, L.H.; Liu, Z.J.; Hu, R.J.; Jiang, S.H.; Zhang, Z.H. Distribution Pattern and Source of Trace Elements in the Surface Sediments Offshore the Northestern Shandong Peninsula. Period. Ocean. Univ. China 2018, 48, 82–92. [Google Scholar] [CrossRef]
- Bian, C.W. Chinese Coastal Sediment Transport in the Bohai Sea, Yellow Sea and East China Sea. Ph.D. Thesis, Ocean University of China, Qingdao, China, 2012. [Google Scholar]
- Zhao, S.L. Shandong Marine Resources and Environment; China Ocean Press: Beijing, China, 2002; pp. 26–213. [Google Scholar]
- Liu, X.M.; Qiao, L.L.; Wan, X.Q.; Zhong, Y.; Ma, W.W.; Liu, P. The sediment transport channel of the yellow rive. Oceanol. Limnol. Sin. 2019, 50, 49–60. [Google Scholar]
- Gong, L.X. Erosion Situation and Protection of Beach in Eastern Part of Shandong Peninsula. Master’s Thesis, Ocean University of China, Qingdao, China, 2014. [Google Scholar]
- Shi, C.X. Deposition and dispersal of different grain-size sediments in the Yellow River estuary. Geogr. Res. 2021, 40, 1125–1133. [Google Scholar]
- Yang, S.L.; Zhao, Q.Y.; Belkin, I.M. Temporal variation in the sediment load of the Yangtze river and the influences of human activities. J. Hydrol. 2002, 263, 56–71. [Google Scholar] [CrossRef]
- Van Rijn, L.C. Mathematical Modelling of Morphological Processes in the Case of Suspended Sediment Transport. Ph.D. Thesis, Delft Technical University, Delft, The Netherlands, June 1987. [Google Scholar]
- Zhang, X.; Hetland, R.D.; Marta-Almeida, M.; DiMarco, S.F. A numerical investigation of the Mississippi and Atchafalaya freshwater transport, filling and flushing times on the Texas-Louisiana Shelf. J. Geophys. Res. Ocean. 2012, 117, 1–21. [Google Scholar] [CrossRef]
- Tsivtsivadze, N.S. Transformation of Sea Coast under the Human Activity. In Proceedings of Coastal & Port Engineering in Developing Countries, 2; China Ocean Press: Beijing, China, 1987; pp. 1825–1833. [Google Scholar]
- Guerrera, F.; Martín-Martín, M.; Tramontana, M.; Nimon, B.; Kpémoua, K. Shoreline Changes and Coastal Erosion: The Case Study of the Coast of Togo (Bight of Benin, West Africa Margin). Geosciences 2021, 11, 40. [Google Scholar] [CrossRef]
- Siqueira, S.; Gonçalves, R.; Queiroz, H.; Pereira, P.; Silva, A.; Costa, M. Understanding the coastal erosion vulnerability influence over sea turtle (Eretmochelys imbricata) nesting in NE of Brazil. Reg. Stud. Mar. Sci. 2021, 47, 101965. [Google Scholar] [CrossRef]
- Ma, F. Study on the Suspended Sediment Transportation and Seabed Erosion and Deposition Surrounding Huanghua Harbor. Master’s Thesis, Ocean University of China, Qingdao, China, 2007. [Google Scholar]
- Wu, Y.Y. The Hydrodynamic and the Sediment Scouring and Silting Numerical Simulation of the Surrounding Waters of Haiyang Central Fishing Harbor. Master’s Thesis, Ocean University of China, Qingdao, China, 2014. [Google Scholar]
- An, Y.N. Study on Impacts of Offshore Artificial Islands Cluster’s Construction on Scouring-Deposition Features in Longkou Bay. Master’s Thesis, Ocean University of China, Qingdao, China, 2010. [Google Scholar]
- Li, S.H. Impacts of Reclamation on the Erosion and Deposition at the Coast of Zhanjiang Bay Entrance. Master’s Thesis, The First Institute of Oceanography, MNR, Qingdao, China, 2013. [Google Scholar]
Figure 1.
Geographical location of the study area and distribution of cross-sections.

Figure 2.
The distribution of original dots, 2019.

Figure 3.
The distribution of dots from Rushankou to Dingzi Bay, 2019.

Figure 4.
Digital elevation model of Rushankou to Dingzi Bay, 2019.

Figure 5.
Isobath and scouring–siltation changes in Laizhou Bay.

Figure 6.
Isobath and scouring–siltation changes between Diaolongzui and Miaodao Strait.

Figure 7.
Isobath and scouring–siltation changes between Luanjiakou Port and Taozi Bay.

Figure 8.
Elevation change in cross-section (P01 to P04).

Figure 9.
Elevation changes in cross-section (P05 to P08).

Figure 10.
Isobaths and scouring–siltation changes between Taozi Bay and Yangma Island.

Figure 11.
Isobaths and scouring–siltation changes between Chengshantou and Jinghai Bay.

Figure 12.
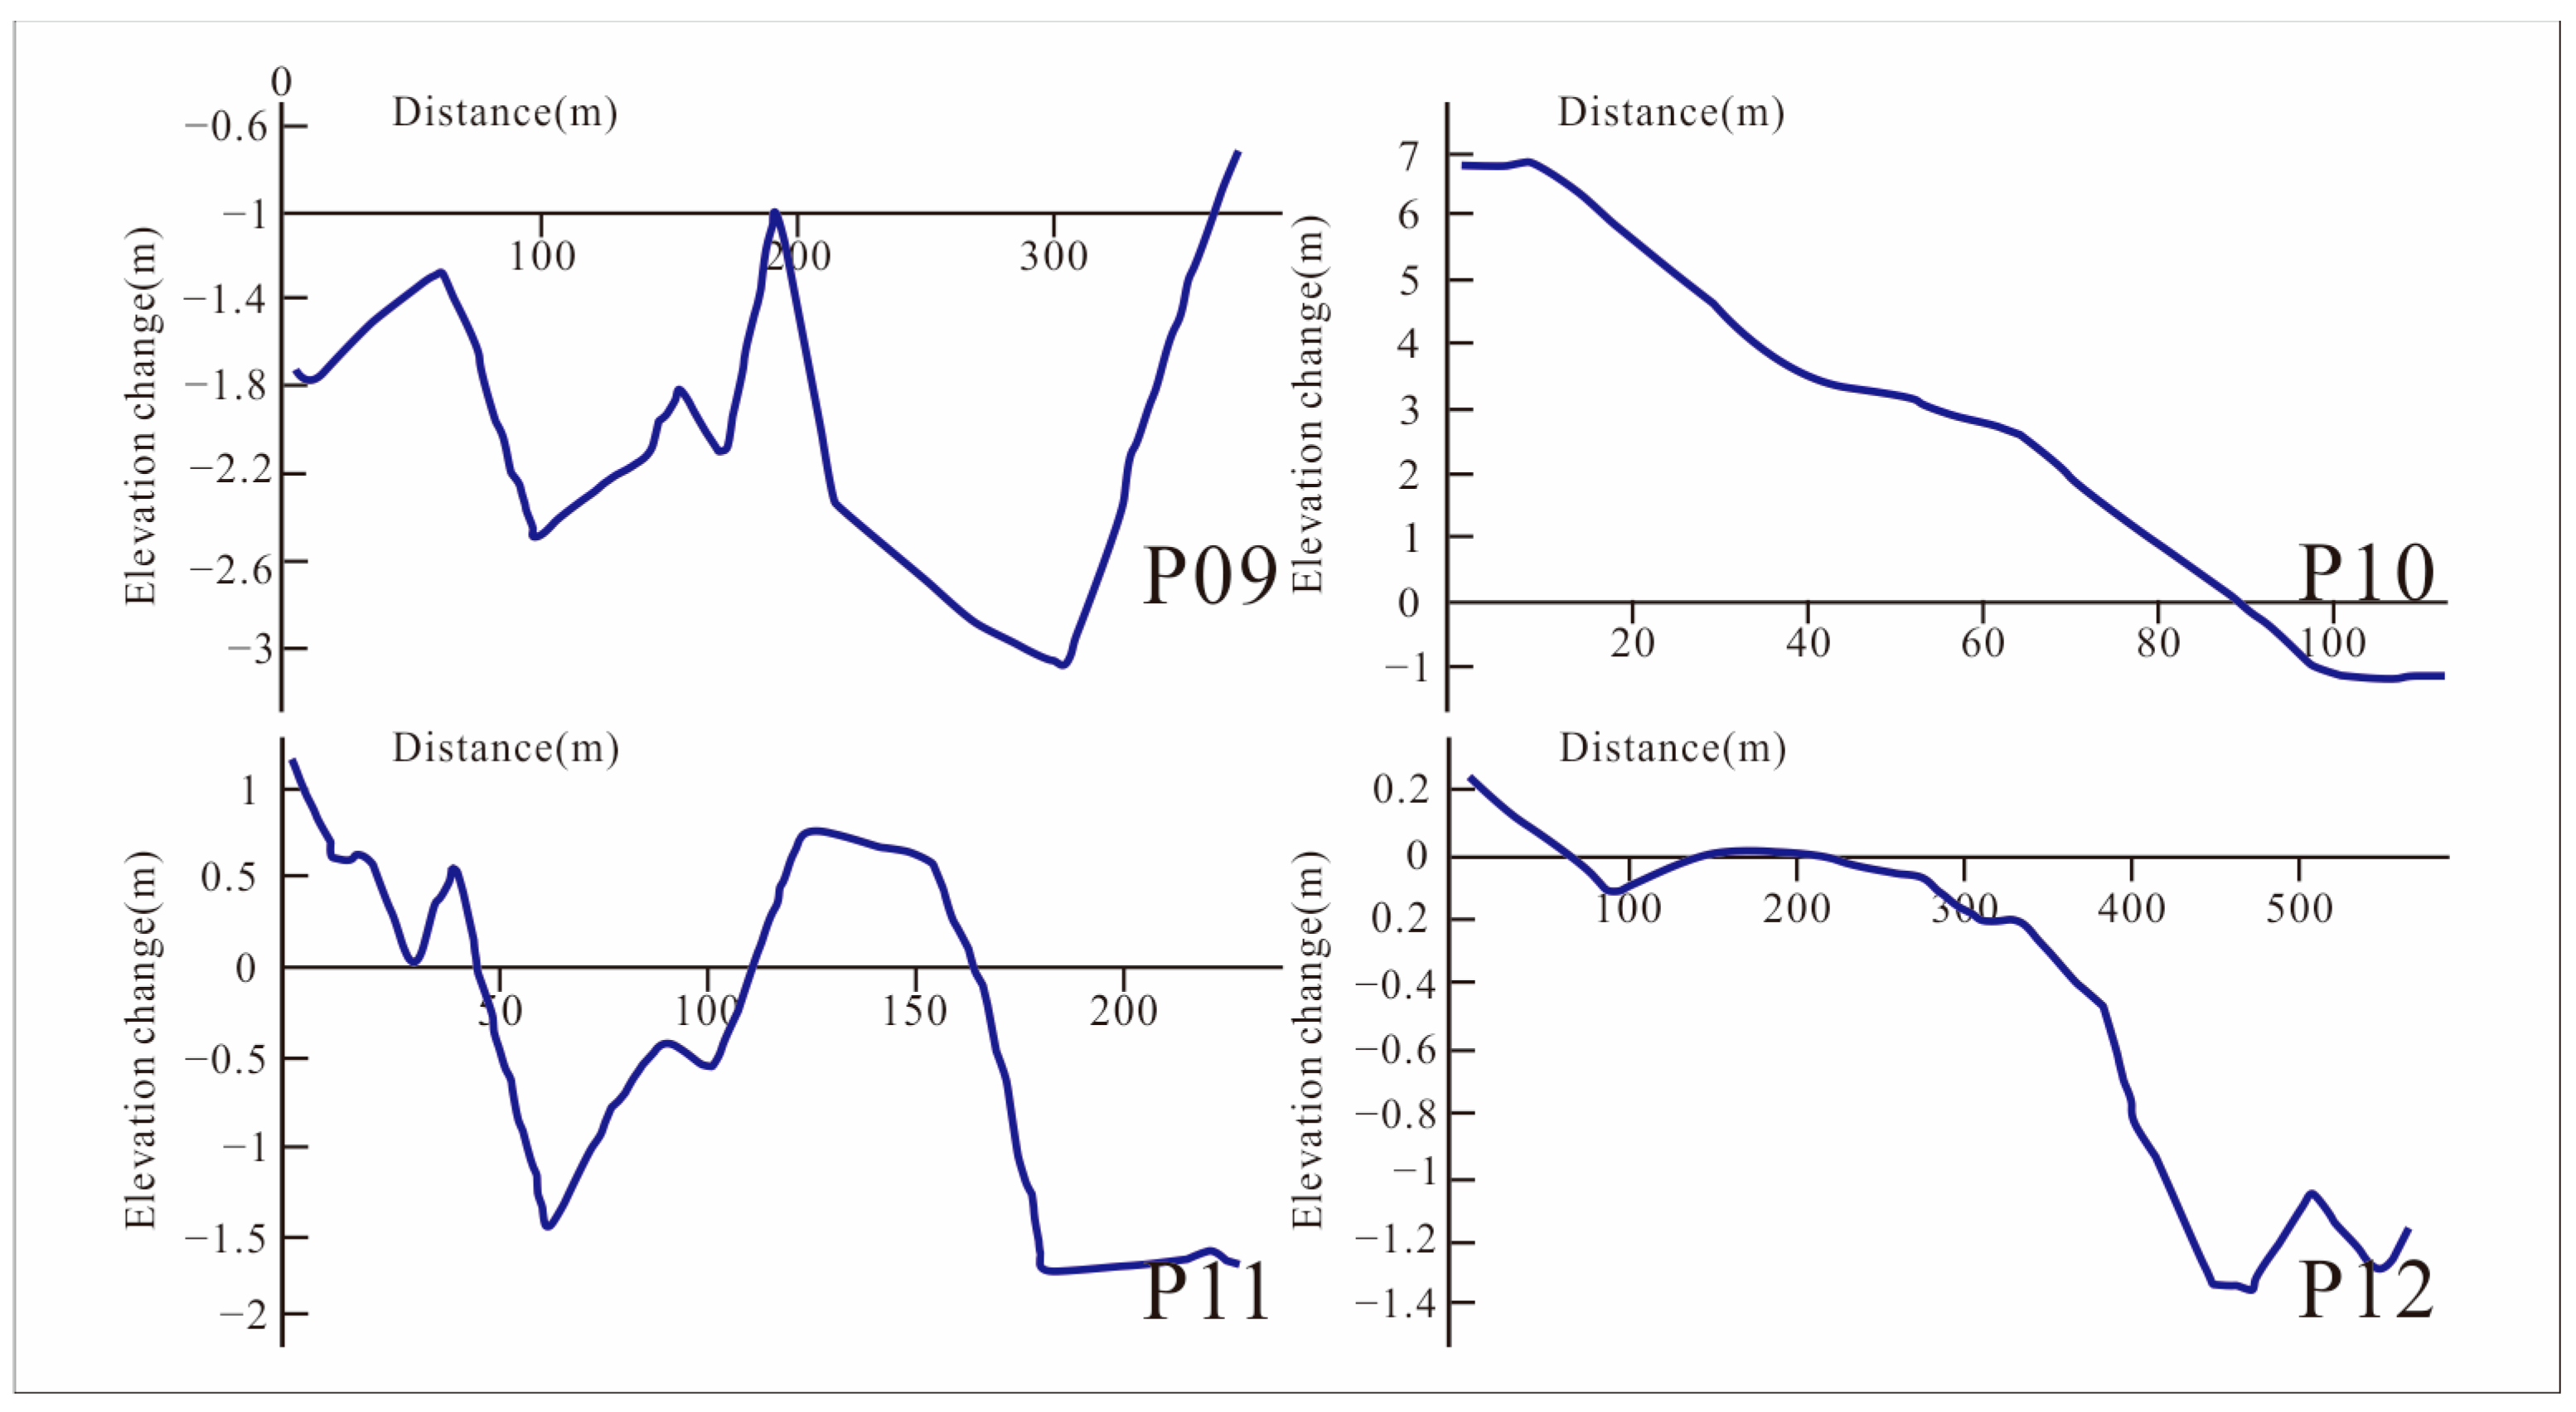
Elevation change in cross-section (P09 to P12).

Figure 13.
Elevation change in cross-section (P13 to P16).

Figure 14.
Isobaths and scouring–siltation changes in Rushankou to Dingzi Bay and Jiaozhou Bay.

Figure 15.
Elevation change in cross-section (P17 to P20).

Figure 16.
Shandong Peninsula offshore circulation diagram and route of seaward material transport from the Yellow River.
Figure 16.
Shandong Peninsula offshore circulation diagram and route of seaward material transport from the Yellow River.

Figure 17.
Contrast map of offshore scouring, siltation, and coastal-erosion distribution in the Shandong Peninsula.
Figure 17.
Contrast map of offshore scouring, siltation, and coastal-erosion distribution in the Shandong Peninsula.

Figure 18.
Human impact on the distribution of scouring and siltation (Human activities change the river estuary).
Figure 18.
Human impact on the distribution of scouring and siltation (Human activities change the river estuary).

Figure 19.
Human impact on the distribution of scouring and siltation (Coastal projects).


Table 1.
Depth data of coastal waters in the Shandong Peninsula.
| Area | Time Span | Coordinate System | Depth Datum |
|---|---|---|---|
| Laizhou Bay | 2005–2019 | WGS84 | theoretical depth datum |
| Diaolongzui to Miaodao Strait | 2006–2019 | WGS84 | theoretical depth datum |
| Luanjiakou Port to Taozi Bay | 2006–2019 | WGS84 | theoretical depth datum |
| Taozi Bay to Yangma Island | 2005–2019 | WGS84 | theoretical depth datum |
| Weihai Port to Jinghai Bay | 2005–2019 | WGS84 | theoretical depth datum |
| Rushankou to Dingzi Bay | 2006–2019 | WGS84 | theoretical depth datum |
| Jiaozhou Bay | 2004–2019 | WGS84 | theoretical depth datum |
Table 2.
Error description of DEMs.
| Area | Time | Maximum Error (meters) | Minimum Error (meters) | Average Error (meters) | Standard Error (meters) |
|---|---|---|---|---|---|
| Laizhou Bay | 2019 | 9.04614 | 0.00003 | 0.01075 | 1.24685 |
| Diaolongzui to Miaodao Strait | 2019 | 3.77348 | 0.00003 | 0.05336 | 1.44664 |
| Luanjiakou Port to Taozi Bay | 2019 | 2.66772 | 0.00021 | 0.06483 | 1.62265 |
| Taozi Bay to Yangma Island | 2019 | 3.27811 | 0.00000 | 0.03474 | 1.42165 |
| Weihai Port to Jinghai Bay | 2019 | 6.98346 | 0.00000 | 0.04256 | 1.73592 |
| Rushankou to Dingzi Bay | 2019 | 2.98725 | 0.00003 | 0.18213 | 1.24690 |
| Jiaozhou Bay | 2019 | 3.88760 | 0.00001 | 0.01537 | 2.27754 |
| Laizhou Bay | 2005 | 2.87709 | 0.00006 | 0.01288 | 0.65750 |
| Diaolongzui to Miaodao Strait | 2006 | 2.33651 | 0.00002 | 0.02151 | 0.92651 |
| Luanjiakou Port to Taozi Bay | 2006 | 2.14962 | 0.00001 | 0.09391 | 1.50429 |
| Taozi Bay to Yangma Island | 2005 | 4.00565 | 0.00003 | 0.04246 | 1.54739 |
| Weihai Port to Jinghai Bay | 2005 | 2.02476 | 0.00000 | 0.04463 | 1.73018 |
| Rushankou to Dingzi Bay | 2006 | 1.75644 | 0.00004 | 0.02016 | 1.16151 |
| Jiaozhou Bay | 2004 | 3.02345 | 0.00001 | 0.11444 | 1.94044 |
Table 3.
Regional scouring–siltation parameters.
| Research Area | Scouring Volume × 108 m3 | Silting Volume × 108 m3 | Net Sedimentation Volume × 108 m3 | Siltation Rate × 108 m3.a−1 |
|---|---|---|---|---|
| West Laizhou Bay | 1.67 | 3.8 | 2.13 | 0.152 |
| East Laizhou Bay | 0.18 | 1.63 | 1.46 | 0.103 |
| Diaolongzui to Miaodao Strait | 2.02 | 2.57 | 0.56 | 0.043 |
| Luanjiakou Port to Taozi Bay | 0.74 | 0.97 | 0.23 | 0.019 |
| Taozi Bay to Yangma Island | 0.83 | 0.72 | −0.10 | −0.007 |
| Weihai Port to Jinghai Bay | 0.94 | 2.55 | 1.62 | 0.019 |
| Rushankou to Dingzi Bay | 1.13 | 2.91 | 1.78 | 0.148 |
| Jiaozhou Bay | 0.76 | 1.34 | 0.57 | 0.115 |
Disclaimer/Publisher’s Note: The statements, opinions and data contained in all publications are solely those of the individual author(s) and contributor(s) and not of MDPI and/or the editor(s). MDPI and/or the editor(s) disclaim responsibility for any injury to people or property resulting from any ideas, methods, instructions or products referred to in the content. |
© 2023 by the authors. Licensee MDPI, Basel, Switzerland. This article is an open access article distributed under the terms and conditions of the Creative Commons Attribution (CC BY) license (https://creativecommons.org/licenses/by/4.0/).
Share and Cite
MDPI and ACS Style
Zhang, Z.; Gao, W.; Li, P.; Liu, J.; Xu, Y.; Wei, X.; Li, A. Influencing Factors of Submarine Scouring and Siltation Changes in Offshore Area of Shandong Peninsula. Water 2023, 15, 435. https://doi.org/10.3390/w15030435
AMA Style
Zhang Z, Gao W, Li P, Liu J, Xu Y, Wei X, Li A. Influencing Factors of Submarine Scouring and Siltation Changes in Offshore Area of Shandong Peninsula. Water. 2023; 15(3):435. https://doi.org/10.3390/w15030435
Chicago/Turabian StyleZhang, Zhuoli, Wei Gao, Ping Li, Jie Liu, Yuanqin Xu, Xia Wei, and Anlong Li. 2023. "Influencing Factors of Submarine Scouring and Siltation Changes in Offshore Area of Shandong Peninsula" Water 15, no. 3: 435. https://doi.org/10.3390/w15030435
Note that from the first issue of 2016, this journal uses article numbers instead of page numbers. See further details here.