
Development of Fouling-Control Strategy for Ceramic Membrane Bioreactor Applied in Partial Nitrification Process
by
Bingxin Li
1,
Ruochen Wang
1,
Weiwei Zuo
1,
Yi Peng
2,3,
Dong An
2,3,
Liang Zhang
1 and
Zheng Ge
1,* 1
National Engineering Laboratory for Advanced Municipal Wastewater Treatment and Reuse Technology, Engineering Research Center of Beijing, Beijing University of Technology, Beijing 100124, China
2
Beijing Xintong Bishui Reclaimed Water Co., Ltd., Beijing 101149, China
3
SDIC Xinkai Water Environment Investment Co., Ltd., Beijing 101101, China
*
Author to whom correspondence should be addressed.
Water 2023, 15(3), 444; https://doi.org/10.3390/w15030444
Submission received: 14 December 2022
/
Revised: 16 January 2023
/
Accepted: 18 January 2023
/
Published: 22 January 2023
(This article belongs to the Special Issue Biological Treatment of Sewage and Resource Utilization of Sludge)
Abstract
:A lab-scale ceramic membrane bioreactor (MBR) with active membrane-fouling control system was developed for the partial nitrification (PN) process. The in situ membrane cleaning method was applied to remove the contaminants on the surface of the membrane with no interruption of the wastewater treatment. The results showed that the device increased critical flux and reduced gel layer resistance (Rg) and internal resistance (Ri) of the flat-sheet ceramic membrane by inhibiting the formation of the cake layer. In long-term experiments, nitrite oxidizing bacteria (NOB) was successfully suppressed, and nitrite accumulation rate (NAR) was achieved at a high level, up to 90.09%; the effluent NO2−-N/NH4+-N was maintained in balance dynamically with an average ratio of ~1.30, which would be beneficial to the proliferation of Anammox bacteria and the following autotrophic nitrogen removal (ANR) process. Moreover, with the assistance of in situ cleaning, energy input from aeration was significantly reduced, while over aeration was avoided for more stable PN performance.
1. Introduction
Autotrophic nitrogen removal (ANR) has received widespread attention for its energy-efficient performance compared to the traditional activated sludge processes [1,2,3]. In practical application, partial nitrification (PN) can be combined with a variety of treatment processes to complete ANR function, which is a shortcut nitrogen conversion pathway directly from ammonium and nitrite to nitrogen gas instead of nitrification and denitrification conversion [4]. The autotrophic microorganisms involved, such as ammonia oxidizing bacteria (AOB) and Anammox bacteria, play a key role in effective nitrogen removal so that energy for oxygen supply and organic carbon necessary for denitrification could be extensively reduced during the ANR [5]. Meanwhile, sludge production is potentially minimized due to slower growth rate of autotrophic microorganisms [6]. However, nitrite accumulation from the PN process usually limits anammox nitrogen removal because stable and efficient PN process is crucial to the continuation of the ANR process [7].
One of the challenges for stable ANR performance is the retention of active biomass. To overcome the biomass loss, membrane bioreactor (MBR) was designed in activated-sludge-based treatment system to enhance the biological degradation with high concentration of biomass [8,9]. Similarly, membrane separation can be applied in ANR for sludge retention purpose, which several studies about ANR utilizing membrane separation have shown [9,10], but the application is still restricted as there is little effective method to control membrane fouling. Especially for polymeric membranes used in traditional MBR systems, in situ fouling control mainly relies on air stripping, which is not applicable for ANR with low dissolved oxygen (DO) environment. Long-term contact between membrane and sludge inevitably leads to a decrease in flux and an increase in transmembrane pressure (TMP), thereby severely restricting the application of MBR due to the increased operation cost and complexity [11,12]. The complete biomass retention in MBR for slow-growing bacteria indicates it could be an effective way to maximize the nitrogen removal performance of autotrophic organisms [13]. In addition, the sludge residence time (SRT) of MBR is much longer, and the much higher sludge concentration of the mixed liquid would barely change with the fed water flow and the concentration of organic matter, which may improve the stability and activity of the microorganisms so that the system would achieve a high impact load resistance to various environment changes [14].
Compared to polymeric membranes, ceramic-based membranes have the advantage of high stability, high flux, low fouling, and mechanical structure [15,16]. Due to its excellent processing properties, ceramic membranes have attracted wide attention in wastewater treatment [17]. Based on the above facts, ceramic membrane applied in MBR could be a potential alternative since more flexible fouling control strategies could be applied.
At present, the most common methods used for membrane fouling control mainly include chemical and physical cleaning [18,19]. Chemical cleaning usually required taking the membrane out of the reactor and washing it with acid and/or alkali. However, to achieve continuous operation with no interruption of biological process, off-site chemical cleaning should be avoided if possible. There are several physical control strategies applied for ceramic membrane, including aeration flushing, backwashing (gas or filtrate), online ultrasonic oscillation, and offline scrubbing [20]. Aeration is the most common way for both hollow fiber and ceramic membrane, which could be also combined with liquid backwash to create gas–liquid disturbance to reduce reversible fouling contaminants and slow down the flux decline [21]. However, for special scenario which does not demand high level of DO (such as partial nitrification process), excessive aeration or air stripping would affect anaerobic or anoxic biological performance.
In this study, an in situ membrane fouling control method was developed for flat-sheet ceramic MBR to achieve sustainable flux in partial nitrification process. The objectives were (1) to investigate the performance of fouling control strategy for long-term filtration operation; (2) to realize rapidly start-up of PN process, stable nitrite production and long-term nitrite oxidizing bacteria (NOB) inhibition; (3) to obtain the appropriate effluent NO2−-N/NH4+-N ratio by optimizing the operation conditions.
2. Materials and Methods
2.1. Synthetic Wastewater and Seeding Sludge
The reactor was fed with synthetic wastewater containing: MgSO4·7H2O, 0.3 g·L−1; CaCl2·2H2O, 0.18 g·L−1; KH2PO4, 0.1 g·L−1; NaHCO3, 1.8 g·L−1; trace solution I, 1 mL·L−1; trace solution II, 1 mL·L−1. The composition of trace solution I included 6.37 g·L−1 of EDTA·2Na and 9.15 g·L−1 of FeSO4·7H2O. The trace solution II contained H3BO4, 0.014 g·L−1; MnCl2·4H2O, 0.99 g·L−1; CuSO4·5H2O, 0.25 g·L−1; ZnSO4·7H2O, 0.43 g·L−1; NiCl2·6H2O, 0.19 g·L−1; NaSeO4·10H2O, 0.21 g·L−1; NaMoO4·2H2O, 0.22 g·L−1; NaWO4·2H2O, 0.05 g·L−1 [3]. The partial nitrification sludge used as inoculum was collected from a lab-scale reactor treating high ammonium wastewater, which has been operated for over 12 months.
2.2. Construction and Operation of Membrane Bioreactor
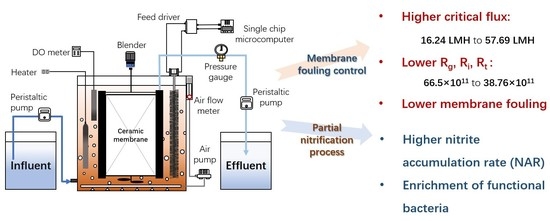
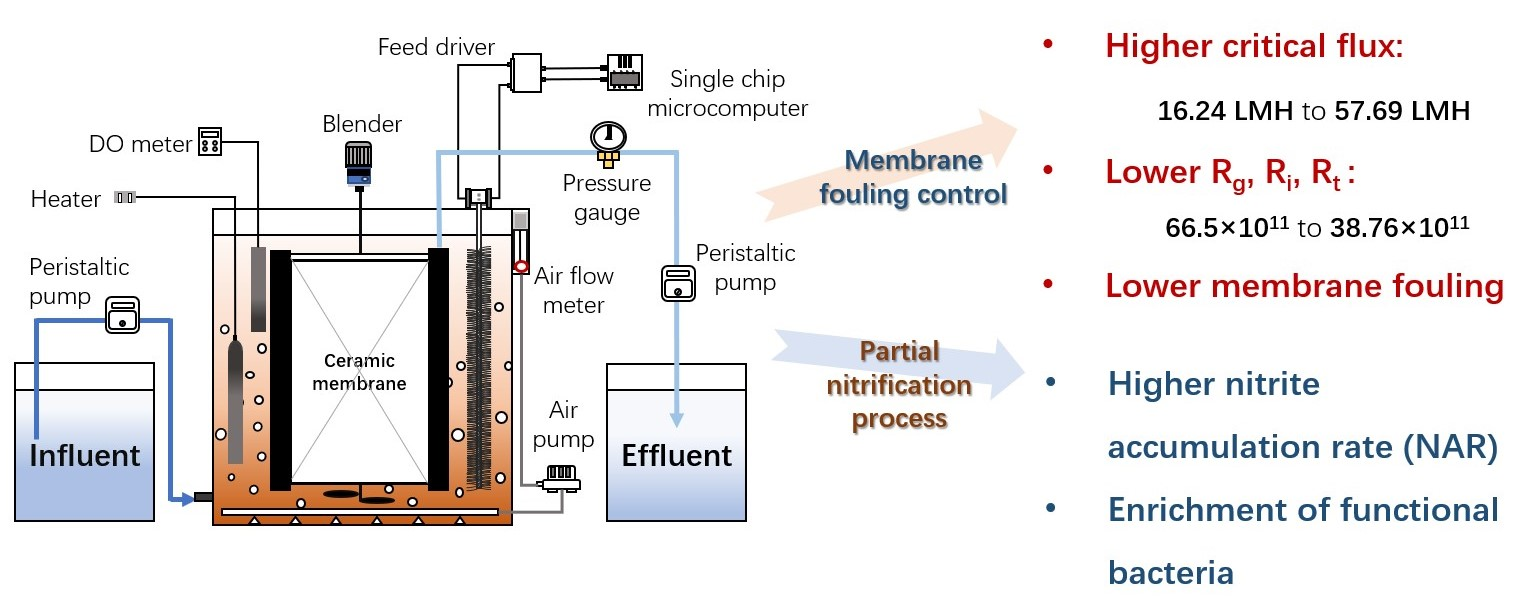
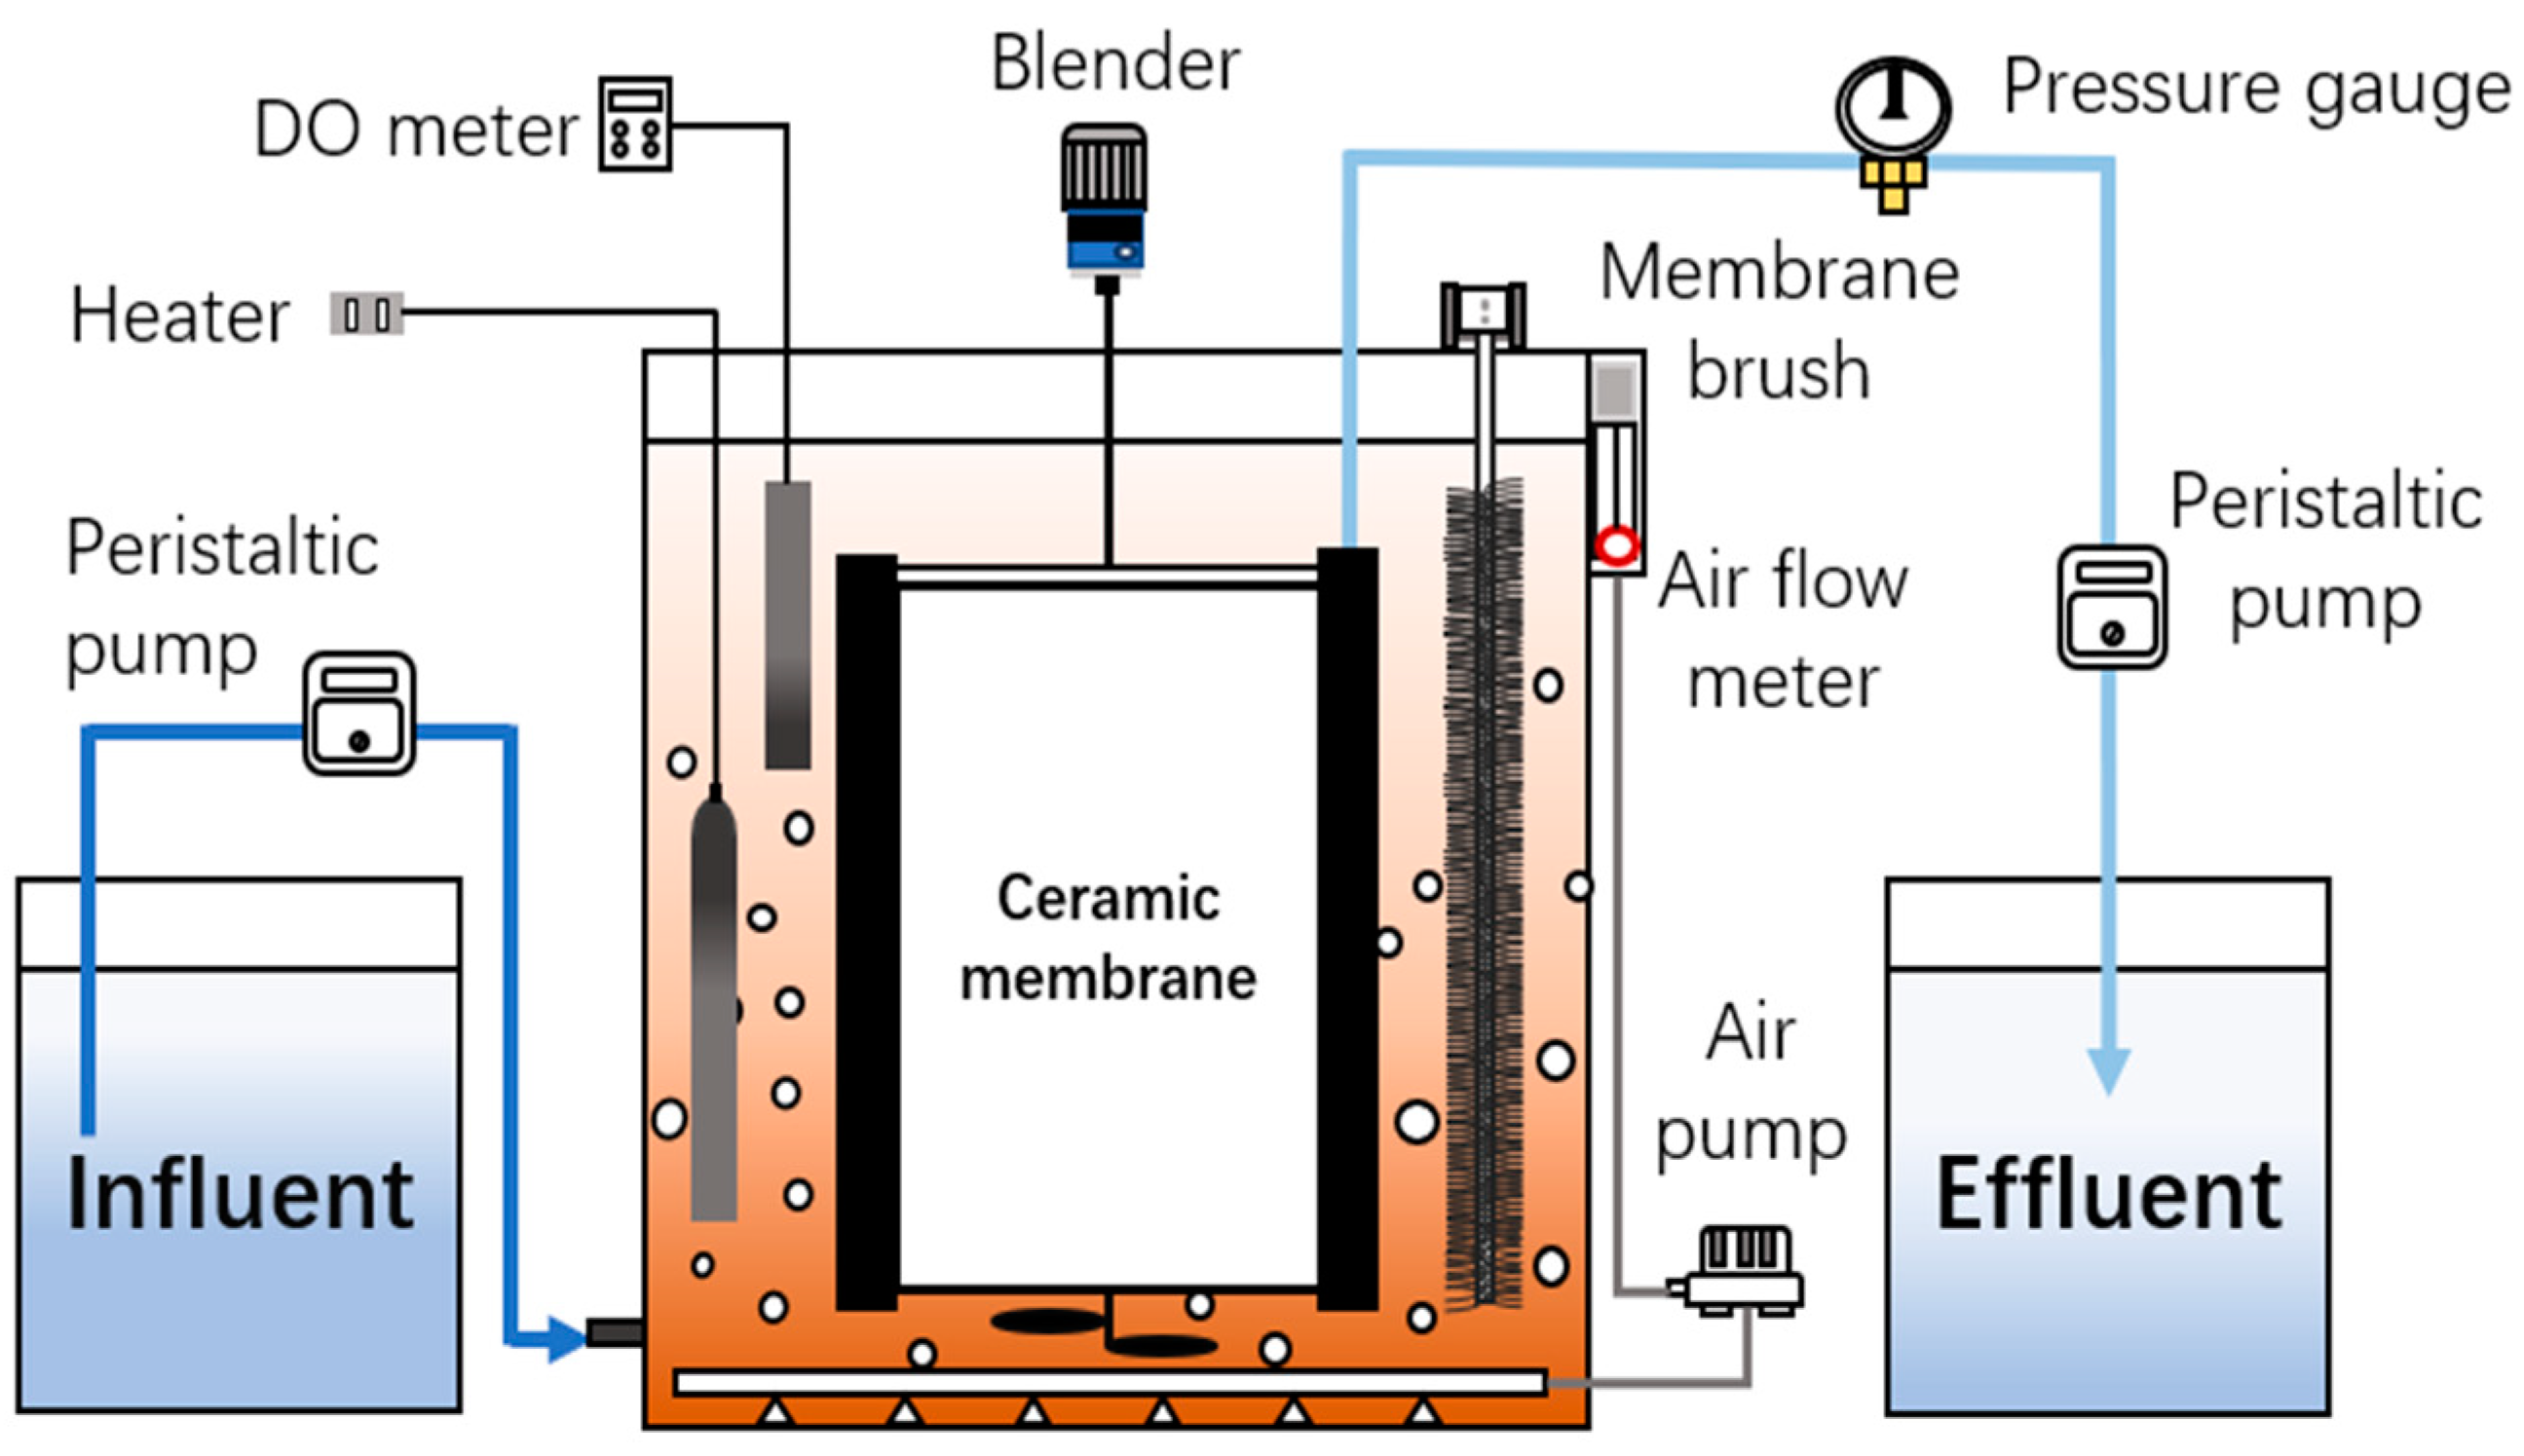
A cubic membrane bioreactor (MBR) was designed with working volume of 27.0 L. Two pieces of flat-sheet ceramic membrane (250 × 100 mm, Beijing Huamo, Beijing, China) were installed as shown in Figure 1. The average membrane pore size was 0.1 μm and the filtration area was 0.1 m2 in total. The different stages of operation conditions are shown in Table 1, and the influent concentration of ammonium ranged from 100–400 mg/L.
For all stages, the liquid temperature was maintained at 35 °C using a heating rod, and the dissolved oxygen was controlled within 0.10–0.25 mg·L−1. The permeate was extracted in constant flux mode using a peristaltic pump, and a digital pressure gauge (YuMing, Jiangsu, China) and a digital recorder (Toprie TP700, Shenzhen, China) were used to measure and record the transmembrane pressure (TMP). A set of soft fiber brushes was applied as membrane cleaning device to mitigate membrane fouling. The brushes were installed in contact with a ceramic membrane surface as shown in Figure 1, and were able to move fourth-and-back frequently. By using stepper driver and microcontroller, brushes were controlled as in situ membrane fouling control device operated along with membrane filtration.
2.3. Chemical Cleaning Method
The chemical cleaning was conducted for fouled membrane. Before the chemical treatment, surface cleaning and backwash were carried out with deionized water for 15 min under 60 kPa; afterward, the membrane was soaked in HCl solution of pH = 2 for 12 h; and then switched to alkaline cleaning with NaOH solution of pH = 12 for another 12 h.
2.4. Analytical Methods
Influent and effluent samples were collected daily and stored at 4 °C before analysis. The water samples were analyzed after being filtered through the 0.45 μm membrane filters. The parameters of samples including ammonium, nitrite, and nitrate concentrations, were measured by standard methods [22]. Temperature, pH, and DO were measured with water quality analyzer (WTW Multi 3420, WTW, Munich, Germany). The morphology of the membrane fouling samples was examined using a scanning electron microscope (SEM; FEIQUANTA 200, FEI Company, Hillsboro, OR, USA). The samples were fixed with 2.5% glutaraldehyde for approximately 1.5 h. Subsequently, samples were centrifuged at 2000 g/min for 10 min, washed three times in 0.1 mol/L phosphate buffer saline, and dehydrated in a series of ethanol solutions (50%, 70%, 80%, 90%, and 100%). The dehydrated samples were treated with 100% isoamyl acetate and dried via the critical point method. Finally, the dried samples were sputter-coated with the gold for SEM observation. Samples were observed by using an optical microscope (Olympus BX51, Tokyo, Japan).
2.5. Data Analysis
Free ammonia (FA) and free nitrous acid (FNA) are critical parameters in establishing partial nitrification; the calculation methods are as follows [23].
The flux of permeate (J) during the fouling process was calculated using Equation (3).
where V, A, and t are the volume of the permeate, membrane area, and operation time, respectively. The ceramic membrane cleaning effect can be expressed in terms of the recovery rate of membrane flux (), which was defined as Equation (4).
where is deionization flux of the ceramic membrane after cleaning, and is the deionization flux of the new uncontaminated ceramic membrane (Figure S1) (See Supplementary Materials).
In order to facilitate the study of membrane contamination control strategies, membrane fouling resistance was used to characterize the blocking force of ceramic membrane on filtrate and the degree of membrane fouling. The total resistance () of the ceramic membrane was calculated using Equation (5).
where , , , are the membrane resistance, concentration polarization resistance, gel layer resistance, and internal resistance. The membrane resistance () can be calculated by the following formula.
where is the TMP of the new membrane in pure water, and is the kinematic viscosity coefficient of pure water at 35 °C, and is the permeation flux of the new membrane under pure water. When the experimental wastewater flux attenuates to a relatively stable state, the relative steady flux is measured and is calculated.
where is the transmembrane pressure of the penetrant, and is the kinematic viscosity coefficient of penetrant, and is the flux of penetrant at relative steady state. It was replaced by pure water cross-flow filtration, and the relative steady flux was measured after the membrane flux was relatively stable.
By combining Equation (5) with Equation (8).
After membrane cleaning, pure water permeation flux was measured again.
Based on Equations (6), (8) and (10)
2.6. Microbial Community Analyses
The sludge samples were withdrawn from the MBR. The microbial communities were determined in triplicate by high-throughput sequencing analysis. The 16S rRNA gene was amplified by PCR using the bacterial primers 338F (5′-ACTCCTACGGGAGGCAGCAG-3′) and 806R (5′-GGACTACHVGGGTWTCTAAT-3′) [24]. Amplicon sequencing was performed by Majorbio Technology Co., Ltd. (Shanghai, China) using the Illumina Miseq platform. Mothur software (V1.45.3) was used for calculating the alpha diversity indices (Chao, ACE, Simpson, and Shannon).
3. Results and Discussion
3.1. In Situ Membrane Fouling Control
Many studies have shown that microorganisms in activated sludge produce a large number of soluble microbial products (SMP) and extracellular polymers (EPS), which are important components of membrane fouling and form gel layer on the membrane surface and accelerate the formation of filter cake layer [25]. The movement of the brushes could produce shear action on the surface of ceramic membranes, and destroy the formation of concentration polarization layer, which would immediately reduce the thickness of gel layer. As a result, the formation of filter cake layer and membrane fouling would be reduced.
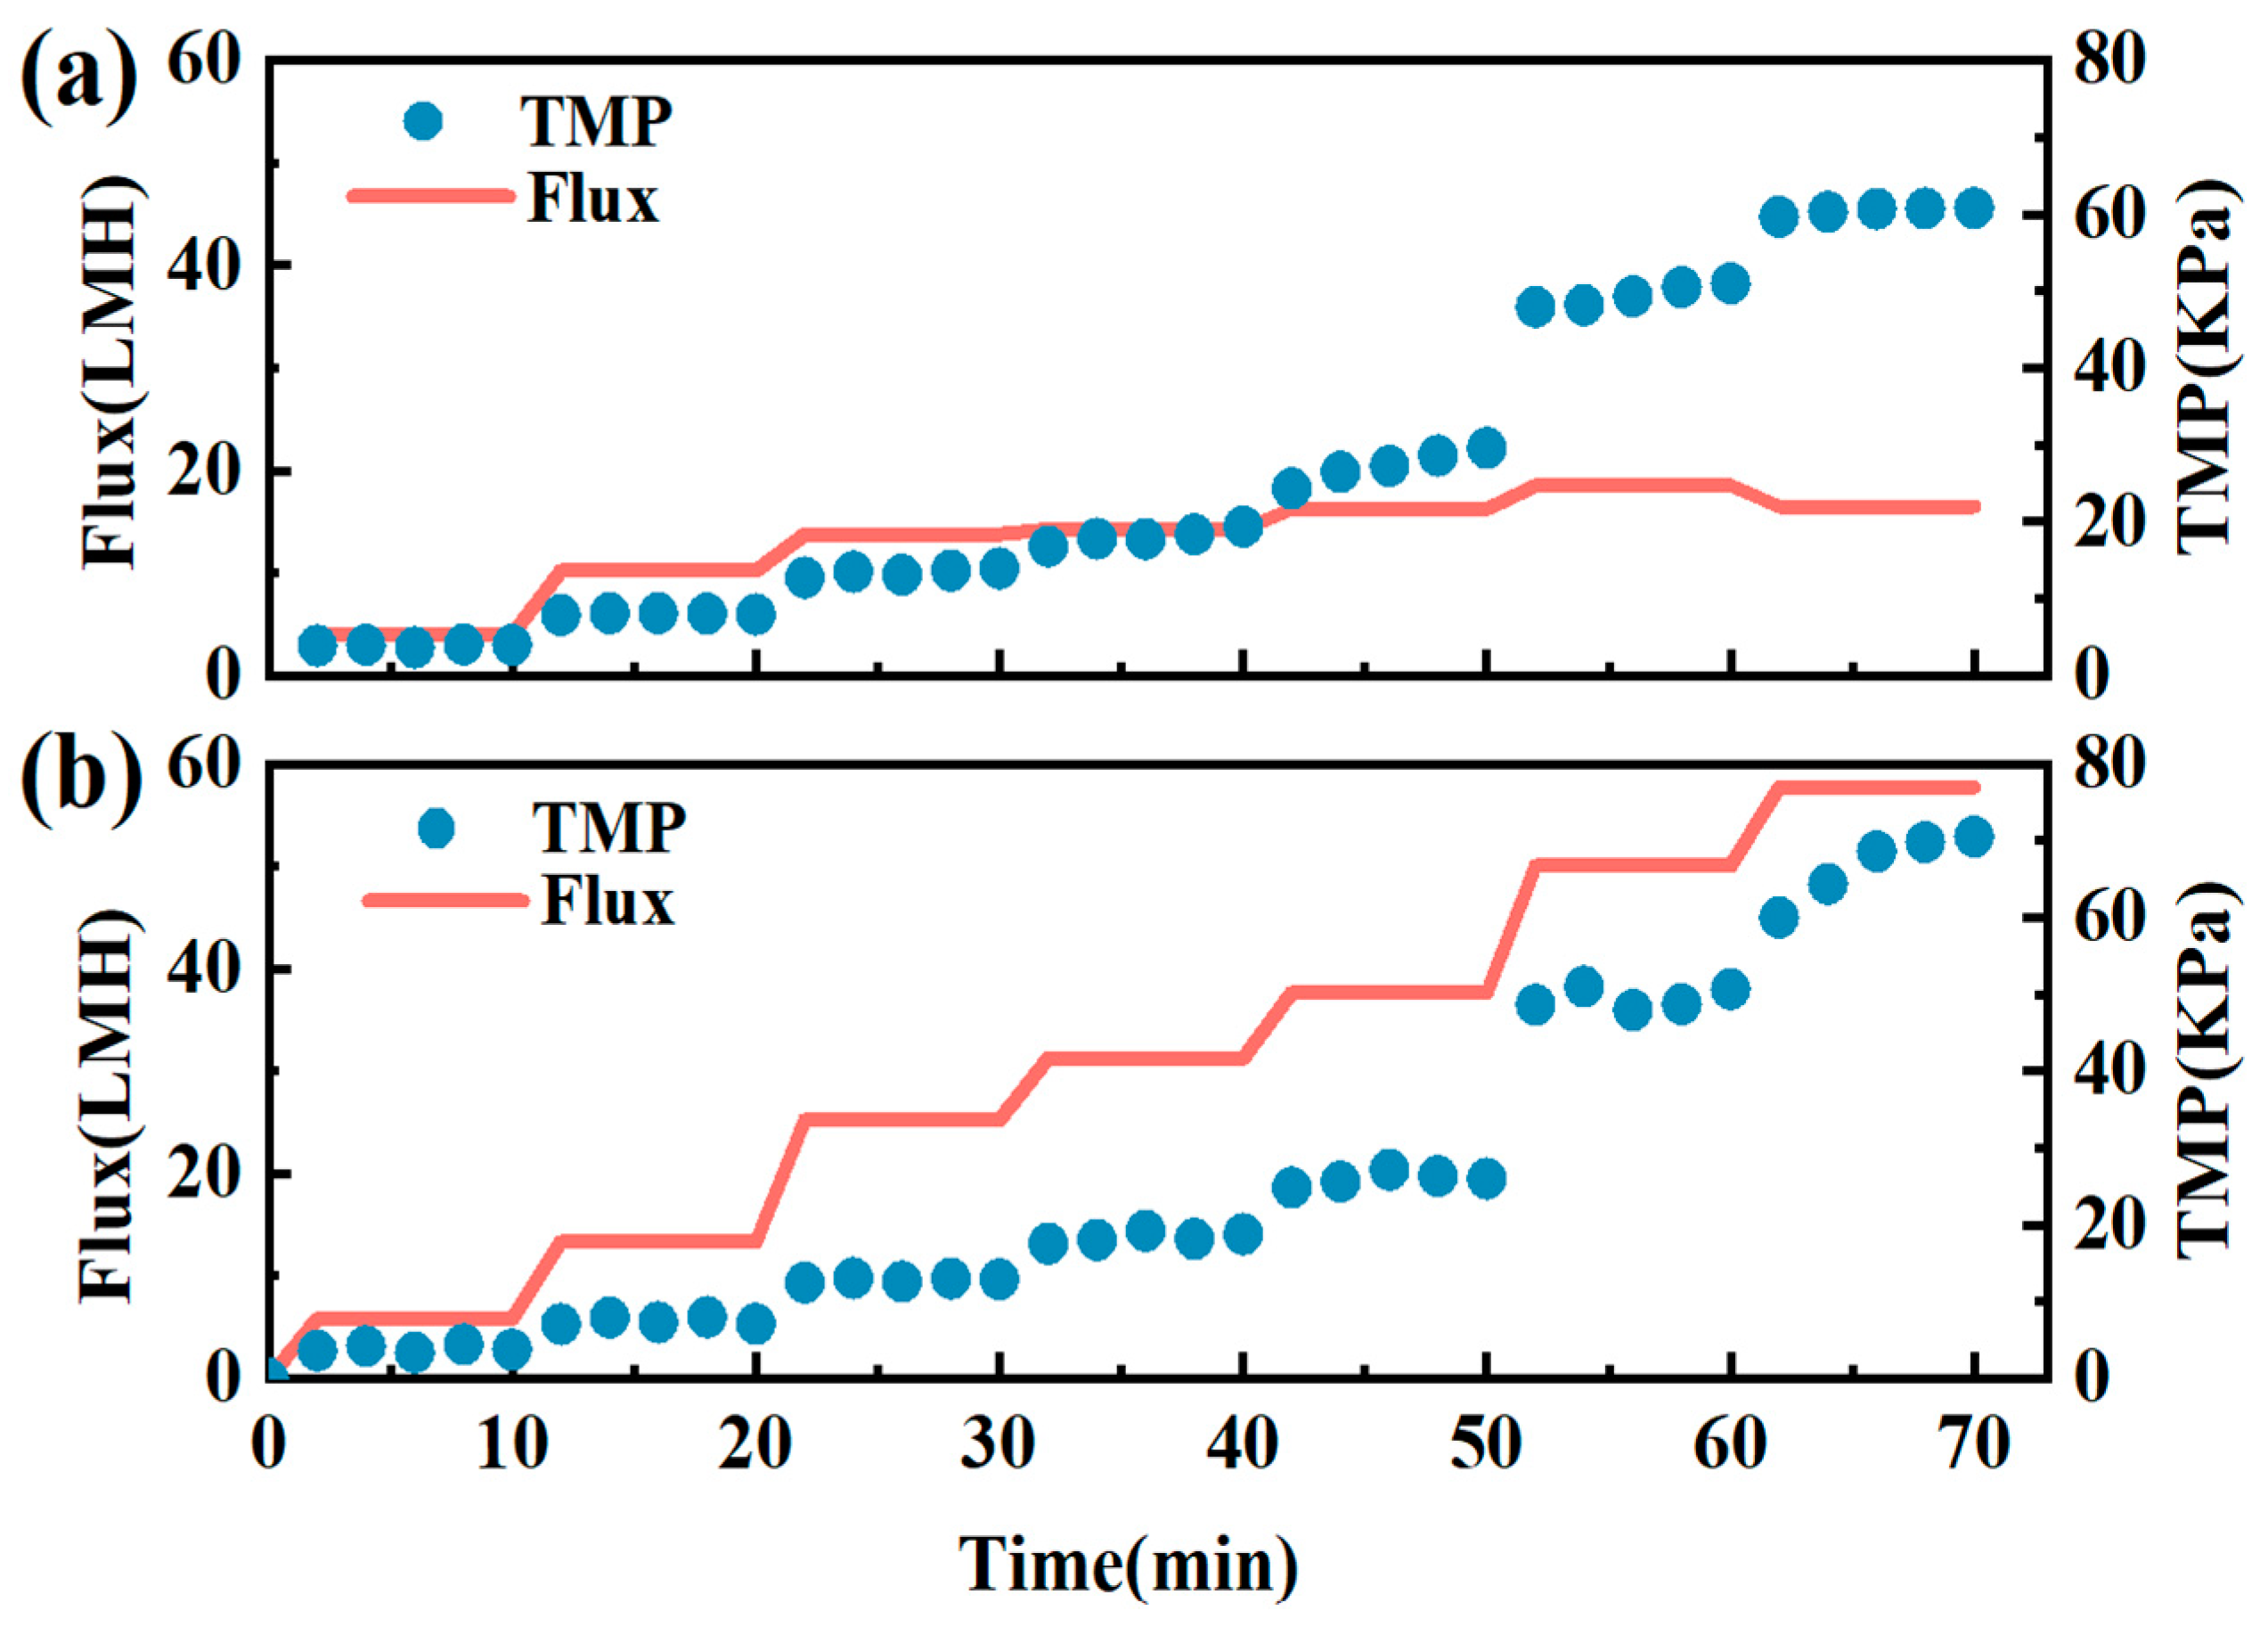
Critical flux measurements were conducted on a constant TMP basis by monitoring changes in permeate flux [26]. The TMP was gradually increased via stepping from 0 to 70 kPa with a step interval of 10 min. The simultaneous variation of TMP and flux with time were illustrated in Figure 2. Without the in situ cleaning device, the critical flux of ceramic membrane was 16.25 LMH, and after the device was turned on, the critical flux increased to 57.69 LMH, which was about 3.5 times improvement compared to no cleaning operation. By increasing the critical flux, the initial membrane fouling could be minimized [27]. Therefore, this fouling control significantly improved the anti-fouling capacity and lifetime of the ceramic membrane filtration.
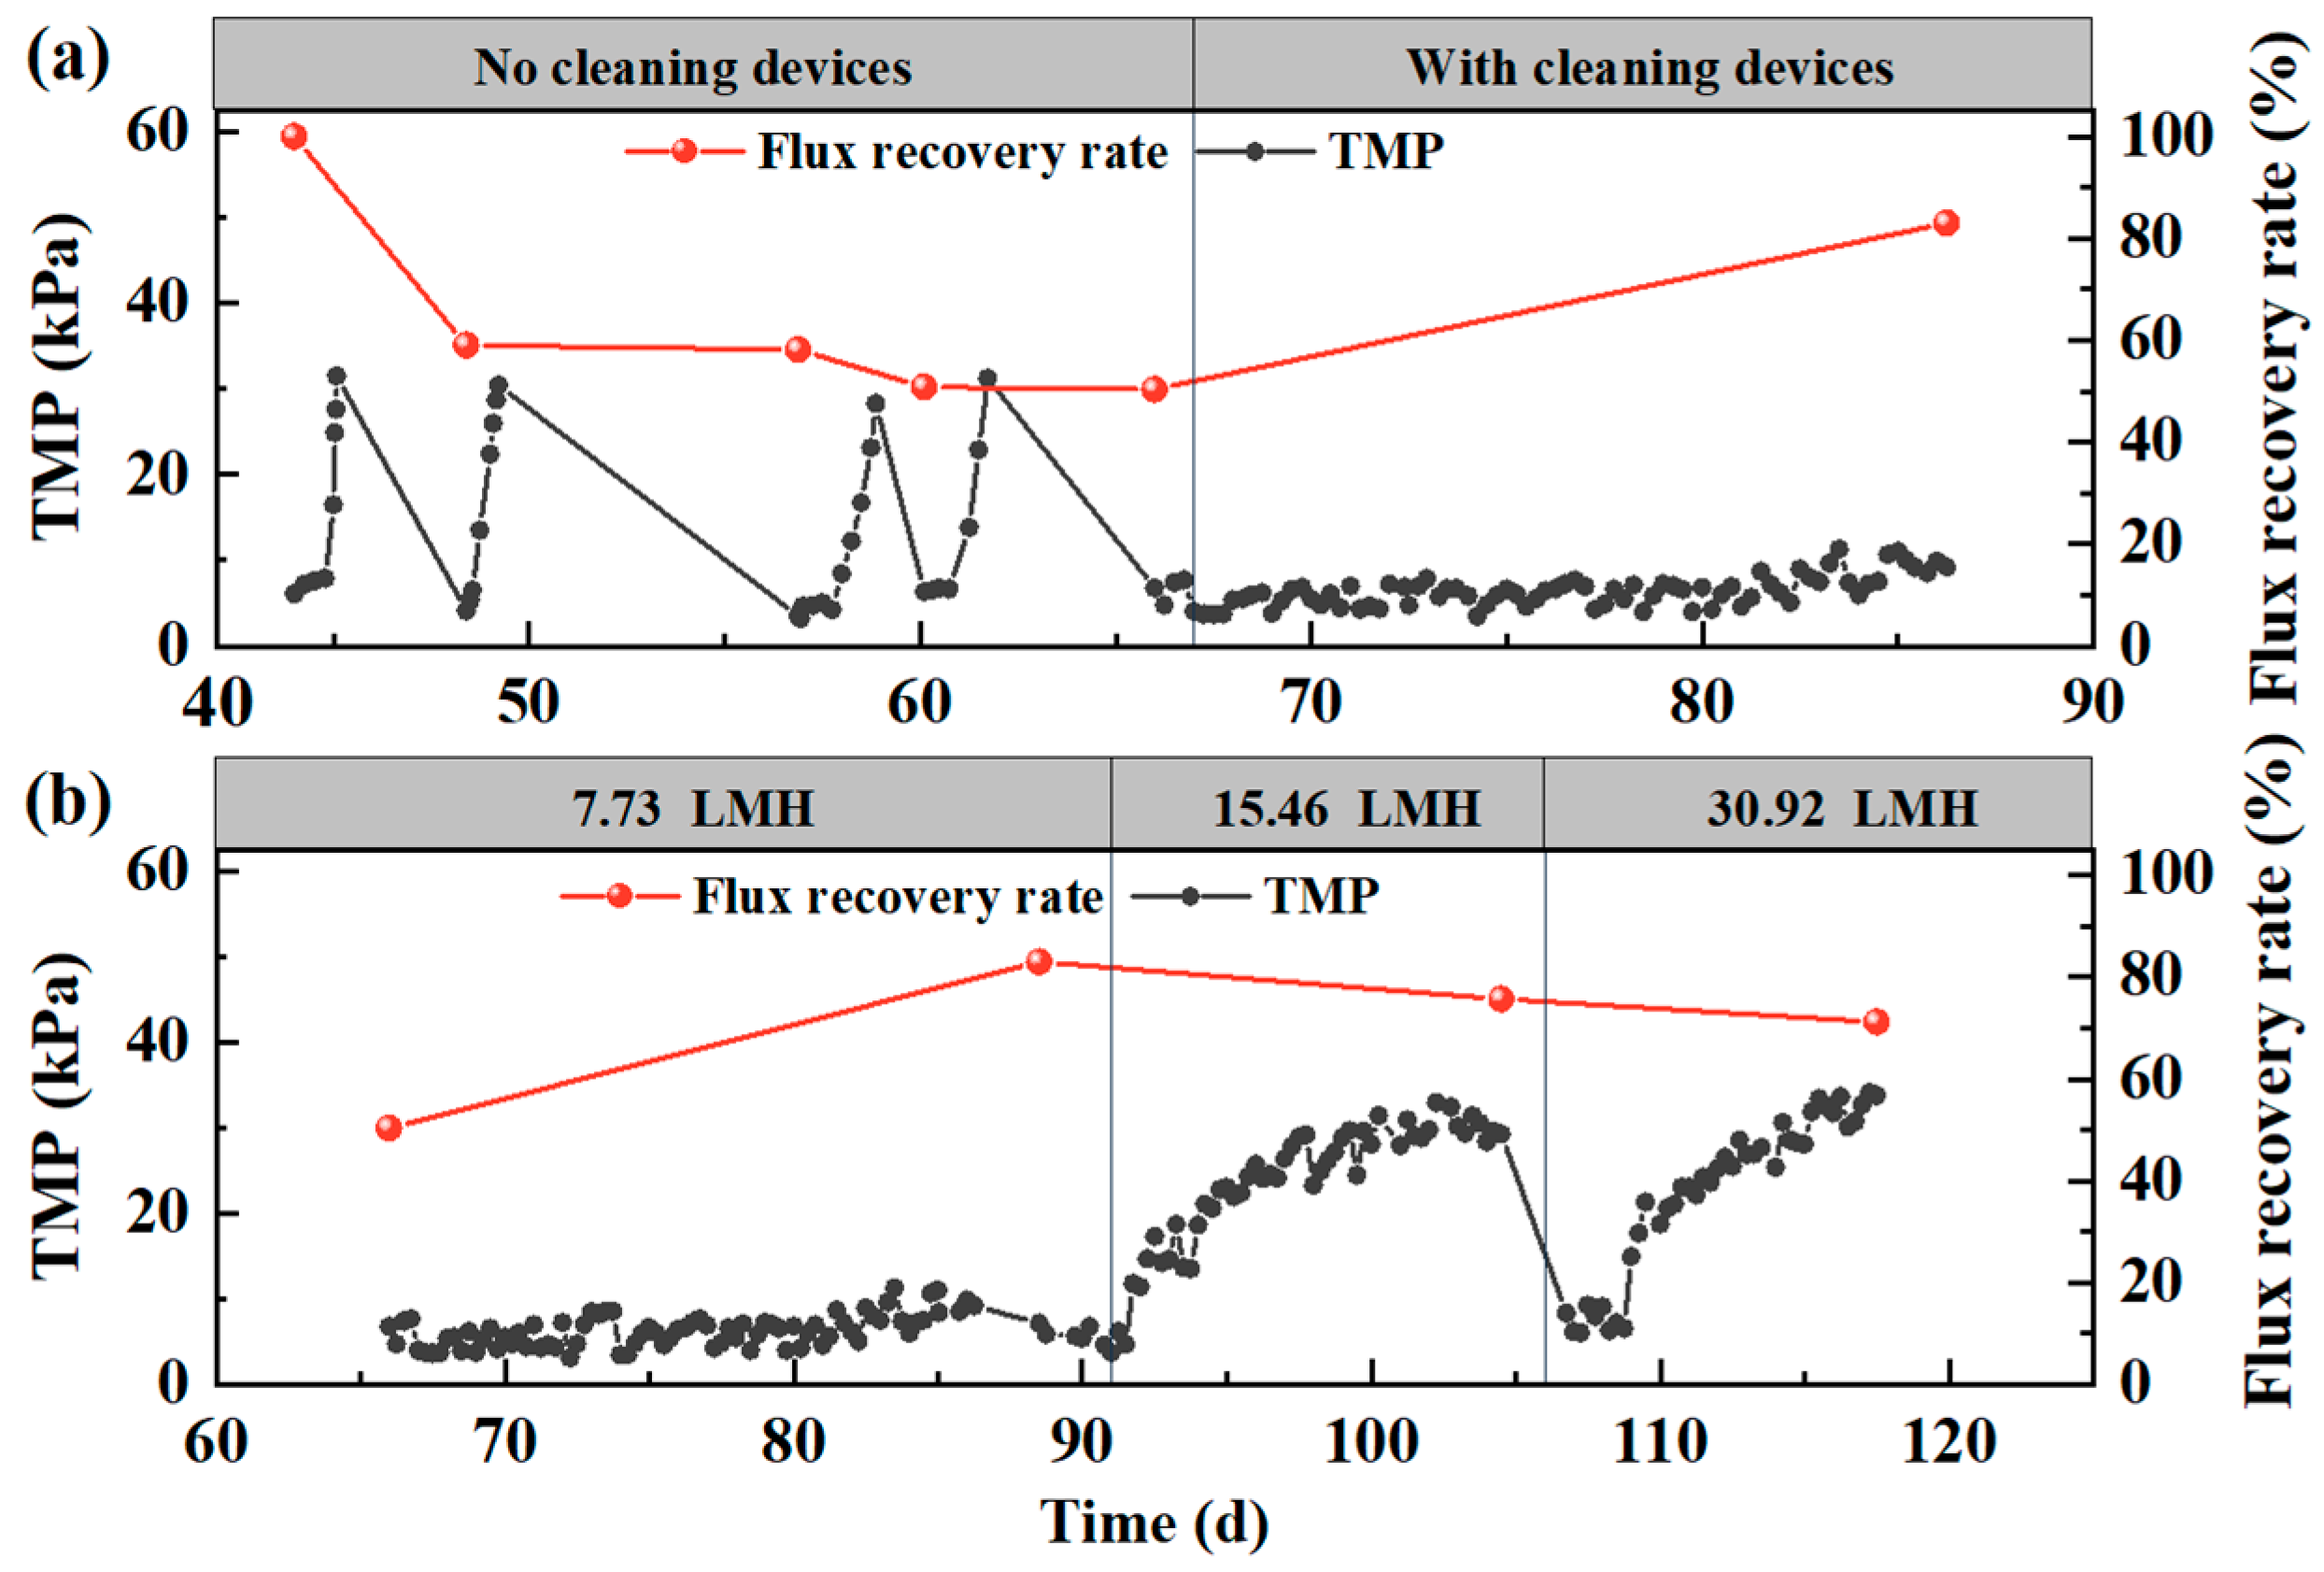
Figure 3a presents the results of the impact of the fouling control on TMP and the flux recovery during long-term operation. The experiment was run at an initial flux of 7.73 LMH. The TMP increased dramatically during cycles without fouling cleaning (day 43–45, 47–49, 56–58, and 60–62) that the pressure changed from 5 to 30 kPa in 2 days. When the TMP is excessively high, meaning that serious membrane contamination has occurred, and then the ceramic membrane is cleaned by chemical methods to recover flux. Although chemical cleaning help decreased TMP for new cycles and the flux was recovered as before, the filtration was not sustainable as operation continued for long term. Day 67, fouling control was started frequently to maintain the filtration. Consequently, the TMP was controlled at a low level while the flux recovery rate increased gradually. After a 20-day operation, the recovery rate increased from 50% to 80%.
Figure 3b shows the influence of programmed cleaning on membrane fouling control under the condition of 7.73 LMH, 15.46 LMH, and 30.92 LMH, respectively. To ensure the initial TMP at each cycle was relatively consistent, the membrane was cleaned with chemical agents before the change of flux. During day 67–90, the reactor was operated under low flux condition of 7.73 LMH so that the TMP increment was successfully inhibited. Day 91–106, the reactor was operated at a doubled flux of 15.46 LMH, resulting in an increase in TMP gradually to 30 kPa within 10 days. After day 107, the flux was tripled at 30.92 LMH, which consequently led to the fastest growth of flux. For the last two cycles between day 91 and day 118, the TMP changed to about 30 kPa in 11 days on average, indicating that the in situ fouling control effectively extend membrane filtration with no cleaning operation.
At present, the commonly used control methods mainly include aeration flushing and backwashing frequently [28,29]. Aeration would reduce membrane fouling by enhancing gas–liquid disturbance and scouring loose cake layer deposited on membrane surface [30]. Studies have shown that the membrane fouling rate decreased with the increase of aeration rate. However, when the system was over aerated, the high speed shear force will destroy the microbial floc and aggravate the membrane fouling [31,32]. Therefore, alternative fouling control strategies are necessary for compensating the blowing air, especially for the application with no requirement of aeration. Moreover, the energy consumption of aeration and oversaturated dissolved oxygen sometimes would be considered as negative aspects for biological wastewater treatment.
Hydraulic backwash is also one of the commonly used membrane fouling control methods [33]. In the process of use, chemical agents are usually added to enhance the cleaning effect, which is easy to generate toxic by-products, causing damage to the microorganisms in the reactor [34]. The automatic cleaning device used in this experiment can be cleaned online, without adding chemical agents, which is safe and non-toxic.
The filtration resistance analysis also revealed the advantage of fouling control used in this study. As shown in Table 2, Rt decreased from to , about 42% lower with the help of in situ cleaning. Rm had no change along with the whole filtration process, which was . But due to the decrease in Rt, the proportion of it increased from 12.50% to 21.44%. Rc decreased from to as the cleaning was active, and the proportion increased from 30.36% to 44.86%. When the cleaning was not operated, the Rg was , accounting for the largest percentage of 35.67%. With cleaning, dropped significantly to , about 76.50% lower than no cleaning. diminished from to , and the proportion decreased from 21.47% to 19.30%. Generally, in situ cleaning effectively reduced membrane resistance, and extended the service time.
The images from the SEM analysis of the membrane fouling are shown in Figure S2 (See Supplementary Materials). The ceramic membrane surface was smoother when the new membrane and the cleaning equipment were active, while the surface was rougher and had cracks of different sizes when there was no cleaning operation. These tracks were formed by microorganisms adhering to the membrane surface and drying for a long time. When there was no cleaning, a large number of microorganisms adhered to the surface of the ceramic membrane, aggravating membrane fouling. And when the cleaning brushes were applied, no obvious cracks were found. The results were consistent with the images obtained by FTIR spectroscopy (Figure S3) (See Supplementary Materials).
3.2. Partial Nitrification Start-Up and Stabilization
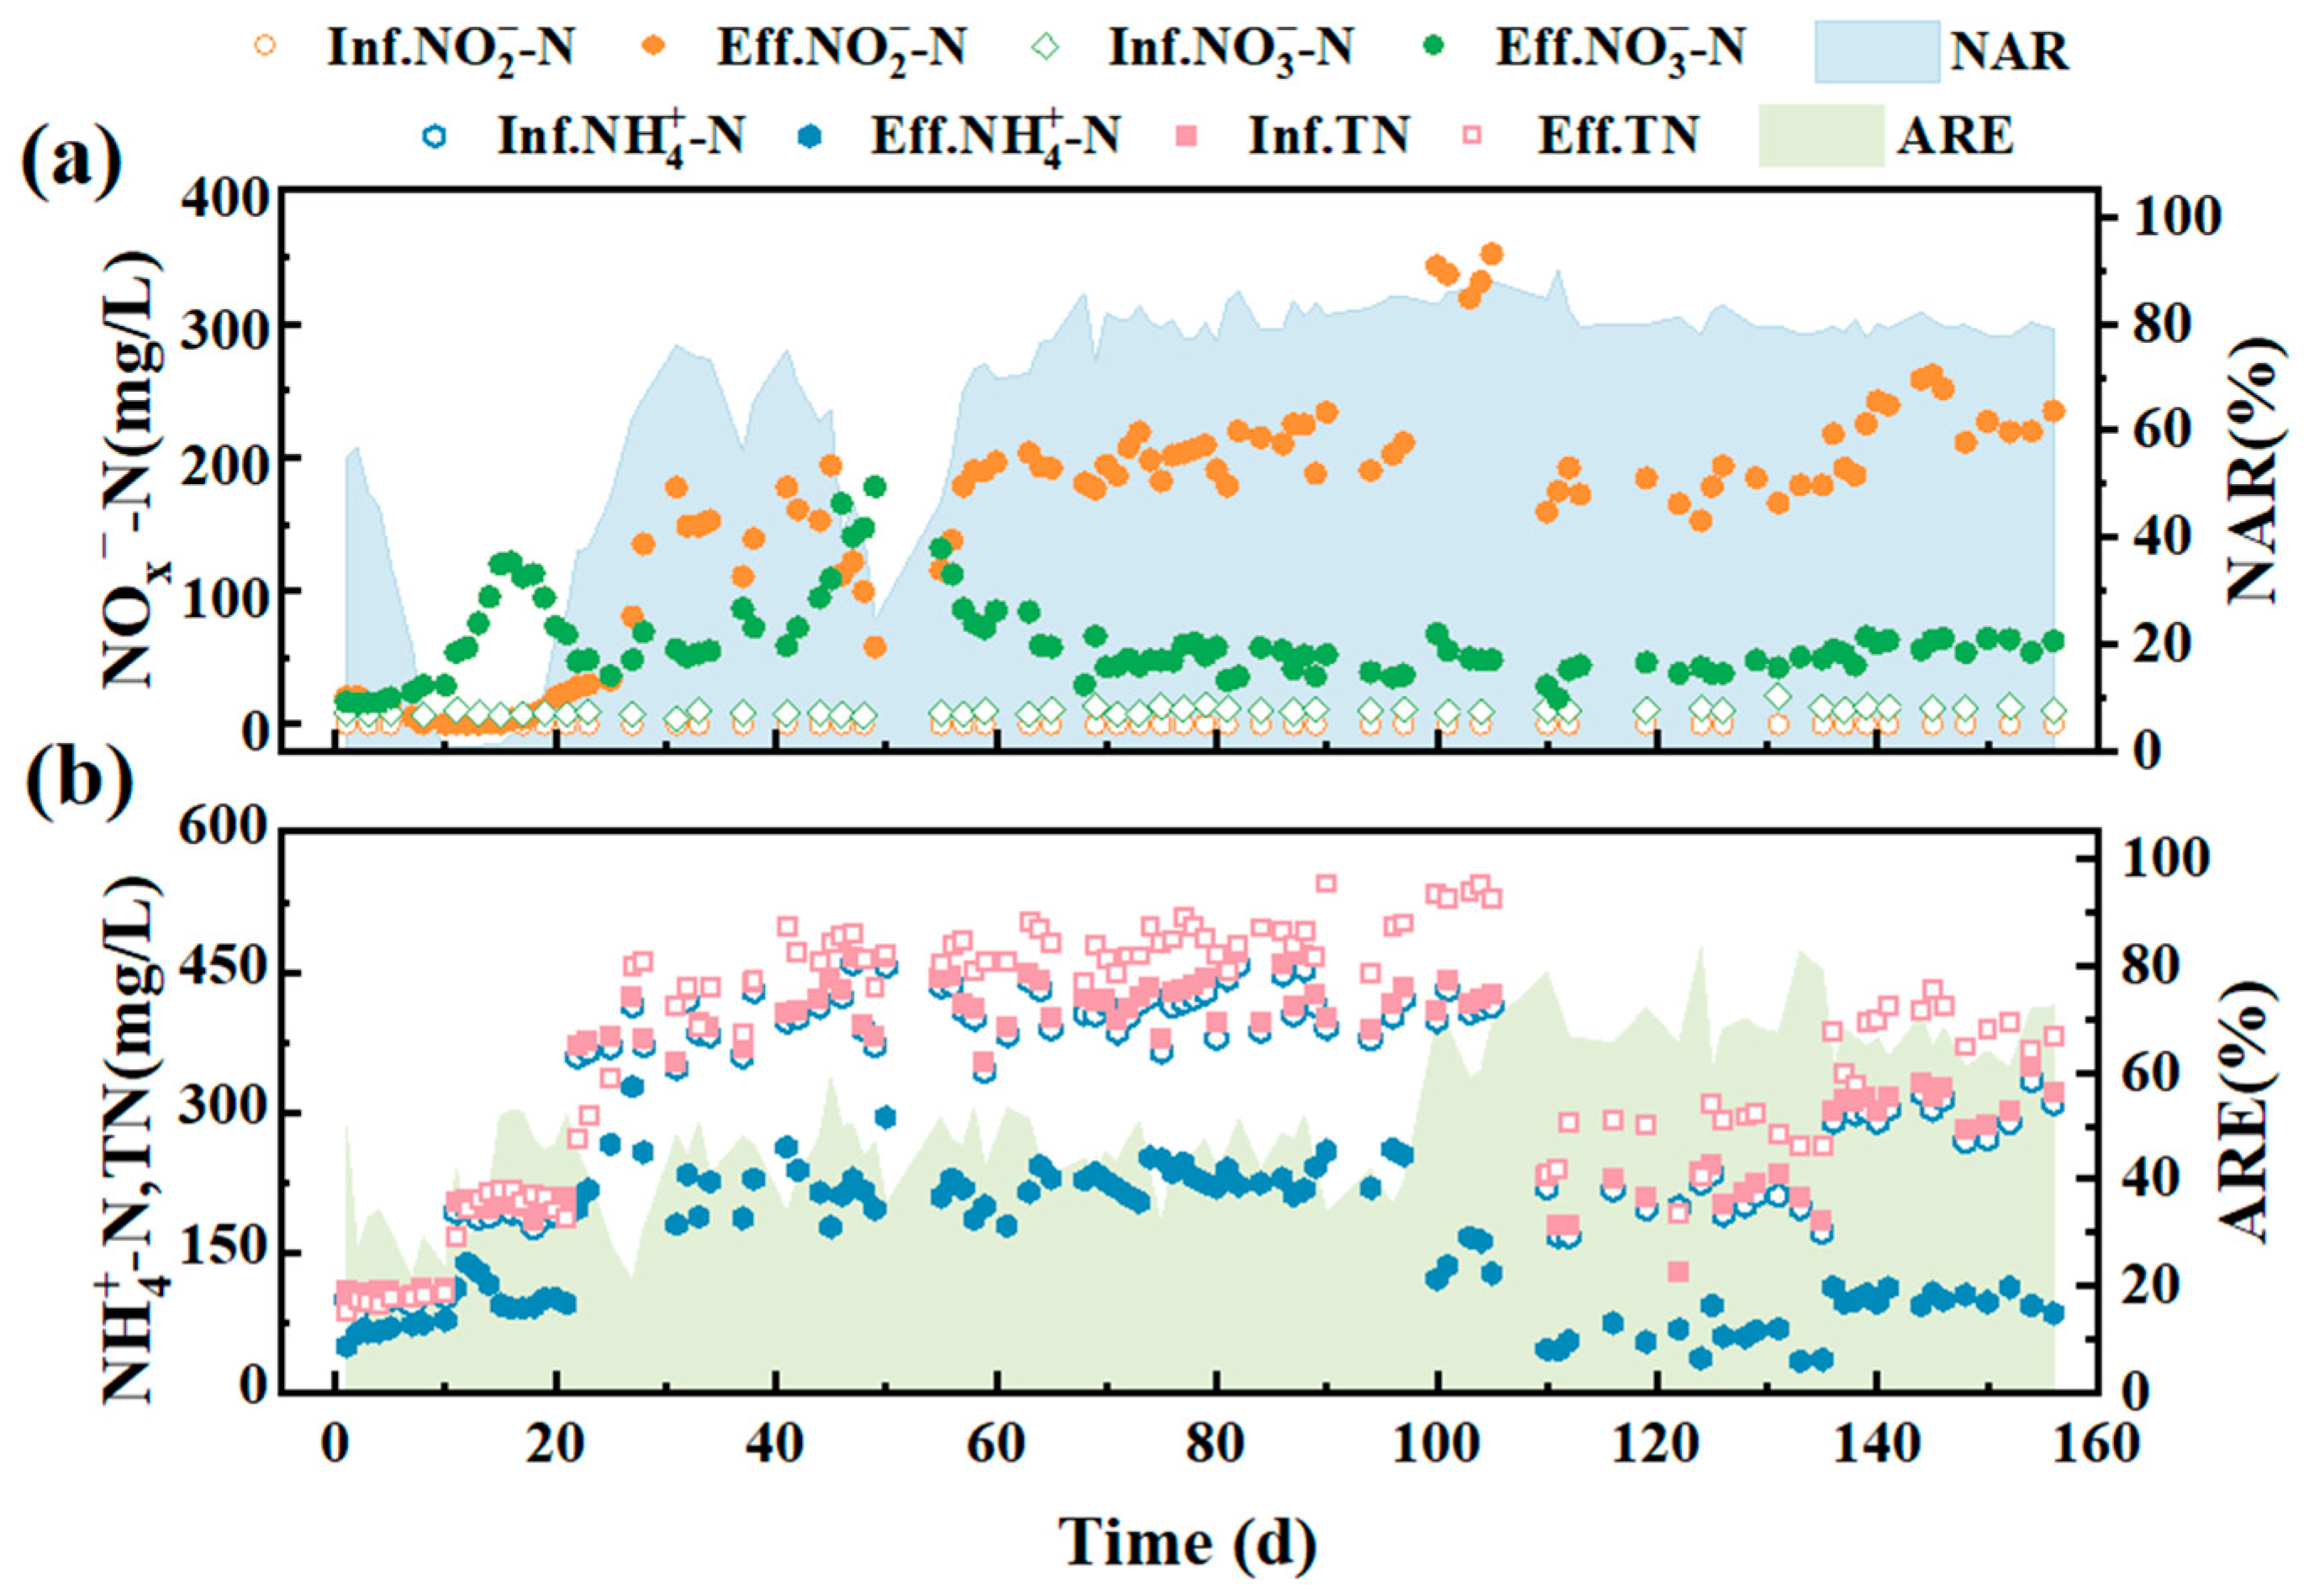
To start up partial nitrification (PN) in MBR system, inoculated sludge with the concentration of 2000 mg/L MLSS was introduced, and the DO was controlled at about 0.1 mg/L (Figures S4 and S5) (See Supplementary Materials). As shown in Figure 4, for the first 10-day operation, feed water at a low nitrogen loading rate (NLR) of 0.1 kg N/m3·d was applied. As the microorganisms in the feeding sludge were less adapted to the new operating conditions, the performance of the reactor was not stable. The removal efficiency of ammonia nitrogen in this period is relatively low, only about 20–30% conversion was observed, and the ammonia removal rate maintained at 0.02–0.06 kgN/m3·d (Figure S6) (See Supplementary Materials). In this period, there was nearly no nitrite accumulation, but a small amount of nitrate production (10–20 mg/L) was detected.
In order to achieve better nitrite accumulation, influent NLR was adjusted to 0.2 kg N/m3·d after day 10. With the increase of nitrogen loading, the removal efficiency of ammonia nitrogen increased to 52.87%, while the nitrite concentration gradually accumulated to 20 mg/L, corresponding to an accumulation percentage of 20%. At this moment, the effluent nitrate concentration increased significantly in contrast, indicating that full nitrification was dominated in the system. There was no obvious inhibition of NOB, and the activity of AOB increased. As the influent NLR stepped to 0.4 kg N/m3·d, more oxygen was required for ammonia conversion so that the aeration rate was adjusted to maintain a constant DO level. On day 25, the ammonia nitrogen removal efficiency (ARE) reached about 50%. Meanwhile, nitrite accumulation rate (NAR) increased to 75.97% and remained relatively stable. Moreover, the concentration of nitrate from the effluent reduced rapidly. These phenomena illustrated that the activity of NOB was effectively suppressed while the dominant reaction in the system gradually transitioned from full nitrification to partial nitrification process. As AOB adapted for about 50 days under stable operation condition, the nitrite concentration of effluent increased to about 200 mg/L. However, on day 50, the system was over aerated due to the damage of air flow meter, which caused a dramatic drop of NAR and an increased nitrate production immediately. On the other hand, the system presented robust performance that the nitrite accumulated right away after the technical issue was fixed. Within 2 days, the performance of the reactor returned to the previous level. The feedback of concentration changes of nitrite and nitrate after over aeration incidence revealed the dynamic balance between AOB and NOB reported in many other studies, which also indicated that oxygen supply was critical to PN process in MBR system [35].
After day 106, to cooperate with the ceramic membrane experiment, HRT was reduced from 24 h to 12 h, ammonia concentration of influent was decreased from 400 mg/L to 200 mg/L, and NLR remained unchanged. At this time, the reactor has been in a stable stage and NAR remained at over 80% and up to 90.09%. Day 135, the NLR was leveled up to 0.6 kg N/m3·d. As expected, the NAR remained at about 80%, and MLSS increased to 7400 mg/L, indicating that the reactor was still in a relatively stable state under this condition and the ceramic membrane system was beneficial to the retention and increase of biomass.
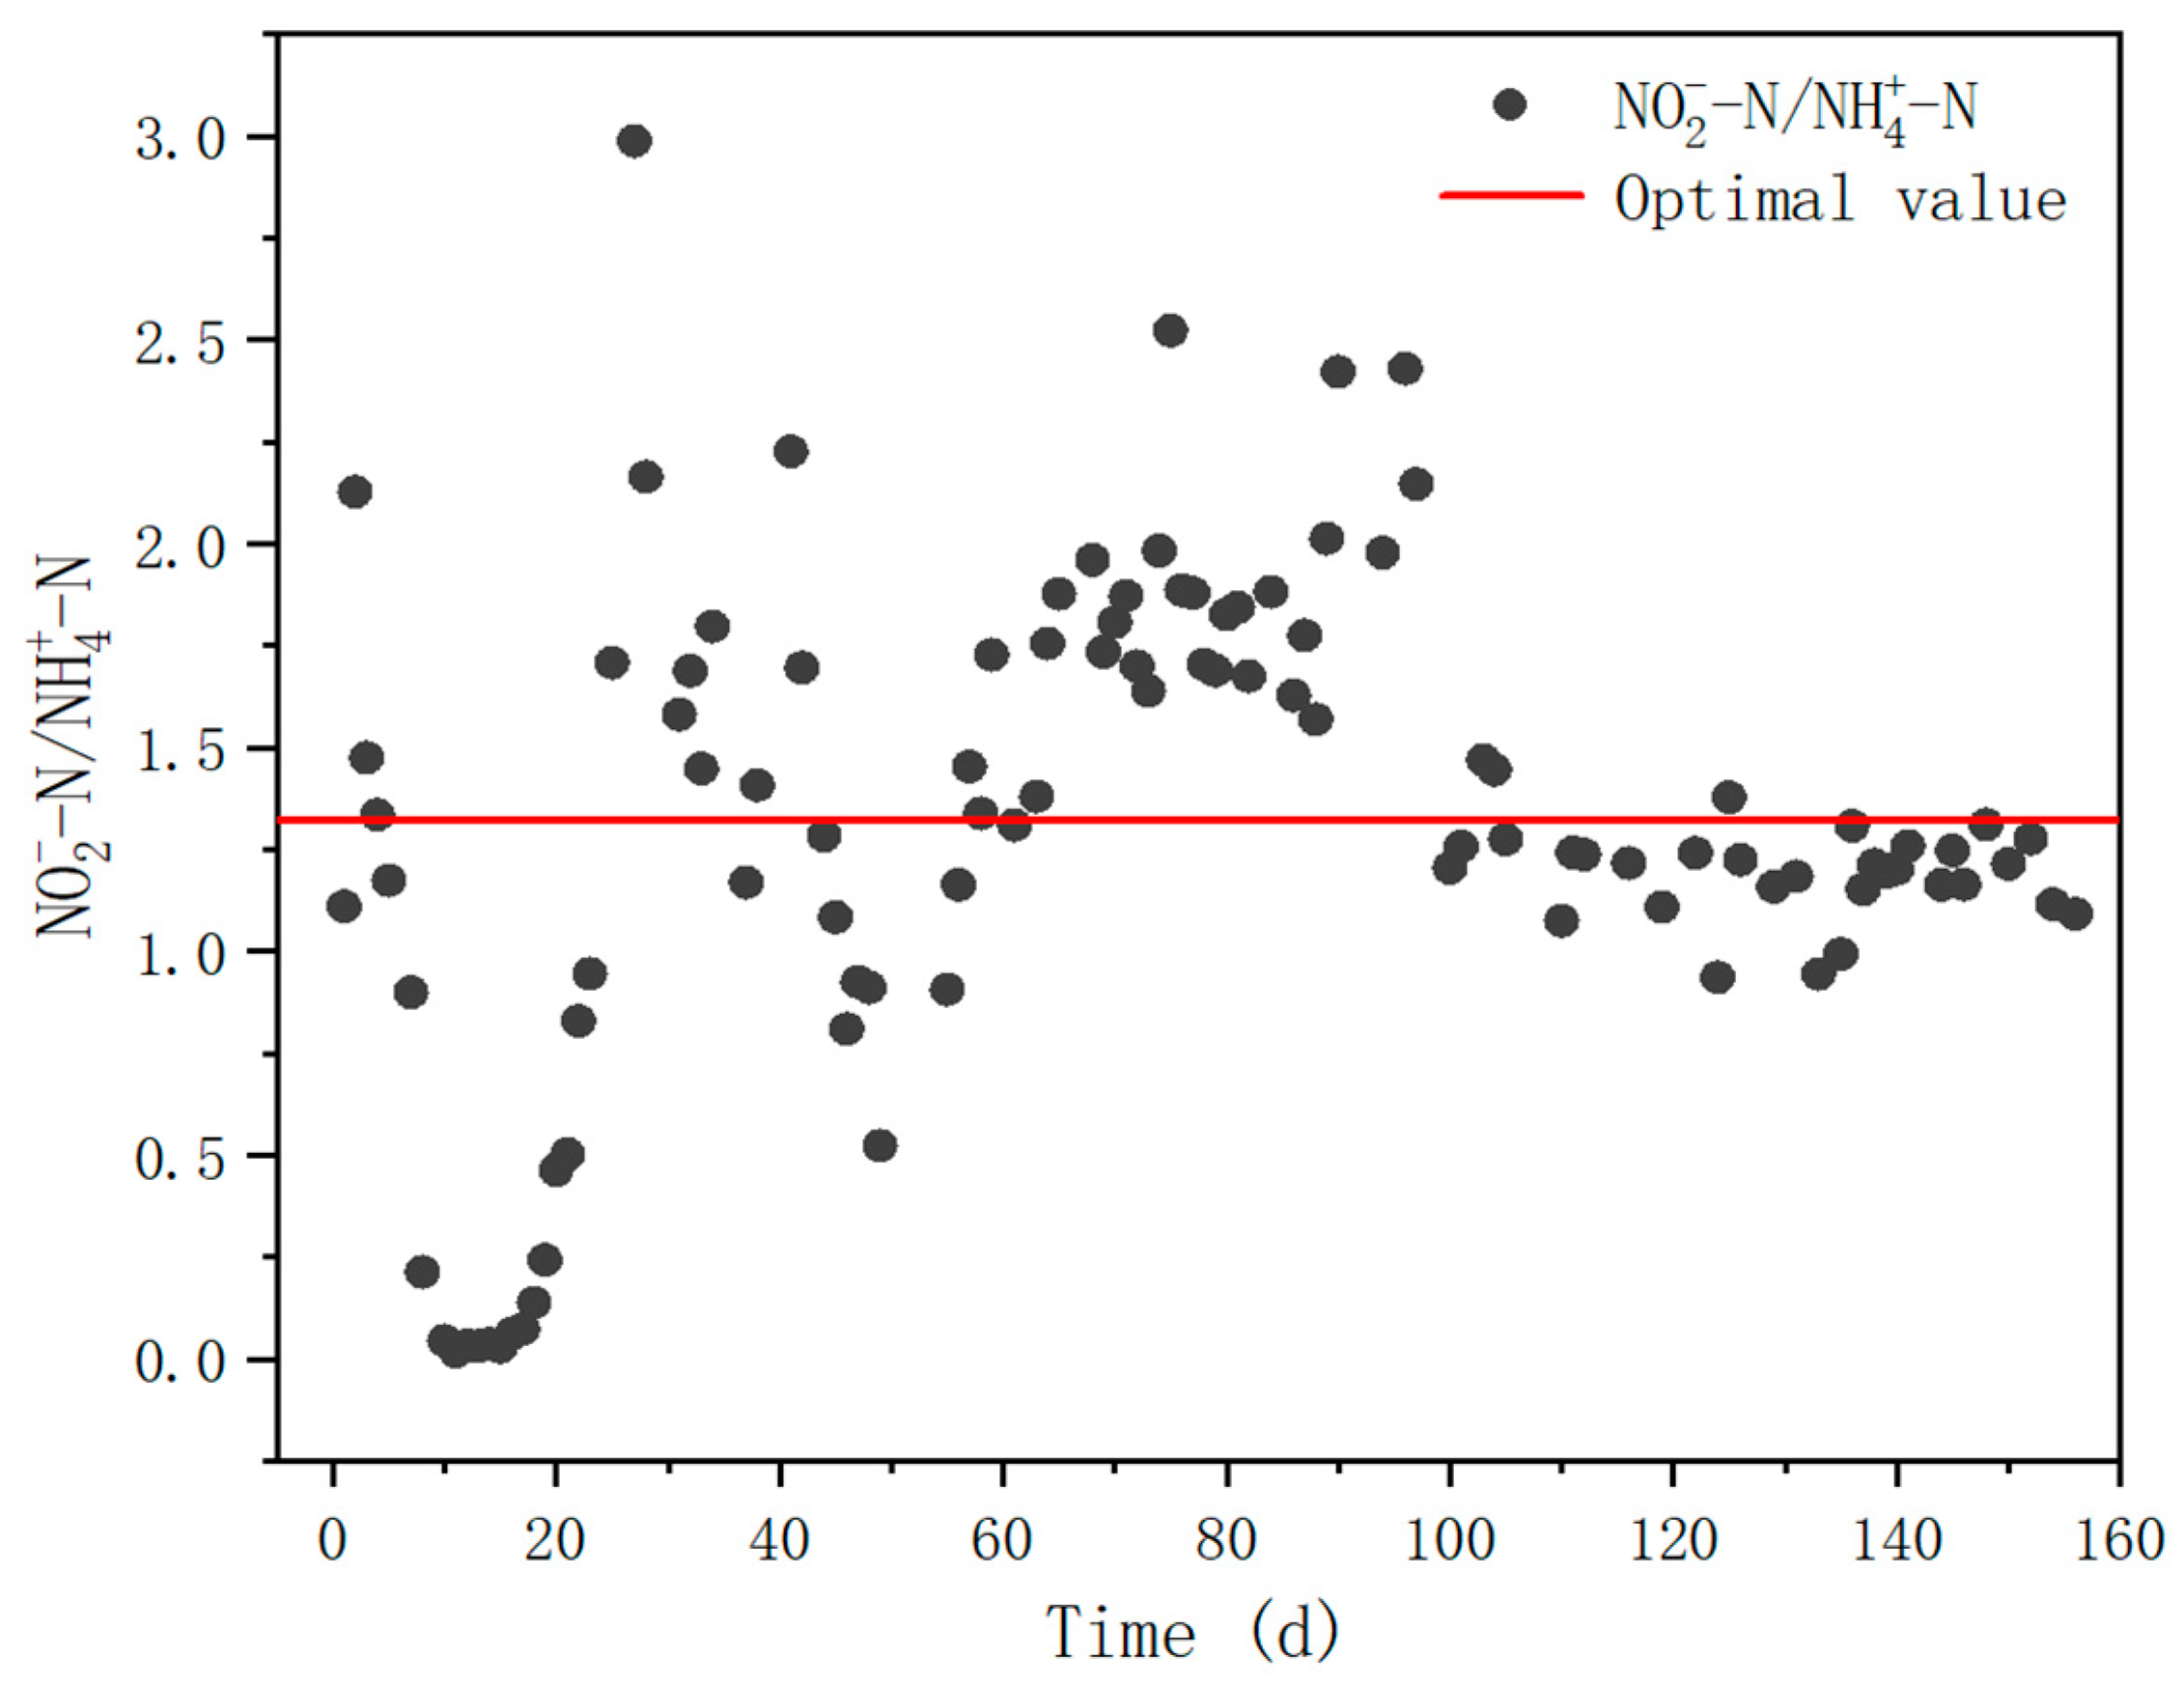
Besides achieving a high NAR, the reactor also allowed a stable effluent NO2−-N/NH4+-N ratio to be obtained by optimizing the influent conditions (Figure 5). In the first two stages (day 1–10 and day 11–22), the influent NLR was low and the effluent NO2−-N/NH4+-N ratio was significantly lower than the theoretical value of 1.32 for ideal anammox process [36]. On days 23–106, the influent nitrogen load was increased in the early part of the third stage and NO2−-N/NH4+-N increased dramatically, but the ratio was slightly higher at this time, which was not conducive to the anammox process. Closing to the end of the third stage, the average of this ratio decreased to around 1.19 and remained at a steady state. On day 137, the reactor processed into the fourth stage and the influent load was increased to 0.6 kg N/m3/d, at which point the ratio of NO2−-N/NH4+-N decreased and a dynamic equilibrium was achieved with an average value of 1.30, which was close to the theoretical value of 1.32 required for the Anammox process.
When the effluent NO2−-N/NH4+-N ratio was too high, the higher nitrite content inhibits the activity of anammox bacteria, while when the ratio was low, the substrate was not sufficient and is not conducive to the proliferation of anammox bacteria [37]. Li et al. [37] constructed an SBR reactor to treat synthetic wastewater, and the effluent NO2−-N/NH4+-N was maintained at about 1.37. Chen et al. [38] used 43 days to start up a UASB reactor to treat simulated wastewater with a discharge effluent NO2−-N/NH4+-N of approximately 1:1. The ratio in this study was much closer to the theoretical value, indicating that the effluent could provide stable and effective substrates for autotrophic biological nitrogen removal process.
The nitrite produced from PN process is utilized as a crucial substrate for anammox bacteria to achieve complete autotrophic nitrogen removal. Moreover, a stable and efficient PN process also provides more possibilities for the development of short-cut denitrification, electrochemical denitrification, and other processes. More significantly, with the help of membrane separation, manipulation of AOB and NOB seemed possible by regular control parameters such as DO. First, delicate control of DO was quite efficient to inhibit the growth of NOB. Researchers have shown that the oxygen saturation constant of AOB is 0.30 mg/L and NOB is 1.30 mg/L, indicating that AOB had a strong affinity for oxygen [39]. To precisely control the oxygen supply, accurate DO monitoring and adjustment were necessary. Some other studies also applied intermittent air supply to prevent over aeration. Liu et al. [40] used intermittent aeration in an SBR reactor to start short-cut nitrification through 48 alternate aeration cycles by adjusting the ratio of aerobic/anoxic time. However, sludge loss and unstable system operation are not conductive to the continuation of the subsequent autotrophic biological nitrogen removal process [41]. In our study, DO was controlled at less than 0.25 mg/L that NOB was strongly suppressed by low DO concentration. As a result, AOB was activated from start-up to stable operation period. On the other hand, membrane retention separates HRT and SRT, which also stopped AOB loss from effluent discharging. Therefore, it inhibited the activity of NOB by AOB dominants. Moreover, accumulated nitrite did not affect the activity of AOB, proving that oxygen would be the key parameter in this PN system for selection between AOB and NOB.
In addition, studies have shown that FA and FNA are also important factors influencing AOB and NOB competition [42,43]. It was reported that the concentration of FA inhibition on NOB was 0.1–10 mg/L, while the concentration of inhibition of AOB ranged from 10–150 mg/L [44]. FNA completely inhibited the growth of NOB and AOB at concentrations of 0.02 mg/L and 0.4 mg/L, respectively [45,46]. In other systems such as SBR and CSTR for nitrogen removal, selective NOB inhibition and short-cut nitrification have been achieved by regulating DO, FA, FNA, and other operation conditions [47,48]. For example, Tian et al. [49] constructed an SBR reactor to treat high ammonia leachate and investigated the effects of different concentrations of FA and FNA on nitrogen removal. The results showed that the FA and FNA concentrations that effectively retained AOB and inhibited NOB were 10–130 mg/L and 0.01–0.03 mg/L, respectively, and the effluent NO2−-N/NH4+-N was maintained between 1.00 and 1.30 [49].
Therefore, the selective inhibition of FA and FNA could be accounting for the inhibition of NOB in this system without affecting the activity of AOB. The average concentration of FA in this study was 5.77 mg/L, which was sufficient to lower the activity of NOB but barely affected AOB. Studies have shown that when the concentration of FA reached 6 mg/L, the activity of NOB was completely inhibited [50]. For FNA, it was found that the maximum concentration was 1.93 × 10⁻³ mg/L, which was much smaller than the inhibition threshold value mentioned above. Therefore, FA was mainly considered the major factor for selective inhibition between AOB and NOB.
Several key factors were demonstrated effective on NOB inhibition as described in previous section. However, how to maintain the dominant advantage of AOB would be the next-step problem for sustainable PN, and further for practical applications. Membrane separation definitely resolved biomass loss issues for its perfect retention function [17]. Shen et al. [51] constructed an anaerobic MBR using PVDF hollow fiber membrane and carried out a long-term experiment, and partial nitrification process was started at 50 days. Zhang et al. [52] compared the start-up time of CSTR and MBR, and the results showed that under the same operating conditions, MBR equipped with a hollow fiber membrane successfully started PN in 44 days, while CSTR needed 56 days. Wu et al. [53] constructed a hollow fiber membrane bioreactor, inoculated nitrification sludge, and started the short-nitrification process on day 46, with NAR reaching 92%. But fouling and flux decline issues were still problems for all systems using membranes. In this study, an inorganic ceramic flat-sheet membrane was applied with in situ fouling control as presented in Section 3.1, and the PN process was successfully started in 25 days, which is shorter than other MBR systems.
3.3. Microbial Community Analysis
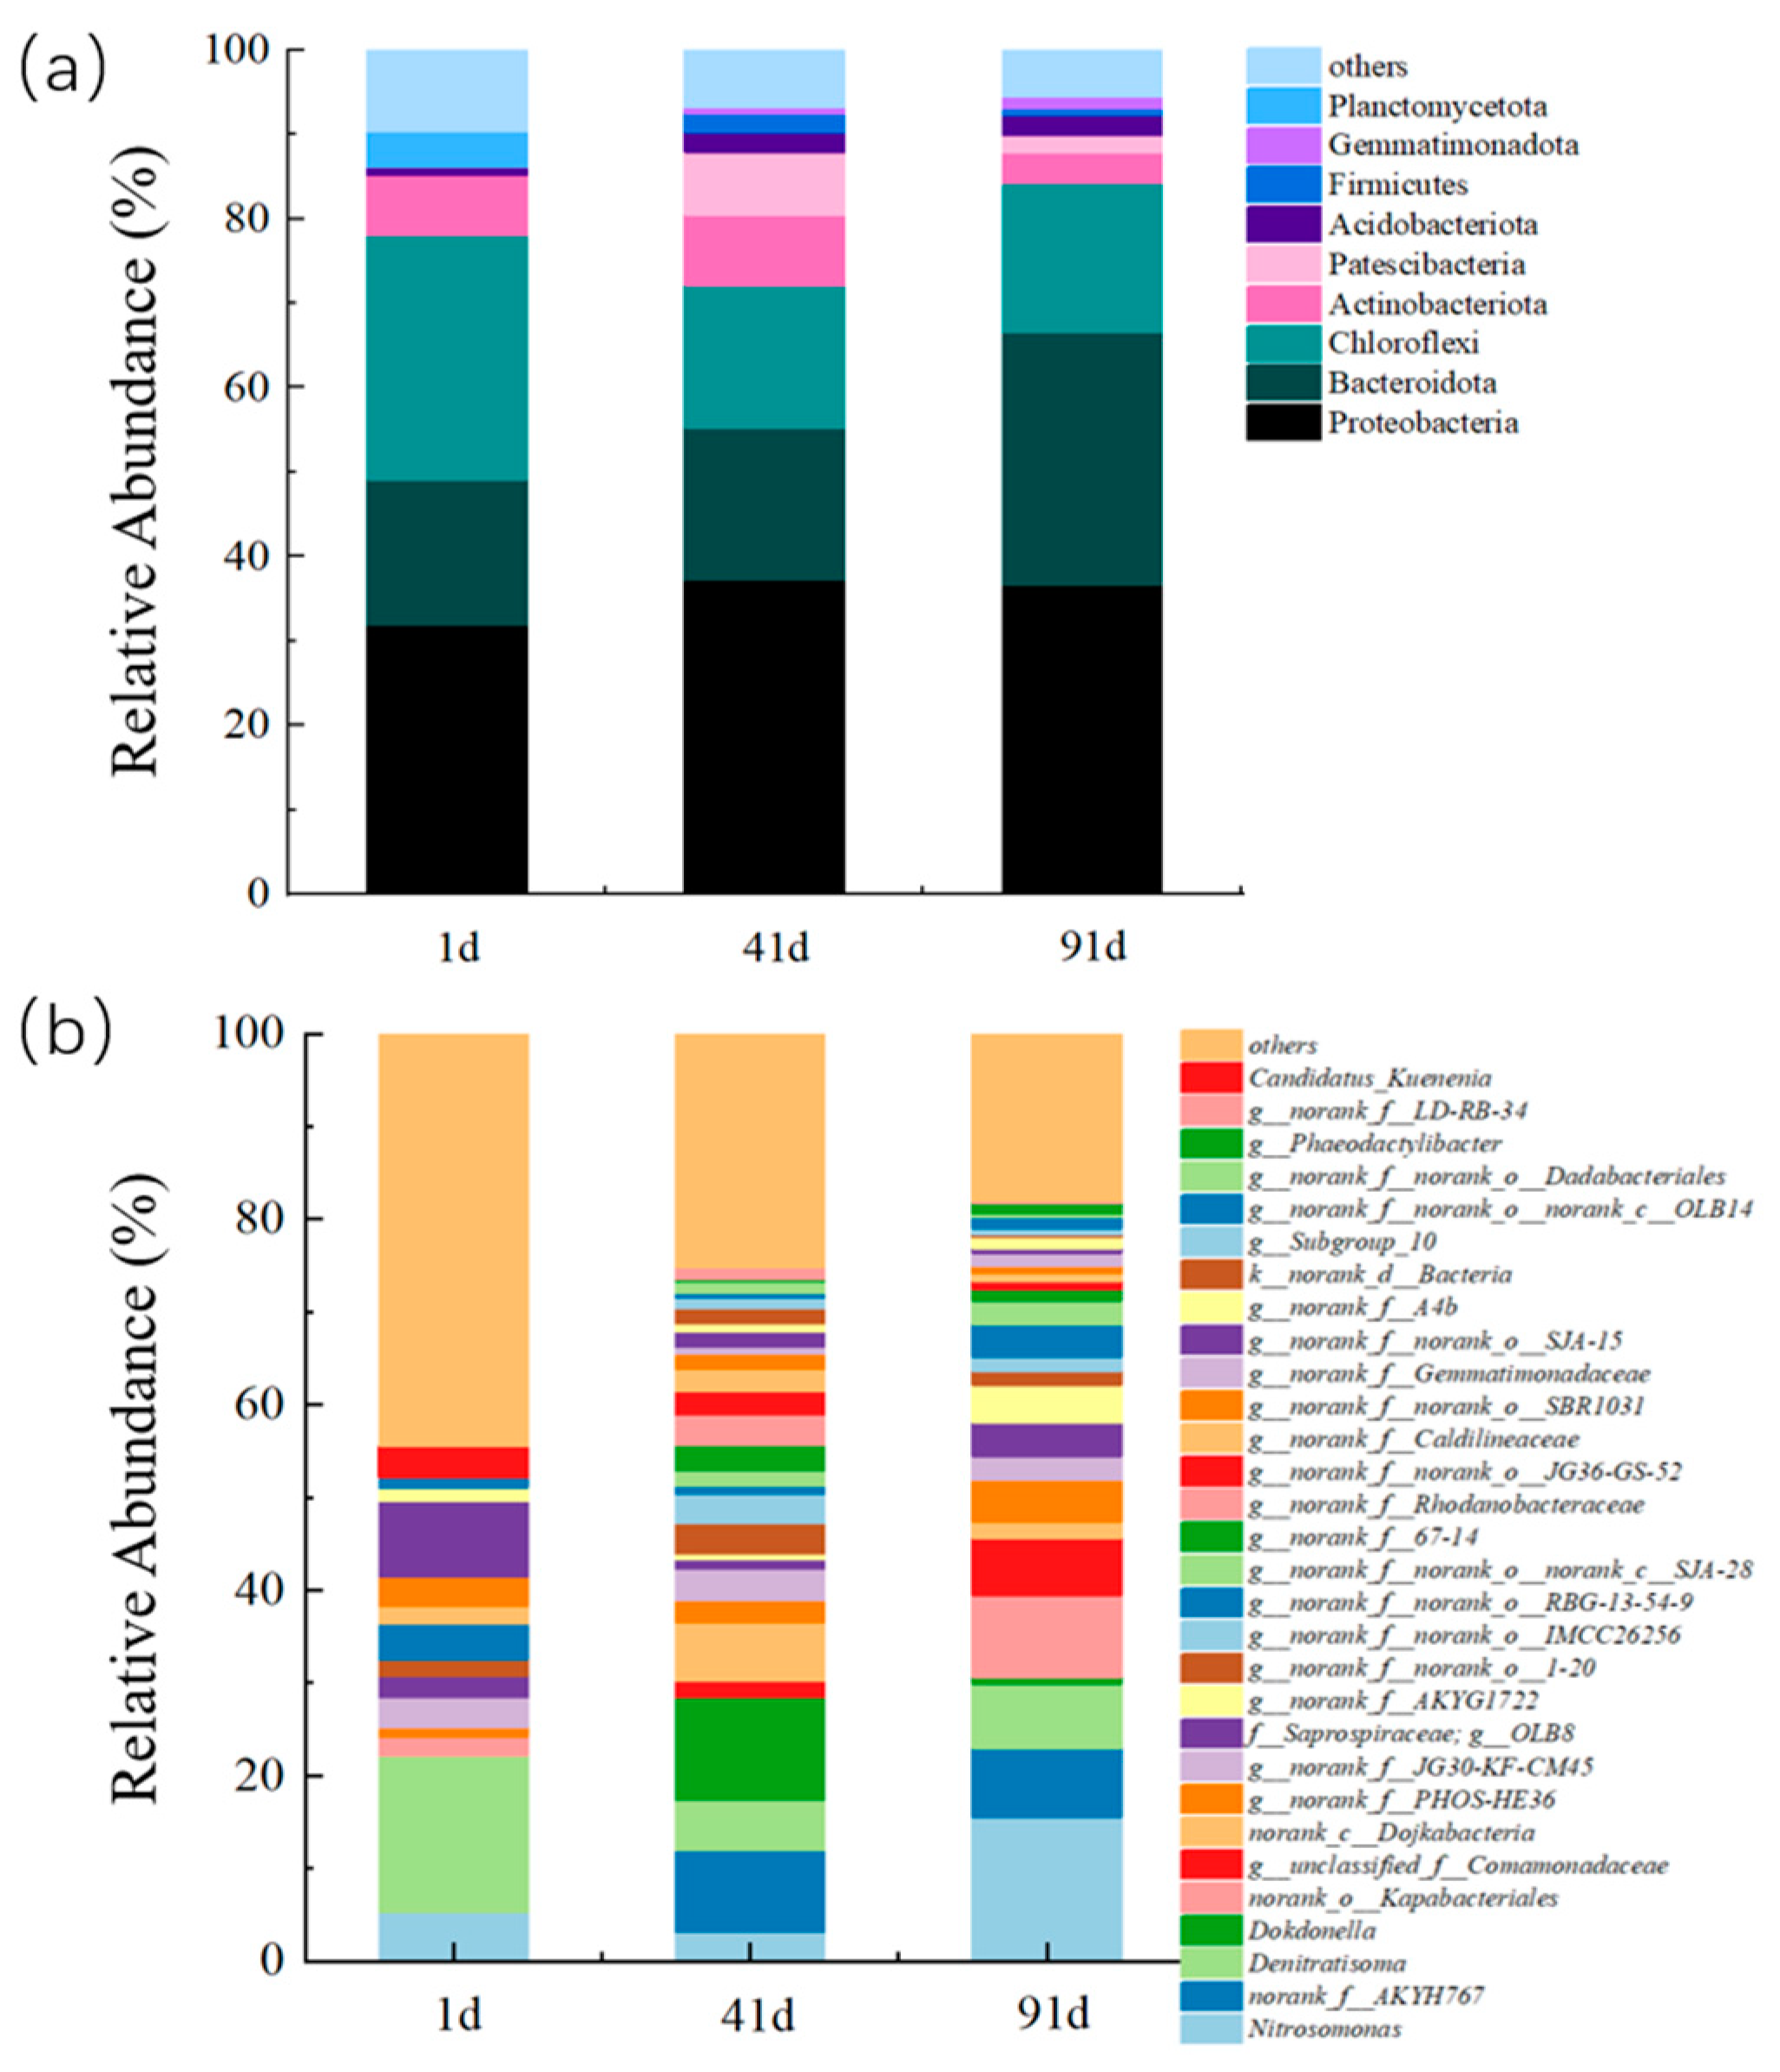
To investigate the microbial community structures in the system at different stages, biomass on day 1, 41, and 91 were sampled for analysis by amplicon sequencing of the 16S rRNA genes (Figure 6).
The coverage of sequencing samples was all greater than 99% to represent the real situation of the microorganisms. Both Ace and Chao showed an upward trend, indicating that the total number of microorganisms in the reactor was increasing and AOB was proliferating steadily during the MBR operation (Table S1) (See Supplementary Materials) [54]. The Shannon and Simpson indices were commonly used to characterize the species diversity of the system [54]. Compared with day 1, the Shannon index increased and the Simpson index slightly decreased on day 91 as AOB became the main functional bacteria and the diversity in the system decreased.
From the phylum level as shown in Figure 6a, it was found that the main bacterial phyla in the MBR system include Proteobacteria, Bacteroidetes, Chloroflexi, Actinobacteriota, and Patescibacteria. During stages operation, the relative abundance of Proteobacteria in the reactor was 31.86%, 37.24%, and 36.66% on days 1, 41, and 91, respectively, showing an increasing trend. Proteobacteria mainly contained a large amount of ammonia-oxidizing phylum and nitrite-oxidizing phylum of microorganisms, and the high abundance of Proteobacteria demonstrated the presence and stable proliferation of nitrifying bacteria in the system. Bacteroidetes were heterotrophic denitrifying bacterium, whose main function was to reduce the nitrate nitrogen present in the wastewater by using complex organic matter, and the relative abundance in the reactor at different stages were 17.33%, 18.03%, and 29.90%, respectively. The higher abundance showed that Bacteroidetes adapted well and dominated in this MBR system. Chloroflexi was mostly facultative anaerobic microorganisms, which were bacteria that do not produce oxygen and cannot fix nitrogen during photosynthesis. Compared with day 1, the richness of Chloroflexi on day 91 was slightly decreased.
The changes in the microbial community before and after the start-up of PN in the system were further investigated based on genus level analysis. The functional microorganisms and dominants from the three samples at genus level are shown in Figure 6b. The results showed that the abundance of Nitrosomonas increased significantly from 5.30% on day 1 to 15.50% on day 91, indicating that AOB continued to proliferate as the main functional bacteria in the system while PN became the dominant process in the MBR reactor. At the same time, it was found that the high DO level in the system did not cause a large amount of NOB proliferation in the short term, AOB was still the dominant bacteria in the PN-MBR system, and the stability of the bacterial population structure qualified the system with ability on impact resistance, which improved the stability of PN.
4. Conclusions
In this study, an in situ ceramic membrane fouling control strategy was developed for the PN-MBR system, which effectively reduced Rg and Ri, lowering the risk of microbial adherence to the membrane surface and slowing down the formation of the filter cake layer. Therefore, the system significantly delayed the process of membrane fouling. Compared to other control strategies, the fiber cleaning device was easier to operate with little damage on membrane. Moreover, chemical enhanced backwash was avoided that no chemicals such as hypochlorite were introduced. Therefore, the operation would be safer for both membrane materials and PN microorganisms.
Due to the application of membrane separation, AOB biomass loss was completely prevented so that the PN process was successfully started up in 25 days and the NAR was maintained above 80%. NOB activity was successfully inhibited, and the operation effect remained stable for a long-term operation. The change of microbial community also confirmed that AOB was dominant in this system.
Supplementary Materials
The following supporting information can be downloaded at: https://www.mdpi.com/article/10.3390/w15030444/s1. Table S1: Microbial richness and diversity in ceramic MBR. Figure S1: Deionization flux of ceramic membrane. Figure S2: SEM images of ceramic membrane surface. (a) New membrane; (b) with cleaning equipment; (c) without cleaning equipment. Figure S3: FTIR images of ceramic membrane surface. Figure S4: Changes in MLSS, MLVSS, and MLSS/MLVSS during operation. Figure S5: pH and DO in the ceramic membrane bioreactor. Figure S6: Changes in ammonia removal rate (ARR) and nitrite oxidizing rate (NOR) in the ceramic membrane bioreactor.
Author Contributions
B.L.: sampling, data curation, writing original draft; R.W.: sampling, data curation; W.Z.: methodology, sampling; Y.P.: Funding acquisition, project administration; D.A.: investigation, resources; L.Z.: review and editing; Z.G.: methodology, supervision, review and editing. All authors have read and agreed to the published version of the manuscript.
Funding
This research work was funded by Tongzhou Science and Technology Project (KJ2022CX013).
Data Availability Statement
The data presented in this study are available on request from the corresponding author.
Conflicts of Interest
The authors declare no conflict of interest.
References
- Liu, L.; Ji, M.; Wang, F.; Wang, S.; Qin, G. Insight into the influence of microbial aggregate types on nitrogen removal performance and microbial community in the anammox process—A review and meta-analysis. Sci. Total Environ. 2020, 714, 136571. [Google Scholar] [CrossRef] [PubMed]
- Lu, H.; Ji, Q.; Ding, S.; Zheng, P. The morphological and settling properties of ANAMMOX granular sludge in high-rate reactors. Bioresour. Technol. 2013, 143, 592–597. [Google Scholar] [CrossRef] [PubMed]
- van de Graaf, A.A.; de Bruijn, P.; Robertson, L.A.; Jetten, M.S.M.; Kuenen, J.G. Autotrophic growth of anaerobic ammonium-oxidizing micro-organisms in a fluidized bed reactor. Microbiology 1996, 142, 2187–2196. [Google Scholar] [CrossRef] [Green Version]
- Chatzisymeon, E. Application of Biological and Chemical Processes to Wastewater Treatment. Water 2021, 13, 1781. [Google Scholar] [CrossRef]
- Li, X.; Xia, C.; Sun, Y.; Ding, W.; Qin, H. Characteristics of Nitrifying and Denitrifying Microbes in the Bioretention Cell with Submerged Zone during a Dry Period. Water 2022, 14, 3503. [Google Scholar] [CrossRef]
- Strous, M.; Heijnen, J.J.; Kuenen, J.G.; Jetten, M.S.M. The sequencing batch reactor as a powerful tool for the study of slowly growing anaerobic ammonium-oxidizing microorganisms. Appl. Microbiol. Biotechnol. 1998, 50, 589–596. [Google Scholar] [CrossRef]
- Akaboci, T.R.V.; Gich, F.; Ruscalleda, M.; Balaguer, M.D.; Colprim, J. Effects of extremely low bulk liquid DO on autotrophic nitrogen removal performance and NOB suppression in side- and mainstream one-stage PNA. J. Chem. Technol. Biotechnol. 2018, 93, 2931–2941. [Google Scholar] [CrossRef]
- Gong, Z.; Yang, F.; Liu, S.; Bao, H.; Hu, S.; Furukawa, K. Feasibility of a membrane-aerated biofilm reactor to achieve single-stage autotrophic nitrogen removal based on Anammox. Chemosphere 2007, 69, 776–784. [Google Scholar] [CrossRef]
- van der Star, W.R.L.; Miclea, A.I.; van Dongen, U.G.J.M.; Muyzer, G.; Picioreanu, C.; van Loosdrecht, M.C.M. The membrane bioreactor: A novel tool to grow anammox bacteria as free cells. Biotechnol. Bioeng. 2008, 101, 286–294. [Google Scholar] [CrossRef]
- Huang, X.; Urata, K.; Wei, Q.; Yamashita, Y.; Hama, T.; Kawagoshi, Y. Fast start-up of partial nitritation as pre-treatment for anammox in membrane bioreactor. Biochem. Eng. J. 2016, 105, 371–378. [Google Scholar] [CrossRef]
- Liang, Z.; Han, Z.; Yang, S.; Liang, X.; Du, P.; Liu, G.; Yang, Y. A control strategy of partial nitritation in a fixed bed bioflim reactor. Bioresour. Technol. 2011, 102, 710–715. [Google Scholar] [CrossRef]
- Liang, Z.; Liu, J. Control factors of partial nitritation for landfill leachate treatment. J. Environ. Sci. 2007, 19, 523–529. [Google Scholar] [CrossRef]
- Awata, T.; Goto, Y.; Kuratsuka, H.; Aoi, Y.; Ozaki, N.; Ohashi, A.; Kindaichi, T. Reactor performance and microbial community structure of single-stage partial nitritation anammox membrane bioreactors inoculated with Brocadia and Scalindua enrichment cultures. Biochem. Eng. J. 2021, 170, 107991. [Google Scholar] [CrossRef]
- Mao, X.; Myavagh, P.H.; Lotfikatouli, S.; Hsiao, B.S.; Walker, H.W. Membrane Bioreactors for Nitrogen Removal from Wastewater: A Review. J. Environ. Eng. 2020, 146, 03120002. [Google Scholar] [CrossRef]
- Gu, Q.; Ng, T.C.A.; Bao, Y.; Ng, H.Y.; Tan, S.C.; Wang, J. Developing better ceramic membranes for water and wastewater Treatment: Where microstructure integrates with chemistry and functionalities. Chem. Eng. J. 2022, 428, 130456. [Google Scholar] [CrossRef]
- Kayvani Fard, A.; McKay, G.; Buekenhoudt, A.; Al Sulaiti, H.; Motmans, F.; Khraisheh, M.; Atieh, M. Inorganic Membranes: Preparation and Application for Water Treatment and Desalination. Materials 2018, 11, 74. [Google Scholar] [CrossRef] [Green Version]
- He, Z.; Lyu, Z.; Gu, Q.; Zhang, L.; Wang, J. Ceramic-based membranes for water and wastewater treatment. Colloids Surf. A Physicochem. Eng. Asp. 2019, 578, 123513. [Google Scholar] [CrossRef]
- Nywening, J.-P.; Zhou, H. Influence of filtration conditions on membrane fouling and scouring aeration effectiveness in submerged membrane bioreactors to treat municipal wastewater. Water Res. 2009, 43, 3548–3558. [Google Scholar] [CrossRef]
- van den Brink, P.; Vergeldt, F.; Van As, H.; Zwijnenburg, A.; Temmink, H.; van Loosdrecht, M.C.M. Potential of mechanical cleaning of membranes from a membrane bioreactor. J. Membr. Sci. 2013, 429, 259–267. [Google Scholar] [CrossRef]
- Shahid, M.K.; Kashif, A.; Rout, P.R.; Aslam, M.; Fuwad, A.; Choi, Y.; Banu, J.R.; Park, J.H.; Kumar, G. A brief review of anaerobic membrane bioreactors emphasizing recent advancements, fouling issues and future perspectives. J. Environ. Manag. 2020, 270, 110909. [Google Scholar] [CrossRef]
- Fan, F.; Zhou, H. Interrelated effects of aeration and mixed liquor fractions on membrane fouling for submerged membrane bioreactor processes in wastewater treatment. Environ. Sci. Technol. 2007, 41, 2523–2528. [Google Scholar] [CrossRef] [PubMed]
- APHA; AWWA; WEF. Standard Methods for Examination of Water and Wastewater, 20th ed.; Ameican Public Health Association: Washington, DC, USA, 1998. [Google Scholar]
- Soliman, M.; Eldyasti, A. Development of partial nitrification as a first step of nitrite shunt process in a Sequential Batch Reactor (SBR) using Ammonium Oxidizing Bacteria (AOB) controlled by mixing regime. Bioresour. Technol. 2016, 221, 85–95. [Google Scholar] [CrossRef] [PubMed]
- Fan, N.S.; Zhu, X.L.; Wu, J.; Tian, Z.; Bai, Y.H.; Huang, B.C.; Jin, R.C. Deciphering the microbial and genetic responses of anammox biogranules to the single and joint stress of zinc and tetracycline. Environ. Int. 2019, 132, 105097. [Google Scholar] [CrossRef] [PubMed]
- Kunacheva, C.; Soh, Y.N.A.; Stuckey, D.C. Identification of soluble microbial products (SMPs) from the fermentation and methanogenic phases of anaerobic digestion. Sci. Total Environ. 2020, 698, 134177. [Google Scholar] [CrossRef] [PubMed]
- Defrance, L.; Jaffrin, M.Y. Comparison between ®ltrations at ®xed transmembrane pressure and ®xed permeate ¯ux: Application to a membrane bioreactor used for wastewater treatment. J. Membr. Sci. 1999, 8, 203–210. [Google Scholar] [CrossRef]
- Field, R.W.; Wu, D.; Howell, J.A.; Gupta, B.B. Critical flux concept for microfiltration fouling. J. Membr. Sci. 1995, 100, 259–272. [Google Scholar] [CrossRef]
- Aghapour Aktij, S.; Taghipour, A.; Rahimpour, A.; Mollahosseini, A.; Tiraferri, A. A critical review on ultrasonic-assisted fouling control and cleaning of fouled membranes. Ultrasonics 2020, 108, 106228. [Google Scholar] [CrossRef]
- Ninomiya, Y.; Kimura, K.; Sato, T.; Kakuda, T.; Kaneda, M.; Hafuka, A.; Tsuchiya, T. High-flux operation of MBRs with ceramic flat-sheet membranes made possible by intensive membrane cleaning: Tests with real domestic wastewater under low-temperature conditions. Water Res. 2020, 181, 115881. [Google Scholar] [CrossRef]
- Braak, E.; Alliet, M.; Schetrite, S.; Albasi, C. Aeration and hydrodynamics in submerged membrane bioreactors. J. Membr. Sci. 2011, 379, 1–18. [Google Scholar] [CrossRef] [Green Version]
- Pourabdollah, M.; Torkian, A.; Hashemian, S.J.; Bakhshi, B. A triple fouling layers perspective on evaluation of membrane fouling under different scenarios of membrane bioreactor operation. J. Environ. Health Sci. Engineer. 2014, 12, 91. [Google Scholar] [CrossRef]
- Qian, G.; Xie, C.; Teng, H.; Zhang, Y.; Zhao, H.; Zhou, J. Effect of aeration on membrane fouling and critical flux in microfiltration tubular membranes. Chin. J. Environ. Eng. 2017, 11, 4542–4548. [Google Scholar]
- Daly, S.; Casey, E.; Semião, A.J.C. Osmotic backwashing of forward osmosis membranes to detach adhered bacteria and mitigate biofouling. J. Membr. Sci. 2021, 620, 118838. [Google Scholar] [CrossRef]
- Thejani Nilusha, R.; Wang, T.; Wang, H.; Yu, D.; Zhang, J.; Wei, Y. Optimization of In Situ Backwashing Frequency for Stable Operation of Anaerobic Ceramic Membrane Bioreactor. Processes 2020, 8, 545. [Google Scholar] [CrossRef]
- Zhou, Z.; Qi, M.; Wang, H. Achieving Partial Nitrification via Intermittent Aeration in SBR and Short-Term Effects of Different C/N Ratios on Reactor Performance and Microbial Community Structure. Water 2020, 12, 3485. [Google Scholar] [CrossRef]
- van Dongen, U.; Jetten, M.S.M.; van Loosdrecht, M.C.M. The SHARON((R))-Anammox((R)) process for treatment of ammonium rich wastewater. Water Sci. Technol. 2001, 44, 153–160. [Google Scholar] [CrossRef]
- Li, J.; Qiang, Z.; Yu, D.; Wang, D.; Zhang, P.; Li, Y. Performance and microbial community of simultaneous anammox and denitrification (SAD) process in a sequencing batch reactor. Bioresour. Technol. 2016, 218, 1064–1072. [Google Scholar] [CrossRef]
- Chen, W.; Dai, X.; Cao, D.; Hu, X.; Liu, W.; Yang, D. Characterization of a Microbial Community in an Anammox Process Using Stored Anammox Sludge. Water 2017, 9, 829. [Google Scholar] [CrossRef] [Green Version]
- Soler-Jofra, A.; Schmidtchen, L.; Olmo, L.; van Loosdrecht, M.C.M.; Pérez, J. Short and long term continuous hydroxylamine feeding in a granular sludge partial nitritation reactor. Water Res. 2022, 209, 117945. [Google Scholar] [CrossRef]
- Liu, A.; Zhao, K.-L.; Liu, H.; Huang, L.; Ni, R.; Chen, Y.-Z. Short-cut Nitrification Start-up and Optimization of Operating Conditions Under Different Control Strategies. Huan Jing Ke Xue 2019, 40, 4569–4577. [Google Scholar]
- Wang, H.; Wang, Y.; Zhang, J.; Sui, Q.; Hu, D.; Zuo, F.; Wei, Y. Is Anoxic Operation Effective to Control Nitrate Build-Up and Sludge Loss for the Combined Partial Nitritation and Anammox (CPNA) Process? Processes 2020, 8, 1053. [Google Scholar] [CrossRef]
- Prakasam, T.; Loehr, R. Microbial nitrification and denitrification in concentrated wastes. Water Res. 1972, 6, 859–869. [Google Scholar] [CrossRef]
- Van Hulle, S.W.; Volcke, E.I.; Teruel, J.L.; Donckels, B.; van Loosdrecht, M.C.; Vanrolleghem, P.A. Influence of temperature and pH on the kinetics of the Sharon nitritation process. J. Chem. Technol. Biotechnol. 2007, 82, 471–480. [Google Scholar] [CrossRef]
- Anthonisen, A.C.; Loehr, R.C.; Prakasam, T.B.S.; Srinath, E.G. Inhibition of Nitrification by Ammonia and Nitrous Acid. J. Water Pollut. Control. Fed. 1976, 48, 835–852. [Google Scholar]
- Vadivelu, V.M.; Keller, J.; Yuan, Z. Free ammonia and free nitrous acid inhibition on the anabolic and catabolic processes of Nitrosomonas and Nitrobacter. Water Sci. Technol. 2007, 56, 89–97. [Google Scholar] [CrossRef]
- Vadivelu, V.M.; Yuan, Z.; Fux, C.; Keller, J. The inhibitory effects of free nitrous acid on the energy generation and growth processes of an enriched nitrobacter culture. Environ. Sci. Technol. 2006, 40, 4442–4448. [Google Scholar] [CrossRef]
- Ge, S.; Peng, Y.; Qiu, S.; Zhu, A.; Ren, N. Complete nitrogen removal from municipal wastewater via partial nitrification by appropriately alternating anoxic/aerobic conditions in a continuous plug-flow step feed process. Water Res. 2014, 55, 95–105. [Google Scholar] [CrossRef] [PubMed]
- Li, S.; Li, J.; Yang, S.; Zhang, Q.; Li, X.; Zhang, L.; Peng, Y. Rapid achieving partial nitrification in domestic wastewater: Controlling aeration time to selectively enrich ammonium oxidizing bacteria (AOB) after simultaneously eliminating AOB and nitrite oxidizing bacteria (NOB). Bioresour. Technol. 2021, 328, 124810. [Google Scholar] [CrossRef]
- Tian, W.-D.; An, K.-J.; Ma, C.; Han, X. Partial nitritation for subsequent Anammox to treat high-ammonium leachate. Environ. Technol. 2013, 34, 1063–1068. [Google Scholar] [CrossRef]
- Vadivelu, V.M.; Keller, J.; Yuan, Z. Effect of free ammonia on the respiration and growth processes of an enriched Nitrobacter culture. Water Res. 2007, 41, 826–834. [Google Scholar] [CrossRef]
- Shen, L.; Yao, Y.; Meng, F. Reactor performance and microbial ecology of a nitritation membrane bioreactor. J. Membr. Sci. 2014, 462, 139–146. [Google Scholar] [CrossRef]
- Zhang, T.; Wu, P.; Shen, Y.-L.; Lü, G.; Xu, Y.-Z.; Samwine, T. Fast Start-up of Shortcut Nitrification in a CSTR and an MBR. Huan Jing Ke Xue 2017, 38, 3399–3405. [Google Scholar] [PubMed]
- Wu, P.; Chen, Y.; Zhang, T.; Shen, Y.-L.; Xu, Y.-Z. Microbial Community Characteristics of Shortcut Nitrification Start-up in Different MBR-Inoculated Sludges. Huan Jing Ke Xue 2018, 39, 4636–4643. [Google Scholar] [PubMed]
- Wang, Y.; Bu, C.N.; Kang, Q.; Ahmad, H.A.; Zhang, J.; Gao, B.; Ni, S.Q. Autoclaved sludge as the ideal seed to culture anammox bacteria: Reactor performance and microbial community diversity. Bioresour. Technol. 2017, 244, 391–399. [Google Scholar] [CrossRef]
Figure 1.
The schematic diagram of the ceramic membrane system.

Figure 2.
Impact of the in situ fouling control on critical flux: (a) filtration without fouling control; (b) filtration with in situ fouling control.
Figure 2.
Impact of the in situ fouling control on critical flux: (a) filtration without fouling control; (b) filtration with in situ fouling control.

Figure 3.
Impact of the fouling control on TMP and flux recovery: (a) initial flux at 7.73 LMH; (b) flux varied from 7.73 to 30.92 LMH.
Figure 3.
Impact of the fouling control on TMP and flux recovery: (a) initial flux at 7.73 LMH; (b) flux varied from 7.73 to 30.92 LMH.

Figure 4.
Operation performance during the entire PN process. (a) Concentration of nitrite and nitrate in influent and effluent, and the rate of nitrite accumulation; (b) concentration of ammonia and TN in fluent and effluent, and ammonia removal efficiency.
Figure 4.
Operation performance during the entire PN process. (a) Concentration of nitrite and nitrate in influent and effluent, and the rate of nitrite accumulation; (b) concentration of ammonia and TN in fluent and effluent, and ammonia removal efficiency.

Figure 5.
The concentration ratio of nitrite and ammonia in effluent.

Figure 6.
Composition of microorganisms at (a) phylum level; (b) genus level in ceramic MBR.


Table 1.
Operation parameters of four different stages.
| Phase | Time (d) | Inf. NH4+-N (mg/L) | HRT (h) | NLR (kg N/m3/d) |
|---|---|---|---|---|
| I | 1–10 | 100 | 24 | 0.1 |
| II | 11–22 | 200 | 24 | 0.2 |
| III | 23–106 | 400 | 24 | 0.4 |
| 107–136 | 200 | 12 | 0.4 | |
| IV | 137–156 | 300 | 12 | 0.6 |
Table 2.
Impact of the automatic cleaning device on membrane resistance distribution.
| Total Resistance (Rt) | Membrane Resistance (Rm) | Concentration Polarization Resistance (Rc) | Gel Layer Resistance (Rg) | Inherent Resistance (Ri) | |
|---|---|---|---|---|---|
| Without in-situ cleaning (1011/m) | 66.50 | 8.31 | 20.19 | 23.72 | 14.28 |
| Percentage (%) | 100.00 | 12.50 | 30.36 | 35.67 | 21.47 |
| With membrane cleaning devices (1011/m) | 38.76 | 8.31 | 17.39 | 5.58 | 7.48 |
| Percentage (%) | 100.00 | 21.44 | 44.86 | 14.40 | 19.30 |
Disclaimer/Publisher’s Note: The statements, opinions and data contained in all publications are solely those of the individual author(s) and contributor(s) and not of MDPI and/or the editor(s). MDPI and/or the editor(s) disclaim responsibility for any injury to people or property resulting from any ideas, methods, instructions or products referred to in the content. |
© 2023 by the authors. Licensee MDPI, Basel, Switzerland. This article is an open access article distributed under the terms and conditions of the Creative Commons Attribution (CC BY) license (https://creativecommons.org/licenses/by/4.0/).
Share and Cite
MDPI and ACS Style
Li, B.; Wang, R.; Zuo, W.; Peng, Y.; An, D.; Zhang, L.; Ge, Z. Development of Fouling-Control Strategy for Ceramic Membrane Bioreactor Applied in Partial Nitrification Process. Water 2023, 15, 444. https://doi.org/10.3390/w15030444
AMA Style
Li B, Wang R, Zuo W, Peng Y, An D, Zhang L, Ge Z. Development of Fouling-Control Strategy for Ceramic Membrane Bioreactor Applied in Partial Nitrification Process. Water. 2023; 15(3):444. https://doi.org/10.3390/w15030444
Chicago/Turabian StyleLi, Bingxin, Ruochen Wang, Weiwei Zuo, Yi Peng, Dong An, Liang Zhang, and Zheng Ge. 2023. "Development of Fouling-Control Strategy for Ceramic Membrane Bioreactor Applied in Partial Nitrification Process" Water 15, no. 3: 444. https://doi.org/10.3390/w15030444
Note that from the first issue of 2016, this journal uses article numbers instead of page numbers. See further details here.