
Monitoring of Plant Cultivation Conditions Using Ground Measurements and Satellite Products

Institute of Meteorology and Water Management-NRI, 01-673 Warsaw, Poland
*
Author to whom correspondence should be addressed.
Water 2023, 15(3), 449; https://doi.org/10.3390/w15030449
Submission received: 23 November 2022
/
Revised: 11 January 2023
/
Accepted: 18 January 2023
/
Published: 22 January 2023
(This article belongs to the Special Issue Advances in Sustainable Agriculture Progress under Climate Change)
Abstract
:The purpose of agrometeorological services conducted by various institutions around the world is to support decisions in the field of planning individual farmer works and agrotechnical treatments so as to fully enable the use of the prevailing weather and climatic conditions. However, the not always sufficient spatial distribution of ground measuring stations limits the possibility of the precise determination of meteorological conditions and the state of vegetation in a specific location. The solution may be the simultaneous use of both ground and satellite data, which can improve and enhance the final agrometeorological products. This paper presents examples of the use of meteorological products combining classical ground measurement and data from meteorological radars and satellites, applied in an agrometeorological service provided by the Institute of Meteorology and Water Management in Poland. Selected examples cover Wielkopolskie Province, which is a primarily agricultural region. An analysis of the course of the soil moisture index and HTC as well as differences in the PEI spatial distribution from ground and satellite data for the extremely dry growing season of 2018 are presented. The authors tried to demonstrate that combining data available from different sources may be a necessary condition for modern agriculture in the conditions of climate change.
1. Introduction
Agriculture remains one of those areas of human economic activity that is heavily dependent on the development of natural conditions. The natural environment, including climatic conditions, consists of inextricably linked elements. One element of this environment that is noticeably changing is the climate. In Poland, as in many European countries, we have been observing changes in a number of meteorological elements since the 1980s [1]. The climate element whose changes are most directly perceptible throughout the environment is air temperature. The beginning of the observed warming has been noticeable in Poland since the late 1970s and early 1980s [2,3,4]. An increase in sunshine duration is also visible, which, together with increasing air temperature, determines an increase in evapotranspiration and deepens the unfavourable water balance in large areas of Poland, with statistically insignificant changes in precipitation amounts [2,5]. Attention is also drawn to the observed seasonal changes: successive seasons appeared earlier, winter shortened markedly, while summer lengthened. The observed warming was more pronounced in western than in northeastern Poland, resulting in increased thermal contrasts across the country [6].
The ongoing changes, particularly the increase in the intensity and frequency of extreme events, are causing an increase in the vulnerability of agricultural production to a changing climate and severe economic losses. The variability of yield increases and thus often reduces the yield of crops as a result of, among other things, increasingly frequent droughts, thermal stress, and the emergence of new plant diseases and pests [3,7]. The observed warming affects the course of physiological processes in plants and the dates of individual phenological appearances. On the one hand, higher temperatures favour the acceleration of plant development and an extended vegetation season [3], while, on the other hand, prolonged drought may accelerate their death (in cultivated plants) or the transition into a state of dormancy (in wild plants). Climate scenarios indicate that changes in climatic conditions will continue, so significant changes in climatic conditions for agricultural production should also be expected.
These changes have also contributed to a significant increase in the interest and importance of monitoring and early-warning systems to monitor current phenomena affecting crop vegetation and to warn against phenomena that may affect crop yields. Agrometeorological services in most countries operate as part of the national meteorological services [8] based on observational data from measurement and observation networks. However, these networks, even the most modern ones, inherently provide only point information. In many cases, especially for spatial analysis, modelling, or forecasting purposes, such information needs to be supplemented by data from other sources. Hence, satellite products are becoming increasingly important, providing a broad spectrum of information with their high and very high spatial resolution [9].
For many years, the Institute of Meteorology and Water Management-National Research Institute (IMGW-PIB) has been carrying out an agrometeorological information service aimed at the correct assessment of agroclimatic conditions for plant cultivation, preventing and minimising crop losses resulting from the occurrence of adverse meteorological phenomena, and supporting decisions on the conduct of field work and agrotechnical operations to fully enable the use of the prevailing weather and climatic conditions for the best possible economic results [10]. IMGW-PIB, having its own satellite data receiving station, has current information showing the spatial distribution of the whole range of environmental data and indices at its disposal. These are complemented by meteorological and phenological data from the observation and measurement network of IMGW-PIB. As analyses conducted at IMGW-PIB have shown, these data closely correspond to satellite data [10]. This has enabled the development of a new methodology for climate monitoring not used in our country so far, both on a national and local scale. This methodology, based on the simultaneous use of data from ground and satellite observations, allows for the tracking of the course of current meteorological characteristics observed at the interface between the atmosphere and the biosphere with the highest possible spatial resolution. It also allows for the reduction of typical errors of individual systems, such as interpolation errors resulting from the point network of ground-based measurements or estimating magnitudes based solely on satellite data. The collected data and indices, supplemented with current information, can support state administration units at various levels in analyses of the state of the environment and in creating solutions to adapt to the effects of climate change. At IMGW-PIB they are used in spatial analyses of meteorological and hydrological indices for, among others, agrometeorological information service purposes, providing a range of information necessary in the decision-making process in modern agriculture.
The paper presents a selected use of meteorological data, products combining ground-based data from meteorological radar and satellites, and satellite-based indices to indicate the possibility of a detailed analysis of plant cultivation conditions, especially agricultural drought, on a local scale based on monitoring that combines all of these sources of information.
2. Area of Analysis and Methods
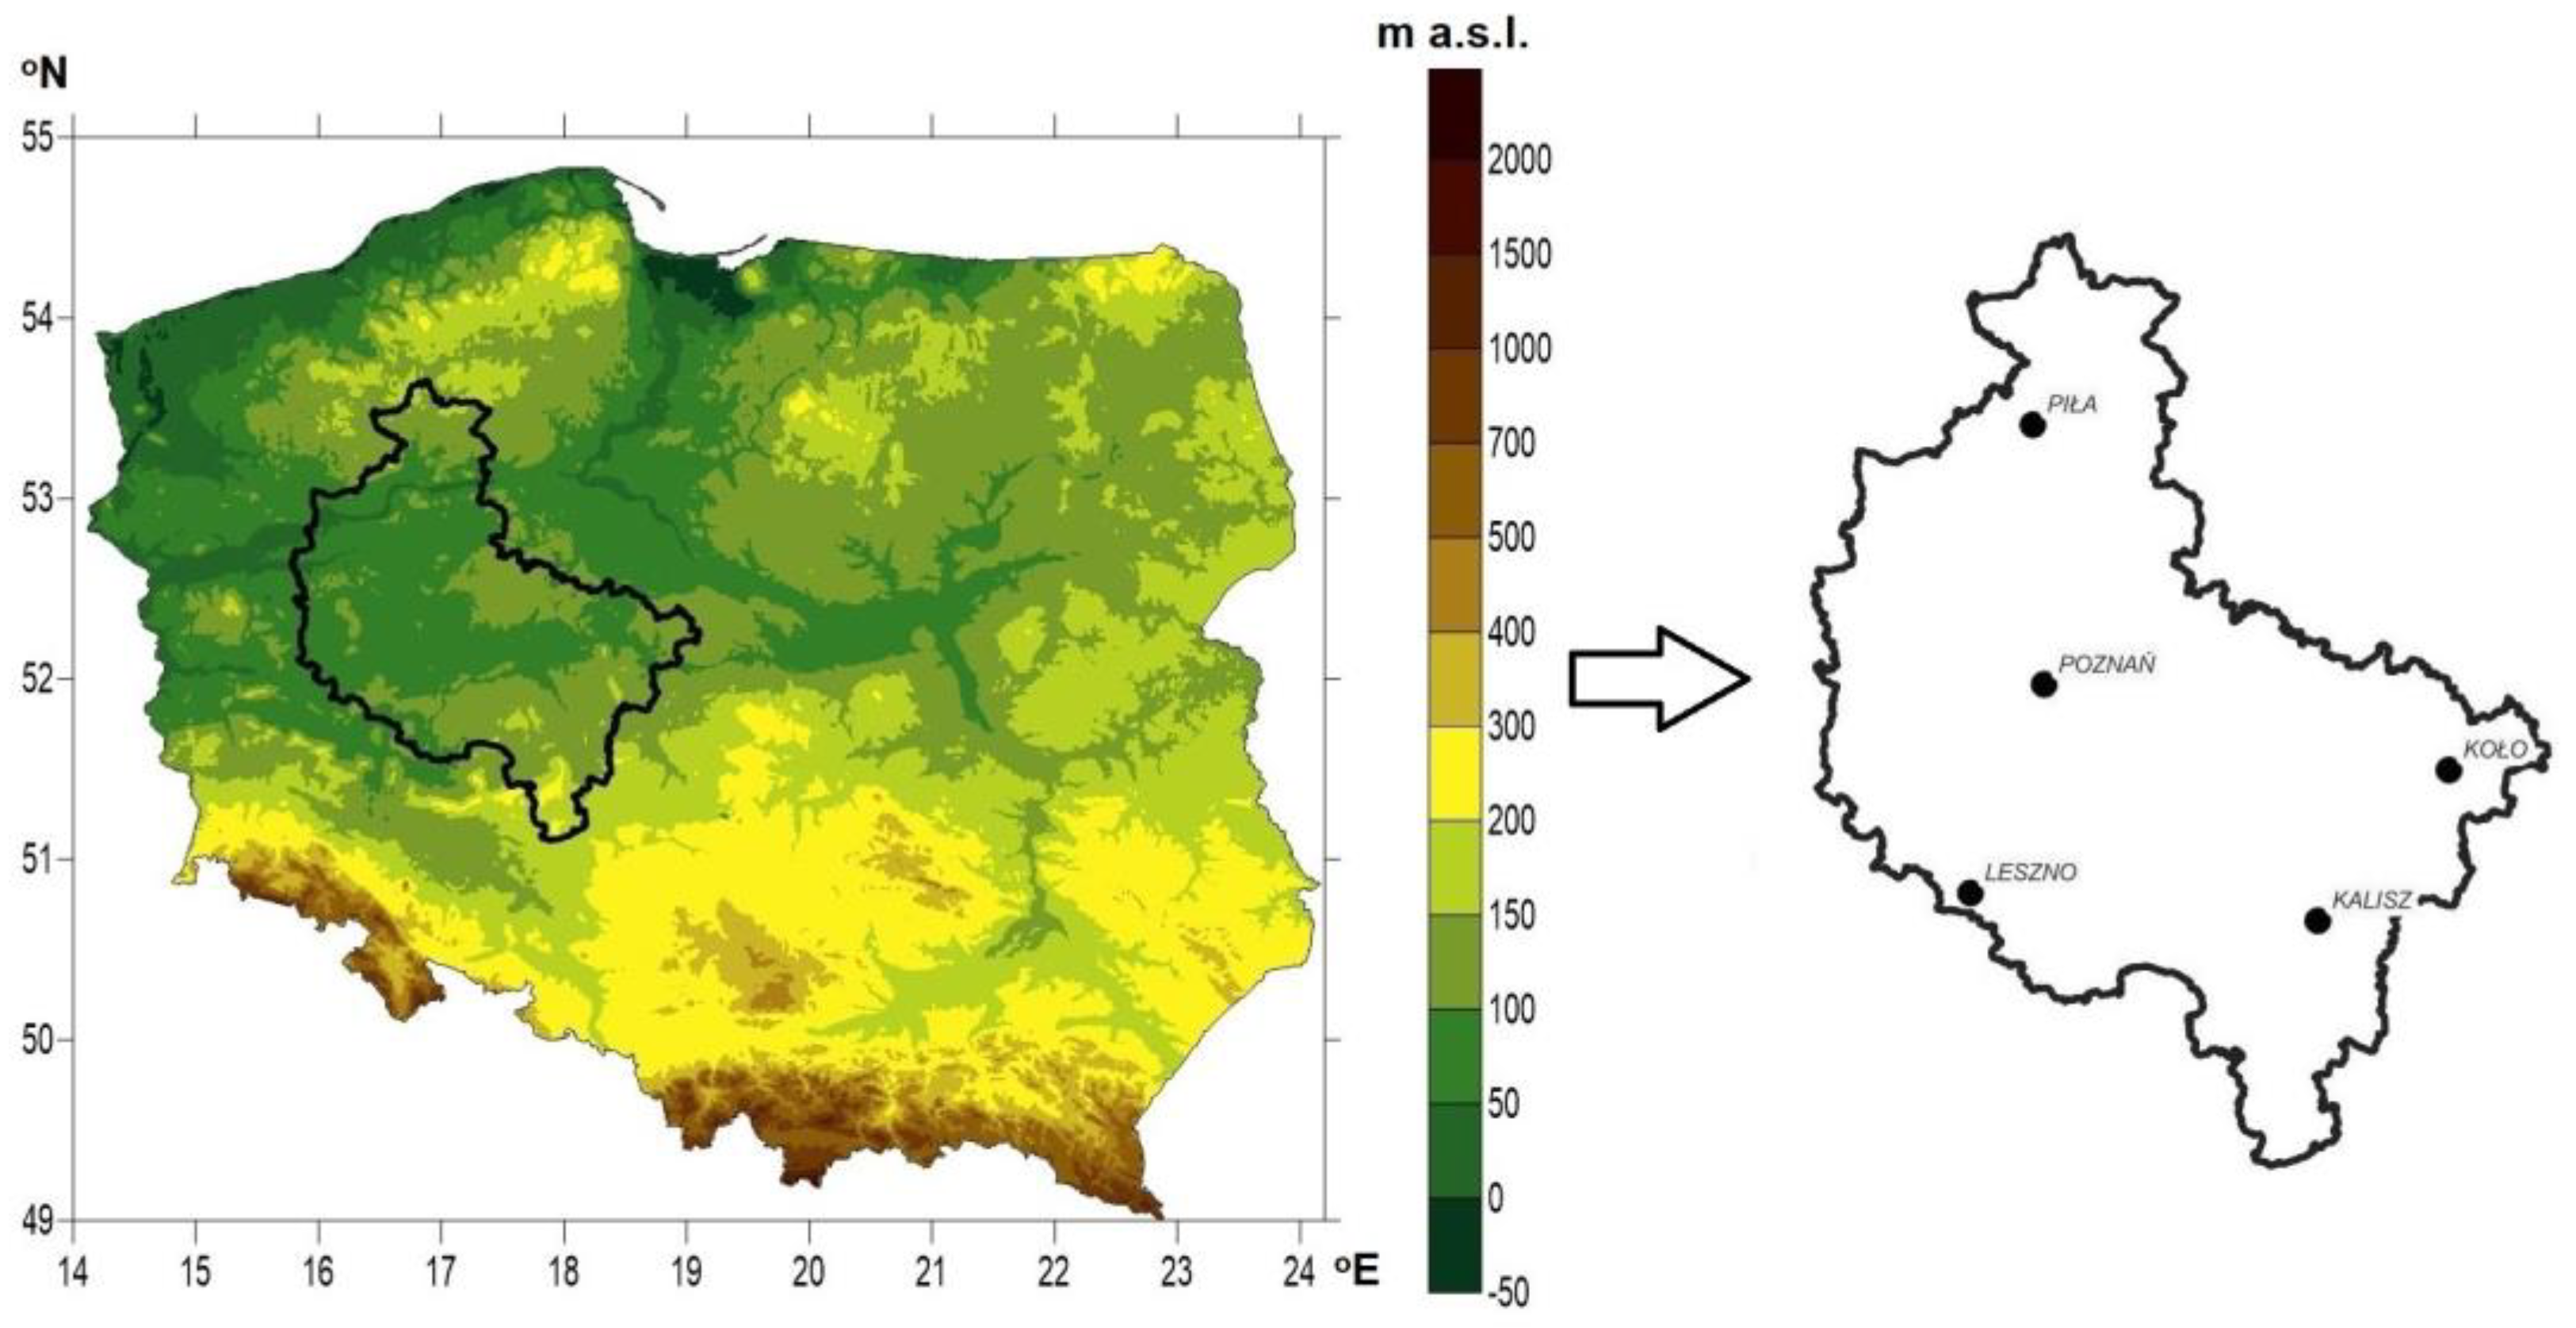
The monitoring of current meteorological conditions is highly significant, especially in regions with the largest area and crop production [11]. In the last 20 years, there has been a marked increase in the moisture deficit expressed by a higher incidence of moderately to extremely dry periods, mainly covering the warm half-year, i.e., the growing season [12]. The low and very low values of the Precipitation-Evapotranspiration Index primarily affect these areas, which is quite unfavourable from the point of agriculture because a major part of Polish agricultural potential is concentrated in those regions [13]. The central part of western Poland is the most exposed to frequent droughts. Therefore, Wielkopolskie Province, located in the western part of the country, was selected to present the monitoring method and the results of the analyses. The analyses are shown using the example of 2018, which was an outstandingly dry year compared to the multi-year period (Figure 1). The presented indices and analyses of plant growing conditions were given for the growing season, which is defined in Poland as the period from 1 April to 30 September. This is a period of optimal thermal and moisture conditions for plant development.
The province’s climate belongs to the temperate climate zone in the area of a mutual intermingling of maritime and continental influences. The average annual temperature is around 8.5 °C, with few frost days throughout the year and low precipitation, especially in the southern and eastern parts. The annual precipitation total ranges from 500 to 550 mm and is one of the lowest in Poland. The province covers an area of 29,826 km2, i.e., 9.5% of the country’s area, and the land use structure is dominated by agricultural land occupying about 65% of its area. Moderately fertile soils (Cambisols and Luvisols) and poor quality soils are predominant (Podzols) [14,15]. Despite this, the region is the country’s largest producer of potatoes, cereals, and sugar beet, the second largest in rapeseed production, and the third largest in vegetable cultivation.
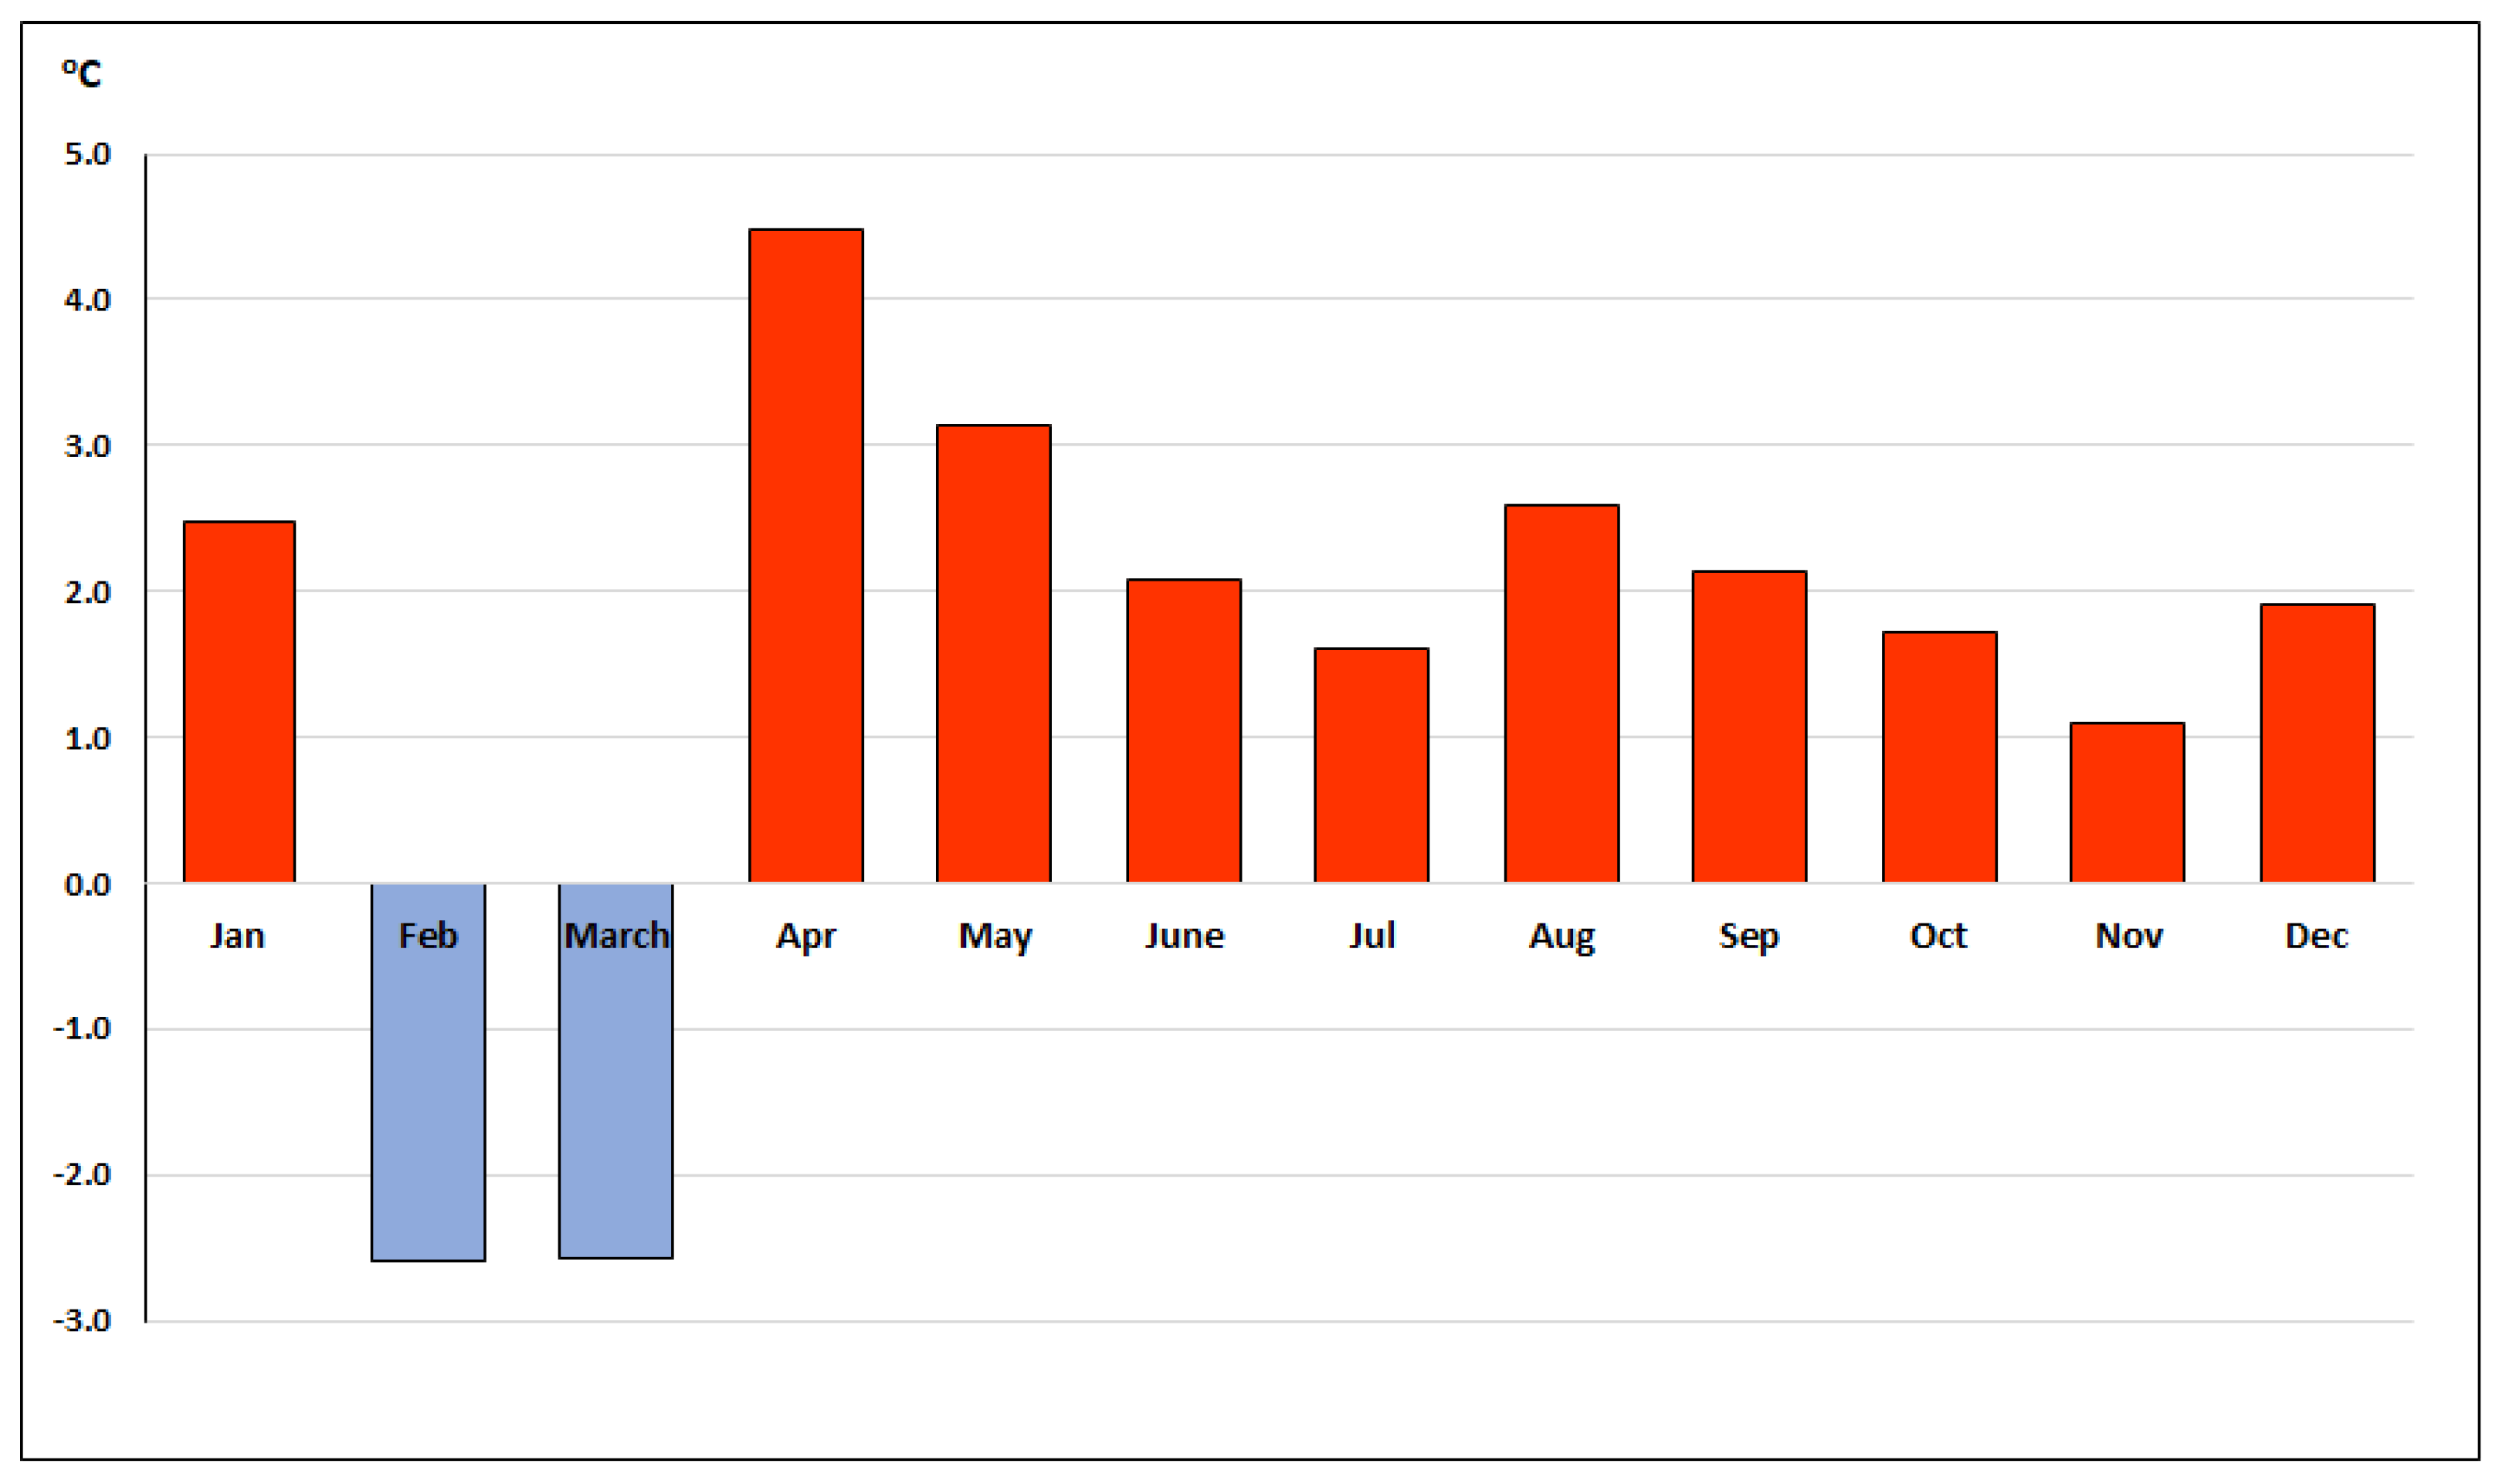
The year 2018 was one of the most unfavourable years for agriculture in this century. The drought, which lasted from April 2018, caused losses to the country’s economy estimated at over EUR 81 million. The greatest damage was recorded in cereals, rapeseed, root crops, and vegetables. Claims for crop insurance were registered, covering 5.4 million hectares of crop area, approximately 38% of agricultural land, and aid was paid to 268,140 beneficiaries for a total of more than EUR 48 million. The development of drought in the discussed year was favoured by the air temperature, with almost every month significantly exceeding the normal of the previous 30 years of 1981–2010 (Figure 2). Only February and March were very cold, which delayed the beginning of vegetation and the phenological beginning of spring in large areas of the country, which started about two weeks later than average. On the other hand, the rapid increase in temperature in April, which turned out to be 4.5 °C warmer than normal, significantly accelerated the development of vegetation and the phenological fullness of spring began across the country about two weeks earlier than average.
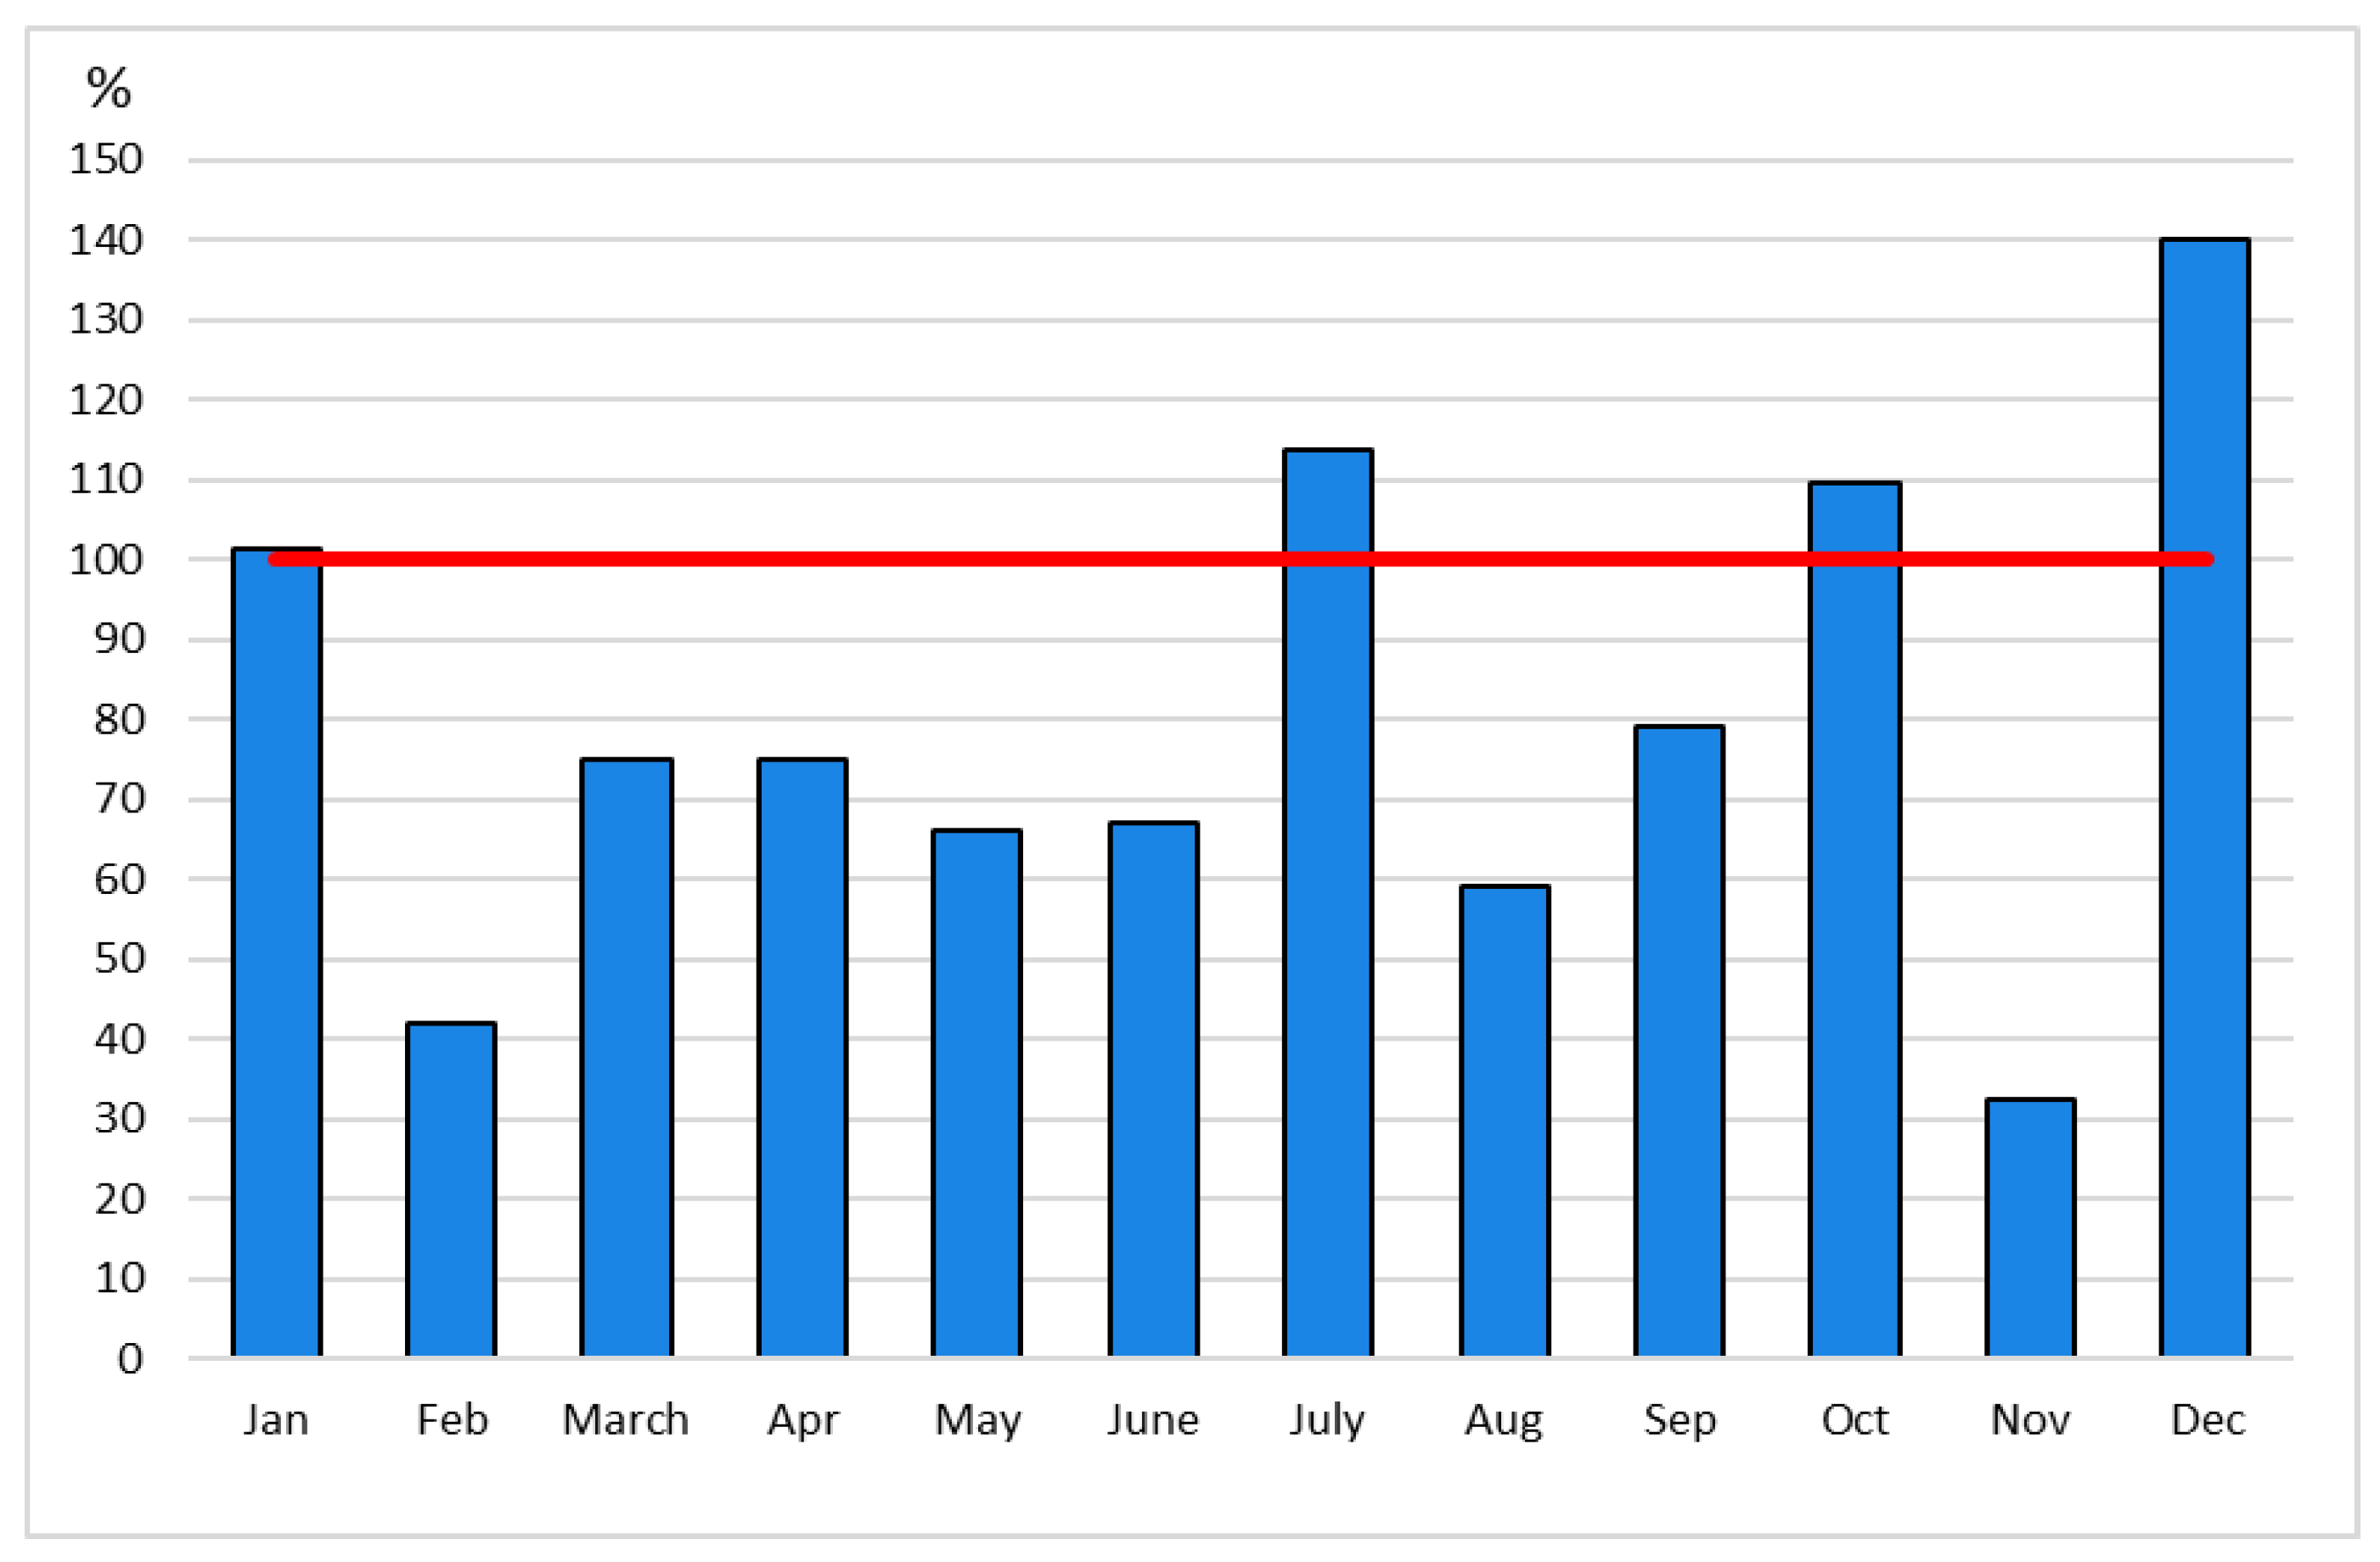
Higher than average air temperatures were accompanied by a shortage of precipitation (Figure 3). A very dry February and a dry March caused plants to enter the growing season (i.e., from April) with a significant rainwater scarcity. The shortage of rains covered almost the entire growing season, except slightly higher rainfall in mid-July, resulting in totals slightly above the multiannual mean in these two months, while the entire growing season was exceptionally dry.
The monitoring of meteorological conditions based on the measurement network of IMGW-PIB and relying mainly on synoptic stations, of which there are a total of 63 in Poland, and telemetric stations, of which there are nearly 500, makes it possible to track the course of essential elements necessary for the agrometeorological service, but often at too low of a spatial resolution. In addition, due to the limited range of these data, it would not be possible to estimate the number of indices depicting this type of agricultural drought. Most of the data are presented on the agrometeorological website not only in a standard daily or monthly step but also in a 10-day step, which is of particular importance for agriculture because daily data, due to their variability, make it difficult to analyse the situation. At the same time, the monthly step is often too long and, in some cases, over-averages and flattens the results.
One of the indices used to assess the development of moisture conditions of a given period is the climatic water balance (Precipitation Evapotranspiration Index-PEI), which is the difference between precipitation and evapotranspiration and is used in climate change studies [16]. PEI is considered an excellent characteristic of meteorological conditions during the growing season and an indicator of crop plants’ state and their water requirements. PEI can be a starting point for scheduling the time and intensity of irrigation and even yield forecasts by providing basic information on the amount of water available to plants during the growing season. It also allows the estimation of soil moisture, which is extremely important in the absence of a network measuring this parameter. However, one of its main components, evapotranspiration, is not measured directly at the regular network. In Poland, as in many countries, evapotranspiration values are calculated using indirect methods from empirical formulas, which are only an approximation of real conditions, and the spatial and temporal resolution of evapotranspiration data from ground sources depends on the resolution of parameters included in the empirical formula. This can be accomplished by the application of remote sensing. Furthermore, values of the second component of climatic water balance, i.e., precipitation, which is measured at meteorological stations, can be problematic in some situations (strong wind, high intensity, or snow, for example). An innovative method of estimating the magnitude of the climatic water balance has been developed at IMGW-PIB based on the “RainGRS” precipitation product developed at the Institute, which combines precipitation values: Ground (automatic weather stations), Meteorological Radar and Satellite [17] and the Land SAF satellite product “Reference Evapotranspiration” [18]. The final spatial resolution of the climatic water balance thus determined is 1 km.
Decade values of the hydrothermal coefficient (HTC), developed to assess the duration and severity of drought, particularly in agroclimatic terms, are also calculated based on the data from the RainGRS product. Its advantage is primarily data availability and calculation simplicity [13]. Furthermore, determining dry periods in 10-day steps is also essential, making it possible to compare the results with a number of other indices, especially those obtained from satellite data. The only limitation of the mentioned coefficient is the possibility of applying it only in periods with average daily air temperatures above 8 °C, which in practice restricts the analysis period to the growing season.
Further information used in the monitoring of plant cultivation conditions by IMGW-PIB is the soil moisture index, based on the EUMETSAT H-SAF H14 product [19]. Soil moisture determines the proper growth of plants and also the soil management and terms of the field work. Unfortunately, in Poland, as in many other countries, there is no unified soil moisture monitoring network covering the whole country. Therefore, the application of satellite data for soil moisture assessment in agrometeorological practice appears to be the most efficient and economically optimal method. The soil moisture product used in the agrometeorological information service at IMGW-PIB is created by EUMETSAT H-SAF (Satellite Application Facility on Support to Operational Hydrology and Water Management). Soil moisture data comes from the ASCAT sensor of the Metop satellites and is used in the ECMWF H-TESSEL Land Surface Model (Hydrology Tiled ECMWF Scheme for Surface Exchanges over Land). Finally, the current saturation of the soil with liquid water in four layers is obtained, with a spatial resolution of 25 km. The H-SAF product H-14 has additional added value for agrometeorological services. The Soil Wetness Index only represents liquid water. When soil is frozen, soil moisture immediately goes down to zero or varies at low values, giving an indication of frozen area localization and depth.
The following EUMETSAT Land SAF satellite products supplement the measured data from synoptic stations and PEI and soil moisture indices for monitoring agrometeorological conditions: reference and actual evapotranspiration (sum for last 24 h, last ten days, and last 30 days), downwelling surface shortwave radiation energy (sum for last 24 h, last ten and 30 days) [20], Leaf Area Index-LAI (daily) and Fraction of Absorbed Photosynthetic Active Radiation -fAPAR (daily) [21].
3. Results
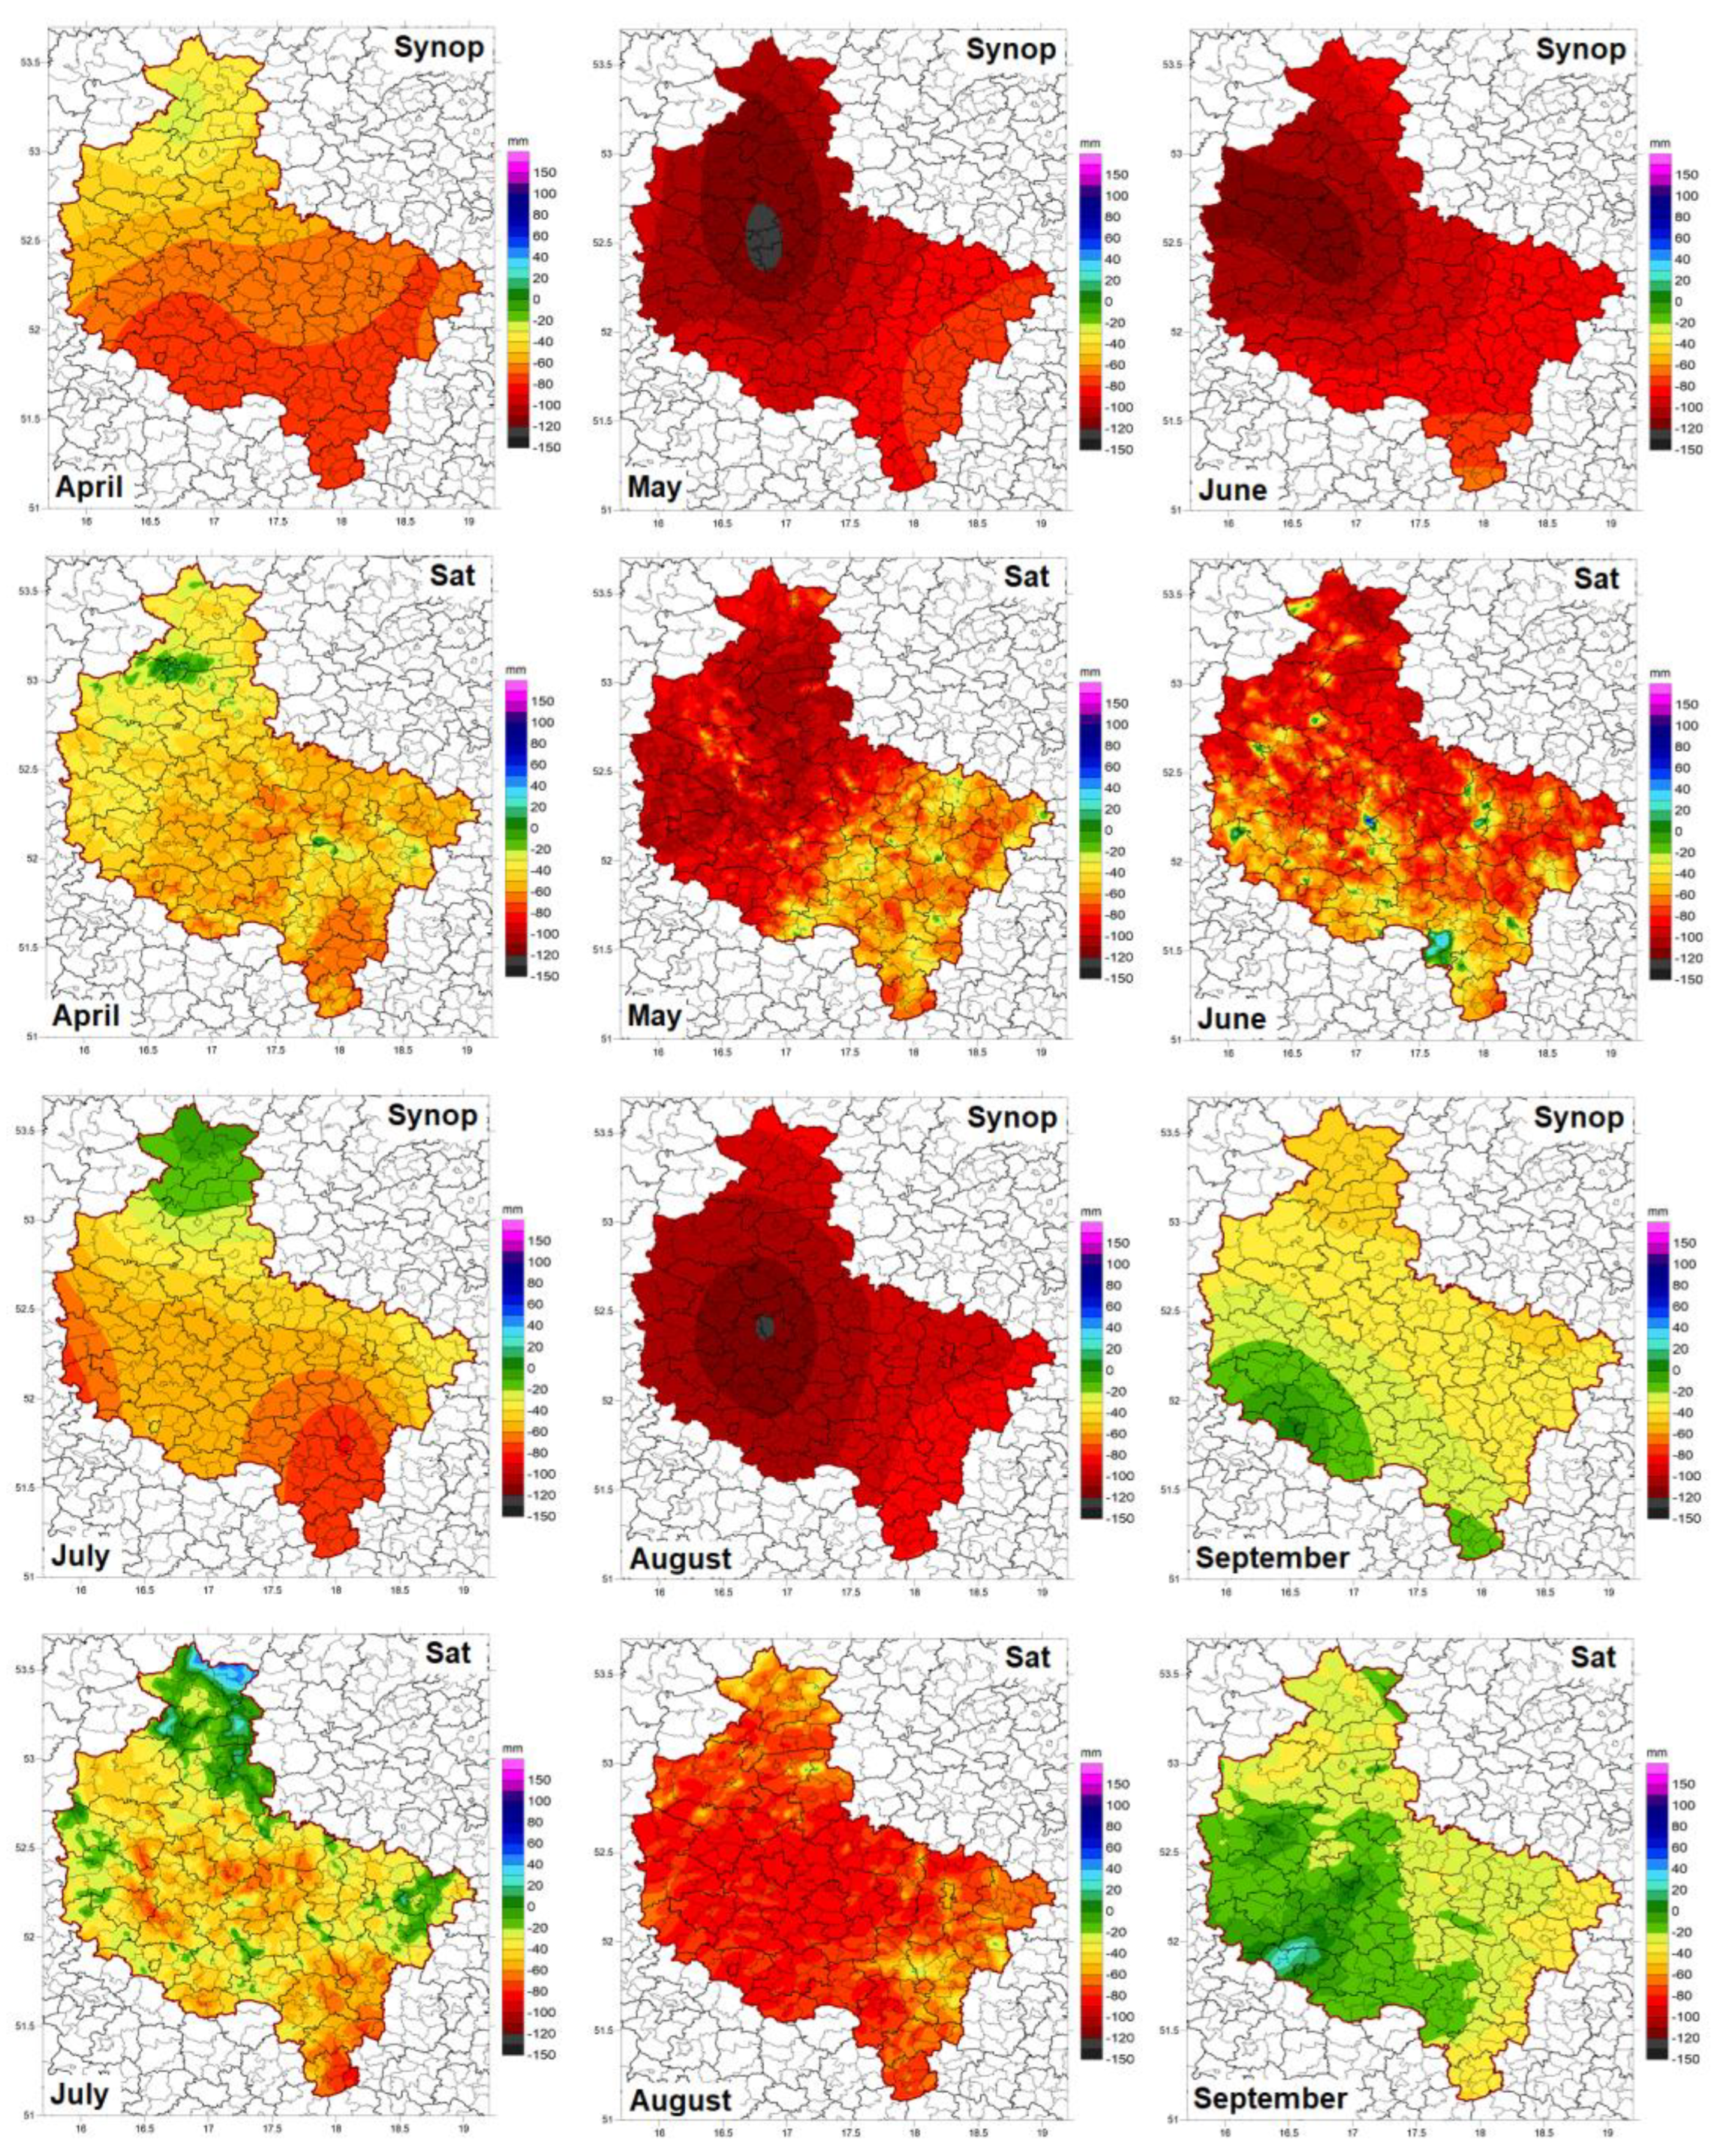
Figure 4 shows the spatial distribution of monthly totals of the Precipitation-Evapotranspiration Index (PEI) for the 2018 growing season. In order to show the differences in the accuracy of the spatial distribution, the PEI values were calculated using two methods: based on data from synoptic stations and the methodology described above. The changes in PEI from month to month reflect very well the temporal distribution of precipitation and reference evapotranspiration, of which air temperature and sunshine duration are considerable components. Significant precipitation deficits, persisting from February onwards, with high evapotranspiration resulting, among others, from significant deviations of positive air temperatures, led to an increasing prevalence of moisture losses over moisture gain and the development of agricultural drought starting from April 2018. In July, due to very high storm precipitation in the middle of the month, the moisture balance temporarily improved, especially in the northern and central parts of the region. Comparing the data obtained with both methods shows a high convergence of PEI values for the month. However, differences in the detailed spatial distribution of the values are also clearly visible. The interpolation of PEI values calculated from synoptic station data is much more generalised due to the small number of such stations. In contrast, the spatial distribution of PEI calculated with kilometre resolution, based on data from the RainGRS product and satellite data (Land SAF METREF product), allows this distribution to be monitored with a high degree of accuracy, indicating areas with higher values, resulting, for example, from local rain showers, which are very frequent during the summer. This is particularly evident in July, when local rainfall was recorded in small areas of eastern and western Wielkopolskie Province that was so high that the monthly totals of PEI were clearly higher than it would be from interpolation based on synoptic data. Such accuracy of the distribution of PEI values, which are one of the key indicators of drought in Poland, allows for the monitoring of the water supply of plants to indicate areas at risk of drought in order to decide on possible irrigation or other treatments to minimize possible crop losses. Differences in the accuracy of the obtained image allow us to conclude that in the case of information based solely on data from measuring stations, their interpretation on a local scale (county, municipality or even a single farm) may be burdened with a significant error and may lead to incorrect conclusions as to the plan for further procedures in field work.
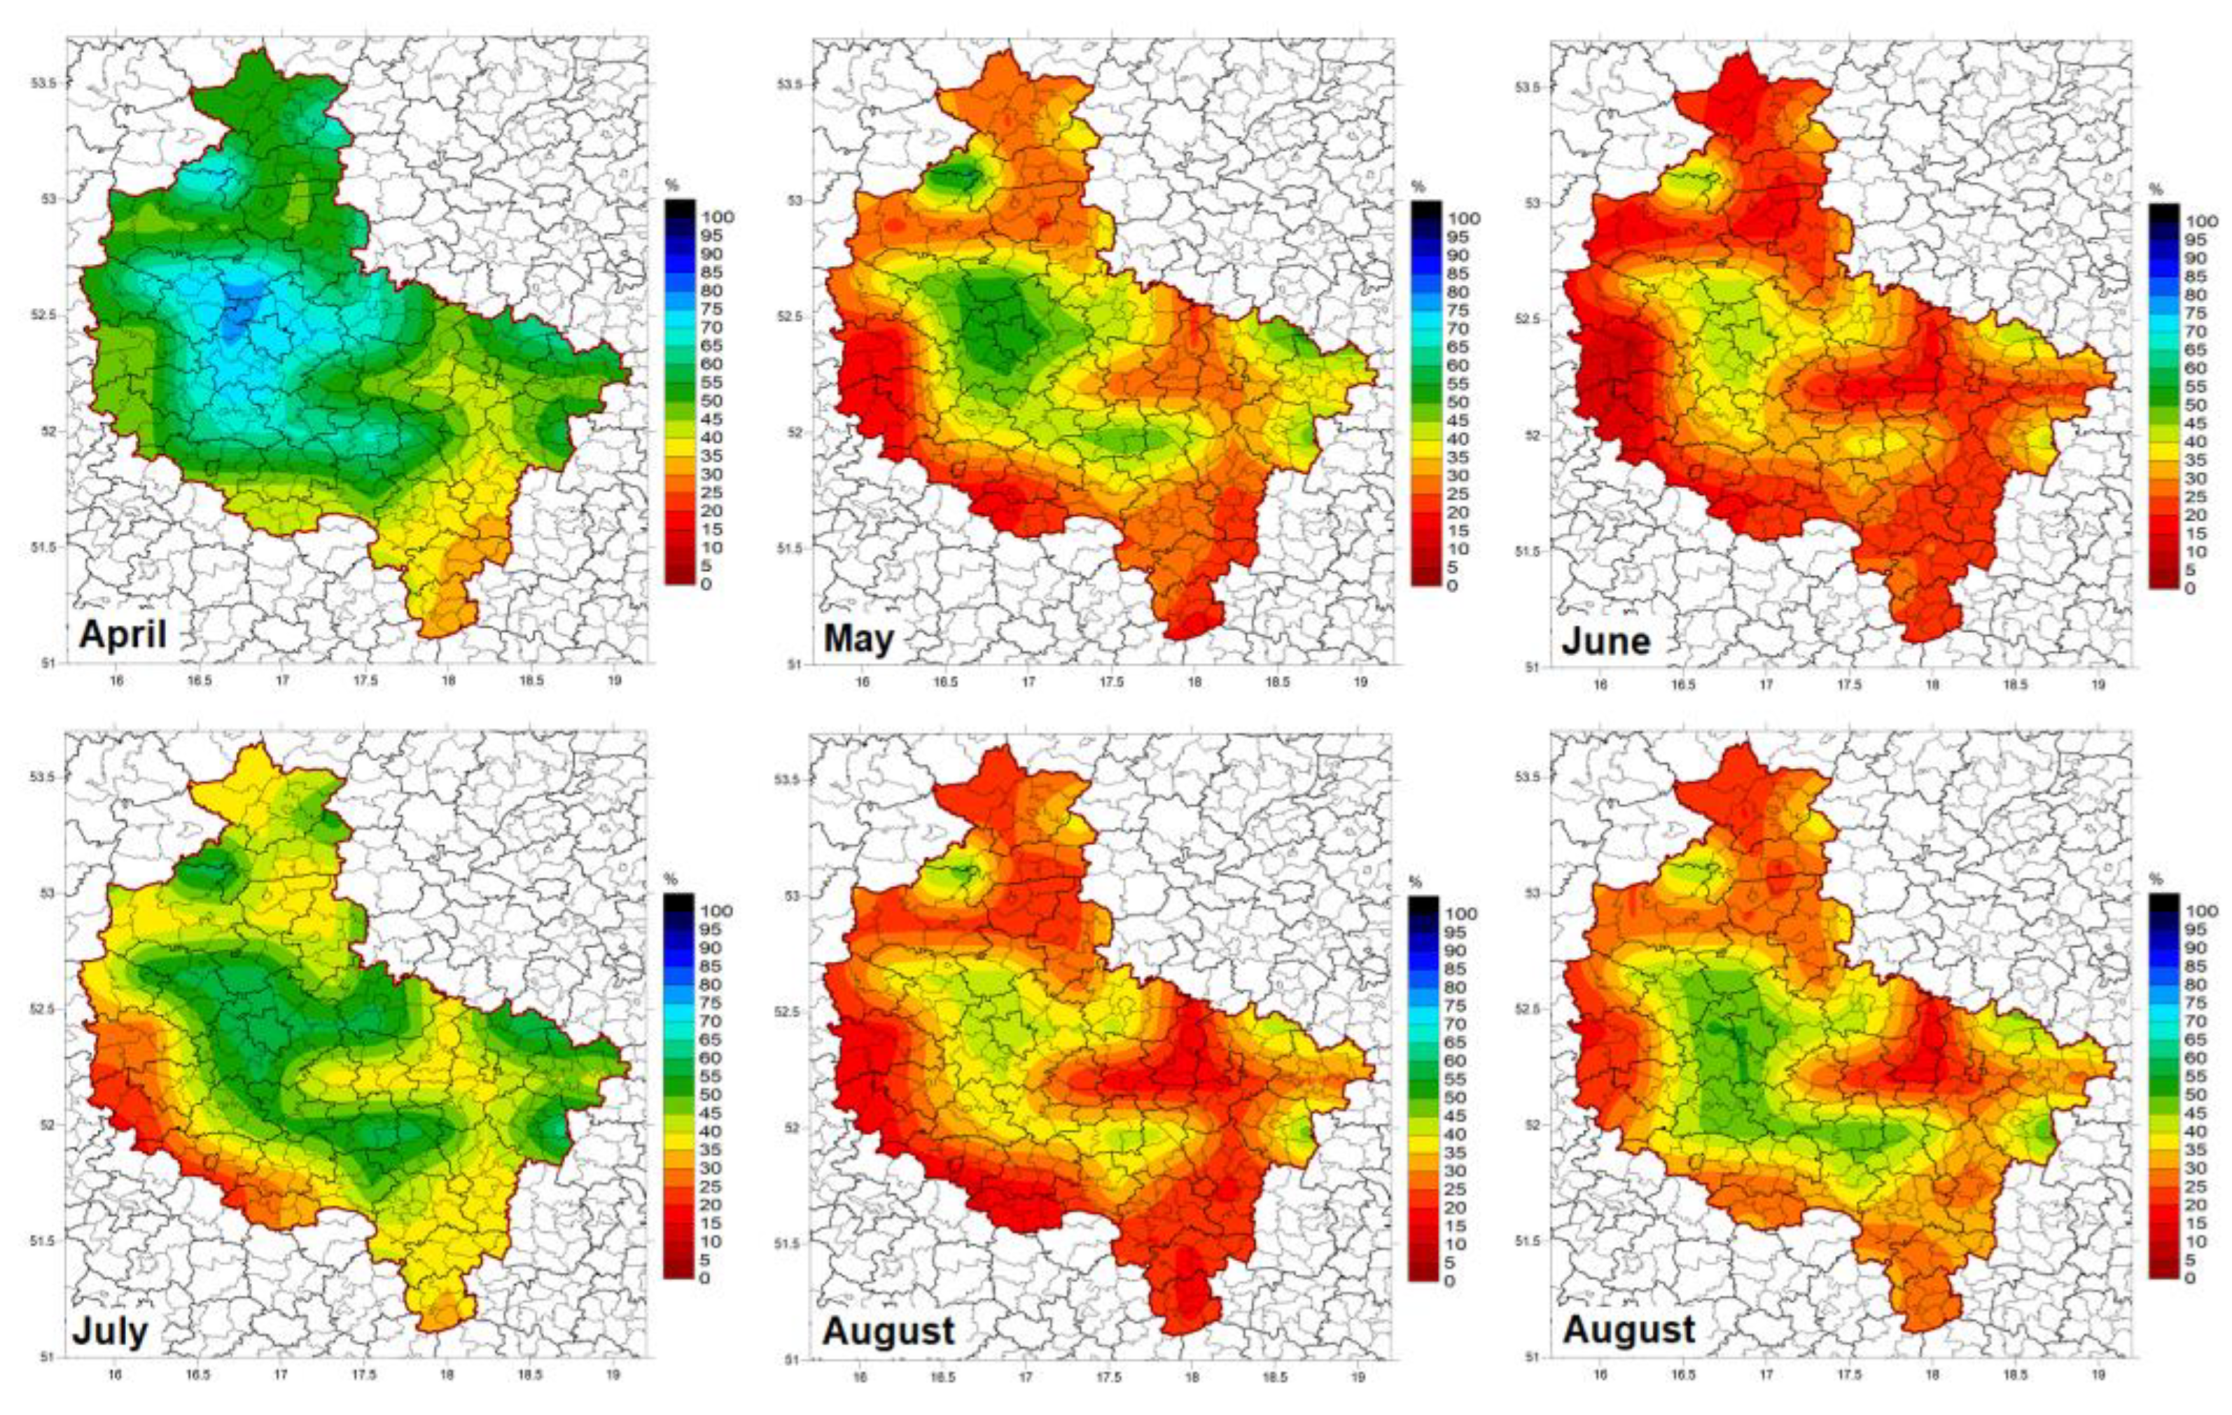
In parallel with the analysis of changes in PEI spatial and temporal distribution, an analysis of the soil moisture index based on satellite data was conducted. Figure 5 and Figure 6 show the spatial distribution of soil moisture index values in the shallower (7–28 cm) and deeper (28–100 cm) root zone in Wielkopolskie Province during the 2018 growing season. The development of soil drought in the 7–28 cm layer is clearly visible as a result of the precipitation deficiency lasting from February, initially in the south of the region (April), where the moisture index fell below 40%, and gradually throughout the province. In May, soil moisture fell below 30% in most of the area, and in June, it fell in almost the entire region, posing a danger of extreme moisture deficiency for all crops. Only in July, as a result of the mentioned storm precipitation, did soil moisture periodically increase, only to decrease significantly again in August, which was very dry in terms of rainfall.
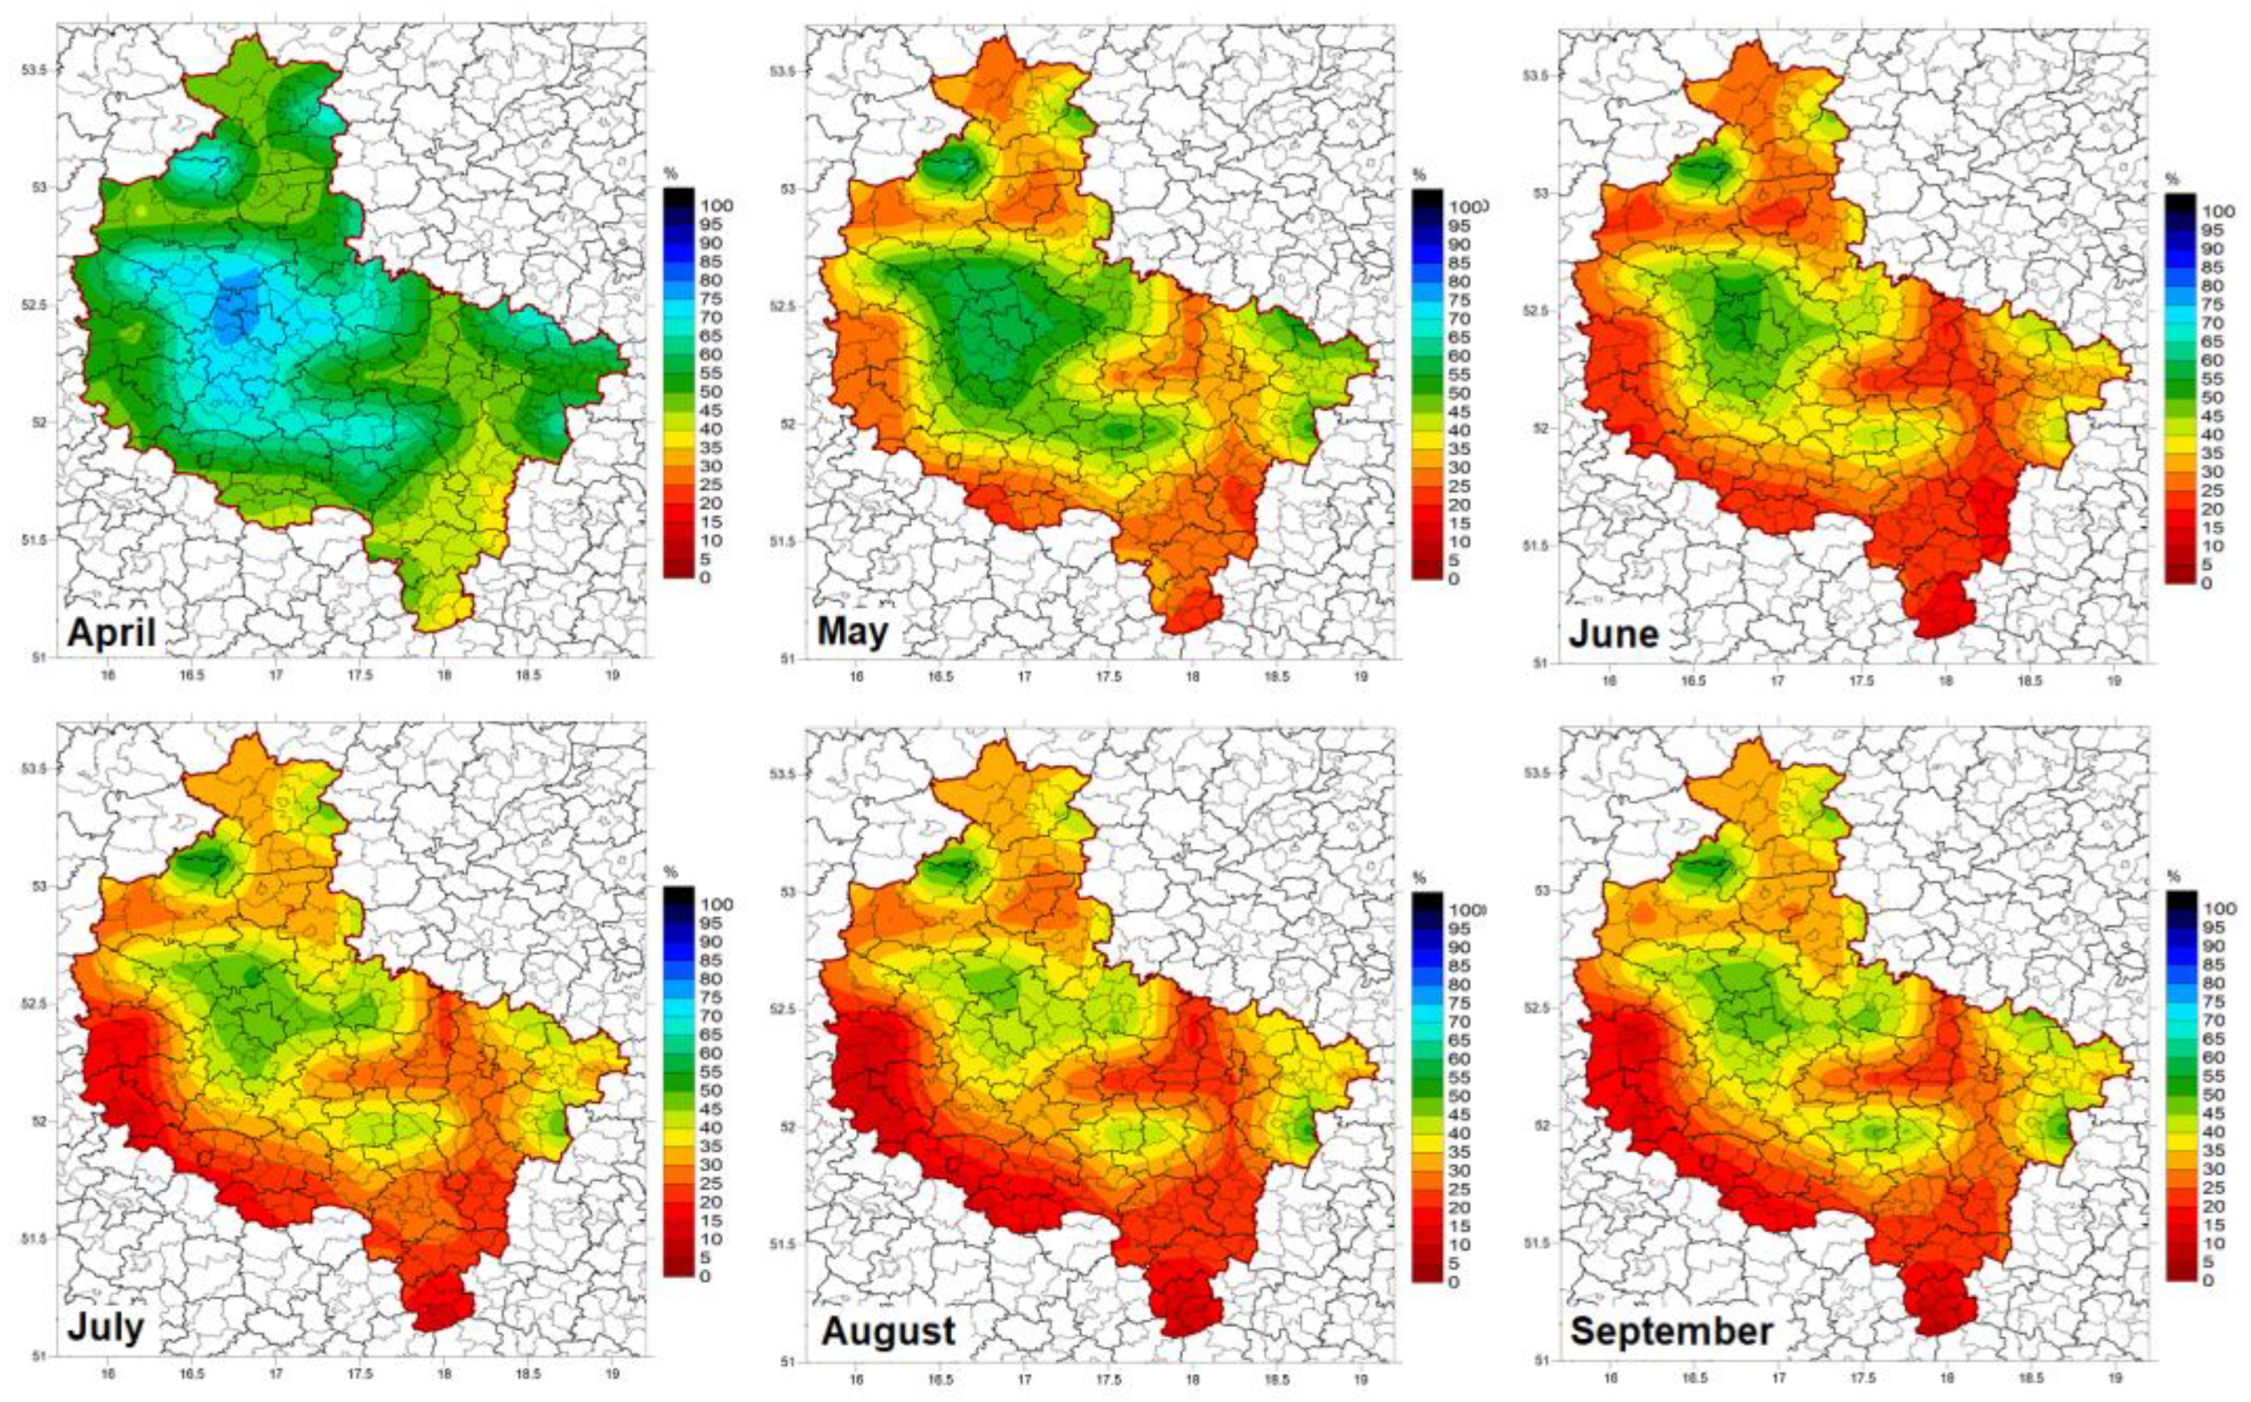
In contrast, the deeper root layer (28–100 cm) reacted slightly weaker and with a longer delay to the lack of precipitation or its occurrence, especially if it was not high. A slightly weaker response than in the shallower layer to the continuing rainfall shortage since February is visible in April, especially in the south of the region. However, heavy precipitation in mid-July due to a storm front passing through Poland did not significantly improve the moisture situation at this depth, but only in the shallower layers. Furthermore, visible in the shallower layer, changes from month to month during July-September are hardly visible in the 28–100 cm layer and the moisture conditions hardly changed during these months. Low and very low soil moisture persisted until the end of the growing season, covering most of the Wielkopolskie Province except for the central part of the region and small patches on its eastern and northern borders. The situation along the southeastern and southern borders of the province was exceptionally critical. The soil drought was extremely deep, threatening cereal crops in the first half of the season, especially maize and root crop plantations in the second half.
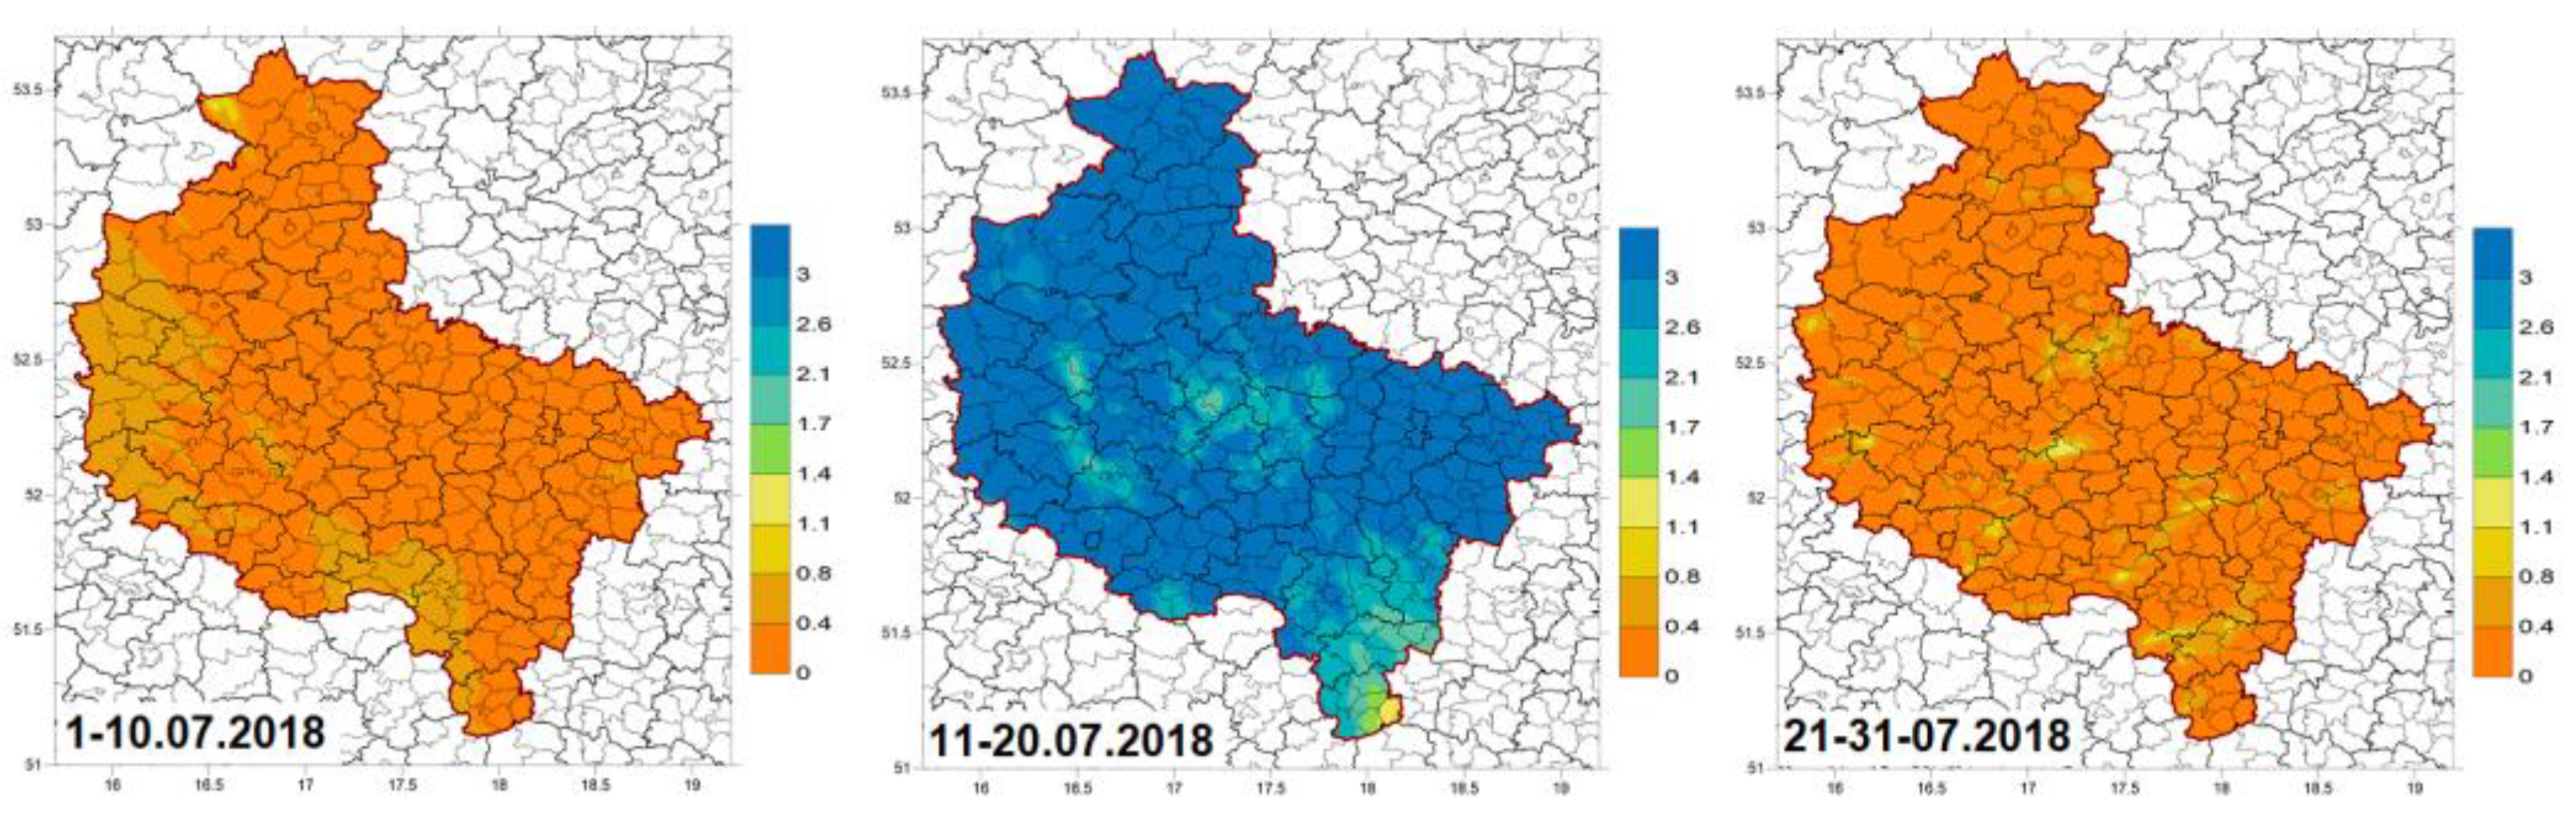
Periods of possible water shortages or excesses are also monitored using the hydrothermal coefficient (HTC). As it allows for the assessment of consecutive dry periods with a 10-day step, it enables the monitoring of conditions with a step sufficient for agrometeorological information service and the assessment of current meteorological conditions. It is usually calculated based on data from meteorological stations, while the use of high spatial resolution products (1 km × 1 km) developed at IMGW allows the assessment of the current situation on a very local scale. To calculate the HTC index, precipitation data from the RainGRS product and temperature data at 2 m from the analysis of the INCA nowcasting model [22], operationally used at IMGW-PIB, were used. The following example also shows how monitoring for shorter periods than a month is essential. The spatial distribution of HTC values in the different parts of July 2018 (Figure 7) shows very significant differences between these periods: extremely dry and very dry in the first ten days of the month, resulting from a lack of precipitation, extremely humid and very humid the second ten days as a result of heavy rains associated with a storm front and again extremely dry in the last ten days of the month. The last ten days of the month also showed locally slightly higher HTC values, resulting from local, minor showers.
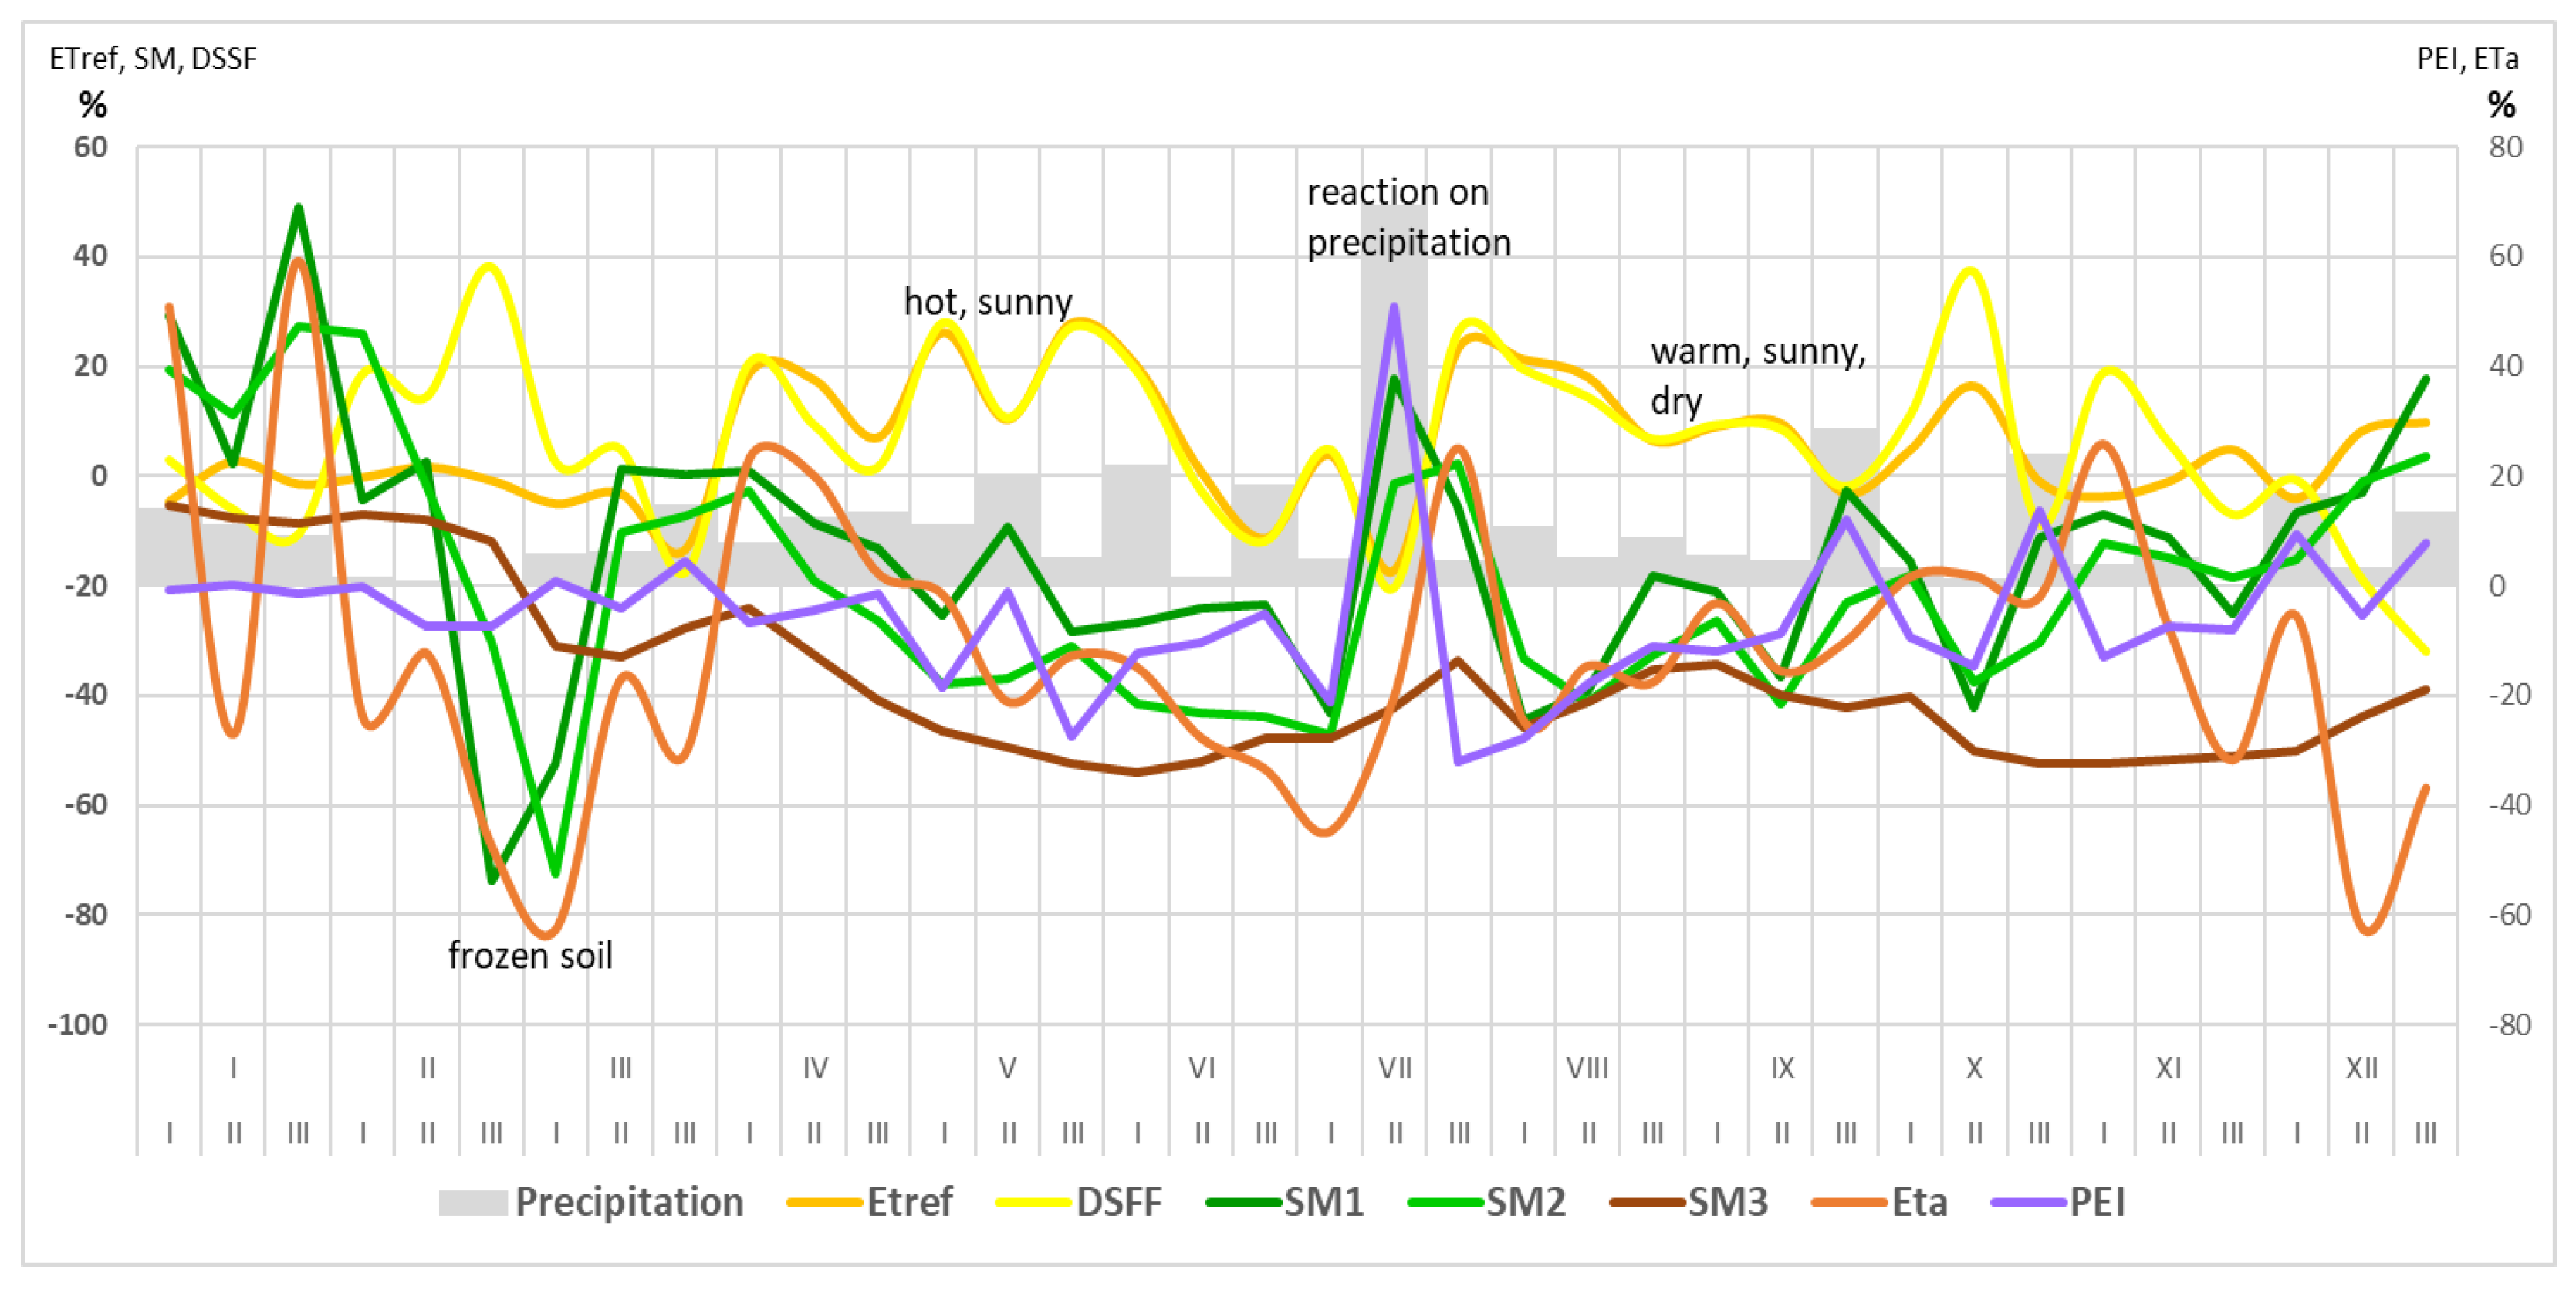
Ground and satellite data also make it possible to track the daily, ten-day, monthly or even seasonal or annual course of individual indices depicting the conditions of plant cultivation. The compilation of the entire spectrum of indices shows a picture of the situation period by period and information about both dry periods due to a lack of precipitation and wet periods, e.g., after heavy or prolonged rains. Particularly valuable is the analysis of the deviations of all indices from the multiannual means in relation to data, such as precipitation or air temperature. Figure 8 shows the course of anomalies of selected indices in relation to precipitation totals in 2018 for the Wielkopolskie Province. Considerable deviations from the long-term averages of soil moisture and actual evapotranspiration are visible in the winter due to the soil profile freezing. We then observe their rapid increase and return to average values after warming in early spring. The period of April, May, and June is characterised by a shortage of precipitation in beautiful and sunny weather, hence significant positive anomalies of insolation and reference evapotranspiration are observed, as well as gradually increasing negative deviations of soil moisture indexes, PEI or actual evapotranspiration. After the heavy rainfalls at the beginning of July, insolation decreases, but the values of indexes reporting soil moisture, actual evapotranspiration, and PEI increase. Subsequently, another period of warm, sunny, and dry weather causes a new development and deepening of the drought, which only begins to partially subside towards the end of the year.
4. Discussion
When conducting the agrometeorological information service, IMGW-PIB relies to a large extent on generally used indicators, also used in the majority of such services and advisory systems for farmers in the world, including Europe. Furthermore, like other agrometeorological services often developed in Europe by NHMSs, a very important part of the advisory system implemented at IMGW-PIB is the “Agrometeorological Bulletin”, which is issued on a monthly basis. A review of this type of publication for Europe [23] allows us to conclude that the satellite data act as a support for meteorological and hydrological services, especially in their activities of monitoring and forecasting the state of the atmosphere and hydrosphere and the modeling of a number of processes that are used widely. They are slightly less often presented and interpreted in products published in agrometeorological bulletins. Spatial distributions of the NDVI indicator are quite commonly presented, and sometimes soil moisture distributions are also based on satellite products. However, satellite data provide input to numerical models and often only the results of such modeling are published, supporting farmers in the process of irrigation, fertilization, or, for example, informing about forecasted yields. On the other hand, the Bulletins prepared at IMGW-PIB use all sources of information available at the Institute, publishing the spatial distribution of the most important indicators calculated using ground and satellite data in parallel on an ongoing basis. The advantage of such a presentation is not only better spatial resolution of a given product (e.g., temperature, precipitation or climatic water balance), but also the promotion of new types of information and tools among farmers in a way that is understandable to users. This last aspect was pointed out by, among others, Buontempo et al. [24], and Motha [25] before that, writing that it is not enough to provide users with a huge amount of data, because they are not able to use them without an appropriate application that facilitates their understanding and use in the decision-making process.
The uneven and not always sufficient spatial distribution of ground-based measuring stations often limits the possibility of the precise determination of both meteorological conditions and the vegetation state for a specific location. Insufficient spatial resolution often limits the possibilities of detailed assessment of agrometeorological parameters, for example at the scale of a single farm [26]. The importance of high-resolution environmental data in applications dedicated to the agricultural sector, both in local-scale and large-scale, is emphasized by many authors. Satellite data, the availability of which has increased enormously in recent years, plays an important role in detecting phenological stages, growing conditions and detecting anomalies in their course. Thus, they play a key role in drought monitoring, estimating possible deficits in biomass production, and in estimating future yields [27,28]. At the same time, the use of data obtained remotely in combination with ground-based weather data additionally gives the possibility of analyzing the quality and correctness of ground data, and if necessary correcting them [29], as well as supplementing one database through another. Satellite products are also a source of information on agrometeorological parameters that are not directly observed within ground measurement networks or whose measurement network is very rare (e.g., solar radiation, actual and potential evapotranspiration, LAI, soil moisture, etc.). This gap could be complemented by satellite data, allowing the estimation of a number of agrometeorological indicators necessary for the current and future assessment of vegetation [30]. All of these advantages of satellite data have been used in the agrometeorological information service conducted by IMGW. They are the basis for the assessment of the course of meteorological conditions and the vegetation status of crops presented in monthly agrometeorological bulletins, and are gradually enriched with further indicators. The RainGRS product developed at IMGW-PIB, estimating the amount of precipitation on the basis of ground measurements, meteorological radars and satellite data, is consistent with the recommendations of the World Bank in its assumptions, which draws attention to the possibility of filling in the gaps existing in the case of data from rain gauges and meteorological radars with satellite data [31]. Therefore, it seems right to simultaneously use all possible sources of information about the state of the environment, i.e., both ground and satellite data, which can enrich and improve the final agro-meteorological products, bringing great benefits both directly to farmers and indirectly to the economy as a whole [32].
The improvement in the quality and availability of satellite data combined with the progress that has been made and is still being made in the field of modelling allow for an accurate assessment of the current growing conditions and the condition of plants. This is also often the case for the much-awaited estimates of the course of a given growing season by farmers at the very beginning of it, or the issuing of warnings against adverse phenomena that may adversely affect the condition of crops well in advance, which was impossible a few dozen or even a dozen years ago [30].
However, when using satellite data, we also have to take into account some limitations and problems resulting from the methods of obtaining and sharing this data. The use of satellite remote sensing in agrometeorology, including the monitoring of drought processes, began with the NDVI vegetation index [33,34]. Based on AVHRR/NOAA and MODIS/Terra/Aqua data, more indicators were constructed, e.g.,: SAVI, EVI, NDWI, etc., [35,36,37,38] to better monitor the current state of vegetation, especially in remote, sparsely populated areas. However, this was the monitoring of effects, not causes. The development of precise farming required more information than just regional weather information. The development of satellite products for monitoring processes on the Earth’s surface (and thus causes) went in this direction, and numerical weather models were used for forecasting not only weather phenomena but also the parameters necessary for agriculture. There was particular interest in those parameters that have a direct impact on agricultural production: precipitation, temperature, insolation, actual and reference evapotranspiration, soil moisture and indices built on the basis of these parameters. Building increasingly dense ground measurement networks is costly and requires maintenance. Thus the increasing use of satellite remote sensing to determine these parameters. Of course, we must agree with the fact that remote sensing measurement only allows for the determination of the radiation reaching the satellite sensor in different spectral ranges depending on the instrument used (from ultraviolet to microwave), and the reconstruction of physical values measured on the ground requires a model, often using a range of information, including ground measurements. As a result, the accuracy of products based on satellite remote sensing is often a limitation that we must be aware of when using them [39,40,41]. Despite the much better spatial resolution compared to ground measurements, there are also limitations here. The products used in this analysis have a spatial resolution from 1 km (RainGRS), to 5–6 km (evapotranspiration) to 25 km (soil moisture index). The last parameter in particular, which in fact is subject to significant spatial variability, can be treated as an average value for a certain area, often similar in area to the smallest administrative units (municipality). The availability of satellite data depends on the time of the satellites pass overhead. In the case of products based on data from geostationary satellites, the daily product is generated from a series of measurements; while using polar satellites, especially with medium and high resolution sensors, the repetition time is extended up to several days. In the case of optical sensors and when monitoring the vegetation condition (e.g., NDVI), cloudiness is an important limitation, making it impossible to observe the Earth’s surface. In the case of active microwave sensors, which are used to monitor the surface moisture of the soil layer, the accuracy is limited by vegetation cover and possible intense precipitation, and the penetration depth is limited to 2–3 cm. Despite these limitations, satellite products are used to monitor drought processes, and sample analyses demonstrate their great usefulness [42,43,44,45].
5. Conclusions
The use of ground measurement data, products based on satellite data and products based on models combining ground and satellite data to monitor plant cultivation conditions, including the impact of the drought in 2018 on these conditions, was presented. The presented tool and method can be applied in the following areas: country, province, county and even municipality, due to the spatial resolution of the products used ranging from 1 to 25 km. Operationally available products allow for the generation of climatological averages from many years and the assessment of the current state as anomalies in relation to these averages, as shown in the final part of the study. The presented example from 2018, when a prolonged period of heat and shortage of precipitation caused agricultural drought and huge losses in the economies of a number of European countries [46,47], including Poland, shows a tool combining conventional meteorological observations with satellite data and models, allowing for the reduction in this threat, e.g., by irrigation, without resorting to economically unjustified decisions.
Although operational products do not have the same accuracy and stability as classic climatological data series do, nevertheless as they are available in near real time, they are currently the best tool for monitoring the current state and large deviations of this state from long-term averages, resulting from such threats to agriculture as, among others, drought or excessive rainfall. The new capabilities also provide high-resolution information from the Sentinel satellites, which can be used in the process of modelling both the water needs of plants in a given area and in estimating yields, providing a range of information necessary for decision-making in modern agriculture, including precision farming at the scale of farmland. They are also indispensable in increasingly popular applications aimed at estimating the amount of damage and losses caused by the occurrence of adverse meteorological phenomena.
However, it should be remembered that although climatic and meteorological conditions have a key impact on the condition of crops, the final size and quality of the crop is also determined by agrotechnical treatments carried out by farmers and their timeliness and quality of seeds, etc. [25]. Therefore, having unlimited information about the past, current and forecasted state of meteorological and hydrological conditions is extremely helpful in conducting agricultural activity, but the final effects obtained in the field of this production are also determined by the other activities mentioned above. It should be emphasized, however, that continuous further improvement of methods of sharing agrometeorological data, as in the form of systematically published bulletins, and combining data available from ground measurements with increasingly better satellite products turns out to be an indispensable condition for conducting modern agriculture in the conditions of progressive climate change.
Author Contributions
Conceptualization, M.K.-K. and P.S.; methodology, M.K.-K. and P.S.; software, P.S.; validation, M.K.-K.; formal analysis, M.K.-K. and P.S.; investigation, M.K.-K. and P.S.; data curation M.K.-K. and P.S.; writing—original draft preparation, M.K.-K. and P.S. All authors have read and agreed to the published version of the manuscript.
Funding
This research received no external funding.
Institutional Review Board Statement
Not applicable.
Informed Consent Statement
Not applicable.
Data Availability Statement
Data used in this study are available at: https://landsaf.ipma.pt, https://hsaf.meteoam.it.
Conflicts of Interest
The authors declare that they have no conflicts of interest.
References
- Christensen, J.H.; Hewitson, B.; Busuioc, A.; Chen, A.; Gao, X.; Held, I.; Jones, R.; Kolli, R.K.; Kwon, W.; Laprise, R.; et al. Regional Climate Projections. In Climate Change 2007: The Physical Science Basis, Contribution of Working Group I to the Fourth Assessment Report of the Intergovernmental Panel on Climate Change; Solomon, S., Qin, D., Manning, M., Chen, Z., Marquis, M., Averyt, K.B., Tignor, M., Miller, H.L., Eds.; Cambridge University Press: Cambridge, UK; New York, NY, USA, 2007; pp. 847–940. [Google Scholar]
- Kożuchowski, K.; Degirmendžić, J. Contemporary changes of climate in Poland: Trends and variation in thermal and solar conditions related to plant vegetation. Pol. J. Ecol. 2005, 53, 283–297. [Google Scholar]
- Żmudzka, E. The influence of circulation patterns on extreme thermal resources in the growing season and the period of active plant growth in Poland (1951–2006). Meteorol. Z. 2013, 22, 541–549. [Google Scholar] [CrossRef] [PubMed]
- Graczyk, D.; Kundzewicz, Z.W. Changes of temperature-related agroclimatic indices in Poland. Theor. Appl. Climatol. 2016, 124, 401–410. [Google Scholar] [CrossRef] [Green Version]
- Mager, P.; Kępińska-Kasprzak, M. Variability of selected climatic indices during vegetation period in Wielkopolska. Acta Agrophysica 2010, 183, 9–21. [Google Scholar]
- Fortuniak, K.; Kożuchowski, K.; Żmudzka, E. Trends and periodicity of changes in air temperature in Poland in the second half of 20th century. Przegląd Geofiz. 2001, 46, 283–303. [Google Scholar]
- Kędziora, A.; Kępińska-Kasprzak, M.; Kowalczak, P.; Kundzewicz, Z.W.; Miler, A.T.; Pierzgalski, E.; Tokarczyk, T. Risks resulting from water shortages. Nauka 2014, 1, 149–172. (In Polish) [Google Scholar]
- Stigter, C.J. Agrometeorological Services: Reaching All Farmers with Operational Information Products in New Educational Commitments. WMO CAgM Rep. 2011, 104, 37. [Google Scholar]
- Toulios, L.; Romaguera, M.; Stancalie, G.; Spiliotopoulos, M.; Struzik, P.; Calleja, E.; Tarquis, A.; Kępińska-Kasprzak, M.; Papadavid, G. How the Study of the Water Footprint of Agricultural Crops can Benefit from the Use of Satellite Remotely Sensed Data; Toulios, L., Struzik, P., Eds.; COST Garmond: Nitra, Slovakia, 2016; p. 147. [Google Scholar]
- Kępińska-Kasprzak, M.; Struzik, P. Agrometeorological service provided by Institute of Meteorology and Water Management—National Research Institute. Biol. Rhythm. Res. 2019, 50, 327–334. [Google Scholar] [CrossRef]
- Szwed, M. The elements of water balance in the changing climate in Poland. Adv. Meteorol. 2015, 2015, 149674. [Google Scholar] [CrossRef]
- Urban, G.; Kuchar, L.; Kępińska-Kasprzak, M.; Łaszyca, E.Z. A Climatic water balance variability during the growing season in Poland in the context of modern climate change. Meteorol. Z. 2022, 31, 349–365. [Google Scholar] [CrossRef]
- Chmist-Sikorska, J.; Kępińska-Kasprzak, M.; Struzik, P. Agricultural drought assessment on the base of Hydro-thermal Coefficient of Selyaninov in Poland. Ital. J. Agrometeorol. 2022, 1, 3–12. [Google Scholar] [CrossRef]
- Mocek, A.; Drzymała, S.; Owczarzak, W. Basics of Soil Analysis and Classification; Wydawnictwo Uniwersytetu Przyrodniczego w Poznaniu: Poznań, Poland, 2022; p. 484. (In Polish) [Google Scholar]
- Mocek, A. Pedology; Wydawnictwo Naukowe PWN: Warsaw, Poland, 2015; p. 589. (In Polish) [Google Scholar]
- Vicente-Serrano, S.M.; National Center for Atmospheric Research Staff (Eds.) The Climate Data Guide: Standardized Precipitation Evapotranspiration Index (SPEI). Modified 18 Jul 2015. Available online: https://climatedataguide.ucar.edu/climate-data/standardized-precipitation-evapotranspiration-index-spei (accessed on 21 November 2022).
- Jurczyk, A.; Szturc, J.; Otop, I.; Ośródka, K.; Struzik, P. Quality-Based Combination of Multi-Source Precipitation Data. Remote Sens. 2020, 12, 1709. [Google Scholar] [CrossRef]
- Eumetsat Land SAF. Product User Manual, Reference Evapotranspiration (DMETREF), Products: LSA-303 (DMETREF). Reference Number: SAF/LAND/IPMA/PUM_ETREF/1.1. 2016. Available online: https://nextcloud.lsasvcs.ipma.pt/s/4jtkEzDfbeQ4ywA (accessed on 18 November 2022).
- Eumetsat H-SAF. Product User Manual (PUM) for Product H14—SM-DAS-2, Soil Moisture Profile Index in the Roots Region by Scatterometer Data Assimilation. SAF/HSAF/PUM-14, Issue 1.1. 2012. Available online: https://hsaf.meteoam.it/Products/ProductsList?type=soil_moisture (accessed on 21 November 2022).
- Eumetsat Land SAF. Product User Manual, Down-Welling Surface Shortwave Flux (DSSF), Products: LSA-07 (MDSSF), LSA-08 (EDSSF), LSA-09 (DIDSSF). SAF/LAND/MF/PUM_DSSF/2.6v2, Issue Issue 2.6v2. 2011. Available online: https://nextcloud.lsasvcs.ipma.pt/s/Br2ME4yB2AWpMKb (accessed on 18 November 2022).
- Eumetsat Land SAF. Product User Manual, Vegetation Parameters (VEGA), Products: LSA-421 (MDFVC), LSA-422 (MTFVC), LSA-450 (MTFVC-R), LSA-423 (MDLAI), LSA-424 (MTLAI), LSA-451 (MTLAI-R), LSA-425 (MDFAPAR), LSA-426 (MTFAPAR), LSA-452 (MTFAPAR-R), Version 3.1. 2017. Available online: https://nextcloud.lsasvcs.ipma.pt/s/Fxsb9BagYyPTXps (accessed on 18 November 2022).
- Haiden, T.; Kann, A.; Wittmann, C.; Pistotnik, G.; Bica, B.; Gruber, C. The Integrated Nowcasting through Comprehensive Analysis (INCA) System and Its Validation over the Eastern Alpine Region. Weather. Forecast. 2011, 26, 166–183. [Google Scholar] [CrossRef]
- World AgroMeteorological Information Service. Available online: http://www.wamis.org/countries/europe.php (accessed on 8 January 2022).
- Buontempo, C.; Hutjes, R.; Beavis, P.; Berckmans, J.; Cagnazzo, C.; Vamborg, F.; Thépaut, J.N.; Bergeron, C.; Almond, S.; Amici, A.; et al. Fostering the development of climate services through Copernicus Climate Change Service (C3S) for agriculture applications. Weather. Clim. Extrem. 2020, 27, 100226. [Google Scholar] [CrossRef]
- Motha, R.P. Agrometeorological Bulletins. How can we improve them? In Improving Agrometeorological Bulletins, Proceedings of the Inter-Regional Workshop, Bridgetown, Barbados, 15–19 October 2001; AGM-5, WMO/TD No.1108; WMO: Geneva, Switzerland, 2002; pp. 13–24. [Google Scholar]
- Motha, R.P. Agrometeorological data management. WMO Bull. 1999, 48, 359–364. [Google Scholar]
- Eerens, H.; Haesen, D.; Rembold, F.; Urbano, F.; Tote, C.; Bydekerke, L. Image time series processing for agriculture monitoring. Environ. Model. Softw. 2014, 53, 154–162. [Google Scholar] [CrossRef]
- Atzberger, C. Advances in Remote Sensing of Agriculture: Context Description, Existing Operational Monitoring Systems and Major Information Needs. Remote Sens. 2013, 5, 949–981. [Google Scholar] [CrossRef] [Green Version]
- Malvern, S.F.; Maurice, C. Comparison of Satellite Data and Ground Based Weather Data in Masvingo, Zimbabwe. Int. J. Environ. Sci. Nat. Res. 2018, 8, 102–107. [Google Scholar] [CrossRef]
- Maracchi, G. The agrometeorological Information System—AgIS? In Improving Agrometeorological Bulletins, Proceedings of the Inter-Regional Workshop, Bridgetown, Barbados, 15–19 October 2001; AGM-5, WMO/TD No.1108; WMO: Geneva, Switzerland, 2002; pp. 275–291. [Google Scholar]
- Measuring Precipitation: On the Ground and from Space. Available online: https://olc.worldbank.org/sites/default/files/sco/E7B1C4DE-C187-5EDB-3EF2-897802DEA3BF/Nasa/chapter2.html (accessed on 8 January 2023).
- Stigter, C.J. From basic agrometeorological science to agrometeorological services and information for agricultural decision makers: A simple conceptual and diagnostic framework. Agric. For. Meteorol. 2007, 142, 91–95. [Google Scholar] [CrossRef]
- Kogan, F.; Sullivan, J. Development of Global Drought-Watch System Using NOAA AVHRR Data. Adv. Space Res. 1993, 13, 219–222. [Google Scholar] [CrossRef]
- Kogan, F.N. Droughts of the late 1980s in the United States as derived from NOAA polar-orbiting satellite data. Bull. Am. Meteorol. Soc. 1995, 76, 655–668. [Google Scholar] [CrossRef]
- Huete, A.R. A Soil-adjusted Vegetation Index (SAVI). Remote Sens. Environ. 1988, 25, 295–309. [Google Scholar] [CrossRef]
- Tarpley, J.D.; Schneider, S.R.; Money, R.L. Global vegetation indices from the NOAA-7 meteorological satellite. J. Clim. Appl. Meteorol. 1984, 23, 491–494. [Google Scholar] [CrossRef]
- Huete, A.; Didan, K.; Miura, T.; Rodriguez, E.P.; Gao, X.; Ferreira, L.G. Overview of the radiometric and biophysical performance of the MODIS vegetation indices. Remote Sens. Environ. 2002, 83, 195–213. [Google Scholar] [CrossRef]
- Gao, B.C. NDWI—A Normalized Difference Water Index for remote sensing of vegetation liquid water from space. Remote Sens. Environ. 1996, 58, 257–266. [Google Scholar] [CrossRef]
- EUMETSAT H-SAF. Product Validation Report (PVR-14) for Product H14 (SM-DAS-2) Soil Moisture Profile Index in the Roots Region by Surface Wetness Scatterometer Assimilation Method. 2012. Available online: https://hsaf.meteoam.it (accessed on 8 January 2023).
- EUMETSAT Land-SAF. Validation Report Evapotranspiration & Surface Fluxes (ET&SF v2) PRODUCTS: LSA-311 (MET V2), LSA-312 (DMET V2) LSA-304 (MH), LSA-305 (MLE), Issue 1.1. 2018. Available online: https://nextcloud.lsasvcs.ipma.pt/s/jaRTCRbmawjdrWX (accessed on 8 January 2023).
- EUMETSAT Land-SAF. Validation Report Reference Evapotranspiration METREF (LSA-303), Issue 1.1. 2018. Available online: https://nextcloud.lsasvcs.ipma.pt/s/obzyjcXf4N6aMPP (accessed on 8 January 2023).
- Land-SAF. Discrepancy between Reference Evapotranspiration and Actual Evapotranspiration as an Indicator of Water Deficit. Exam-ples of Romania, Bucovina and Slovenia, Nova Gorica for Years 2020 and 2013. Available online: https://landsaf.ipma.pt/en/news/news/discrepancy-between-reference-evapotranspiration-and-actual-evapotranspiration-as-an-indicator-of-water-deficit/ (accessed on 10 January 2023).
- Land-SAF. Monitoring of Vegetation Condition. Example of Drought Detection by Combining Precipitation, Vegetation Indices and Satellite Derived Evapotranspiration. Available online: https://landsaf.ipma.pt/en/news/news/introducing-a-new-drought-monitoring-indicator/ (accessed on 8 January 2023).
- Land-SAF. Satellite Derived Evapotranspiration Is Advantageous for Drought Detection. Analysing Drought Impact by Combining Evapotranspiration and Vegetation Signal. Available online: https://landsaf.ipma.pt/en/news/news/satellite-derived-evapotranspiration-is-advantageous-for-drought-detection/ (accessed on 8 January 2023).
- Fairbairn, D.; de Rosnay, P.; Puca, S.; Brocca, L.; Hahn, S. European Drought of Summer 2022. Available online: https://hsaf.meteoam.it/CaseStudies#95 (accessed on 8 January 2023).
- Bastos, A.; Ciais, P.; Friedlingstein, P.; Sitch, S.; Pongratz, J.; Fan, L.; Wigneron, J.P.; Weber, U.; Reichstein, M.; Fu, Z.; et al. Direct and seasonal legacy effects of the 2018 heat wave and drought on European ecosystem productivity. Sci. Adv. 2020, 6, 13. [Google Scholar] [CrossRef]
- Event Tracker. Available online: https://www.climate.gov/news-features/event-tracker/hot-dry-summer-has-led-drought-europe-2018 (accessed on 7 January 2023).
Figure 1.
Poland and the location of Wielkopolskie province with the localization of synoptic stations in the province.
Figure 1.
Poland and the location of Wielkopolskie province with the localization of synoptic stations in the province.

Figure 2.
Deviation of average monthly air temperatures [°C] in Poland in 2018, from the 1971–2000 mean.
Figure 2.
Deviation of average monthly air temperatures [°C] in Poland in 2018, from the 1971–2000 mean.

Figure 3.
Deviation of monthly precipitation totals [%] in Poland in 2018 from the 1971–2000 mean.

Figure 4.
Monthly totals of the Precipitation-Evapotranspiration Index for the growing season of (April–September) 2018, calculated using two methods: based on data from synoptic station (synop) and based on the RainGRS product and evapotranspiration from satellite data (sat).
Figure 4.
Monthly totals of the Precipitation-Evapotranspiration Index for the growing season of (April–September) 2018, calculated using two methods: based on data from synoptic station (synop) and based on the RainGRS product and evapotranspiration from satellite data (sat).

Figure 5.
Soil moisture index [%] in the 7–28 cm layer in the following months of the growing season (April–September) 2018.
Figure 5.
Soil moisture index [%] in the 7–28 cm layer in the following months of the growing season (April–September) 2018.

Figure 6.
Soil moisture index [%] in the 28–100 cm layer in the following months of the growing season (April–September) 2018.
Figure 6.
Soil moisture index [%] in the 28–100 cm layer in the following months of the growing season (April–September) 2018.

Figure 7.
Hydrothermal coefficient (HTC) values for individual 10-day periods in July 2018.

Figure 8.
Course of anomalies of selected indices relative to precipitation totals in Wielkopolskie Province in 2018. Etref: reference evapotranspiration, DSFF: down-welling surface short-wave radiation; SM1: soil moisture 0–7 cm; SM2: soil moisture 7–28 cm; SM3: soil moisture 28–100 cm; Eta: actual evapotranspiration, PEI: Precipitation-Evapotranspiration.

Disclaimer/Publisher’s Note: The statements, opinions and data contained in all publications are solely those of the individual author(s) and contributor(s) and not of MDPI and/or the editor(s). MDPI and/or the editor(s) disclaim responsibility for any injury to people or property resulting from any ideas, methods, instructions or products referred to in the content. |
© 2023 by the authors. Licensee MDPI, Basel, Switzerland. This article is an open access article distributed under the terms and conditions of the Creative Commons Attribution (CC BY) license (https://creativecommons.org/licenses/by/4.0/).
Share and Cite
MDPI and ACS Style
Kępińska-Kasprzak, M.; Struzik, P. Monitoring of Plant Cultivation Conditions Using Ground Measurements and Satellite Products. Water 2023, 15, 449. https://doi.org/10.3390/w15030449
AMA Style
Kępińska-Kasprzak M, Struzik P. Monitoring of Plant Cultivation Conditions Using Ground Measurements and Satellite Products. Water. 2023; 15(3):449. https://doi.org/10.3390/w15030449
Chicago/Turabian StyleKępińska-Kasprzak, Małgorzata, and Piotr Struzik. 2023. "Monitoring of Plant Cultivation Conditions Using Ground Measurements and Satellite Products" Water 15, no. 3: 449. https://doi.org/10.3390/w15030449
Note that from the first issue of 2016, this journal uses article numbers instead of page numbers. See further details here.