
Discriminant Analysis of Water Inrush Sources in the Weibei Coalfield, Shaanxi Province, China
by
 , ,
, ,
Weifeng Xue
1,2,*,
Enke Hou
1,
Xia Zhao
1 ,
,
Yong Ye
1,
Paraskevas Tsangaratos
3,
Ioanna Ilia
3 and
Wei Chen
1 1
College of Geology and Environment, Xi’an University of Science and Technology, Xi’an 710054, China
2
Shaanxi Coal and Chemical Technology Institute Co., Ltd., Xi’an 710065, China
3
Laboratory of Engineering Geology and Hydrogeology, Department of Geological Sciences, School of Mining and Metallurgical Engineering, National Technical University of Athens, 15780 Athens, Greece
*
Author to whom correspondence should be addressed.
Water 2023, 15(3), 453; https://doi.org/10.3390/w15030453
Submission received: 28 November 2022
/
Revised: 15 January 2023
/
Accepted: 18 January 2023
/
Published: 23 January 2023
(This article belongs to the Special Issue Risk Analysis in Landslides and Groundwater-Related Hazards)
Abstract
:Water inrush disasters in mining areas are one of the most serious geological disasters in coal mining. The purpose of this study is to study the establishment of a water chemical database and water inrush source discrimination model in the Weibei coalfield to provide the basis for regional hydrogeological conditions for future mining under pressure in the Weibei area, as well as a basis for the rapid identification of water inrush sources in the Weibei coalfield. In this paper, a conventional hydrochemical and trace element discrimination model for mine water inrush was established, and the hydrochemical characteristic files of the entire mining area were integrated. Based on 10 indicators, three hydrochemical discrimination models of rock stratum aquifers were established. Through the Mahalanobis distance test, it was found that the six selected variables, K+ + Na+, Mg2+, NH4+, Cl−, SO42−, and pH, have significant discrimination ability and good effect and can effectively distinguish the three main water inrush aquifers in the Weibei mining area. Then, the clustering stepwise discriminant analysis method was used to select 24 water samples and 14 trace element indicators from the conventional water chemistry test results. Based on principal component analysis, a principal component analysis discriminant model of trace elements was established for the four main aquifers. The accuracy and misjudgment rate of the Bayes multi-class linear discriminant using conventional ions as explanatory variables were 64.3% and 35.7%, respectively, showing a poor discriminant effect. On this basis, seven characteristic trace elements were analyzed according to Bayes multi-class linear discriminant analysis, the mutual influence and restriction relationship regarding the migration of these seven trace elements in the groundwater system of the mining area was determined, and the modified Bayes multi-class linear discriminant analysis model of trace elements for the water inrush source was established, which was more accurate than the conventional ion Bayes multi-class linear discriminant analysis model. The accuracy rate reached 92.9%. This research is of great significance for mine water-source identification and water-inrush prevention guidance.
1. Introduction
At present, with the rapid development of society and the economy, coal resources occupy an important position [1]; however, at the same time, the existence of hidden dangers, such as mine floods and the occurrence of accidents, restrict and hinder the safe production of mines. These have led to major disasters occurring in China [2,3,4]. After a water outburst, coal mines bear huge drainage costs [5]. In addition, mine water inrushes will also lead to a shortage of water resources and underground water pollution, which brings great risks to the safe use of water resources [6,7,8]. Mine inrushes will cause serious threats and losses to the economy and resource utilization [9,10,11]. Once a mine water inrush occurs, only by quickly and accurately identifying the source of the water inrush can targeted governance be carried out [5]. Seen from the actual situation of coal mine water disaster, although many new theories, methods, and technologies have been put forward in the prediction of coal mine water inrush, the serious and super large water inrush accidents have not been effectively curbed, which shows that the prediction of floor water inrush is far from the actual application.
For the Weibei mining area, there are difficulties in exploring the source of sudden water inflows. The conventional hydrochemical characteristics of the Taiyuan limestone aquifer and Ordovician limestone aquifer are similar. The groundwater quality in the mining area changes due to the mixing, overflow, and recharge of multiple water sources. The hydrogeological conditions of limestone aquifers are complex, karst development is uneven, strong runoff zones occur, water richness varies greatly, and the hydraulic connection is changeable. Geochemical exploration can identify hydrogeological conditions to a certain extent, as well as guide production and prevent water disasters.
With the deepening of the mining level, mining intensity and scale have also increased, and the frequency of water inrush has also increased. Therefore, it is imperative to control mine outbursts [5,12]. In recent years, a large number of ideas and methods have emerged for the identification of outburst water sources, such as feature component discrimination [13], the water chemical feature method [12,14,15,16], water temperature and water level discrimination [17], and geophysical exploration [17,18]. Among them, the water chemical feature method is the most widely used in water source identification due to its advantages of economy, efficiency, and high accuracy [5,19,20], and it can provide an important basis for mine water control. Judging from the change in water volume, there is generally a process from quantitative change to qualitative change from “wet gang → dripping water → water spraying → flowing water → water inrush”. Each aquifer in the mining area has different water chemistry characteristics [21,22]. Therefore, according to the characteristics of water chemical ion components, a mathematical statistical method can be used to build a water source discrimination model. Common water source discriminant models include gray correlation [16,23], the fuzzy comprehensive evaluation method [17,24], cluster analysis [13,15,17,25,26], discriminant analysis [2,16,18,25,27], and BP neural network discrimination [16]. However, in recent decades, this research has been based on the mathematical statistical methods used to build water-discriminative models, ignoring the similarity between outbursts and the chemical control mechanism of each water-bearing layer [5]. By studying the similarity between the water chemical control mechanism, it is possible to determine whether the water chemical properties of different water layers are similar and, to a certain extent, judge the hydraulic connection between different water layers. Knowing the changes in water connections in advance can prevent mine water inrushes [16]. Even if mine water inrush is discovered, looking at the similarities in the water chemical mechanism, we can quickly obtain the source of water inrush for governance through a comparison between the water inrush. Therefore, the comparative analysis of hydrochemical types, identification of hydrochemical components, and comprehensive mathematical analysis of hydrochemical components can be used to supplement the detection of water inrush sources and allow for the early warning regarding water inrush.
This paper takes the regional water outburst in Weibei coalfield, Shaanxi Province, as the research background. Based on the changes in water sample data from regular observation holes, downhole outbursts, water sample data from water inflow points, conventional hydrochemical test data, and ICP-MS data, the regional groundwater hydrogeological conditions, hydrogeochemical characteristics of the mining area, and establishment of hydrochemical characteristics files were obtained. The discriminant mode, considering the similarities between the water inrush and the chemical control mechanism of each aquifer, can be used to identify the source of water inrush in the Weibei coalfield area.
2. Materials and Methods
2.1. Study Area
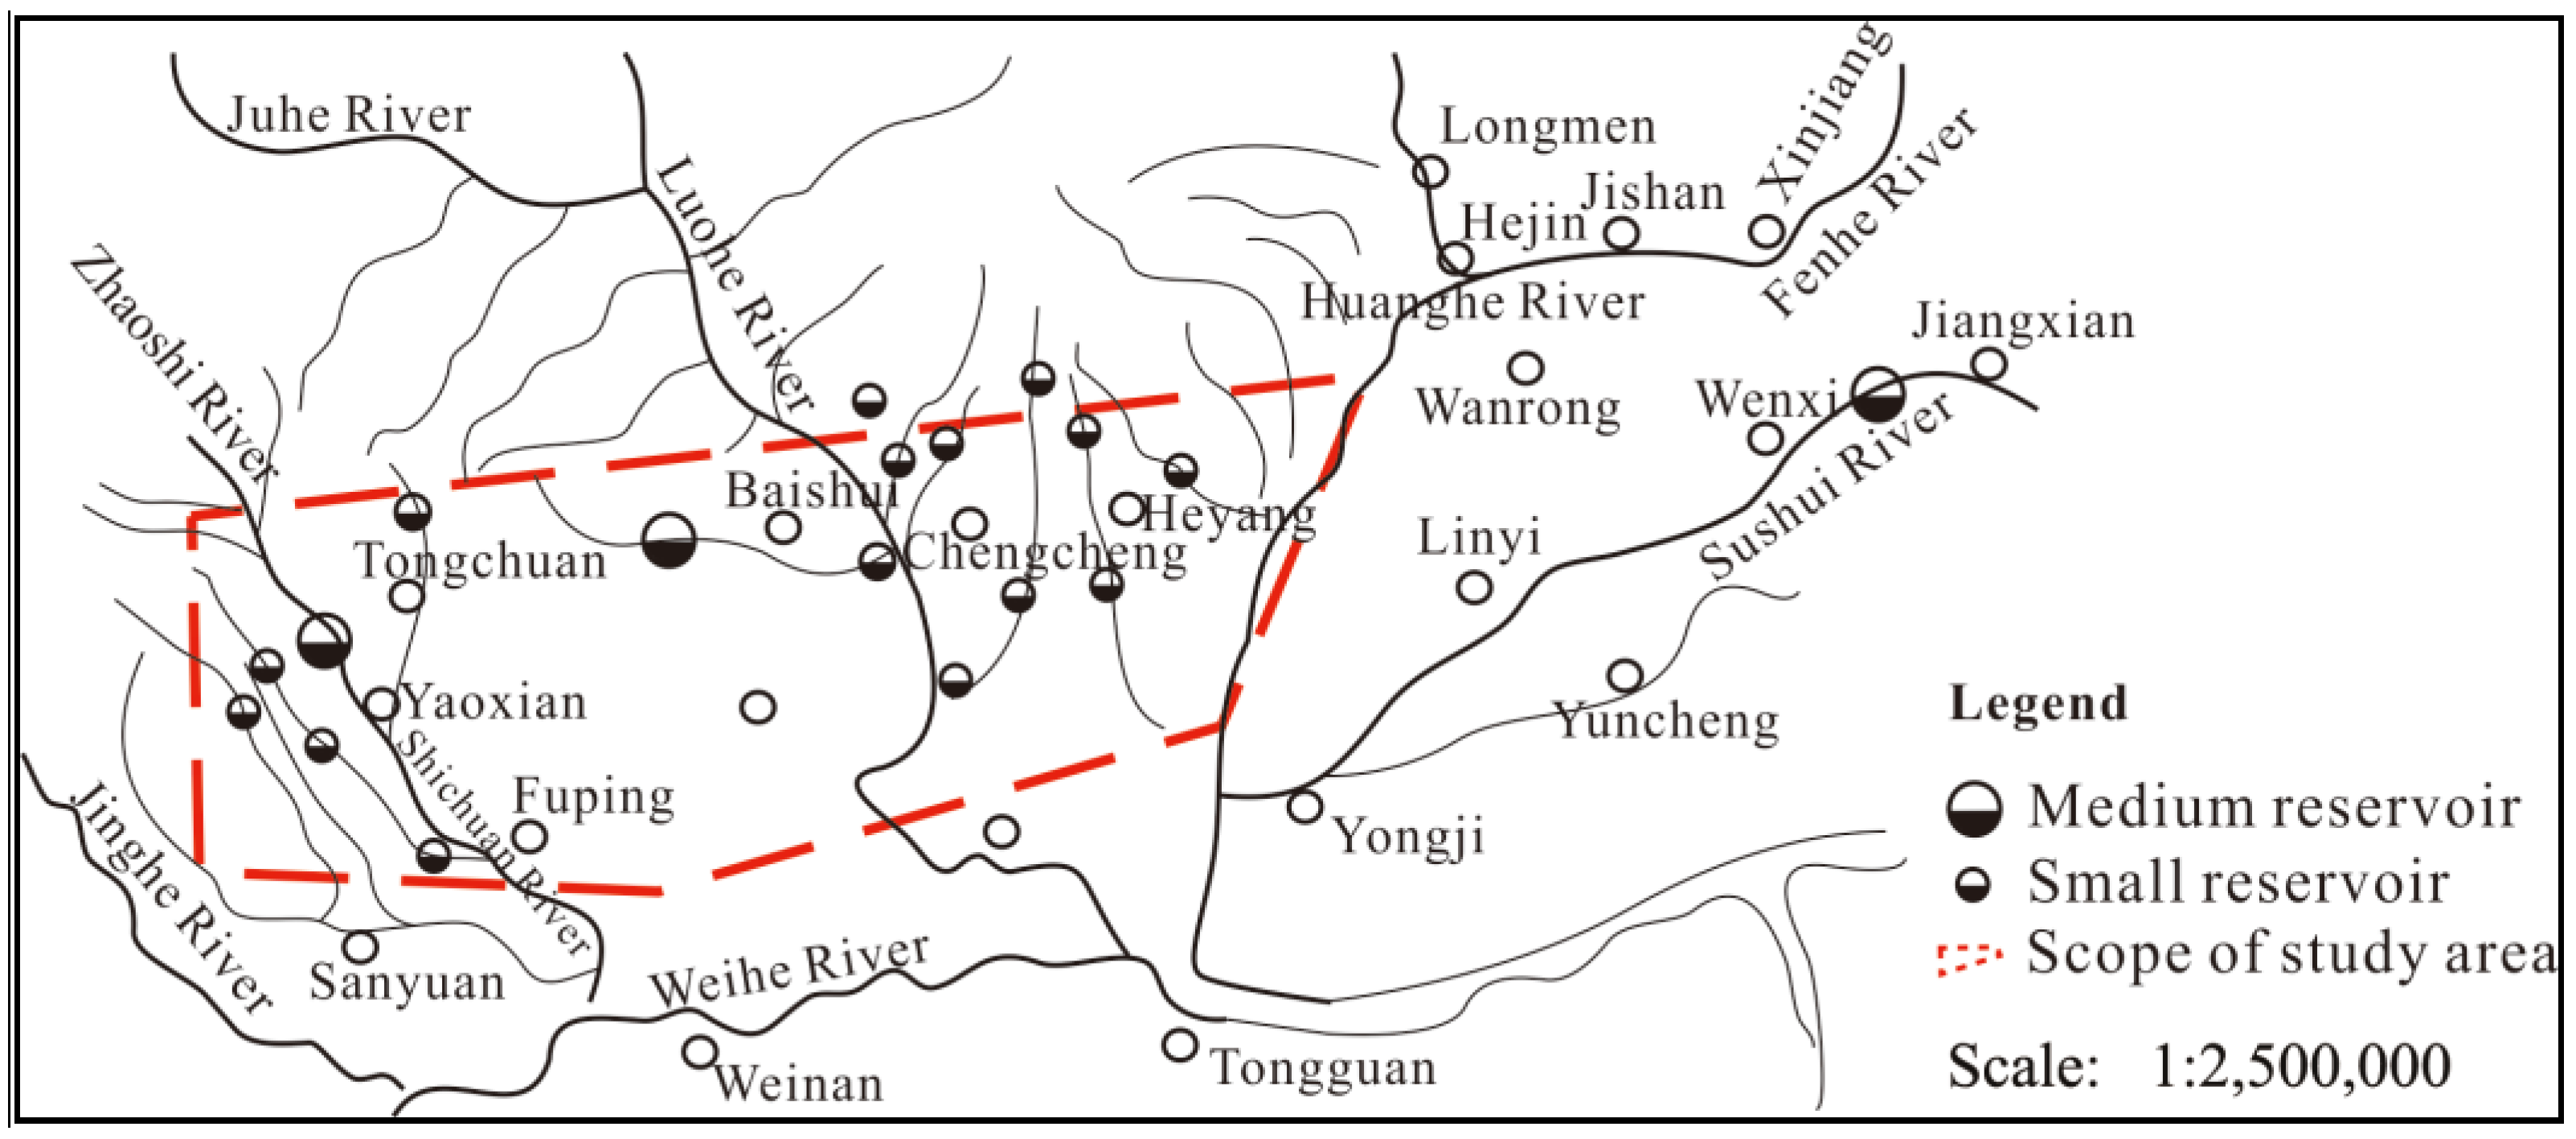
Weibei refers specifically to Baoji in the west, the Yellow River in the east, the Weihe Plain in the south, and the hilly and gully area of the Loess Plateau in the north (Figure 1). The terrain of the study area is high in the north and low in the south, with an altitude of 340–1200 m. The rivers in the area belong to the Yellow River system, and the flow in the dry season and the flood season is very different. The study area has a warm, temperate, semi-humid, continental monsoon climate. The study area is located in the transition zone between the Ordos platform syncline (Shaanxi-Gansu-Ningtai platform) and the Fenwei fault depression in the Sino-DPRK block. In the study area, most of the karst aquifers are covered by tertiary and quaternary loose rocks or buried by Carboniferous and Permian clastic rocks. In the section where carbonate rocks are directly covered by loose deposits of the Quaternary system, such as loess, atmospheric precipitation recharges karst water through the loose layers.
2.2. Data Acquisition
According to the distribution of stratigraphic lithology and aquifer occurrence space in the Weibei mining area, there are four main water inrush aquifers in the mining area: the Quaternary loose rock aquifer, Permian sandstone fissure aquifer, Carboniferous sandstone (limestone) fissure aquifer and Ordovician limestone karst fissure aquifer. The four major water inrush aquifers were mainly sampled.
2.2.1. Occurrence of the Four Aquifers
Quaternary Loose Rock Aquifers
The total thickness of the fourth series of loose rocks in the Weibei mining area is 0~216.9 m, and the average thickness is about 100 m, which is not integrated and covers the strata of each era. Its lithology is loess, fine sand, and gravel from top to bottom (Table 1). It is mainly found in the alluvial gravel layer of the fourth series loess layer and the banks of river valleys. Due to the control of topography and recharge conditions, the groundwater level and degree of water richness in the area are different, and the general loess plateau has a deep water level and a lack of water. In low-lying areas on the surface or on both sides of the river valleys, the water level is buried at a shallow depth, and the amount of water is relatively high. Most water-rich areas are distributed in bands along the valley terraces, which directly receive atmospheric precipitation recharge and have a complementary relationship with the surface water. When the coal seam is buried shallowly, and the water diversion cracks generated by coal mining penetrate this, the water inflow of the pit also increases.
Permian Sandstone Fractured Aquifers
The Permian section of the Weibei mining area comprises the Shanxi Formation, Lower Shihe Formation, Upper Shihe Formation, and Shiqianfeng Formation. The lithology of this system is mainly composed of mudstone, sandy mudstone, and sandstone of various grain sizes (Table 2).
Carboniferous and Ordovician Sandstone (Limestone) Fractured Aquifers
Carboniferous sandstone (limestone) fissure aquifer is 10~80m thick and is divided into Taiyuan Formation and Benxi Formation (Table 3). There were several water outlets, mostly in the conglomerate aquifer of Benxi Formation. The characteristics of water inflow are basically the same as the limestone of Taiyuan Formation. The Ordovician limestone karst fissure aquifer has undergone many structural destruction actions, and the rock strata are vertical, inverted, folded, fractured, and the karst fissures are developed, which creates good conditions for the storage and migration of groundwater. It is composed of a relative aquiclude section and several aquifer sections, and has a unified water level elevation. It is a heterogeneous composite confined aquifer with a multi-layer structure. Groundwater is characterized by the coexistence of dynamic and static reserves.
2.2.2. Sampling
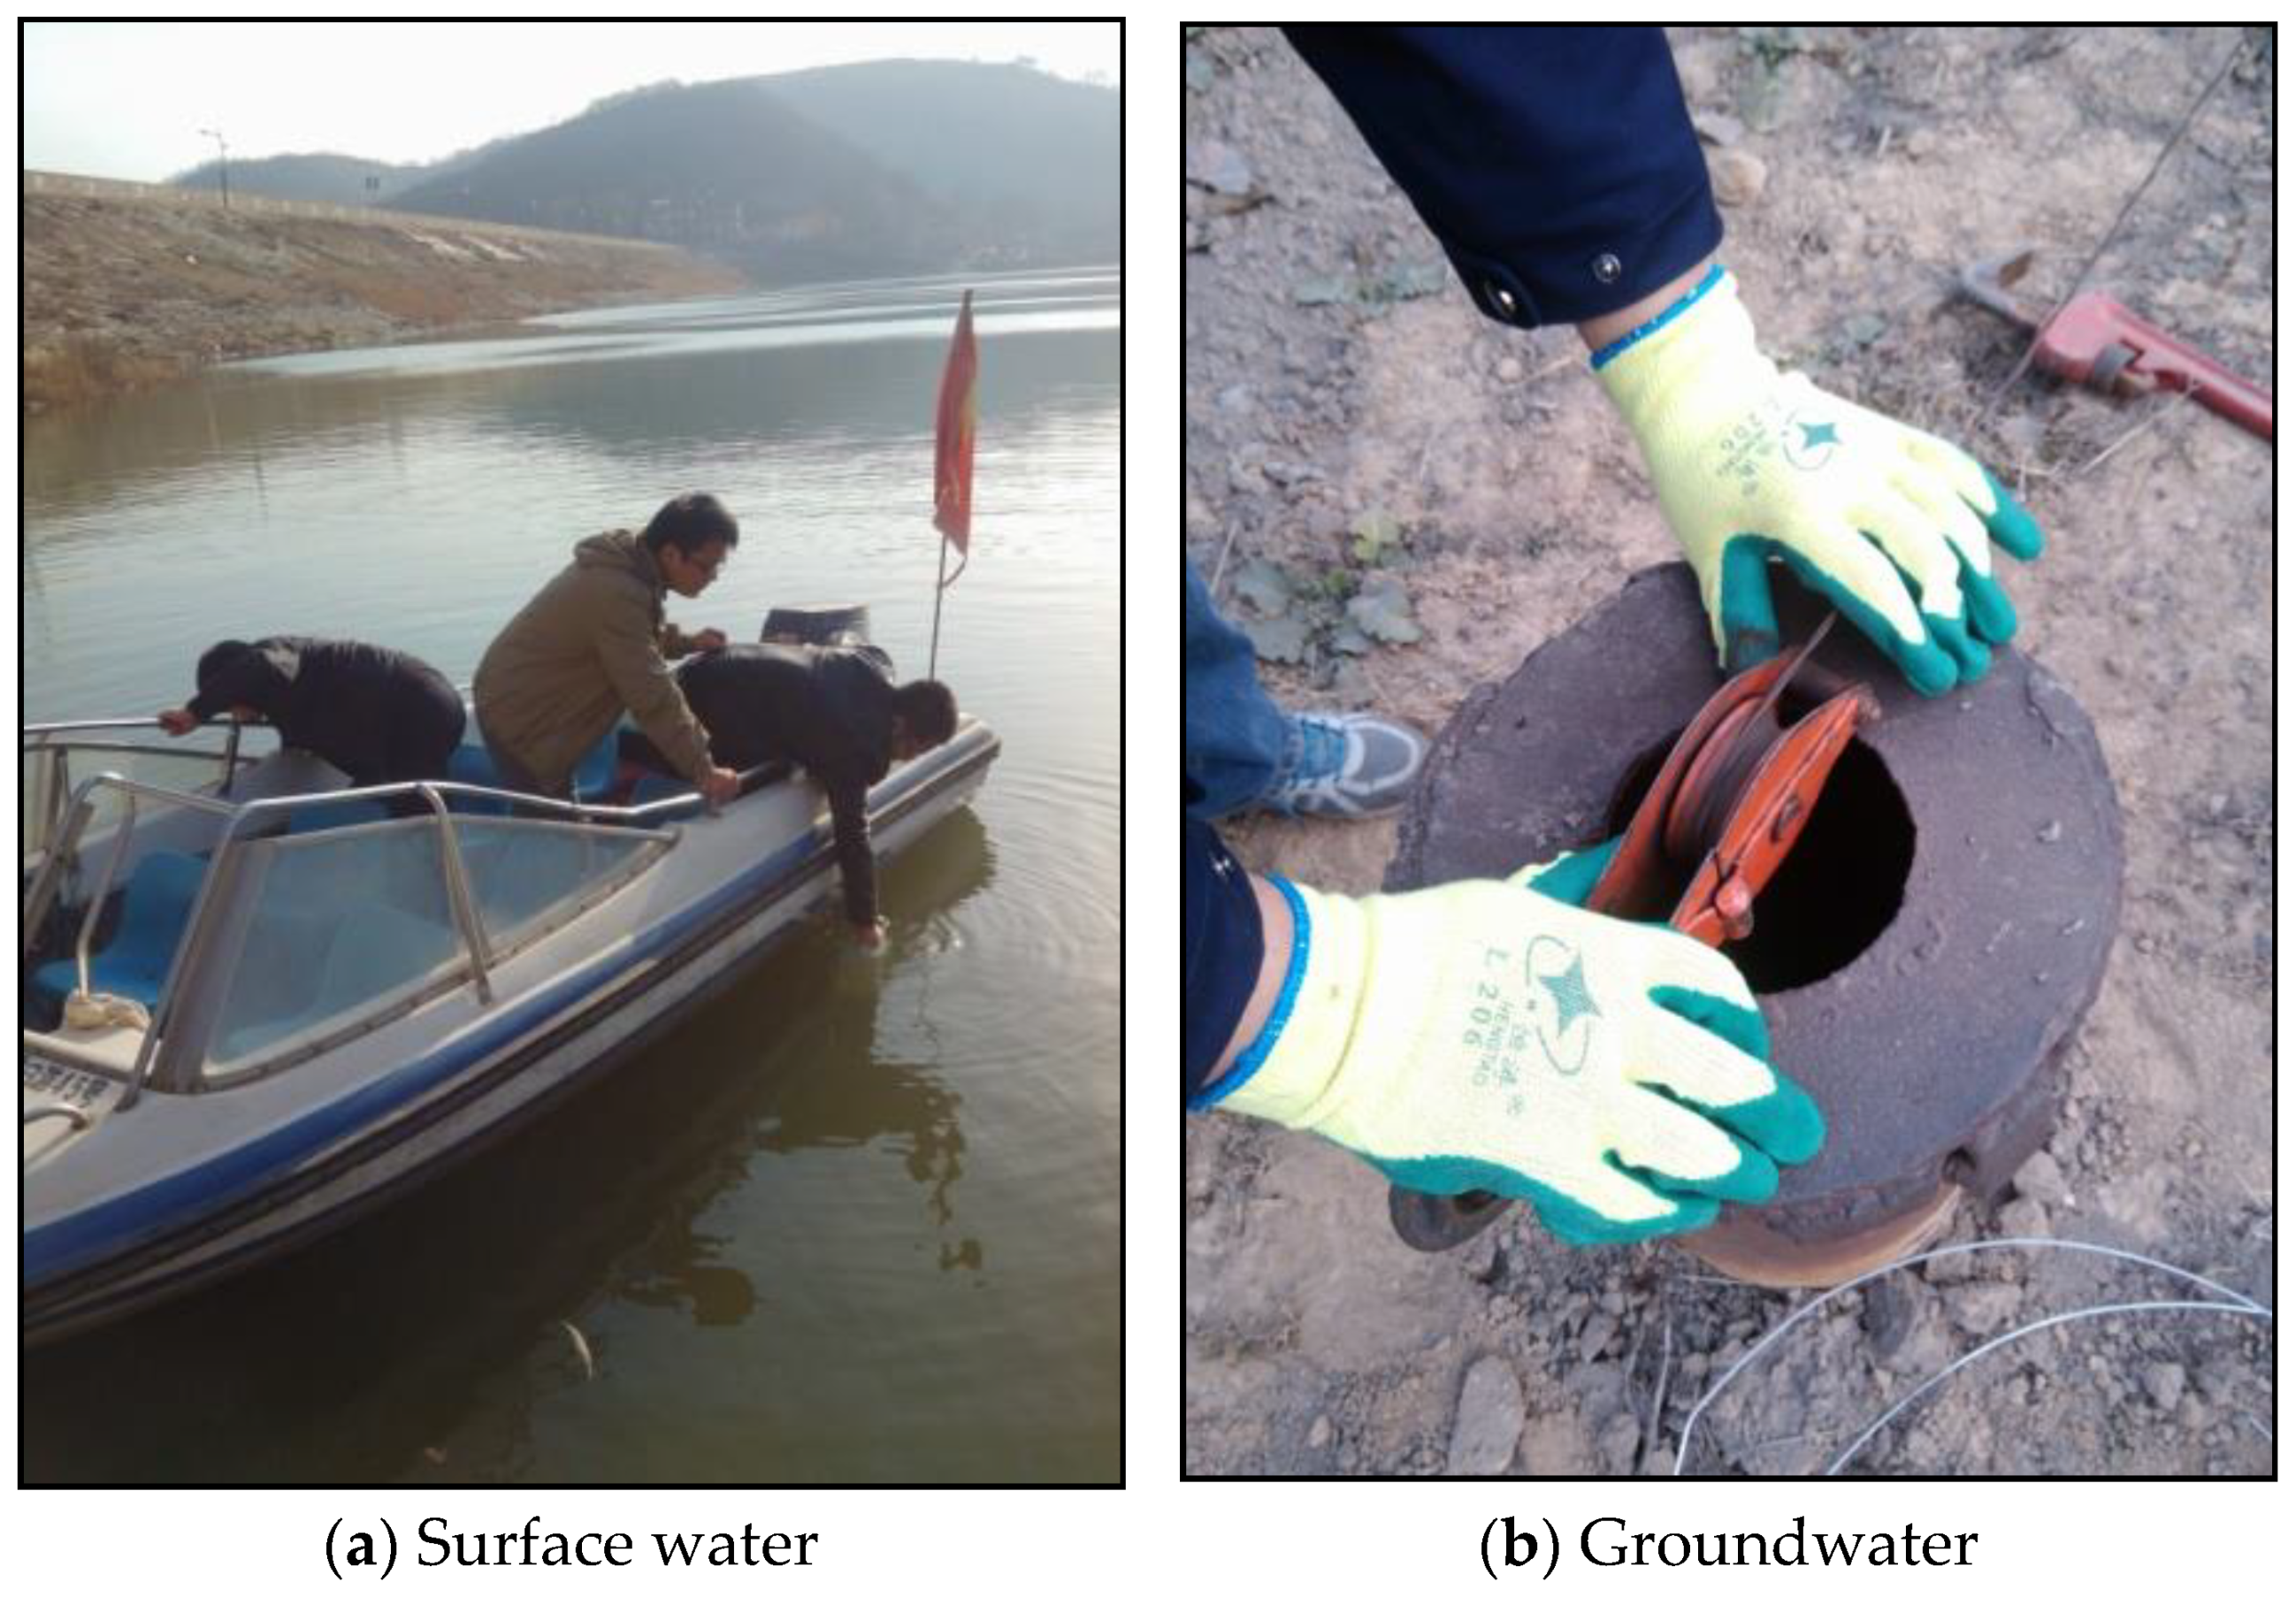
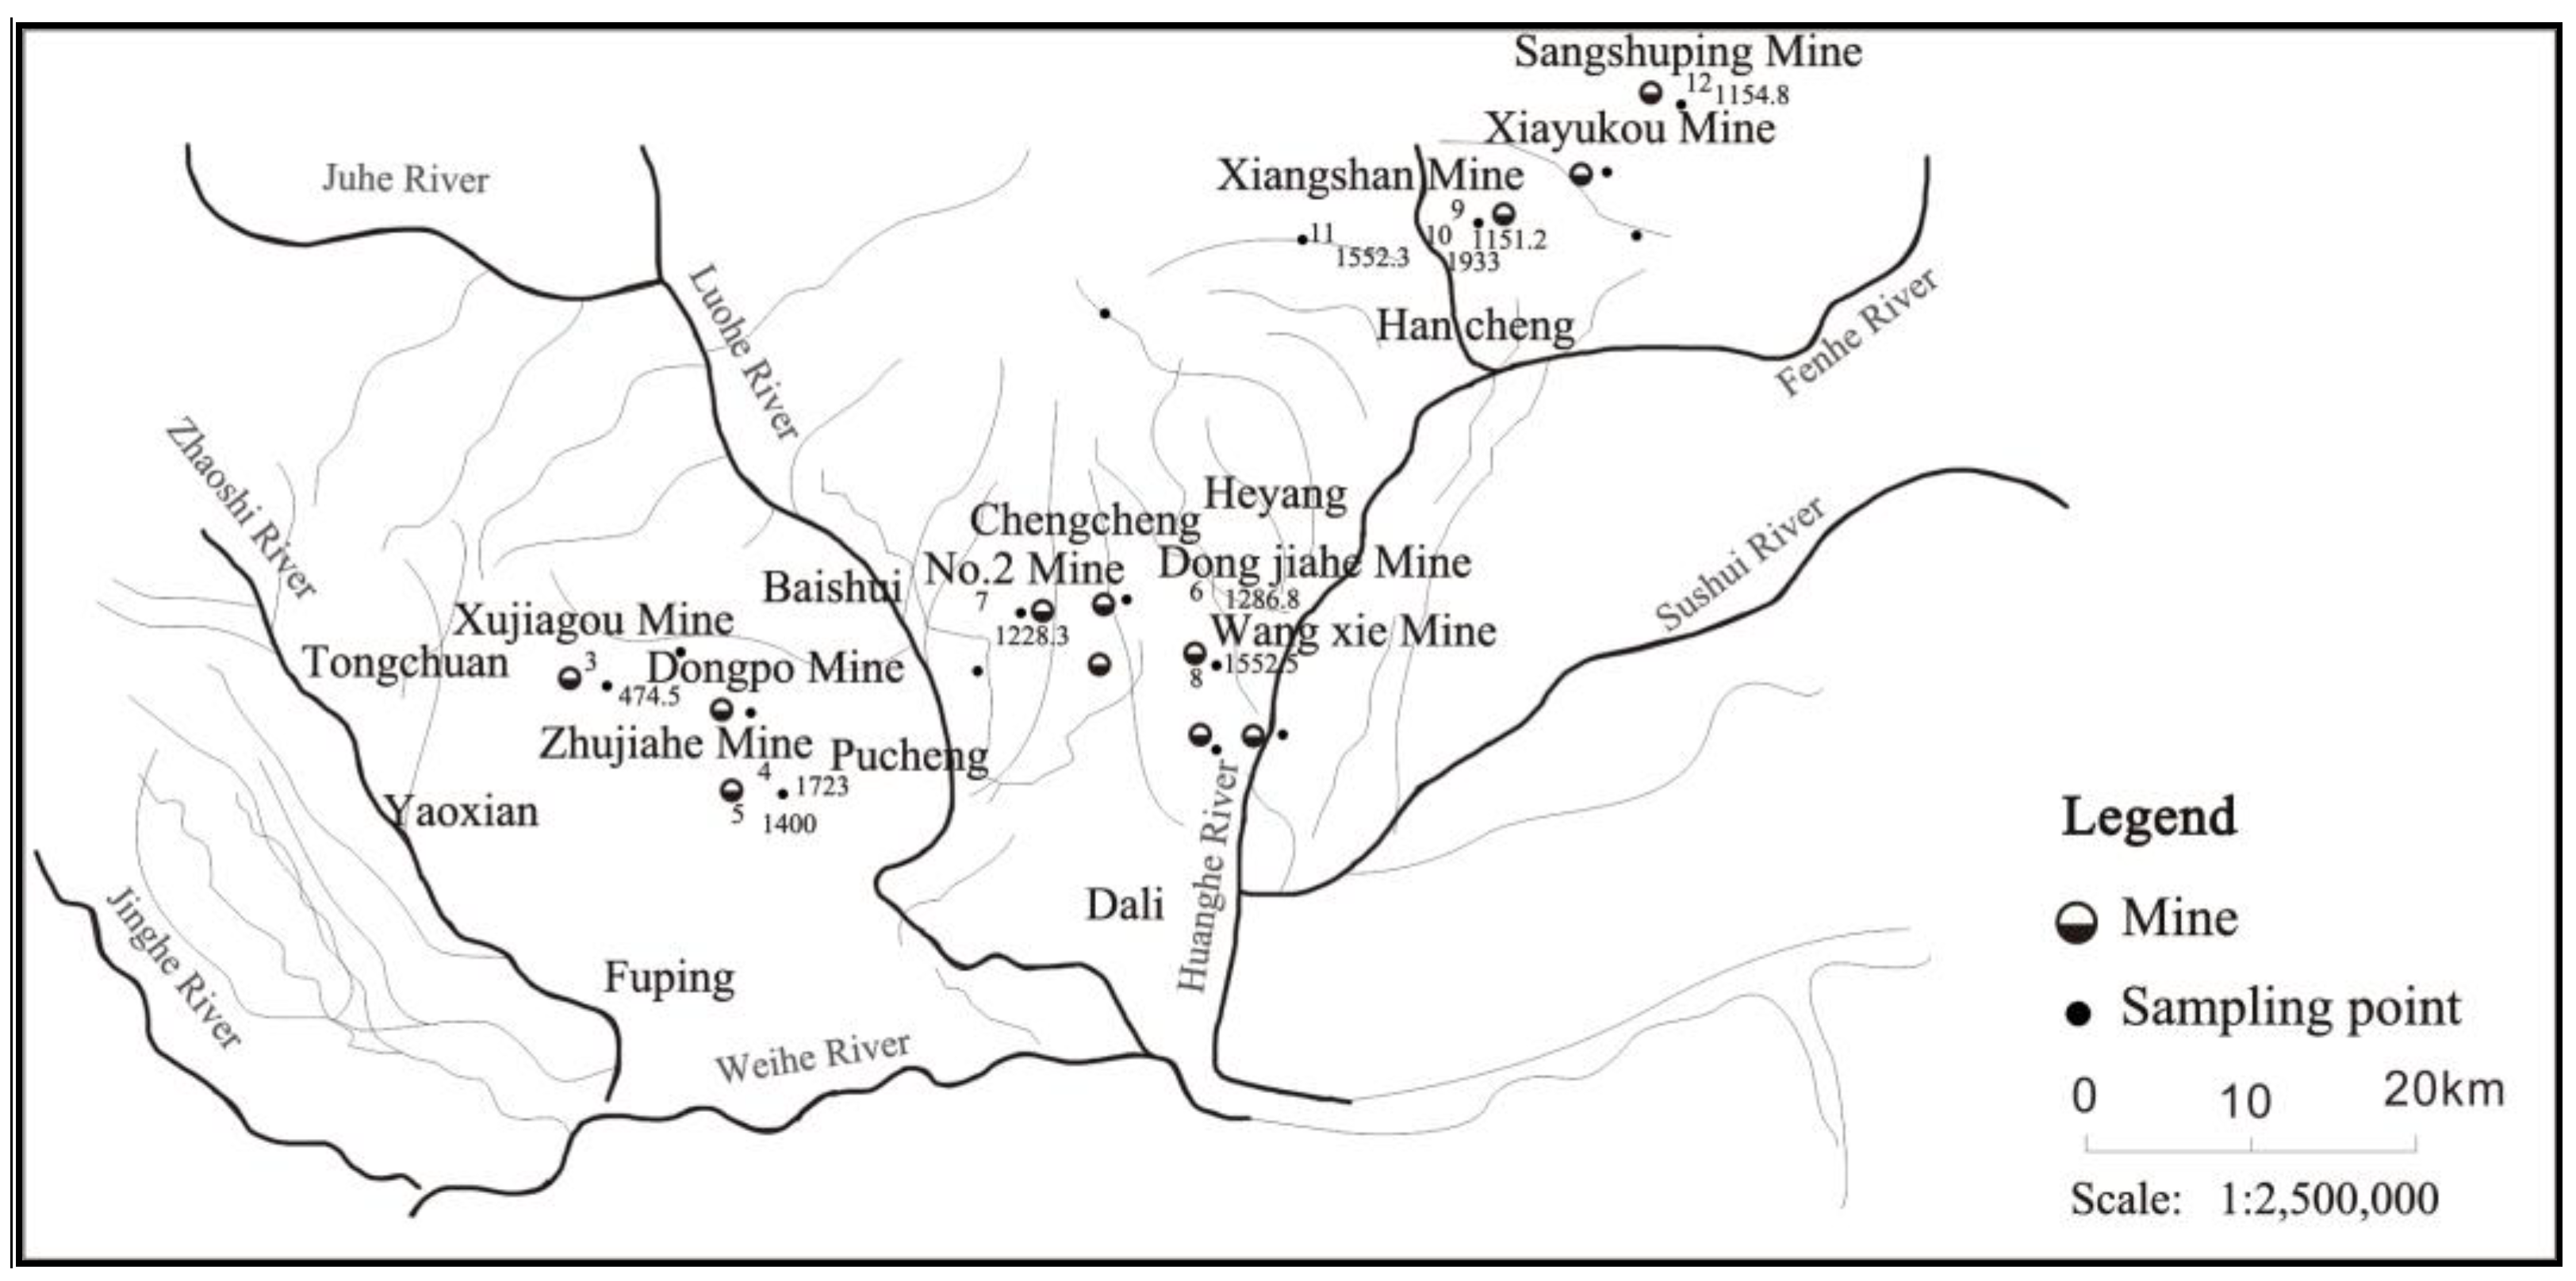
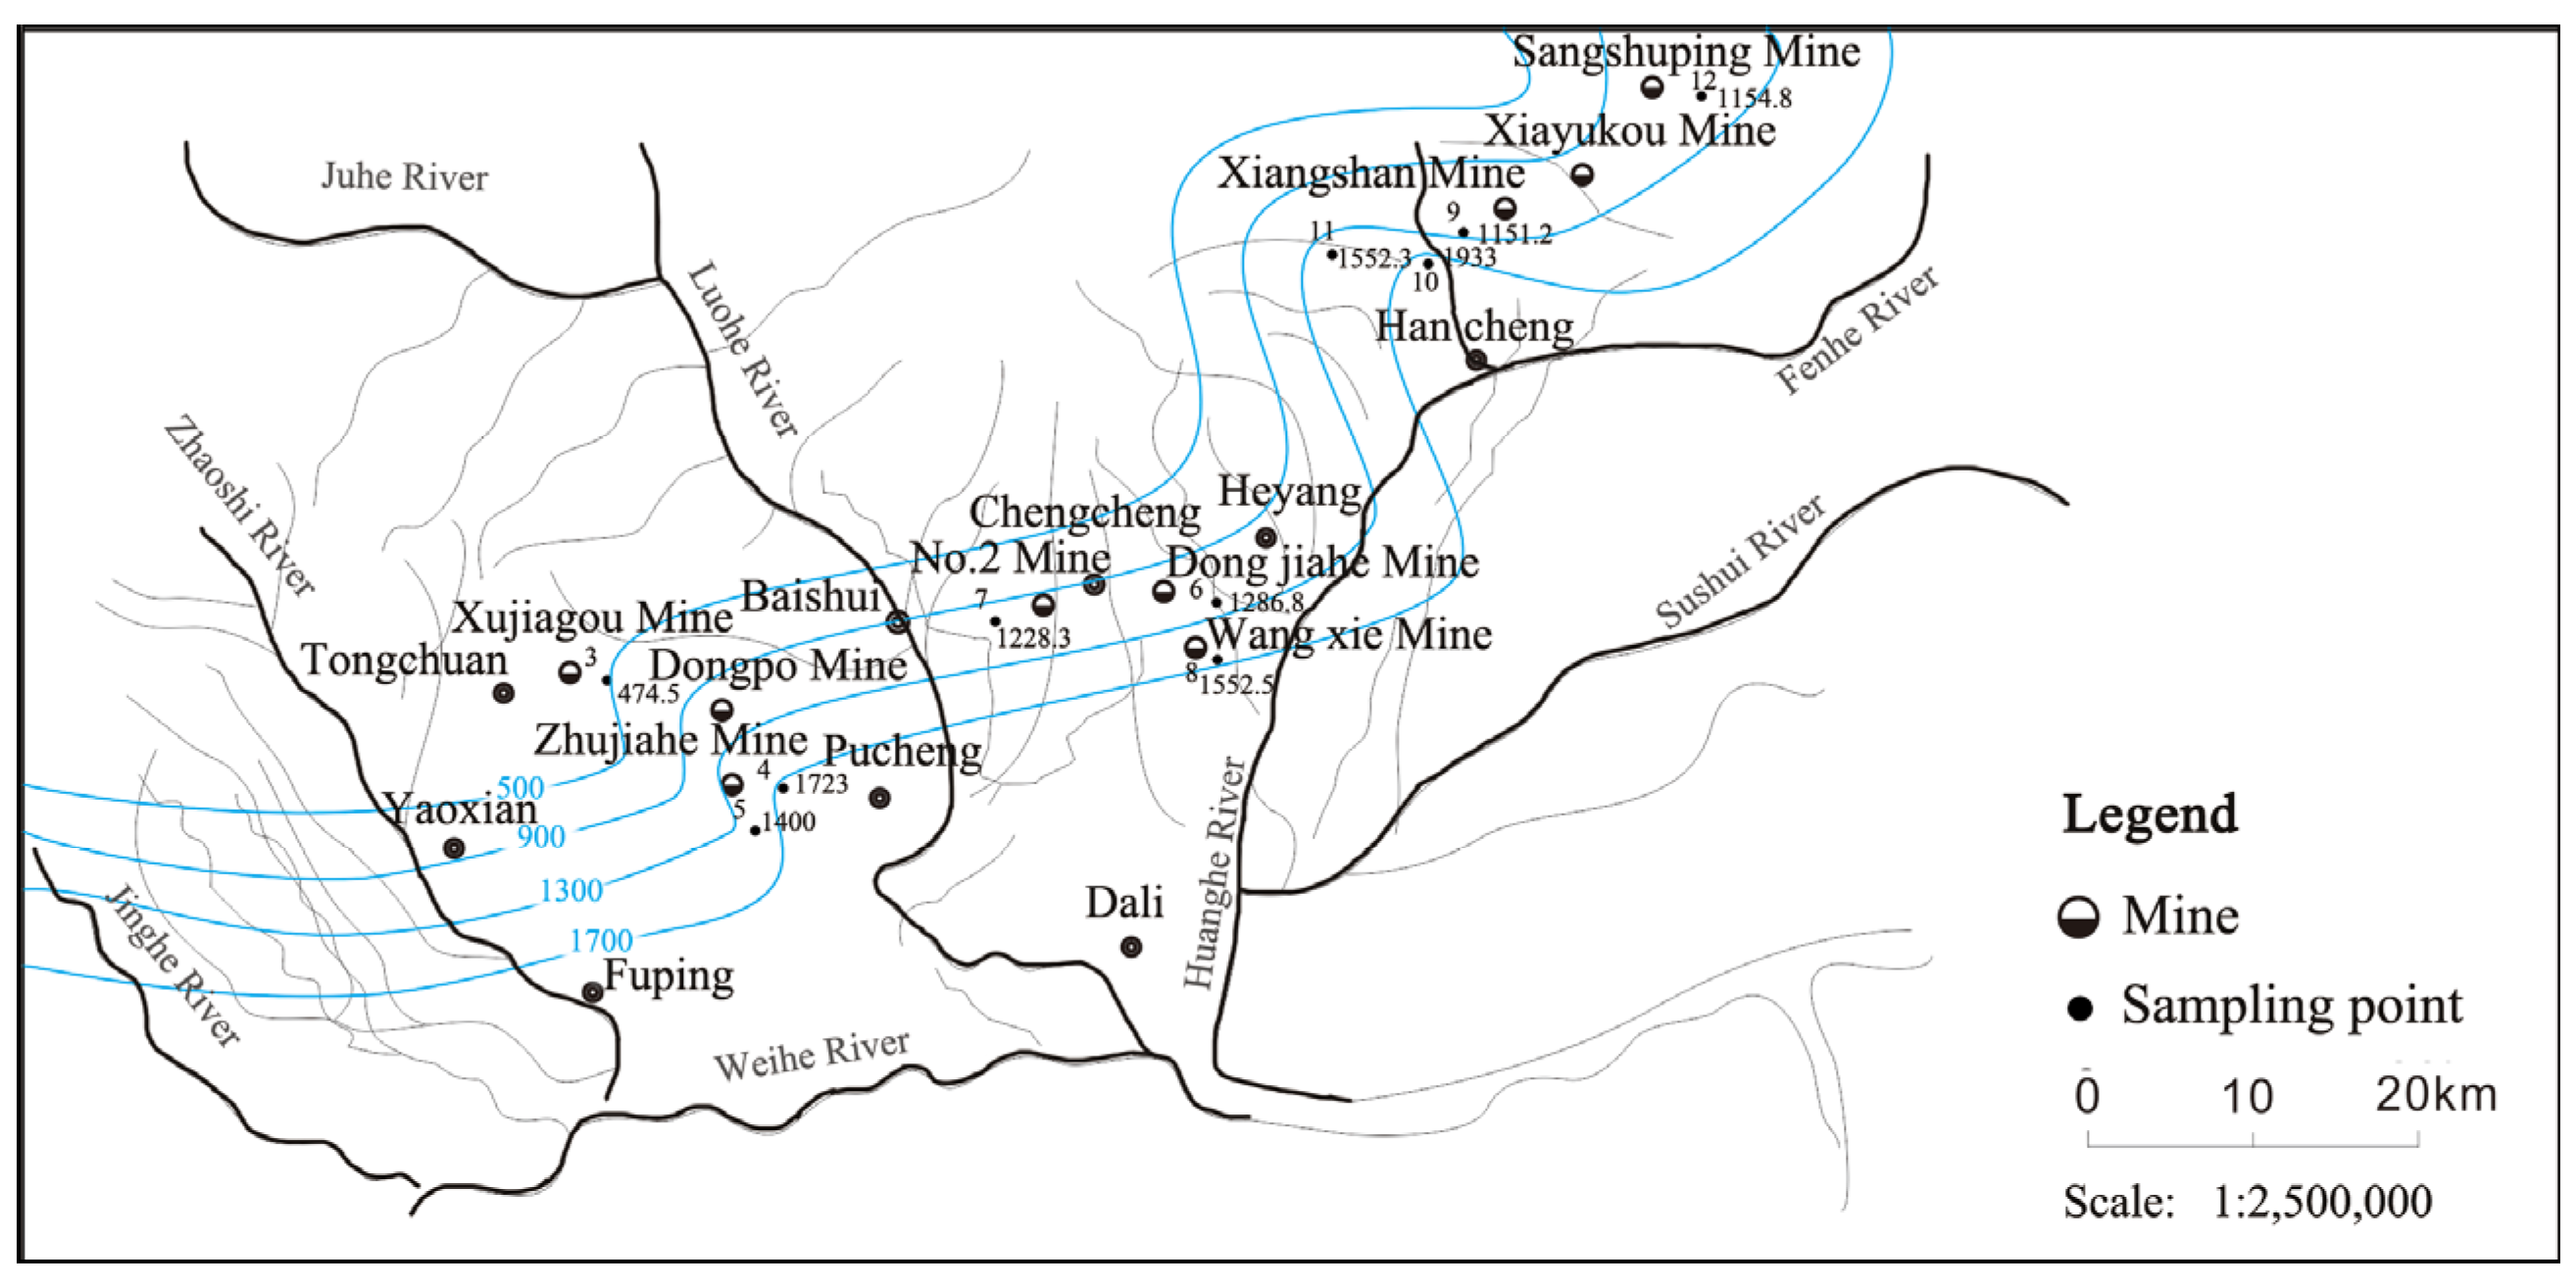
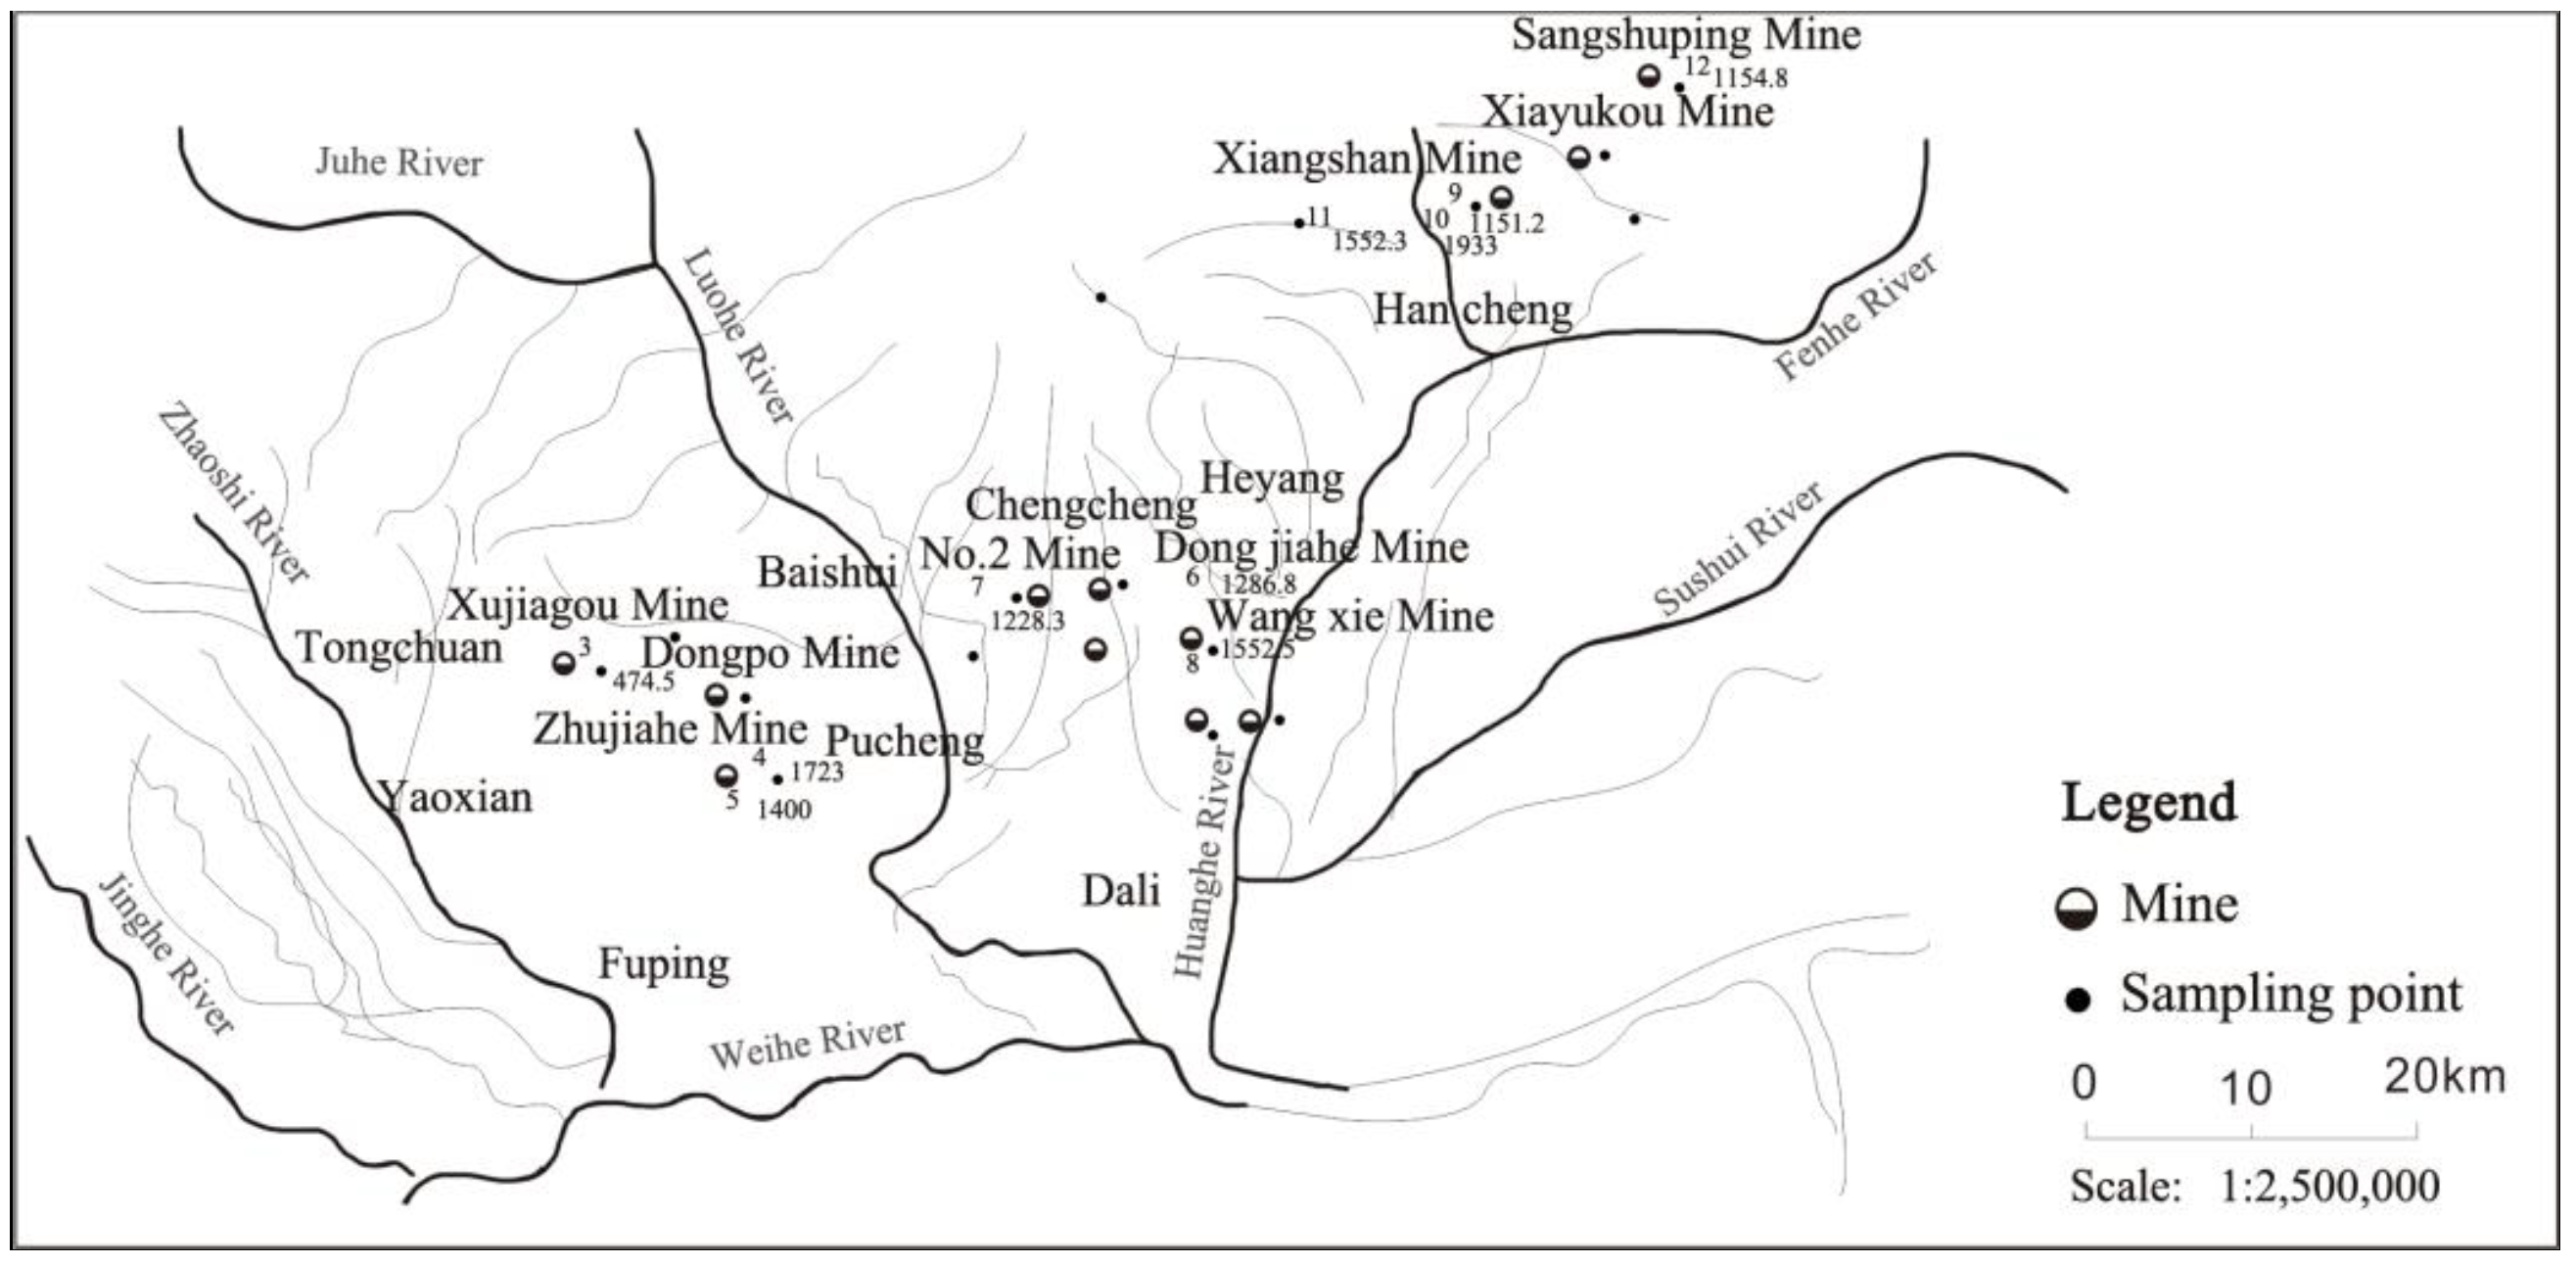
In the Weibei mining area, 61 sampling points were arranged, and 61 groups of water samples were collected (Figure 2 and Figure 3). These included the main production shafts of the four mining areas, surface water system, long-term observation well, civil well, etc.
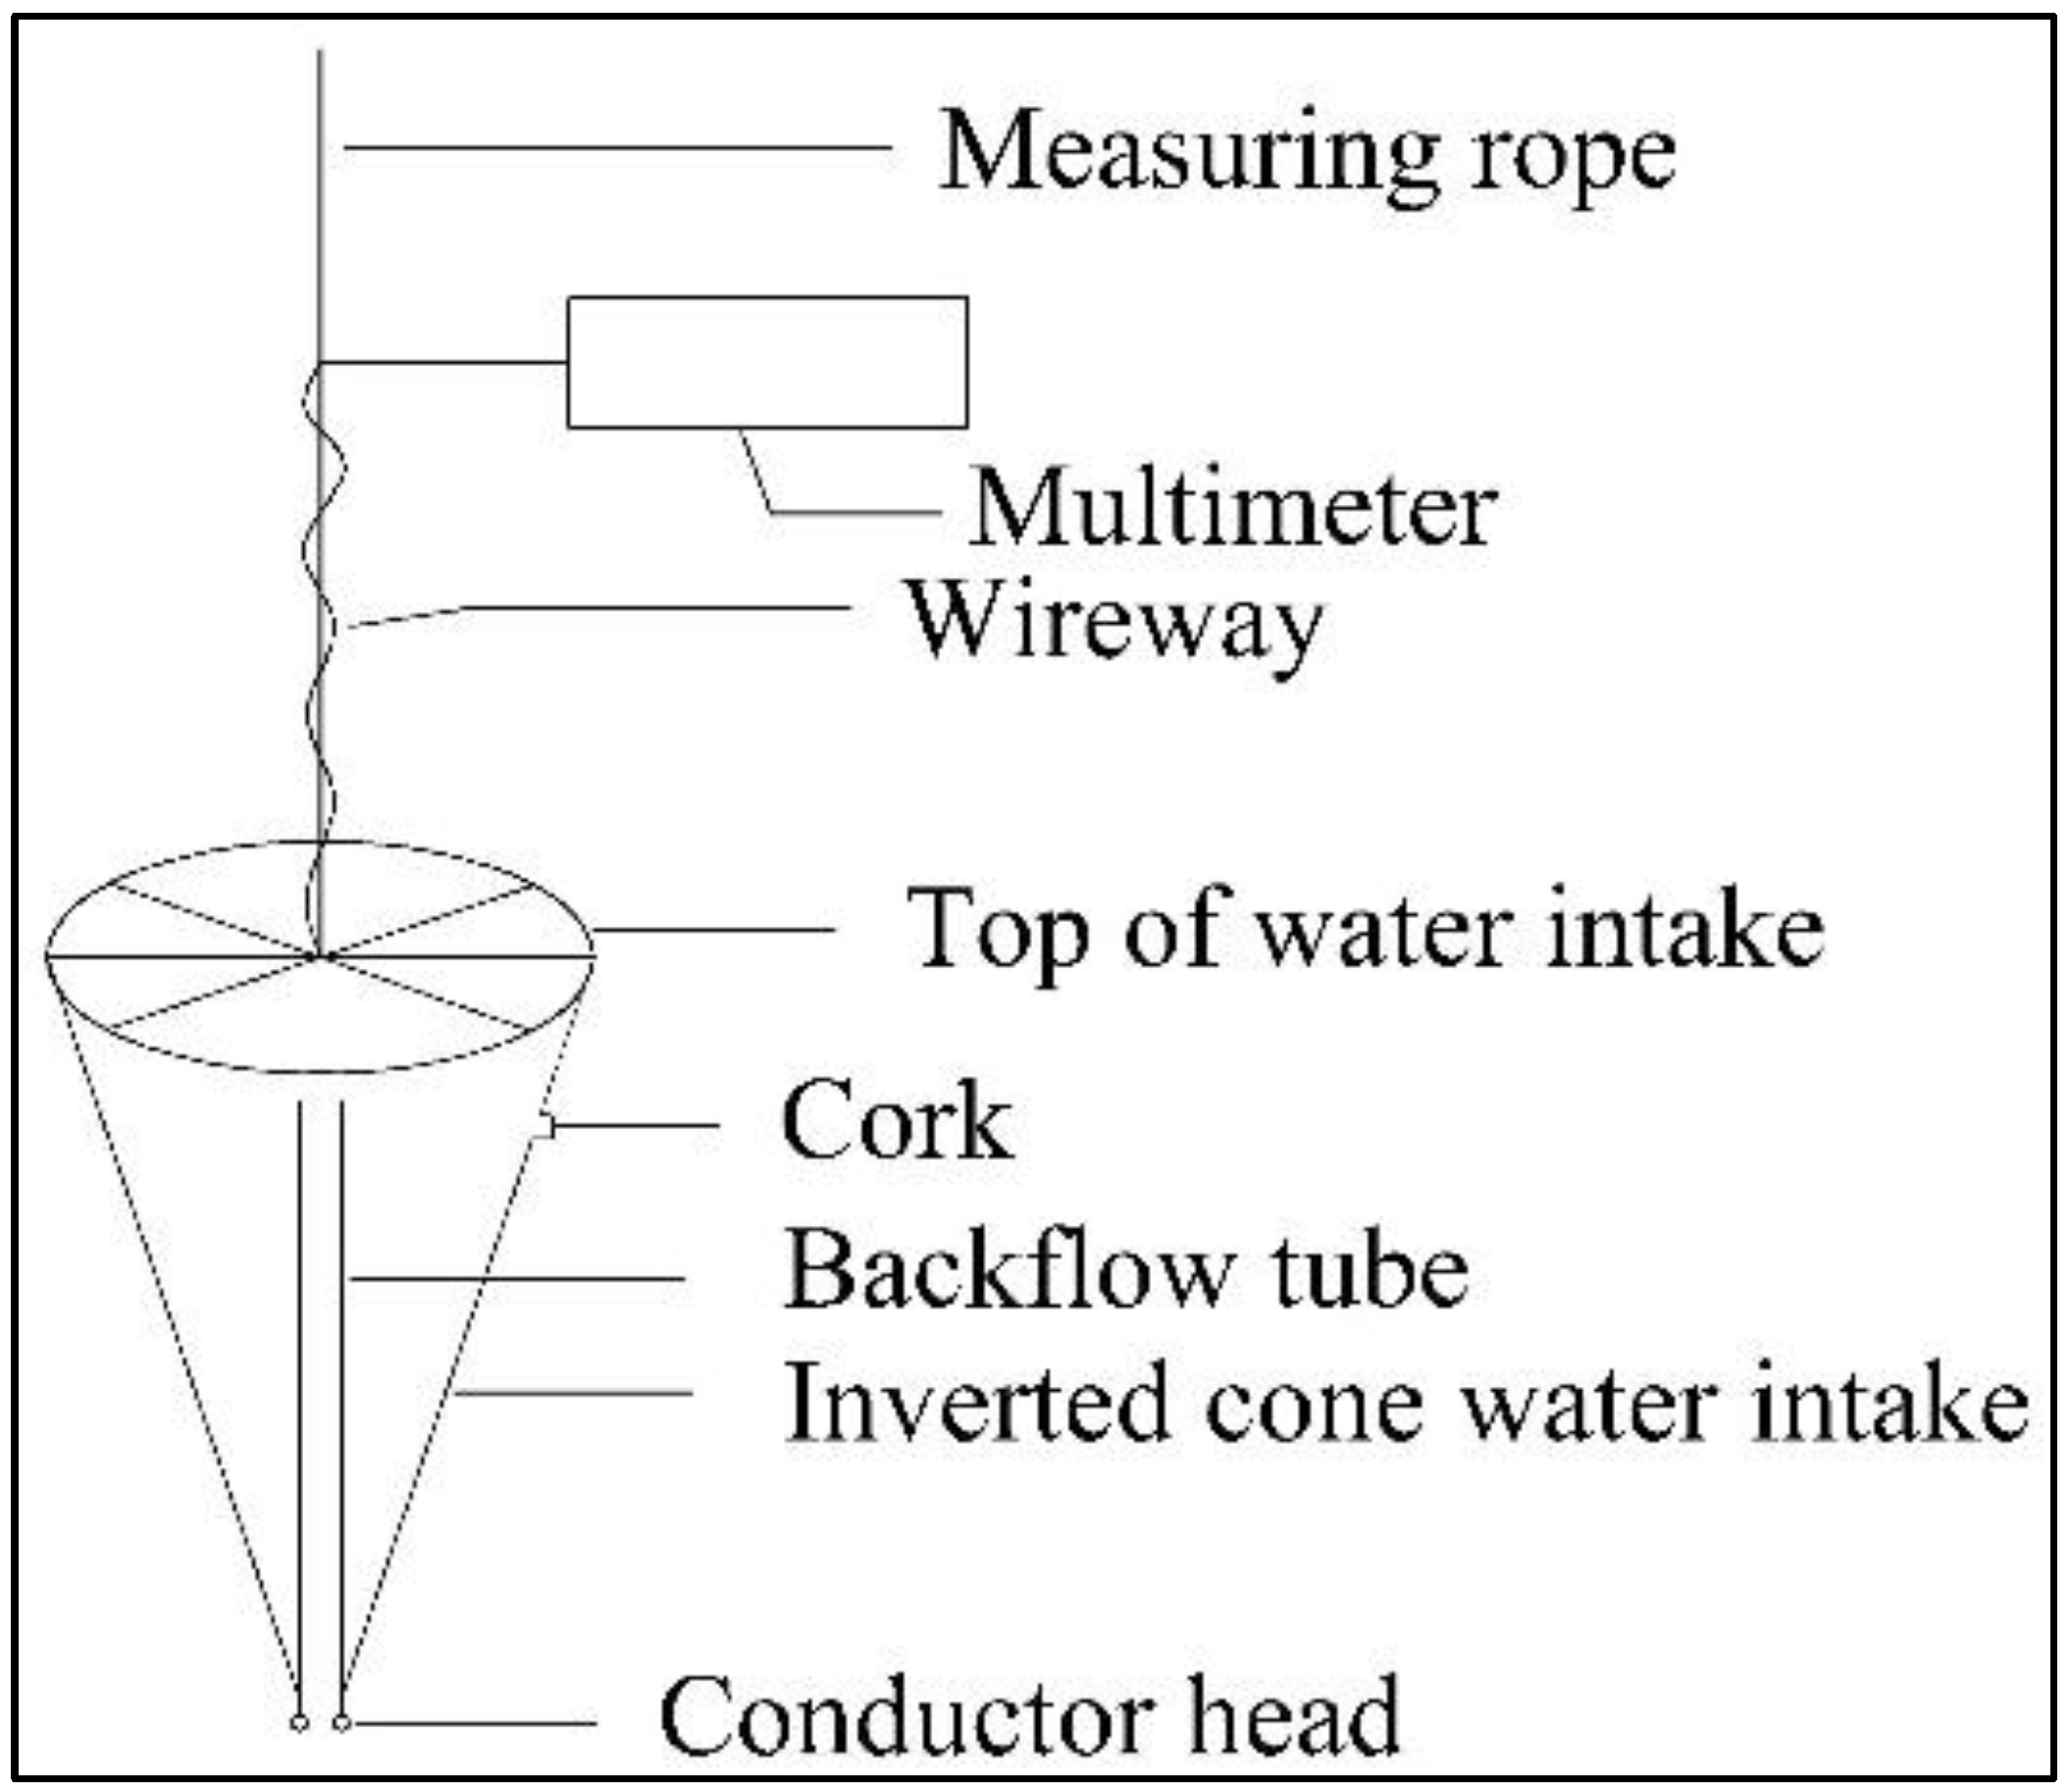
The project sampling needed to include the long-term observation well. The water level of the long-term observation well in the Chenghe mining area is generally deep, and a deep-hole water extractor is required in the sampling process. Therefore, an inverted conical backflow drilling and water intake device was designed (Figure 4), with the advantage that the water intake can be completed through the backflow without opening the switch or piston operation, which makes it simple and easy to implement. The design makes it easy to dump the water when taking water in an inverted cone, easy to maintain plumb when lifting, and difficult to leak water during the lifting process. The water intake container and water dispenser were integrated, the space was not wasted, and the water could be taken efficiently. Water samples taken by water intake devices are less susceptible to contamination.
The 61 groups of water samples collected in the Weibei mining area were separately sent for inspection. The test results were sorted and analyzed and it was found that, due to the age of all the O-ash long viewing holes in the Chenghe mining area, the local water environment of the wellbore was occluded and polluted to varying degrees. The pH value was alkaline and the Ca2+ ion content was very low, which did not meet the characteristics of Austrian gray water. The samples were rejected, and 38 groups of valid test water samples were collected in the Weibei mining area, including 2 sampling points for Quaternary aquifers, 10 sampling points for Permian sandstone fractured aquifers, and 7 sampling points for Limestone water of Taiyuan Formation. There were 11 sampling points for Austrian grey water and 8 sampling points for other surface water and old-air mixed water.
2.2.3. Test Methodology
A routine water quality analysis was completed in the testing center of the Shaanxi Institute of Geology and Mineral Exploration, and the trace elements were completed in the testing center of the Beijing Nuclear Industry Geology Bureau. The test methods and instruments are shown in Table 4.
2.3. Methods
2.3.1. Hierarchical Clustering Stepwise Discriminant Analysis
Each water sampling point sample containing m indicators can be defined as a point in the m-dimensional space, and the similarity between any two points in the m-dimensional space can be measured by the “distance” [28], which is defined as “dij”. If any sample is regarded as a class, and the similarity between classes can be represented by the Euclidean distance DE, then:
where number l represents the index number of the sample, l = 1, 2, …, m, and i, j represent the sample serial number, respectively. Xil, Xjl represent each index of the sample, respectively.
The systematic clustering method is used to calculate the distance dij between each pair of n samples, find the two classes with the smallest distance, merge them into a new class, recalculate the distance between the new class and other types of distance, and then merge the two categories with the smallest distance and repeat the above process until all samples are clustered into one category. All the water sample points (there are n) of the water inrush aquifer in the mining area whose Euclidean distance DE is less than a certain man-made specified value, P, were selected for participation in the stepwise discriminant analysis, and n water sample points were divided with m indicators into four categories. The stepwise discriminant analysis selected the indicators with significant discriminative effects on the four categories from its m indicators to form the discriminant function:
where Y(An) represents the discriminant function of the An-th class, An = 1, 2, 3, 4. C0(An), C1(An), C2(An), …, Cn(An) represent the discriminant coefficient of the An-th class. q(An) represents the event probability of the An-th class.
For any sample, corresponding characteristic data can be substituted into the discriminant function of each type of aquifer, the Y value of each type can be calculated, the maximum Y value can be taken, and the sample can be classified into this type [28].
2.3.2. F-Test
The discriminant effect between any two types of aquifers can be measured by the F-test [29], and the test method of the discriminant effect is described as follows:
To test the discriminant effect between classes 1 and 2, the F-test value can be used:
where n1 represents the number of samples of the first type. n2 represents the number of samples of the second type. p represents the number of discriminant variables. represents the generalized Mahalanobis distance, and its value can be expressed as:
where S represents the covariance matrix between variables. represents the sample mean vector of the first category. represents the sample mean vector of the second category.
Under the assumption of equal means, obey the F-distribution with Z and nA + nB-1-z degrees of freedom at a given significance level, α. If > , is the F critical value at the significance level α, and the discriminative effect of the two categories is significant.
2.3.3. Principal Component Analysis
The principal component analysis method is to study how to integrate multiple trace elements into one or a few comprehensive indicators, and these comprehensive indicators can reflect the basic information of the original groundwater trace elements to the greatest extent [30]. It is suitable to establish a principal component analysis model for the element content to analyze the hydrogeochemical characteristics of the water inrush in this mining area.
Let be a P-dimensional random variable, and its second-order moment is denoted by E(X) = μ, D(X) = ∑. Then, select a constant vector I, under the condition of Ii = 1 (i = 1, 2, …, t), and consider its multi-class linear transformation:
Var(γ1) = ∑Ii, Cov(γi, γj)= ∑Ij (i, j = 1, 2, …, t). If you want to use γ1 to replace the original t trace element variables X1, X2, …, Xt, this requires γ1 to reflect the information of the original t variables as best as possible. According to statistical analysis theory, the larger the Var(γ1), the more information γ1 contains. Therefore, I1 should be calculated under constraint conditions so that Var(γ1) reaches the maximum value. At this time, γ1 is called the first principal component. If a principal component cannot represent the trace element information of the aquifer, as reflected by the original t variables, consider using γ2. To effectively represent the information of the original variable, the existing trace element information of γ1 does not need to appear in γ2, which should have Cov(γ1, γ2) = 0. Therefore, to find γ2 is to find I2 under the constraints so that Var(γ2) reaches the maximum value. The required γ2 is called the second principal component. Similarly, the third principal component, the fourth principal component, etc., can be defined. Generally, the i-th principal component γi = of X refers to finding Ii under the constraints and Cov(γi ,γk) = 0 (k < i), so that Var(γi) reaches a maximum.
According to matrix theory, the i-th principal component of X is γi = I′ (i = 1, 2, …, p). Among them, Ii is the unit eigenvector of the corresponding λi; at this time, Var(γi) = λi (i = 1, 2, …, t). Generally, let λ1, λ2, …, λt ≥ 0 is the obtained eigenroot and I1, I2, …, It are the corresponding eigenvectors. Then, it is called: , which is the contribution rate of the i-th principal component γi (i = 1, 2, …, t), and its size reflects the information of X1, X2, …, Xt: .
The contribution rate of the first principal component γ1 is the largest; it extracts X1, X2, …, Xt with the largest amount of information and the strongest comprehensive ability, so it can be reflected by the first principal component. The trace element information is used to comprehensively analyze the hydrogeochemical characteristics of trace elements in the Weibei mining area [31].
2.3.4. Bayes Criterion
If n samples are taken from G precursors (), each sample must belong to one of the G precursors (Ag). If each sample measures t variables (), then each sample can be regarded as a point in the p-dimensional space {R} [32]. n samples form a p-dimensional sample space {R}. An unknown sample is also regarded as a point in the p-dimensional space to see which subspace it falls into or which subspace has the highest probability; then, it can be classified as one of the G mothers [32].
There are various division methods for space {R}. Any division method may be misclassified, and misclassification will cause losses. If the sample originally belonging to the Ah parent is wrongly classified into the Ag parent, the loss caused is recorded as L(g/h), and it is agreed that when h = g, L(g/h) = 0; when h ≠ g, L(g/h) > 0.
If the probability of the misclassification of samples originally belonging to Ag parent to Ah is denoted as , then, when the probability distribution density of G parents is known, we have . The average loss caused by misclassifications of the sample originally belonging to the Ag parent into the Ah parent is:
When the class H prior probability of each parent is known, the average loss of misclassification of the G-type parent is: . If the sample originally belonging to the Ah parent is wrongly classified into the Ag parent, the loss is recorded as L(h/g), and the same is obtained:
Bayes proved that to minimize the average loss of total misclassification, the method of dividing the space {R} should for any research individual ; then, it is classified as the parent of Ag. Therefore, when the class G prior probability qg is given to the parent, the principle of dividing the space {R} to minimize the average loss of misclassification is called the Bayes criterion or attribution criteria. That is to say, the individual with the largest posterior probability belonging to the Ag parent is assigned to the Ag parent. The maximum a posteriori probability is equivalent to the maximum qgfg(x), so the discriminant function of any individual x can be obtained.
Bayesian Multi-class Linear Discriminant Analysis (LDA) Model
Suppose G parent Ag (g = 1, 2, …, G) obeys the normal distribution N (ag, ∑) (g = 1, 2, …, G) [33], and its probability density function is:
where , and the parameters ag and ∑ are the mean vector and covariance matrix of the parent Ag, respectively.
When L(g/h) = L(h/g) (h ≠ g), the prior probability qg of the parent and the parent parameters are known, and the parent covariance matrix is not significantly different (when the statistics are equal) [33], the G discriminant functions can be obtained as follows:
where g = 1, 2, …, G. After derivation and sorting, the multi-class LDA function of the normal parent under the Bayes criterion can be obtained as:
3. Results
3.1. Conventional Hydrochemical Characteristics and Discrimination Model
3.1.1. Relationship between Conventional Ions and Total Dissolved Solids (TDS) in Karst Water
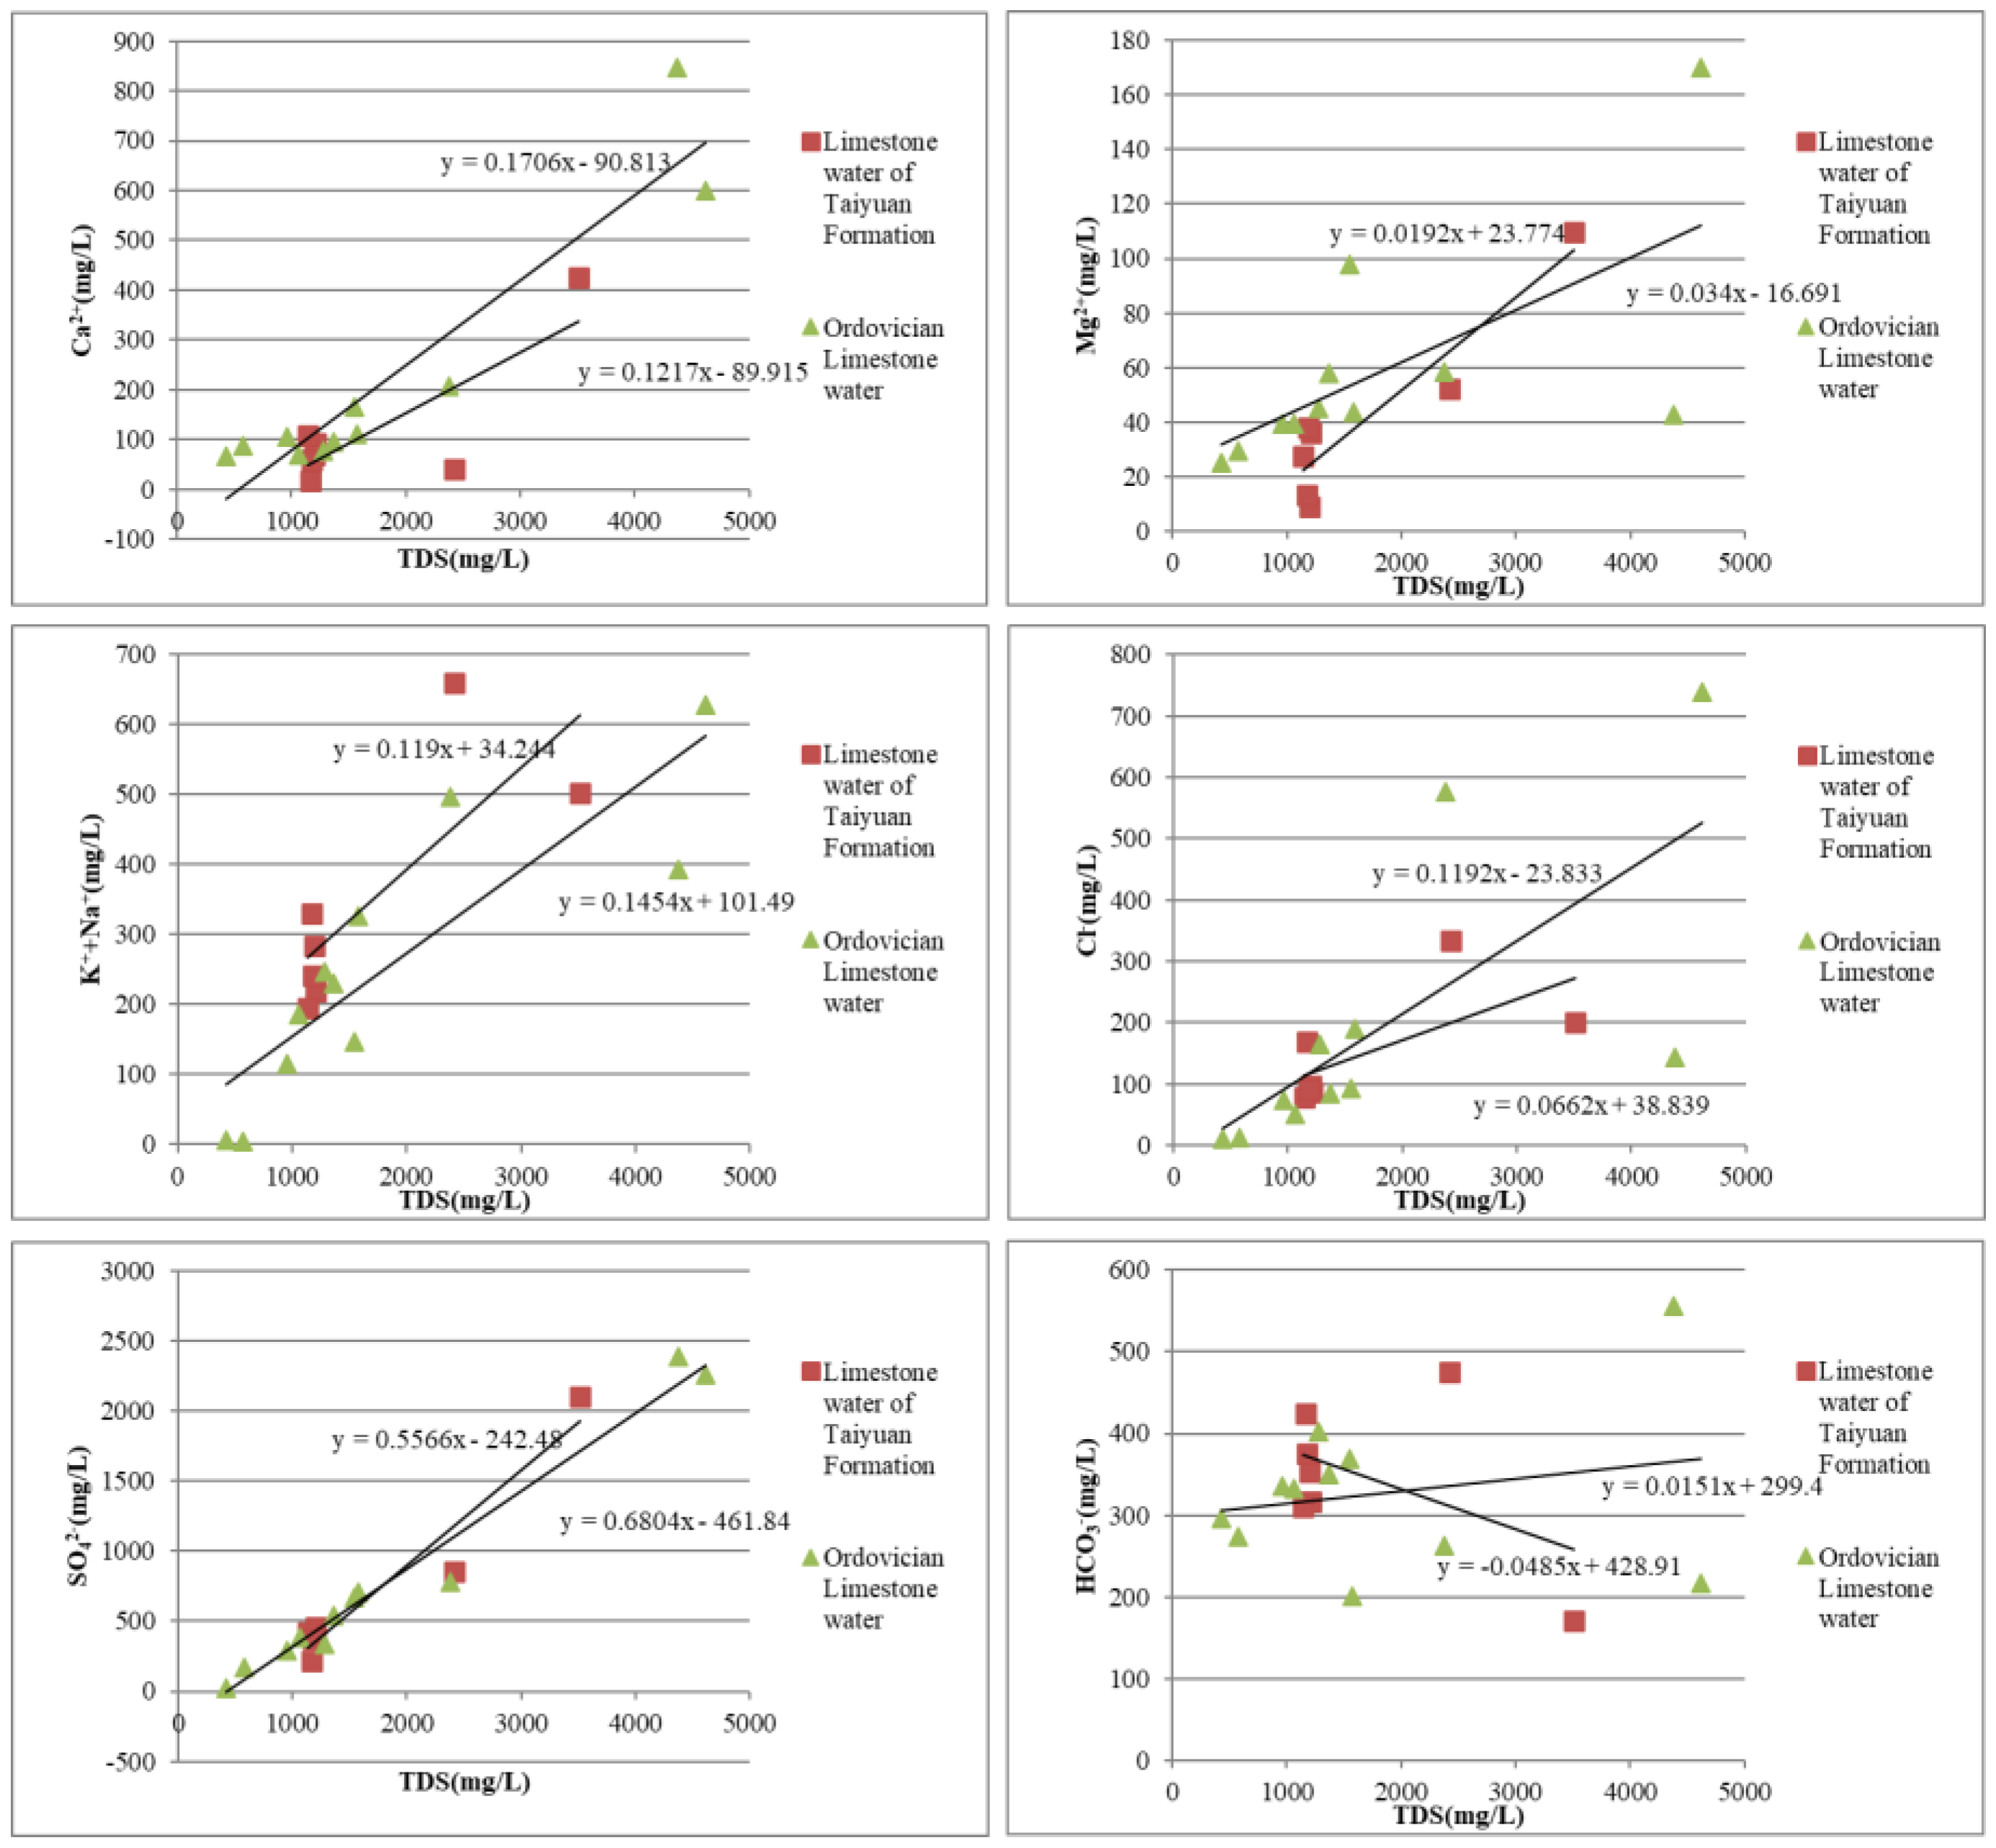
Total dissolved solids (TDS) are the total amount of dissolved components in water, which provides a comprehensive reflection of the accumulation of conventional ions (K+, Na+, Ca2+, Mg2+, Cl−, SO42−, CO32−, HCO3−) in water.
The relationship between Ca2+, Mg2+, HCO3−, and TDS can determine the hydraulic connection between the Hancheng hydrological subunit and the Tongchuan-Pucheng-Heyang hydrological subunit. TDS are about 2000 mg/L, which is the boundary between Hancheng and Tongpu Hehe hydrological subunits (Figure 5, Figure 6 and Figure 7).
The relationship between Ca2+, Mg2+, and HCO3− of Carboniferous water and Ordovician limestone water in the Tongchuan-Pucheng-Heyang hydrological subunit and TDS shows that the dissolution of the Carboniferous aquifer and Ordovician limestone aquifer in the Tongchuan-Pucheng-Heyang hydrological subunit is not significant. That is, when TDS are below 2000 mg/L, the changes in Ca2+, Mg2+, and HCO3− ions are not significant. The variation range is concentrated at about 100 mg/L, indicating that the dissolution of calcite, dolomite, and other minerals in the Tongchuan-Pucheng-Heyang hydrological subunit is close to saturation. That is to say, the Tongchuan-Pucheng-Heyang hydrological subunit has good exchange conditions with surface water and atmospheric water, and the karst groundwater in this area has poor solubility to the karst minerals in this area. The hydrogeological conditions of the Hancheng hydrological subunit and Tongchuan-Pucheng-Heyang hydrological subunit are obviously different. In addition, the hydrological subunit in the current mining area of Hancheng is located in the middle- and deep-detention areas, with a relatively closed environment and a poor exchange environment with surface water and atmospheric precipitation.
The content of conventional ions in karst water mostly increases with the increase in TDS. In the mining area, using TDS as an index has a good effect on the comprehensive analysis of the conventional ion migration law of the karst water system, which shows the accuracy and reliability of using TDS as a comprehensive index to analyze the circulation characteristics of the groundwater concentration gradient field. The slope of the conventional ion trend line in Figure 8 shows that Kca2+ > K(K++Na+) > KMg2+, so the migration ability of cations in karst water is Ca2+ > K++Na+ > Mg2+. From Figure 8, the Tongchuan-Pucheng-Heyang hydrological unit and the Hancheng hydrogeological unit are considered separately. According to the slope of the conventional ion trend line, KK++Na+ > Kca2+ > KMg2+ in the Tongchuan-Pucheng-Heyang, indicating that the runoff supply of surface water and atmospheric precipitation in this hydrogeological unit is good, and the calcium ion of the Tongchuan-Pucheng-Heyang hydrological unit is saturated. In Hancheng, Kca2+ > K(K++Na+) > KMg2+, so the migration ability of cations in karst water is Ca2+ > K+ + Na+ > Mg2+.
3.1.2. Conventional Hydrochemical Discrimination Model for Main Water Inrush Aquifers
Cluster Analysis of Aquifer System
To exclude the effect of these water samples’ interference with the establishment of a hydrochemical discrimination model of the main water inrush aquifers, it is necessary to conduct a separate cluster analysis for each aquifer. Through cluster analysis, the abnormal water sample point of an aquifer that does not meet a certain standard can be removed, and all the water sample points can be simultaneously established in the four main aquifers that underwent cluster analysis to re-establish a water sample point set, carry out step-by-step identification and analyze the hydrochemical characteristics of each aquifer. This time, when analyzing the hydrogeochemical characteristics of the mining area and establishing the conventional hydrochemical discrimination model of the main water inrush aquifers, we strove to reflect the latest water quality test data. Each water sample point included ten indicators of K+ + Na+, Ca2+, Mg2+, NH4+, Cl−, SO42−, HCO3−, PH value, total hardness, and TDS, and these selected water samples can better reflect the hydrogeochemical sampling features at the point.
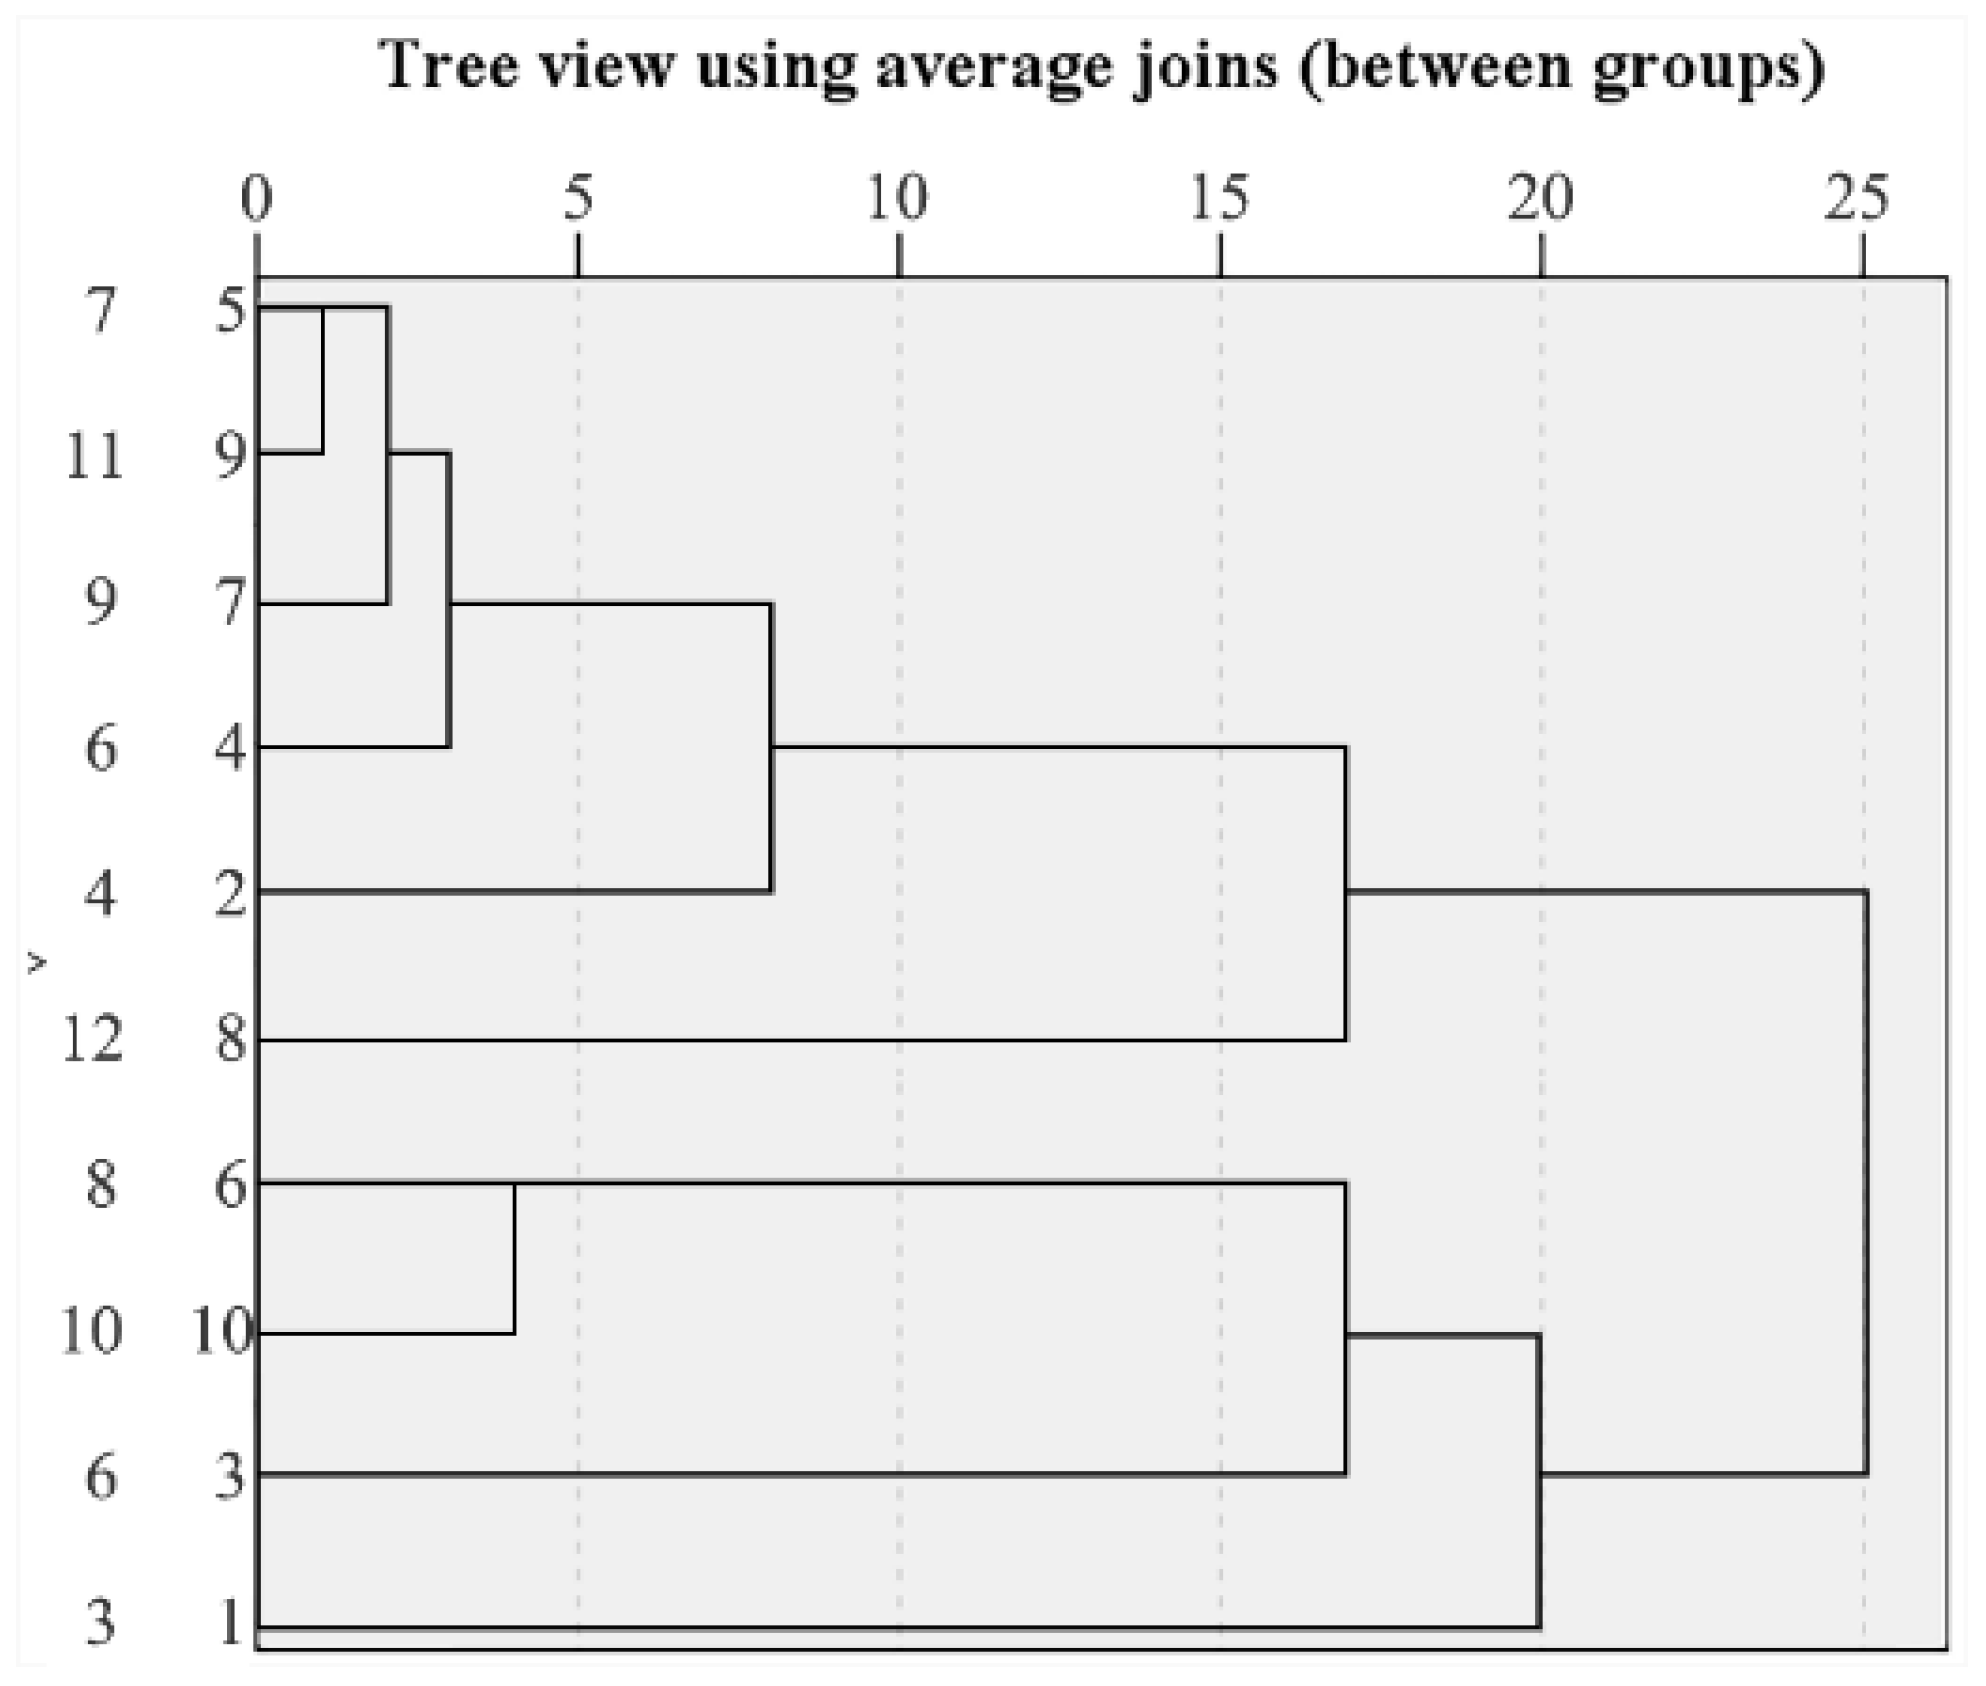
There was a large difference between Xujiagou mine water sample 3, Zhujiahe mine water sample 5, Wangxie mine water sample 8, Xiangshan mine water sample 10, Sangshuping mine water sample 12, and Permian sandstone fissure water in other production mines. From the hierarchical cluster analysis pedigree diagram (Figure 9), it can be seen that the Euclidean distance between the five water samples and other production mine water types is greater than the specified standard 15. This shows that the hydrogeochemical characteristics represented by these groups of water samples are quite different from those of other production mines. Therefore, these groups of water samples were excluded, and the remaining No. 4, 6, 7, 9, and 11 water samples of Permian sandstone fissure water in the mining area were selected to participate in the stepwise discriminant analysis.
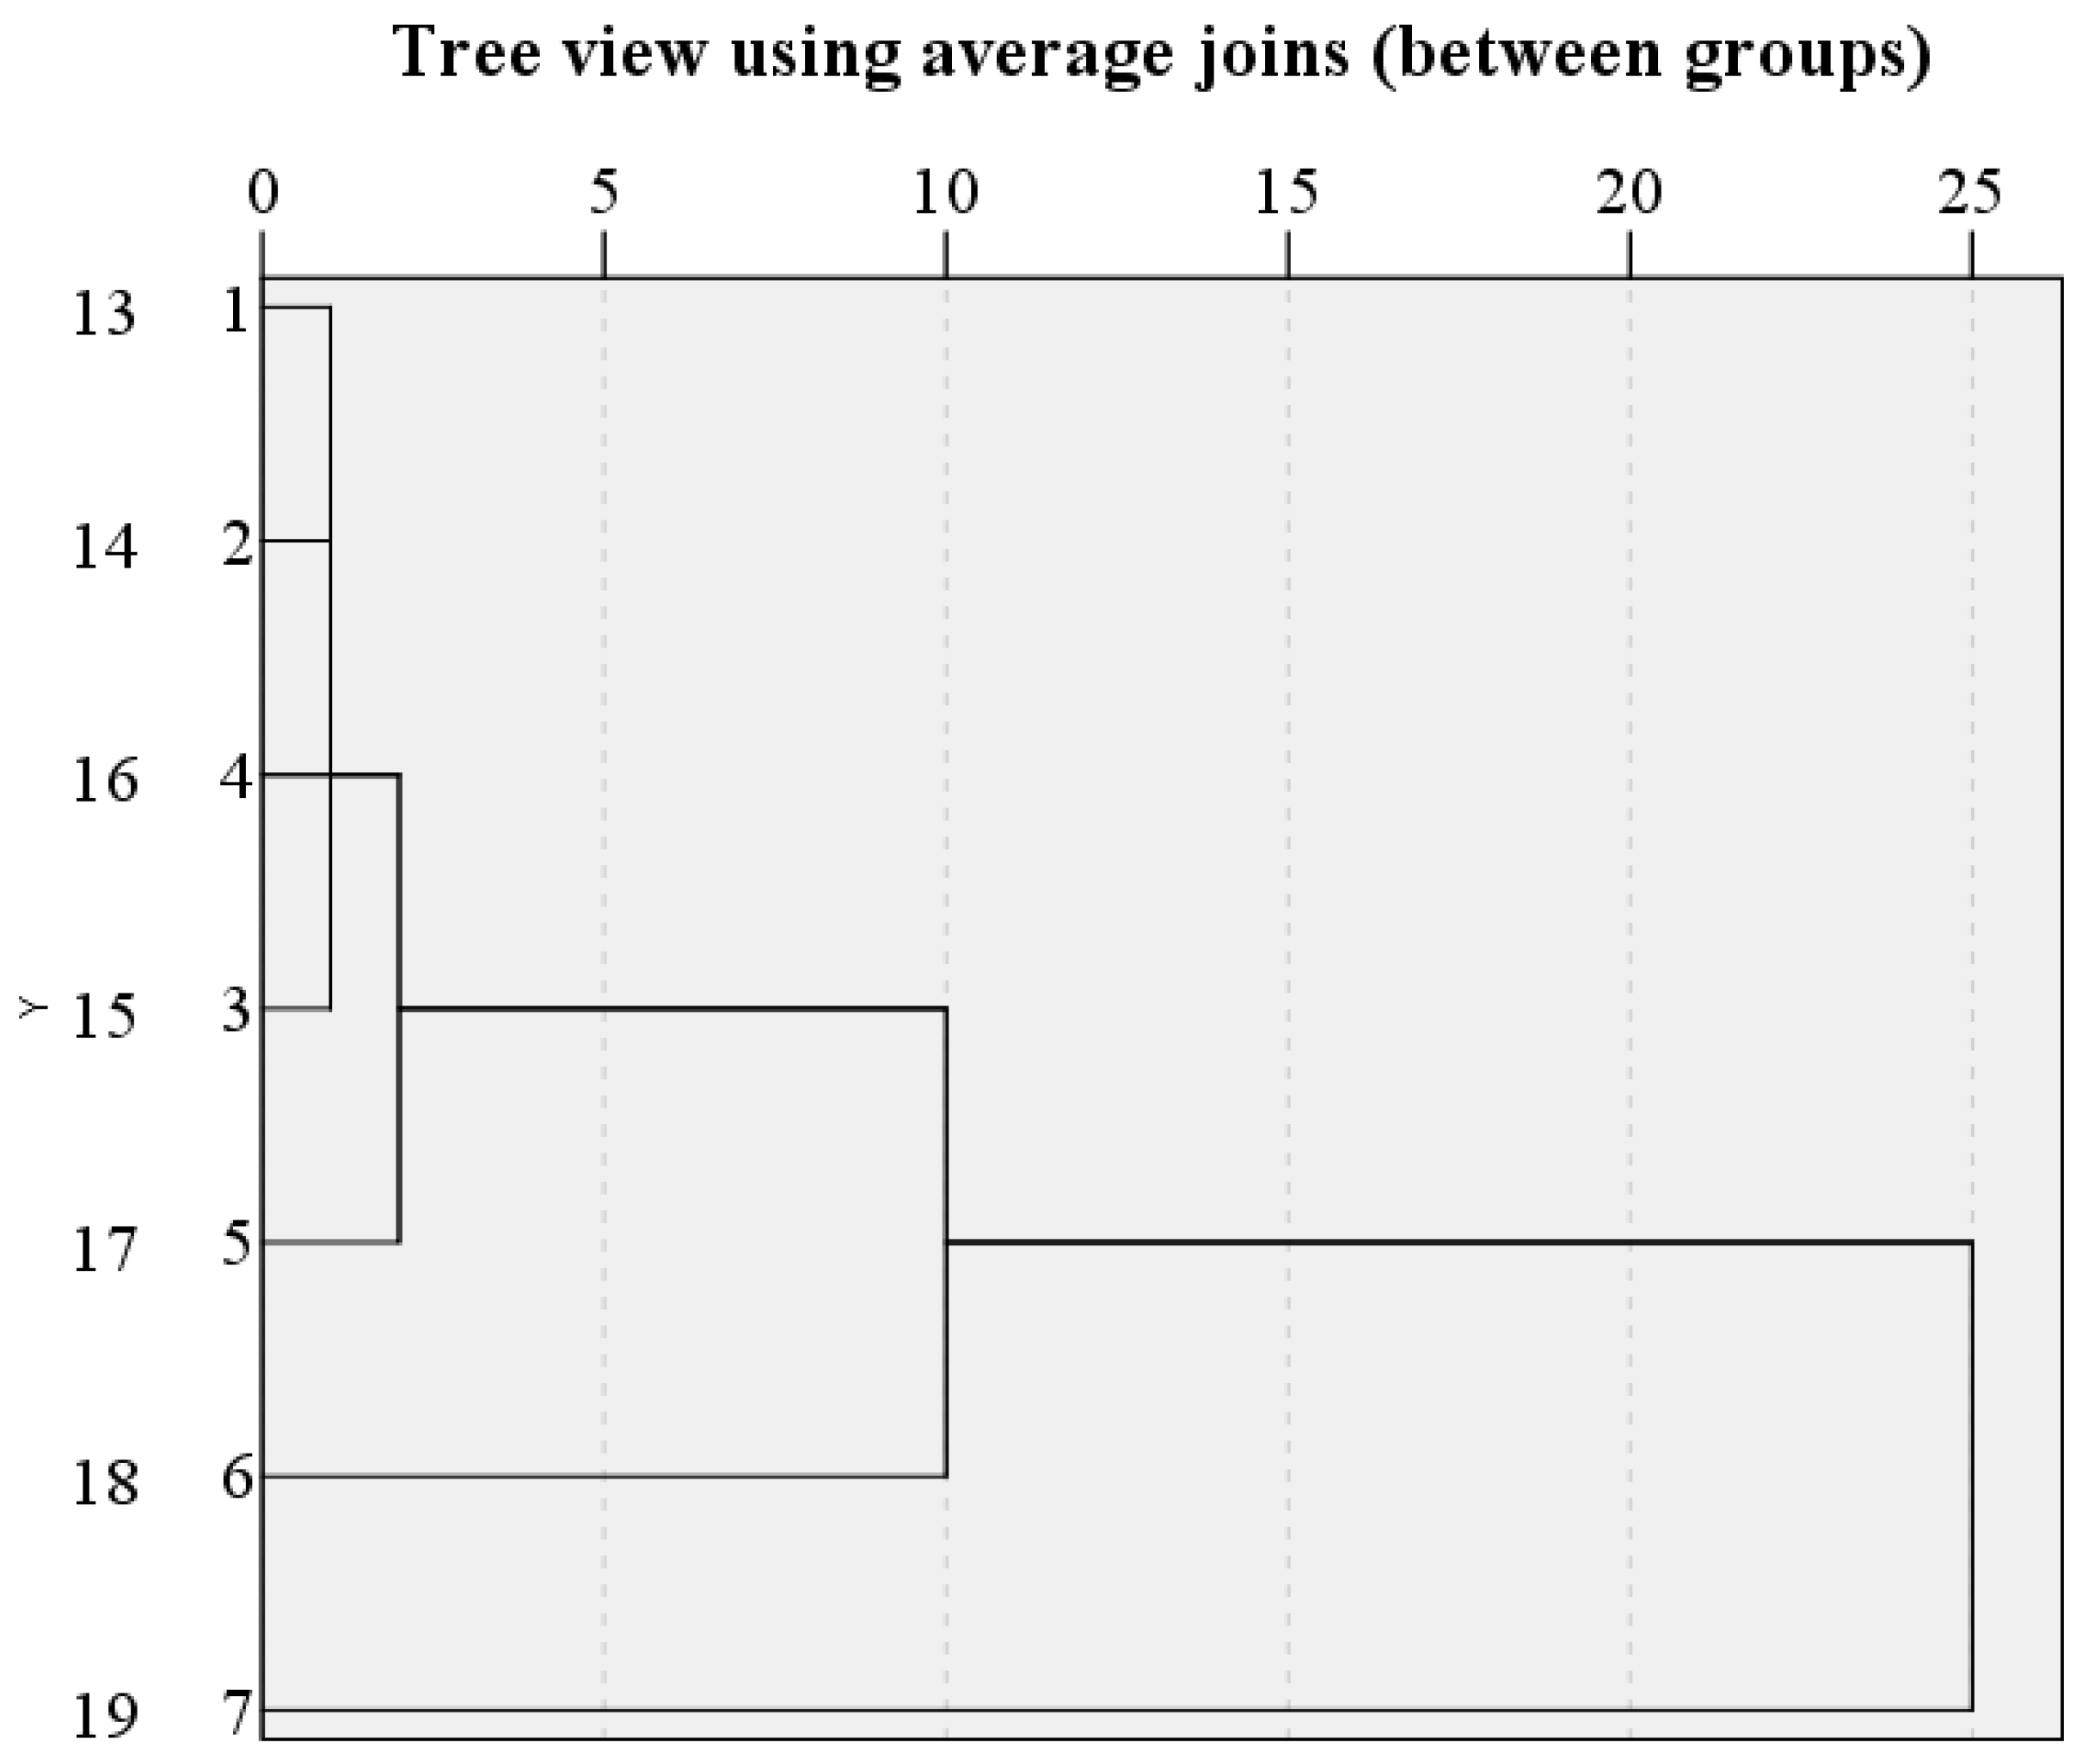
The fissure water of the Carboniferous sandstone (limestone) in the Weibei mining was also determined in the system cluster analysis diagram (Figure 10), and the Euclidean distance between the classes was determined to be no greater than 15, which was used as the selection criterion. The Euclidean distance between Sangshuping mine water sample 19 and sandstone (limestone) fissure water in other production mines is 25, so water sample 19 was excluded. The remaining 13, 14, 15, 16, 17, and 18 water samples have a distance between classes of less than 15 and were distributed in a large mining area, so they could be selected to participate in the step-by-step discriminant analysis.
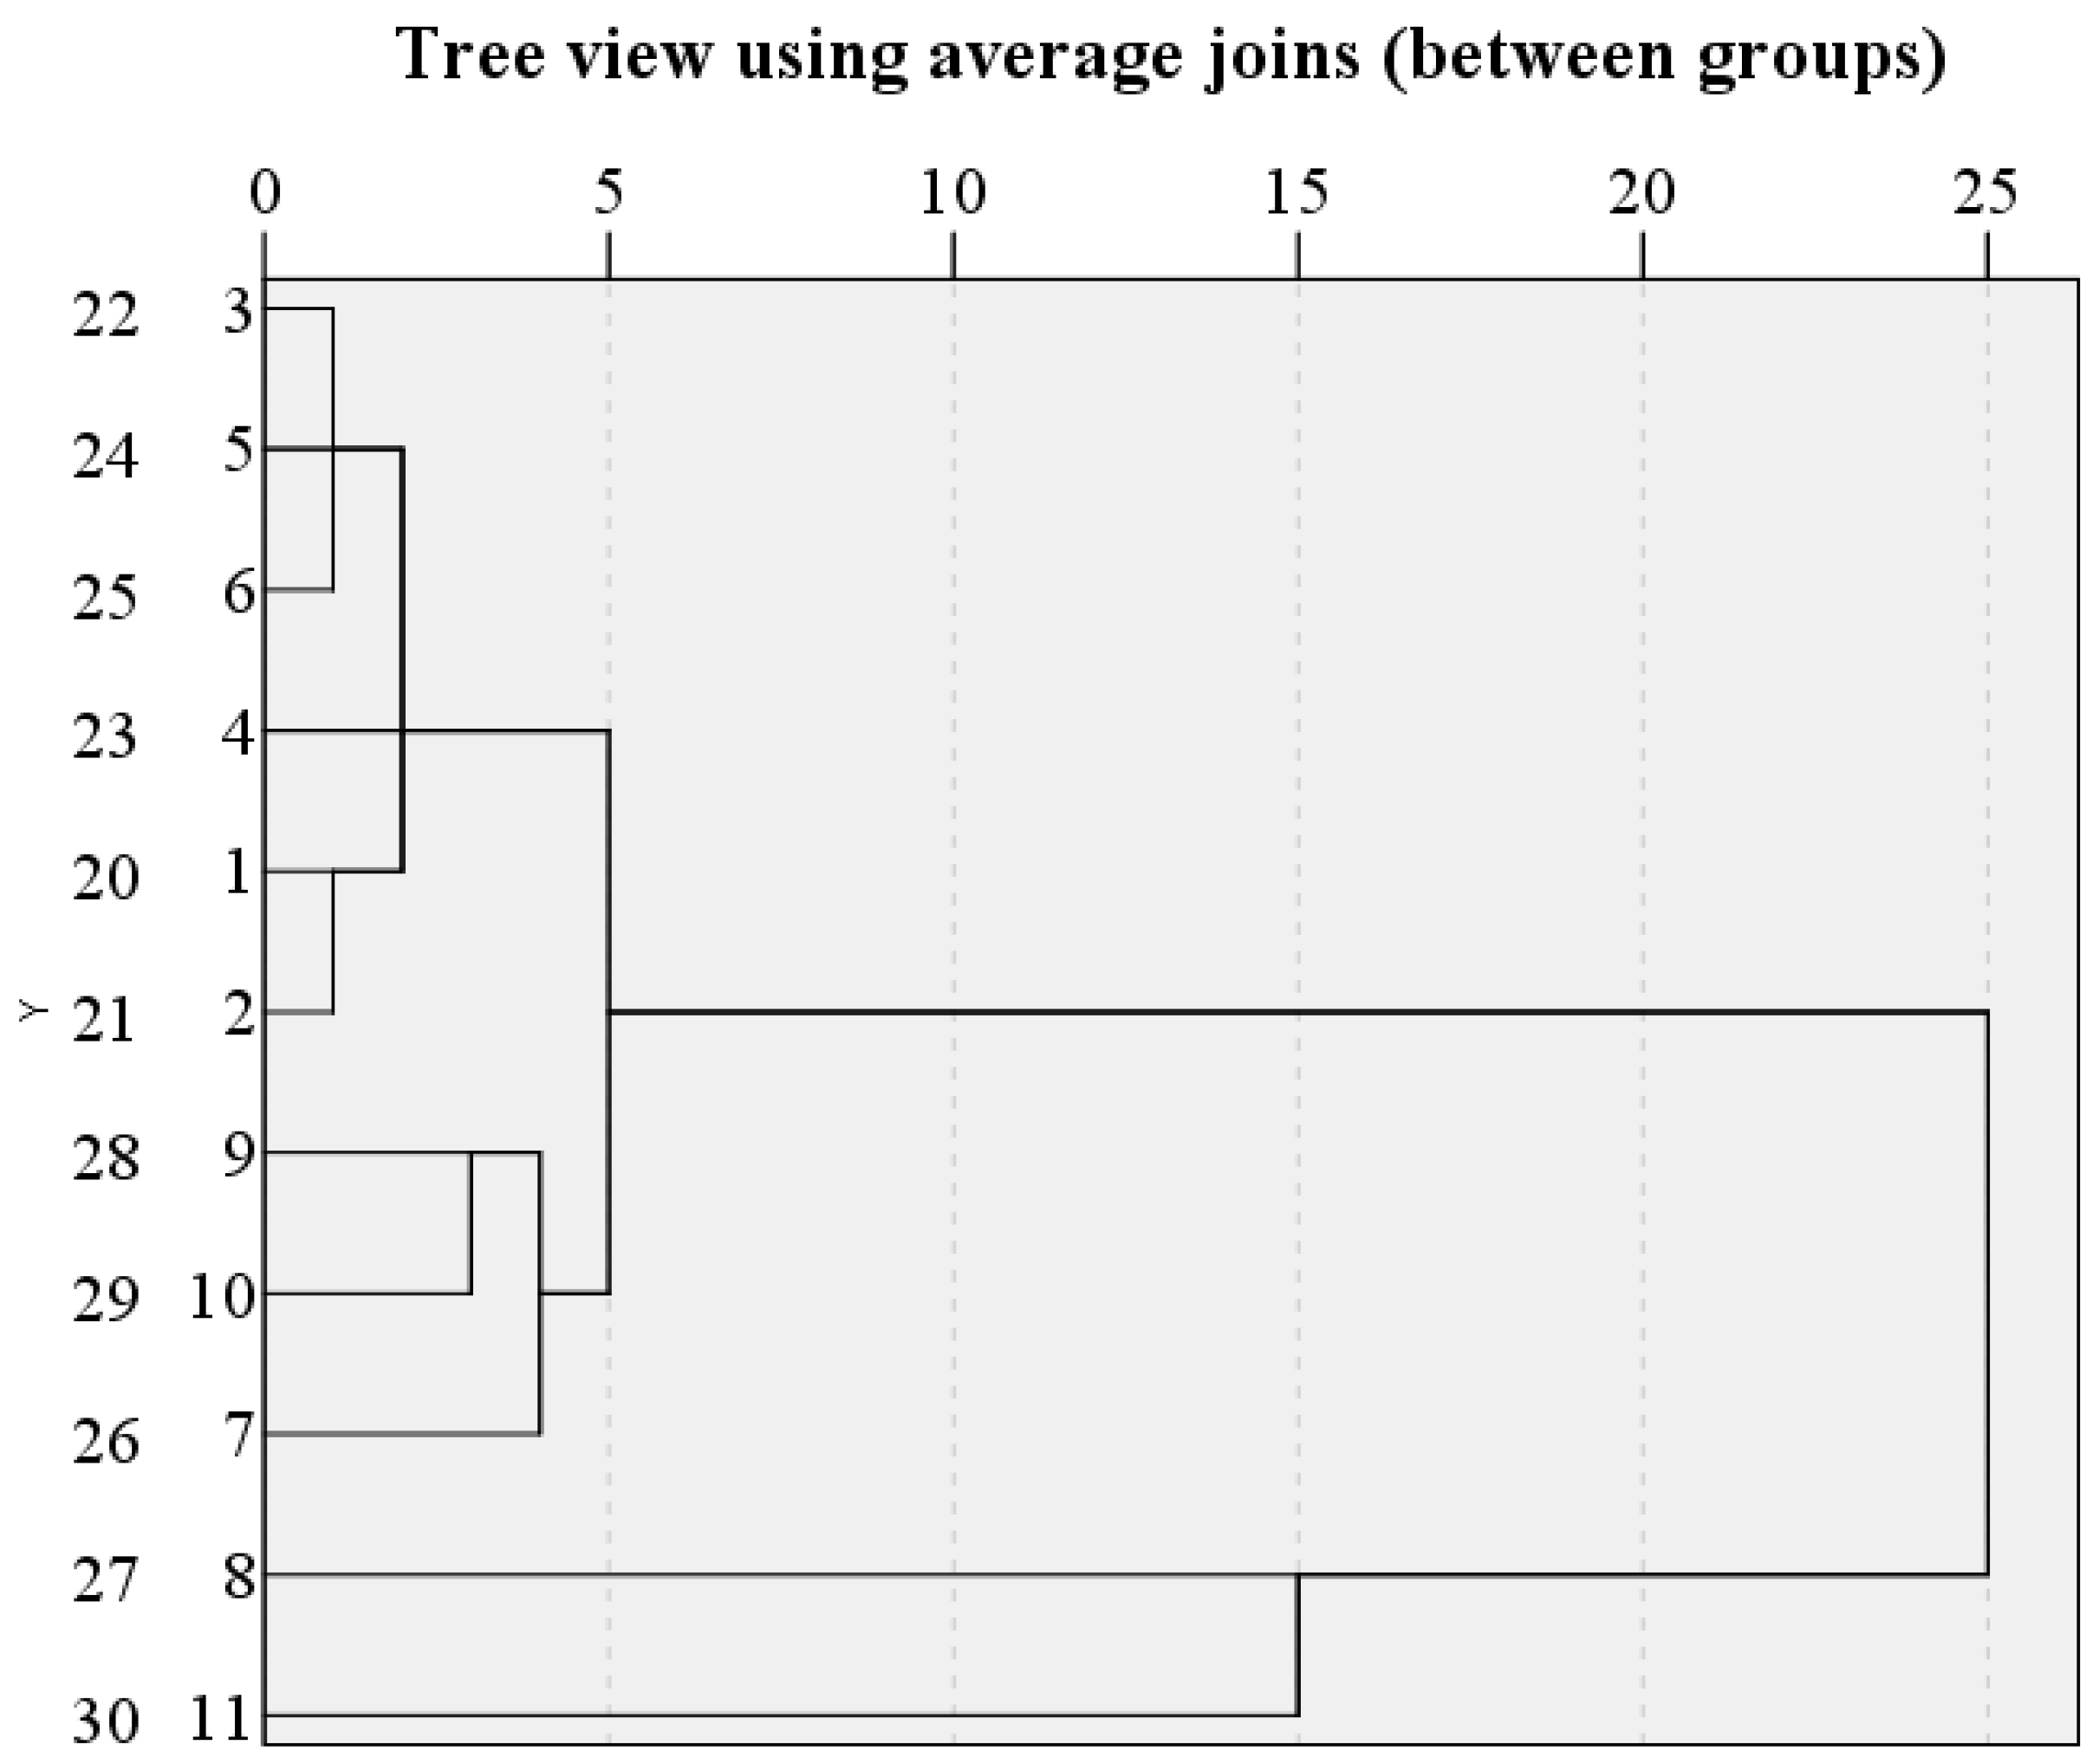
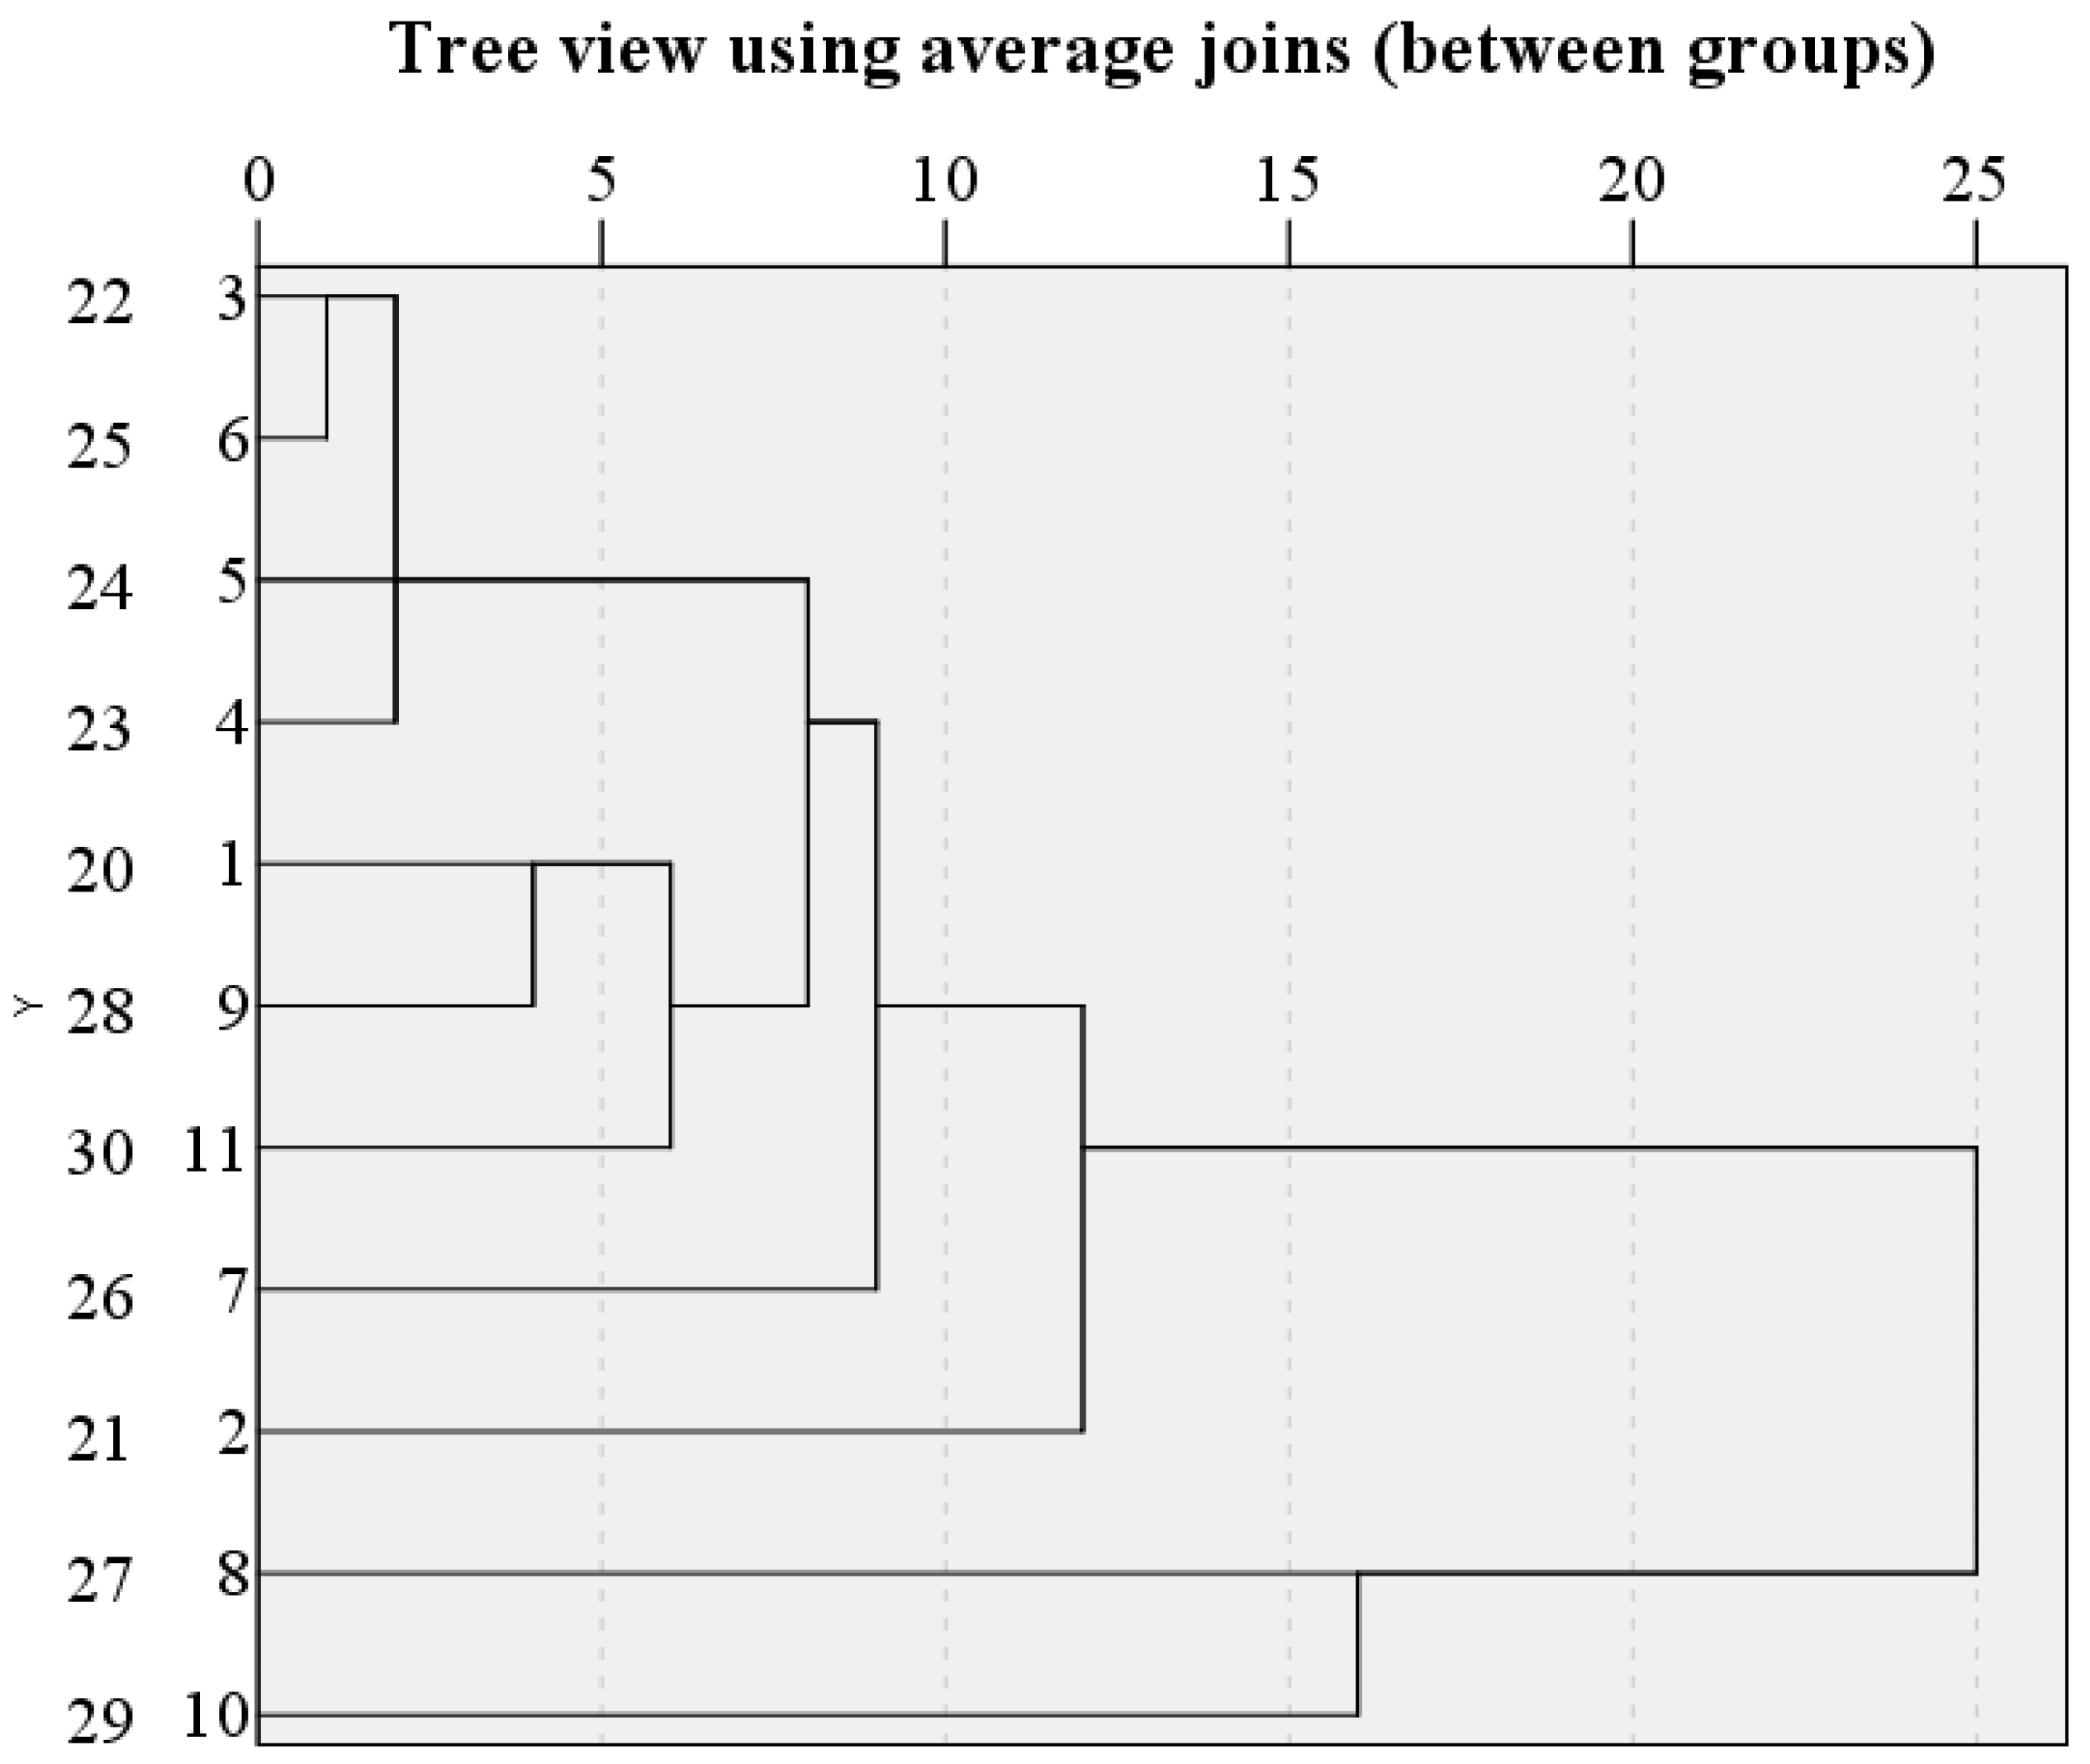
The Ordovician limestone water in the Weibei mining area is the same as that in the Carboniferous sandstone (limestone) water, and the clustering effect is better (Figure 11). Among the 11 sampling points in the mining area, except for the water sample of Xiangshan Mine No. 27 and the water sample of Sangshuping Mine No. 30, the inter-class Euclidean distance from other water samples is 25 greater than 15, and other water samples are less than 15, which meets the standard; therefore, the remaining water samples 20, 21, 22, 23, 24, 25, 26, 28, and 29 were selected to participate in the stepwise discriminant analysis.
Gradual Discriminant Analysis of Aquifer
- (1)
- Discriminant analysis
According to the results of systematic cluster analysis, 20 water sample points were selected from 28 water sample points in the main water inrush aquifer in the Weibei mining area, and 1, 2, and 3 were used as categorical variables to represent Permian sandstone fissures, For the three aquifers of Carboniferous sandstone (limestone) fissures and Ordovician limestone, after applying the multi-class stepwise LDA model under the FISHER criterion, the discriminant function was obtained as follows:
where [K+ + Na+] represents the sum of the concentrations of potassium ions and sodium ions (mg/L); [Mg2+] represents the concentration of magnesium ions (mg/L); [NH4+] represents the concentration of ammonium ions (mg/L); [Cl−] represents chloride ion concentration (mg/L); [SO42−] represents sulfate ion concentration (mg/L).
When all samples are divided into three categories, through step-by-step discriminant analysis, the original 10 indicators of each sample are preferably transformed into six indicators. When discriminant classification was required, only the values of K+ + Na+, Mg2+, NH4+, Cl−, SO42−, and pH were substituted into each discriminant function formula, respectively, to calculate the Y value of each type. The largest Y value was taken, and the sample was classified into this type.
- (2)
- Discrimination effect test
The F-test results are shown in Table 5. It can be seen from Table 5 that, at the test level α = 0.05, F > F0.05(2, 17), the difference between classes is significant, indicating that the six selected variables, K+ + Na+, Mg2+, NH4+, Cl−, SO42−, and pH have significant discriminative ability and good effect, and can effectively discriminate the three main water inrush aquifers in the Weibei mining area.
3.2. Hydrogeochemical Characteristics and Discriminant Model of Trace Elements
3.2.1. Systematic Cluster Analysis of Trace Elements in Aquifer
In this study, elements with a content of less than 10 mg/L are generally referred to as trace elements. A total of 38 groups of water samples were selected in the Weibei mining area for trace-element testing. Seventeen indicators, such as Cs, Ba, U, and Sr, were analyzed.
Cluster Analysis of Aquifer System
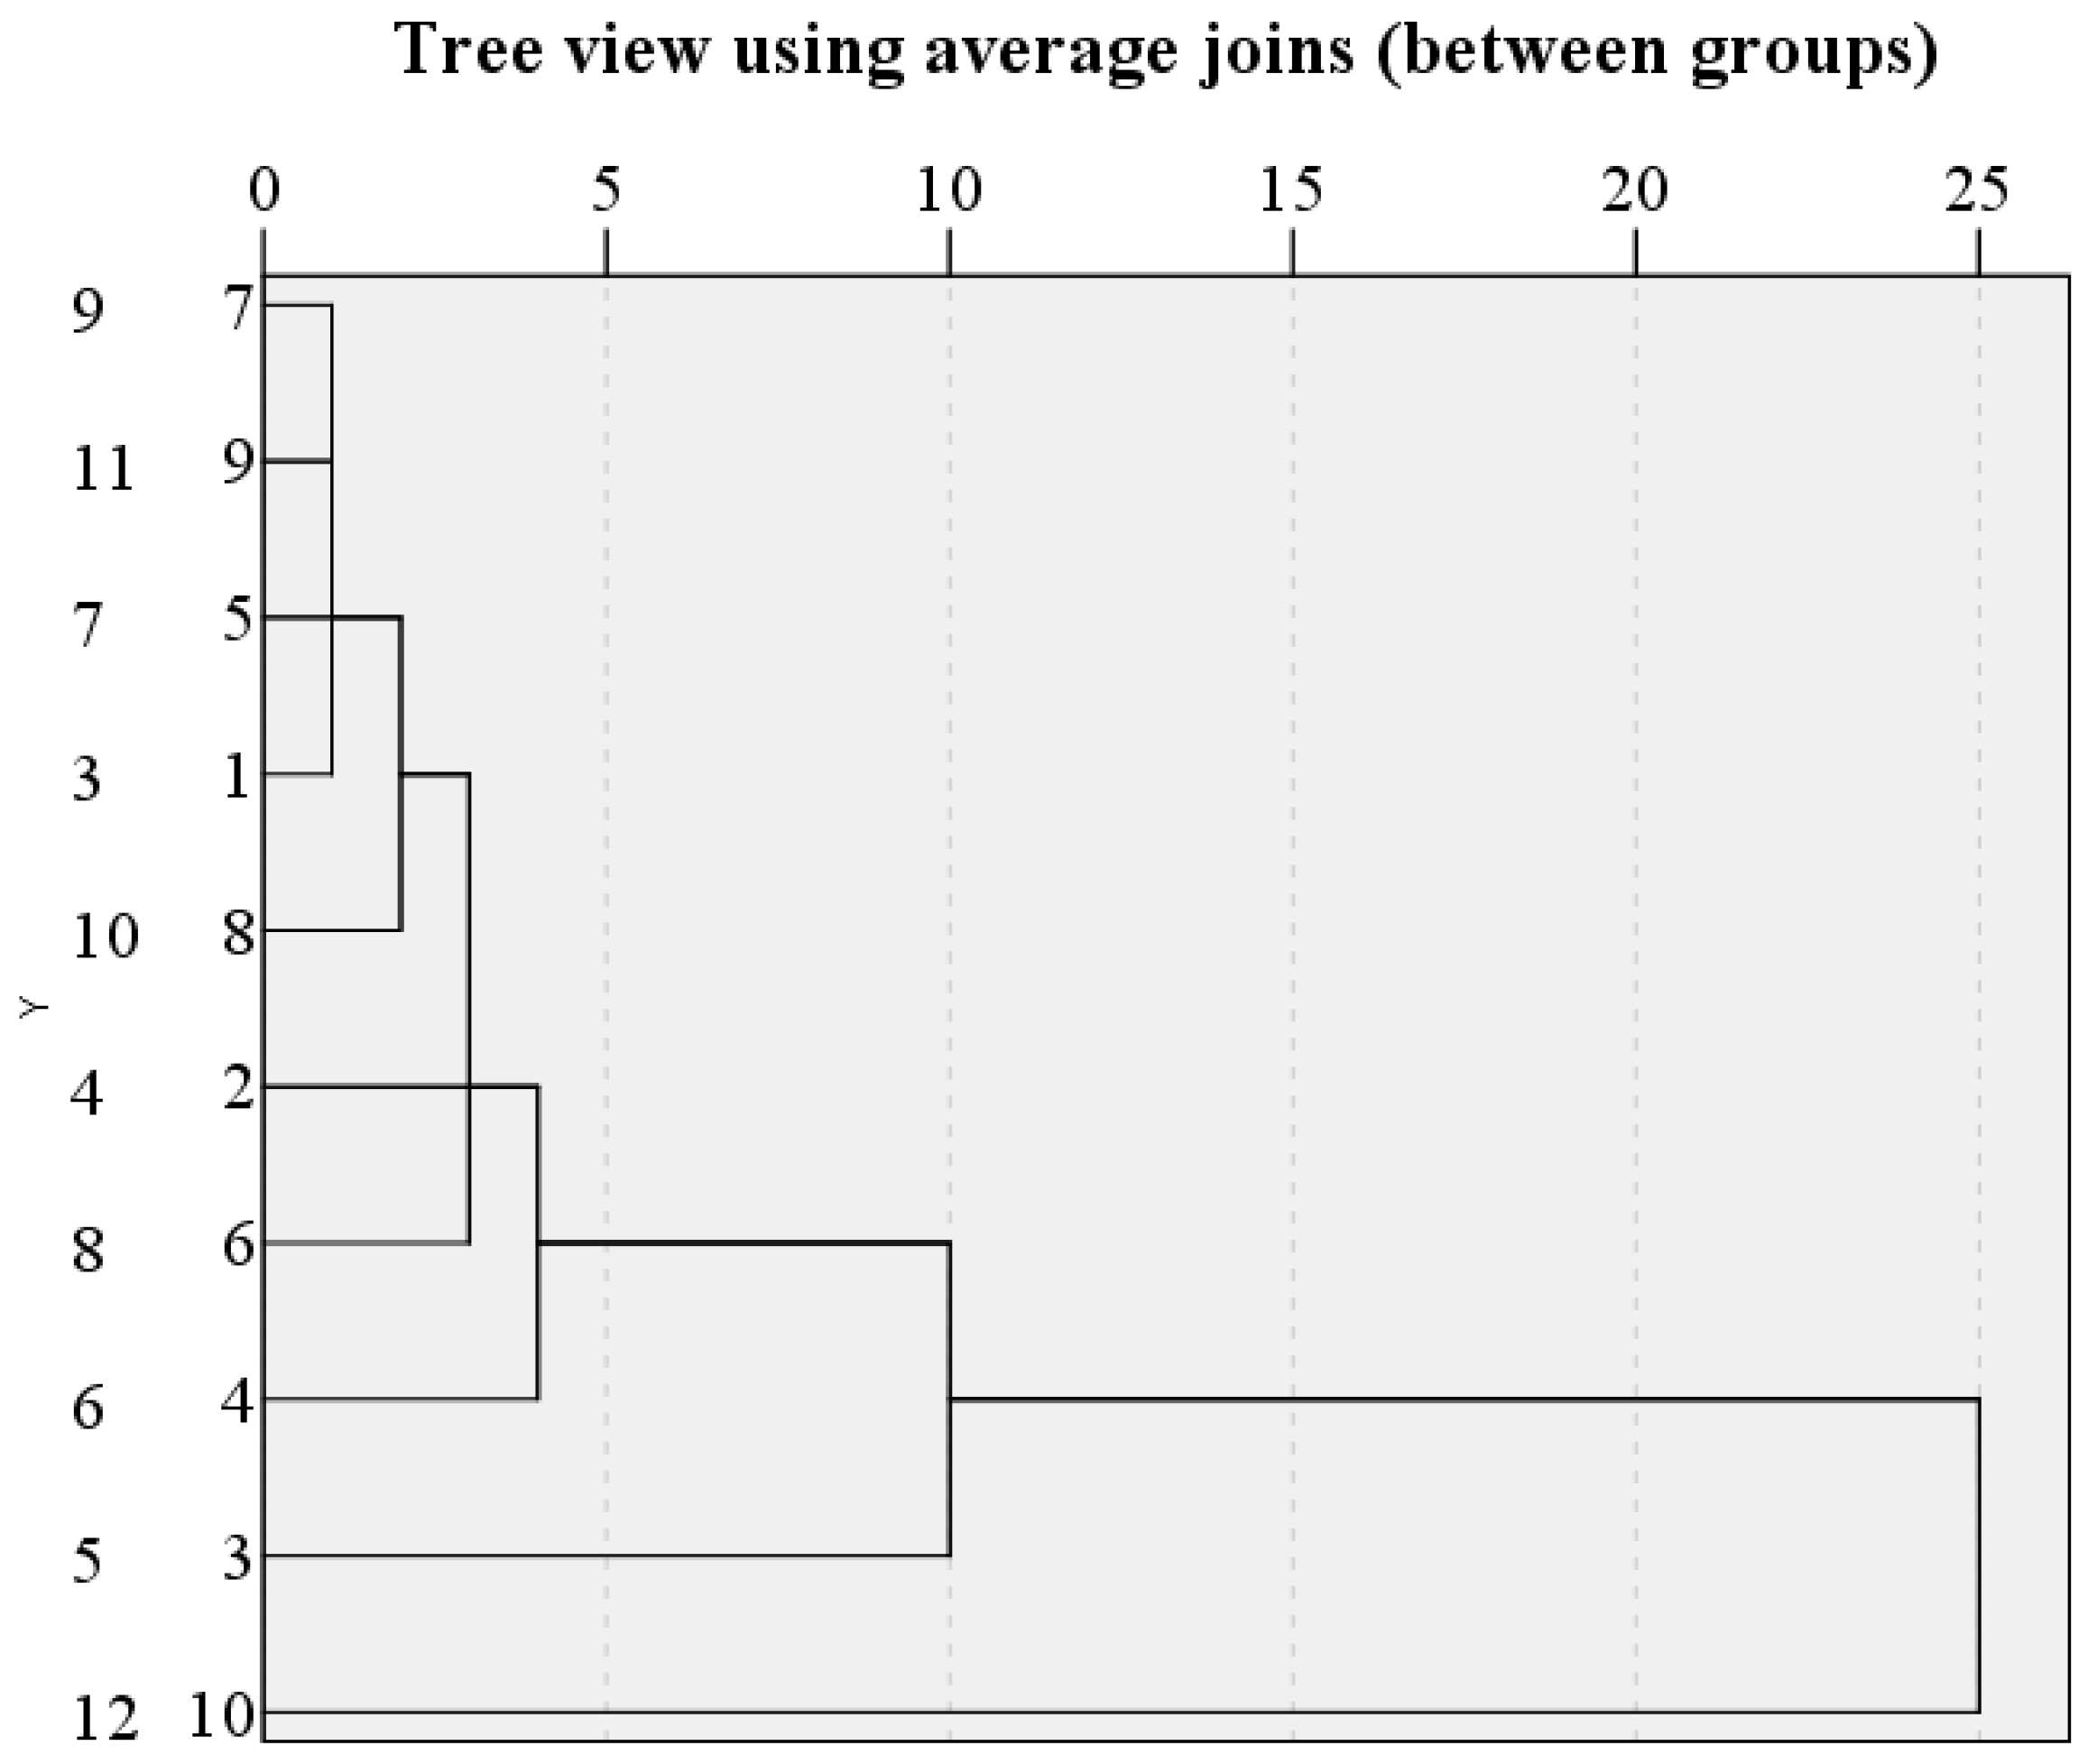
The water sample 12 from the Sangshuping mine in the Weibei mining area is quite different from the water in the Permian sandstone fissures in other production mines. From the phylogenetic cluster analysis, it can be seen that the Euclidean distance between this water sample and other production mine water types is larger than the artificial distance. The specified standard 15 indicates that the hydrogeochemical characteristics represented by this group of water samples are quite different from those of other production mines (Figure 12). Therefore, this group of water samples was excluded, and the remaining 3, 4, and water sampling points 5, 6, 7, 8, 9, 10, and 11 participated in the stepwise discriminant analysis.
The fissure water of the Carboniferous sandstone (limestone) in the Weibei mining area was also determined to be no more than 15 according to the selection criterion on the phylogenetic cluster analysis diagram (Figure 13). The Euclidean distance between fissure water types is 25, so water sample 19 was excluded. The remaining 13, 14, 15, 16, 17, and 18 water samples have a distance between classes of less than 15 and are distributed over a large portion of the mining area, so they can be selected for participation in the step-by-step discriminant analysis.
The Ordovician limestone water in the Weibei mining area is the same as that in the Carboniferous sandstone (limestone) water, and the clustering effect is better (Figure 14). Among the 11 sampling points in the mining area, except for the water sample No. 27 from Xiangshan Mine and No. 29 water sample from Sangshuping Mine, the inter-class Euclidean distance from other water samples is 25 and greater than 15, and the other water samples are all less than 15, which meets the standard; therefore, the remaining water samples, 20, 21, 22, 23, 24, 25, 26, 28, and 29, were selected for participation in the stepwise discriminant analysis.
Gradual Discriminant Analysis of Aquifer
- (1)
- Discriminant analysis
According to the results of the above systematic cluster analysis, 24 water sample points were selected from the 28 water sample points in the main water inrush aquifer in the Weibei mining area. Each water sample point included Li, Sc, Ti, V, Mn, Cr, Co, Ni, Cu, Zn, Rb, Mo, Sb, Cs, Ba, U, Sr, with 1, 2, and 3 as categorical variables, representing Permian sandstone fissures and Carboniferous sandstone (limestone) fissures, respectively. Ordovician limestone was found in three aquifers. Applying a multi-class stepwise LDA model under the FISHER criterion, the discriminant function can be obtained as:
where Li represents the lithium element concentration (μg/L); Sc represents the scandium element concentration (μg/L); V represents the vanadium element concentration (μg/L); Cr represents the chromium element concentration (μg/L); Ni represents the nickel element concentration (μg/L); Cu indicates copper element concentration (μg/L); Zn indicates zinc element concentration (μg/L); Rb indicates rubidium element concentration (μg/L); Mo indicates molybdenum element concentration (μg/L); Sb represents antimony element concentration (μg/L); Cs represents cesium element concentration (μg/L); Ba represents barium element concentration (μg/L); U represents uranium element concentration (μg/L); Sr represents strontium element concentration (μg/L).
When all samples are divided into three categories, the original 17 indicators of each sample are preferred to 14 through stepwise discriminant analysis. When it is necessary to distinguish and classify, it is only necessary to substitute the value of Li, Sc, V, Cr, Ni, Cu, Zn, Rb, Mo, Sb, Cs, Ba, U, Sr into each discriminant function to calculate the Y value of each type. The maximum Y value can be used to classify the samples into this category.
- (2)
- Discrimination effect test
Under the test level α = 0.05, F1,3 and F2,3 are both greater than F0.05(2,12), indicating that there are significant differences between the first class and the third class, and between the second class and the third class and the discriminant effect is better. However, F1,2 < F0.05(2, 12), indicating that there is no significant difference between the first and second types, the total discriminant significance rate is 67%, and the discriminant effect is poor (Table 6).
3.2.2. Principal Component Analysis of Trace Elements
Analysis of Eigenvalues and Cumulative Variance Contribution Rate
Correlation analysis was carried out on the original data of 17 kinds of trace elements, such as Li, V, Mn, Cr, Ni, Cu, Rb, Mo, Cs, Sb, Co, Zn, U, etc., the correlation coefficient matrix of trace elements was obtained, and principal component analysis was carried out to select the principal component whose eigenvalue is greater than 1. Since the first four eigenvalues are all greater than 1, and the cumulative contribution rate of the first four principal components is 73.39%, these four principal components concentrated 73.39% of the original 17 variables’ information. To meet the requirements of principal component selection, the first four eigenvectors were used as principal components, which can basically reflect the hydrogeochemical information reflected by the original 17 trace elements. The top four calculated eigenvalues and cumulative variance contribution rates (top 10 principal components) are listed in Table 7.
Interpretation of Principal Components of Groundwater
According to Table 7, using the relationship between the first four principal components and the analysis variables of trace elements, the discriminant expressions of the four principal components of the main water inrush sources in the Weibei mining area can be established as follows:
In the first principal component expression, the coefficients of Mo, Zn, U, and Ba are negative values, and the coefficients of other terms are between 0.496 and 0.91, of which the coefficients of Cs, Ni, Rb, Co, and Ti are all greater than 0.7000. The content of these five trace elements in aquifer coal and rock in the mining area is relatively high, which indicates that the dissolution and filtration of the aquifer water body, and the coal rock flowing through it, is the main factor for the increase in trace elements in the aquifer in the mining area. In the second principal component expression, the coefficients of Li, Cu, Zn, Mn, Rb, Mo, Cs, and Co are negative or very low, and the coefficients of Cr, Sb, and Sc are positive, all greater than 0.600. This indicates that these trace elements are easily absorbed by clay particles or plant roots and often undergo irreversible chemical adsorption. The huge, thick, loose layer produces various geochemical effects and then infiltrates into various aquifers in the mining area. In the third principal component expression, the coefficients of Mo and U are larger, and other coefficients are positive or negative. This shows that the third principal component is related to the recharge of various aquifers through the mining area or the rivers around the mining area. In the fourth principal component expression, the coefficients of trace elements are both positive and negative, the trace elements with positive and negative values are evenly distributed, and the absolute value of each coefficient is higher than that of the first, second, and third principal components. The absolute value of the term coefficient is small. From this, it can be inferred that the atmospheric precipitation did not undergo complex hydrogeochemical action before the formation of groundwater, and the fourth principal component is related to the direct recharge of atmospheric precipitation to various aquifers through structural fissures in the mining area.
The groundwater in the mining area, Quaternary loose rock aquifer, Permian sandstone fissure aquifer, Carboniferous sandstone (limestone) fissure aquifer, and Ordovician limestone karst fissure aquifer are closely related to these four main components. The first, second, third, and fourth principal components can be summarized as groundwater leaching, overcurrent, river recharge, and structural fissure recharge. The content distribution characteristics of trace elements in the groundwater of the Weibei mining area are, in the final analysis, the result of the comprehensive influence of atmospheric precipitation on various geochemical actions.
Discrimination of Principal Components of Hydrogeochemistry of Aquifers
The main components of the trace element cycle in water inrush aquifers in the mining area, especially those with water inrush threats, are complex and relate to many hydrogeochemical processes, with leaching, leakage, river recharge, and tectonic fissure recharge as the main ones. For a pair of production mines and a water inrush aquifer, if the main component discrimination is carried out using the content test results of several common trace elements with a good discrimination effect in the mining area, the principal components, characteristic values, cumulative variance contribution rates and principal component expressions of groundwater in aquifers of different production mines can be obtained, and these analysis elements will be different.
3.2.3. Analysis of Trace Element Content in the Mining Area
Selection of Characteristic Trace Elements
The groundwater in the Weibei mining area is generally moderately alkaline, which inhibits the migration of some metal elements or a small number of non-metallic elements; therefore, the changes in the content of trace elements are not uniform within the mining area and show different migration characteristics.
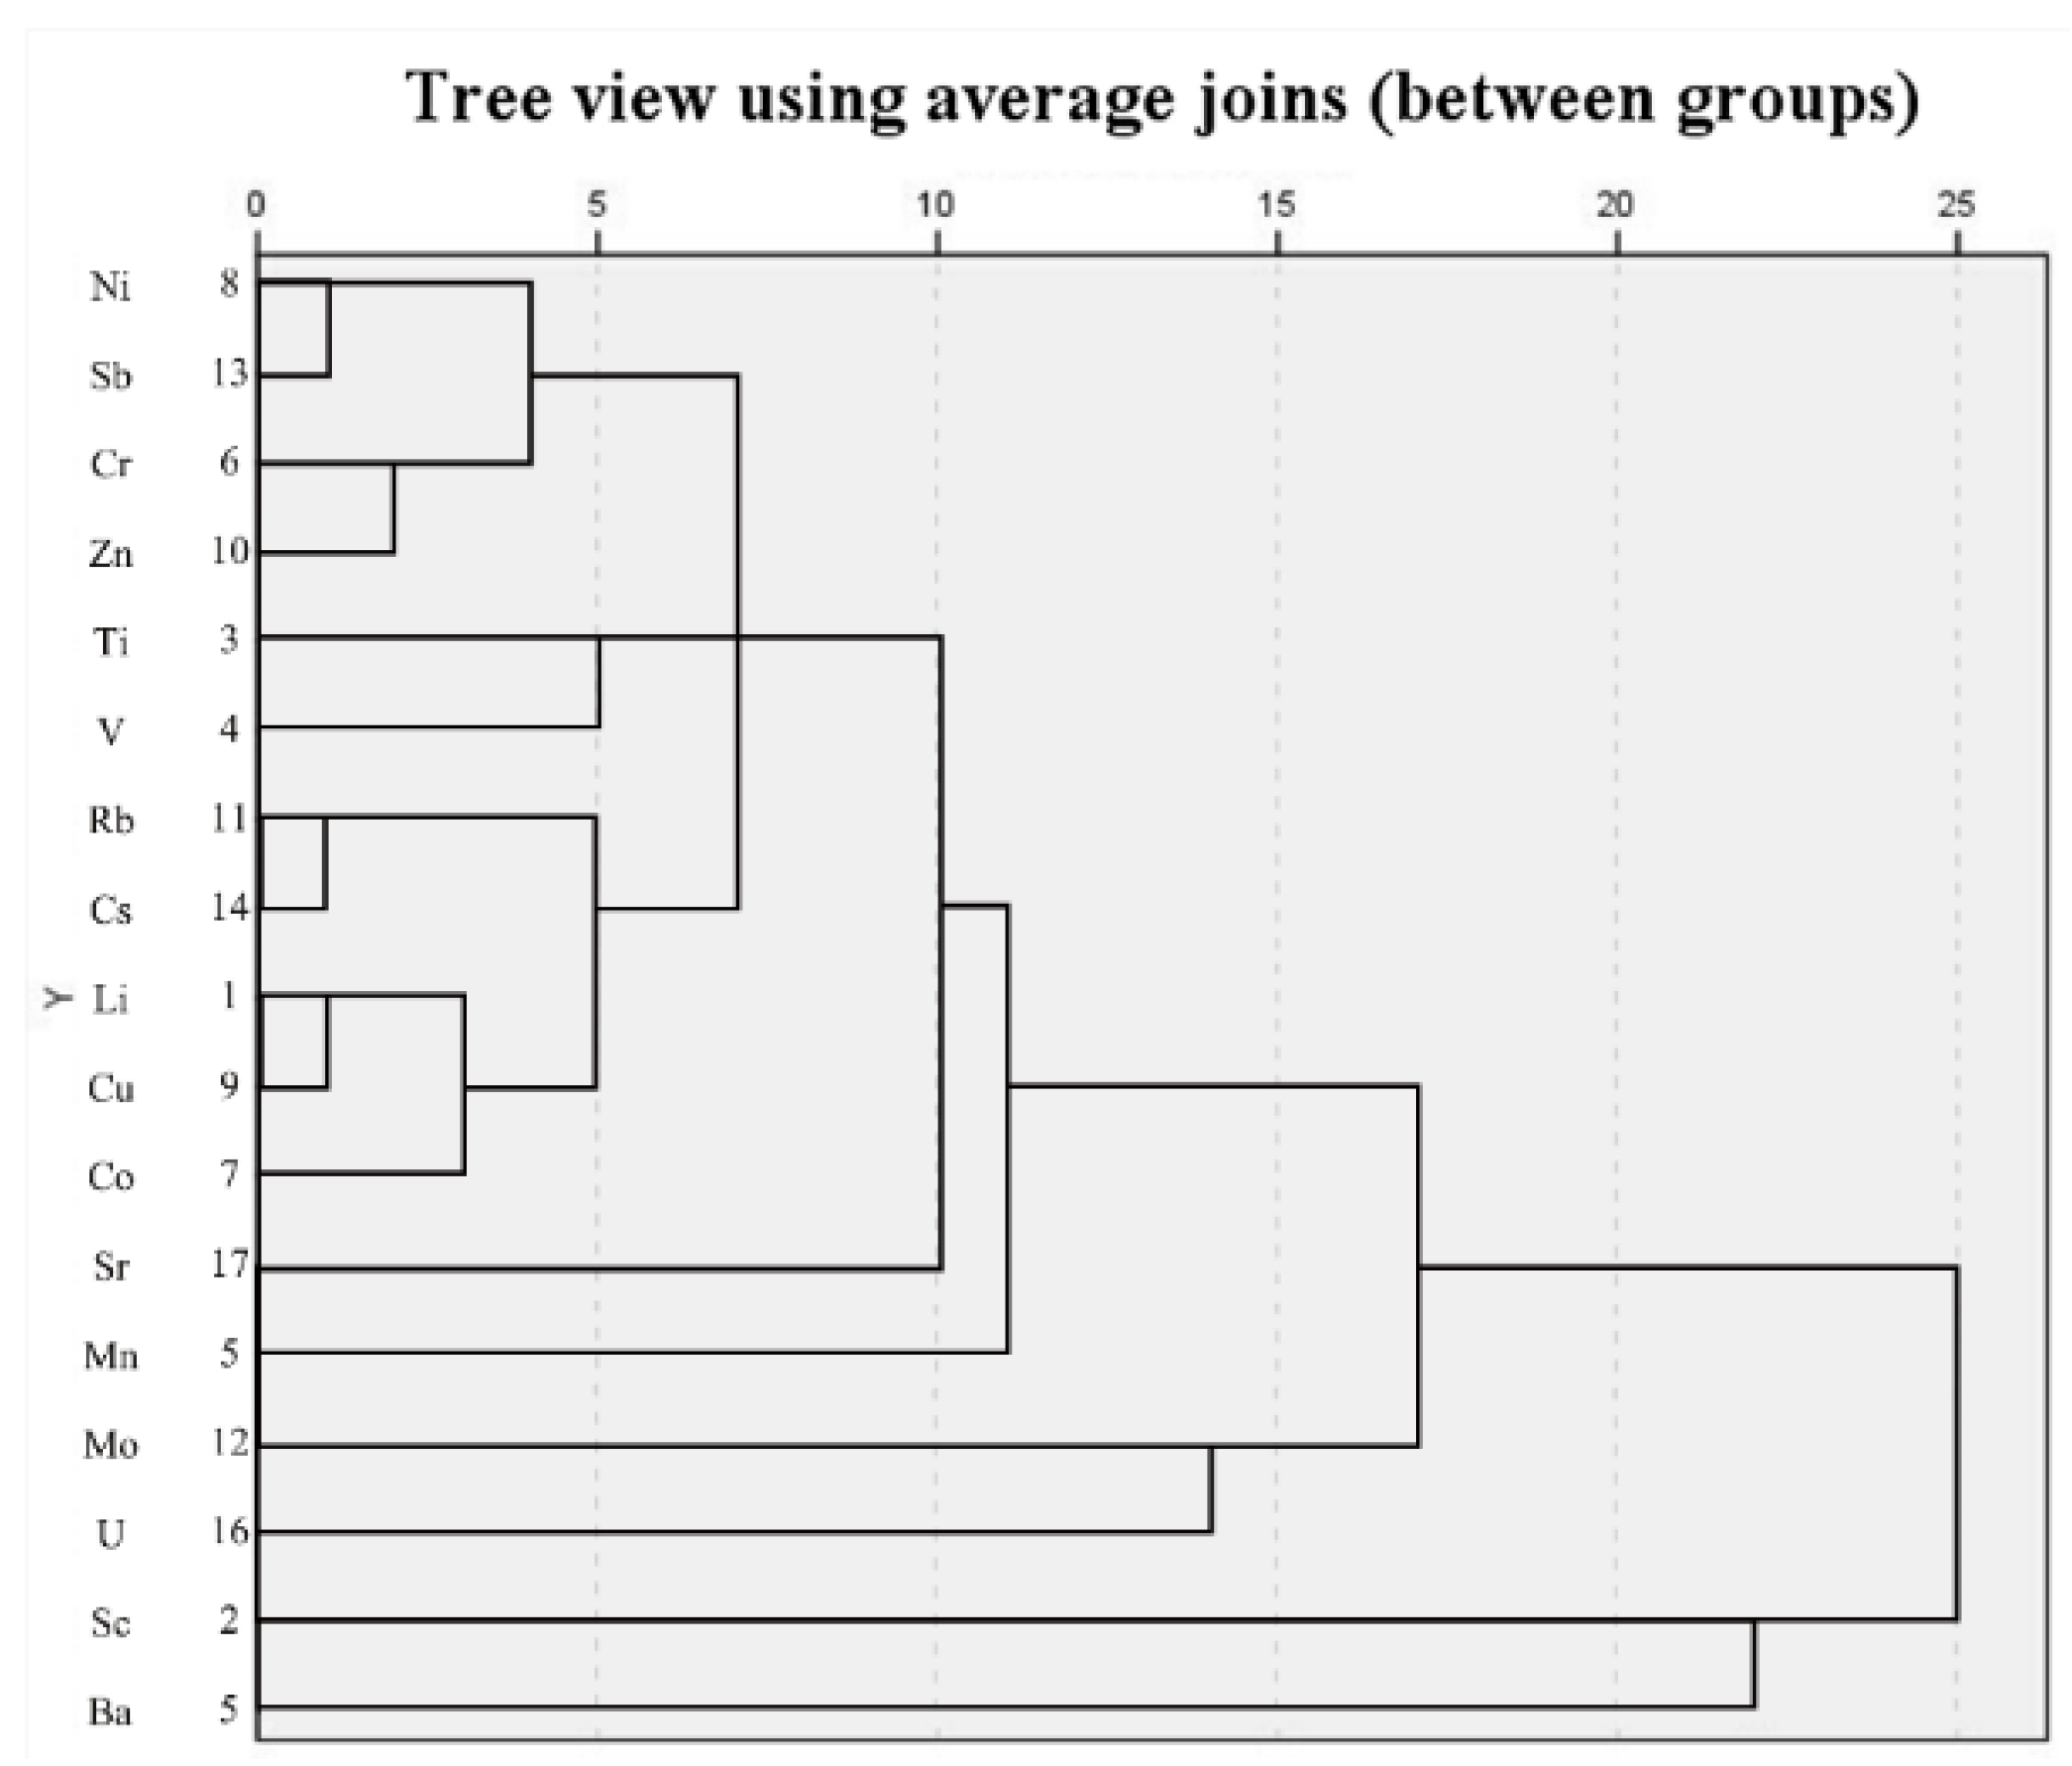
The content of trace elements in each water sample in the mining area was systematically clustered using the maximum correlation coefficient. Seventeen trace elements participate in the systematic clustering, including Sc, V, Mn, Cr, Co, Ni, Cu, Zn, Mo, Cs, Ba, etc. The clustering results are shown in Figure 15.
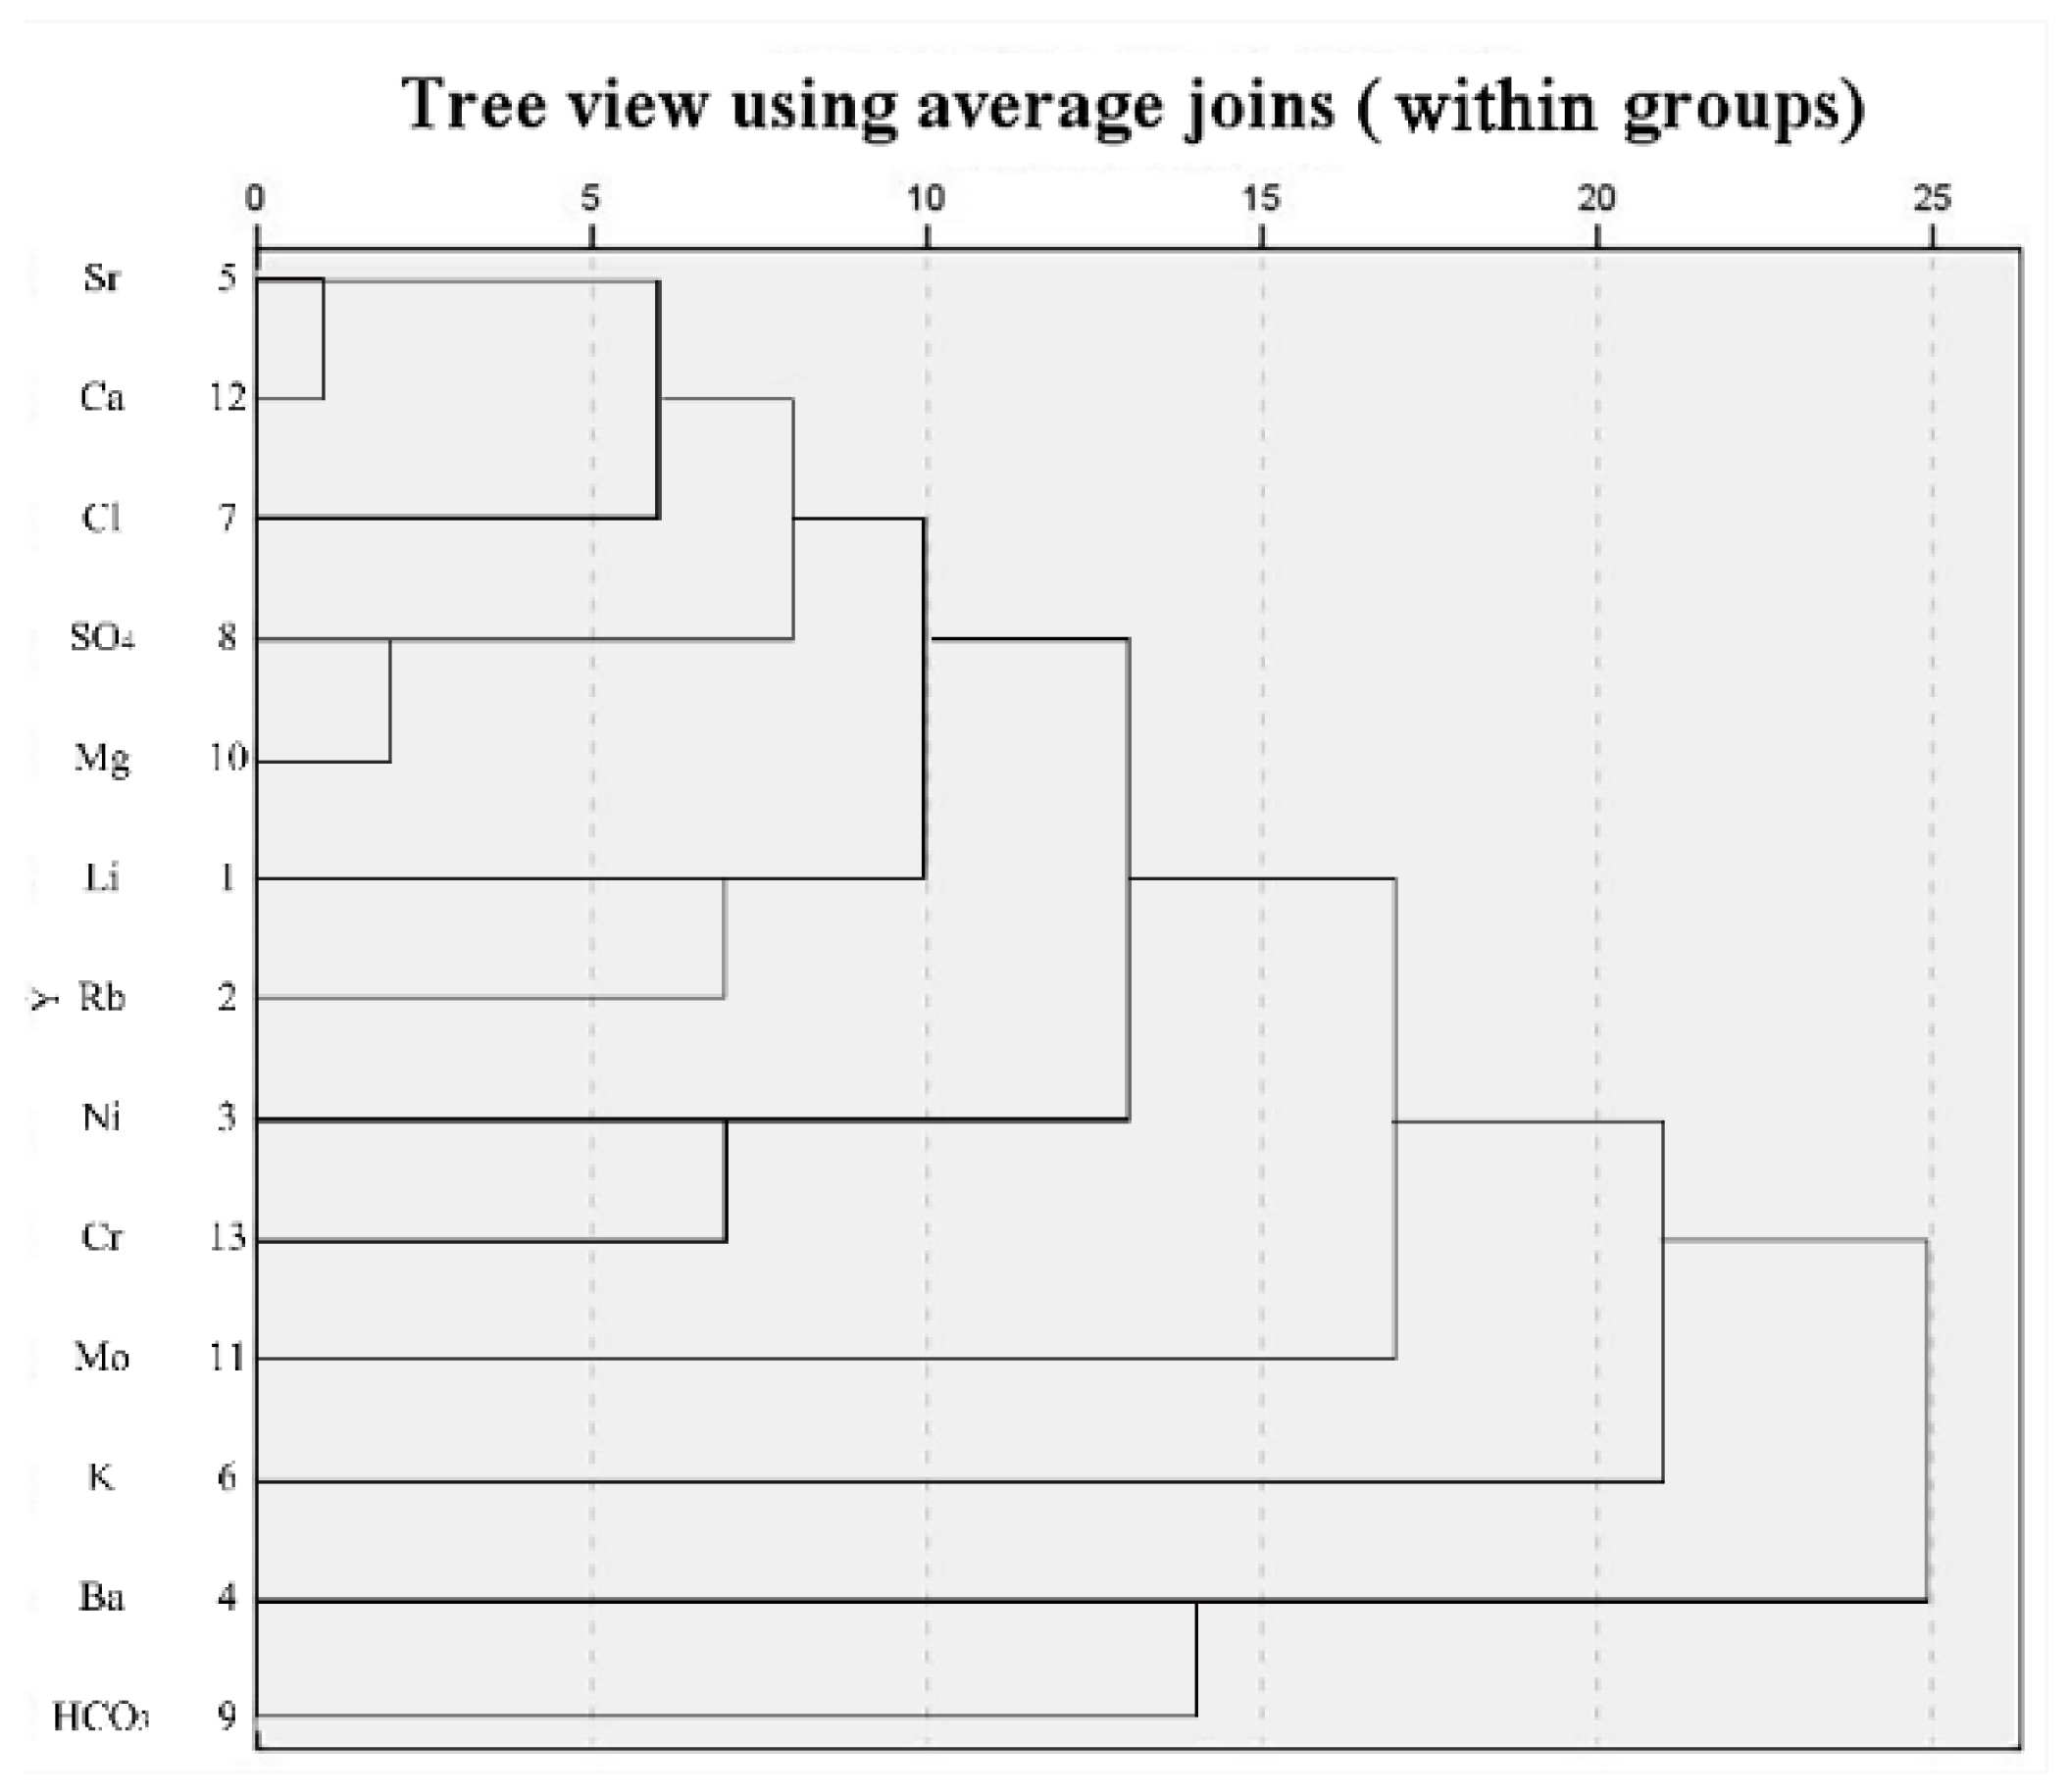
The figure shows large differences in the migration characteristics of trace elements in the groundwater of the Weibei mining area. The correlation between the main components of these trace elements highlights some mutually exclusive trace elements: Ni, Cr, Rb, Li, Sr, Mo, and Ba. Taking these mutually different elements and conventional ions such as CI−, SO42−, HCO3−, K+, Mg2+, and Ca2+ as analysis variables, the systematic clustering method is used for analysis, and the clustering results are shown in Figure 16. These trace elements are highly correlated with groundwater conventional ions and show a good correlation with each other. The migration of these seven trace elements in the groundwater system of the mining area is not isolated, but they interact with and restrict each other. These seven trace elements can be selected as characteristic trace elements to identify the type of water inrush source and analyze the hydrogeochemical characteristics of the mining area.
Relationship between Characteristic Trace Elements and Aquifers
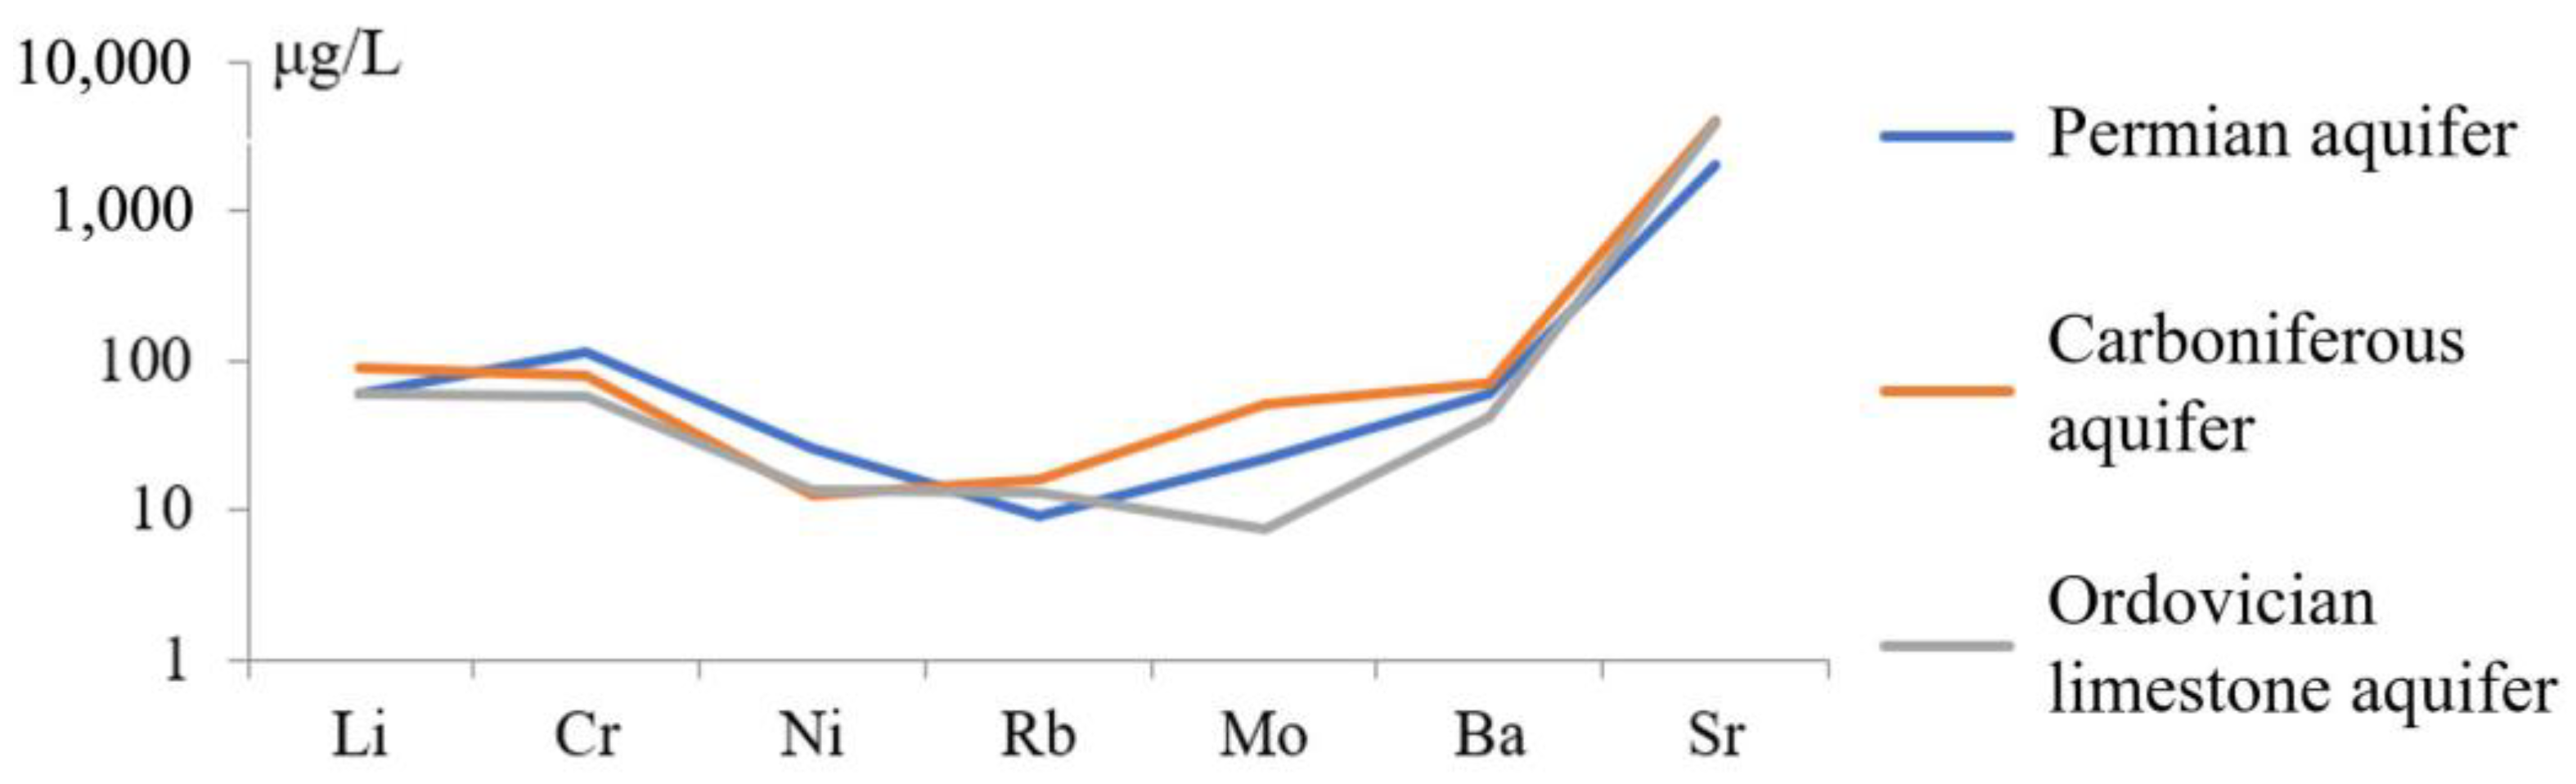
According to the contents of seven characteristic trace elements of Ni, Cr, Rb, Li, Sr, Mo, and Ba in the three aquifers in the mining area, the characteristic trace elements in the Permian aquifer, the Carboniferous aquifer, and the orus ash aquifer were drawn. Figure 17 shows the average content profile of the three threatened water inrush aquifers. The variation trend of seven trace elements in the three main water inrush aquifers in the mining area is roughly the same. However, with different aquifers, their migration characteristics and laws of groundwater are different. Some characteristic trace elements are relatively enriched in a certain type of aquifer, and some trace elements are relatively lacking in a certain type of aquifer.
3.2.4. Bayes Multi-Class LDA Model of Characteristic Trace Elements
Bayes Multi-Class LDA Model of Characteristic Trace Elements
Variables 1, 2 and 3 were taken as classification variables, representing the Permian, Taiyuan, and Ordovician aquifers, respectively, and the contents of seven characteristic trace elements in the mining area, Ni, Cr, Rb, Li, Sr, Mo, and Ba, were taken as explanatory variables, according to the principle of Bayes multi-class linear discriminant analysis. These were used to obtain Bayes multi-class linear discriminant functions. The estimated values of the discriminant function coefficients are shown in Table 8, and the retrospective discriminant results of the functions are shown in Table 9.
The Bayes multi-type LDA function of the three main water inrush aquifers of Permian, Taiyuan limestone, and Ordovician limestone, with seven characteristic trace elements as explanatory variables, were studied in the Weibei mining area. The absolute values of the coefficients of Cr and Ni are larger, and the coefficient of Sr is larger. The absolute value is small, and the absolute value of other characteristic trace element coefficients is medium. The absolute value of the coefficient of characteristic trace elements determines the type of aquifer in the water sample to a certain extent. In the Bayes multi-class LDA function, with these characteristic trace elements as explanatory variables, Cr and Ni play a larger role in the discrimination of water sample types, Sr is smaller, and other characteristic trace elements are medium. With characteristic trace elements as explanatory variables, the correct rate of the Bayes multi-class LDA model is 89.3%, the misjudgment rate is 10.07%, and the discriminant effect is relatively significant.
Conventional Ion Bayes Multi-Class LDA Model
Similarly, 1, 2, and 3 were taken as classification variables for the three aquifers of Permian, Taiyuan limestone, and Ordovician limestone, respectively, and the six conventional ions Cl−, SO42−, HCO3−, K+, Mg2+, and Ca2+ in the mining area were taken as explanatory variables. According to the principle of the Bayes multi-class LDA model, the Bayes multi-class LDA function was obtained. The estimated values of their function coefficients are shown in Table 10. The retrospective discriminant results are shown in Table 11.
Among the Bayes multi-class LDA function of the three inrush aquifers of Permian, Taiyuan limestone, and Ordovician limestone in the Weibei mining area, which take six conventional ions as the explanatory variables, the absolute values of the coefficients of Cl−, SO42−, K+ + Na+ and Ca2+ are similar, while the absolute values of the coefficients of Mg2+ are large. Among the Bayes multi-class LDA function with conventional ions as explanatory variables, these are generally balanced. The accuracy of Bayes multi-class linear discrimination analysis with conventional ions as explanatory variables was 64.3%, and the error rate was 35.7%. The discrimination effect was poor.
Bayes Multi-Class LDA Model of Characteristic Trace Elements Corrected by Conventional Ions
Although the Bayes multi-class LDA model of characteristic trace elements has higher accuracy than the conventional model, it still cannot meet the needs of mine water control work. To improve the accuracy of characteristic trace elements in the mining area, it is necessary to use conventional ions for correction. As mentioned above, 1, 2, and 3 were used as categorical variables, representing the three aquifers of Permian, Taiyuan limestone, and Ordovician limestone, respectively. The contents of seven characteristic trace elements and conventional ions in the mining area were used as explanatory variables. Based on the principle of the quasi-LDA model, the Bayes multi-class LDA function was obtained. The estimated value of the discriminant function coefficient is shown in Table 12, and the retrospective discriminant result of the function is shown in Table 13.
Bayes multi-type LDA function of the three main water inrush aquifers of Permian, Taiyuan limestone, and Ordovician limestone were used as explanatory variables. In addition to the influence of the variables on the water sample, the absolute values of the coefficients of Cr and Ni in the characteristic trace elements are larger and play a larger role in the discrimination process, while the effect of Sr is smaller and the coefficients of other characteristic trace elements are small and roughly equivalent. The discriminative role played by conventional ions is generally balanced.
In sum, in the modified Bayes multi-class LDA function of characteristic trace elements in the mining area, the discriminant role played by the characteristic trace elements and conventional ions in the discriminant process, and the discriminative role played in their respective Bayes multi-class LDA function are the same, with some differences in the distribution of coefficients. The correct rate for the Bayes multi-class LDA model of trace elements, when corrected by conventional ions, was 92.9%, and the discrimination effect was significantly improved.
4. Discussion
In the groundwater circulation system, the smaller the TDS, the more sufficient the water recharge and the shorter the groundwater retention time [34]. This also leads to the relative weakening of hydrogeochemical effects such as karst filtration. In a groundwater circulation system, at a certain level, water quality is generally considered to migrate from a small TDS area to a large TDS area. The tighter the contour line, the more sufficient the filtration effect with the surrounding karst; the sparser the contour line, the weaker the filtration effect with the surrounding karst. Among them, limestone water of the Taiyuan formation and Ordovician limestone water in the Weibei mining area are the two major karst water inrush water sources, and the water-bearing medium is composed of carbonate minerals such as limestone, marl, and dolomite. The water quality of too-ash and ash water in the whole mining area varies greatly with the geographical distribution of the mining area. The groundwater anions and cations in the two aquifers show their own characteristics, which are distinct from the recharge area, the runoff area and the discharge area or the stagnation area. On the one hand, carbonate rocks in karst strata are easily dissolved by water and transported by hydrodynamics; The relationship shows that there is a good linear correlation between the conventional ions and the TDS in the ash water. Therefore, it is possible to study the hydrochemical characteristics of the karst water aquifer subsystem and the Orthodox ash aquifer subsystem as a single karst water system to analyze the relationship between the conventional ions of karst water and TDS, especially the relationship between Ca2+ and TDS, which is helpful for understanding the karst water system. The water cycle is very important. In addition, most of the conventional ion content in the Weibei mining area increases with the increase of TDS, which shows the accuracy and reliability of using TDS as a comprehensive index to simulate the groundwater concentration gradient field to analyze its cycle characteristics [35]. The karst water system of the Tongchuan-Pucheng-Heyang hydrogeological unit is closely related to the overlying shallow aquifer, surface water, and atmospheric precipitation. The dissolution of limestone and dolomite reaches saturation in the recharge area, and the karst groundwater in this area has poor solubility in the karst minerals in this area. In addition, the currently exploited Hancheng hydrogeological unit is the middle and deep detention area of the karst water system, with a relatively closed environment and poor exchange environment with surface water and atmospheric precipitation.
Twenty water samples were selected from the conventional hydrochemical test results using the cluster stepwise discriminant analysis method, and three hydrochemical discriminant models of the Permian sandstone fractures, the Carboniferous sandstone (limestone) fractures, and the Ordovician limestone aquifers in the Weibei coalfield were established using the ten indicators of K+ + Na+, Ca2+, Mg2+, NH4+, Cl−, SO42−, HCO3−, pH value, total hardness, and TDS, and total hardness. The model was found to be able to better distinguish the source of water inrush through the Mahalanobian distance test. Through F test, it is considered that the six selected variables K+ + Na+, Mg2+, NH4+, Cl−, SO42−, and pH have significant discrimination ability and good effect, and effectively identify the three main water-inrush aquifers in Weibei mining area.
According to the difference in the principal component discriminant analysis results, combined with the regional geological background and structural geological characteristics of the aquifer in the mining area, the hydrogeochemical principal component discrimination can be carried out for different types of groundwater [36]. This can better determine the trace element hydrogeochemical characteristics of the water inrush source in the mining area, accurately identify the water source, and serve the safe production of coal mines. Based on the principal component analysis and the cluster stepwise discriminant analysis method, twenty-four water samples and fourteen trace element indicators were selected from the conventional hydrochemical test results, and the principal component analysis discriminant model of trace elements for four main aquifers was established. On this basis, seven characteristic trace elements, Ni, Cr, Rb, Li, Sr, Mo, and Ba, are selected as the characteristic trace elements to identify the type of water inrush source and analyze the hydrogeochemical characteristics of the mining area. According to Bayes multi-class LDA model, the correct rate of discrimination with characteristic trace elements as explanatory variables is 89.3%, and the wrong rate is 10.07%. The correct rate of discrimination with conventional ions as explanatory variables was 64.3%, and the false rate was 35.7%. In order to improve the discrimination probability, the correct rate of Bayes multi-class linear discrimination of characteristic trace elements modified by conventional ions is 92.9%, and the discrimination effect is significantly improved.
5. Conclusions
Based on the regional hydrogeological conditions of the Weibei coalfield, the water inrush source in the mining area was selected as the research object, and the hydrogeochemical characteristics of trace elements were obtained. For the Quaternary loose aquifer, the Permian sandstone aquifer, the Carboniferous aquifer, and the Ordovician limestone aquifer, regular and trace water inrush source discrimination models were established for mathematical verification. Ten indicators were extracted from each water sample point to reflect the hydrogeological and chemical characteristics. The six indicators selected by the cluster stepwise discriminant analysis method through the Mahalanobis distance test have the significant discriminant ability and good effect and can better distinguish the water inrush sources. Through the principal component analysis and content characteristics analysis of trace elements, it is believed that the content-change trend of seven characteristic trace elements in the three aquifers is roughly the same; namely, Ni, Cr, Rb, Li, Sr, Mo, and Ba. However, with different aquifers, their migration characteristics and regular pattern in groundwater are different. A key comparison can be made between the modified trace element model and the conventional element model. The accuracy of the conventional element model was higher, with an accuracy rate of 92.9%. This lays a foundation for the systematic understanding of regional hydrogeological conditions in the Weibei coalfield and the establishment of a water inrush source discrimination model in the Weibei mining area. The research results can be further extended to all hydrogeological units in coal mining enterprises, and even to the whole country, with broad application prospects.
Author Contributions
Conceptualization, W.X., E.H. and W.C.; methodology, W.X., E.H., X.Z. and W.C.; software, W.X., X.Z. and Y.Y.; validation, W.X., E.H. and W.C.; formal analysis, W.X., E.H., P.T., I.I. and W.C.; investigation, W.X., X.Z. and Y.Y.; writing—original draft preparation, W.X., X.Z., Y.Y. and W.C.; writing—review and editing, W.X., E.H., P.T., I.I. and W.C.; visualization, W.X., X.Z. and Y.Y.; supervision, W.X., E.H., P.T., I.I. and W.C.; project administration, W.X., E.H. and W.C. All authors have read and agreed to the published version of the manuscript.
Funding
This research received no external funding.
Data Availability Statement
Not applicable.
Acknowledgments
Not applicable.
Conflicts of Interest
The authors declare no conflict of interest.
Nomenclature
| Symbols | |
| q | Unit water inflow |
| K | the permeability coefficient |
| m | the number of indicators |
| n | the number of samples |
| DE | Euclidean distance |
| i, j | the sample serial number |
| dij | the similarity of any two points in the m-dimensional space |
| Xil, Xjl | each sample index |
| Y(An) | the discriminant function of the An-th class |
| Cn(An) | discriminant coefficient of the An-th class |
| q(An) | the event probability of the An-th class |
| Y | the discriminant value |
| F1,2 | the test value between test classes 1 and 2 |
| n1 | the number of samples of the first type |
| n2 | the number of samples of the second type |
| P | the number of discriminant variables |
| the generalized Mahalanobis distance | |
| S | the covariance matrix between variables |
| the sample mean vector of the first category | |
| the sample mean vector of the second category | |
| Z | the degrees of freedom |
| the F critical value at the significance level α | |
| the P-dimensional random variable | |
| I | the constant vector |
| t | the number of element variables |
| G | the number of precursors |
| Ag | the sample of the G precursors |
| Ah | the sample of the H precursors |
| {R} | the p-dimensional space |
| L(g/h) | the loss caused by misclassification of samples originally belonging to the Ah parent into the Ag parent |
| P{g/h} | the probability caused by misclassification of samples originally belonging to the Ag parent into the Ah parent |
| the class G probability distribution density | |
| Wh | the average loss caused by misclassifying the sample originally belonging to the Ag parent into the Ah parent |
| the class H prior probability | |
| the probability caused by the misclassification of samples originally belonging to the Ah parent into the Ag parent | |
| WR | the average loss of misclassification of the G-type parent |
| Wg | the average loss caused by misclassifying the sample originally belonging to the Ah parent into the Ag parent |
| the class H probability distribution density | |
| qg | the class G prior probability |
| ag | the mean vector of Ag |
| fx(x) | the probability density function of Ag |
| qgfg(x) | the G discriminant functions |
| yg(x) | the multi-class LDA functions of the normal parent under the Bayes criterion |
| cig | the multi-class LDA coefficient |
| K+ | the potassium ion concentration |
| Na+ | the sodium ion concentration |
| Mg2+ | the magnesium ion concentration |
| NH4+ | the ammonium ion concentration |
| Cl− | the chloride ion concentration |
| SO42− | the sulfate ion concentration |
| Li | the lithium element concentration |
| Sc | he scandium element concentration |
| V | the vanadium element concentration |
| Cr | the chromium element concentration |
| Ni | the nickel element concentration |
| Cu | the copper element concentration |
| Zn | the zinc element concentration |
| Rb | the rubidium element concentration |
| Mo | the molybdenum element concentration |
| Sb | the antimony element concentration |
| Cs | the cesium element concentration |
| Ba | the barium element concentration |
| U | the uranium element concentration |
| Sr | the strontium element Concentration |
| Greek symbols | |
| i | replace the original p trace element variables X1, X2, …, Xp |
| the obtained eigenroot | |
| Abbreviations | |
| LDA | linear discriminant analysis |
| TDS | total dissolved solid |
References
- Liu, X.; Pei, T.; Zhou, C.; Du, Y.; Ma, T.; Xie, C.; Xu, J. A systems dynamic model of a coal-based city with multiple adaptive scenarios: A case study of Ordos, China. Sci. China Earth Sci. 2017, 61, 302–316. [Google Scholar] [CrossRef]
- Zhao, D.; Wu, Q.; Cui, F.; Xu, H.; Zeng, Y.; Cao, Y.; Du, Y. Using random forest for the risk assessment of coal-floor water inrush in Panjiayao Coal Mine, northern China. Hydrogeol. J. 2018, 26, 2327–2340. [Google Scholar] [CrossRef]
- Carranza, F.; Romero, R.; Mazuelos, A.; Iglesias, N. Recovery of Zn from acid mine water and electric arc furnace dust in an integrated process. J. Environ. Manag. 2016, 165, 175–183. [Google Scholar] [CrossRef]
- Qin, L.; Ben-Zion, Y.; Qiu, H.; Share, P.E.; Ross, Z.E.; Vernon, F.L. Internal structure of the San Jacinto fault zone in the trifurcation area southeast of Anza, California, from data of dense seismic arrays. Geophys. J. Int. 2018, 213, 98–114. [Google Scholar] [CrossRef] [Green Version]
- Chen, Y.; Tang, L.; Zhu, S. Comprehensive study on identification of water inrush sources from deep mining roadway. Environ. Sci. Pollut. Res. 2022, 29, 19608–19623. [Google Scholar] [CrossRef] [PubMed]
- Huang, Z.; Zeng, W.; Zhao, K. Experimental investigation of the variations in hydraulic properties of a fault zone in Western Shandong, China. J. Hydrol. 2019, 574, 822–835. [Google Scholar] [CrossRef]
- Ma, D.; Rezania, M.; Yu, H.-S.; Bai, H.-B. Variations of hydraulic properties of granular sandstones during water inrush: Effect of small particle migration. Eng. Geol. 2017, 217, 61–70. [Google Scholar] [CrossRef] [Green Version]
- Liu, S.; Li, W.; Wang, Q. Height of the water-flowing fractured zone of the Jurassic coal seam in northwestern China. Mine Water Environ. 2018, 37, 312–321. [Google Scholar] [CrossRef]
- Gui, H.; Lin, M. Types of water hazards in China coalmines and regional characteristics. Nat. Hazards 2016, 84, 1501–1512. [Google Scholar] [CrossRef]
- Gui, H.; Lin, M.; Song, X. Features of separation water hazard in China coalmines. Water Pract. Technol. 2017, 12, 146–155. [Google Scholar] [CrossRef]
- Wu, Q.; Zhao, D.; Wang, Y.; Shen, J.; Mu, W.; Liu, H. Method for assessing coal-floor water-inrush risk based on the variable-weight model and unascertained measure theory. Hydrogeol. J. 2017, 25, 2089–2103. [Google Scholar] [CrossRef]
- Sun, L. Statistical analyses of groundwater chemistry in coalmine and its hydrological implications. J. Appl. Sci. Eng. 2017, 20, 335–344. [Google Scholar]
- Zhang, H.; Xu, G.; Chen, X.; Mabaire, A.; Zhou, J.; Zhang, Y.; Zhang, G.; Zhu, L. Groundwater hydrogeochemical processes and the connectivity of multilayer aquifers in a coal mine with karst collapse columns. Mine Water Environ. 2020, 39, 356–368. [Google Scholar] [CrossRef]
- Liu, J.; Wang, H.; Jin, D.; Xu, F.; Zhao, C. Hydrochemical characteristics and evolution processes of karst groundwater in Carboniferous Taiyuan formation in the Pingdingshan coalfield. Environ. Earth Sci. 2020, 79, 151. [Google Scholar] [CrossRef]
- Chen, Y.; Zhu, S.; Xiao, S. Discussion on controlling factors of hydrogeochemistry and hydraulic connections of groundwater in different mining districts. Nat. Hazards 2019, 99, 689–704. [Google Scholar] [CrossRef]
- Chen, Y.; Zhu, S.; Yang, C.; Xiao, S. Analysis of hydrochemical evolution in main discharge aquifers under mining disturbance and water source identification. Environ. Sci. Pollut. Res. Int. 2021, 28, 26784–26793. [Google Scholar] [CrossRef] [PubMed]
- Liu, R.; Peng, J.; Leng, Y.; Lee, S.; Panahi, M.; Chen, W.; Zhao, X. Hybrids of support vector regression with grey wolf optimizer and firefly algorithm for spatial prediction of landslide susceptibility. Remote Sens. 2021, 13, 4966. [Google Scholar] [CrossRef]
- Liu, Q.; Sun, Y.; Xu, Z.; Xu, G. Application of the comprehensive identification model in analyzing the source of water inrush. Arab. J. Geosci. 2018, 11, 189. [Google Scholar] [CrossRef]
- Ayadi, R.; Trabelsi, R.; Zouari, K.; Saibi, H.; Itoi, R.; Khanfir, H. Hydrogeological and hydrochemical investigation of groundwater using environmental isotopes (18O, 2H, 3H, 14C) and chemical tracers: A case study of the intermediate aquifer, Sfax, southeastern Tunisia. Hydrogeol. J. 2018, 26, 983–1007. [Google Scholar] [CrossRef]
- Bouzourra, H.; Bouhlila, R.; Elango, L.; Slama, F.; Ouslati, N. Characterization of mechanisms and processes of groundwater salinization in irrigated coastal area using statistics, GIS, and hydrogeochemical investigations. Environ. Sci. Pollut. Res. 2015, 22, 2643–2660. [Google Scholar] [CrossRef]
- Dong, S.; Feng, H.; Xia, M.; Li, Y.; Wang, C.; Wang, L. Spatial–temporal evolutions of groundwater environment in prairie opencast coal mine area: A case study of Yimin Coal Mine, China. Environ. Geochem. Health 2020, 42, 3101–3118. [Google Scholar] [CrossRef] [PubMed]
- Chen, S.; Gui, H. Hydrogeochemical characteristics of groundwater in the coal-bearing aquifer of the Wugou coal mine, northern Anhui Province, China. Appl. Water Sci. 2017, 7, 1903–1910. [Google Scholar] [CrossRef] [Green Version]
- Ju, Q.; Hu, Y. Source identification of mine water inrush based on principal component analysis and grey situation decision. Environ. Earth Sci. 2021, 80, 157. [Google Scholar] [CrossRef]
- Guo, Y.; Wei, J.; Gui, H.; Zhang, Z.; Hu, M. Evaluation of changes in groundwater quality caused by a water inrush event in Taoyuan coal mine, China. Environ. Earth Sci. 2020, 79, 528. [Google Scholar] [CrossRef]
- Chen, K.; Sun, L.; Xu, J. Statistical analyses of groundwater chemistry in the Qingdong coalmine, northern Anhui province, China: Implications for water–rock interaction and water source identification. Appl. Water Sci. 2021, 11, 50. [Google Scholar] [CrossRef]
- Sun, L.H. Statistical analysis of hydrochemistry of groundwater and its implications for water source identification: A case study. Arab. J. Geosci. 2014, 7, 3417–3425. [Google Scholar] [CrossRef]
- Jiang, C.; An, Y.; Zheng, L.; Huang, W. Water source discrimination in a multiaquifer mine using a comprehensive stepwise discriminant method. Mine Water Environ. 2021, 40, 442–455. [Google Scholar] [CrossRef]
- Liu, W.; Yu, J.; Shen, J.; Zheng, Q.; Han, M.; Hu, Y.; Meng, X.J.G. Application of clustering and stepwise discriminant analysis based on hydrochemical characteristics in determining the source of mine water inrush. Geofluids 2021, 2021, 6670645. [Google Scholar] [CrossRef]
- Gall, I.K.; Ritzi, R.W., Jr.; Baldwin, A.D., Jr.; Pushkar, P.D.; Carney, C.K.; Talnagi, J.F., Jr. The correlation between bedrock uranium and dissolved radon in ground water of a fractured carbonate aquifer in southwestern Ohio. J. Ground Water 2010, 33, 197–206. [Google Scholar] [CrossRef]
- Xiao, J.; Jin, Z.; Wang, J. Geochemistry of trace elements and water quality assessment of natural water within the Tarim River Basin in the extreme arid region, NW China. J. Geochem. Explor. 2014, 136, 118–126. [Google Scholar] [CrossRef]
- Nematollahi, M.J.; Keshavarzi, B.; Moore, F.; Nasrollahzadeh Saravi, H.; Rahman, M.M. Hydrogeochemical and ecological risk assessments of trace elements in the coastal surface water of the southern Caspian Sea. Environ. Monit. Assess. 2021, 193, 452. [Google Scholar] [CrossRef] [PubMed]
- Xu, B.; Huang, K.; Liu, C.-L. Maxi-min discriminant analysis via online learning. Neural Netw. 2012, 34, 56–64. [Google Scholar] [CrossRef] [PubMed]
- Kim, H.; Drake, B.L.; Park, H. Multiclass classifiers based on dimension reduction with generalized lda. Pattern Recognit. 2007, 40, 2939–2945. [Google Scholar] [CrossRef] [Green Version]
- McNab, W.W.; Singleton, M.J.; Moran, J.E.; Esser, B.K. Ion exchange and trace element surface complexation reactions associated with applied recharge of low-TDS water in the San Joaquin Valley, California. Appl. Geochem. 2009, 24, 129–137. [Google Scholar] [CrossRef]
- Motevalli, A.; Moradi, H.R.; Javadi, S. A comprehensive evaluation of groundwater vulnerability to saltwater up-coning and sea water intrusion in a coastal aquifer (case study: Ghaemshahr-juybar aquifer). J. Hydrol. 2018, 557, 753–773. [Google Scholar] [CrossRef]
- Amiri, V.; Nakagawa, K. Using a linear discriminant analysis (LDA)-based nomenclature system and self-organizing maps (SOM) for spatiotemporal assessment of groundwater quality in a coastal aquifer. J. Hydrol. 2021, 603, 127082. [Google Scholar] [CrossRef]
Figure 1.
Scope of study area.

Figure 2.
Field Sampling.

Figure 3.
Sampling Points.

Figure 4.
Schematic diagram of a deep-hole water dispenser.

Figure 5.
TDS contour line of Permian sandstone fissured aquifer.

Figure 6.
TDS contour line of Carboniferous sandstone (limestone) aquifer.

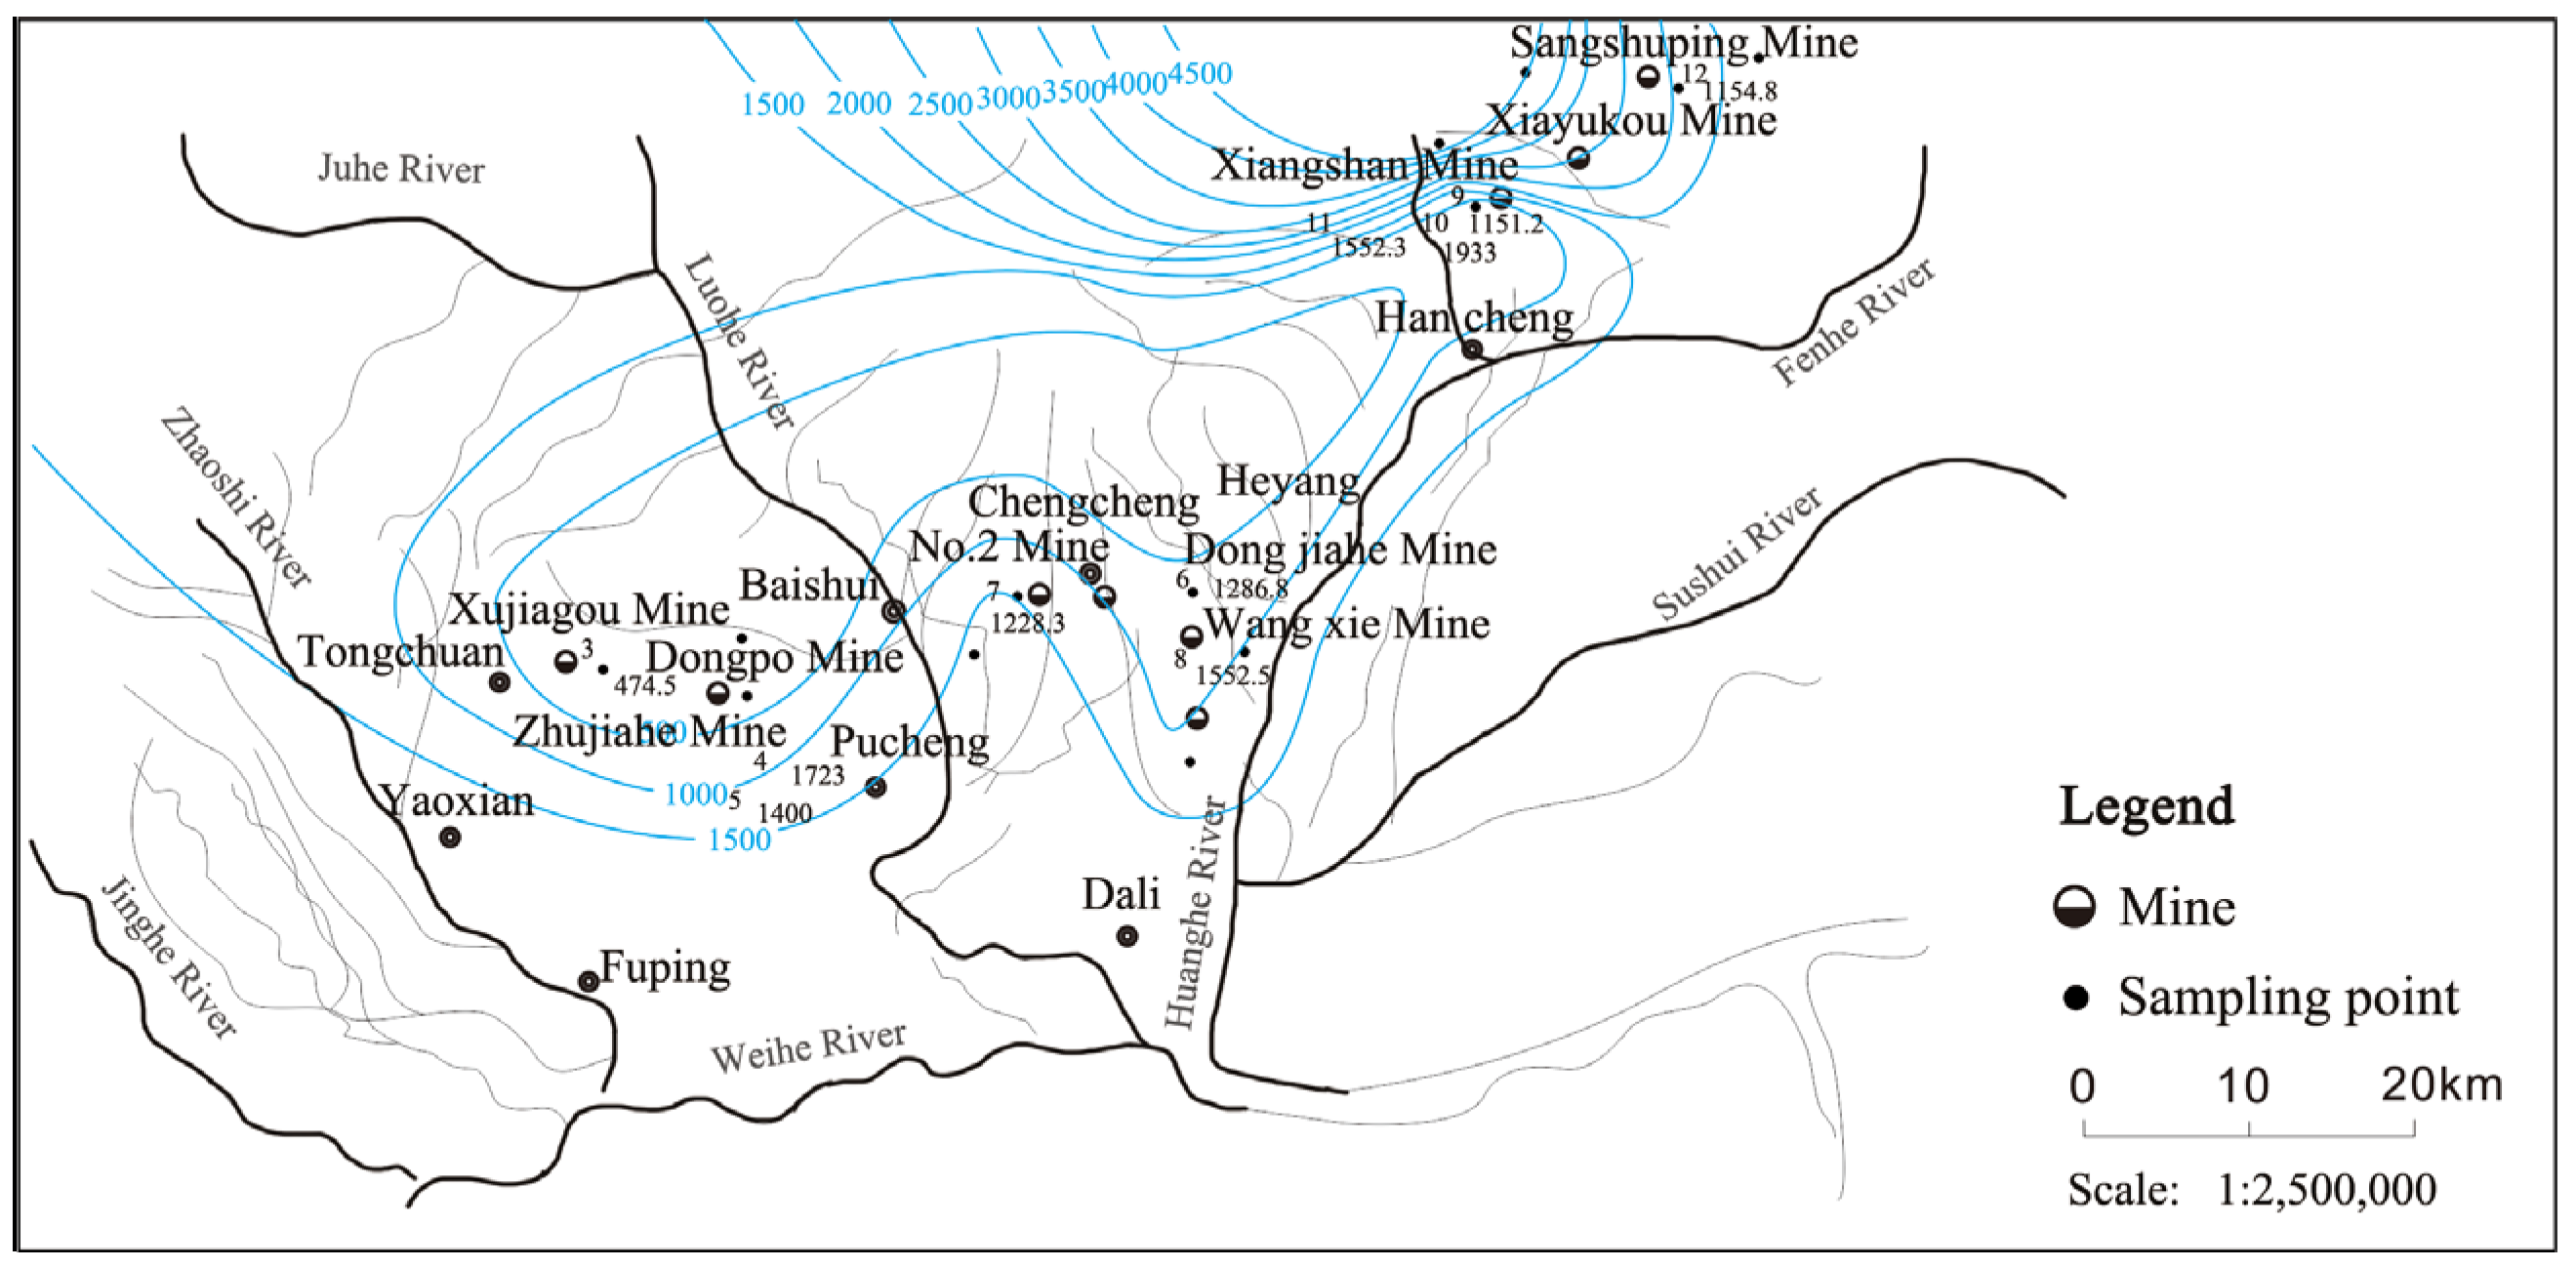
Figure 7.
TDS contour line of Ordovician aquifer.

Figure 8.
Relationship between conventional ion concentration and TDS in karst water.

Figure 9.
Cluster analysis of Permian sandstone fissure water system.

Figure 10.
Cluster analysis of Carboniferous sandstone (limestone) fracture water system.

Figure 11.
Cluster analysis of Ordovician limestone water system.

Figure 12.
Cluster analysis of Permian sandstone fissure water system.

Figure 13.
Cluster analysis of Carboniferous sandstone (limestone) facture water system.

Figure 14.
Cluster analysis of Ordovician limestone water system.

Figure 15.
Systematic cluster analysis of trace elements in groundwater in the Weibei mining area.

Figure 16.
Cluster analysis of different trace elements and conventional ions in the mining area.

Figure 17.
Characteristic Trace Element Profile of Main Water inrush Aquifers in the Mining Area.


Table 1.
Hydrogeological characteristics of quaternary loose rock aquifers.
| Diggings | Colliery | Thickness (m) | q (L/s·m) | K (m/d) | Predominantly Lithological |
|---|---|---|---|---|---|
| Tongchuan | Xujiagou | 100~130 | 0.0654 | 0.626 | Clay, sub-clay, sandy clay |
| PuBai | Zhujiahe | 0~152.22 | 0.008~0.47 | 0.013~18.7 | Loess, sub-clay, sub-sand |
| Chenghe | Dongjiahe | 1.79~134.41 | 0.01~0.1 | 0.0073~1.55 | Loess, gravel-bearing sandstone |
| Wang Cun | 0~160 | 0.119~0.264 | 6.33 | Conglomerate, clay, sub-sand, sand and silt | |
| Hancheng | Elephant Mountain | 0~100 | 0.068~21.11 | 1.3~4.45 | Sand, sub-sand |
| Mulberry Tree Ping | 0~100 | 1.93~6.73 | Silt, sub-clay |
Table 2.
Hydrogeological characteristics of Permian sandstone fractured aquifers.
| Aquifer Segments | Thickness (m) | Hydrogeological Features |
|---|---|---|
| Shiqianfeng formation aquifer | 0~100 | The lithology is mainly sandstone, followed by mudstone and sandy mudstone, and the aquifer is mainly lower middle- and coarse-grained sandstone, about 20 m thick, with fracture development, including fracture diving, q = 0.1~0.8 L/s·m, K = 2.06~33.77 m/d. |
| Upper shihe formation aquifer | 0~300 | The lithology is mainly purple variegated, yellow–green sandy mudstone and siltstone, interspersed with medium–coarse-grained sandstone and thin mudstone layers. q = 0.0004~1.14 L/s·m, K = 0.0009~3.89 m/d. |
| Lower shihe formation aquifer | 17.56~230.86 | q = 0.00084~0.473 L/s·m, K = 0.00443~1.96 m/d |
| Shanxi formation | 18.44~100.68 | Composed of light gray, gray–green, yellow–green sandstone, siltstone, dark gray sandy mudstone, mudstone, and No. 2 and No. 3 coal seams. q = 0.0001~0.08 L/s·m, K = 0.00036~0.231 m/d |
Table 3.
Hydrogeological characteristics of fractured aquifers in Carboniferous and Ordovician sandstone (limestone).
Table 3.
Hydrogeological characteristics of fractured aquifers in Carboniferous and Ordovician sandstone (limestone).
| Aquifer Segments | Thickness (m) | Hydrogeological Features |
|---|---|---|
| Taiyuan formation | 5~105 | The lower part is mainly quartz sandstone and sandstone, interspersed with siltstone and mudstone, and the middle part is composed of quartz sandstone, siltstone, limestone, and coal seam, q = 0.000052~0.0316 L/s·m, K = 0.003~1.649 m/d |
| Benxi formation | 0~41.01 | The lithology is mainly gray clumpy clay mudstone, gray mudstone, sandy mudstone, and gray quartz sandstone, q = 0.0002~0.154 L/s·m, K = 0.00041~0.07 m/d |
| Ordovician | q = 0.00015~124 L/s·m, K = 0.000077~12.41 m/d |
Table 4.
List of test methods.
| Detect Items | Method | Instrument |
|---|---|---|
| PH | Electrode method | PP-50-P11 acidity meter |
| HCO3−, CO32−, OH−, Cl−, SO42−, K+, Na+, Ca2+, Mg2+, NH4+ | Titration method (DZ/T0064-93, DZ55-87) | Digital titrators 1620506 |
| Li, Sc, Ti, V, Mn, Cr, Co, Ni, Cu, Zn, Rb, Mo, Sb, Cs, Ba, U, Sr | DZ/T 0064.80-1993 | ICP-MS 2000 |
Table 5.
F-test for the discrimination effect of water sample in the mining area.
| Class | Interclass F Value | F0.05(2, 17) |
|---|---|---|
| 2 and 1 | 5.457 | 3.59 |
| 3 and 1 | 26.206 | |
| 3 and 2 | 7.589 |
Table 6.
F-test for discrimination effect of water sample in the mining area.
| Class | Interclass F Value | F0.05(2, 12) |
|---|---|---|
| 2 and 1 | 2.626 | 3.88 |
| 3 and 1 | 20.081 | |
| 3 and 2 | 5.709 |
Table 7.
Characteristic value and cumulative variance contribution rate.
| Principal Component | Characteristic Value | Cumulative Variance Contribution Rate |
|---|---|---|
| Z1 | 6.756 | 39.739 |
| Z2 | 3.051 | 57.688 |
| Z3 | 1.483 | 66.409 |
| Z4 | 1.187 | 73.393 |
| Z5 | 0.988 | 79.204 |
| Z6 | 0.905 | 84.527 |
| Z7 | 0.766 | 89.035 |
| Z8 | 0.666 | 92.953 |
| Z9 | 0.489 | 95.832 |
| Z10 | 0.271 | 97.424 |
Table 8.
Estimation of coefficients (C0g, C1g, C2g, …, Cpg) of Bayes multi-class LDA function for trace elements.
Table 8.
Estimation of coefficients (C0g, C1g, C2g, …, Cpg) of Bayes multi-class LDA function for trace elements.
| Variable | Group | ||
|---|---|---|---|
| x | Y1(x) Permian | Y2(x) Taiyuan | Y3(x) Ordovician |
| Li | −0.034 | −0.003 | −0.043 |
| Ni | −0.278 | −0.290 | −0.175 |
| Rb | 0.069 | 0.151 | 0.178 |
| Mo | 0.057 | 0.081 | 0.023 |
| Ba | 0.015 | 0.039 | 0.014 |
| Sr | 0.002 | 0.002 | 0.002 |
| Cr | 0.289 | 0.257 | 0.187 |
| (constant) | −16.597 | −18.215 | −9.189 |
Table 9.
Retrospective discrimination results of Bayes multi-class LDA function for trace elements.
| Original Classification | New Classification | |||
|---|---|---|---|---|
| 1 (Permian) | 2 (Taiyuan) | 3 (Ordovician) | All | |
| 1 (Permian) | 8 | 1 | 1 | 10 |
| 2 (Taiyuan) | 1 | 6 | 0 | 7 |
| 3 (Ordovician) | 0 | 0 | 11 | 11 |
| All | 9 | 7 | 12 | 28 |
Note(s): 89.3% of the initial grouped cases were correctly classified.
Table 10.
Estimation of coefficients (C0g, C1g, C2g, …, Cpg) of Bayes multi-class LDA function for conventional ions.
Table 10.
Estimation of coefficients (C0g, C1g, C2g, …, Cpg) of Bayes multi-class LDA function for conventional ions.
| Variable | Group | ||
|---|---|---|---|
| x | Y1(x) Permian | Y2(x) Taiyuan | Y3(x) Ordovician |
| K+ + Na+ | 0.080 | 0.056 | 0.063 |
| Ca2+ | 0.089 | 0.053 | 0.094 |
| Mg2+ | 0.245 | 0.171 | 0.236 |
| Cl− | −0.052 | −0.037 | −0.038 |
| SO42− | −0.040 | −0.024 | −0.039 |
| (constant) | −9.533 | −6.275 | −7.651 |
Table 11.
Retrospective discrimination results of Bayes multi-class LDA function for conventional ions.
Table 11.
Retrospective discrimination results of Bayes multi-class LDA function for conventional ions.
| Original Classification | New Classification | |||
|---|---|---|---|---|
| 1 (Permian) | 2 (Taiyuan) | 3 (Ordovician) | All | |
| 1 (Permian) | 5 | 2 | 3 | 10 |
| 2 (Taiyuan) | 2 | 5 | 0 | 7 |
| 3 (Ordovician) | 1 | 2 | 8 | 11 |
| All | 8 | 9 | 11 | 28 |
Note(s): 64.3% of the initial grouped cases were correctly classified.
Table 12.
Modified Bayes multi-class LDA function coefficient (C0g, C1g, C2g, …, Cpg) estimates.
| Variable | Group | ||
|---|---|---|---|
| x | Y1(x) Permian | Y2(x) Taiyuan | Y3(x) Ordovician |
| K+ + Na+ | −0.036 | −0.208 | −0.088 |
| Ca2+ | −0.013 | −0.201 | −0.021 |
| Mg2+ | 0.045 | −0.392 | −0.064 |
| Cl− | 0.031 | 0.157 | 0.080 |
| SO42− | 0.013 | 0.104 | 0.023 |
| Li | −0.042 | −0.111 | −0.045 |
| Ni | −0.471 | −0.864 | −0.601 |
| Rb | 0.265 | 0.847 | 0.657 |
| Mo | 0.086 | 0.139 | 0.053 |
| Ba | 0.048 | 0.161 | 0.064 |
| Cr | 0.409 | 0.691 | 0.446 |
| Sr | 0.001 | 0.002 | 0.001 |
| (constant) | −20.046 | −31.169 | −17.515 |
Table 13.
Retrospective discrimination results of modified Bayes multi-class LDA function.
| Original Classification | New Classification | |||
|---|---|---|---|---|
| 1 (Permian) | 2 (Taiyuan) | 3 (Ordovician) | All | |
| 1 (Permian) | 9 | 0 | 1 | 10 |
| 2 (Taiyuan) | 0 | 6 | 1 | 7 |
| 3 (Ordovician) | 0 | 0 | 11 | 11 |
| All | 9 | 6 | 11 | 22 |
Note(s): 92.9% of the initial grouping cases were correctly classified.
Disclaimer/Publisher’s Note: The statements, opinions and data contained in all publications are solely those of the individual author(s) and contributor(s) and not of MDPI and/or the editor(s). MDPI and/or the editor(s) disclaim responsibility for any injury to people or property resulting from any ideas, methods, instructions or products referred to in the content. |
© 2023 by the authors. Licensee MDPI, Basel, Switzerland. This article is an open access article distributed under the terms and conditions of the Creative Commons Attribution (CC BY) license (https://creativecommons.org/licenses/by/4.0/).
Share and Cite
MDPI and ACS Style
Xue, W.; Hou, E.; Zhao, X.; Ye, Y.; Tsangaratos, P.; Ilia, I.; Chen, W. Discriminant Analysis of Water Inrush Sources in the Weibei Coalfield, Shaanxi Province, China. Water 2023, 15, 453. https://doi.org/10.3390/w15030453
AMA Style
Xue W, Hou E, Zhao X, Ye Y, Tsangaratos P, Ilia I, Chen W. Discriminant Analysis of Water Inrush Sources in the Weibei Coalfield, Shaanxi Province, China. Water. 2023; 15(3):453. https://doi.org/10.3390/w15030453
Chicago/Turabian StyleXue, Weifeng, Enke Hou, Xia Zhao, Yong Ye, Paraskevas Tsangaratos, Ioanna Ilia, and Wei Chen. 2023. "Discriminant Analysis of Water Inrush Sources in the Weibei Coalfield, Shaanxi Province, China" Water 15, no. 3: 453. https://doi.org/10.3390/w15030453
Note that from the first issue of 2016, this journal uses article numbers instead of page numbers. See further details here.