Article

Spatiotemporal Oasis Land Use/Cover Changes and Impacts on Groundwater Resources in the Central Plain of the Shiyang River Basin

1
Institute of Hydrogeology and Environmental Geology, Chinese Academy of Geological Sciences, Shijiazhuang 050061, China
2
Key Laboratory of Groundwater Sciences and Engineering, Ministry of Natural Resources, Shijiazhuang 050061, China
3
Chongqing Jiangshan Hydropower Construction Engineering Survey and Design Consulting Co., Ltd., Chongqing 400000, China
4
Airborne Survey and Remote Sensing Center of Nuclear Industry, Shijiazhuang 050002, China
*
Authors to whom correspondence should be addressed.
Water 2023, 15(3), 457; https://doi.org/10.3390/w15030457
Submission received: 25 November 2022 / Revised: 3 January 2023 / Accepted: 20 January 2023 / Published: 23 January 2023

Abstract

:
The impacts of land use/cover changes (LUCCs) on groundwater resources are a global issue. The Shiyang River Basin of China is a typical, ecologically fragile area. Focusing on the Wuwei sub-basin of the central plain, this study analyzed typical remote sensing image data for 17 specific dates since 1970. Before the Comprehensive Treatment Program in 2007, the area of natural oases decreased at a rate of 16.25 km2/year, while the area of farmland expanded at a rate of 13.85 km2/year. The farmland expansion preferentially occurred in low-vegetation-coverage oases, where the groundwater depth increased from 4 to 20 m. The consumption of groundwater increased from 7319.5 × 104 m3/year to 12,943.2 × 104 m3/year. During the period 2008–2018, the areas of both the natural oases and farmland decreased at rates of 2.57 km2/year and 8.99 km2/year, respectively. The groundwater level rose significantly in the south and west, as well as near the main river channel. Groundwater consumption has been restored to 7270.4 × 104 m3/year. Only 0.12 km2 of every 1.17 km2 of the original natural oases were restored through the natural farmland–natural oases conversion process. Groundwater depth increased significantly with the continuous expansion of farmland. Since the farmland area was effectively controlled, the trend of groundwater-level decline was significantly improved. These findings provide scientific support for the ecological restoration and reconstruction of oases, as well as an efficient and balanced development of river basin water resources.

1. Introduction

Groundwater is the world’s largest and most accessible source of unfrozen freshwater [1,2]; it supports food and water security, economic development, drought-risk alleviation, and other important ecosystem functions [3]. About 2.5 billion people worldwide depend on groundwater supplies [4]. However, as the world’s population continues to grow, more people must rely on groundwater resources [5,6], particularly in arid and semiarid areas [7,8]. Groundwater is, as yet, less sensitive to climate variability and change compared to surface water, which makes groundwater more reliable for consumption. However, human activity affects the groundwater’s distribution, quantity, and quality [9,10]. Therefore, assessing the impacts of human activities on the groundwater system is a major scientific challenge [11]. Land-use change is one of the most important human interventions that alter groundwater flow systems [9], one that will continue in the future to impact groundwater recharge dynamics [12]. Human-induced land use/cover changes (LUCCs) not only impact groundwater recharge but also have a significant effect on groundwater flow dynamics [5,13]. Therefore, in the LUCC plans that have been established by the International Geosphere–Biosphere Program (IGBP) and the International Human Dimensions Program (IHDP), one core problem is in understanding the impacts of regional land-use and land-cover changes on hydrological processes and water resources [14]. The impact of LUCC-induced changes in regional vegetation ecosystems on the regional hydrological cycle processes [15,16,17] has been an important research topic in hydrological science for more than 20 years and has become an issue of global importance [16,18]. Groundwater is usually the most important resource in arid regions, especially for socio-economic development, and is the best choice for a reliable water supply. Furthermore, groundwater is the most important factor in maintaining the health of an arid oasis ecosystem [19,20,21]. In the event of a reduction in water supply, the balance of an oasis ecosystem will be disrupted, and the oasis will degrade rapidly [22]. Globally, groundwater resources are irreplaceable when resolving water scarcity. Therefore, precise evaluation and effective management are important guarantees and necessary preconditions for exploring groundwater resources in an arid region. In this regard, an accurate estimation of the impact of human activities on the groundwater system is critical for developing a reasonable utilization program for regional groundwater resources [23,24]. Previous research on the impact of human activities on the groundwater system has mainly focused on the aspects of the intensity and reasonability of groundwater utilization while ignoring the impact of land-use changes on the groundwater system in the basin [25,26]. In fact, as an important link in the regional hydrological cycle, the groundwater dynamics in a basin (especially the groundwater depth and groundwater balance state) respond strongly to LUCCs [27].
Because of the stresses of an arid climate, desertification, water shortages, and other factors, the Shiyang River Basin is a typical ecologically fragile and climate-sensitive region [28]. Frequent droughts and drastic environmental changes are the main factors limiting sustainable development [28]. Since the 1980s, natural oases have been continuously declining, and their ecosystems have nearly collapsed due to the over-exploitation of soil and water resources [29] and the rapid yet uncontrolled expansion of farmland as a result of the intensification of human activities and extensive economic development [30]. In 2007, the Chinese central government launched the Comprehensive Treatment Program of the Shiyang River Basin (CTSRB) [31,32], the main measures of which included implementing the Grain-for-Green Program, protecting and restoring natural oases, increasing the coverage of forest/grass oases, increasing the surface water supply (i.e., increasing runoff and implementing inter-basin water-diversion projects), and controlling the over-exploitation of groundwater (i.e., limiting the per capita water consumption and closing some pumping wells). At a basin scale, LUCCs lead to changes in the patterns of the water supply and its use, and, in turn, cause inevitable changes in groundwater recharge/discharge processes, dynamics, and water cycle patterns, thereby significantly affecting the ecology, environment, economic development, and many other aspects of the basin [33].
Many studies have been conducted to investigate the land-use-driven changes in the water resource pattern of the Shiyang River Basin [34,35]. In addition, previous research has also focused on water resource management and allocation [36], groundwater level dynamics [32], the quantities of groundwater resources [37], policy mechanisms [38], and changes in ecosystem vulnerability [39] in this basin since the implementation of the CTSRB. However, only a very limited number of studies have been conducted to evaluate spatiotemporal changes in the vegetation cover as a measure of the spatiotemporal LUCCs since the implementation of the CTSRB in 2007 and to examine the response of the groundwater resource systems to these changes. Focusing on the Wuwei subbasin, i.e., the central plain of the Shiyang River basin, the goals of this study were: (1) to explore and compare the changes in the spatiotemporal pattern of the oasis coverage before and after 2007; (2) to analyze the effect of the spatiotemporal pattern of land use on the groundwater system, and the response characteristics of the groundwater system to the LUCCs. The findings of this study have implications for the scientific assessment of basin management effectiveness and the future management of water resources; they also provide scientific support for the ecological restoration and reconstruction of oases.

2. Materials and Methods
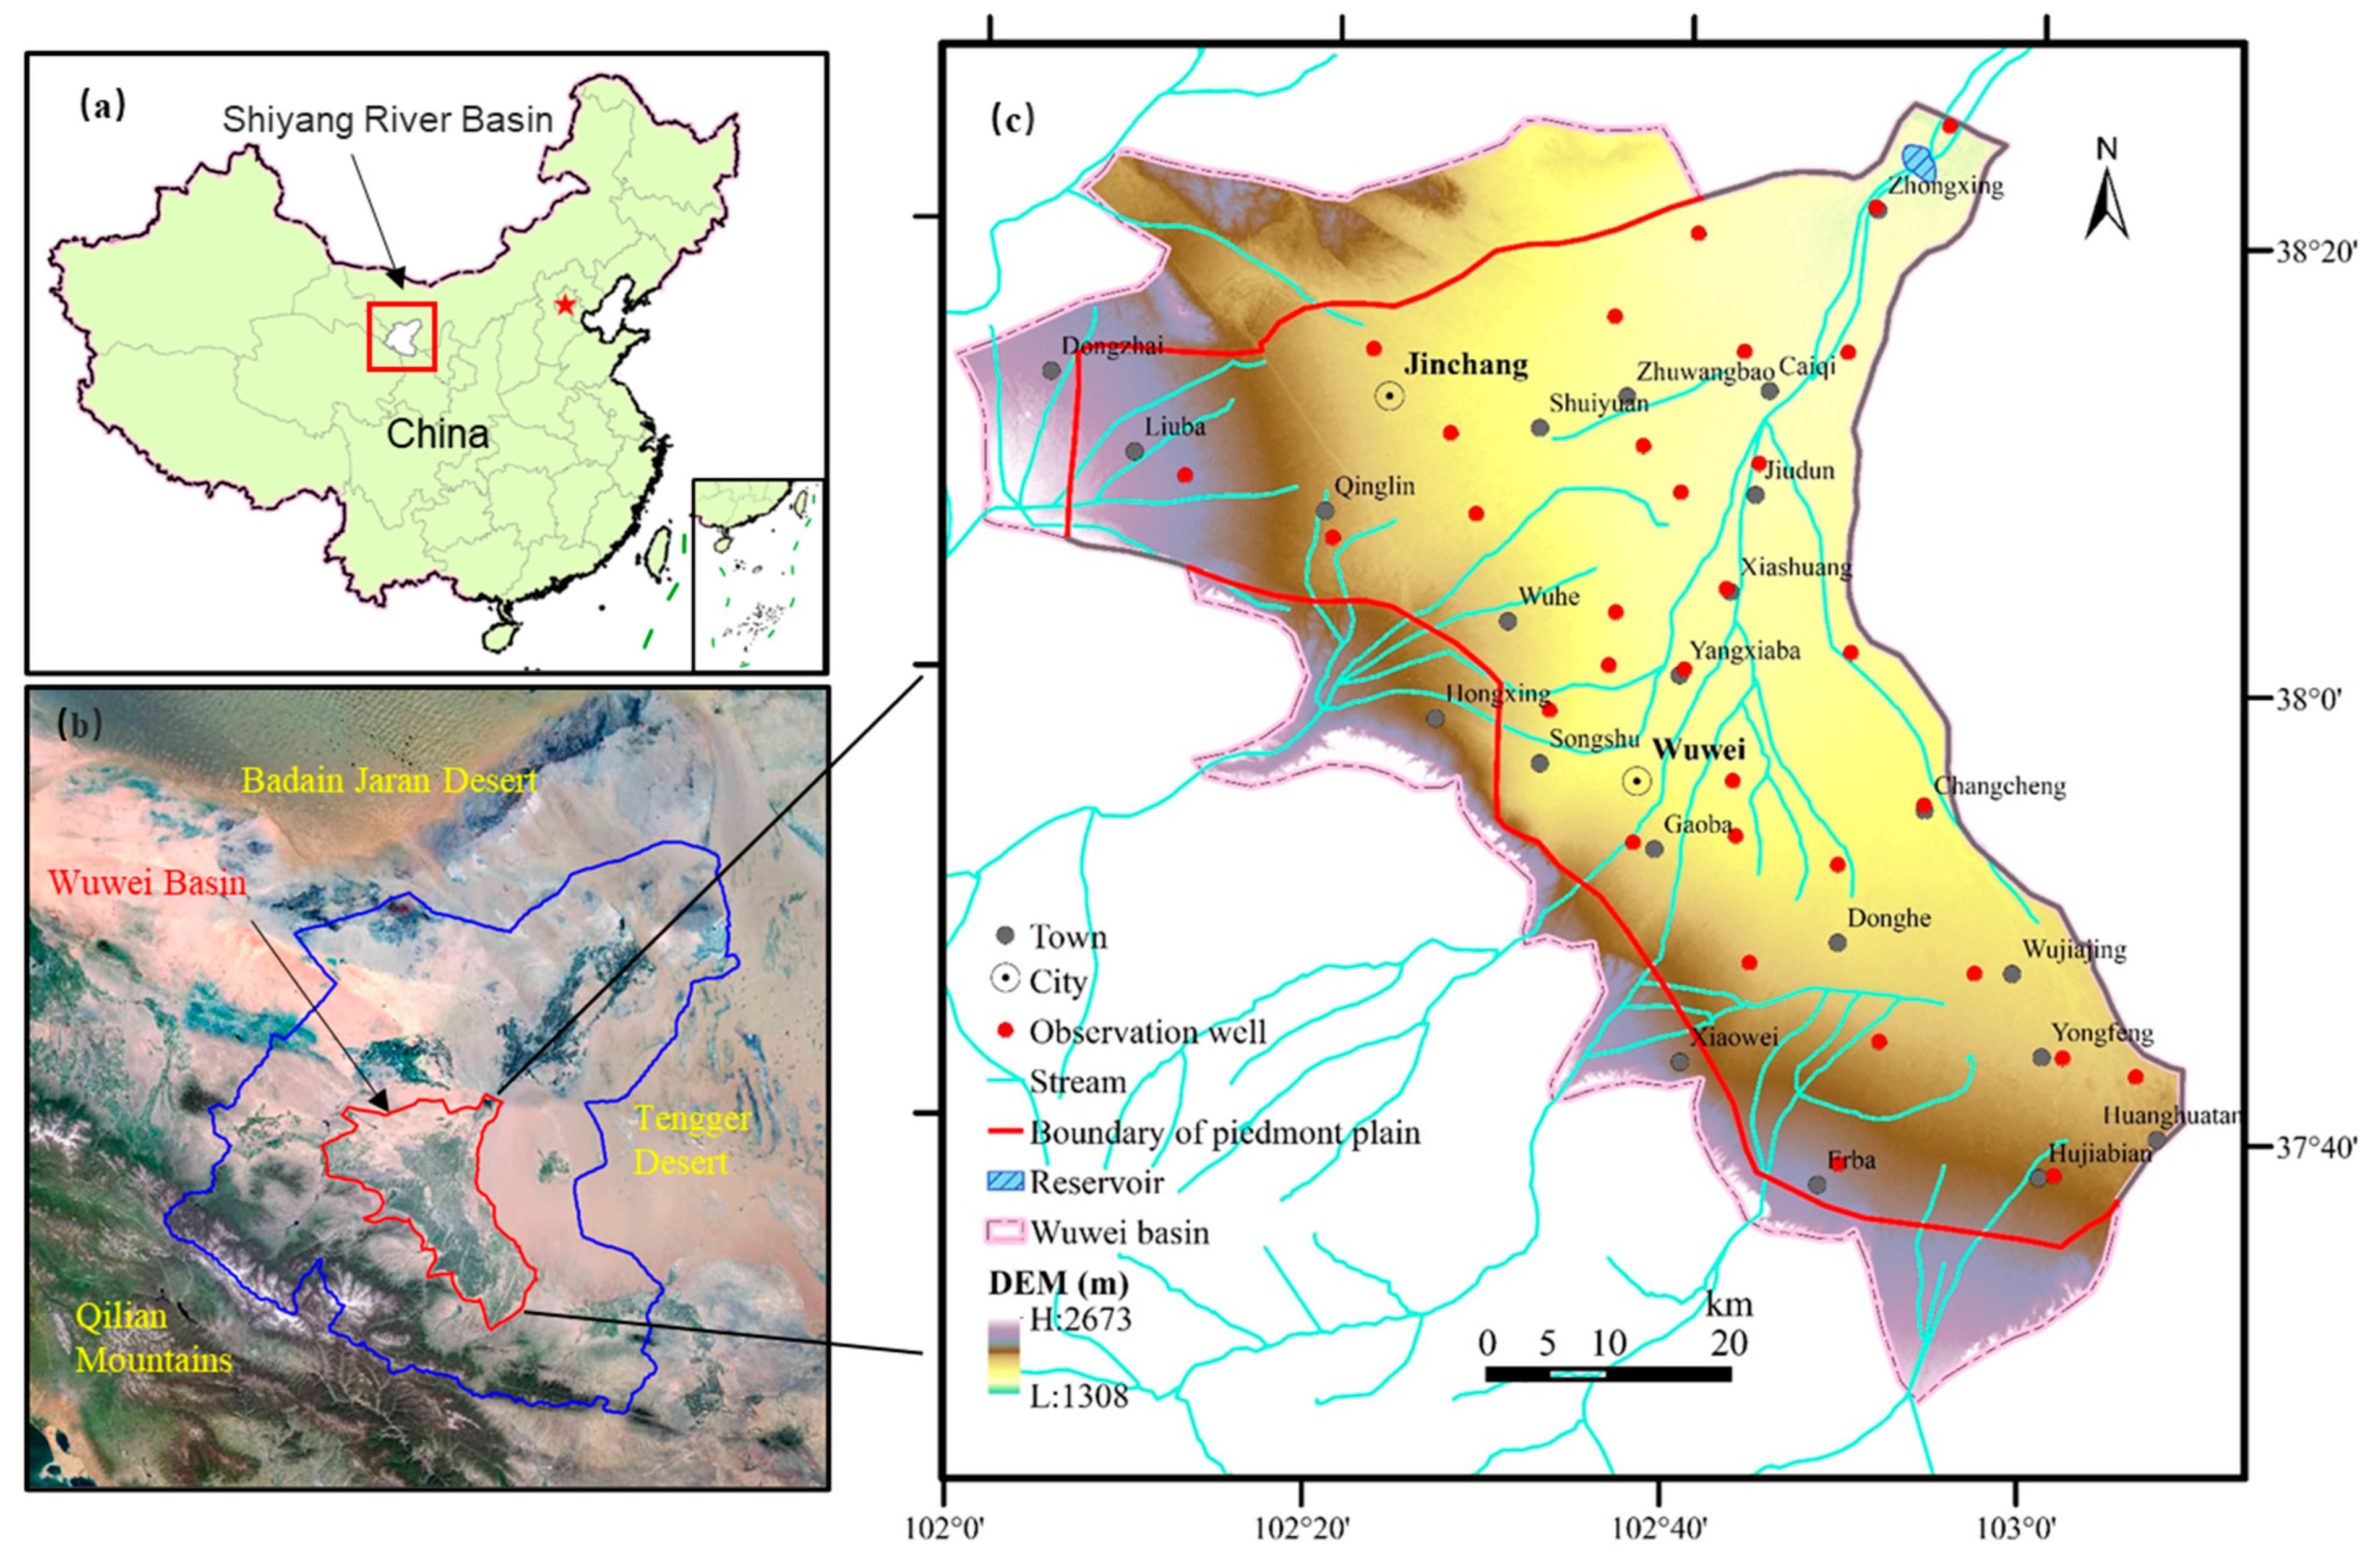
2.1. Study Area

The Shiyang River Basin (101°41′–104°16′ E, 36°29′–39°27′ N), which is surrounded by the Tengger Desert and the Badain Jaran Desert, is one of the three major inland river basins in the Gansu Hexi Corridor. It is located in the eastern part of the corridor, to the west of the Wushaoling Mountains, and is at the northern foot of the Qilian Mountains, with altitudes of 1300–4800 m. It is well known as a sandy wasteland, characterized by the predominant presence of sandy lands and the strong irrigation dependence of agricultural plantations. In addition to the oasis agroecosystem on the plain, the vast areas of the basin are dominated by a desert vegetation landscape (Figure 1). The basin has a typical inland arid climate, with an annual mean precipitation of 165.4 mm and a high annual mean evaporation of 2100 mm for the whole region, reaching 4000 mm in the deserts.
The groundwater aquifers are mainly composed of sand and gravel, deposited in the Upper and Middle Pleistocene, followed by slightly cemented and semi-cemented mud conglomerate, sandstone, and sandy loam, deposited in the Lower Pleistocene. The distribution and burial pattern of the aquifers are controlled by neotectonic movement. Due to the cutting of the buried Quaternary piedmont fault, the base of the fault zone is raised in the south, leading to the phreatic groundwater level being close to the ground surface, i.e., very shallow. In contrast, the aquifers thicken dramatically in the north, where they are mostly phreatic aquifers in the fault terrace and phreatic/confined aquifers in the plain.
The groundwater mainly exists in loose rock pores in the quaternary aquifer. The tertiary mudstone, sandy mudstone, and muddy sand conglomerate underneath are extremely weak in terms of water richness and hydraulic conductivity, and there is no water exchange. The recharging of the Quaternary aquifer is mainly from piedmont runoff recharge from the Qilian Mountains, atmospheric precipitation, surface water infiltration during conveyance, irrigation ditch infiltration, and the infiltration of irrigation groundwater. The groundwater eventually converges in the vicinity of Caiqi Township, Minqin County, where it partly overflows to the surface in the form of springs that flow into the Shiyang River and then on into the Hongyashan Reservoir. Part of this water also flows into the territory in Minqin County, in the form of lateral runoff. In addition, a large volume of groundwater is extracted for farmland irrigation and a small volume evaporates, which, together, constitute another important pathway of regional groundwater discharge. The amount of annual average recharge in the study area was as follows: piedmont runoff, precipitation and reservoir infiltration, surface water infiltration during conveyance, irrigation ditch infiltration, and the infiltration of irrigation groundwater were 18,526.1 × 104 m3/year, 2879.8 × 104 m3/year, 15,219.6 × 104 m3/year, 3694.5 × 104 m3/year, and 14,298.6 × 104 m3/year, accounting for 33.9%, 5.3%, 27.9%, 6.8%, and 26.2% of the total recharge, respectively. The amount of annual average discharge was as follows: lateral outflow, groundwater exploitation, spring overflow, and evaporation were 603.0 × 10⁴ m3/year, 55,044.3 × 104 m3/year, 5596.7 × 104 m3/year, and 1030.9 × 104 m3/year, accounting for 1.0%, 88.4%, 9.0%, and 1.7% of the total discharge, respectively [40,41].
The groundwater generally flows northward from the southern piedmont and eastward from the west, turning towards the northeast after reaching the main channel of the Shiyang River and entering the Minqin Basin through the Hongya-Alagu Mountain Fault. The groundwater is 100–120 m deep in the west and south; it gradually becomes shallower along the direction of groundwater runoff until it reaches the northeastern region, where the groundwater-level depth is as shallow as 5 m in some locations (Figure 2).
The vegetation types in the study area include artificial vegetation and natural vegetation. The artificial vegetation is mainly Haloxylon ammodendron, which plays an important role in creating windbreaks and for sand fixation. Shrubs are the dominant component of natural vegetation in the area, including Nitraria spp., Tamarix spp., Haloxylon ammodendron, Kalidium foliatum, Reaumuria soongorica, and Artemisia arenaria. The trees include Populus euphratica, Populus gansuensis, Elaeagnus angustifolia, and Salix matsudana. The herbs are mainly Phragmites australis, Achnatherum splendens, Sophora alopecuroides L., Bassia dasyphylla, and Agriophyllum squarrosum [42,43].

2.2. Data Sources and Methodology

2.2.1. Land-Use Types

Raw remote sensing images (https://earthexplorer.usgs.gov/, path/row coordinates: 131–132, 33–34) of the study area, acquired in 1970, 1984, 1990, 1995, 2000, and 2007–2018, were derived from the thematic mapper (TM), enhanced thematic mapper (ETM), and operational land imager (OLI) data obtained by the US Landsat satellites. These data were subjected to atmospheric correction, radiometric correction, geometric correction, image fusion, color synthesis, and cropping [44,45].
In this study, an object-oriented approach was adopted for image segmentation by combining image texture features with actual crop growth features via a bottom-up approach. The nearest-neighbor classification method and the affiliation function classification method were combined to achieve information extraction for the decoding target. Meanwhile, to ensure the correctness and reliability of the results, the interpretation content was calibrated and validated by land-cover type calibration, field spectrum testing, and land-cover type validation.
The normalized difference vegetation index (NDVI) is a commonly used indicator for evaluating vegetation development. In general, NDVI values range between −1 and 1. A high NDVI value indicates that the vegetation is well-developed, whereas a low NDVI value indicates that the vegetation is in poor condition.
The vegetation fractional coverage is estimated using NDVI and the following formula:
VFC = NDVI     NDVImin NDVImax     NDVImin × 100 %
where VFC is the vegetation fractional coverage and NDVImin and NDVImax are NDVI values with cumulative probabilities of 5% and 95%, respectively [46].
The vegetation coverage was classified according to the vegetation coverage classification criteria for sandy land. The land-use types were classified as artificial oases (i.e., farmland), natural oases, and other land-use types (OL). Given that the remote sensing spectra of artificial oases are significantly affected by the seasons and crop harvest periods, in this study, artificial oases were identified through the visual interpretation of image pixels using characteristic colors, shapes, and textures as interpretation features. The natural oases were classified as high-vegetation-coverage oases (HCO, vegetation fractional coverage (VFC) ≥ 30%), medium-vegetation-coverage oases (MCO, 10% ≤ VFC < 30%), low-vegetation-coverage oases (LCO, 4% ≤ VFC < 10%), and desert oases (DO, VFC < 4%, including sandy land, saline land, shoals, marshland, and bare land). The OL category included urban land, rural residential land, industrial and mining land, rivers/canals, and reservoirs [47]. The regional land-use types on the 17 dates, and particularly the LUCCs during 1984, 2007, and 2018 were analyzed via object-oriented human–computer interactive interpretation according to the established interpretation features of the different land-use types; ArcGIS 10.3 (ESRI, Redlands, CA, USA) was used as the data processing and information extraction platform [44,45].
Geographic information system (GIS) intersection analysis was performed on the 1984, 2007, and 2018 LULC maps by overlaying the various maps, which yielded LUCC maps for 1984–2007 and 2007–2018. Two LULC transition matrices corresponding to these two periods were obtained by adding the map fields with the corresponding classes into the attribute table and then performing statistical analysis of the map units, with each matrix providing information about the direction of transition between two land-use types (i.e., gain vs. loss) and the land area involved in the transition [48]. The LULC transition matrices were used to examine the quantitative changes and the changes in the spatial pattern of the land-use types.

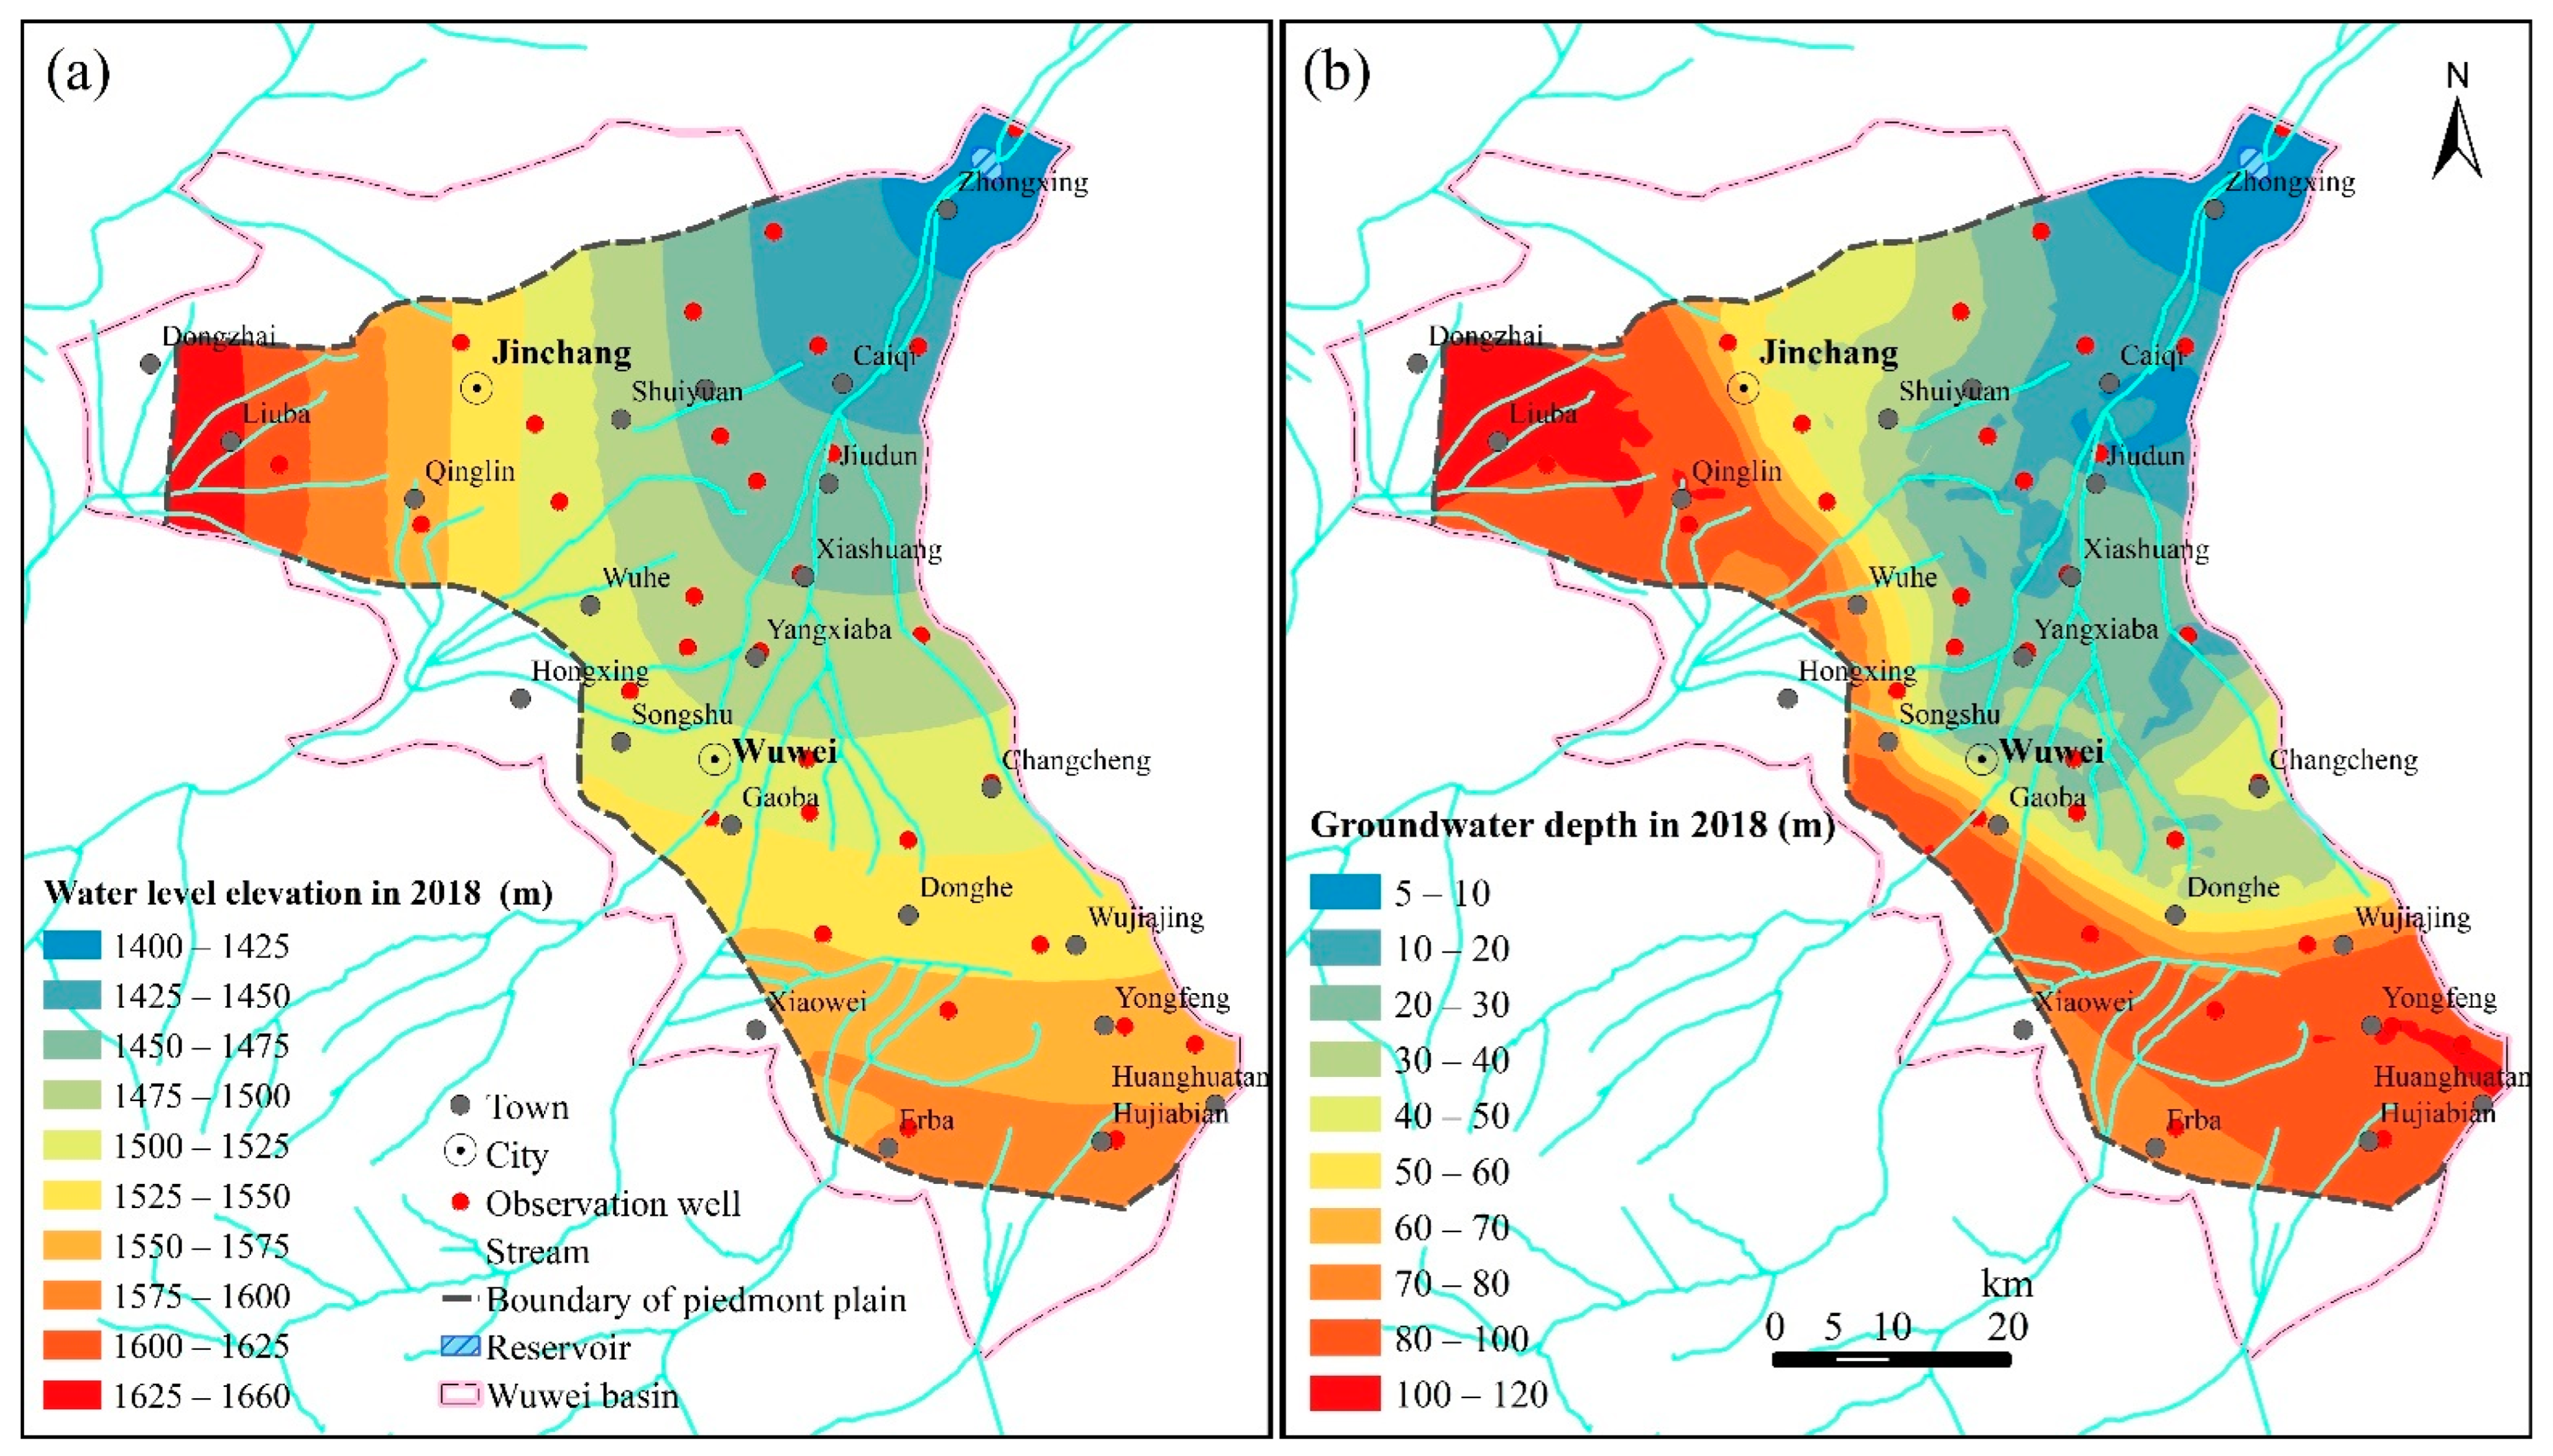
2.2.2. Groundwater Depth

The groundwater depth was measured on site in December 1984, December 2007, and December 2018 via a total of 32 observation boreholes, which all belong to the same unified phreatic aquifer. The changes in groundwater depth from 1984 to 2007 and from 2007 to 2018 were estimated separately by calculating the differences between the measured values and then performing kriging interpolation in a total of 23,105 cells (each interpolation cell had the dimensions of 400 m × 400 m and an area of 0.16 km2).
Based on intersection analysis, the changes in the groundwater depth during each period were spatially overlaid on the corresponding land-use change map to visualize and calculate the area of the land-use changes associated with the alterations in groundwater depth.

2.2.3. Groundwater Balance Analysis

A groundwater system is a complex system consisting of inputs, outputs, and geological entities, and the various influencing factors of the system are interlinked and interact with one another. In this study, multivariate regression with a significance test was performed to establish a linear regression equation for identifying the influencing factors that significantly contributed to the changes in the groundwater storage volume.
The groundwater recharge in the study area mainly comes from upstream lateral inflow, surface water infiltration, irrigation ditch infiltration, the infiltration of irrigation groundwater, atmospheric precipitation, and reservoir water infiltration. The groundwater discharge mainly includes groundwater extraction, spring overflow, phreatic evaporation, and downstream lateral outflow. The upstream section of the Wuwei subbasin is bounded by a large fault in front of the Qilian Mountains, and the fault steps lead to a difference of nearly 100 m in the groundwater depth on the two sides of the fault, thereby leading to little inter-annual variation in the recharge. In contrast, atmospheric precipitation and reservoir water infiltration (with both acting as groundwater sources), spring overflow, phreatic evaporation, and downstream lateral outflow (all as groundwater sinks) accounted for a small proportion of the total recharge/discharge of the groundwater system, with no significant inter-annual variations. The surface water conveyance volume affected both the surface water infiltration during conveyance and the irrigation ditch infiltration, while the groundwater extraction volume determined the volume of infiltrated irrigation groundwater. A multivariate regression model was established, using the groundwater storage volume as the dependent variable and the farmland area, surface water conveyance volume, and volume of groundwater extraction as the three independent variables. This model was used to predict and conduct statistical analyses of the historical data. The model can be expressed as follows:
Q = β + a   S c + b   Q s + c   Q g
where ∆Q is the groundwater storage volume (×104 m3), Sc is the farmland area (km2), Qs is the surface water conveyance volume (×104 m3), Qg is the groundwater extraction volume (×104 m3), and β, a, b, and c are the regression coefficients.
Since agricultural and ecological irrigation was the main water consumption sector in the study area, the surface water conveyance volume and groundwater extraction volume in the model only present the amount of groundwater used in this particular sector.

3. Results and Discussion

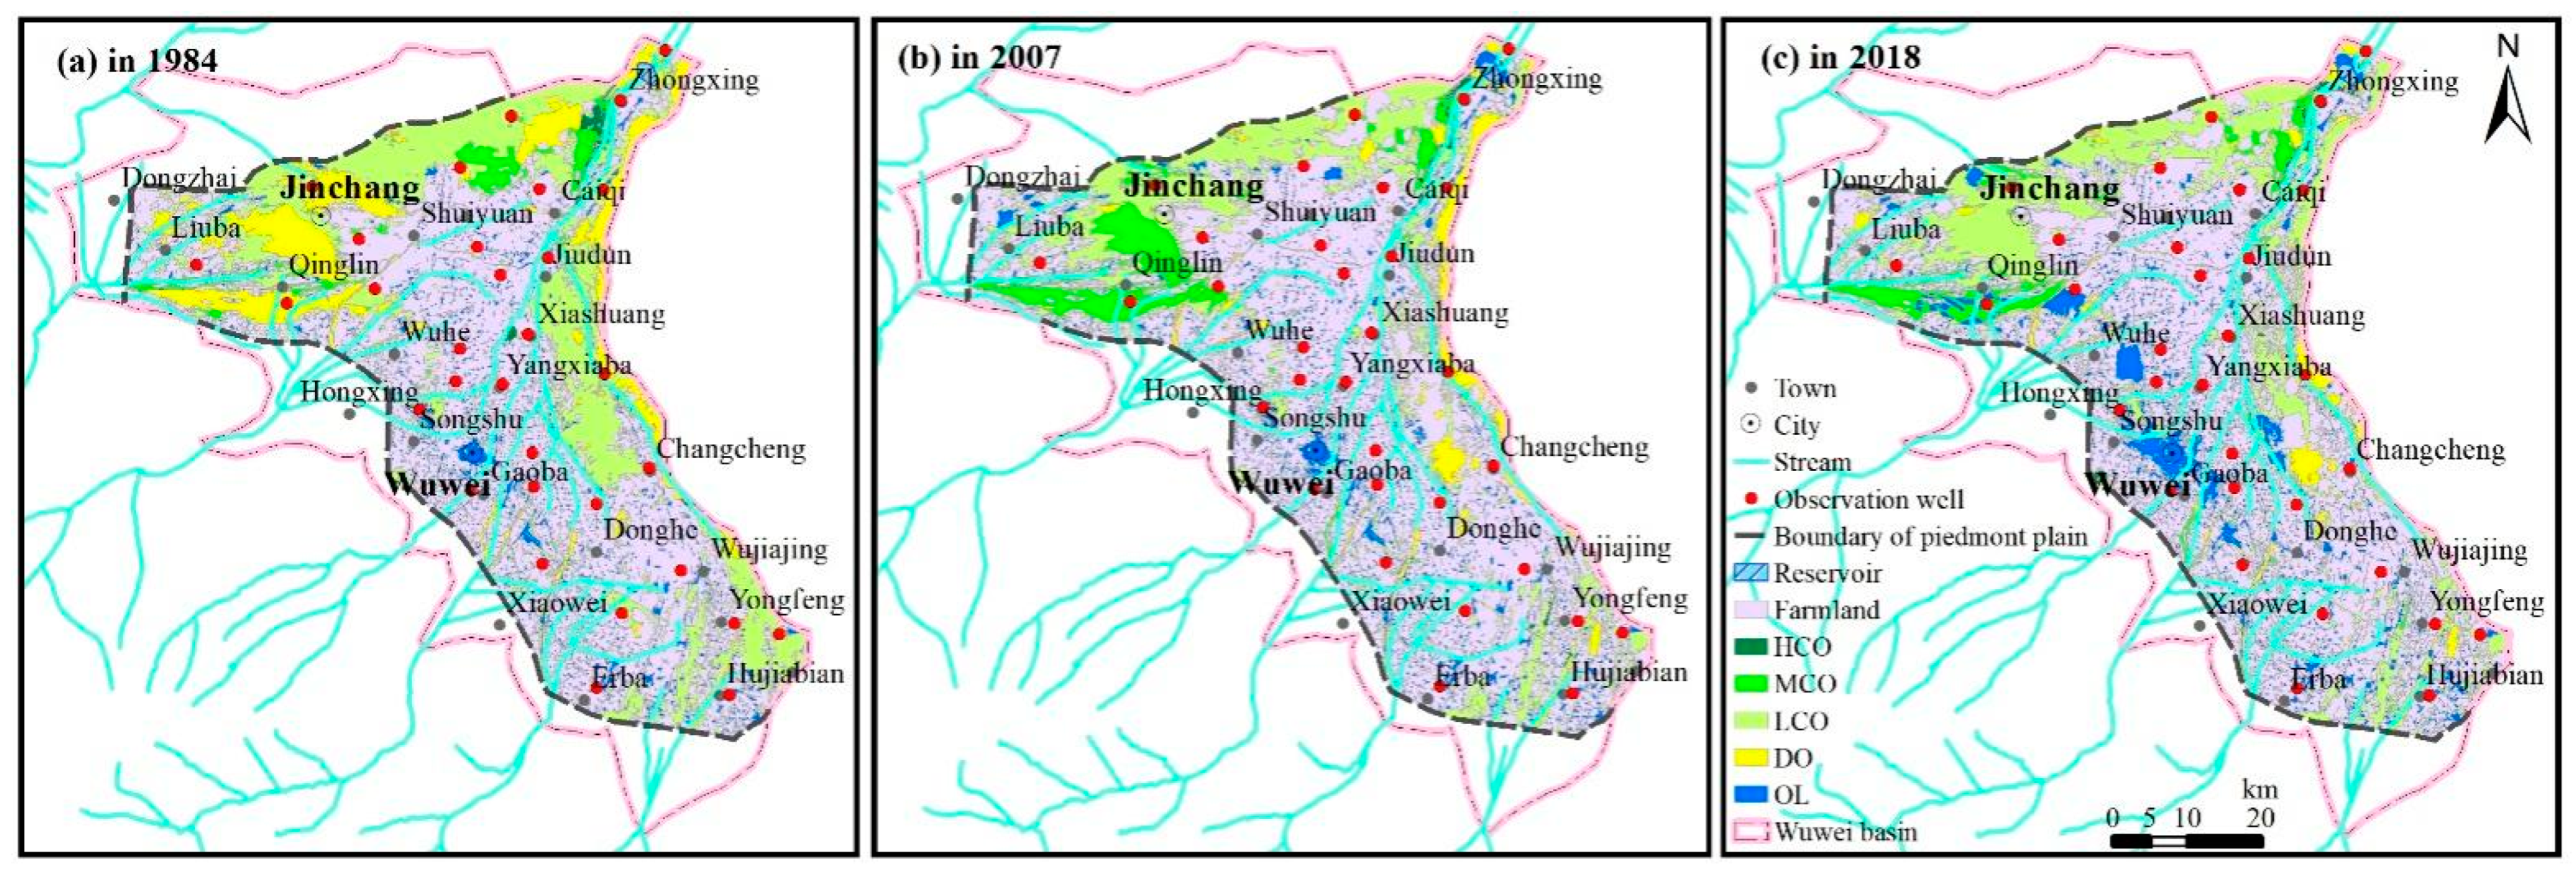
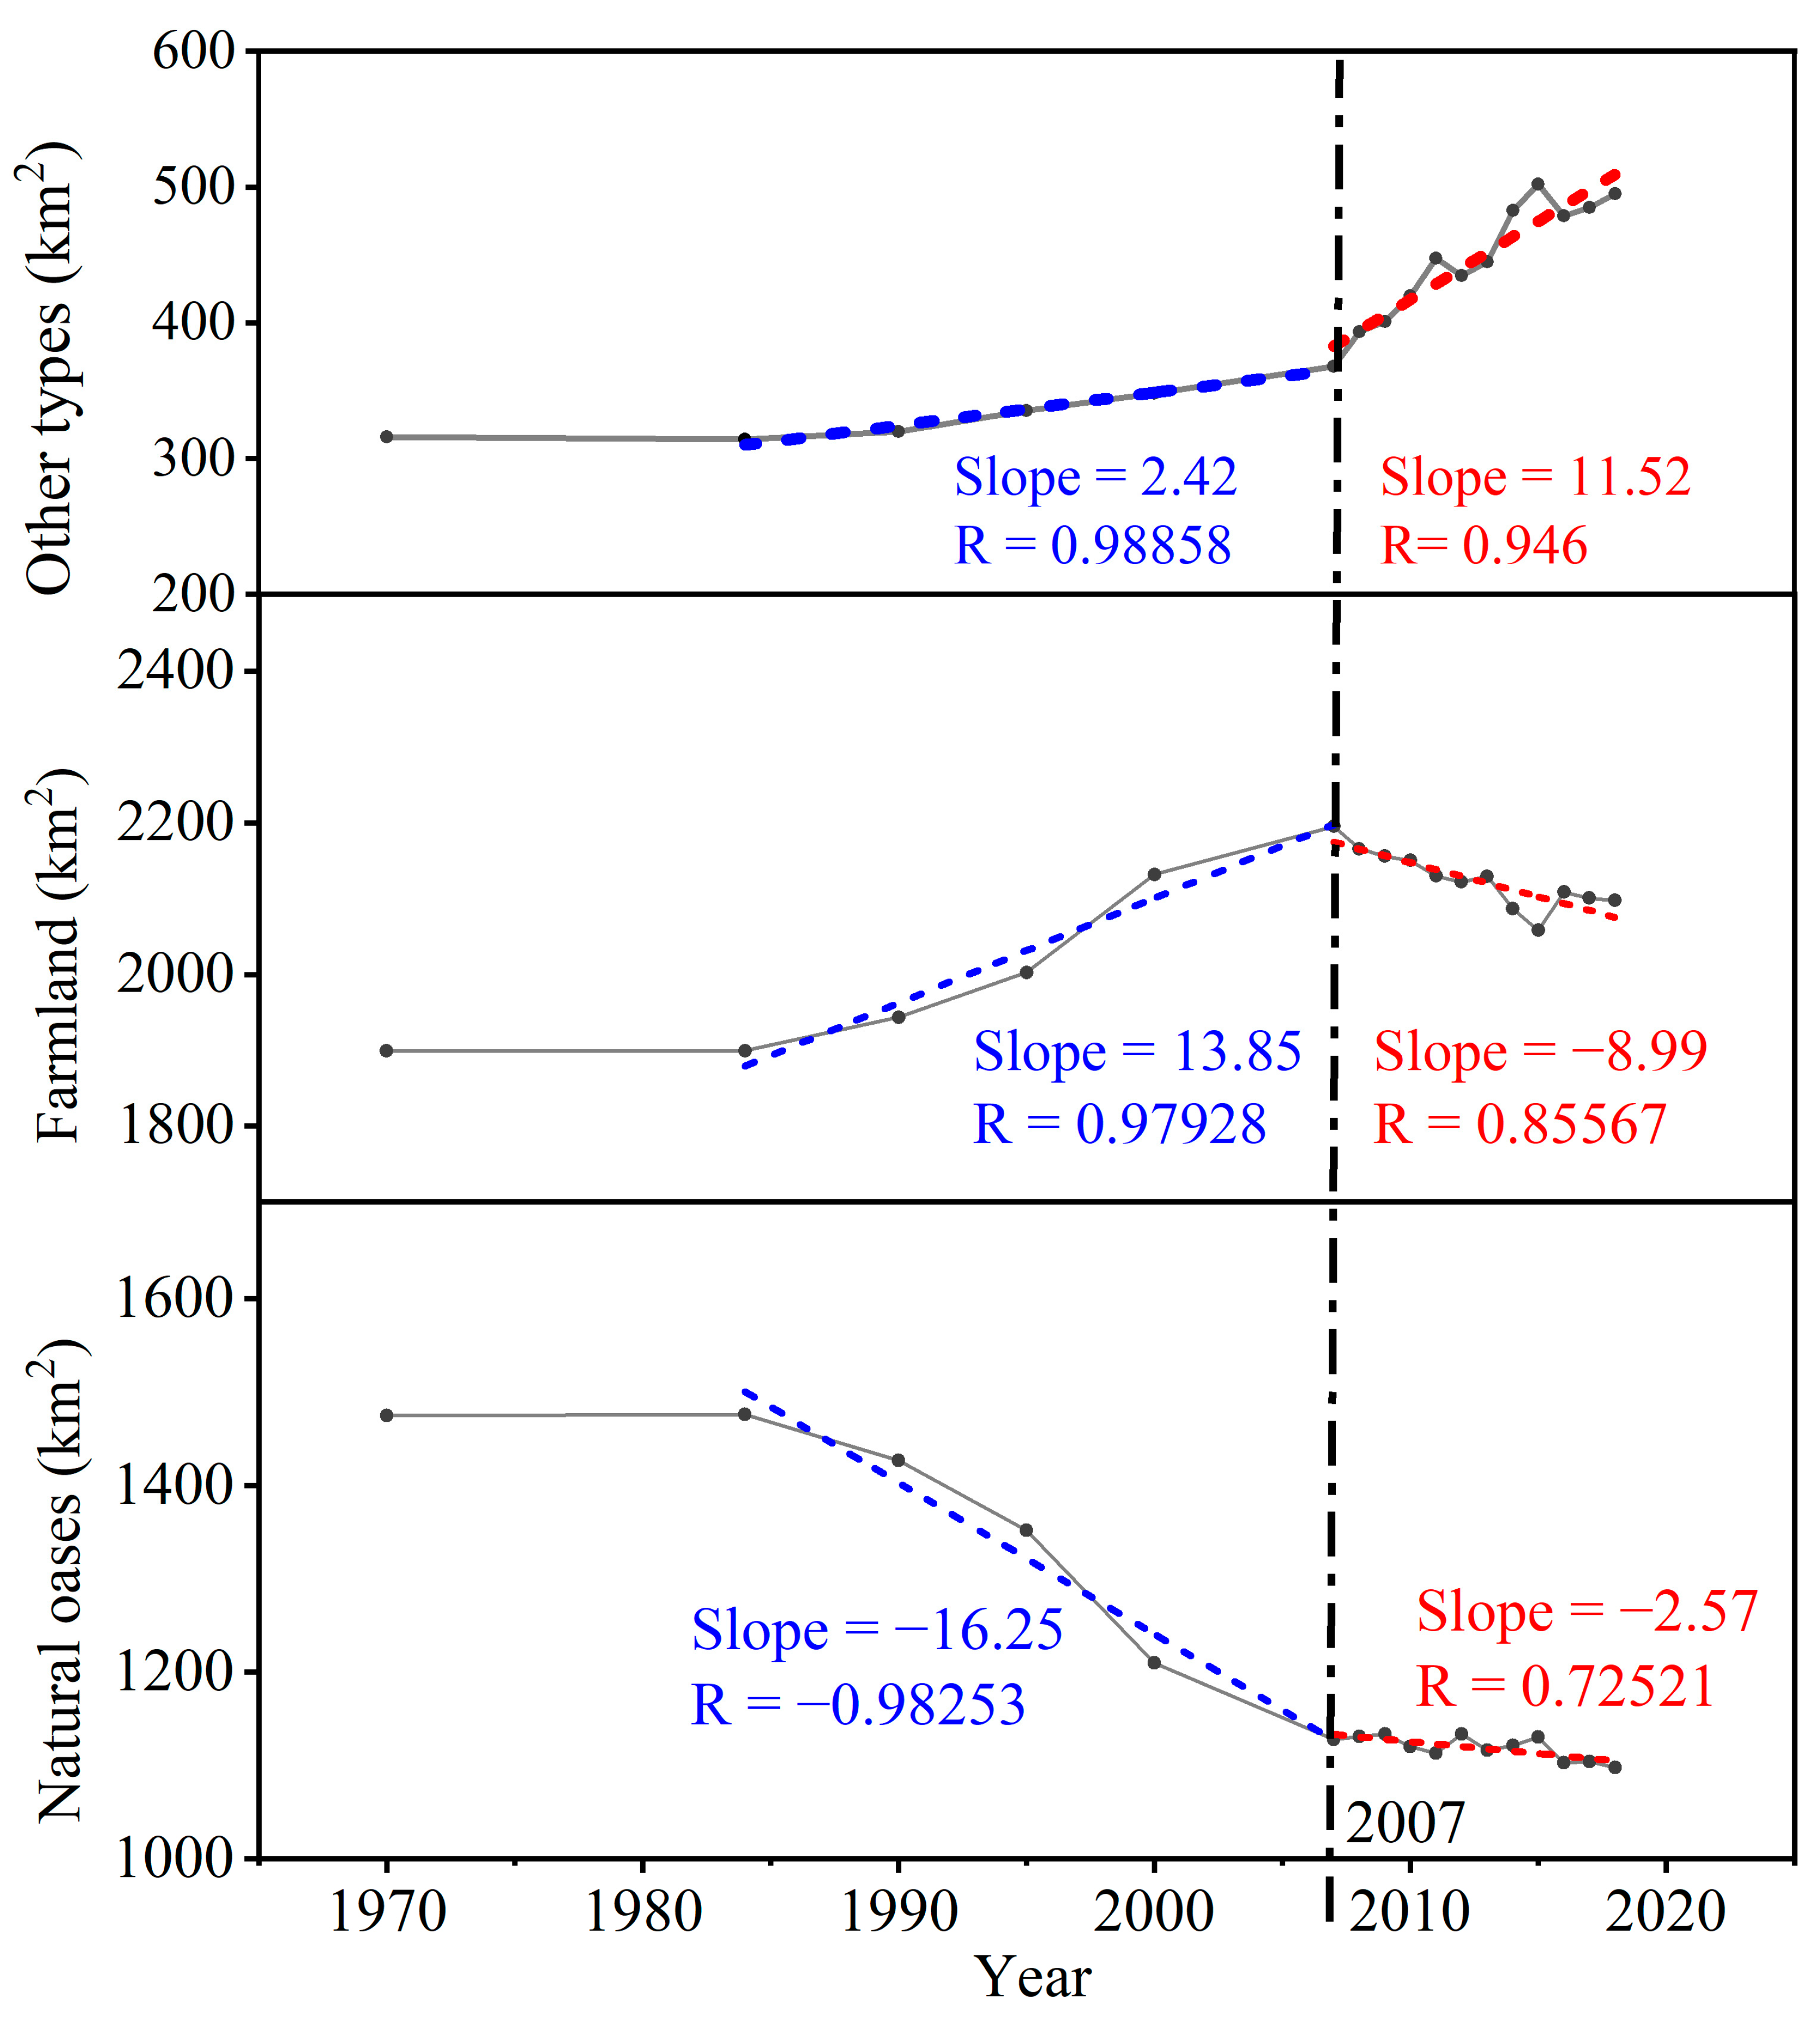
3.1. Spatiotemporal LUCCs over the Last 30 Years

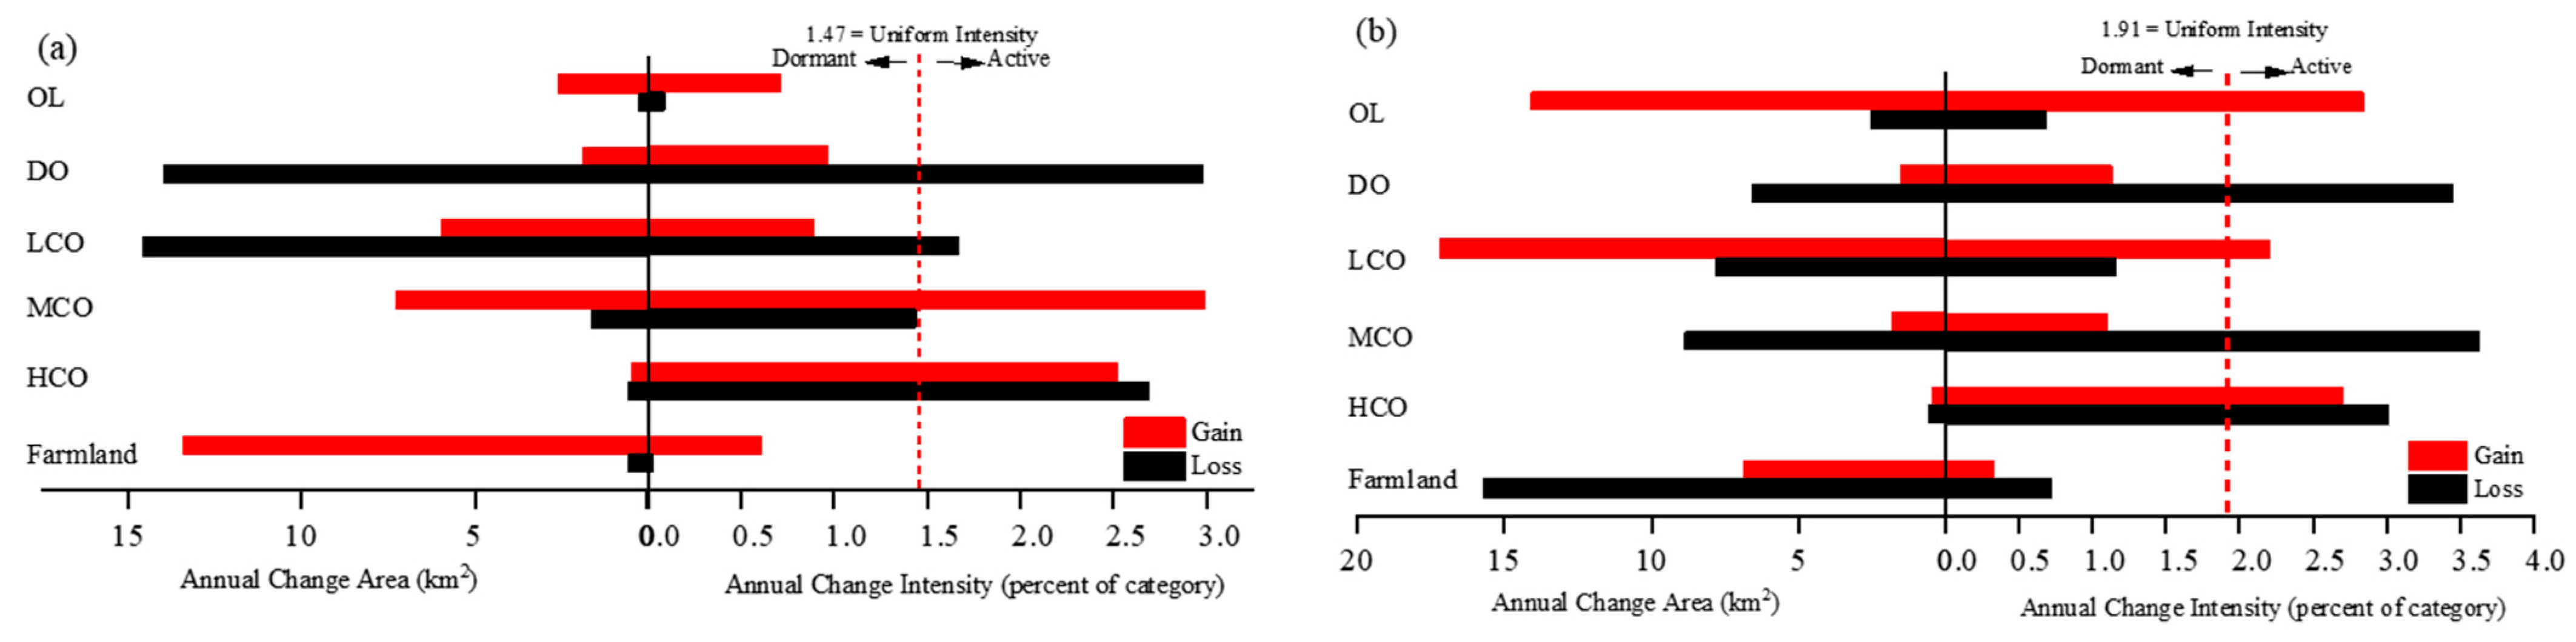
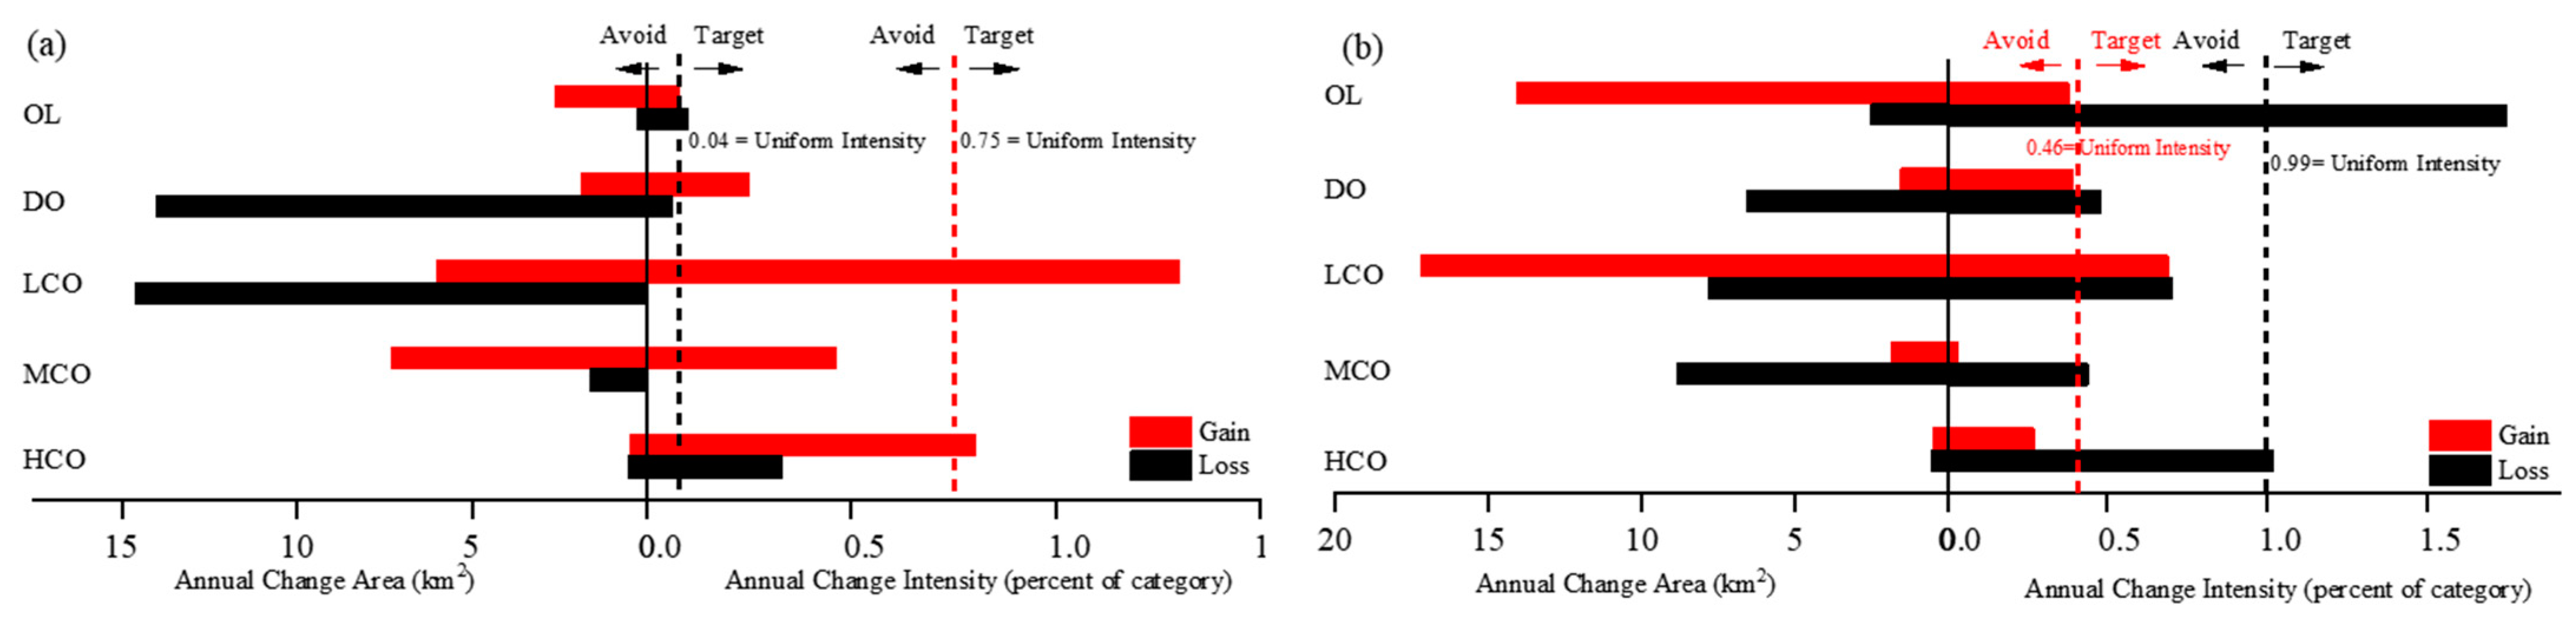
3.1.1. Land-Use Intensity Analysis

The land-use category level mainly focuses on the gross gain intensity, gross loss intensity, and uniform intensity of annual change for each land use over different time intervals [49,50]. From 1984 to 2007, the average annual increase in farmland was much bigger than the increases in the other categories (Figure 3). The two categories with the largest average annual reduction were the LCO and the DO. The uniform intensity of annual change for each land use was 1.47. The intensity of change for both farmland and OL was the following: uniform intensity > gross gain intensity > gross loss intensity. This indicated that the increase in farmland and OL was in a relatively stable state. The intensity of change for the DO and LCO was consistent with gross loss intensity > uniform intensity > gross gain intensity. This suggested that the gross losses in the DO and LCO were relatively active. From 2008 to 2018, the LCO had the largest average annual increase, followed by the OL. Farmland decreased by the largest average annual area, and uniform intensity > gross loss intensity > gross gain intensity, indicating that the decrease in farmland was in a relatively stable state. The intensity changes of the DO and the MCO were characterized by gross loss intensity > uniform intensity > gross gain intensity, implying that the gross losses were relatively active. The intensity of changes for the OL and farmland use types were featured as gross gain intensity > uniform intensity > gross loss intensity, implying that the gross gains were relatively active. The uniform intensity of annual change for each land-use type was 1.91, illustrating that the land-use category varied more dramatically in this period. It was presumed that the expansion of OL played a critical role.
The transition level is mainly used to analyze the increase or decrease in specific land-use types at different time intervals, the transition intensity of other land-use types into specific land-use types, and specific land-use types into other land-use types, and to compare the transition intensity of specific land-use types with the uniform intensity of annual change [49,50]. In this study, the intensity of the transitional level of farmland was analyzed (Figure 4). All increases in farmland were at the expense of the loss of natural oases. During 1984–2007, increases in farmland tended to occupy the LCO and HCO. The average intensity of the annual transition was greatest in the LCO, followed by the HCO, and avoided conversion in the MCO and DO. From 2008–2018, increases in farmland also tended to occupy the LCO, and decreases in farmland tended more frequently to convert to OL and avoid conversion to DO, LCO, and MCO.

3.1.2. Spatiotemporal LUCCs during 1984–2007

The farmland in the study area has continuously expanded with the increase in population during the last 30 years, leading to the shrinkage of natural oases [51,52]. As shown in Figure 5 and Table 1, the farmland, DO, LCO, and MCO had large gain and loss areas from 1984 to 2007.
The gain (i.e., conversion of other land use types to farmland) and loss (i.e., conversion of farmland to other land use types) areas of the farmland were 308.91 km2 and 13.39 km2, respectively, leading to a net increase of 295.52 km2 (15.6%). The new farmland was primarily created from the conversion of the LCO (260.88 km2), which was distributed in Yongfeng and Liuba, as well as Changcheng, Xiashuang, and Jiudun near the river.
The gain and loss areas of the MCO were 167.80 km2 and 37.73 km2, respectively, leading to a net increase of 130.07 km2 (114.2%). The new MCO was primarily from DO (151.76 km2), which was mostly distributed in nearby Qinglin.
The gain and loss areas of the DO were 42.73 km2 and 321.95 km2, respectively, leading to a net reduction of 279.22 km2 (59.4%). The loss areas, distributed in Qinglin, Liuba, and Zhongxing, were mainly converted into MCO (151.76 km2) and LCO (114.82 km2), accounting for 47.1% and 35.7% of the total loss areas, respectively.
The gain and loss areas of the LCO were 137.51 km2 and 335.60 km2, respectively, leading to a net reduction of 198.09 km2 (22.7%). The loss areas were mainly converted into farmland (260.88 km2), accounting for 77.7% of the total loss areas. The new LCO areas were primarily from DO (114.82 km2), accounting for 83.5% of the total gain areas, which were mostly distributed in Yongfeng, Xiashuang, and Jiudun.

3.1.3. Spatiotemporal LUCCs during 2008–2018

As shown in Figure 5 and Table 1, the gain and loss areas of the OL, LCO, farmland, MCO, and DO from 2008 to 2018 were relatively large.
The gain and loss areas of the OL were 154.82 km2 and 27.49 km2, respectively, leading to a net increase of 127.33 km2 (34.6%). The gain areas were primarily from farmland (95.46 km2), accounting for 61.7% of the total gain areas. The new gain areas were distributed near the Wuwei urban area, and the expansion was also significant in Wuhe, Qinglin, and Gaoba.
The gain and loss areas of the LCO were 189.36 km2 and 85.93 km2, respectively, leading to a net increase of 103.44 km2 (15.3%). The new gain areas were primarily from the MCO (69.86 km2), farmland (60.08 km2) and DO (57.74 km2), accounting for 36.9%, 31.7%, and 30.5% of the total gain areas, which were mostly distributed in Jinchang and Qinglin.
The gain and loss areas of the farmland were 75.65 km2 and 172.79 km2, respectively, leading to a net reduction of 97.14 km2 (4.4%). The loss areas were mainly converted into OL (95.46 km2) and LCO (60.08 km2), accounting for 55.2% and 34.8% of the total loss areas, respectively; these were mostly distributed in the Wuwei urban area, Wuhe, and Xiashuang areas.
The gain and loss areas of the MCO were 20.16 km2 and 97.30 km2, respectively, leading to a net reduction of 77.14 km2 (31.6%). The loss areas were mainly converted into LCO (69.86 km2), accounting for 71.8% of the total loss areas, which were mostly distributed in Qinglin and Jinchang.
The gain and loss areas of the DO were 16.72 km2 and 72.31 km2, respectively, leading to a net reduction of 55.58 km2 (29.2%). The loss areas, mostly distributed in Jiudun, were mainly converted into LCO areas (57.74 km2), accounting for 79.9% of the total loss areas.

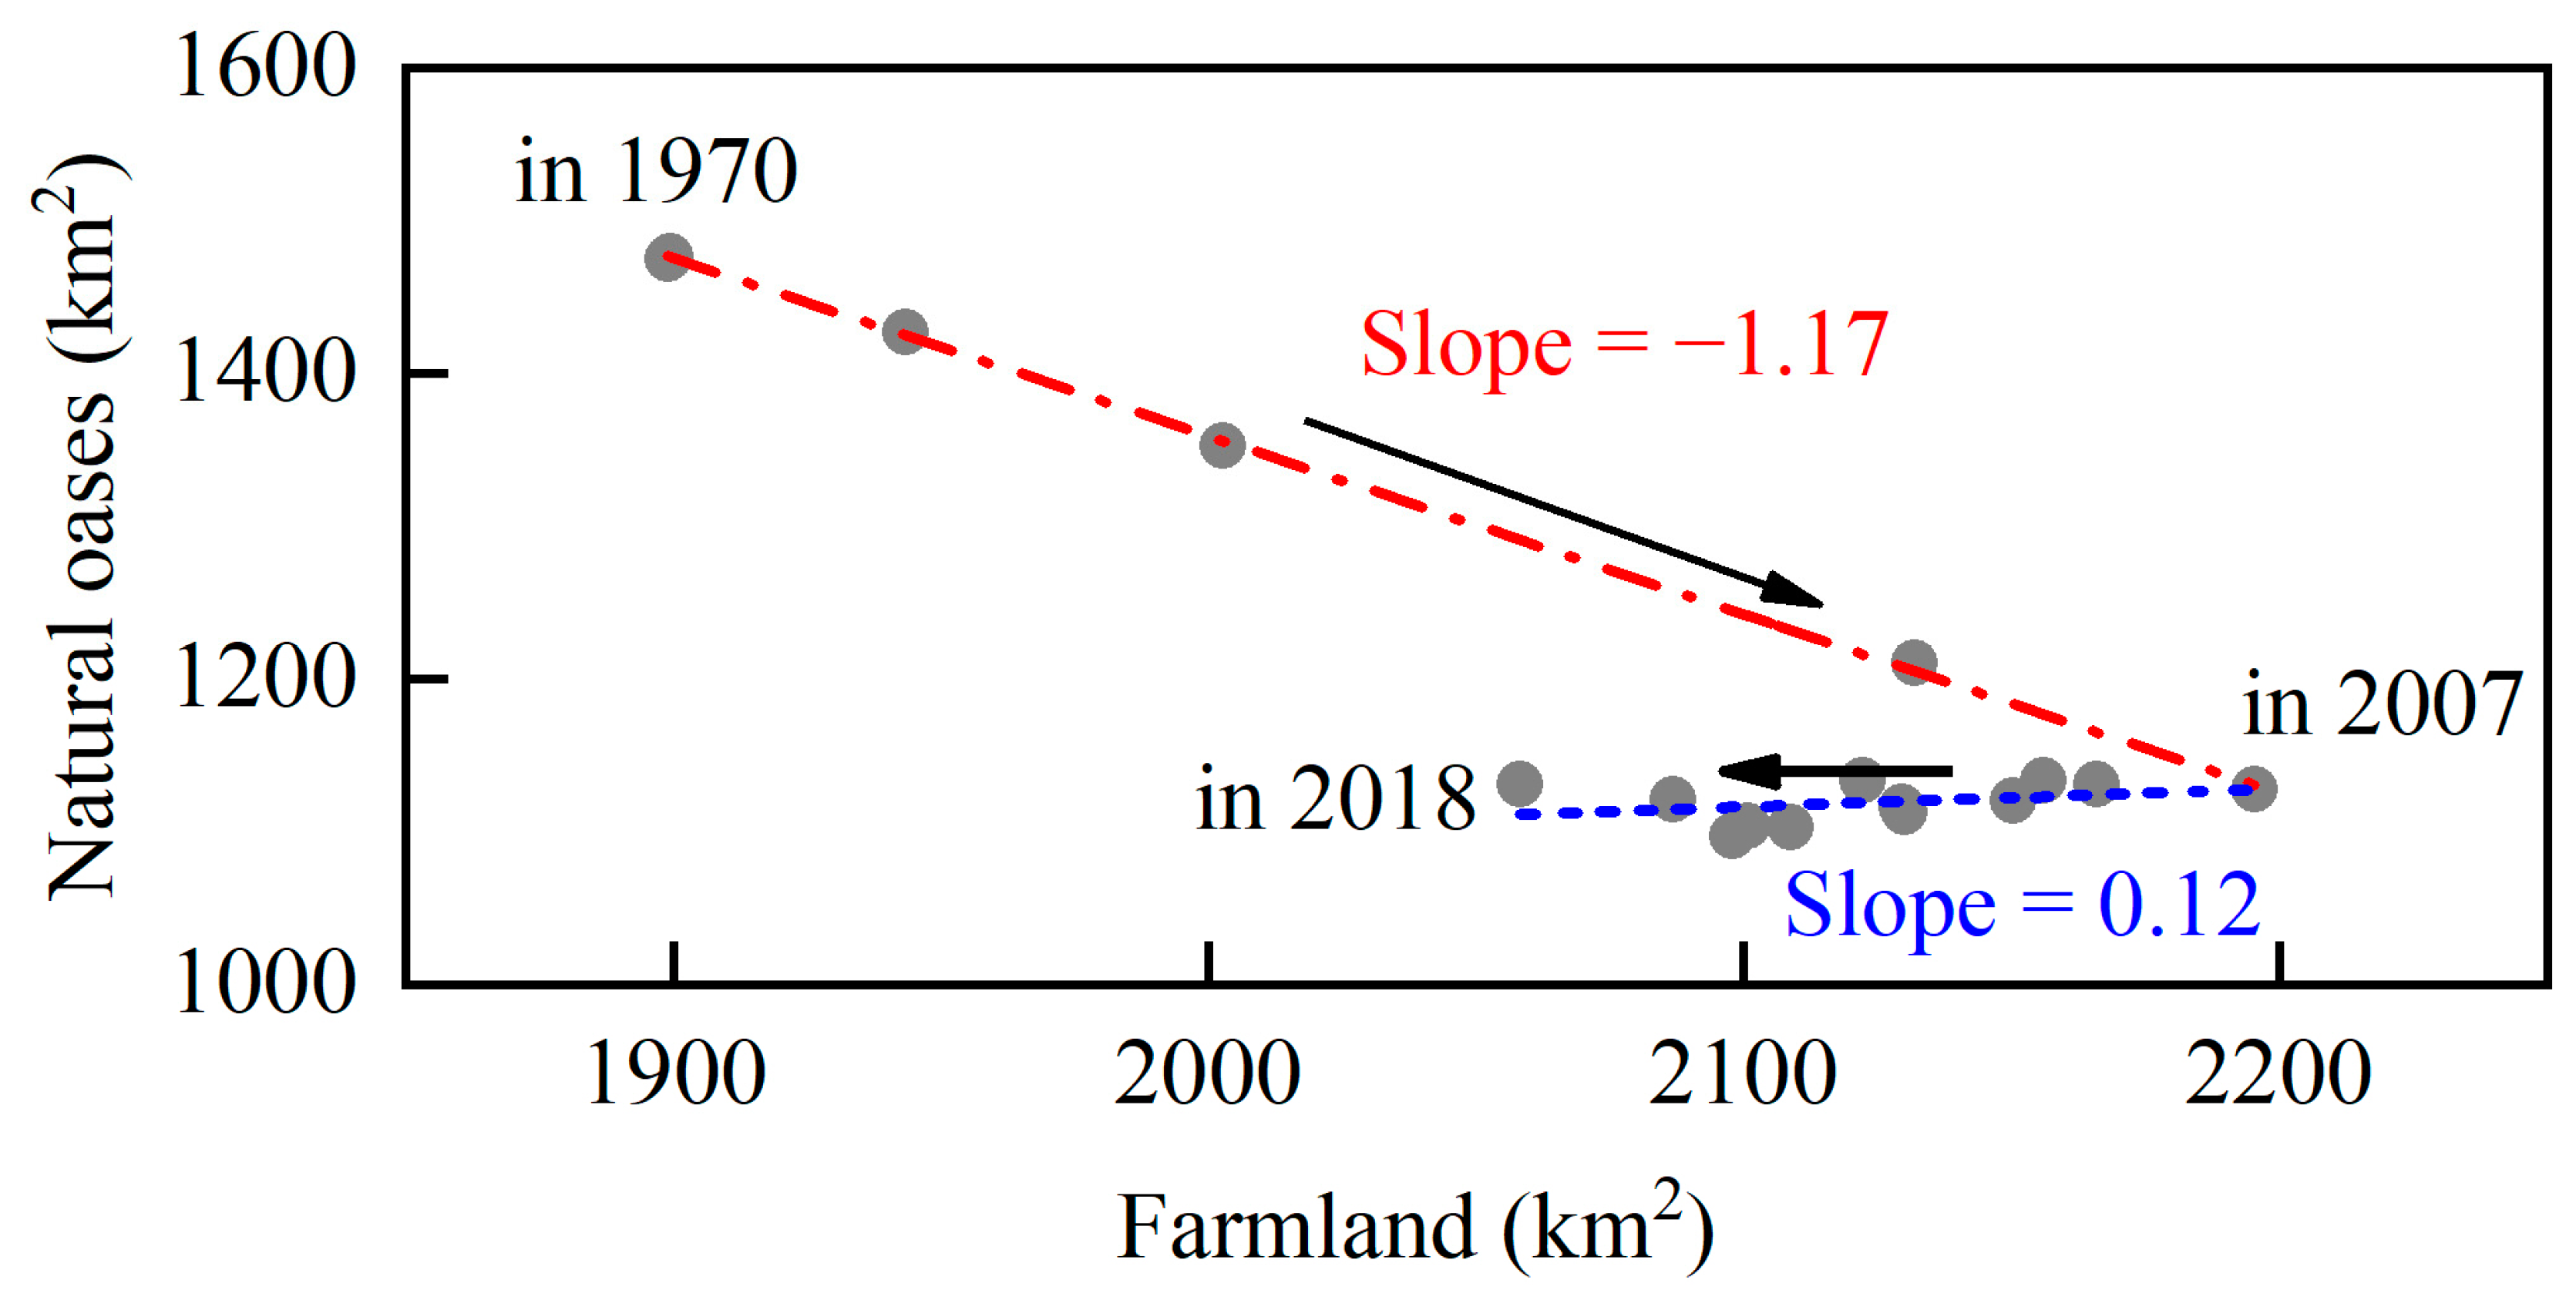
3.1.4. LUCCs during 1984–2018

The areas of farmland, natural oases, and OL since 1970 are presented in Figure 6. From 1970 to 1984, human activities were stable, and there were no significant LUCCs. From 1984 to 2007, the farmland and OL expanded at rates of 13.85 km2/year and 2.42 km2/year, respectively, while the natural oases decreased at a rate of 16.25 km2/year. From 2008 to 2018, the OL expanded at a higher rate of 11.52 km2/year, while farmland and natural oases decreased at rates of 8.99 km2/year and 2.57 km2/year, respectively.
A correlation analysis between the farmland area and the natural oasis area (Figure 7) revealed that the natural oasis area decreased by 1.17 km2 for every 1 km2 of increase in farmland area before 2007. After 2007, the natural oases recovered by only 0.12 km2 for every 1 km2 of increase in farmland area. That is, only 0.12 km2 of every 1.17 km2 of the original natural oases were restored after the natural oasis–farmland–return to natural oasis conversion process was implemented. This indicates that, to some extent, relatively speaking, the natural oases lacked vegetation species diversity and the ecosystem structure was simple and extremely fragile, i.e., the ecosystem stability was low, and it would be very difficult to achieve system recovery in the event of ecosystem damage [22].
During 1984–2018, the farmland and OL increased by 198.38 km2 and 180.91 km2, respectively, while the natural oases decreased by 379.29 km2. In particular, the MCO increased by 52.92 km2; while the DO, LCO, and HCO decreased by 334.81 km2, 94.65 km2, and 2.76 km2, respectively. In 1984, the HCO, MCO, LCO, and DO accounted for 1.4%, 7.7%, 59.1%, and 31.8% of the natural oasis area, respectively. In 2018, these four vegetation cover types accounted for 1.6%, 15.2%, 70.9%, and 12.3%, respectively, meaning that the first three types increased by 0.2%, 7.5%, and 11.8%, while the DO decreased by 19.5%. This indicates that, to some extent, local human activities provided a certain amount of water supply to ensure the good growth of vegetation species in the natural oases.

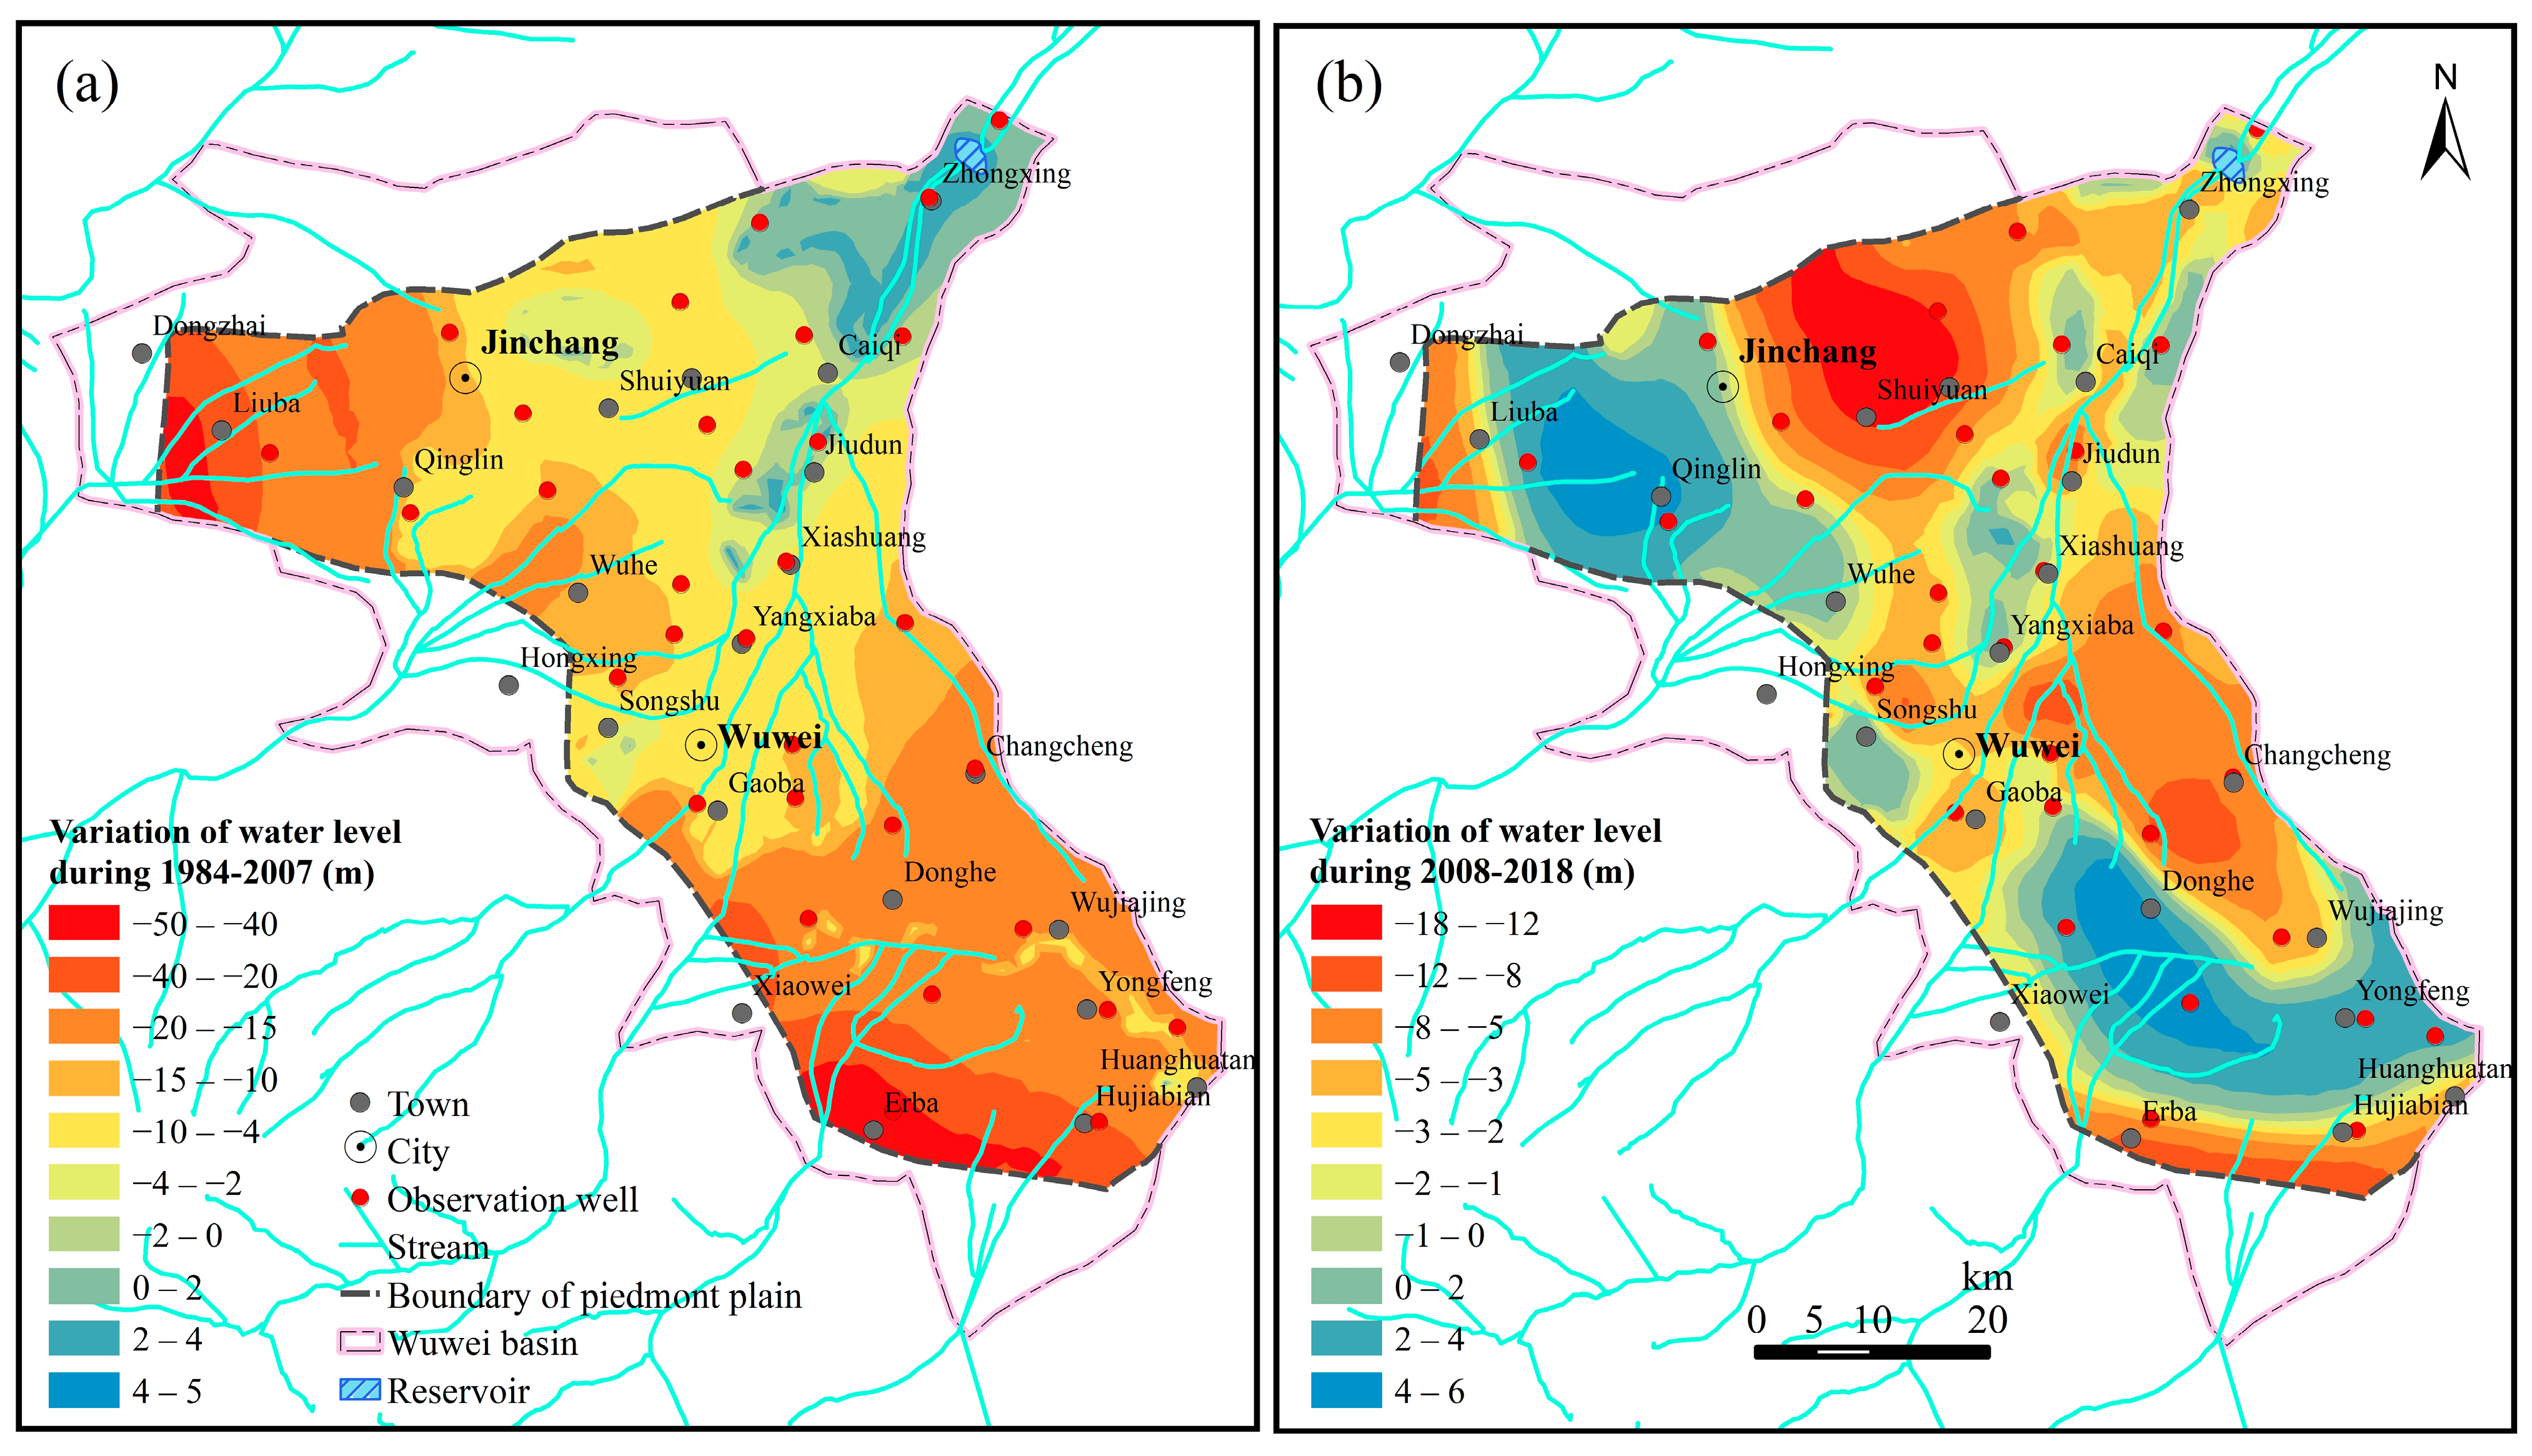
3.2. Impact of LUCCs on Groundwater Depth

The groundwater depth, as an important indicator of the ecological environment [32,53], is the dominant factor influencing the distribution, growth, population succession, and survival of vegetation species in natural and DO areas [54,55]; it is also an essential variable for measuring and evaluating basin water resource management. A reasonable groundwater depth is beneficial for both agricultural production and ecologically sustainable development [56,57].

3.2.1. Impact of LUCCs on Groundwater Depth from 1984 to 2007

As shown in Figure 8, the changes in groundwater depth from 1984 to 2007 exhibited a trend of significant increase–gradual slowdown–small rebound from west to east and from south to north. The groundwater level declined by more than 40 m in the western and southern parts of the region and by 4–20 m in the central part, while it varied little in the northeast, with a small rebound at some locations.
Figure 5 and Figure 6 jointly illustrate that in the regions where the groundwater depth changed from 1984–2007, the farmland and MCO increased, while the DO and LCO decreased. Significant LUCCs occurred in the western and southeastern parts of the study area, especially near Jinchang. The total area of land-use conversion was 508.96 km2, accounting for 13.8% of the study area.
Table 2 shows that where the groundwater depth changed from 1984–2007, the area of DO decreased by 11.52–57.44 km2. The LCO only underwent positive changes in some parts of the study area, with a maximum increase of 11.84 km2 and a maximum decrease of 51.68 km2. The farmland underwent positive changes throughout the study area, with a maximum increase of 102.08 km2. The MCO generally underwent positive changes, with a maximum increase of 55.84 km2.
The regions where the groundwater depth changed from −20 m to −4 m had a total area of 2153.60 km2, accounting for 58.3% of the total study area; these areas (referred to as the −20 m/−4 m subregion for simplicity) were distributed in the central part of the study area. From 1984 to 2007, the farmland in the −20 m/−4 m subregion increased by 187.04 km2, accounting for 63.4% of the total increase in farmland in the study area. The MCO increased by 91.68 km2, accounting for 70.2% of the total increase in the MCO in the study area. The LCO decreased by 178.72 km2, accounting for 90.2% of the total reduction in the LCO in the study area. The DO decreased by 119.52 km2, accounting for 42.9% of the total reduction in the DO in the study area. In addition, the total area of land-use conversion in the −20 m/−4 m subregion was 298.72 km2, accounting for 13.9% of the total area of this subregion and 58.7% of the total area of land-use conversion in the study area, indicating that this subregion was the region wherein the LUCCs were the most active and concentrated. This pattern was created because the groundwater depth was naturally 10–40 m in the −20 m/−4 m subregion, which allowed groundwater extraction wells to be drilled at low cost and the groundwater to be discharged with little difficulty. In addition, the −20 m/−4 m subregion received runoff recharge from the south all year round (especially during the irrigation period), and thus, the groundwater storage was abundant, thereby making this subregion a favorable place for LUCCs.
Under natural conditions, the groundwater in the western and southern parts of the study area was generally more than 50 m below the ground surface, and, thus, its ecological function in the growth of natural oases was negligible. The expansion of farmland was preferentially conducted in the LCO because in 1984, the areas of the different land-use types, listed in decreasing order, were: farmland > LCO > DO > OL > MCO > HCO. The LCO accounted for 872.58 km2 of land use, which was 1.86 times larger than in DO. In addition, as opposed to the DO, the LCO was covered by vegetation to some extent, indicating that the locations of the LCO were advantageous in terms of having access to relatively more groundwater to support crop growth. After the conversion of LCO to farmland, agricultural irrigation activities were conducted continuously, mainly utilizing surface water conveyance and groundwater irrigation. In addition, the study area displayed a high-slope terrain, with a difference in elevation of 1400 m. During the irrigation period, a large volume of runoff was generated from the cropland, which allowed the nearby natural oasis areas, especially the DO areas, to effectively receive a water supply. Consequently, the plants in these nearby areas could grow well, gradually converting the areas into LCO and, further, into MCO. For example, the groundwater level was deep (>70 m in 2018) in the areas where the groundwater depth changed from −50 to −40 m (referred to as the −50 m/−40 m subregion); thus, the groundwater could not supply water for natural vegetation growth at all. In the −50 m/−40 m subregion, the DO decreased by 19.04 km2, while the MCO increased by 11.52 km2, and there were almost no changes in any of the other land-use types investigated in this study. This indicates that the gain in MCO was derived from DO, due to the year-round human irrigation of the nearby farmland.

3.2.2. Impact of LUCCs on Groundwater Depth from 2008 to 2018

As shown in Figure 8, the groundwater level generally declined in the eastern and northern parts of the Wuwei Plain from 2008 to 2018, with a drop of 5–18 m; the maximum drop occurred around Shuiyuan. The groundwater level rose by 2–6 m in the south and west, and the groundwater level also rose at multiple sites in the vicinity of the main river channel.
Figure 5 and Table 2 jointly show that where the groundwater depth changed during 2008–2018, the farmland, MCO, and DO all decreased, while the LCO and OL expanded. The total converted land area was 261.28 km2, accounting for 7.1% of the total study area.
The areas where the groundwater level changed from −8 to −2 m from 2008 to 2018 spanned 1457.92 km2, accounting for 39.4% of the total study area. In these areas (referred to as the −8 m/−2 m subregion), the farmland decreased by 83.68 km2, accounting for 86.2% of the total reduction in farmland in the study area. The DO decreased by 17.28 km2, accounting for 30.9% of the total reduction in the DO in the study area. The OL increased by 59.04 km2, accounting for 46.5% of the total increase in the OL in the study area. The LCO increased by 34.72 km2, accounting for 33.9% of the total increase in the LCO in the study area. The total converted land area in the −8 m/−2 m subregion was 102.24 km2, accounting for 7.0% of the total area of this subregion and 39.1% of the total converted land area of the study area.
The areas where the groundwater level changed from 0 to 4 m from 2008 to 2018 spanned 804.48 km2, accounting for 21.8% of the total study area. In these areas (referred to as the 0 m/4 m subregion), the MCO decreased by 64.16 km2, accounting for 83.7% of the total reduction in MCO in the study area. The DO decreased by 18.56 km2, accounting for 33.2% of the total reduction in DO in the study area. The LCO increased by 61.12 km2, accounting for 59.6% of the total increase in LCO in the study area. The OL increased by 27.52 km2, accounting for 21.7% of the total increase in OL in the study area. The total converted land area in the 0 m/4 m subregion was 89.44 km2, accounting for 11.1% of the total area of this subregion and 34.2% of the total converted land area in the study area.
After 2007, the farmland shrinkage was concentrated in those areas where the groundwater level changed from −8 to 2 m. In the −8 m/2 m subregion, the farmland was mainly converted to OL near Wuhe, Songshu, and Wuwei. Part of the farmland was converted to the LCO to the east of Yangxiaba and Xiashuang.
The shrinkage in the MCO was due to conversion in the 0 m/4 m subregion, where this land use type was mainly converted to the LCO near Qinglin. Due to groundwater pumping, irrigation, and weakening surface runoff in the 0 m/4 m subregion, the groundwater level rose by 2–6 m; and by 2018, the groundwater level was about 80 m deep, but this depth still prevented the groundwater from being effectively used by natural vegetation species, thereby leading to a gradual decline in the vegetation coverage over the years.
The DO generally decreased in each subregion where the groundwater depth changed over the years, gradually changing into the LCO as farmland irrigation and ecological irrigation practices increased in the nearby areas. The maximum decrease (19.36 km2) in the DO occurred to the east of Caiqi where the groundwater depth changed from 0 to 2 m.

3.3. Causes of Groundwater Depth Variation

Since the 1980s, with the expansion of farmland, the water demand for farmland irrigation has increased. Surface water was not sufficient for farmland irrigation. At the same time, the utilization rate of surface water was not high for a number of reasons, such as the poor impermeability of the canal system, and the water delivery timing not fully matching the exact moment of farmland irrigation. In addition, the canal water still needed to be diverted to farmland via ditches, with serious losses along the way. Water was still mainly based on extracted groundwater, and wells were growing rapidly. According to the statistics, there were 4294 wells in the Wuwei Basin in 2005, with a distribution density of 0.86 wells/km2. Due to the wide distribution of wells and the convenience of water extraction and supply, groundwater extraction rose from 5.0 × 10⁸ m3/year in 1980 to 6.4 × 10⁸ m3/year in 2006, with an average annual extraction of 5.9 × 10⁸ m3/year (Figure 9). With the sharp increase in groundwater exploitation, the groundwater level dropped rapidly, and the spring overflow declined significantly. The spring overflow in the mainstream of the Shiyang River decreased from 4.4 × 10⁸ m3/year in the 1950s to 0.43 × 10⁸ m3/year in 2010. The pre-mountain region of the Wuwei Basin was the runoff area. Under groundwater dynamics, the groundwater ran east from Liuba, and north from Erba and Huanghuatan. The groundwater depth in these areas was more than 100 m, which meant that groundwater could not provide physiological water for natural vegetation and no longer served its ecological function. To ensure farmland irrigation, the combination of groundwater and surface water supply was adopted. However, some factors, such as the construction of reservoirs and the anthropogenic interception of flow in the upper reaches of the basin, resulted in a weakening of the piedmont runoff recharge from the Qilian Mountains. In addition, the topographic slope of the pre-mountain plain was relatively steep, which tended to generate runoff to the middle of the basin during farmland irrigation. The amount of piedmont runoff recharge from the Qilian Mountains was less than the sum of groundwater extraction and discharge to adjacent areas, resulting in a greater decline in groundwater level. The central and northern parts of the basin received lateral runoff recharge from adjacent areas, coupled with the relatively shallow groundwater depth and weak groundwater exploitation, so that the groundwater decline was smaller.
Since the implementation of CTSRB, the farmland area decreased and groundwater extraction became limited, with an average annual extraction of 4.6 × 10⁸ m3/year, which was about 6.8% lower than the amount before CTSRB [41]. The amount of groundwater recharged by irrigation also changed, including surface water infiltration during conveyance, irrigation ditch infiltration, and the infiltration of irrigation groundwater. In 2007, the farmland area was 2629.9 km2, and the surface water conveyance was 7.5 × 10⁸ m3. It was calculated that the surface water infiltration during conveyance and irrigation ditch infiltration was 2.0 × 10⁸ m3 in total. However, the groundwater extraction was 6.9 × 10⁸ m3, and the infiltration of irrigation groundwater was 1.8 × 10⁸ m3. Therefore, the groundwater consumption was 3.1 × 10⁸ m3. As the farmland area decreased, the amount of groundwater resource loss also decreased (Figure 10). By 2018, the farmland decreased to 2510 km2, the surface water conveyance was 6.4 × 10⁸ m3, and the surface water infiltration during conveyance and irrigation ditch infiltration totaled 1.7 × 10⁸ m3. While the groundwater extraction was 4.9 × 10⁸ m3, the infiltration of irrigation groundwater was 1.3 × 10⁸ m3. Thus, the groundwater consumption was 1.8 × 10⁸ m3. With an increased awareness of efficient water use, and the development of high-standard lining and repair projects for canal systems, the losses during the process of surface water conveyance were reduced, and the utilization rate of canal system water increased accordingly. In the areas where the groundwater level had dropped seriously, such as Liuba and Qinlin in the west, groundwater extraction was prohibited. In the areas of Erba and Huanghuatan in the south, the farming area was restricted, and groundwater extraction was limited under the premise of maximizing the utilization of surface water. At the same time, the piedmont runoff recharge capacity from the Qilian Mountains was subsequently enhanced by water conservation in the upper reaches of the basin. All these factors largely alleviated the groundwater resource situation in the piedmont plain, and the groundwater level gradually rose. The central part was irrigated only with limited groundwater, so the groundwater level continued to decline, especially in northern Shuiyuang and eastern Changcheng. The water depth was more than 10 m and the groundwater no longer performed its ecological function in these places. The conversion of DO and LCO to farmland increased the demand for groundwater near Changcheng in the east. The growth of the OL near Shuiyuang in the north also raised water demand, due to urban construction and industrial use. As a result, these two areas became the areas with the greatest drops in water level.

3.4. Response of Groundwater Depth to LUCC

The whole region was divided into groundwater depth-increasing areas and groundwater depth-decreasing areas, and its land-use changes were calculated separately to analyze the response of groundwater depth to the land-use changes. During 1984–2007, the area of groundwater depth decreasing accounted for 94.3% of the total, and the average decrease in groundwater depth was 24.2 m (Table 3). Among them, the farmland area increased by 14.2%, yet the LCO and DO decreased by 23.6% and 57.5%, respectively. This indicated that the conversion to farmland reduced groundwater levels significantly. From 2008–2018, the farmland in the area of groundwater depth increasing decreased by 1.1%, and the water level rose by an average of 3.1 m. The farmland in the area of groundwater depth decrease was reduced by 5.9% and the water level dropped by an average of 5.1 m. The DO decreased while the LCO increased. This further indicated that the irrigation behavior would bring some water to the nearby natural oases, which could promote the healthy growth of natural vegetation.

3.5. Groundwater Balance Analysis

Recent studies have shown that the groundwater in the study area remained in a negative balance all year round, with the rate of change in the groundwater storage volume shifting from −12,943.2 × 104 m3/year in 2007 to −7270.4 × 104 m3/year in 2018, due to the gradual decline in the groundwater resource consumption as the CTSRB was implemented. According to the data published in the report on the research and demonstration of the rational extraction and utilization of groundwater and the protection of ecological functions in the Shiyang River Basin, a linear regression equation for the changes in the groundwater storage volume as a function of the farmland area, surface water conveyance volume, and groundwater extraction volume was established using Excel:
Q = 25094.58 19.0297 S c + 0.5214 Q s 0.5229 Q g
where R2 = 0.9434, indicating a good fit of the linear regression equation to the groundwater storage volume. The significance test (Table 4) showed that the changes in the groundwater storage volume were significantly correlated with the farmland area (p < 0.05) and were extremely significantly correlated with the surface water conveyance volume and groundwater extraction volume (both p < 0.01). That is, the linear regression equation fitted the raw data well and was reliable.
After 1984, the farmland underwent erratic expansion, followed by the implementation of the Grain-for-Green Project. In addition, the groundwater storage volume also underwent a rapid depletion to slow recovery process. The missing early data for the groundwater storage volume can be predicted using the established linear regression equation. The farmland area was 1899.43 km2 in 1984, and it increased by 295.52 km2 in 1984. Assuming that the surface water conveyance volume and groundwater extraction volume in 1984 were the same as in 2007, the rate of change of the groundwater storage volume in 1984 was estimated to be −7319.5 × 104 m3/year. With the implementation of the CTSRB, the farmland decreased to 2097.8 km2 in 2018, and the rate of change of the groundwater storage volume was −7270.4 × 104 m3/year in 2018. The groundwater in the study area was in a negative balance all year round and was extracted in large volumes. To ensure water resource management in the basin and to achieve sustainable development of the basin, it is necessary to implement and improve integrated basin management initiatives sustainably and efficiently.
The changes in groundwater levels in arid and semi-arid regions were influenced by a combination of factors. Based on the above analysis, it could be seen that the groundwater depth was sensitive to changes in land use types because of human activities. This indicated that groundwater resources in the region were closely related to land use types. Groundwater depth increased significantly with the continuous expansion of farmland. Since the implementation of CTSRB, the farmland area has been effectively controlled, and the trend of groundwater level decline has been significantly improved.
The groundwater depth also changed to different degrees due to other human activities, such as the surface soil nature, the type of crops cultivated, and changes in irrigation systems. Especially in the pre-mountain plain area, where the aquifer particles were relatively coarse, the variations in groundwater depth would be larger. These factors were not considered in this study, and the results of the analyses are still limited and uncertain, to some extent. For these reasons, to propose countermeasures and measures for the rational use of water and land resources in the development of water resources planning programs, the impact of human activities, including a variety of factors such as land use changes, should be considered comprehensively when water-resources planning is carried out.

4. Conclusions

The main conclusions of this study are as follows.
Before the CTSRB in 2007, the area of natural oases decreased at a rate of 16.25 km2/year, while the area of farmland expanded at a rate of 13.85 km2/year. The farmland expansion preferentially occurred in LCO and MCO, where the groundwater depth increased from 4 to 20 m. The consumption of groundwater increased from 7319.5 × 104 m3/year to 12,943.2 × 104 m3/year.
During 2008–2018, the areas of both the natural oases and farmland decreased at the rates of 2.57 km2/year and 8.99 km2/year, respectively. The groundwater level rose significantly in the south, in the west, and near the main river channel. The negative groundwater balance was alleviated, and the groundwater resource consumption was restored to 7270.4 × 104 m3/year. Through the natural oasis–farmland–natural oasis conversion process, only 0.12 km2 of every 1.17 km2 of the original natural oases were restored, indicating that it would be very difficult to achieve system recovery in the event of ecosystem damage. Groundwater depth increased significantly with the continuous expansion of farmland. Since the farmland area was effectively controlled, the trend of groundwater level decline was significantly improved.
Land-use changes inevitably led to changes in the water supply and use patterns, groundwater depth, and groundwater balance status. To fulfill the goals of water resource management, the ecological restoration and reconstruction of oases, and the sustainable development of the basin, the following measures should be continued in the future:
(1) Adjusting the local agricultural planting structure, developing special agriculture with high output value, high efficiency, and good benefits, and advocating and promoting the concept of water planning and water conservation to reduce wasteful behavior regarding water resources.
(2) According to the basin water allocation plan, planners should decompose and implement the indicators of groundwater extraction and reduction. At the same time, groundwater extraction should be reduced in a planned manner, to gradually achieve a balance between groundwater extraction and recharge, and then achieve a greater amount of recharge than extraction.
(3) Minimizing the area of farmland, especially by reducing the reclamation of the upper reaches of the basin. This is because the upper part, i.e., the upper and middle alluvial fans, is the source of the recharge of the groundwater system.
(4) In fact, the groundwater depth in most areas of the basin is far greater than the required depth (less than 10 m) for the normal growth of natural vegetation species [57]. Therefore, inter-basin water transfer projects, for example, can be combined to provide orderly artificial groundwater recharge to the area.
(5) Gradually restoring groundwater levels and implementing ecological water conveyance to maintain the normal growth of natural oases. Due to the slow recovery of vegetated ecosystems, the relationship between vegetation recovery, groundwater, and land use changes over time can be studied further in subsequent studies.

Author Contributions

Conceptualization, L.W. and Z.N.; methodology, L.W., Q.Y. and Z.N.; formal analysis, L.W., H.L. and B.F.; investigation, M.L., L.C. and Q.Y.; data curation, L.W., P.Z. and M.L., writing—original draft preparation, L.W.; writing—review and editing, P.Z. and Q.Y.; supervision, M.L. and L.C.; funding acquisition, Z.N., M.L. and L.C. All authors have read and agreed to the published version of the manuscript.

Funding

This research was funded by the National Natural Science Foundation of China (grant Nos. 41902262 and 41807214), the National Key Research and Development Program of China (grant No. 2017YFC0406103), the Natural Science Foundation of Hebei Province, China (grant No. D2022504014), the Fundamental Research Funds for Central Public Welfare Research Institutes, CAGS (grant No. SK202011), and the China Geological Survey Project (grant Nos. DD20221752 and DD20190349). The authors declare that they have no financial conflicts of interest related to this work.

Data Availability Statement

The data presented in this study are available on request from the corresponding author.

Acknowledgments

The authors would like to sincerely thank Zhang Tongze, who has provided abundant data for this study. We also thank the editors and anonymous reviewers who provided valuable comments.

Conflicts of Interest

The authors declare no conflict of interest.

References

  1. Gleeson, T.; Cuthbert, M.; Ferguson, G.; Perrone, D. Global Groundwater Sustainability, Resources, and Systems in the Anthropocene. Annu. Rev. Earth Planet. Sci. 2020, 48, 431–463. [Google Scholar] [CrossRef] [Green Version]
  2. Lall, U.; Josset, L.; Russo, T. A Snapshot of the World’s Groundwater Challenges. Annu. Rev. Environ. Resour. 2020, 45, 171–194. [Google Scholar] [CrossRef]
  3. Buhay Bucton, B.G.; Shrestha, S.; KC, S.; Mohanasundaram, S.; Virdis, S.G.P.; Chaowiwat, W. Impacts of climate and land use change on groundwater recharge under shared socioeconomic pathways: A case of Siem Reap, Cambodia. Environ. Res. 2022, 211, 113070. [Google Scholar] [CrossRef] [PubMed]
  4. Grönwall, J.; Danert, K. Regarding Groundwater and Drinking Water Access through A Human Rights Lens: Self-Supply as A Norm. Water 2020, 12, 419. [Google Scholar] [CrossRef] [Green Version]
  5. Sajjad, M.M.; Wang, J.; Abbas, H.; Ullah, I.; Khan, R.; Ali, F. Impact of climate and land-use change on groundwater resources, study of Faisalabad district, Pakistan. Atmosphere 2022, 13, 1097. [Google Scholar] [CrossRef]
  6. Ridwansyah, I.; Yulianti, M.; Apip; Onodera, S.; Shimizu, Y.; Wibowo, H.; Fakhrudin, M. The impact of land use and climate change on surface runoff and groundwater in Cimanuk watershed, Indonesia. Limnology 2020, 21, 487–498. [Google Scholar] [CrossRef]
  7. Nasiri, S.; Ansari, H.; Ziaei, A.N. Determination of water balance equation components in irrigated agricultural watersheds using SWAT and MODFLOW models: A case study of Samalqan plain in Iran. J. Groundw. Sci. Eng. 2022, 10, 44–56. [Google Scholar] [CrossRef]
  8. Kafando, M.B.; Koïta, M.; Zouré, C.O.; Yonaba, R.; Niang, D. Quantification of Soil Deep Drainage and Aquifer Recharge Dynamics according to Land Use and Land Cover in the Basement Zone of Burkina Faso in West Africa. Sustainability 2022, 14, 14687. [Google Scholar] [CrossRef]
  9. Zomlot, Z.; Verbeiren, B.; Huysmans, M.; Batelaan, O. Trajectory analysis of land use and land cover maps to improve spatial–temporal patterns, and impact assessment on groundwater recharge. J. Hydrol. 2017, 554, 558–569. [Google Scholar] [CrossRef] [Green Version]
  10. Zheng, Z.; Liu, L.; Cui, X. Source identification of methane in groundwater in shale gas development areas: A critical review of the state of the art, prospects, and future challenges. J. Groundw. Sci. Eng. 2021, 9, 245–255. [Google Scholar] [CrossRef]
  11. Tang, Z.; Engel, B.A.; Pijanowski, B.C.; Lim, K.J. Forecasting land use change and its environmental impact at a watershed scale. J. Env. Manag. 2005, 76, 35–45. [Google Scholar] [CrossRef]
  12. Kim, J.H.; Jackson, R.B. A Global Analysis of Groundwater Recharge for Vegetation, Climate, and Soils. Vadose Zone J. 2012, 11. [Google Scholar] [CrossRef] [Green Version]
  13. Van Huijgevoort, M.H.J.; Voortman, B.R.; Rijpkema, S.; Nijhuis, K.H.S.; Witte, J.M. Influence of climate and land use change on the groundwater system of the Veluwe, the Netherlands: A historical and future perspective. Water 2020, 12, 2866. [Google Scholar] [CrossRef]
  14. Huang, M.; Zhang, L. Hydrological responses to conservation practices in a catchment of the Loess Plateau, China. Hydrol. Process. 2004, 18, 1885–1898. [Google Scholar] [CrossRef]
  15. Jinno, K.; Tsutsumi, A.; Alkaeed, O.; Saita, S.; Berndtsson, R. Effects of land-use change on groundwater recharge model parameters. Hydrol. Sci. J. 2009, 54, 300–315. [Google Scholar] [CrossRef]
  16. Guerrero-Morales, J.; Fonseca, C.R.; Goméz-Albores, M.A.; Sampedro-Rosas, M.L.; Silva-Gómez, S.E. Proportional variation of potential groundwater recharge as a result of climate change and land-use: A study case in Mexico. Land 2020, 9, 364. [Google Scholar] [CrossRef]
  17. Zhang, L.; Dawes, W.R.; Walker, G.R. Response of mean annual evapotranspiration to vegetation changes at catchment scale. Water Resour. Res. 2001, 37, 701–708. [Google Scholar] [CrossRef]
  18. Ghimire, U.; Shrestha, S.; Neupane, S.; Mohanasundaram, S.; Lorphensri, O. Climate and land-use change impacts on spatiotemporal variations in groundwater recharge: A case study of the Bangkok Area, Thailand. Sci. Total Environ. 2021, 792, 148370. [Google Scholar] [CrossRef]
  19. Calow, R.C.; Robins, N.S.; Macdonald, A.M.; Macdonald, D.M.J.; Gibbs, B.R.; Orpen, W.R.G.; Mtembezeka, P.; Andrews, A.J.; Appiah, S.O. Groundwater Management in Drought-prone Areas of Africa. Int. J. Water Resour. D 1997, 13, 241–262. [Google Scholar] [CrossRef]
  20. Alley, W.M.; Reilly, T.E.; Franke, O.L. Sustainability of Ground-Water Resources; Circular 1186; US Geological Survey: Reston, VI, USA, 1999. [CrossRef] [Green Version]
  21. Li, X.; Xiao, D. Dynamics of water resources and land use in oases in middle and lower reaches of Shiyang River watershed, Northwest China. Adv. Water Sci. 2005, 16, 643–648. (In Chinese) [Google Scholar] [CrossRef]
  22. Li, H. Oasis Water Resource Utilization Scenarios Simulation and Oasis Ecological Security—A Case Study in Wuwei and Minqin Oasis of Shiyang River Stream. Ph.D. Thesis, Peking University, Beijing, China, 2008. [Google Scholar]
  23. Schwartz, W.F.; Zhang, H. Fundamentals of Groundwater; John Wiley & Sons: New York, NY, USA, 2003; p. 583. [Google Scholar]
  24. Sato, K.; Iwasa, Y. Groundwater Hydraulic; Springer: Tokyo, Japan, 2003; p. 204. [Google Scholar]
  25. Hu, J. Analysis on space-time distribution of groundwater resources based on gis technology in Shiyanghe River Basin. J. Desert Res. 2008, 28, 781–786. [Google Scholar]
  26. Wang, G.; Yang, L.; Chen, L.; Jumpei, K. Impacts of land use changes on groundwater resources in the Heihe River Basin. J. Geogr Sci 2005, 15, 405–414. [Google Scholar] [CrossRef]
  27. Shu, L.; Wang, Z.; Yuan, Y.; Zhang, F.; Liu, W.; Lu, C. Land use change and its impact on groundwater in the typical district of Sanjiang Plain during the past 40 years. J. Hydraul. Eng. 2021, 52, 896–906. [Google Scholar] [CrossRef]
  28. Hao, Y.; Xie, Y.; Ma, J.; Zhang, W. The critical role of local policy effects in arid watershed groundwater resources sustainability: A case study in the Minqin oasis, China. Sci. Total Environ. 2017, 601–602, 1084–1096. [Google Scholar] [CrossRef] [PubMed]
  29. Hu, H.; Ding, H.; He, B. Dynamic variation of groundwater level in the middle-lower reaches of Shiyanghe River Basin for nearly 40 years. Northwestern Geol. 2016, 49, 164–174. [Google Scholar] [CrossRef]
  30. Li, Z. Study on Water Crisis in Arid Inland River Basins and Its Countermeasures: A Case Study of Shiyang River Basin in Gansu Province. Ph.D. Thesis, Cold and Arid Regions Environmental and Engineering Research Institute, Chinese Academy of Sciences, Beijing, China, 2007. [Google Scholar]
  31. Fan, Y.; Wang, C.; Nan, Z. Comparative evaluation of crop water use efficiency, economic analysis and net household profit simulation in arid Northwest China. Agric. Water Manag. 2014, 146, 335–345. [Google Scholar] [CrossRef]
  32. Li, S.; Zhang, Y.; Ma, Y.; Wang, L.; Mu, H. Analysis of groundwater dynamic changes in Shiyang River Basin. J. Arid. Land Resour. Environ. 2018, 32, 145–151. [Google Scholar] [CrossRef]
  33. Zhou, J.; Lei, L.; Shi, P.; Wang, L.; Wei, W.; Liu, H. Response of runoff to the climate and land use pattern changes in Shiyang River Basin. Acta Ecol. Sin. 2015, 35, 3788–3796. [Google Scholar] [CrossRef] [Green Version]
  34. Liu, J. Study on Water Resource Distribution Change of Modality Driven with Land Use and Land Coverage in Hexi Inland River Basin of Northwest China. Ph.D. Thesis, Cold and Arid Regions Environmental and Engineering Research Institute, Chinese Academy of Sciences, Beijing, China, 2007. [Google Scholar]
  35. Ma, X.; Li, B.; Wu, C.; Peng, H.; Guo, Y. Predicting of temporal-spatial change of groundwater table resulted from current land use in Minqin oasis. Adv. Water Sci. 2003, 14, 85–90. [Google Scholar] [CrossRef]
  36. Li, Z. Study on Ecological Flow Analysis and Water Resources Optimization Allocation in Shiyang River Basin. Master Thesis, Chang’an University, Xi’an, China, 2020. [Google Scholar]
  37. Zhang, L. Study on the Effectiveness of Integrated Management of Shiyang River Basin in Terms of Water Resources. Master Thesis, Lanzhou University, Lanzhou, China, 2017. [Google Scholar]
  38. Shi, Y.; Zhang, R.; Dong, P.; Hao, Y.; Shi, P.; Cheng, Z. Effect analysis of efficient utilization of water resources and ecological management measures in Shiyang River Basin: A case study of water resources management in Minqin. Water Resour. Plan. Des. 2017, 53–55. [Google Scholar] [CrossRef]
  39. Zhang, J.; Li, J.; Yang, X.; Yin, S.; Chen, J. Rural social-ecological systems vulnerability evolution and spatial-temporal heterogeneity in arid environmental change region: A case study of Minqin Oasis, northwestern China. Appl. Geogr. 2022, 145, 102747. [Google Scholar] [CrossRef]
  40. Nie, Z.; Liu, M.; Liu, P.; Wang, L.; Meng, L. Research and Demonstration of Rational Extraction and Utilization of Groundwater and Protection of Ecological Functions in Shiyang River Basin; Institute of Hydrogeology and Environmental Geology, CAGS: Shijiazhuang, China, 2021. [Google Scholar]
  41. Wang, L.; Nie, Z.; Liu, M.; Cao, L.; Zhu, P.; Yuan, Q. Rational Allocation of Water Resources in the Arid Area of Northwestern China Based on Numerical Simulations. Sustainability 2023, 15, 55. [Google Scholar] [CrossRef]
  42. Liu, H.; Liu, S.; Li, Y. Response of riparian vegetation to the change of groundwater level at middle and lower reaches of the Shiyang River. Arid Zone Res. 2012, 29, 335–341. [Google Scholar]
  43. Liu, S. Change of Riparian Vegetation and Its Driving Factors at the Middle and Lower Reaches of Shiyang River Basin. Ph.D. Thesis, Beijing Forestry University, Beijing, China, 2010. [Google Scholar]
  44. Feng, B.; Nie, Z.; Wang, J.; Lu, H. Long-time series remote sensing dynamic monitoring of the oasis in Shiyang River basin. Geospat. Inf. 2020, 18, 6. [Google Scholar] [CrossRef]
  45. Lu, H.; Nie, Z.; Liu, M.; Feng, B.; Cheng, X.; Wang, J.; Wang, Q.; Cui, H.; Fan, F. Research on land cover changes in Shiyang River Basin in recent 50 years based on RS and GIS. Geogr. Res. 2020, 29, 8. [Google Scholar]
  46. Li, M.; Wu, B.; Yan, C.; Zhou, W. Estimation of vegetation fraction in the upper basin of Miyun Reservoir by remote sensing. Resour. Sci. 2004, 26, 153–159. [Google Scholar]
  47. Gao, Z.; Li, Z.; Wei, H.; Ding, F. Quantitative monitoring of vegetation cover change by using remotely sensed data over Minqin Oasis, Gansu. Geogr. Res. 2006, 25, 587–595. [Google Scholar] [CrossRef]
  48. Rongqun, Z.; Sun, W.; Ai, D.; Wang, S. Analysis on land cover change based on visual method of monitoring information. Trans. Chin. Soc. Agric. Eng. 2015, 31, 8. [Google Scholar] [CrossRef]
  49. Aldwaik, S.Z.; Pontius, R.G. Intensity analysis to unify measurements of size and stationarity of land changes by interval, category, and transition. Landsc. Urban Plan 2012, 106, 103–114. [Google Scholar] [CrossRef]
  50. Huang, B. Processes in Land Use Change and their Environmental Consequences in Coastal Area of Fujian Province from the Perspective of Land-Sea Integration. Ph.D. Thesis, Xiamen University, Xiamen, China, 2019. [Google Scholar]
  51. Wen, X.; Duan, H.; Liao, J.; Xue, X. Rs monitoring of the spatial-temporal variation of vegetation index and desertification in Shiyang River Basin. J. Jilin Univ. (Earth Sci. Ed.) 2012, 42, 415–422. [Google Scholar] [CrossRef]
  52. Wei, J. The Hexi Area Oasis Extraction Method and Spatial Distribution Based on the Remote Sensing. Master Thesis, Lanzhou University, Lanzhou, China, 2016. [Google Scholar]
  53. Wang, J.; Zhang, G.; Cui, H.; Wang, Q.; Dong, H.; Hao, J. System index attribute and application of groundwater function zoning in northwest inland area of China. J. Hydraul. Eng. 2020, 51, 796–804. [Google Scholar] [CrossRef]
  54. Ye, H.; Chen, S.; Sheng, F.; Chen, H. Research on dynamic changes of land cover and its correlation with groundwater in the Shule River Basin. J. Hydraul. Eng. 2013, 44, 83–90. [Google Scholar] [CrossRef]
  55. Yan, D.; Wang, H.; Qin, D.; Wang, J.; Li, Y. The ecological evolution driven by water in the lower reaches of Heihe Basin. China Environ. Sci. 2005, 25, 38–42. [Google Scholar]
  56. Ren, D.; Xu, X.; Huang, Q.; Huo, Z.; Xiong, Y.; Huang, G. Analyzing the role of shallow groundwater systems in the water use of different land-use types in arid irrigated regions. Water 2018, 10, 634. [Google Scholar] [CrossRef] [Green Version]
  57. Liu, M.; Nie, Z.; Cao, L. Comprehensive evaluation on the ecological function of groundwater in the Shiyang River watershed. J. Groundw. Sci. Eng. 2021, 9, 326–340. [Google Scholar] [CrossRef]
Figure 1. Location of (a) the Shiyang River Basin, (b) the Wuwei sub-basin, against the Shiyang River basin, (c) elevation distribution of the Wuwei sub-basin.
Water 15 00457 g001
Figure 2. Distribution of (a) water level elevation in 2018, (b) groundwater depth in 2018.
Water 15 00457 g002
Figure 3. Category level intensity analysis for (a) 1984–2007; (b) 2008–2018.
Water 15 00457 g003
Figure 4. Transition-level intensity analysis of farmland for (a) 1984–2007; (b) 2008–2018.
Water 15 00457 g004
Figure 5. Distributions of land use/cover types, (a) in 1984, (b) in 2007, and (c) in 2018.
Water 15 00457 g005
Figure 6. Changes in the areas taken up by the various land use/cover types.
Water 15 00457 g006
Figure 7. Relationship between the farmland area and the natural oasis area.
Water 15 00457 g007
Figure 8. Groundwater depth changes in the plain during (a) 1984–2007, and (b) 2008–2018 (negative values denote water-level decline).
Water 15 00457 g008
Figure 9. Amount of surface water conveyance and groundwater extraction since 1980.
Water 15 00457 g009
Figure 10. Relationship between farmland area and water consumption in 2007–2018.
Water 15 00457 g010
Table 1. Transition matrix of the land-cover types (km2).
YearTypeFarmlandHCOMCOLCODOOLTotal
1984~2007Farmland1886.041.400.280.532.628.561899.43
HCO3.757.723.761.922.810.2920.26
MCO12.110.0076.1520.211.743.67113.88
LCO260.885.2911.91536.9835.0622.46872.58
DO26.743.89151.76114.82147.8624.74469.81
OL5.430.080.090.040.50307.86314.01
Total2194.9518.39243.95674.49190.59367.593689.96
2008~2018Farmland2022.161.968.1260.087.1895.462194.95
HCO0.5512.302.541.010.321.6718.39
MCO0.770.00146.6569.860.0026.68243.95
LCO50.992.524.10588.572.2526.06674.49
DO8.140.151.3357.74118.284.94190.59
OL15.200.574.070.676.97340.10367.59
Total2097.8117.50166.81777.93135.00494.923689.96
Table 2. Changes in the areas of the various land-use types over set periods in subregions corresponding to a different range of changes in groundwater depth (km2).
YearWater Level Variations (m)FarmlandHCOMCOLCODOOL
1984~2007−50 to −400.8011.520.32−19.046.4
−40 to −202.56021.1211.84−40.484.96
−20 to −1550.56−0.4855.84−51.68−57.443.2
−15 to −1034.40.3221.76−41.44−16.81.76
−10 to −4102.080.9614.08−85.6−45.2813.76
−4 to −235.042.56−6.4−24.32−13.66.72
−2 to 012.64−0.16−2.080−11.521.12
0 to 27.36−0.961.283.2−12.962.08
2 to 416.161.924.16−4.96−30.0812.8
4 to 533.6−6.49.28−5.6−31.680.8
2008~2018−18 to −123.5200−5.28−0.322.08
−12 to −8−0.80.480.96−6.241.923.68
−8 to −5−43.04−0.484.1627.2−7.6819.84
−5 to −3−25.92−0.83.044.48−3.8423.04
−3 to −2−14.7201.283.04−5.7616.16
−2 to −1−6.721.121.766.72−129.12
−1 to 0−2.241.12−2.246.72−9.285.92
0 to 2−3.040−23.6825.92−19.3620.16
2 to 4−1.92−0.96−40.4835.20.87.36
4 to 6−2.24−0.48−21.444.8−0.3219.68
Table 3. Land use changes in various groundwater depth zones from 1984 to 2018.
Water Level Variation AreaLand-Use Types
YearFarmlandHCOMCOLCODOOL
Decline area (−24.2 m)1984 (km2)1843.046.0887.84815.84430.24303.36
2007 (km2)2104.6410.24209.12623.2183.04356.16
Rate (%)14.268.4138.1−23.6−57.517.4
Rise area (+1.0 m)1984 (km2)63.213.7625.2858.439.369.92
2007 (km2)96.87.3634.5652.87.6810.72
Rate (%)53.2−46.536.7−9.6−80.58.1
Decline area (−5.1 m)2008 (km2)1532.813.9280.48449.12144.96246.72
2018 (km2)1442.8815.3689.44485.76108326.56
Rate (%)−5.910.311.18.2−25.532.4
Rise area (+3.1 m)2008 (km2)669.123.68163.2226.8845.76120.16
2018 (km2)661.922.2477.6292.826.88167.36
Rate (%)−1.1−39.1−52.529.1−41.339.3
Table 4. Regression equation parameters for the changes in the groundwater storage volume.
TypeCoefficientsp-Value
β25,094.58220.49830
a−19.02970.03714
b0.52140.00085
c−0.52290.00105
Disclaimer/Publisher’s Note: The statements, opinions and data contained in all publications are solely those of the individual author(s) and contributor(s) and not of MDPI and/or the editor(s). MDPI and/or the editor(s) disclaim responsibility for any injury to people or property resulting from any ideas, methods, instructions or products referred to in the content.

