Article

Occurrence, Potential Risk Assessment, and Source Apportionment of Polychlorinated Biphenyls in Water from Beiluo River

1
Shaanxi Key Laboratory of Earth Surface System and Environmental Carrying Capacity, College of Urban and Environmental Sciences, Northwest University, Xi’an 710127, China
2
State Key Laboratory of Biogeology and Environmental Geology, School of Environmental Studies, China University of Geosciences, Wuhan 430074, China
*
Author to whom correspondence should be addressed.
These authors contributed equally to this work.
Water 2023, 15(3), 459; https://doi.org/10.3390/w15030459
Submission received: 11 November 2022 / Revised: 29 December 2022 / Accepted: 19 January 2023 / Published: 23 January 2023

Abstract

:
Polychlorinated biphenyls (PCBs) are highly hazardous, persistent, and bioaccumulative substances that pose a threat to water quality in a number of locations, including the Beiluo River in Shaanxi Province, China. However, little is known about the contribution of PCBs to the Beiluo River. In this study, in order to look into the impact of sources on the water of the Beiluo River, the discovered PCB congeners in water were examined on a regional scale. The concentration of PCBs in water across Beiluo River was in the range from 0.065 to 1.92 ng L−1, and the average concentration was 0.37 ng L−1. The main PCB sources in the Beiluo River waterbody were found using positive matrix factorization (PMF). Source apportionment results indicated that the PCB pollution of the Beiluo River was mostly caused by industrial emissions, technical PCB mixtures, and coal and wood combustion. According to current ecological risk assessment guidelines, the PCB concentrations found in this study may have a negative impact on biological systems. Overall, the new information about the presence of several PCBs in the water of the Beiluo River justifies the need for urgent management actions, as well as long-term monitoring efforts, to protect ecosystems. Future investigations of these chemicals in China may use the conclusions of this first ecological risk level assessment on the PCB contamination in the waterbody of the Beiluo River as a guide.

1. Introduction

A rise in waste and pollution emissions in the environment has been caused in recent years by the industrialization and rapid development of the human population [1]. The problem of water contamination has long been quite concerning to humanity [2]. Polychlorinated biphenyls (PCBs), a class of pollutants, have drawn the most attention due to the ecological risk, economic effects, and health risks they pose to people [3]. In total, PCBs have 209 commercially generated congeners, which are regarded as hazardous, persistent organic pollutants (POPs) for both humans and animals (PCB congeners are any single, unique well-defined chemical compound in the PCB category) [4,5]. Therefore, they are one of the original 12 POPs specified by the Stockholm Convention (SC) [6,7,8].
PCBs have been produced and utilized in large amounts all around the world since the 1950s [9]. According to estimates, 1.3 million tons of commercial PCBs were produced worldwide [10]. Based on a prior study, electrical waste is a significant source of PCB emissions in some developing nations [11]. In China, about 10,000 tons of PCBs were produced during the period from 1965 to their prohibition in 1974 [12]. As inert substances, PCBs have excellent thermal stability and dielectric characteristics. PCBs have been extensively employed in electrical insulating fluids in capacitors and transformers, as well as in hydraulic, heat transfer, and lubricating fluids in a variety of technological appliances, including industrial operations, heat transfer applications, and plasticizers [13,14]. China used PCB3 and PCB5 largely as paint additives and power capacitors for the production, distribution, and transmission of electricity [15]. Although PCBs were not widely used or produced in China, their effects on the environment cannot be ignored [16]. In addition, the presence of PCB-containing products may lead to the entry of PCBs into our food chain through various routes [17]. Due to their high octanol-to-water partition, low water solubility, and high lipid solubility, PCBs can have a bio-accumulative effect that gets worse with time by moving up the food chain [18].
In a previous study, PCBs were discovered to enter the ecosystem through direct discharge, atmospheric deposition, and runoff from terrestrial sources, as well as bioaccumulating in aquatic biota tissues [9]. PCBs are still present in environmental media, such as the air, soil, water, and sediment, despite restrictions on or bans on their usage [4]. In previous studies, some scholars also proved PCBs have detrimental effects on humans. For example, PCBs can affect fetal growth and infant development [19]. Toxicological studies have shown that PCBs may be associated with human liver diseases and thyroid hormone status, which may cause some negative consequences on human growth and development [20,21]. It can disrupt reproductive function and sociosexual behaviors via changes neuroendocrine mechanisms [22]. According to a study conducted on animals, PCBs can have toxicological effects on animals as well, leading to behavioral and functional abnormalities [23]. PCBs are becoming a major concern due to their toxicological characteristics and ambiguous ecological behavior. Numerous accords, including the Stockholm convention in 2001, were signed in an effort to resolve this problem. However, PCB levels in the environment and their ecotoxicological effects still need attention.
The Beiluo River (34°39′55″ N–37°18′22″ N, 107°33′33″ E–110°10′30″ E), the second tributary of the Yellow River, is 680 km long and covers an area of 2.69 × 10⁴ km2. The Beiluo River is a prominent river in Shaanxi Province, China, which is of fundamental importance for regional agricultural activities and water supply for industrial development (Figure 1) [24,25,26]. The Beiluo River is located on the Loess Plateau, which is one of the most concentrated regions of fossil energy in China, in which the land-use categories were mainly forest, cropland, and grassland [27]. With a population of about 640.86 thousand in four counties in the basin, the area contributed about CNY 24.16 billion GDP and produced 52.53 million tons of coal and 14.90 million tons of oil in 2020 [28]. However, the natural environmental systems of Beiluo have been impacted by a long history of wastewater drainage and a quickly growing petroleum industry [29]. Meanwhile, the Beiluo River was influenced by a significant amount of organic matter and hazardous waste runoff, including oil spills, endangering the region’s economic growth and public health [24]. Despite the importance of the Beiluo River, little research has been conducted on PCB pollution in the past. Particularly, there are little reliable data on PCB concentrations, sources, and ecological risk assessments regarding rivers.
Therefore, in order to stop additional contamination and to protect the priceless living resources provided by the Beiluo River, it is crucial to analyze PCB concentration and contamination levels, as well as their source(s). The purposes of this study were to (1) determine PCBs concentrations in the waterbody of the Beiluo River; (2) identify PCB sources using positive matrix factorization (PMF) factor analysis; and (3) determine the ecological risk levels of PCBs in the Beiluo River.

2. Materials and Methods

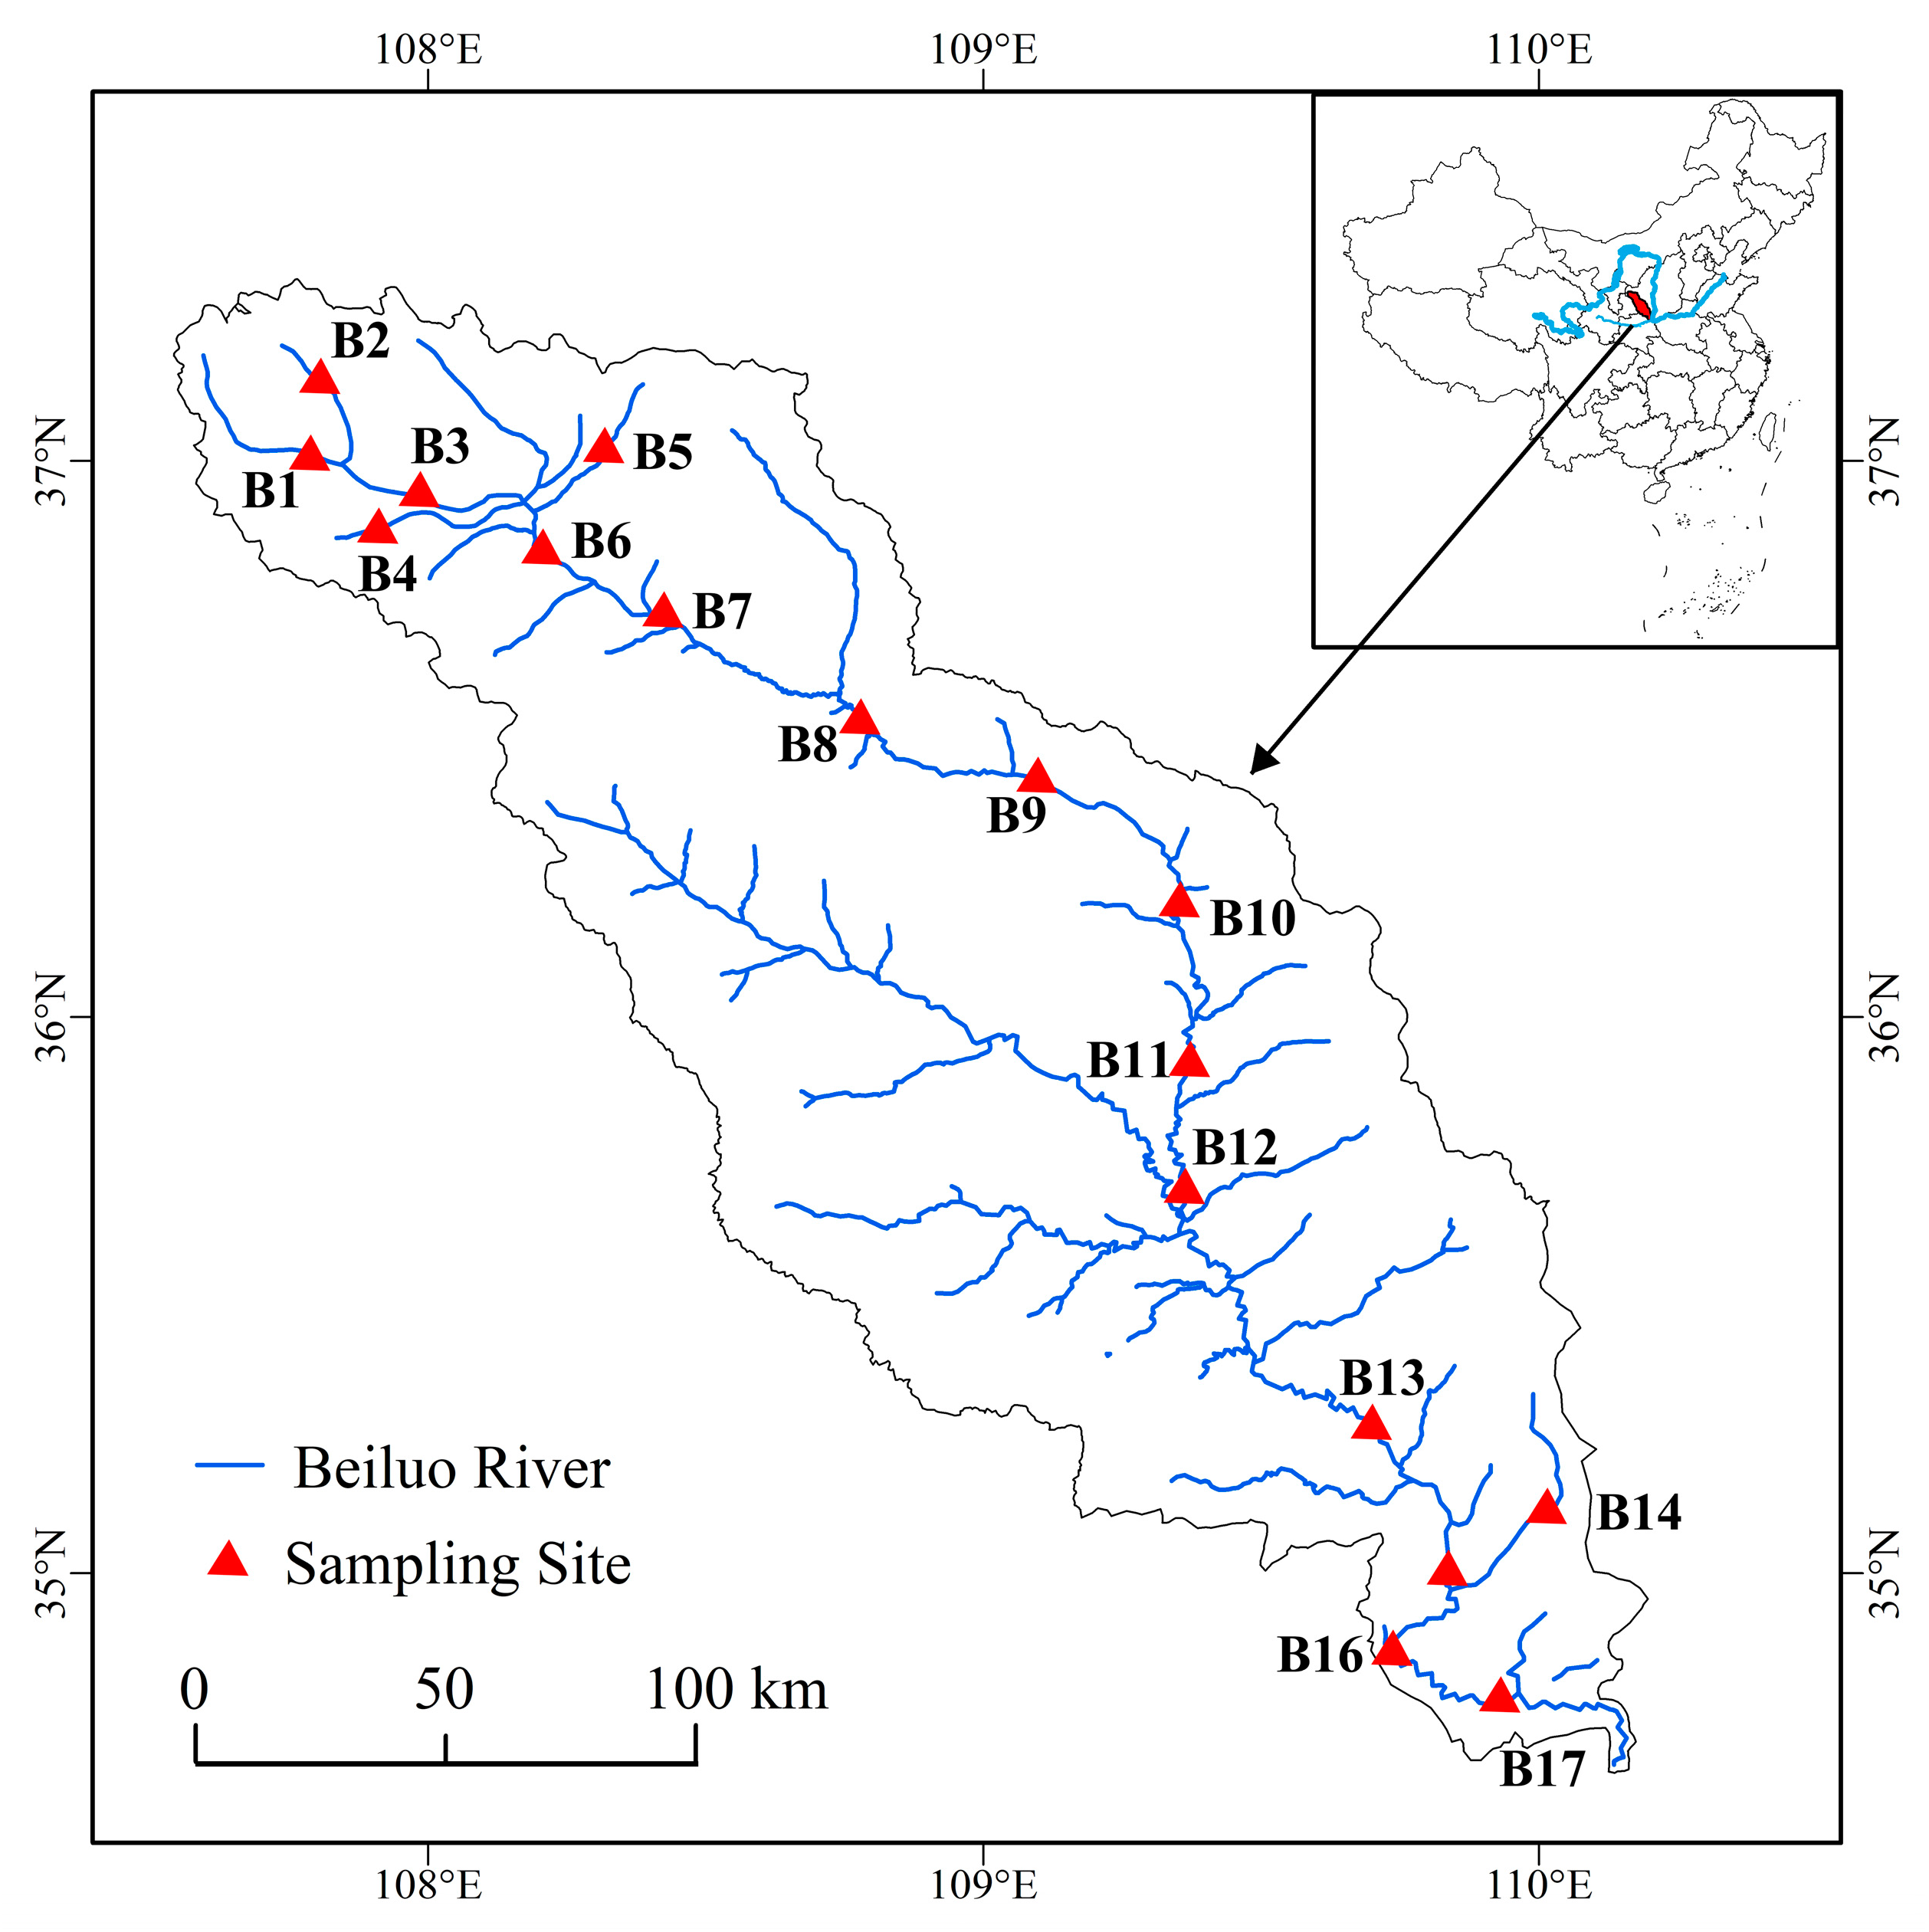
2.1. Study Area and Sampling

We used a water-collector to obtain 17 water samples over 3 days from Beiluo River, covering the Beiluo River Basin and its main tributaries, in June 2021 (wet season) (Figure 1). The sampling sites were set according to factors, such as uniform spatial distribution and traffic accessibility. A glass water collector equipped with a long handle (2–3 m) was used to collect approximately 5 L of water samples at each site, and then we immediately transferred to pretreated brown glass vials and stored at −4 °C until analysis.

2.2. Sample Pre-Treatment and Instrumental Analysis

The water samples were strictly processed using the method described in the Chinese national standard, Water quality-Determination of PCBs-Gas chromatography-mass spectrometry (HJ 715–2014) for PCBs analysis [30]. Briefly, 1 L water samples were spiked with 25 mL CH2Cl2 and 5μL standard PCB solutions (tetrachlorometaxylene, PCB65, or PCB 155). After fully mixing, CH2Cl2 was separated into a flask by separating funnel, then we dried samples in muffle furnace at 450 °C for 4 h. We repeated the pervious steps 3 times. Then, the samples were processed by rotary evaporation to 4 mL at 40 °C and chromatographed by 1:2 Al2O3 and silica gel 3 times. The samples were reconcentrated by rotary evaporation to 1 mL before putting the samples into cell bottles. Finally, we blew samples to 0.2 mL using gentle nitrogen gas [31]. Gas chromatography (GC, Agilent 6890N/5975 MSD, Agilent, Santa Clara, CA, USA) was used, which was equipped with a HP-5MS capillary column (30 m × 0.25 mm × 0.25 μm) and an electron impact (EI) ionization source (GC-MS/MS 7000D). The incoming carrier gas was high-purity helium with a flow rate of 1.2 mL/min. For PCBs, initial oven temperature was 80 °C for 1 min; then we increased to 200 °C at 15 °C/min; increased to 260 °C at 4 °C/min; and increased to 290 °C at 20 °C/min and held for 2 min before the temperature was immediately raised to 320 °C. The injection volume was 1 μL. The transmission line temperature was 280 °C, the electron energy was 70 eV, and the ion source temperature was 230 °C. Finally, the concentration data of PCBs at all sampling sites were obtained.
The method detection limits for different PCB congeners were from 9.25 × 10⁻⁴ to 1.24 × 10⁻¹ ng L−1. All data were corrected for recovery and reported as percentages. By spiking the samples with known working-standard PCB solutions and extracting and analyzing the results in the same manner as the genuine samples, a matrix spike recovery investigation was carried out. Prior to extraction, each sample was spiked with a labeled recovery standard (TCMX, PCB65, or PCB 155) for identification. Tetrachlorometaxylene (TCMX) average surrogate recoveries in all samples ranged from 33.52% to 97.55%, PCB65 average recoveries ranged from 47.24% to 108.79%, and PCB155 average recoveries ranged from 27.91% to 113.59%. All samples had an average sample recovery of 64.40% for TCMX, while for PCB65 it was 89.18%, and for PCB155 it was 84.45%. The recoveries of PCB65, PCB155, and TCMX standards proved the validity of the sample treatment protocol [31].

2.3. Ecological Risk Assessment Methods

Toxic equivalents (TEQs) can be used to evaluate PCB ecological risk. The TEQs of PCBs in the samples were calculated using toxic equivalence factors (WHO-TEFs). The total toxic equivalent is calculated by the following equation, which is the actual concentrations of PCBs in an environmental sample multiplied with the respective TEF [32]:
T E Q = i = 1 n C i × T E F i
where TEQ is the total toxic equivalent (ng L−1) and Ci is the detected amounts of PCBs in the water sample (ng L−1). TEFi is the toxic equivalency factor of certain PCBs, taken from the WHO-revised TEF value in 2005 [33].
PCBs in water samples can also be evaluated for their potential ecological risk using the risk quotient (RQ) approach [34]. This is how the RQ value is calculated:
R Q = M E C P N E C
where MEC is the sample’s actual measured PCB concentration. The predicted no-effect concentration (PNEC) for organisms is computed using the EC50 or LC50 values, and the assessment factor set to 1000 [35,36]. The PNEC value is calculated as follows:
P N E C = E C 50   o r   L C 50 A s s e s s m e n t   F a c t o r
Different levels of risk index are presented as follows: The risk is negligible when RQ is less than 0.01, low when it is between 0.1 and 1, moderate risk when it is between 0.1 and 1, and high risk when it is greater than 1 [36,37]. Toxicity date of PCBs among different trophic levels were obtained from the United States Environmental Protection Agency (USEPA) ECOTOX database (USEPA 2012) to extrapolate the predicted PNEC.

2.4. PCBs Source Apportionment by Positive Matrix Factorization (PMF)

PMF is a sophisticated approach for factor analysis [38]. Source apportionment of PCBs was performed using the positive matrix factorization receptor model (v.5.0) developed by the United States Environmental Protection Agency (US EPA).
The PCBs data were decomposed into a source component spectrum matrix F (k × j), a source contribution matrix G (i × k), and a residual matrix E (i × j) by the PMF model, as shown in the following:
X i j = k 1 p g i k f k j + e i j
where gik is the contribution of the kth source to the sample, fkj is the concentration of the jth species in source k, and Xij is the concentration of the jth species detected in the ith sample. The residual eij is related with the concentration of the jth species measured in the ith sample.
Q is defined as an objective function, which determines the pollution source contribution spectrum g and the pollution source component spectrum f. The Uij is the uncertainty of each observation. The equation is as follows:
Q = i = 1 n j = 1 m ( e i j U i j ) 2
The concentration file and the uncertainty file are the two input files needed for PMF analysis. EPA positive matrix factorization (PMF) 5.0 Fundamentals and User Guide’s methodology was used to calculate the concentration and uncertainty of each contaminant. Accordingly, for the concentration, element concentrations below the method detection limit (MDL) were replaced with “the 1/2 of the MDL”. For the uncertainty, “the 5/6 of the MDL” was used for the values below the MDL, while the values above the MDL were calculated as follows:
U i j = ( E r r o r   F r a c t i o n × C o n c e n t r a t i o n ) 2 + ( 0.5 × M D L ) 2 )
where Uij is the uncertainty of PCBs. The error fraction is 0.05. The Q values, scaled residues, G-Spaceplot, physical meaningfulness, factor contribution, and diagnostics of the acquired factor profiles and contributions were used to determine the best factor numbers [39]. After testing three to nine factors with random seeds by running the simulation 20 times, a three-factor solution was obtained to be the best fit for the input data set based on the Q values and error evaluation [6].

2.5. Statistical Analyses

∑PCBs were defined as the sum of 28 PCB congeners, while Pi-PCBs (indicator PCBs) were defined as the sum of PCB28, PCB52, PCB101, PCB118, PCB153, PCB138, and PCB180. According to their structure, chemical makeup, and physiological consequences, PCBs can be divided into two groups: dioxin-like and non-dioxin-like. Dioxin-like PCBs (DL-PCBs) are a class of very harmful byproducts of some industrial processes that resemble the prototype dioxin.
Microsoft Excel (Microsoft Inc., Redmond, WA, USA) was used for all statistical analyses. Positive matrix factorization receptor model was applied using EPA PMF 5.0 to identify the possible sources of PCBs. PCB concentrations below the MDL were replaced with half of the method detection limits during data analysis. Using the Arcgis 10.2 program (ESRI Inc., Redlands, CA, USA), the spatial distributions of the sampling sites were mapped. Column charts were performed with OriginPro 2021 software (OriginLab Corporation, Northampton, MA, USA).

3. Results and Discussion

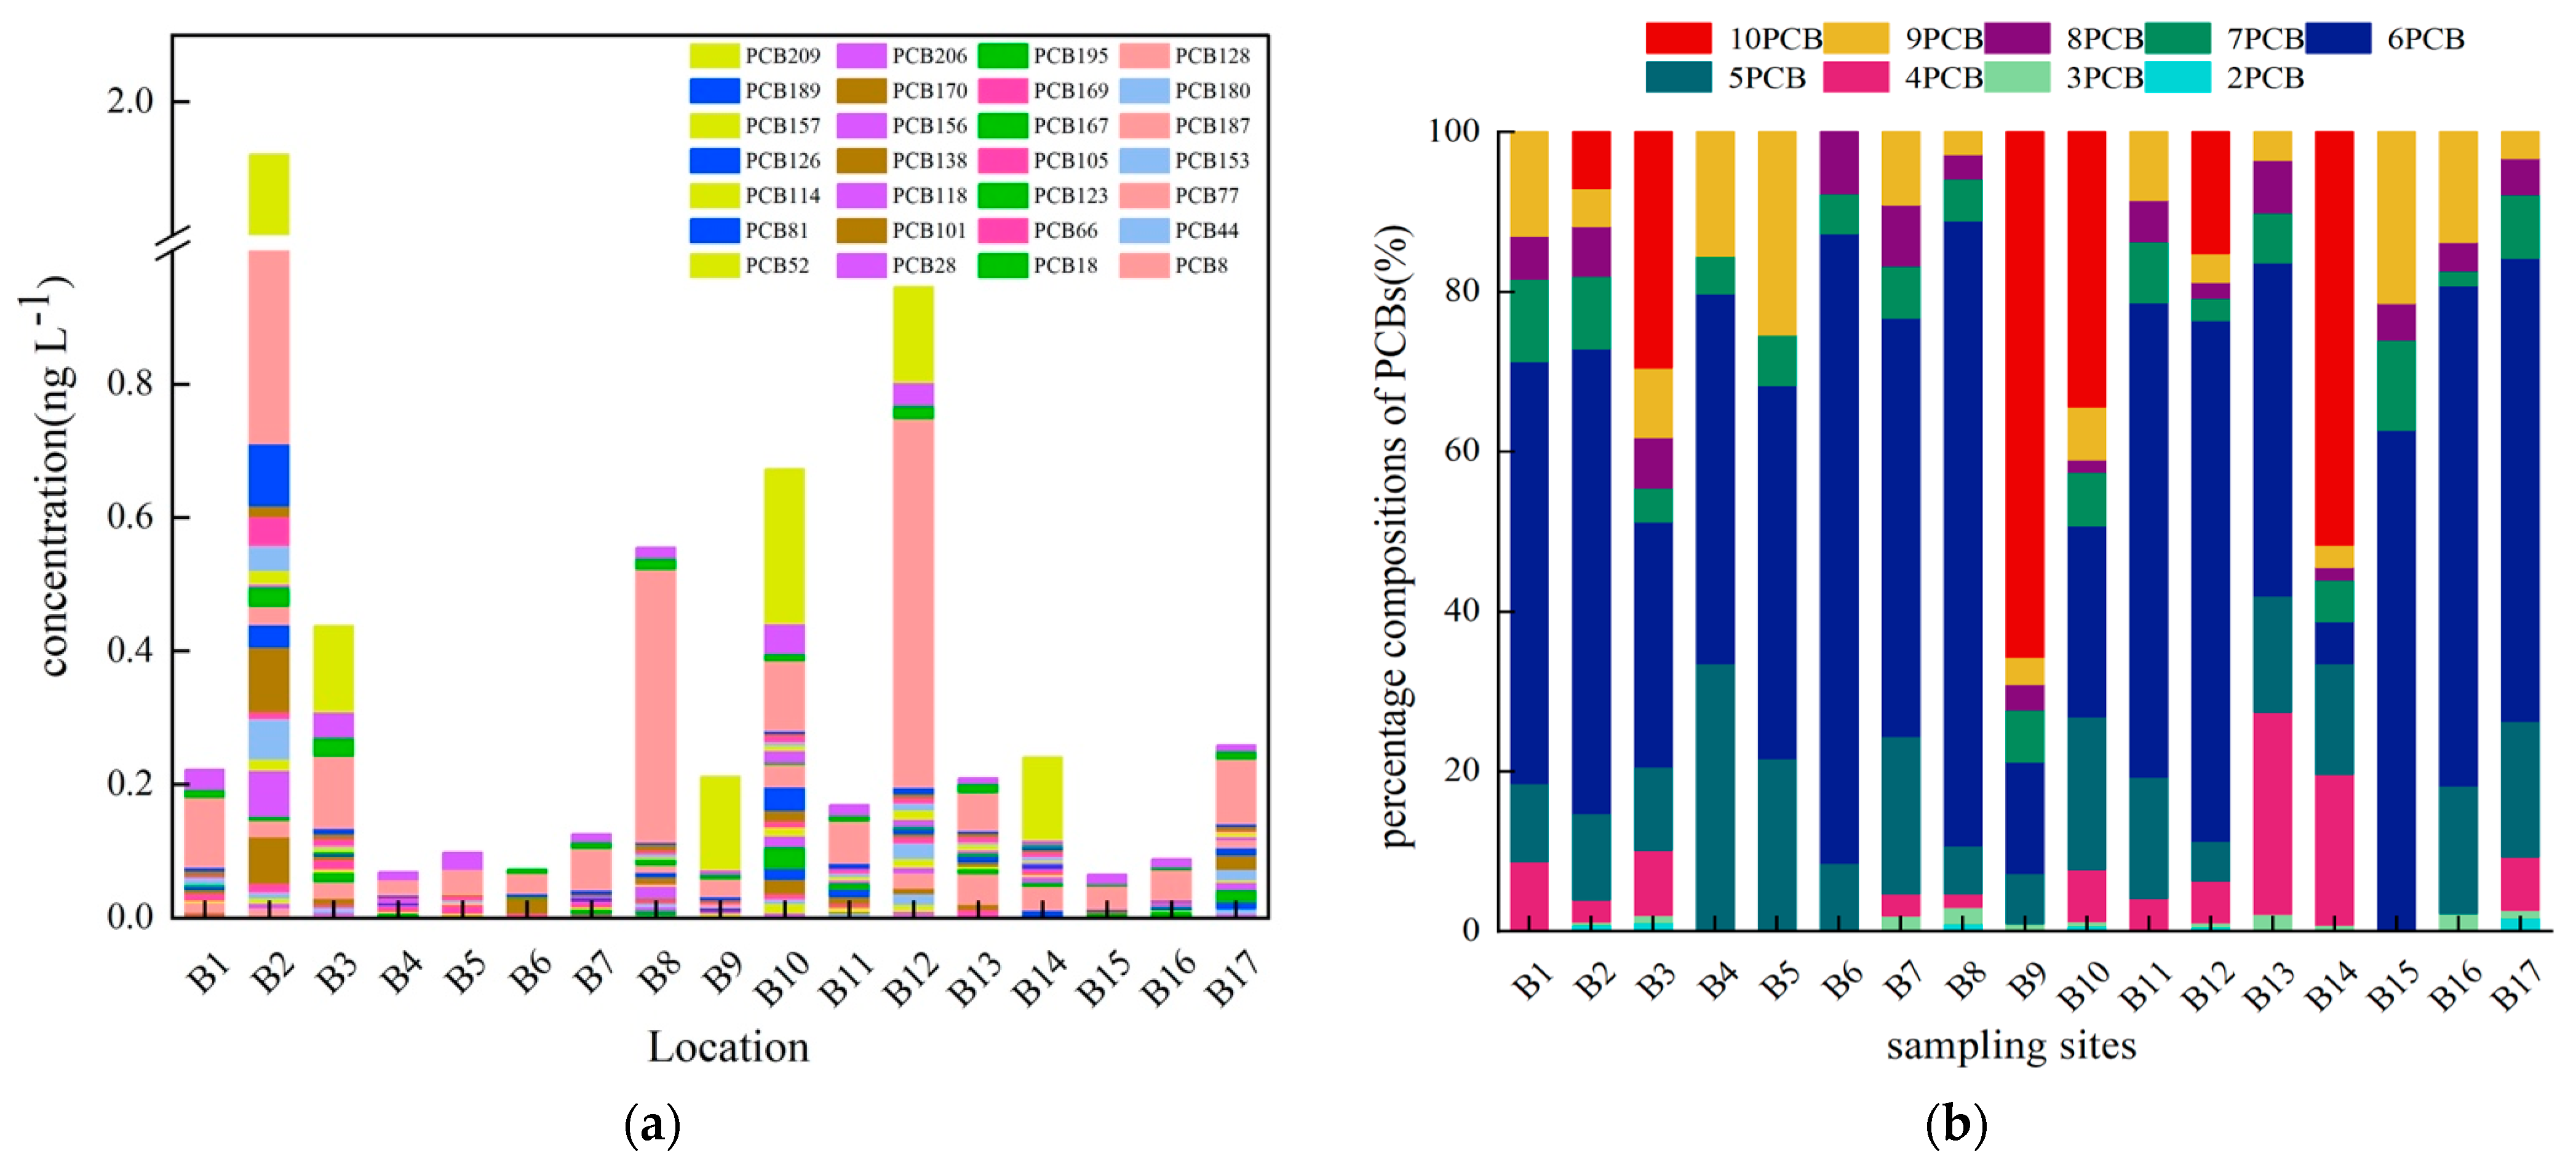
3.1. PCB Concentrations and Congener Profiles

PCB concentrations in water showed huge differences at each sampling site (Figure 2a). More detailed descriptive statistics data of each PCB concentration are listed in Table S2. With a mean of 0.37 ng L−1, the total PCBs concentration ranged from 0.065 to 1.92 ng L−1. In all sampling locations, PCB-128 was the PCB with the highest concentration, followed by PCB-209 and PCB-206. They were found to contribute 5.8% (PCB-209), 14.2% (PCB-128), and 41.3% (PCB-128) of the total PCB concentrations (PCB-206). Throughout the study period, there was a wide range of variation in the measured PCB concentrations. The highest concentration of PCBs appeared at B2 (1.92 ng L−1), followed by B12 (0.95 ng L−1), and B10 (0.67 ng L−1). For individual PCB compounds, detection frequencies were 94.12%, 94.12%, 94.12%, 94.12%, 88.24%, 88.24%, and 99% for PCB114, PCB128, PCB189, PCB206, PCB169, and PCB195, respectively.
Previously, the water samples of 10 tributaries of the Yellow River Basin were collected in September 2018 by Chen et al. [40], and the mean concentration of PCBs was 0.26 ng L−1 in the Wei River. Compared with the results measured by Chen et al., higher PCBs concentrations (1.4 times higher than their results) were detected in this study, probably as the water samples in this study were taken very close to specific sources, for example, industrial areas, such as steel plants, petrochemical plants, etc. Therefore, it can be speculated that the PCB contamination of water to a relative high degree exists in the Beiluo River. The data on PCB concentrations in different regions are shown in Table 1. In other studies, the areas close to industrial locations usually produced higher PCB concentration levels [41,42,43]. Other highly polluted regions, such as the Persian Gulf (0.97–3.10 ng L−1) [44], Houston Ship Channel of Texas (0.49–12.49 ng L−1) [41], and Hangzhou Bay and East China Sea (0.4–51.75 ng L−1) [36], also showed similar results. In contrast, the concentration was only 0.0093 ng L−1 in Nanjiabawa Peak in Tibet, where there are no industrial emissions [12]. According to USEPA guidelines, surface water must have a PCB concentration of less than 14 ng L−1 in order to be deemed safe for aquatic life (USEPA, 2002) [12]. Although the PCBs in the Beiluo River have not exceeded the recommended value of the USEPA, the Beiluo River is very close to oil exploitation sites and related industrial areas; therefore, further investigations into PCBs and their environmental risks are required.
PCBs were also evaluated based on their homolog groups (Figure 2b). The homolog groups of each PCB are listed in Table S3. The seven standard individual congeners (PCB 28, 52, 101, 138, 153, and 180) selected by EPA to reflect a broad spectrum of chlorination are also included. It was evident that PCB patterns were mostly dominated by high chlorinated (>5 Cl) PCBs such, as 6-CBs (51.2%), 10-PCBs (14.2%), and 7-PCBs (6.6%), while less chlorinated (<5 Cl) PCBs were less prominent, such as 5-PCBs (11.3%), 4-PCBs (5.3%), and 3-PCBs (0.75%). The possible reason is that low-chlorine PCBs are easily degraded by OH radicals in the environment, and the rate of degradation of PCBs reduces as the content of chlorine in the environment increases [16].

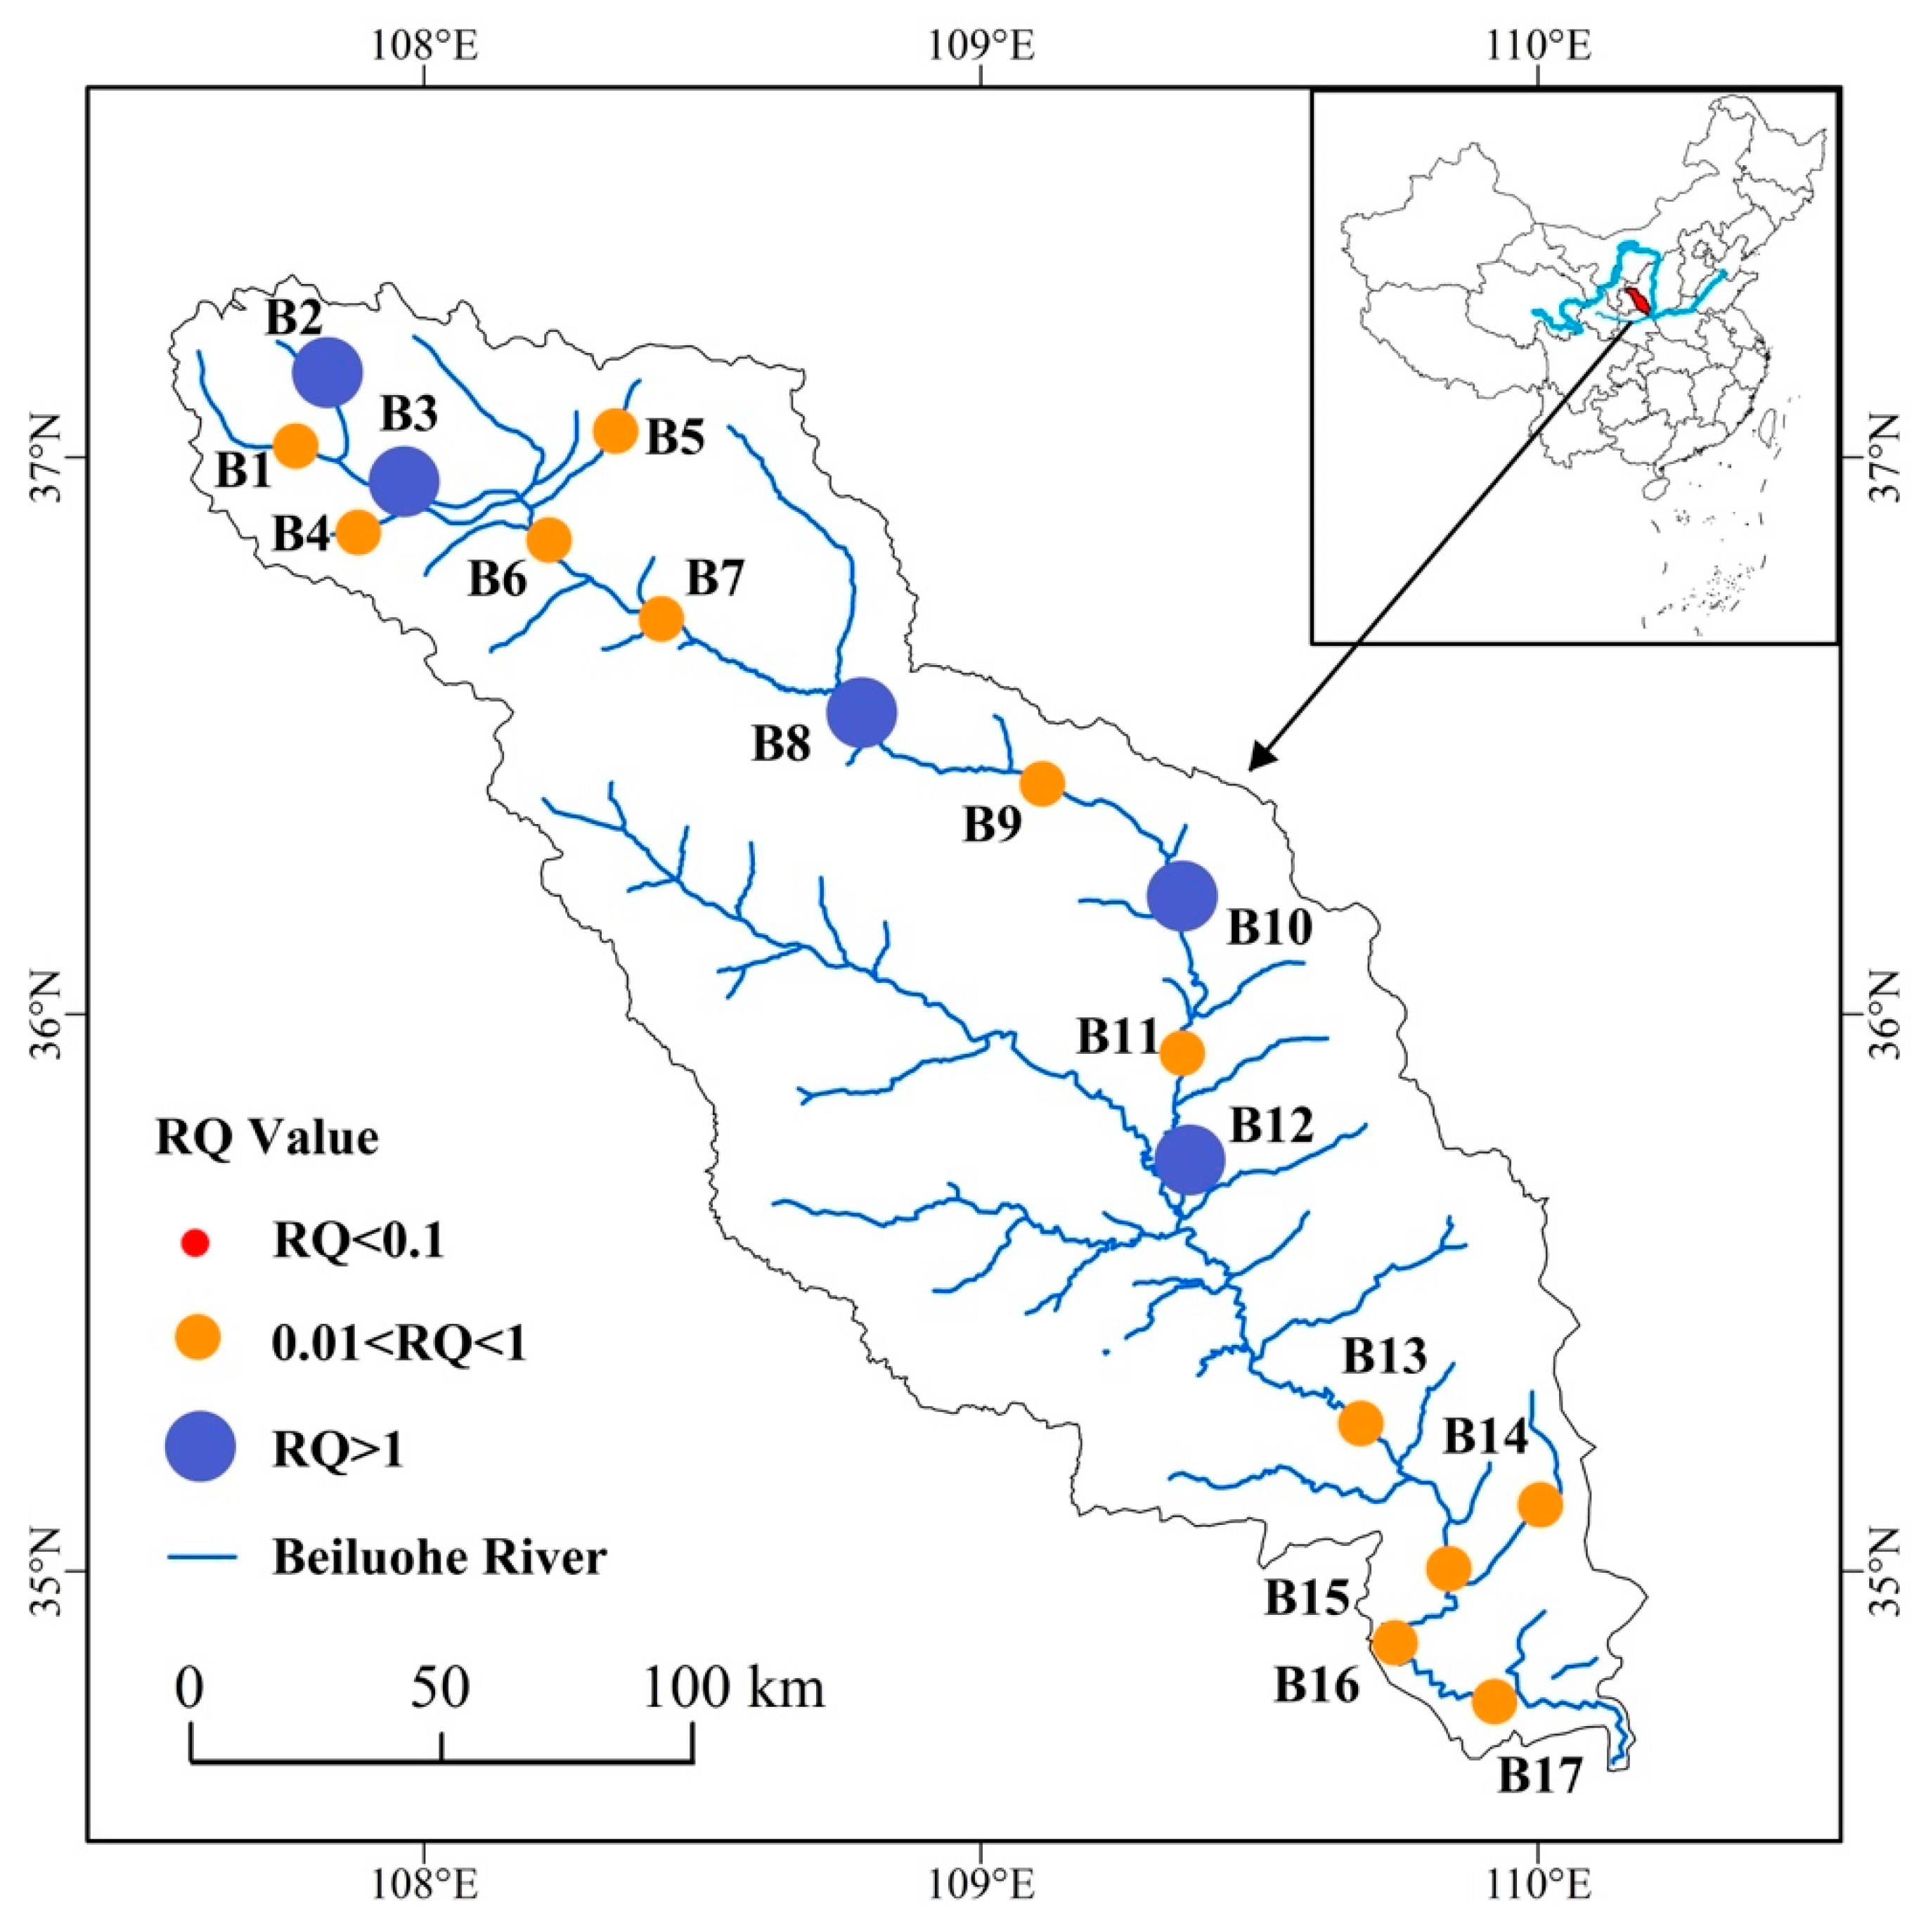
3.2. Ecological Risk Assessment

PCBs in the waterbody can have an impact on ecosystems, human health, and water quality [52]. Thus, it is crucial to assess the possible ecological impact of PCBs in this region because of their toxicity and bioaccumulation properties, as well as the broad ecological value of the Beiluo River Basin [53]. Since China has not yet set environmental quality guidelines for PCBs, we contrast our results with those suggested by other countries and/or international organizations.
The potential ecological risks of PCBs in the Beiluo River were assessed using the two ecological risk assessment indices, TEQ and RQ [33]. As shown in Table 2, the main driver of TEQ is PCB126, which is the most toxic (14.48 × 10⁻³). The least risky PCBs were PCB 156 (17.07 × 10⁻⁷) and PCB 167(20.43 × 10⁻⁷). In the present study, the sum of WHO2005-TEQs for the 12 DL-PCBs in water varied from 17.07 × 10⁻⁴ to 14.48 pg-TEQ/L, with an average level of 1.5 pg-TEQ/L. A total of 83% of the WHO2005-TEQs in all sampling sites was higher than the recommended environmental quality standard of 1 pg-TEQ/L by Japan Government (Government of Japan, 2012) [54,55]. Furthermore, the ∑TEQ of water samples from all sampling sites did not exceed the maximum contaminant level of 30 pg-TEQ/L set by the United States Environmental Protection Agency (USEPA, 2001) [55], and the total concentrations standards of PCBs in all sampling sites did not exceed the maximum contaminant level of 8 ng L−1 set by the environmental quality standards for water in China [15]. At present, the concentration of DL-PCB does not pose a threat to the water quality of the Beiluo River and the aquatic organisms in it. Therefore, a more comprehensive ecological risk assessment of PCBs is required.
The RQ provides another method to evaluate the ecological risk posed by PCBs to the environment. Figure 3 shows the RQ of PCBs in different sampling sites for the levels. Most of the PCBs in the water samples were low. The PNECs values corresponding to the concentrations of individual PCBs are presented in Table S4. In all sampling sites, the RQs of ∑PCBs ranged from 0.11–4.16 ng L−1, with high pollution only at B2, B3, B8, B10, and B12, and moderate risk at other sampling sites. The RQs associated with exposure to individual PCBs were also calculated. The RQ values derived from the data revealed the ecological risk level in all sampling sites. According to the ecological risk classification about the risk quotient in all sampling sites, PCB18, PCB28, PCB44, PCB52, PCB66, PCB81, PCB101, PCB105, PCB114, PCB123, PCB156, PCB157, and PCB169 showed an RQ < 0.01 at all monitored sites, which showed negligible risk. Other PCBs existed moderate and high risk in different sites. In particular, only PCB128 has high risk in the B2 site. This result is consistent with a study on PCBs in Hangzhou Bay, China, indicating that only PCB 153 has high risk [35]. However, another study on the Yangtze River watershed found that 13 PCBs induced a medium or high environmental risk potential, especially in Badong, Shanghai, and Nanjing [56]. The variation in pollution in different regions can be huge. Nevertheless, because of the high chronic toxic value of PCBs, it is worth paying attention to PCBs concentration and the associated environmental risks [57].
The environmental toxicity data and assessment factor (AF) are used to calculate the PNEC [56]. Each of the 28 PCBs has the capability of causing toxic effects to aquatic creatures, including fish, crustaceans, and algae, with E(L)C50 values ranging from 1 × 10⁻⁴ mg/L to 0.25 mg/L. PCB206 was the least harmful PCB for aquatic creatures, while PCB8 was the most toxic. Algae in particular are the taxa that are most vulnerable to micropollutants, and their EC50 were 0.05–0.6 mg/L for different PCB [58,59]. Algae are a major source of food for aquatic organisms, contributing significantly to the aquatic food chain or food, and are a healthy addition to the natural diet of humans [60]. They also work to remove contaminants and nutrients from water. Destruction of the growth and reproduction of algae is a huge loss to nature and human society. In addition to harming algae, PCBs can also cause negative effects to human health. A genotoxicity analysis revealed that chlorination increased DNA damage in human Caco-2 cells [59]. Therefore, the chlorine on the benzene ring of PCBs may be the reason for their increased toxicity. PCB poisoning is a terrifying threat to both human and environmental health.
In general, we need to pay attention to the ecological risks caused by PCBs in the water of the Beiluo River. Although it does not directly provide drinking water, Beiluo River water has an indirect influence on human health, social stability, and safety. Thus, it is necessary to control PCBs pollution in the Beiluo River.

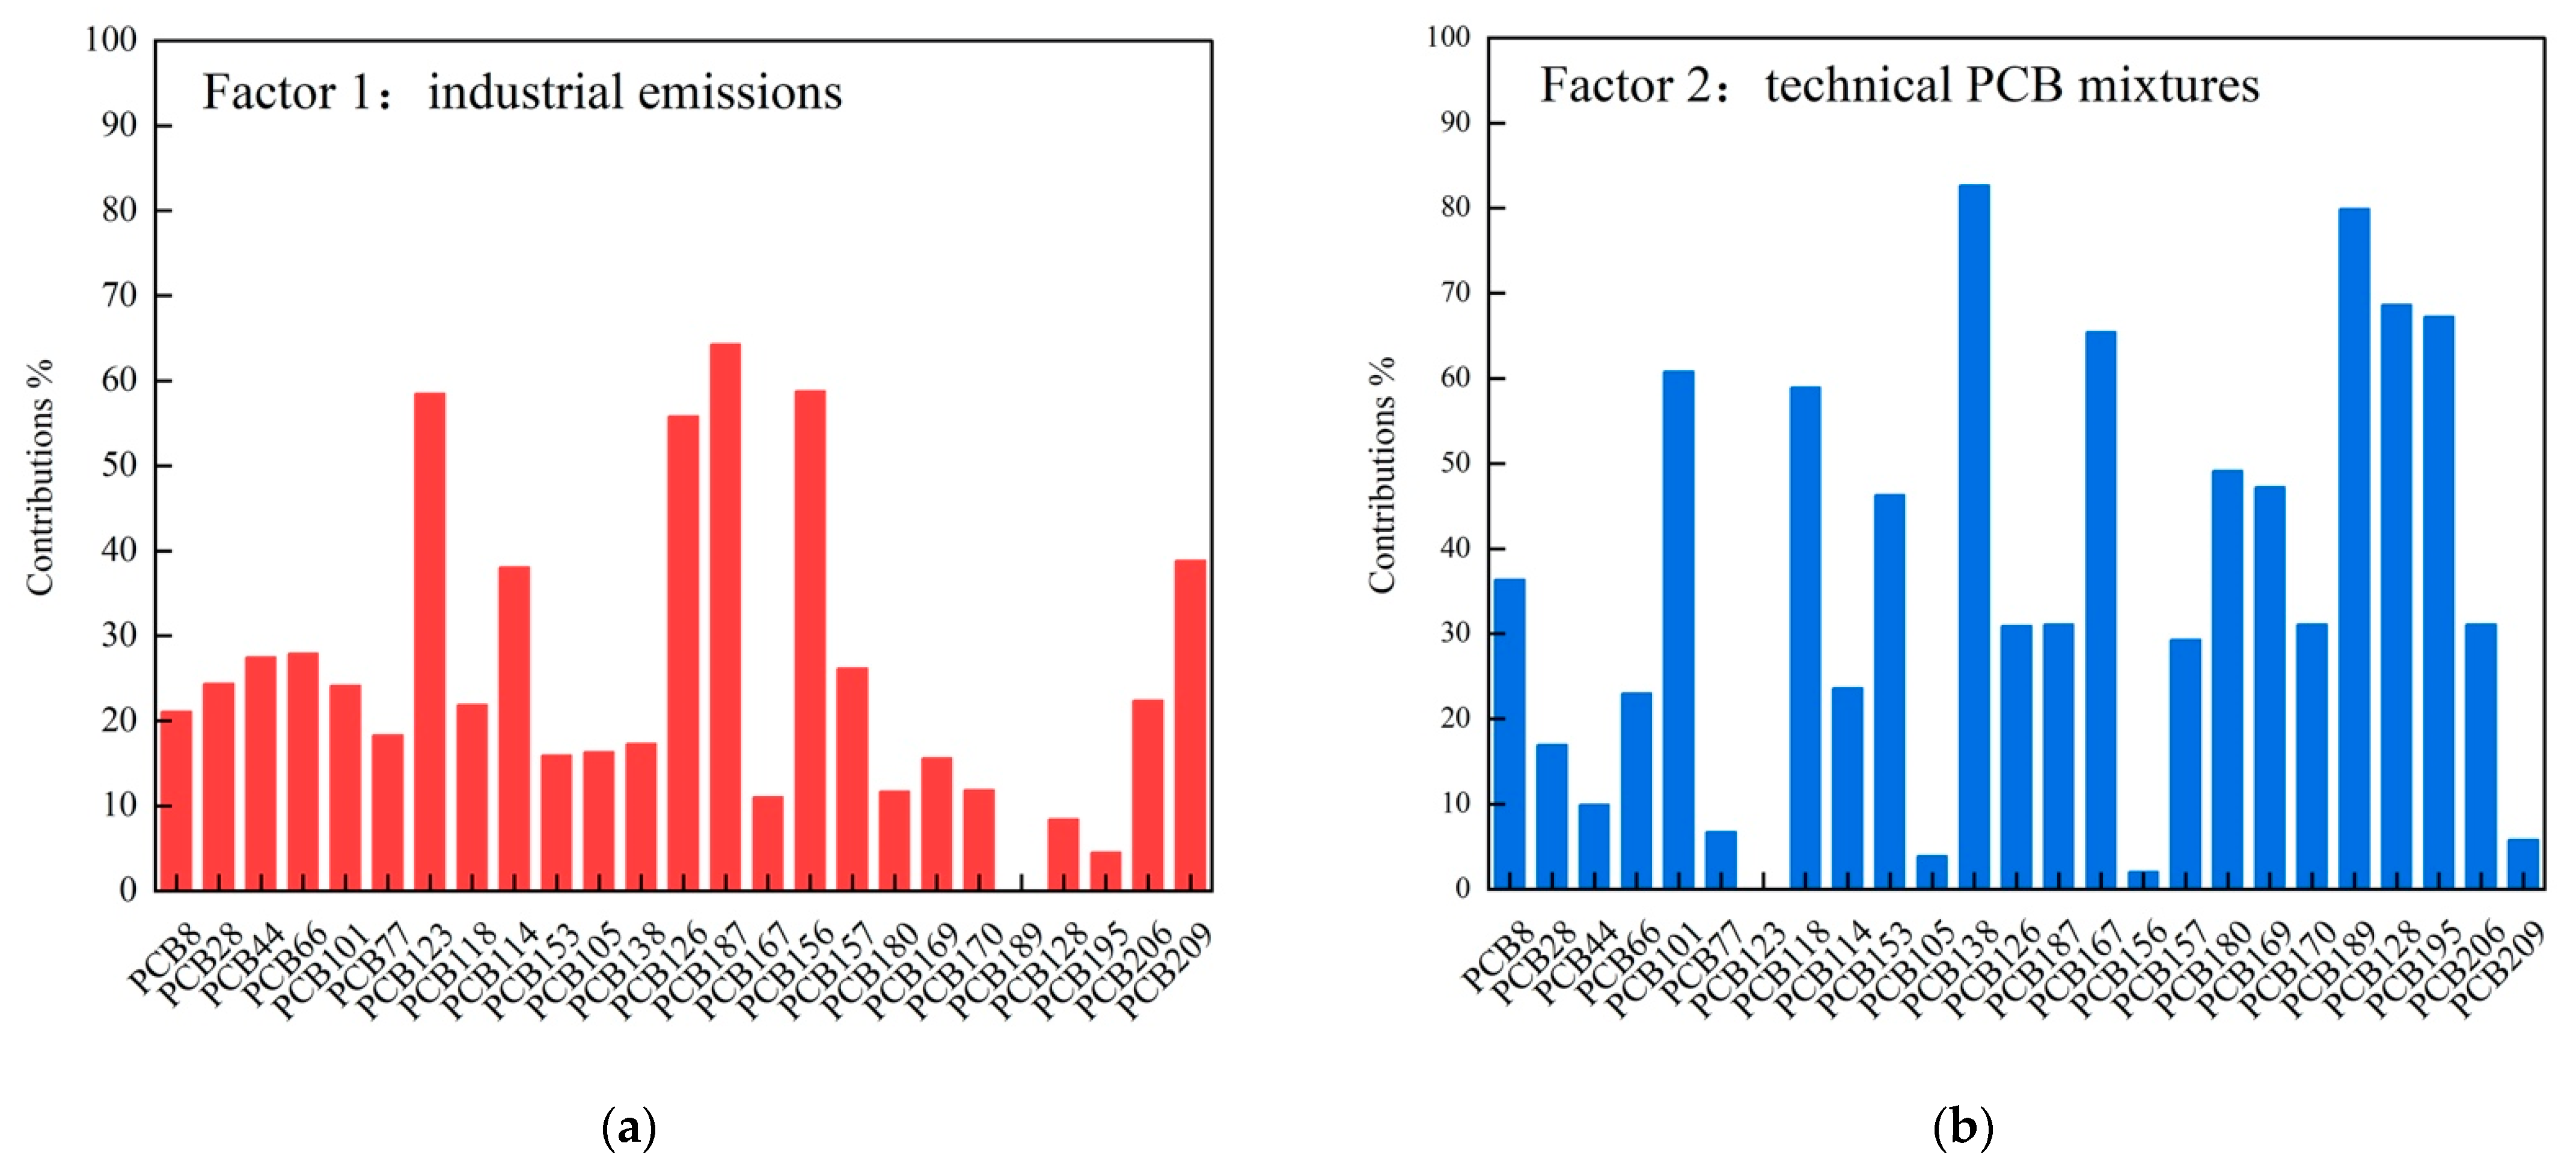
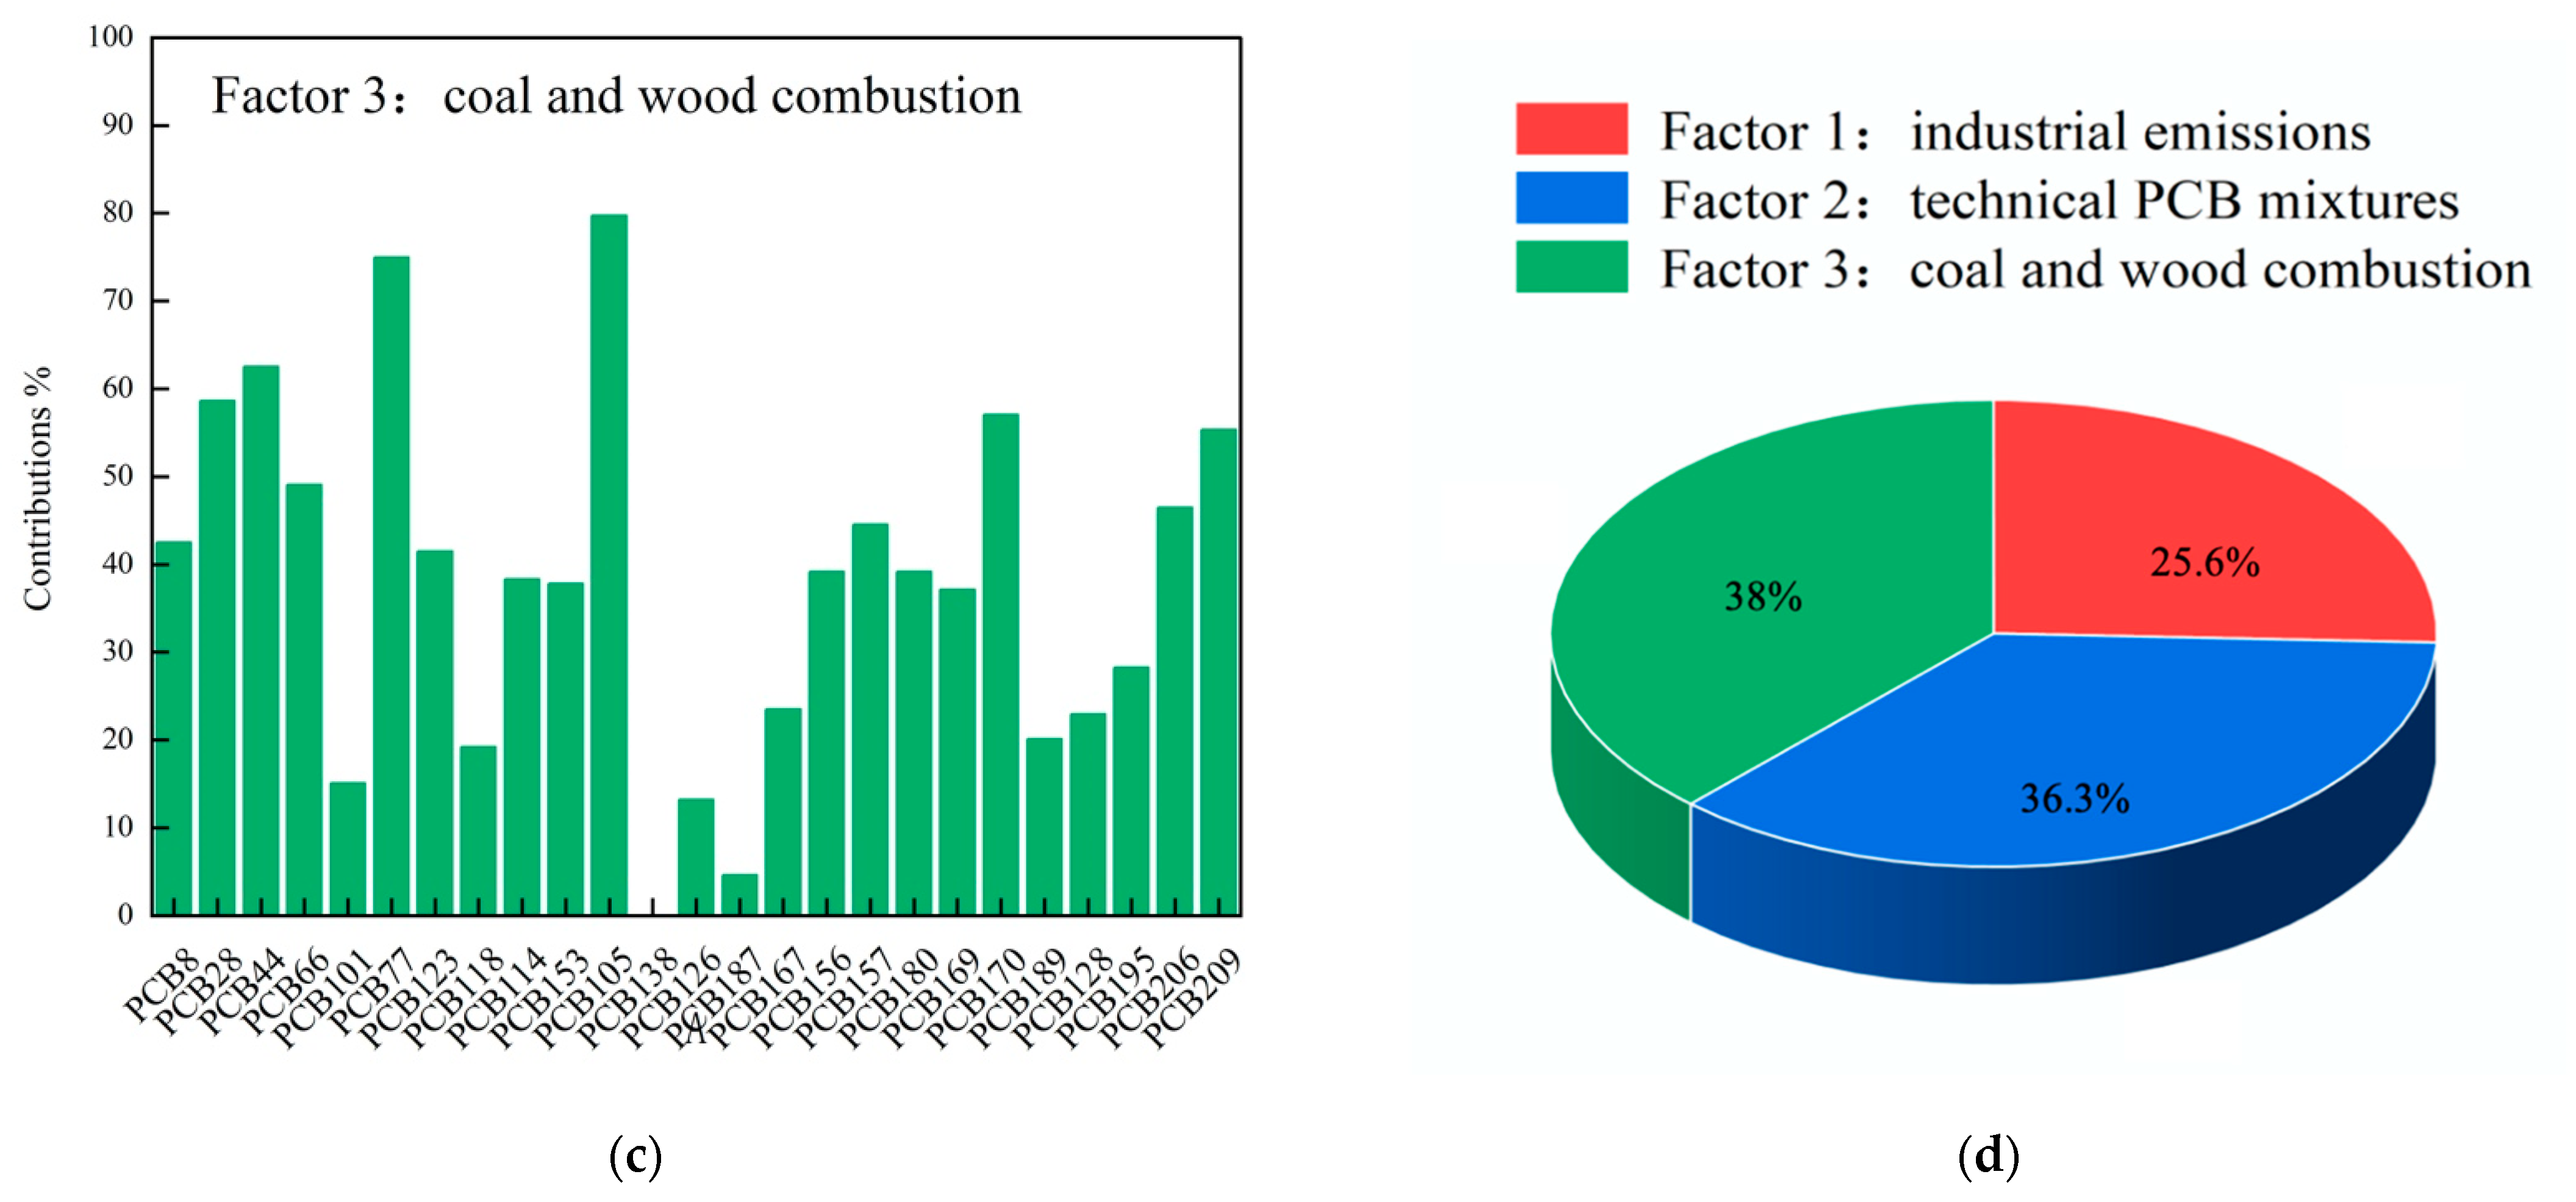
3.3. Source Apportionment of PCBs by Positive Matrix Factorization (PMF)

Using a similar method to Yuan et al. (2021) [61], 3 factors were chosen in this study using the PMF model by exploring factor numbers from 2 to 18 for the best and most applicable solutions, with a random start and a running number of 20. Three different factors found by PMF analysis are shown in Figure 4. The first factor explains 25.63% of the total PCBs, and PCB187, PCB156, PCB123, PCB126, PCB209, and PCB114 were mainly loaded on this factor. PCB209 are non-Aroclor congeners that are prevalent in phthalocyanine-type pigments and can be used to identify the use or discharge of a pigment [62]. PCB123, PCB126, and PCB114 are mainly used as a paint additive [63]. Moreover, PCB-206, PCB-208, and PCB-209 are produced during the manufacturing of titanium dioxide and titanium tetrachloride [39]. As a result, Factor 1 was determined to be associated with industrial activity in the area, representing emissions from the pigment/paint industries and/or wastewater effluents containing paints.
Since the establishment of the national government, the Northern Shaanxi Energy and Chemical Industry Base has formed an industrial system based on coal, oil, natural gas, rock, and salt mining, with electric power, chemical, building materials, and other industries as the leading industries, constructing the main engine of economic and social development [64]. In northern Shaanxi, due to these industrial activities, the Beiluo River has received significant amounts of toxic waste runoff and oil spills [24]. The upper and middle portions of the river are home to numerous huge refineries and companies, making it an important location for the exploitation of the oil–gas potential in northwest China [27]. In northern Shaanxi, coal mining started in the 1980s and significantly increased in the late 1990s [65]. The study area contributed GDP and produced a lot of coal and oil. Meanwhile, resource exploitation has brought a series of problems, including river pollution, farmland pollution, soil pollution, etc.
The second factor was heavily loaded with PCB138, PCB189, PCB128, PCB195, PCB167, PCB101, and PCB118, which explained 36.33% of the total PCBs in the water sample. Highly chlorinated biphenyls displayed high factor loadings on typical Aroclor congeners and were heavily loaded on the second factor (53.25% of the variance). These congeners, including Aroclor 1254, Arochlor 1260, and Kanechlor 600, are all major components of technical PCBs mixtures [13,66]. These technical PCBs mixtures are usually used in industrial equipment. Technical PCBs mixtures mainly contain many highly chlorinated PCBs, a result consistent with PCBs emission inventories in China, indicating that technical PCBs mixtures mainly come from intentional sources, especially those with a high chlorine content [67,68]. Therefore, this factor could be attributed to technical PCBs mixtures discharged from manufacturing.
The third factor explains 38.05% of the total PCB and was highly loaded with PCB105, PCB77, PCB44, PCB28, PCB170, and PCB209. According to Lee et al., the main pollutants released during the burning of coal and hardwoods include PCB-49, PCB-52, PCB-28, PCB-44, PCB-101, PCB-110, and PCB-118 [69]. Kim et al. also discovered that PCB77, PCB128, PCB170, PCB189, and PCB206 are combustion marker congeners [70]. Therefore, coal (industrial applications and residential heating) and wood combustion (residential heating) were regarded as the main contributors for this factor. It is reported that both wood and coal combustion contribute significantly to the spread of PCBs. Wood emissions come from household heating, the burning of agricultural crop leftovers, and forest fires, while coal emissions come from industrial and residential sources [71]. Sun et al. [72] and Zhang et al. [27] verified that coal and biomass combustion were vital PAHs contributors in the Beiluo River Basin. The above content provides certain credibility for our source analysis of the PCBs of the Beiluo River in this study.
The source compositions of PCBs in the Beiluo River of China were compared with other regions. The source analysis of PCBs in the Beiluo River was similar to those of the Bay of Bengal coast of Bangladesh and an urban lake in Shanghai [55,73], in which the sources of PCBs were mainly due to the use of commercial PCBs, such as transformers, capacitors, and producing pigments. Additionally, the combustion process also contributed to the discharge of PCBs in these areas, whereas the source compositions of PCBs in this study were somewhat different from the seawater of the Arctic fjords [45], Jinzhou Bay in China [74], and the Chao River in China [75]. In the areas far from industrial zones, the sources of PCBs are usually considered as a deposition from the atmosphere. As for the areas near to human activity and production, the sources of PCBs depend on the local industrial characteristics. Thus, industrial features and distribution in various regions are regarded as the main reasons for the region-specific sources of PCBs.

3.4. Implications for Control Measures

Particularly for big countries, such as China, with distinct geographic disparities and degrees of economic development, the environmental response to regulatory efforts to reduce persistent chemicals can be highly sluggish, substance-specific, and regionally variable [68]. An efficient control strategy should be created and put into place as soon as possible for this reason. This study’s findings imply that PCBs have been found at the majority of sampling sites. Despite the low concentration values of PCBs, stronger preventative and control methods are needed to further limit the environmental risks that they pose. According to the PMF’s findings, policies and regulations can be put in place to effectively mitigate the effects of controllable pollution sources. Despite the development of emission abatement measures, more effort is required to regulate the PCBs from industrial activities, necessitating on-site monitoring. Establishing efficient ways to lessen the toxic contribution of PCB sources and improve the sustainability of the terrestrial ecosystem in the study region will be made possible by the current research.
In general, it is important to constantly check on the contamination of the Beiluo River and to promptly evaluate any potential ecological problems.

4. Conclusions

PCBs in the basin of the Beiluo River were analyzed for their characteristics, sources, and ecological and health risks. We examined the characteristics and origins of the PCBs using measured data from the Beiluo River Basin and historical data from other areas. The toxic equivalent (TEQ) and risk quotient values were used to evaluate the ecological risk of PCBs in the Beiluo River watershed (RQ). The following are the study’s findings:
  • We found 28 different PCB types, with concentrations ranging from 0.065 to 1.92 ng L−1, in the analyzed items. Furthermore, the average was 0.37 ng L−1. The pollution was on a moderate level when compared with other comparable lakes, bays, or water samples. PCBs were primarily high chlorinated (>5 Cl) at all sampling sites, accounting for 82.03% of the total. Only 17.97% of PCBs are less chlorinated (5 Cl), which is a rather small fraction;
  • According to an assessment of ecosystem risk, PCB128, PCB206, and PCB209 in the Beiluo River Basin generally showed middle-level ecosystem risk, while PCB77, PCB126, PCB189, and PCB195 only showed moderate pollution risk at specific sampling sites, and PCB18, PCB28, PCB44, PCB52, PCB66, PCB81, PCB101, PCB105, PCB114, PCB123, PCB156, and PCB157 showed no ecosystem risk at any site. At sampling point B2, only PCB128 is high risk. Therefore, it is important to constantly analyze the pollution levels in the Beiluo River in order to determine the ecological risk;
  • The PMF model’s source apportionment of PCBs indicates that combustion-related sources, commercial PCB mixtures, and industrial emissions were the main sources of PCBs in the Beiluo River, contributing 25.63%, 36.33%, and 38.05% of total PCBs, respectively.
These findings would be helpful in guiding decision makers as they create and put into practice emission-reduction strategies for PCB emissions and enhancing the water quality in the Beiluo River, China. Only the content, distribution, and sources of PCBs were taken into account and examined in this study. Since PCB levels were only evaluated during the summer, more year-round research with larger sample numbers is required to completely comprehend PCB levels and the area’s ecological risk assessment. Future research should explore the PCBs distribution in different land-use types and seasons. In addition, the possible toxic effects of PCBs to aquatic creatures, such as fish, algae, and plankton, are an important issue.

Supplementary Materials

The following supporting information can be downloaded at: https://www.mdpi.com/article/10.3390/w15030459/s1, Table S1: Error estimation summary results in PMF model; Table S2: Statistical summary of the measured PCBs during the study (ng L−1); Table S3: The homolog groups of detected PCBs; Table S4: The PNECs values corresponding to the concentrations of individual PCBs (ng L−1).

Author Contributions

Conceptualization: J.G. and Y.T.; methodology: Q.W. and S.Y.; formal analysis: Q.W.; investigation: C.C. and C.Q.; writing—original draft preparation: Q.W. and S.Y.; writing—review and editing: All authors; supervision: J.G. and J.S.; funding acquisition: J.G. and Y.T. All authors have read and agreed to the published version of the manuscript.

Funding

This work was supported by the International Science and Technology Cooperation Project of Shaanxi Province [No. 2023-GHZD-30], National Natural Science Foundation of China [No. 42201109], Shaanxi Thousand Talent Program for Young Outstanding Scientists [No. 334041900007] and College Students’ Innovation and Entrepreneurship Training Program [No. 202210697139].

Institutional Review Board Statement

Not applicable.

Informed Consent Statement

Not applicable.

Data Availability Statement

Not applicable.

Conflicts of Interest

The authors declare no conflict of interest.

References

  1. Mitra, S.; Corsolini, S.; Pozo, K.; Audy, O.; Sarkar, S.K.; Biswas, J.K. Characterization, source identification and risk associated with polyaromatic and chlorinated organic contaminants (PAHs, PCBs, PCBzs and OCPs) in the surface sediments of Hooghly estuary, India. Chemosphere 2019, 221, 154–165. [Google Scholar] [CrossRef] [PubMed]
  2. Wang, Q.; Yang, Z.M. Industrial water pollution, water environment treatment, and health risks in China. Environ. Pollut. 2016, 218, 358–365. [Google Scholar] [CrossRef] [PubMed]
  3. Cui, M.K.; Xu, S.L.; Song, W.Q.; Ye, H.B.; Huang, J.L.; Liu, B.H.; Dong, B.; Xu, Z.X. Trace metals, polycyclic aromatic hydrocarbons and polychlorinated biphenyls in the surface sediments from Sanya River, China: Distribution, sources and ecological risk. Environ. Pollut. 2022, 294, 118614. [Google Scholar] [CrossRef] [PubMed]
  4. Wang, W.; Bai, J.H.; Zhang, G.L.; Jia, J.; Wang, X.; Liu, X.H.; Cui, B.S. Occurrence, sources and ecotoxicological risks of polychlorinated biphenyls (PCBs) in sediment cores from urban, rural and reclamation-affected rivers of the Pearl River Delta, China. Chemosphere 2019, 218, 359–367. [Google Scholar] [CrossRef]
  5. Jepson, P.D.; Deaville, R.; Barber, J.L.; Aguilar, A.; Borrell, A.; Murphy, S.; Barry, J.; Brownlow, A.; Barnett, J.; Berrow, S.; et al. PCB pollution continues to impact populations of orcas and other dolphins in European waters. Sci. Rep. 2016, 6, 18573. [Google Scholar] [CrossRef] [Green Version]
  6. Mao, S.D.; Liu, S.R.; Zhou, Y.T.; An, Q.; Zhou, X.J.; Mao, Z.Y.; Wu, Y.T.; Liu, W.P. The occurrence and sources of polychlorinated biphenyls (PCBs) in agricultural soils across China with an emphasis on unintentionally produced PCBs. Environ. Pollut. 2021, 271, 116171. [Google Scholar] [CrossRef]
  7. Qu, C.; Albanese, S.; Lima, A.; Hope, D.; Pond, P.; Fortelli, A.; Romano, N.; Cerino, P.; Pizzolante, A.; De Vivo, B. The occurrence of OCPs, PCBs, and PAHs in the soil, air, and bulk deposition of the Naples metropolitan area, southern Italy: Implications for sources and environmental processes. Environ Int 2019, 124, 89–97. [Google Scholar] [CrossRef]
  8. Qu, C.; Albanese, S.; Cicchella, D.; Fortelli, A.; Hope, D.; Esposito, M.; Cerino, P.; Pizzolante, A.; Qi, S.; De Vivo, B.; et al. The contribution of persistent organic pollutants to the environmental changes in Campania region, Italy: Results from the Campania Trasparente project. J. Geochem. Explor. 2022, 241. [Google Scholar] [CrossRef]
  9. Ragab, S.; El Sikaily, A.; El Nemr, A. Concentrations and sources of pesticides and PCBs in surficial sediments of the Red Sea coast, Egypt. Egypt. J. Aquat. Res. 2016, 42, 365–374. [Google Scholar] [CrossRef] [Green Version]
  10. Zhang, H.B.; Li, X.H.; Luo, Y.M.; Li, Q.B. Depth distribution of polychlorinated biphenyls in soils of the Yangtze River Delta region, China. Geoderma 2011, 160, 408–413. [Google Scholar] [CrossRef]
  11. Wang, Y.; Luo, C.L.; Li, J.; Yin, H.; Li, X.D.; Zhang, G. Characterization and risk assessment of polychlorinated biphenyls in soils and vegetations near an electronic waste recycling site, South China. Chemosphere 2011, 85, 344–350. [Google Scholar] [CrossRef]
  12. Xing, Y.; Lu, Y.; Dawson, R.W.; Shi, Y.; Zhang, H.; Wang, T.; Liu, W.; Ren, H. A spatial temporal assessment of pollution from PCBs in China. Chemosphere 2005, 60, 731–739. [Google Scholar] [CrossRef]
  13. Takasuga, T.; Senthilkumar, K.; Matsumura, T.; Shiozaki, K.; Sakai, S.I. Isotope dilution analysis of polychlorinated biphenyls (PCBs) in transformer oil and global commercial PCB formulations by high resolution gas chromatography-high resolution mass spectrometry. Chemosphere 2006, 62, 469–484. [Google Scholar] [CrossRef] [PubMed]
  14. Erickson, M.D.; Kaley, R.G. Applications of polychlorinated biphenyls. Environ. Sci. Pollut. Res. 2011, 18, 135–151. [Google Scholar] [CrossRef]
  15. Li, J.; Chen, C.L.; Li, F.D. Status of POPs accumulation in the Yellow River Delta: From distribution to risk assessment. Mar. Pollut. Bull. 2016, 107, 370–378. [Google Scholar] [CrossRef] [PubMed] [Green Version]
  16. Duan, X.Y.; Li, Y.X.; Li, X.G.; Li, M.F.; Zhang, D.H. Distributions and sources of polychlorinated biphenyls in the coastal East China Sea sediments. Sci. Total. Environ. 2013, 463, 894–903. [Google Scholar] [CrossRef] [PubMed]
  17. Wang, N.; Yi, L.; Shi, L.L.; Kong, D.Y.; Cai, D.J.; Wang, D.H.; Shan, Z.J. Pollution level and human health risk assessment of some pesticides and polychlorinated biphenyls in Nantong of Southeast China. J. Environ. Sci. 2012, 24, 1854–1860. [Google Scholar] [CrossRef]
  18. Sun, H.; Chen, H.; Yao, L.; Chen, J.; Zhu, Z.; Wei, Y.; Ding, X.; Chen, J. Sources and health risks of PM(2.5)-bound polychlorinated biphenyls (PCBs) and organochlorine pesticides (OCPs) in a North China rural area. J. Environ. Sci. 2020, 95, 240–247. [Google Scholar] [CrossRef] [PubMed]
  19. Chen, X.; Chen, J.S.; Zhang, L.; Li, J.G.; Yao, L.N.; Self, S.G.; Sun, X.; Tang, N.J. Levels of PCDDs, PCDFs and dl-PCBs in the blood of childbearing-aged women living in the vicinity of a chemical plant in Tianjin: A primary study. Chemosphere 2015, 118, 1–4. [Google Scholar] [CrossRef]
  20. Cave, M.; Appana, S.; Patel, M.; Falkner, K.C.; McClain, C.J.; Brock, G. Polychlorinated Biphenyls, Lead, and Mercury Are Associated with Liver Disease in American Adults: NHANES 2003-2004. Environ. Health Persp. 2010, 118, 1735–1742. [Google Scholar] [CrossRef] [PubMed] [Green Version]
  21. Nagayama, J.; Okamura, K.; Iida, T.; Hirakawa, H.; Matsueda, T.; Tsuji, H.; Hasegawa, M.; Sato, K.; Ma, H.Y.; Yanagawa, T.; et al. Postnatal exposure to chlorinated dioxins and related chemicals on thyroid hormone status in Japanese breast-fed infants. Chemosphere 1998, 37, 1789–1793. [Google Scholar] [CrossRef] [PubMed]
  22. Bell, M.R. Endocrine-disrupting actions of PCBs on brain development and social and reproductive behaviors. Curr. Opin. Pharmacol. 2014, 19, 134–144. [Google Scholar] [CrossRef] [PubMed] [Green Version]
  23. Cheng, J.; Yang, Y.; Ma, J.; Wang, W.; Liu, X.; Sakamoto, M.; Qu, Y.; Shi, W. Assessing noxious effects of dietary exposure to methylmercury: PCBs and Se coexisting in environmentally contamined rice in male mice. Environ. Int. 2009, 35, 619–625. [Google Scholar] [CrossRef] [PubMed]
  24. Zhang, L.; Shi, K.L.; Yue, L.P. Chemical characteristics and pollution sources of petroleum hydrocarbons and PAHs in sediments from the Beiluo River, Northern China. Environ. Geol. 2007, 53, 307–315. [Google Scholar] [CrossRef]
  25. He, Y.; Song, J.; Hu, Y.; Tu, X.; Zhao, Y. Impacts of different weather conditions and landuse change on runoff variations in the Beiluo River Watershed, China. Sustain. Cities Soc. 2019, 50, 101674. [Google Scholar] [CrossRef]
  26. Chen, N.; Ma, T.; Zhang, X. Responses of soil erosion processes to land cover changes in the Loess Plateau of China: A case study on the Beiluo River basin. Catena 2015, 136, 118–127. [Google Scholar] [CrossRef]
  27. Zhang, Y.X.; Cheng, D.D.; Lei, Y.L.; Song, J.X.; Xia, J. Spatiotemporal distribution of polycyclic aromatic hydrocarbons in sediments of a typical river located in the Loess Plateau, China: Influence of human activities and land-use changes. J. Hazard. Mater. 2022, 424, 127744. [Google Scholar] [CrossRef]
  28. 2020 Yan’an Statistical Yearbook. 2020. Available online: http://tjj.yanan.gov.cn/tjxx/tjsj/tjnj/1535078906934181889.html (accessed on 21 October 2022).
  29. Jiang, W.W.; Song, J.X.; Zhang, J.L.; Wang, Y.Y.; Zhang, N.; Zhang, X.H.; Long, Y.Q.; Li, J.X.; Yang, X.G. Spatial variability of streambed vertical hydraulic conductivity and its relation to distinctive stream morphologies in the Beiluo River, Shaanxi Province, China. Hydrogeol. J. 2015, 23, 1617–1626. [Google Scholar] [CrossRef]
  30. Chinese Industrial Standard, 2017. Soil and Sediment–Determination of Polychlorinated Biphenyl Mixtures–Gas Chromatography. HJ 890; Ministry of Ecology and Environment of People’s Republic of China: Beijing, China, 2017. (In Chinese)
  31. Zheng, H.; Qu, C.; Zhang, J.; Talpur, S.A.; Ding, Y.; Xing, X.; Qi, S. Polycyclic aromatic hydrocarbons (PAHs) in agricultural soils from Ningde, China: Levels, sources, and human health risk assessment. Env. Geochem. Health 2019, 41, 907–919. [Google Scholar] [CrossRef]
  32. Yang, Z.F.; Shen, Z.Y.; Gao, F.; Tang, Z.W.; Niu, J.F. Occurrence and possible sources of polychlorinated biphenyls in surface sediments from the Wuhan reach of the Yangtze River, China. Chemosphere 2009, 74, 1522–1530. [Google Scholar] [CrossRef]
  33. Van den Berg, M.; Birnbaum, L.S.; Denison, M.; De Vito, M.; Farland, W.; Feeley, M.; Fiedler, H.; Hakansson, H.; Hanberg, A.; Haws, L.; et al. The 2005 World Health Organization reevaluation of human and mammalian toxic equivalency factors for dioxins and dioxin-like compounds. Toxicol. Sci. 2006, 93, 223–241. [Google Scholar] [CrossRef] [PubMed] [Green Version]
  34. Shi, C.; Qu, C.; Sun, W.; Zhou, J.; Zhang, J.; Cao, Y.; Zhang, Y.; Guo, J.; Zhang, J.; Qi, S. Multimedia distribution of polycyclic aromatic hydrocarbons in the Wang Lake Wetland, China. Environ Pollut 2022, 306, 119358. [Google Scholar] [CrossRef]
  35. Sah, R.; Baroth, A.; Hussain, S.A. First account of spatio-temporal analysis, historical trends, source apportionment and ecological risk assessment of banned organochlorine pesticides along the Ganga River. Environ. Pollut. 2020, 263, 114229. [Google Scholar] [CrossRef]
  36. Wang, X.N.; Zhang, Z.M.; Zhang, R.R.; Huang, W.; Dou, W.K.; You, J.J.; Jiao, H.F.; Sun, A.L.; Chen, J.; Shi, X.Z.; et al. Occurrence, source, and ecological risk assessment of organochlorine pesticides and polychlorinated biphenyls in the water-sediment system of Hangzhou Bay and East China Sea. Mar. Pollut. Bull. 2022, 179, 113735. [Google Scholar] [CrossRef] [PubMed]
  37. Wang, Z.; Qu, C.; Zhang, J.; Zhi, L.; Tang, T.; Yao, H.; Li, W.; Shi, C.; Qi, S. Constructing model-averaging species sensitivity distributions of Phenanthrene based on reproductive fitness: Implications for assessing ecological risk in urban watershed. J. Hazard. Mater. 2023, 443, 130296. [Google Scholar] [CrossRef] [PubMed]
  38. Du, S.Y.; Rodenburg, L.A. Source identification of atmospheric PCBs in Philadelphia/Camden using positive matrix factorization followed by the potential source contribution function. Atmos Environ. 2007, 41, 8596–8608. [Google Scholar] [CrossRef]
  39. Yurdakul, S.; Celik, I.; Celen, M.; Ozturk, F.; Cetin, B. Levels, temporal/spatial variations and sources of PAHs and PCBs in soil of a highly industrialized area. Atmos Pollut. Res. 2019, 10, 1227–1238. [Google Scholar] [CrossRef]
  40. Chen, Y.P.; Zhao, Y.; Zhao, M.M.; Wu, J.H.; Wang, K.B. Potential health risk assessment of HFRs, PCBs, and OCPs in the Yellow River basin. Environ. Pollut. 2021, 275, 116648. [Google Scholar] [CrossRef]
  41. Howell, N.L.; Suarez, M.P.; Rifai, H.S.; Koenig, L. Concentrations of polychlorinated biphenyls (PCBs) in water, sediment, and aquatic biota in the Houston Ship Channel, Texas. Chemosphere 2008, 70, 593–606. [Google Scholar] [CrossRef]
  42. Wang, D.G.; Yang, M.; Jia, H.L.; Zhou, L.; Li, Y.F. Levels, distributions and profiles of polychlorinated biphenyls in surface soils of Dalian, China. Chemosphere 2008, 73, 38–42. [Google Scholar] [CrossRef]
  43. Odabasi, M.; Bayram, A.; Elbir, T.; Seyfioglu, R.; Dumanoglu, Y.; Bozlaker, A.; Demircioglu, H.; Altiok, H.; Yatkin, S.; Cetin, B. Electric Arc Furnaces for Steel-Making: Hot Spots for Persistent Organic Pollutants. Environ. Sci. Technol. 2009, 43, 5205–5211. [Google Scholar] [CrossRef] [PubMed]
  44. Jafarabadi, A.R.; Bakhtiari, A.R.; Mitra, S.; Maisano, M.; Cappello, T.; Jadot, C. First polychlorinated biphenyls (PCBs) monitoring in seawater, surface sediments and marine fish communities of the Persian Gulf: Distribution, levels, congener profile and health risk assessment. Environ. Pollut. 2019, 253, 78–88. [Google Scholar] [CrossRef] [PubMed]
  45. Pouch, A.; Zaborska, A.; Mazurkiewicz, M.; Winogradow, A.; Pazdro, K. PCBs, HCB and PAHs in the seawater of Arctic fjords–Distribution, sources and risk assessment. Mar. Pollut. Bull. 2021, 164, 111980. [Google Scholar] [CrossRef] [PubMed]
  46. Moret, I.; Gambaro, A.; Piazza, R.; Ferrari, S.; Manodori, L. Determination of polychlorobiphenyl congeners (PCBs) in the surface water of the Venice lagoon. Mar. Pollut. Bull. 2005, 50, 167–174. [Google Scholar] [CrossRef]
  47. Montuori, P.; De Rosa, E.; Sarnacchiaro, P.; Di Duca, F.; Provvisiero, D.P.; Nardone, A.; Triassi, M. Polychlorinated biphenyls and organochlorine pesticides in water and sediment from Volturno River, Southern Italy: Occurrence, distribution and risk assessment. Environ. Sci. Eur. 2020, 32, 123. [Google Scholar] [CrossRef]
  48. Nie, X.; Lan, C.Y.; Luan, T.; Huang, M.H.; Mai, Z.Q. Polychlorinated biphenyls in the waters, sediments and benthic organisms from Guangzhou reach of Pearl River. Zhongguo Huanjing Kexue/China Environ. Sci. 2001, 21, 417–421. [Google Scholar]
  49. Chunxia, W. Monitoring toxic organic pollutants in Huaihe River waters using SPE and triolein-SPMD. China Environ. Sci. 2000, 20, 168–172. [Google Scholar]
  50. Zhang, R.; Kang, Y.; Yu, K.-F.; Han, M.; Wang, Y.; Huang, X.; Ding, Y.; Wang, R.; Pei, J. Occurrence, Distribution, and Fate of Polychlorinated Biphenyls (PCBs) in Multiple Coral Reef Regions from the South China Sea: A Case Study in Spring-summer. Sci. Total Environ. 2021, 777, 146106. [Google Scholar] [CrossRef]
  51. Sun, H.W.; Giesy, J.P.; Jin, X.W.; Wang, J. Tiered probabilistic assessment of organohalogen compounds in the Han River and Danjiangkou Reservoir, central China. Sci. Total Environ. 2017, 586, 163–173. [Google Scholar] [CrossRef]
  52. Zaghden, H.; Barhoumi, B.; Jlaiel, L.; Guigue, C.; Chouba, L.; Touil, S.; Sayadi, S.; Tedetti, M. Occurrence, origin and potential ecological risk of dissolved polycyclic aromatic hydrocarbons and organochlorines in surface waters of the Gulf of Gabès (Tunisia, Southern Mediterranean Sea). Mar. Pollut. Bull. 2022, 180, 113737. [Google Scholar] [CrossRef]
  53. Miraji, H.; Ripanda, A.; Moto, E. A review on the occurrences of persistent organic pollutants in corals, sediments, fish and waters of the Western Indian Ocean. Egypt. J. Aquat. Res. 2021, 47, 373–379. [Google Scholar] [CrossRef]
  54. Dioxins. Office of Dioxins Control, Environmental Management Bureau, Ministry of the Environment, Government of Japan. 2012. Available online: https://www.env.go.jp/en/chemi/dioxins/brochure2012.pdf (accessed on 23 October 2022).
  55. Habibullah-Al-Mamun, M.; Ahmed, M.K.; Islam, M.S.; Tokumura, M.; Masunaga, S. Occurrence, distribution and possible sources of polychlorinated biphenyls (PCBs) in the surface water from the Bay of Bengal coast of Bangladesh. Ecotox. Environ. Safe 2019, 167, 450–458. [Google Scholar] [CrossRef] [PubMed]
  56. Yang, Y.J.; Chen, Z.L.; Zhang, J.L.; Wu, S.Q.; Yang, L.; Chen, L.; Shao, Y. The challenge of micropollutants in surface water of the Yangtze River. Sci. Total Environ. 2021, 780, 146537. [Google Scholar] [CrossRef] [PubMed]
  57. Wang, H.S.; Du, J.; Leung, H.M.; Leung, A.O.; Liang, P.; Giesy, J.P.; Wong, C.K.; Wong, M.H. Distribution and source apportionments of polychlorinated biphenyls (PCBs) in mariculture sediments from the Pearl River Delta, South China. Mar. Pollut. Bull. 2011, 63, 516–522. [Google Scholar] [CrossRef]
  58. Shao, Y.; Chen, Z.L.; Hollert, H.; Zhou, S.B.; Deutschmann, B.; Seiler, T.B. Toxicity of 10 organic micropollutants and their mixture: Implications for aquatic risk assessment. Sci. Total Environ. 2019, 666, 1273–1282. [Google Scholar] [CrossRef]
  59. Wu, B.B.; Zhang, Y.L.; Hong, H.C.; Hu, M.; Liu, H.L.; Chen, X.; Liang, Y. Hydrophobic organic compounds in drinking water reservoirs: Toxic effects of chlorination and protective effects of dietary antioxidants against disinfection by-products. Water Res. 2019, 166, 115041. [Google Scholar] [CrossRef]
  60. Khalil, S.; Mahnashi, M.H.; Hussain, M.; Zafar, N.; Nisa, W.U.; Khan, F.S.; Afzal, U.; Shah, G.M.; Niazi, U.M.; Awais, M.; et al. Exploration and determination of algal role as Bioindicator to evaluate water quality-Probing freshwater algae. Saudi, J. Biol. Sci. 2021, 28, 5728–5737. [Google Scholar] [CrossRef]
  61. Yuan, Z.; He, B.; Wu, X.; Simonich, S.L.M.; Liu, H.; Fu, J.; Chen, A.; Liu, H.; Wang, Q. Polycyclic aromatic hydrocarbons (PAHs) in urban stream sediments of Suzhou Industrial Park, an emerging eco-industrial park in China: Occurrence, sources and potential risk. Ecotoxicol. Environ. Saf. 2021, 214, 112095. [Google Scholar] [CrossRef]
  62. Anezaki, K.; Nakano, T.; Kashiwagi, N. Estimation of Polychlorinated Biphenyl Sources in Industrial Port Sediments Using a Bayesian Semifactor Model Considering Unidentified Sources. Environ. Sci. Technol. 2016, 50, 765–771. [Google Scholar] [CrossRef]
  63. Zhao, T.G.; Guo, Z.G.; Yao, P.; Hu, L.M.; Wu, Z.L.; Lin, T. Deposition flux and mass inventory of polychlorinated biphenyls in sediments of the Yangtze River Estuary and inner shelf, East China Sea: Implications for contributions of large-river input and e-waste dismantling. Sci. Total Environ. 2019, 647, 1222–1229. [Google Scholar] [CrossRef]
  64. Yan, W.Z.; Hua, S. A Strategy Study on the Environmental Protection of the Energy and Chemical Industry Base in Northern Shaanxi. Energy Procedia 2011, 5, 969–973. [Google Scholar] [CrossRef] [Green Version]
  65. Song, J.X.; Yang, Z.Y.; Xia, J.; Cheng, D.D. The impact of mining-related human activities on runoff in northern Shaanxi, China. J. Hydrol. 2021, 598, 126235. [Google Scholar] [CrossRef]
  66. Jin, R.H.; Park, S.U.; Park, J.E.; Kim, J.G. Polychlorinated Biphenyl Congeners in River Sediments: Distribution and Source Identification Using Multivariate Factor Analysis. Arch. Environ. Con. Tox. 2012, 62, 411–423. [Google Scholar] [CrossRef]
  67. Cui, S.; Fu, Q.; Ma, W.L.; Song, W.W.; Liu, L.Y.; Li, Y.F. A preliminary compilation and evaluation of a comprehensive emission inventory for polychlorinated biphenyls in China. Sci. Total Environ. 2015, 533, 247–255. [Google Scholar] [CrossRef]
  68. Zhao, S.Z.; Breivik, K.; Liu, G.R.; Zheng, M.H.; Jones, K.C.; Sweetman, A.J. Long-Term Temporal Trends of Polychlorinated Biphenyls and Their Controlling Sources in China. Environ. Sci. Technol. 2017, 51, 2838–2845. [Google Scholar] [CrossRef] [Green Version]
  69. Lee, R.G.; Coleman, P.; Jones, J.L.; Jones, K.C.; Lohmann, R. Emission factors and importance of PCDD/Fs, PCBs, PCNs, PAHs and PM10 from the domestic burning of coal and wood in the U.K. Environ. Sci. Technol. 2005, 39, 1436–1447. [Google Scholar] [CrossRef]
  70. Kim, K.S.; Hirai, Y.; Kato, M.; Urano, K.; Masunaga, S. Detailed PCB congener patterns in incinerator flue gas and commercial PCB formulations (Kanechlor). Chemosphere 2004, 55, 539–553. [Google Scholar] [CrossRef]
  71. Aydin, Y.M.; Kara, M.; Dumanoglu, Y.; Odabasi, M.; Elbir, T. Source apportionment of polycyclic aromatic hydrocarbons (PAHs) and polychlorinated biphenyls (PCBs) in ambient air of an industrial region in Turkey. Atmos Environ. 2014, 97, 271–285. [Google Scholar] [CrossRef]
  72. Sun, H.; Chen, Q.; Chen, W.; Qu, C.; Mo, J.; Song, J.; Guo, J.; Tian, Y. Assessment of biological community in riparian zone contaminated by PAHs: Linking source apportionment to biodiversity. Sci. Total Environ. 2022, 851, 158121. [Google Scholar] [CrossRef]
  73. Yang, J.; Qadeer, A.; Liu, M.; Zhu, J.M.; Huang, Y.P.; Du, W.N.; Wei, X.Y. Occurrence, source, and partition of PAHs, PCBs, and OCPs in the multiphase system of an urban lake, Shanghai. Appl. Geochem. 2019, 106, 17–25. [Google Scholar] [CrossRef]
  74. Yao, T.; He, C.X.; Zhang, P.; Gao, H.; Zhou, C.G. Distribution and sources of polychlorinated biphenyls (PCBs) and organochlorine pesticides (OCPs) in surface waters of Jinzhou Bay in China. Procedia Environ. Sci. 2013, 18, 317–322. [Google Scholar] [CrossRef] [Green Version]
  75. Yu, Y.; Li, Y.X.; Shen, Z.Y.; Yang, Z.F.; Mo, L.; Kong, Y.H.; Lou, I. Occurrence and possible sources of organochlorine pesticides (OCPs) and polychlorinated biphenyls (PCBs) along the Chao River, China. Chemosphere 2014, 114, 136–143. [Google Scholar] [CrossRef]
Figure 1. Study area with sampling sites marked with red triangles. Beiluo River Basin is located in Loess Plateau in northern Shaanxi Province, the middle of China.
Water 15 00459 g001
Figure 2. (a) PCBs concentrations in all sampling sites. (b) PCBs homolog profiles (i.e., relative contribution to total PCBs in %) in all sampling sites.
Water 15 00459 g002
Figure 3. The risk quotient (RQ) of PCBs in all sampling sites.
Water 15 00459 g003
Figure 4. Positive matrix factorization source analysis of PCBs: (ac) are the different factors, and the bars represent the contribution of each factor to the corresponding PCB. (d) The Pie chart showing the contribution of each factor to the total PCBs.
Water 15 00459 g004aWater 15 00459 g004b
Table 1. Concentrations of PCBs in waterbodies in different regions.
LocationCountry or RegionPCBs Range (ng L−1)Average (ng L−1)Reference
Beiluo RiverChina6.5 × 10−2–1.920.37This study
Arctic fjordsArctic0.4 × 10−2–0.40-[45]
Houston Ship ChannelTexas0.49–12.492.47[41]
Hangzhou Bay and East China SeaChina0.40–51.75-[36]
Nanjiabawa PeakTibet-9.3 × 10⁻³[12]
Yangtze RiverChina0.29–2.001.24[12]
Persian GulfMiddle East0.97–3.10-[44]
Venice LagoonItaly3.55 × 10−1–18.68 × 10⁻¹-[46]
Volturno RiverSouthern Italy4.1–48-[47]
Yellow River BasinChina-2.32 × 10⁻¹[40]
Pearl EstuaryGuangzhou1.13–3.112.3[48]
Huaihe RiverChina0.24–0.280.26[49]
South China SeaThe south of China2.8 × 10−3–7.7 × 10−34.28 × 10−3[50]
Han River and Danjiangkou ReservoirChina0.35–5.0-[51]
Table 2. The toxicity equivalents (TEQ) of 12 typical PCBS in the water of Beiluo River.
PCBsTEF 1TEQPCBsTEF1TEQ
PCB-810.30 × 10−310.86 × 10⁻⁶PCB-1260.1014.48 × 10−3
PCB-770.10 × 10−316.79 × 10⁻⁶PCB-1670.30 × 10−420.43 × 10⁻⁷
PCB-1230.03 × 10−331.77 × 10⁻⁷PCB-1560.30 × 10−417.07 × 10⁻⁷
PCB-1180.03 × 10−339.54 × 10⁻⁷PCB-1570.3 × 10−424.48 × 10⁻⁷
PCB-1140.03 × 10−328.95 × 10⁻⁷PCB-1690.0335.07 × 10−4
PCB-1050.03 × 10−331.71 × 10⁻⁷PCB-1890.3048.33 × 10−7
Note: 1 The toxic equivalency factor (TEF) of PCBs were extracted from 2005 WHO revision [33].
Disclaimer/Publisher’s Note: The statements, opinions and data contained in all publications are solely those of the individual author(s) and contributor(s) and not of MDPI and/or the editor(s). MDPI and/or the editor(s) disclaim responsibility for any injury to people or property resulting from any ideas, methods, instructions or products referred to in the content.

