Article

Precision Nitrogen Fertilizer and Irrigation Management for Apple Cultivation Based on a Multilevel Comprehensive Evaluation Method of Yield, Quality, and Profit Indices

1
College of Natural Resources and Environment, Northwest A&F University, Xianyang 712100, China
2
Key Laboratory of Plant Nutrition and the Agri-Environment in Northwest China, Ministry of Agriculture, Xianyang 712100, China
3
Apple Experiment Station, Northwest A&F University, Weinan 715600, China
*
Author to whom correspondence should be addressed.
Water 2023, 15(3), 468; https://doi.org/10.3390/w15030468
Submission received: 21 November 2022 / Revised: 11 January 2023 / Accepted: 17 January 2023 / Published: 24 January 2023
(This article belongs to the Special Issue Water-Soil-Crop Relationships in Agriculture Production)

Abstract

:
Precise and efficient fertilizer and irrigation management is critical for apple production in the Loess Plateau, China. In this study, we established three levels of nitrogen application and irrigation in nine treatments in an apple orchard based on a completely randomized block design. Then, we analyzed different apple indicator responses to nitrogen and irrigation and their related interactions. More importantly, we used the multilevel comprehensive fuzzy evaluation value (MFCE) method to combine the weights of all indicators to obtain the comprehensive growth indicators for apples. Finally, we analyzed the effect of nitrogen and irrigation coupling on the comprehensive growth of apples and then determined the optimal interval for nitrogen application and irrigation. The results indicated that an increase in the amount of irrigation was beneficial for apple yield, but excessive nitrogen fertilizer application significantly reduced apple yield. The apple indicators were not sensitive to irrigation and nitrogen application and their related interactions; they were mainly controlled by the apple cultivar. On the other hand, an increase in the amount of nitrogen fertilizer or a reduction in the amount of irrigation could improve apple quality. The results of the comprehensive evaluation showed that the T5 treatment was most beneficial for the comprehensive growth of apples. To obtain the optimal interval for nitrogen application and irrigation more precisely, we used multiple linear regression based on the MFCE values of apples, nitrogen, and irrigation in R language. Nitrogen and irrigation showed a positive effect on the comprehensive growth of apples when the irrigation amount was low. However, nitrogen application and irrigation had a negative effect on the comprehensive growth of apples when the irrigation level was high. After optimization, the optimal nitrogen application and irrigation amounts were 170.5–189.5 kg·hm−2 and 38.4–42.7 mm, respectively. We recommend using this irrigation and fertilizer management scheme for apple orchards in China’s Loess Plateau.

1. Introduction

The Loess Plateau is primarily a semiarid area in China. Ecological fragility and soil erosion are major long-term problems in this area [1,2]. More importantly, the productivity of crops on the Loess Plateau is severely limited because of soil water limitations [3]. Additionally, much soil has been eroded, which has resulted in vegetation degradation and the destruction of ecosystems [4,5]. In 1999, the Chinese government implemented the ‘Grain to Green Project’ to address environmental crises and improve human well-being [6]. China has the largest apple (Malus pumila Mill.) planting area and fruit yield [7]. The Loess Plateau is also a major planting area in China. Apple tree planting can not only increase the income of local farmers but also effectively conserve water and protect the local ecosystem [8]. Therefore, the apple industry has become a major economic mainstay in the Loess Plateau.
It is well known that irrigation and fertilization are the most important management measures during apple cultivation. Apples are highly sensitive to water supplies, and irrigation amounts can significantly affect the yield of apple fruits [9,10]. Nitrogen fertilizer is the main nutritional factor absorbed by apples, and it has an important influence on the growth and development of trees and the quality of fruits [11,12]. Improper amounts of irrigation and fertilization not only affect plant yield and quality but also lead to soil salinization and soil moisture loss [13]. The Loess Plateau is a relatively water-deficient area and has severe soil erosion issues. Therefore, the precise and efficient use of nitrogen fertilizer and irrigation is crucial to the conservation of the local agroecology and for the economic benefits obtained from apple trees.
In fact, the compatibility of applied fertilizer and irrigation levels with the growth and development of local crops can strongly influence the yield and quality of crops and the efficient use of resources [14,15,16]. Appropriate irrigation and nitrogen application rates can ensure the normal development of apple trees, resulting in positive yields and fruit quality. Excessive levels of nitrogen application and irrigation can lead to unbalanced growth and development in apple trees; when an original source or reservoir breaks, a surplus of nutrients could be delivered to the trees [17,18,19]. Excessive nitrogen application may affect apple fruit yield and size and cause unpleasant coloration on the fruit surface, leading to poor economic yield [20]. Irrigation levels that are very low can also lead to the impaired vegetative development of apple trees and to reduced yields [21]. Therefore, saving water by reducing irrigation may result in a negative trade-off on apple trees, especially in arid and semiarid areas such as the Loess Plateau of China. Therefore, scientific, and efficient irrigation is crucial to ensure that the growth and development of apple trees are not affected [9,22].
The effect of nitrogen fertilizer and irrigation and their interaction on apples has not been determined in detail in the Loess Plateau. More importantly, different amounts of irrigation and nitrogen can significantly affect the yield, quality, and profitability of apples. In addition, the responses of various apple indicators to nitrogen and irrigation and their interactions are also unclear. A rational and scientific method is urgently needed to comprehensively evaluate the effects of nitrogen application and irrigation on the comprehensive growth of apples. Many evaluation methods have been used in agriculture, but most of them are single evaluation methods that cannot objectively and subjectively evaluate the growth of the final crops [23,24,25]. The multilevel fuzzy comprehensive evaluation (MFCE) method can effectively combine subjective and objective evaluation results based on fuzzy algorithms and is widely used in many fields [26,27,28]. Therefore, in this study, the objectives were to (1) explore how nitrogen application and irrigation and their interactions affect various indicators in apples; (2) determine the importance of different apple indicators for the comprehensive growth of apples based on subjective and objective evaluations; and (3) determine how coupled nitrogen and irrigation effects influence the comprehensive growth of apples based on the MFCE method and determine the optimal irrigation and nitrogen management rates for apples in the Loess Plateau.

2. Materials and Method

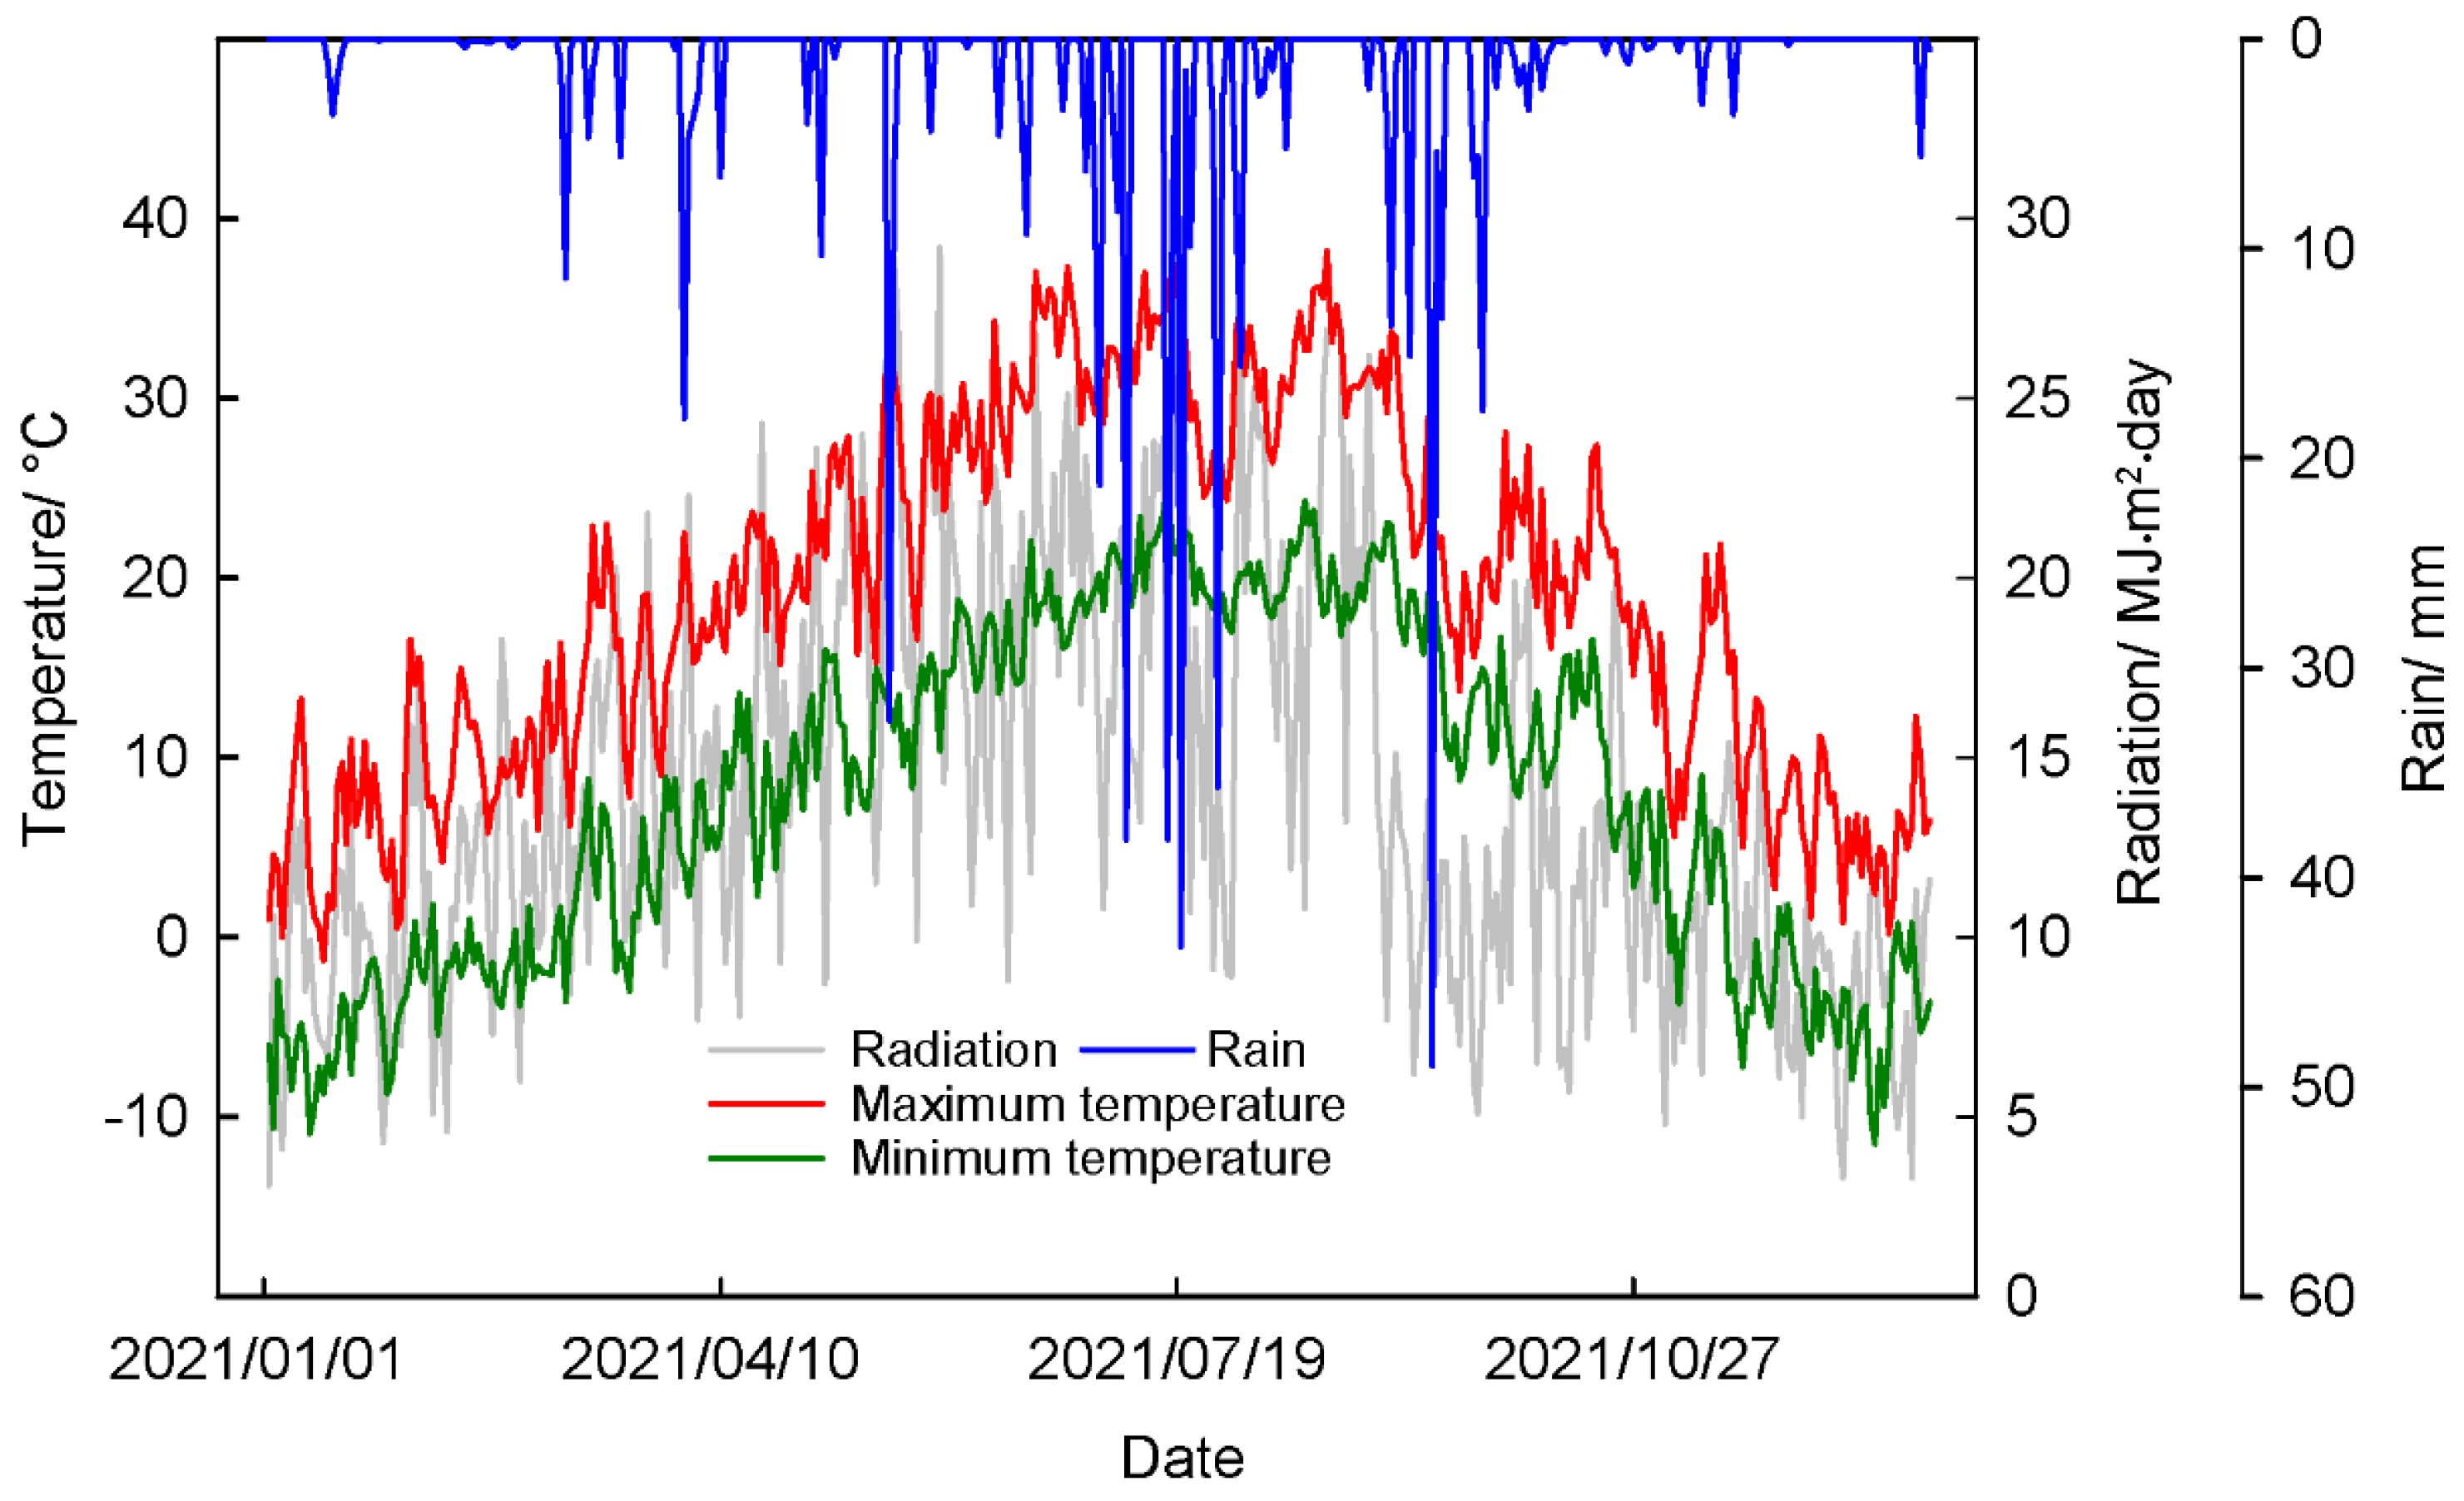
2.1. Experimental Site and Planting Details

The experiment was conducted in an apple orchard in Baishui, Shaanxi Province, China (latitude 35°10′ N, longitude 109°35′ E). This region is categorized as a cold temperate zone (Dwa) and experiences dry winters based on the Koppen climate classification. The apple variety selected was ‘Ruixue,’ which is the main apple variety cultivated locally. The apple trees were planted in 2015, and the fruits were harvested in 2018. The experiment was initiated in 2021, and the climate trends (radiation, rain, maximum temperature, and minimum temperature) are shown in Figure 1. The soils at the experimental site are classified as Calcic Cambisols according to the World Reference Base for Soil Resources 4th edition [29]. The soil nutrient concentrations in the initial soil profile (0–100 cm soil layer) are shown in Table 1.
During the experiment, the sprouting stage of the apple trees began on 7 April, the fruiting stage began on 7 May, the young fruit stage began on June 9, the fruit swelling stage began on 24 August, and the ripening period began on 10 October. We used drip irrigation under black mulch with drip tape (spacing = 0.5 m; flow rate = 2.3 L/h) to reduce evapotranspiration and achieve irrigation retention. All the daily field management practices were consistent with those of local farmers.

2.2. Experimental Design

A completely randomized block design with three replicates was used for the experiments conducted at the apple orchard. We established a total of nine combined treatments, including three different irrigation levels and three different nitrogen (N) levels (Table 2). Each treated block (90 m long and 4.0 m wide) was planted with 60 apple trees. The base fertilizer, which included one-quarter of the total N fertilizer and all the P fertilizer (P2O5, 240 kg·hm−1) and K fertilizer (K2O, 180 kg·hm−1), was initially applied to the roots of the apple trees in each experimental plot before the apple trees broke dormancy. All experimental plots were then irrigated to field capacity. After the apple trees were past the sprouting stage, all irrigation and nitrogen application treatments were initiated. For different irrigation treatments, we used a soil moisture conductivity sensor to obtain the moisture content of the soil to ensure that the soil moisture content was 50%, 70%, and 90% of the field capacity. The actual irrigation period was every 3–6 days for 2021, and on rainy days, no irrigation was applied. Fertilizers were applied using high-frequency drip fertigation. That is, we placed N fertilizer (three-quarters of total nitrogen) and water at the roots of the apple trees through drip irrigation tapes at the beginning of each phenological period (7 April 2021, 7 May 2021, 9 June 2021, 24 August 2021) of the apples.

2.3. Data Measurement

2.3.1. Yield Data

The single fruit weight (SFW) was measured when the apple fruit was ripe, and the fruit number per plant (FNP) was counted on each tree when all the apples could be harvested. The degree of maturity of the apple fruit had to be consistent, and the final apple yield was estimated by SFW, FNP, and planting density.

2.3.2. Fruit Shape and Quality Data

All fresh apple fruits were measured for shape and quality within a week. Vernier calipers were used to measure the vertical and horizontal diameters of apple fruits, which were used to calculate the fruit shape index (FSI). A GY-4 digital hardometer was used to measure the fruit firmness (FF) of the apples. The soluble sugar content (SSC) was quantified via anthrone colorimetry; phenolphthalein indicator and 0.1 mol·L−1 NaOH were used to measure the organic acids (OA); and total soluble solids (TSS) and sugar-acid ratio (SAR) was measured by a digital PAL-Easy ACID3 tonic system (ATAGO, Tokyo, Japan).

2.3.3. Profit Index Data

The irrigation water use efficiency (IWUE) was calculated as follows:
IWUE = Y I
where, IWUE is the irrigation water use efficiency (kg∙mm−1); Y is the apple fruit yield (kg∙hm−2), and I is the drip irrigation water applied (mm∙hm−2).
The partial factor productivity of applied N (PFPN) was calculated as follows:
PFP N = Y F N × 1000
where, PFPN is the partial factor productivity of applied N (kg∙kg−1), Y is the apple fruit yield (kg∙hm−2), and FN is the amount of nitrogen application (kg∙hm−2).

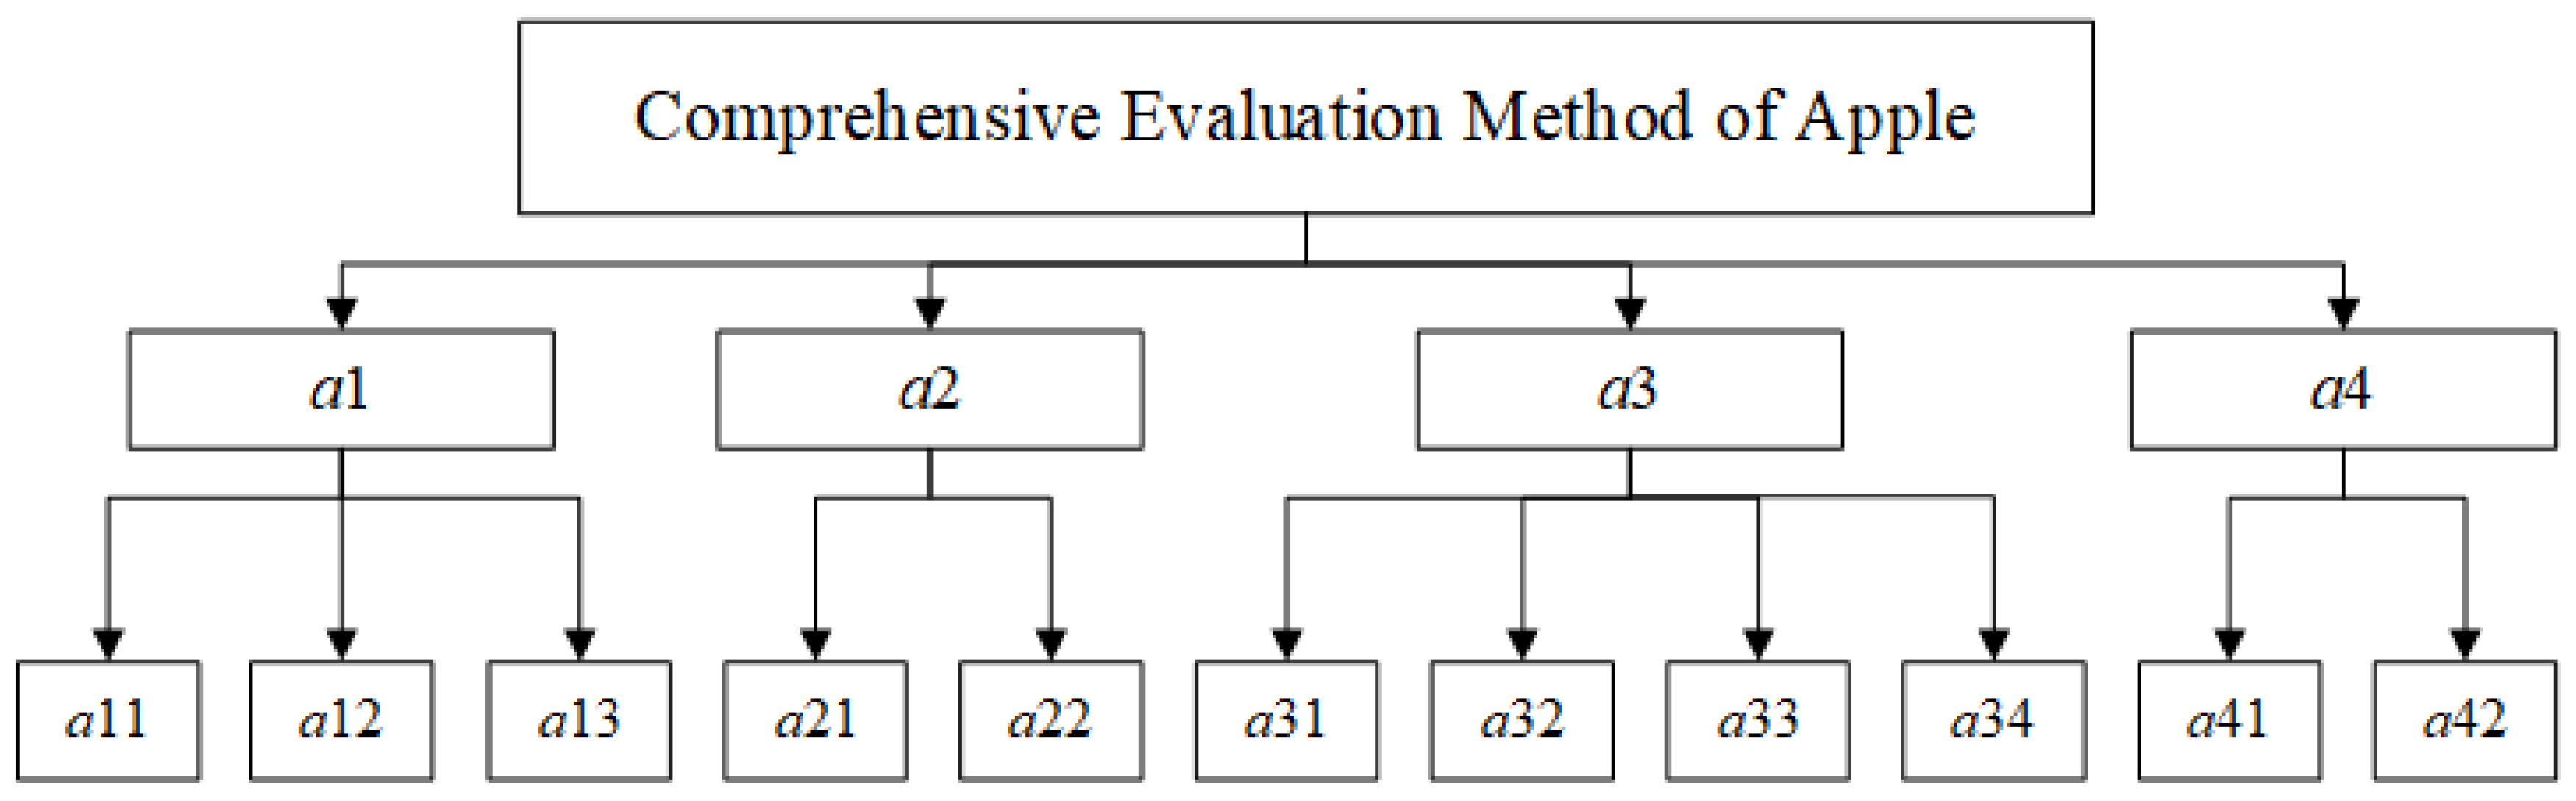
2.4. Multilevel Fuzzy Comprehensive Evaluation Method

First, we have categorized the apple indicators into the following factors: yield, the shape of the fruit, the fruit quality indicators, and the profit index, respectively.
A i = { a 1 , a 2 , a 3 , a 4 }
Then, we classified the sub-indicators and built the data frame. More specifically, a11 is the single fruit weight (SFW), a12 is the fruit number per plant (FNP), a13 is the apple yield (Y), a21 is the fruit shape index (FSI), a22 is the fruit firmness (FF), a31 is the total soluble solids (TSS), a32 is the organic acids (OA), a33 is the soluble sugar content (SSC), a34 is the sugar-acid ratio (SAR), a41 is the irrigation water use efficiency (IWUE), and a42 is the partial factor productivity of applied N (PFPN).
a ij ( a 1 = { a 11 , a 12 , a 13 } a 2 = { a 21 , a 22 } a 3 = { a 31 , a 32 , a 33 , a 34 } a 4 = { a 41 , a 42 } )
According to the fuzzy algorithm, each indicator and its relevant sub-indicators had a corresponding set of evaluation values. Therefore, we have constructed fuzzy maps of indicators (Vi) and sub-indicators (vi) for the nine treatments.
{ V i = { V 1 , V 2 , , V 9 } v ij ( v 1 , v 2 , , v 9 ) }
The analytic hierarchy process (AHP) algorithm is often used to subjectively assess the importance of something; thus, it is a subjective evaluation method. The AHP algorithm consists of three layers, including a target layer, a factor layer, and a subfactor layer (Figure 2).
More specifically, AHP uses questionnaire results to establish a judgment matrix for each sub-indicator as follows:
B = [ b 11 b 12 b 1 n b 21 b 22 b 2 n                  b n 1 b n 2 b nn ]
To calculate the weight of each factor, we first calculated the product of the elements of each row of the matrix (bij) as follows:
M i = j = 1 n b ij   ( i , j = 1 , 2 , , n )
Then, we calculated the weight of each indicator (li) and obtained the dataset of these weights (l). The consistency ratio (CR) test indicated that the weight of the factors conformed to the subjective judgment of human thinking. When CR < 0.1, the consistency ratio test is rational, so the weight of the factor is effective. First, we calculated the maximum characteristic root (λmax) and consistency index (IC) and then used IC and average random consistency index (IR) to calculate CR. The calculation process for all parameters is as follows:
{ l = [ l 1 , l 2 , , l n ] T l i = M i n j = 1 n ( M i n ) λ max = i = 1 n ( C l ) i n l i CR = λ max n ( n 1 ) IR
The entropy method is the main approach used to determine the objective weight of an indicator. They can effectively reflect the information implied by the data and exhibit strong operability. By using the entropy method, the weight of the subfactor is calculated using the following procedure:
The measured data of the subfactor set are standardized to
r jz = ( x jz / z = 1 n x jz ) ( j = 1 , 2 , , m ; z = 1 , 2 , , n ; 0 r ij 1 )
where xjz is the actual measured data.
The information entropy of the subfactor set is calculated. If there are m evaluation indicators and n evaluation objects, then the j-th index information entropy is defined as
E ij =   ln n 1 z = 1 n r jz ln r jz , i = 1 , 2 , 3 ; j = 1 , 2 , 3 , , m
where Eij is the information entropy of the j-th subfactor of the i-th factor.
The weight of each subfactor set is determined. After the j-th index information entropy is determined, the entropy weight (wij) of the j-th subfactor is measured as
w ij = 1 E ij m j = 1 m E ij , 0 w ij 1 , j = 1 m w ij = 1
Finally, we used the obtained subjective weights and objective weights to calculate the multilevel comprehensive fuzzy evaluation value (MFCE). The single-level fuzzy evaluation of factor sets is as follows:
c iz = w ij r jz = [ w 11 w 12 w 1 m w 21 w 22 w 2 m w 31 w 32 w 3 m w 41 w 42 w 4 m ] [ r 11 r 12 r 1 n r 21 r 22 r 2 n                  r m 1   r m 2 r mn ] = [ b 11 b 12 b 1 n b 21 b 22 b 2 n b 31 b 32 b 3 n b 41 b 42 b 4 n ]
where ciz is the fuzzy evaluation index of the i-th indicator set.
We then calculated the first-level fuzzy value and the subjective weight and finally obtained all the second-level fuzzy values of all treatments.
C z = a i b iz = [ a 1 a 2 a 3 a 4 ] [ c 11 c 12 c 1 n c 21 c 22 c 2 n c 31 c 32 c 3 n c 41 c 42 c 4 n ] = [ C 1 C 2 C n ]

3. Results

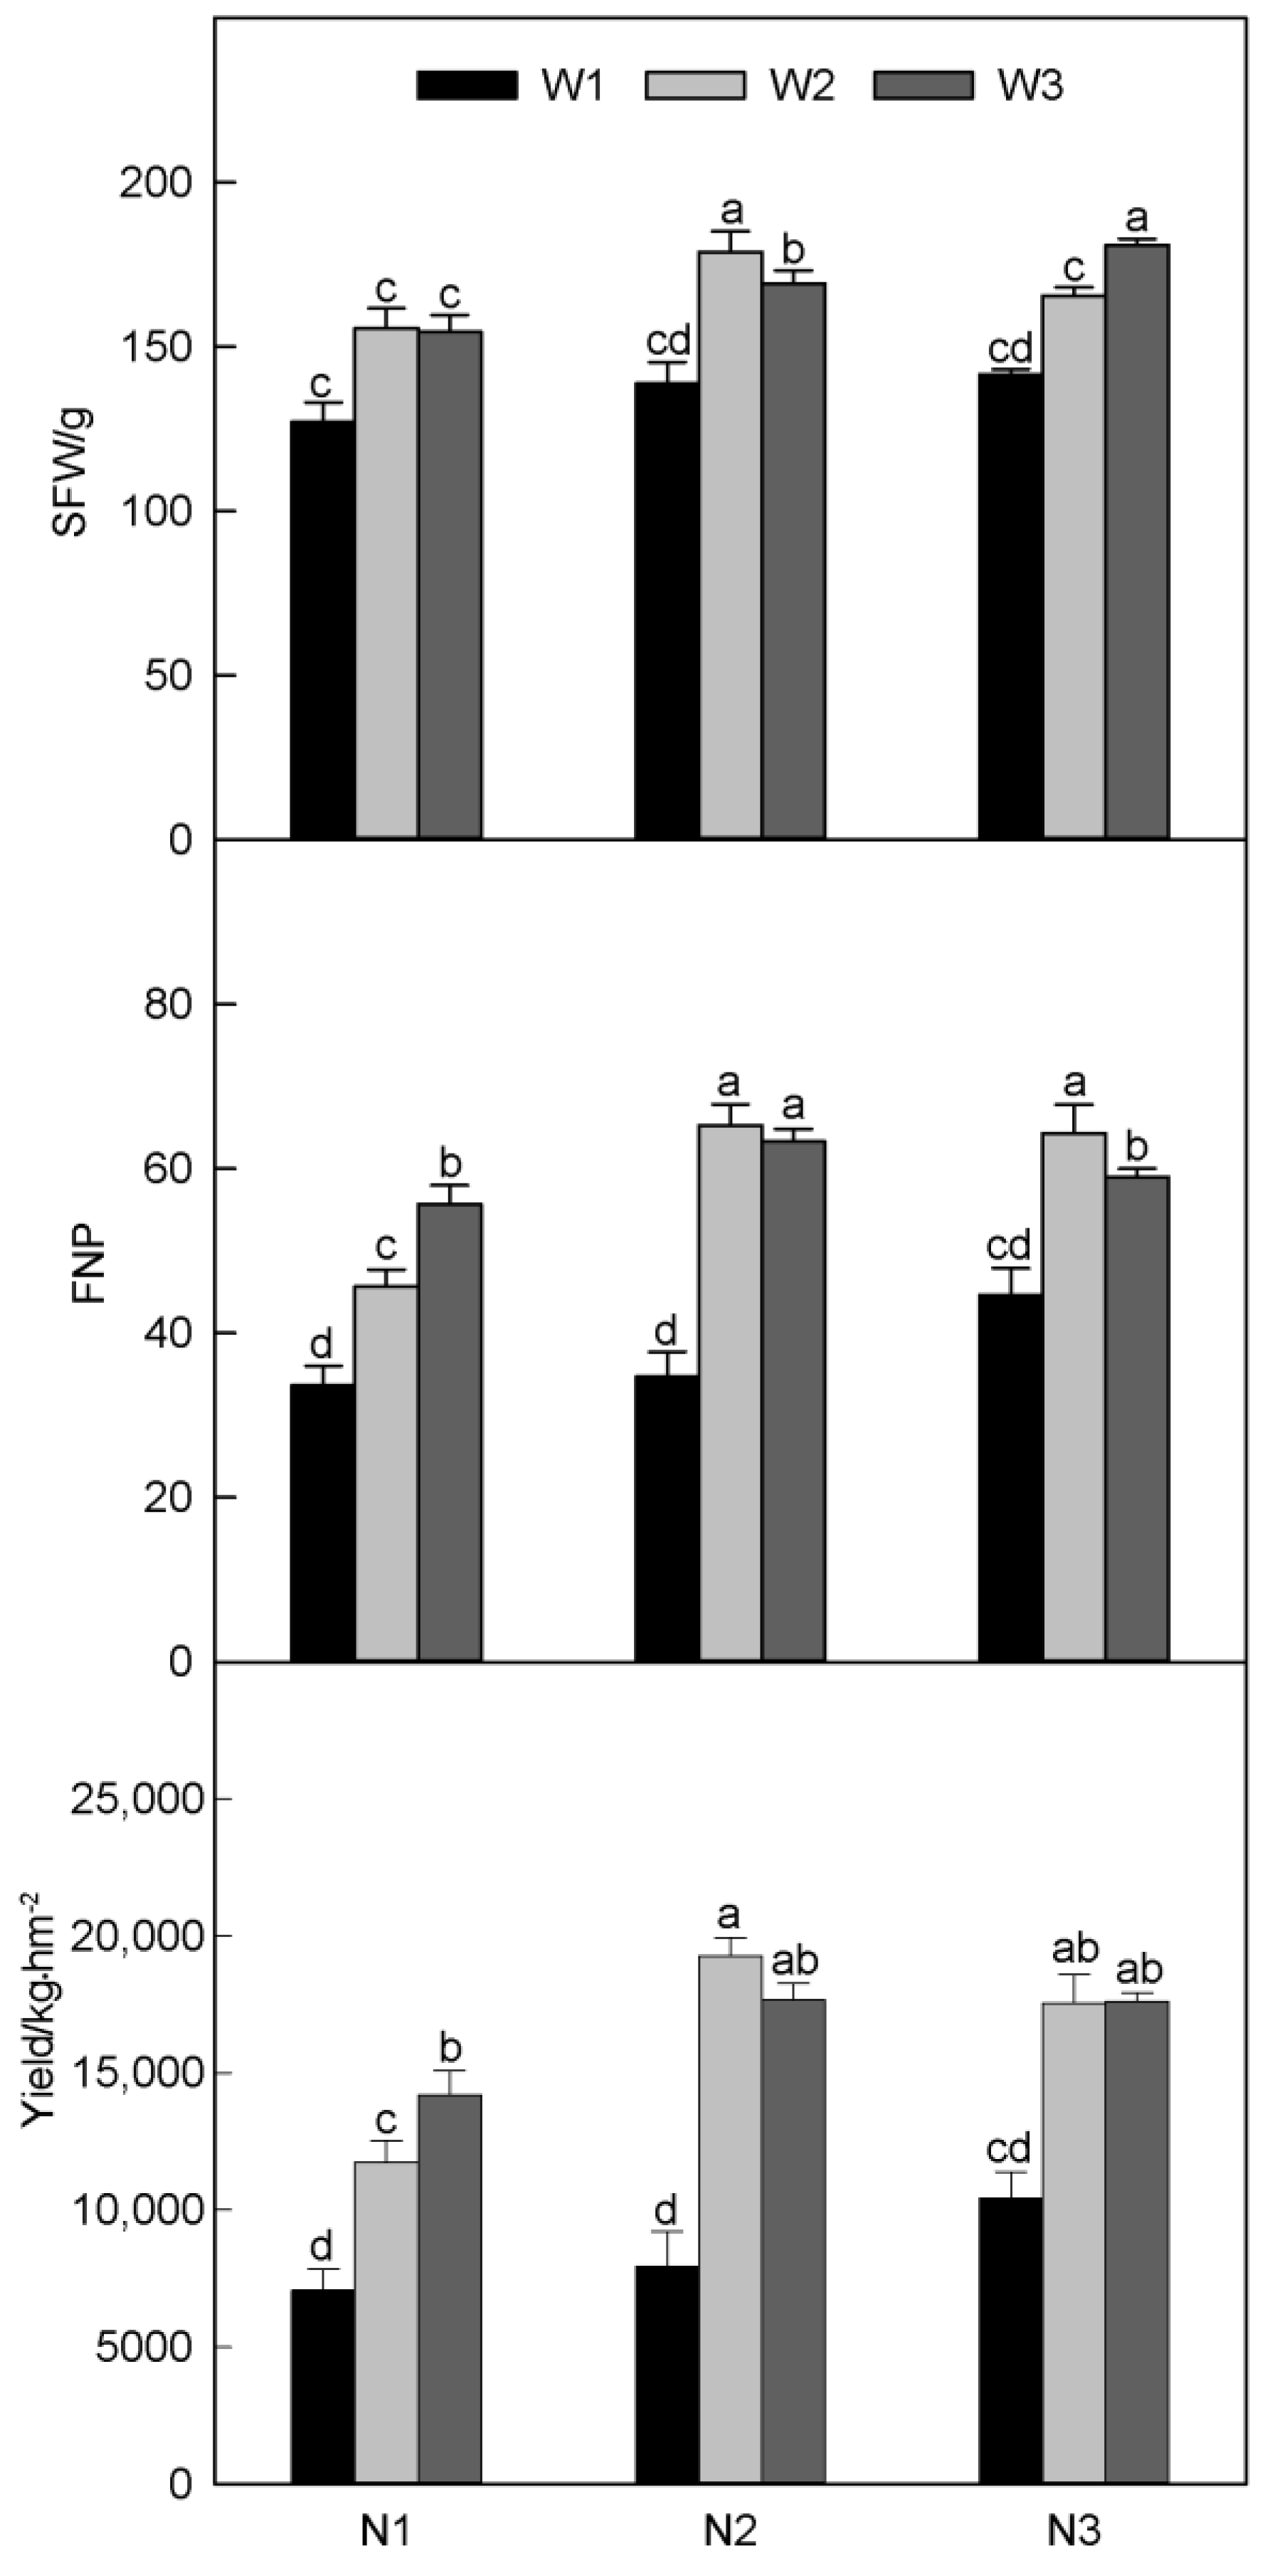
3.1. Effects of Nitrogen and Irrigation on Yield Indicators of Apple

The SFW, FNP, and apple Y were significantly affected by the amount of irrigation and nitrogen applied, but FNP was not sensitive to the interaction effects of irrigation and nitrogen. Notably, SFW, FNP, and Y all showed an upwards trend with increasing nitrogen and irrigation (Table 3). However, when the irrigation amount ranged from 70% to 90% field capacity, the apple yield did not increase or even decrease, implying that the benefit of irrigation on yield was significantly reduced when the irrigation amount was too high. For the different treatments, T9 (N3W3) had the highest SFW, which was significantly higher than that of T1 by 42.25% (N1W1, lowest treatment of SFW). However, the SFW of T5 (N2W2) was only 1.12% lower than that of T9 (Figure 3). Furthermore, both FNP and Y were highest in T5, but the difference between T5 and T6 (N3W2) for FNP was not evident, suggesting that an increase in irrigation did not significantly improve FNP when the nitrogen application was high (Figure 3). More importantly, T5 also had the largest FNP value, which was 8.93% higher than that of T6, indicating that Y did not increase significantly when the amount of nitrogen and irrigation were very high.

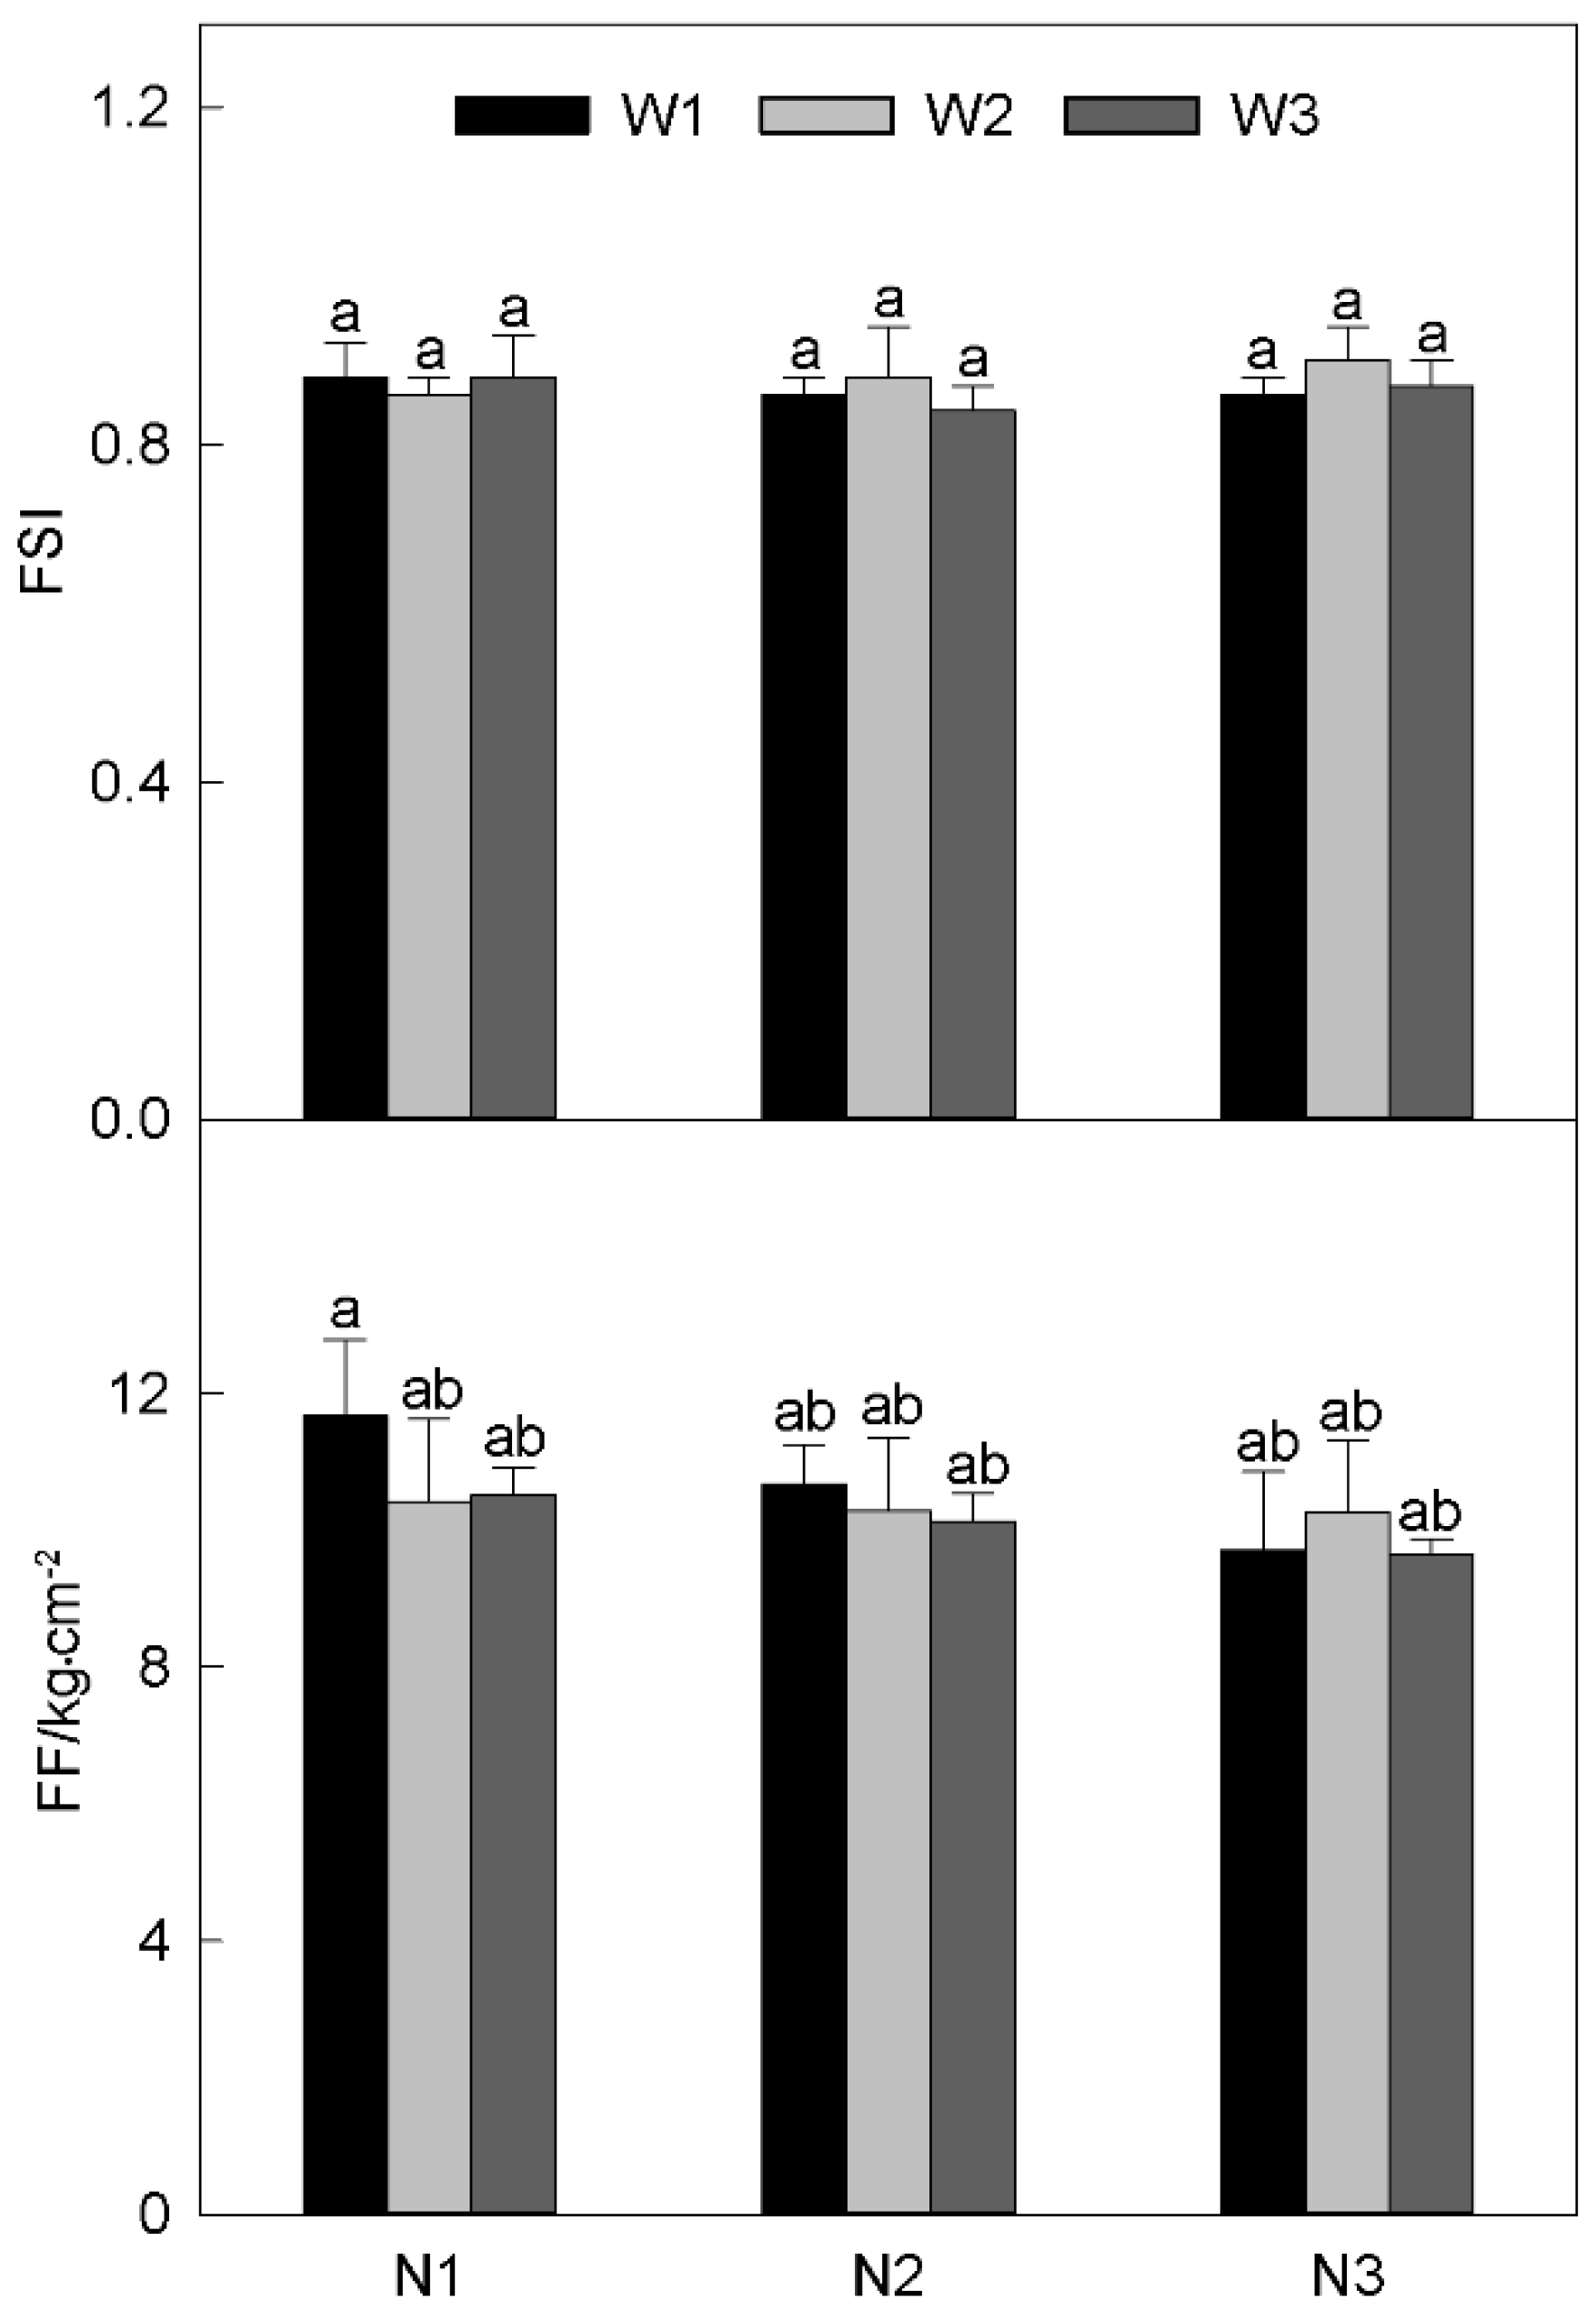
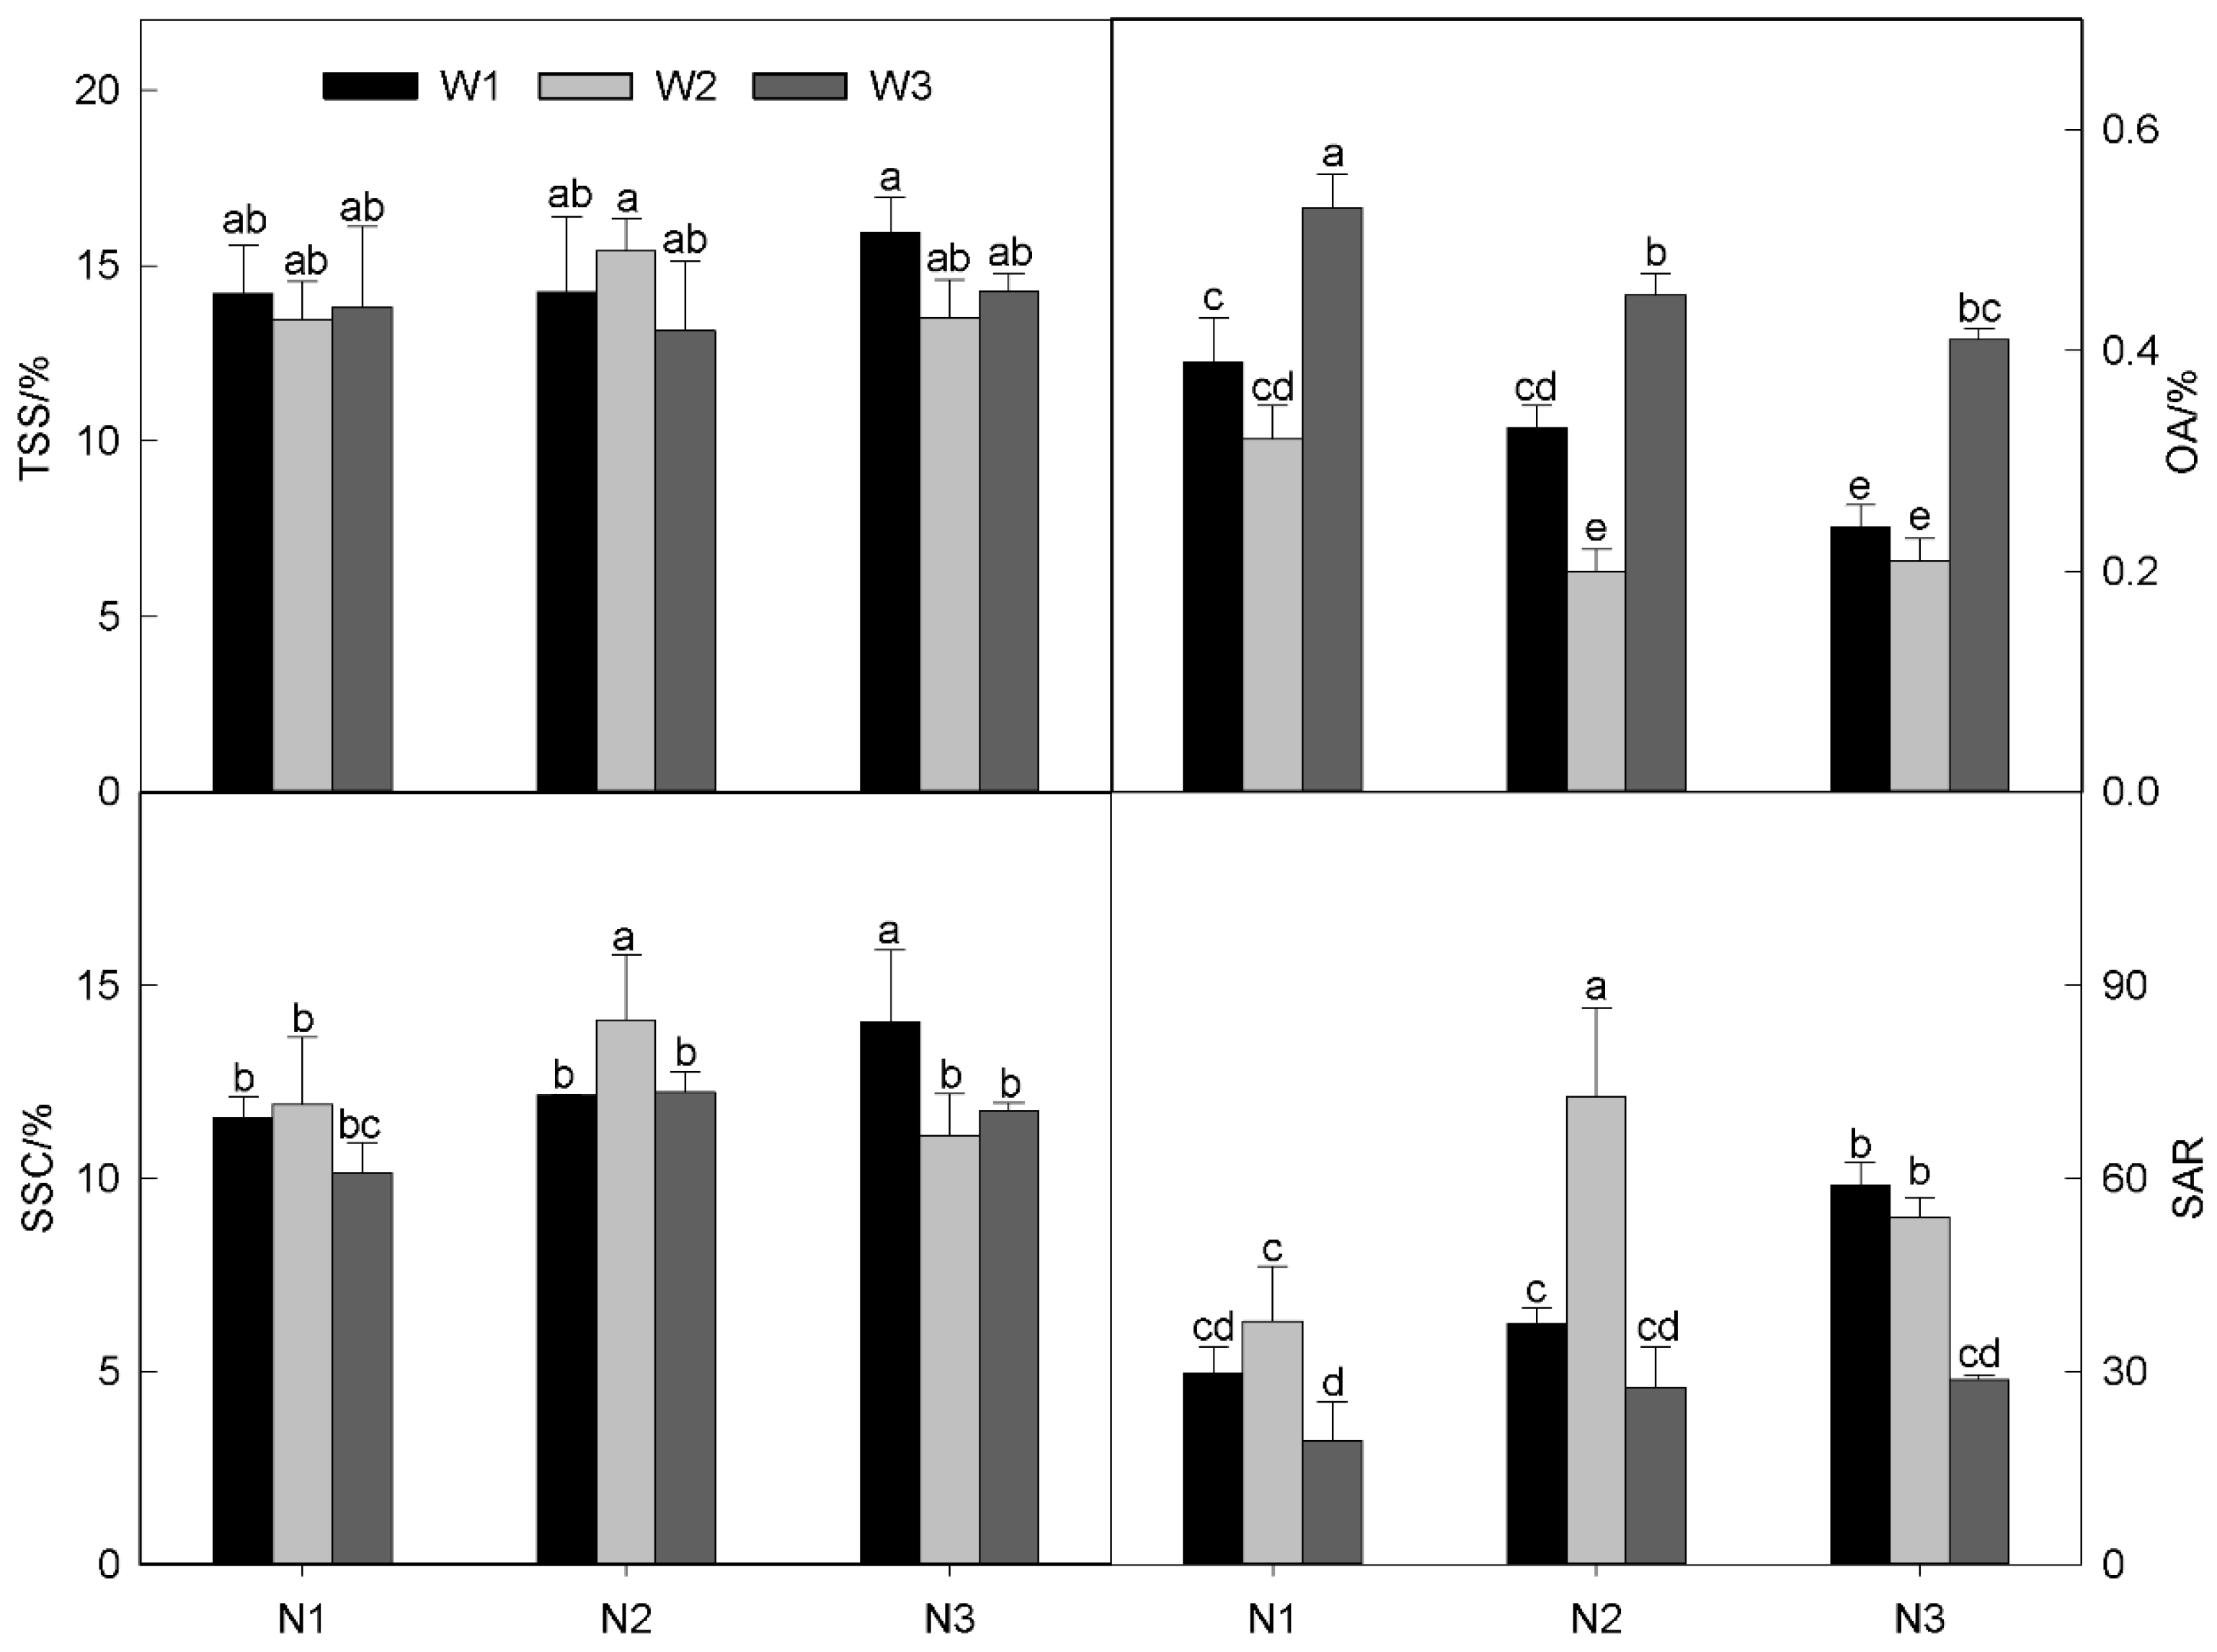
3.2. Effects of Nitrogen and Irrigation on Shape and Quality of Apple Fruit Indicators

Nitrogen, irrigation, and their interaction effects did not seem to have a noticeable effect on the FSI of apples (Table 3). The FSI of apple was not significantly different among all the treatments (Figure 4). The FF was only affected by nitrogen (N1 > N2 > N3) and was not sensitive to irrigation and the interaction effects because of p > 0.05 (Table 3). The largest FF was observed in T1 (N1W1, 11.67), which was 21.1% higher than that in T9 (N3W3, 9.64), which had the lowest value. However, other than T1, the FFs of the other treatments were not significantly different, indicating that nitrogen and irrigation also had limited effects on the FFs of apples (Figure 4).
Nitrogen and irrigation and their interactions significantly affected the TSS, and the rank was N3 > N2 >N1 and W1 > W2 > W3 (Table 3). Under nitrogen and irrigation interaction, T7 (N3W1) had the highest TSS, which was 21.32% higher than that of T6 (N2 W3). The TSS content of the apples increased with increasing nitrogen application and decreasing irrigation amount. The OA content of the apples was significantly affected by nitrogen and irrigation and their interaction (p < 0.001); that is, OA was extremely sensitive to changes in nitrogen and irrigation applications (Table 3). In all treatments, T3 (N1 W3) achieved the highest OA, and it was significantly higher than that of the other treatments. The OA of T5 was the lowest, but there was no significant difference between T5 (N2 W2) and T8 (N3 W2). The SSC of the apples was also significantly affected by nitrogen and irrigation and their interaction (Table 3). SSC first increased and then decreased as the nitrogen amount increased, but it continued to decline as the irrigation amount increased (Table 3). There were also differences in the responses of different SSC treatments to nitrogen and irrigation. Overall, T5 (N2 W2) had the highest SSC, and it was significantly higher than that of T3 (N1 W3) by 39.04%. Therefore, very high or very low amounts of nitrogen and irrigation had negative impacts on the SSC of apples (Figure 5). The SAR of the apples also showed similar trends in response to nitrogen application and irrigation. The SAR also increased gradually with increasing nitrogen application. However, the SAR showed a trend in which it first increased and then decreased with increasing irrigation amount. Among the different SAR treatments, the SAR of T5 (N2 W2) was significantly higher than that of the other treatments. T3 (N1 W3) achieved the lowest SAR among all treatments (Figure 5). Therefore, the SAR of apples was negatively affected when the amount of nitrogen was very low, or the irrigation level was very high.

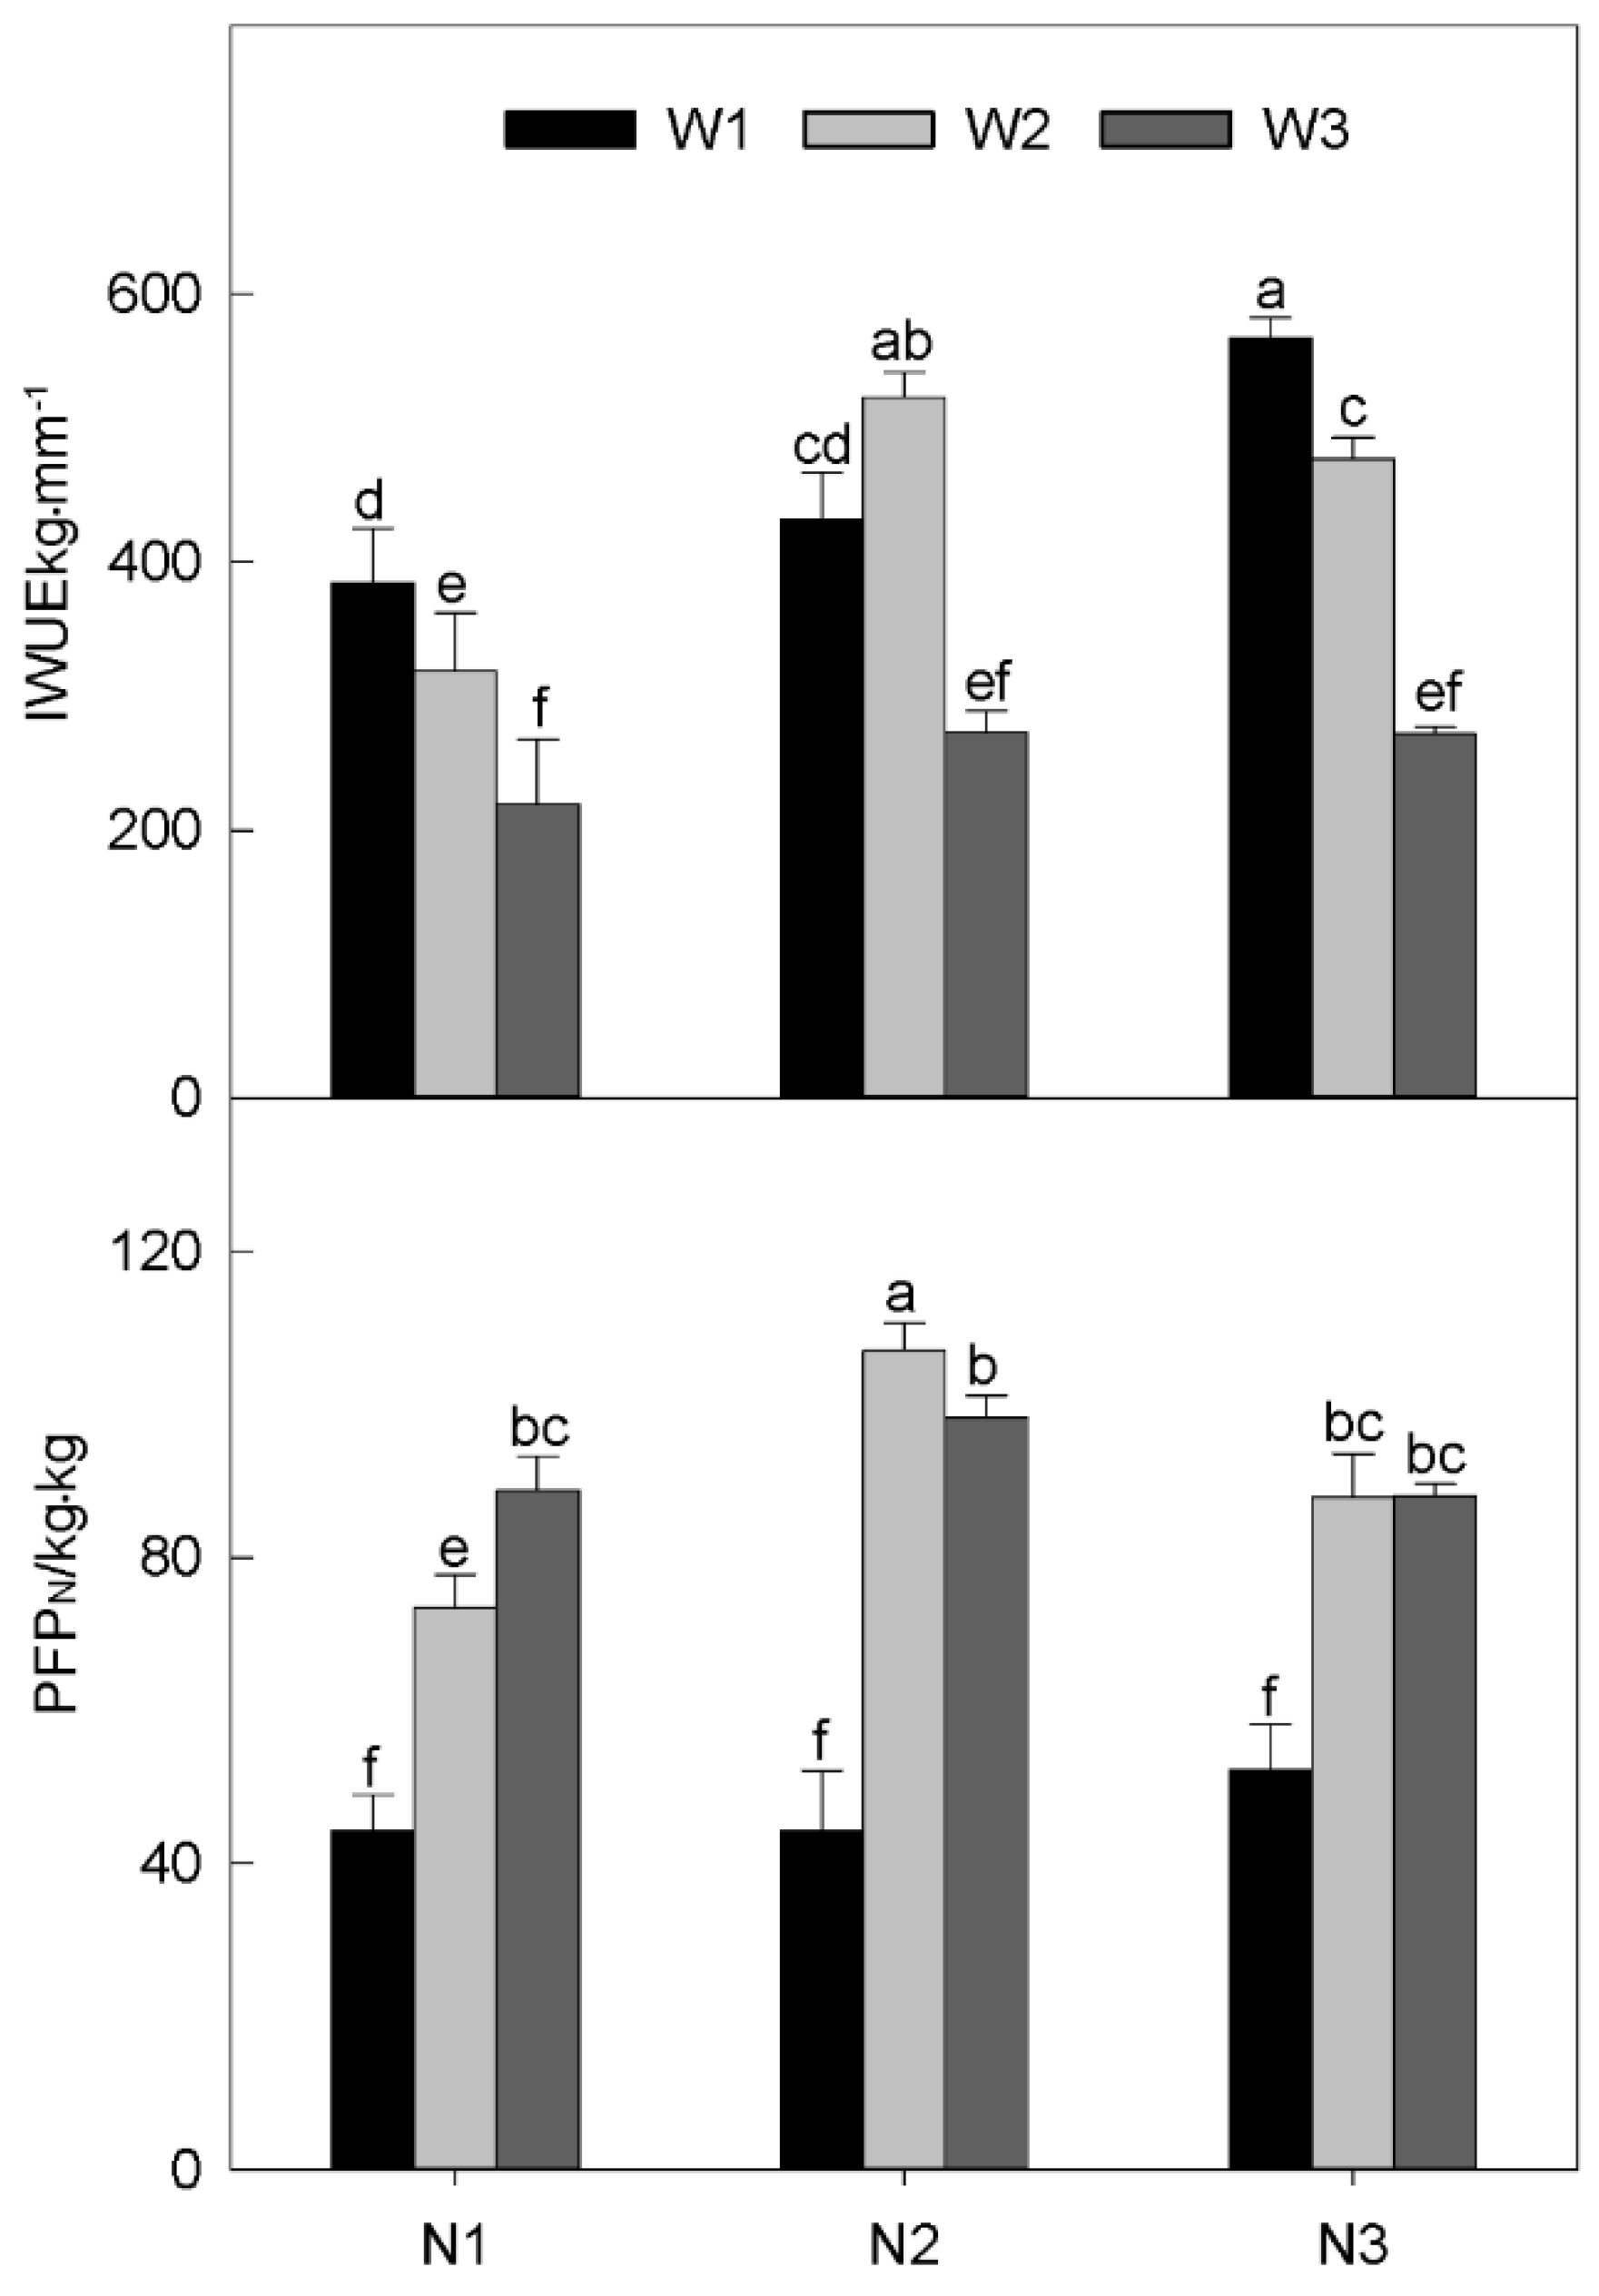
3.3. Effects of Nitrogen and Irrigation on the Apple Profit Index

Nitrogen and irrigation and their interaction significantly affected the IWUE. IWUE showed a downward trend with increasing irrigation (W1 > W2 > W3), and it also rose slowly with an increase in applied nitrogen (Table 3). For the different treatments, T7 (N3W1) exhibited the highest IWUE, and T3 (N1 W3) had the lowest of all treatments (Figure 6). Moreover, the PFPN was not significantly affected by irrigation and nitrogen but was affected by their interactions. A negative feedback effect existed between nitrogen application and PFPN; that is, PFPN first increased and then decreased with increasing nitrogen application. However, PFPN showed an upwards trend with increasing irrigation amount, indicating that irrigation had a positive feedback effect on PFPN (Table 3). T5 (N2W2) achieved the highest PFPN among all the treatments. Notably, the PFPN values of T1, T4, and T7 were nearly indistinguishable due to the low irrigation amount (Figure 6).

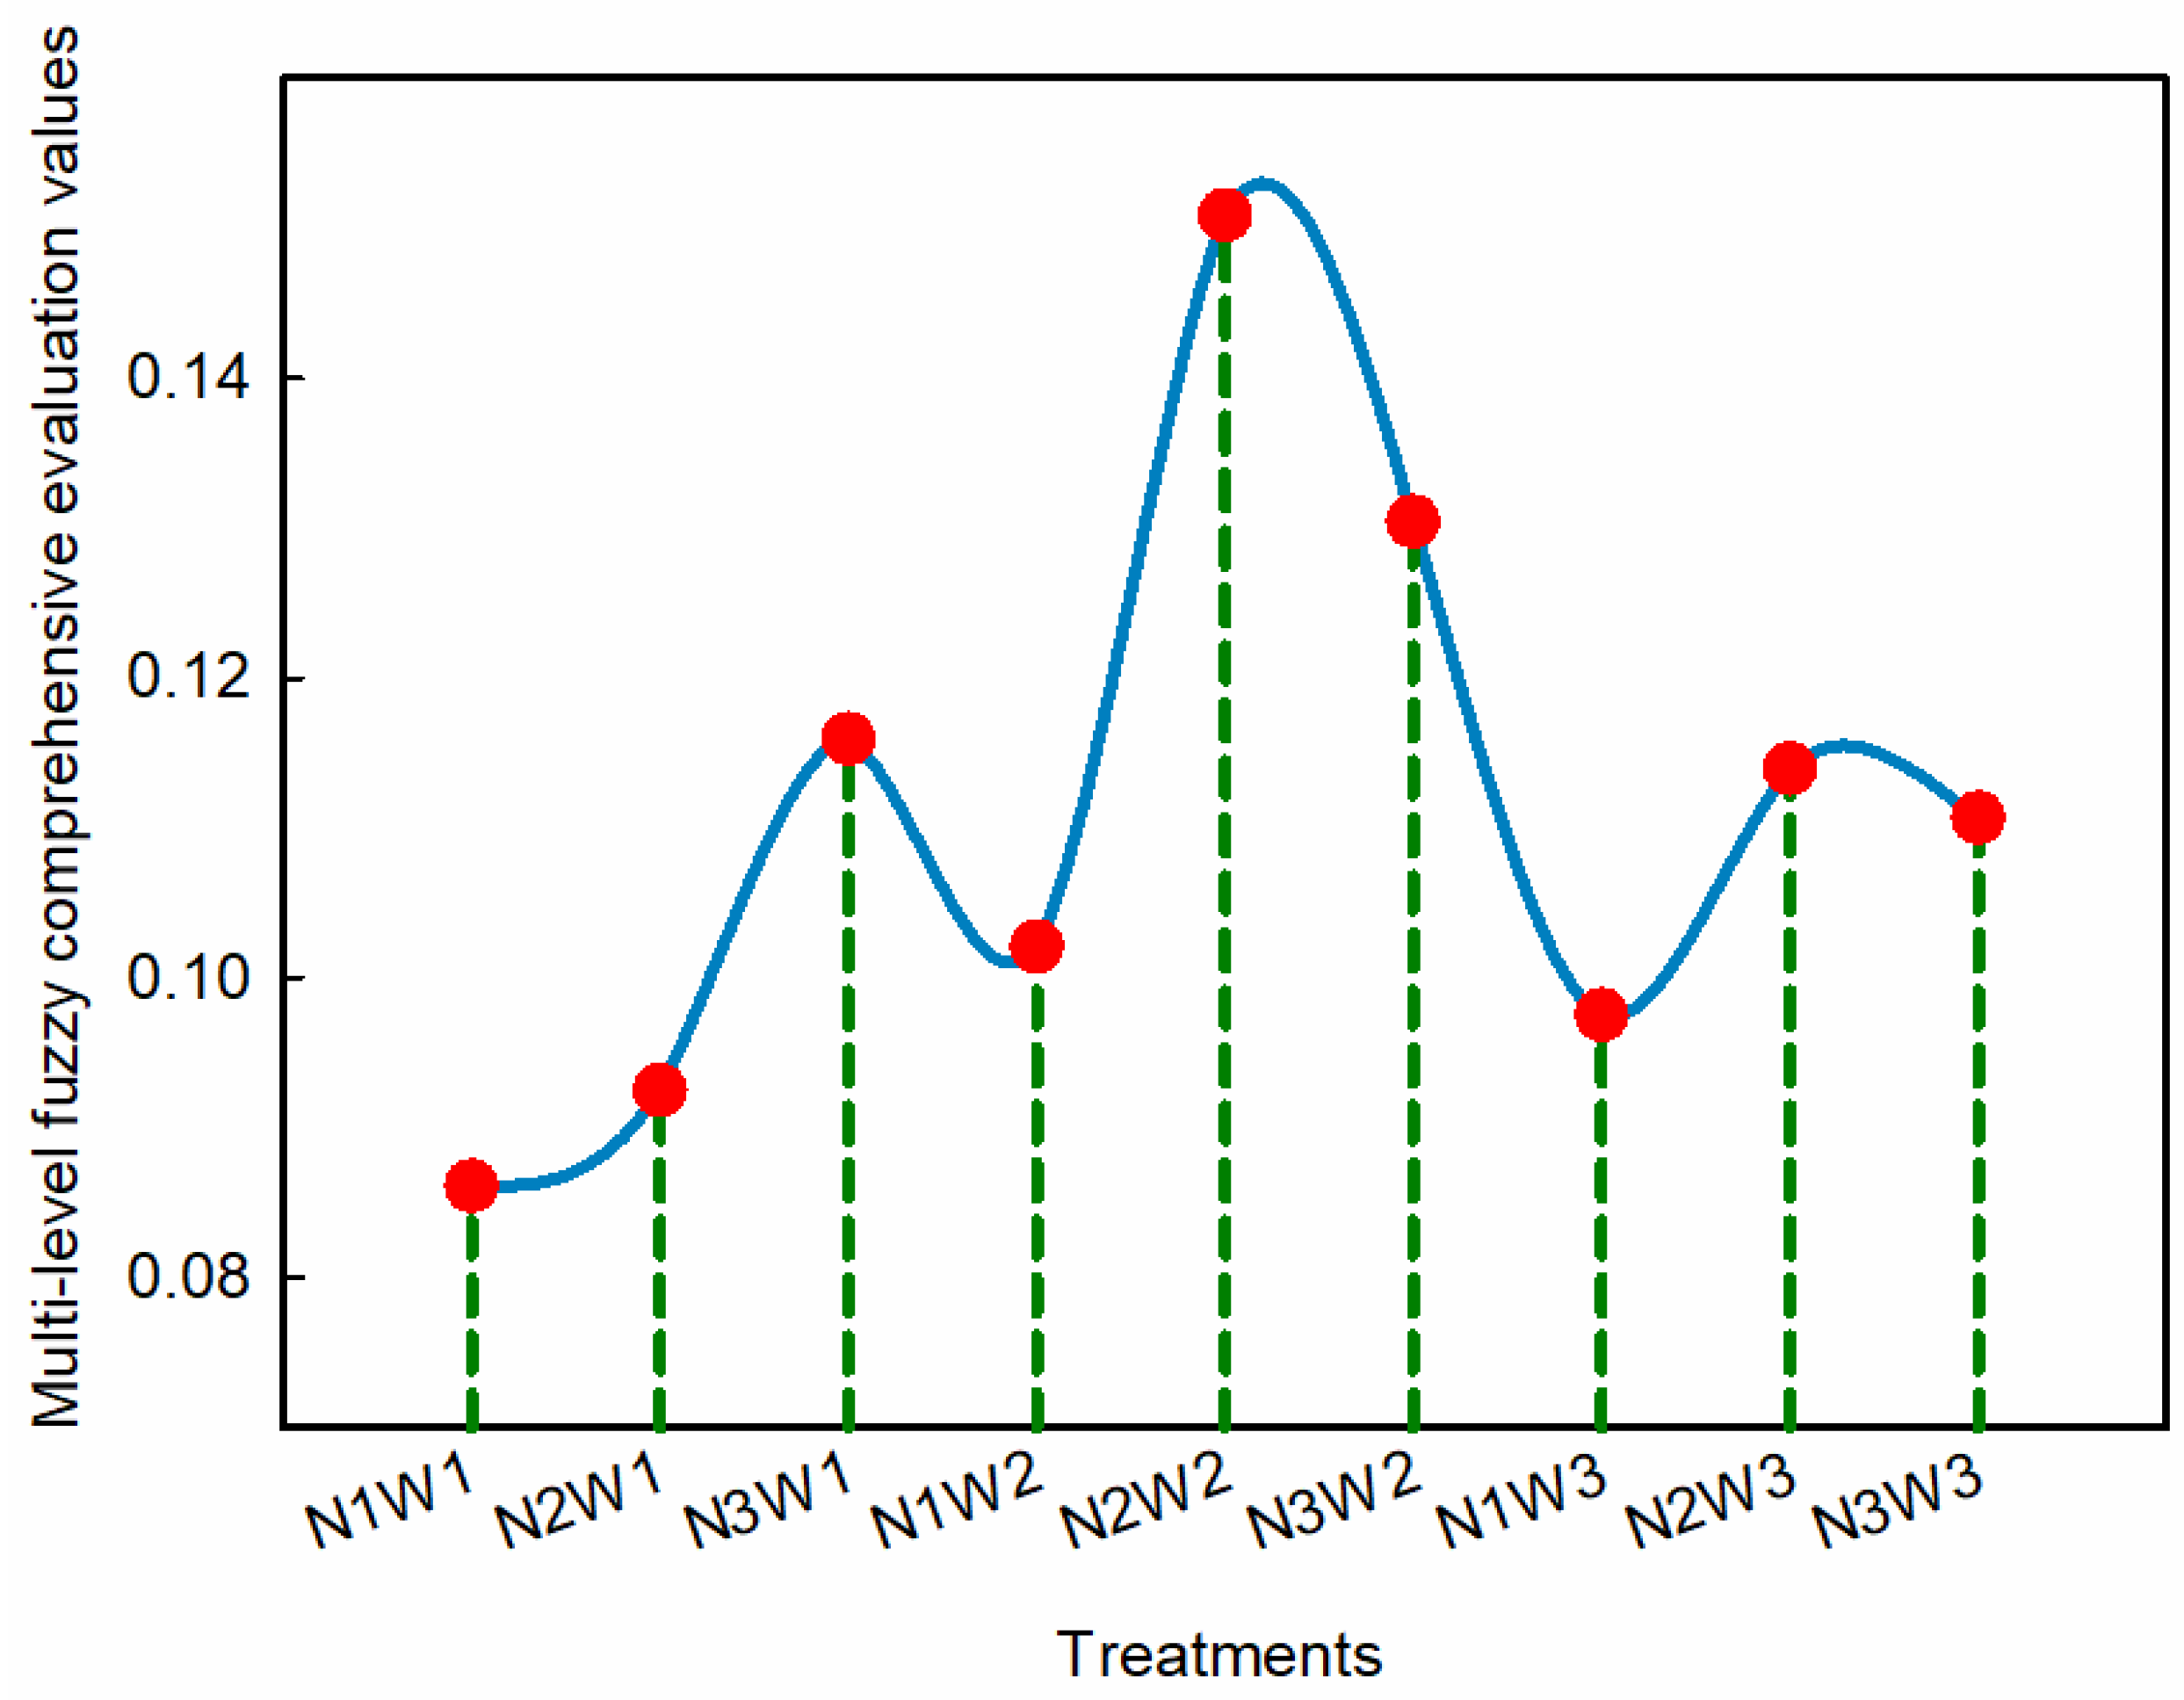
3.4. Comprehensive Evaluation of Apple Indicators Based on Multilevel Fuzzy Comprehensive Evaluation

We observed that nitrogen application and irrigation regulate different indicators in apples; therefore, coordinating the differences in all apple indicators based on nitrogen and irrigation is an important issue in plant management. The MFCE was used to assess the comprehensive growth of apples in Baishui. In terms of subjective weight (AHP method), yield indicators were considered the most important for the comprehensive growth of apples (0.324). The second most important indicator was the quality indicator of apples (0.304), followed by the profit indicator (0.247) and the shape of fruit indicator (0.125). Among the objective weights of all sub-indicators, the weight ranking was described as apple yield > FNP > SFW; FF > FSI; SAR > SSC > OA >TSS; PFPN > IWUE (Table 4). Therefore, apple yield, SAR, PFPN, and FF mainly affected the comprehensive growth of apples among all sub-indicators (Table 4). The MFCE method can yield a comprehensive evaluation value for all treatments based on the AHP and entropy method (Figure 7). In other words, the amount of nitrogen and irrigation applied in treatment was most favorable for the comprehensive growth of apples when the MFCE value was the highest. Therefore, the amount of nitrogen and irrigation in T5 (N2 W2) were most favorable for the comprehensive growth of apples because this treatment had the highest MFCE value. T1 (N1W1) was most unfavorable for the comprehensive growth of apples. Similarly, excessive amounts of nitrogen and irrigation were not conducive to the comprehensive growth of apples.

3.5. Responses in the Comprehensive Growth of Apples to the Coupling of Nitrogen and Water Based on Multilevel Fuzzy Comprehensive Evaluation

After obtaining the MFCE values of all treatments, we constructed a comprehensive apple growth model based on the amount of nitrogen and irrigation and the MFCE values of all treatments. Specifically, we constructed a multiple linear regression model using the “LM” function in R language, which was fitted between the standardized MFCE values (y) and nitrogen (x1) and irrigation (x2). The quadratic polynomial regression equation used to determine the effects of nitrogen and irrigation on the comprehensive growth of apples was described as follows:
y = −18.3400 + 0.9379x1 + 0.1813x2 − 0.0007x12 − 0.0004x22 − 0.0001x1x2
where y is the standardized MFCE value, x1 is the amount of nitrogen, and x2 is the amount of irrigation. In this model, the coefficient of determination (R2) of y was calculated as 0.801, and the regression was significant at the 0.01 level (p-value = 0.002).
For the effect of nitrogen or irrigation on the comprehensive growth of apples, the MFCE value of apples increased gradually and then decreased slowly with increasing nitrogen amount. Therefore, a very low nitrogen amount was not conducive to the comprehensive growth of apples, but increasing the nitrogen amount within a certain threshold significantly improved the MFCE value of apples (Figure 8). However, the MFCE value of apples first increased and then decreased with increasing irrigation amount. That is, a very high or very low irrigation amount was not conducive to the comprehensive growth of apples. For the coupled effect of nitrogen and irrigation there was a positive feedback effect between nitrogen and irrigation; that is, a coupling effect promoted the comprehensive growth of apples, within which an increase in nitrogen also promoted the comprehensive growth of apples. However, there was a negative feedback effect between irrigation and nitrogen amount when the amount of irrigation was gradually increased. Overall, controlling the amount of irrigation and increasing the amount of nitrogen fertilizer within a certain threshold could help the comprehensive growth of apples. Therefore, we carried out a simulated optimization to model the comprehensive growth of apples. The “expand.grid” function in R language was mainly used to construct a grid interval for nitrogen and irrigation. Then, we invoked the comprehensive growth model to yield the optimal combination of nitrogen and irrigation, that is, the combination at which the largest MFCE value was obtained. The nitrogen and irrigation interval was set to more than 90% of the optimal value to ensure the applicability of the final results for actual production management. From the simulation analysis, the optimal amounts of nitrogen and irrigation were 170.5–189.5 kg·hm−2 and 38.4–42.7 mm, respectively.

4. Discussion

Water and fertilizer are very important for the growth of crops, so inappropriate amounts of water and fertilizer have adverse impacts on the growth, yield, and quality of crops [30,31,32]. There were differences in the response of apple yield indicators to nitrogen fertilizer application and irrigation. The SFW, FNP, and apple yield all increased with increasing nitrogen application and irrigation (Table 3). However, when the nitrogen application level was very high, the yield of apples was significantly affected, indicating that the nitrogen amount must be controlled within a reasonable range to ensure apple yield [33,34]. Interaction between nitrogen application and irrigation also significantly affected apple yield. We found that apple yields improved when irrigation was at high levels and nitrogen was at medium levels (Figure 3). Overall, when the nitrogen levels were very high, the apple yields were not significantly improved with increased irrigation [35,36]. This may be because an increase in nitrogen is more conducive to the synthesis of protein in apples, resulting in a reduced supply of carbohydrates. The shape of the fruit appeared to be insensitive to nitrogen and irrigation and their interactions, and few significant changes were observed among the treatments (Figure 4). This was probably because apple shape is mainly controlled by the cultivar genotype, and our study did not contain fertilizer- and irrigation-limited treatments [37,38].
The market value of apples is affected not only by the yield but also by the quality of the fruit, which is also an important indicator. The quality of the apple fruits was significantly affected by nitrogen and irrigation and their interaction (Table 3). Appropriate amounts of nitrogen application can improve the content of the TSS, SSC, and SAR in apple fruits, but organic acids (OA) decreased significantly with increasing nitrogen application (Figure 5). An increase in irrigation amount reduced the quality of apple fruits; in contrast, a moderate irrigation deficit helped improve the quality of apple fruits [39,40]. In this study, both the TSS and SSC decreased with increasing irrigation amount, but OA showed a trend in which it first increased and then decreased (Table 3). The quality of apple fruits was significantly improved when the irrigation amount was low. Plants experience different degrees of drought stress signals at different irrigation levels. During drought stress, plants change their distribution of sources and sinks, inducing changes in the protein, starch, and mineral elements in the fruits [41,42,43]. For the apple profit index, the IWUE and PFPN were clearly and significantly affected by irrigation and nitrogen application, respectively (Table 3). The IWUE of T7 was the highest of all the treatments, but the difference between T5 and T7 was minimal. The PFPN of T5 also had optimal values. Therefore, nitrogen and irrigation levels that are very high or very low may have adverse effects on the profit index [44,45]. In fact, the quality of apple fruits was affected not only by irrigation and nitrogen but also by the duration of open-air storage after harvest. In addition, the concentration of CO2 in the environment can also significantly affect the quality of apple fruits [46,47].
Because each indicator had different responses to irrigation and fertilizer, it was difficult to accurately and efficiently regulate irrigation and fertilizer during production management [48,49]. Therefore, we used the MFCE method to comprehensively assess the comprehensive growth of apples. Previous researchers have used a variety of evaluation methods to evaluate the growth and development of agricultural crops, but the differences in the evaluation methods have yielded different results because of the different subjective or objective methods applied [50]. Therefore, we also used subjective (AHP) and objective (entropy) weights to calculate the apple MFCE values [25,51]. Subjective weights mainly indicated that the yield and quality of apple indicators had the greatest impact on the comprehensive growth of apples (Table 4). The objective weight of the sub-indicators indicated that the apple yield, FF, SAR, and PFPN had greater impacts on the comprehensive growth of apples. The final results also indicated that the largest MFCE value occurred in T5, which ranked in the top three for yield and quality indicators among all treatments (Figure 7). Subsequently, we evaluated the effect of irrigation and fertilizer coupling on the comprehensive growth of apples. We found that the coupling effect of nitrogen and irrigation significantly promoted the comprehensive growth of apples when irrigation was below a medium level. However, the MFCE value of apples showed a downward trend when irrigation was above a medium level, and the nitrogen application was at a high level (Figure 8). In fact, other studies have shown that excessive amounts of nitrogen application and irrigation can reduce apple yield and quality, respectively [52,53,54]. Therefore, we obtained the optimal amount of nitrogen application and irrigation for apples in the Loess Plateau, and these were obtained based on the comprehensive evaluation of apples. The results of this study may differ from those of others, possibly due to the age and variety of the apple trees or their geographical location. However, the MFCE method systematically and scientifically considers different indicators related to various aspects of apples; thus, the final result is credible.

5. Conclusions

We focused on the effect of nitrogen application and irrigation regulation on different apple indicators and found that the indicators had different responses to nitrogen application and irrigation. Then, we used the MFCE to comprehensively evaluate the growth of apples. The yield indicators had the greatest impact on the comprehensive growth of apples, followed by fruit quality indicators, while the shape of fruit indicators had the lowest impact. Then, we analyzed the effect of nitrogen and irrigation coupling and found that nitrogen and irrigation showed a positive effect on the comprehensive growth of apples when the irrigation amount was low. However, nitrogen and irrigation had a negative effect on the comprehensive growth of apples when irrigation was at high levels. After simulating and optimizing the comprehensive growth model for apples, we recommend nitrogen application and irrigation rates of 170.5–189.5 kg·hm−2 and 38.4–42.7 mm, respectively.
Although MFCE can yield optimal irrigation and nitrogen management practices, only one apple cultivar was used in this study, so the applicability of the results might be limited. In the future, the water and fertilizer management strategies for different apple cultivars should be optimized.
Overall, we consider our method to be applicable for assessing irrigation and nitrogen levels for apples and other crops. We also believe that our results play an important role in guiding nitrogen and irrigation strategies for the efficient usage of nitrogen and irrigation for apple cultivation on the Loess Plateau, China.

Author Contributions

Conceptualization, B.Z. (Bingnian Zhai) and S.C.; methodology, B.Z. (Bingnian Zhai); software, B.Z. (Bangyu Zheng); validation, S.C., and B.Z. (Bingnian Zhai); formal analysis, Z.Z. (Zhiyuan Zhao); investigation, N.Y.; resources, Z.Z. (Zhaoxia Zheng); data curation, Z.Z. (Zhiyuan Zhao); writing—original draft preparation, S.C.; writing—review and editing, S.C.; visualization, S.C.; supervision, Z.Z. (Zhaoxia Zheng); project administration, B.Z. (Bingnian Zhai); funding acquisition, B.Z. (Bingnian Zhai). All authors have read and agreed to the published version of the manuscript.

Funding

This research was funded by the Earmarked Fund for China Agriculture Research System (CARS-27) and the Major Project of Science and Technology of Shaanxi (2020zdzx03-02-01).

Data Availability Statement

The data and computer codes used in this study can be provided by the corresponding author upon request.

Acknowledgments

The author thanks the following individuals for their assistance with the project: Shang Chen and Zhihao He (Key Laboratory of Plant Nutrition and the Agri-environment in Northwest China).

Conflicts of Interest

The authors declare no conflict of interest.

References

  1. Fu, B.J.; Liu, Y.; Lu, Y.H.; He, C.S.; Zeng, Y.; Wu, B.F. Assessing the soil erosion control service of ecosystems change in the Loess Plateau of China. Ecol. Complex. 2011, 8, 284–293. [Google Scholar] [CrossRef]
  2. Li, Y.Y.; Shao, M.A. Change of soil physical properties under long-term natural vegetation restoration in the Loess Plateau of China. J. Arid. Environ. 2006, 64, 77–96. [Google Scholar] [CrossRef]
  3. Chen, H.S.; Shao, M.G.; Li, Y.Y. Soil desiccation in the Loess Plateau of China. Geoderma 2008, 143, 91–100. [Google Scholar] [CrossRef]
  4. Shi, H.; Shao, M.G. Soil and water loss from the Loess Plateau in China. J. Arid. Environ. 2000, 45, 9–20. [Google Scholar] [CrossRef] [Green Version]
  5. Chen, L.D.; Wei, W.; Fu, B.J.; Lu, Y.H. Soil and water conservation on the Loess Plateau in China: Review and perspective. Prog. Phys. Geogr. Earth Environ. 2007, 31, 389–403. [Google Scholar] [CrossRef]
  6. Liu, J.G.; Li, S.X.; Ouyang, Z.Y.; Tam, C.; Chen, X.D. Ecological and socioeconomic effects of China’s policies for ecosystem services. Proc. Natl. Acad. Sci. USA 2008, 105, 9477–9482. [Google Scholar] [CrossRef] [Green Version]
  7. FAOSTAT. Food and Agriculture Organization of the United Nations (FAO). Available online: https://www.fao.org/faostat/zh/#data/QCL (accessed on 20 November 2022).
  8. Jian, S.Q.; Zhao, C.Y.; Fang, S.M.; Yu, K. Effects of different vegetation restoration on soil water storage and water balance in the Chinese Loess Plateau. Agric. For. Meteorol. 2015, 206, 85–96. [Google Scholar] [CrossRef]
  9. Zhong, Y.; Fei, L.J.; Li, Y.B.; Zeng, J.; Dai, Z.G. Response of fruit yield, fruit quality, and water use efficiency to water deficits for apple trees under surge-root irrigation in the Loess Plateau of China. Agric. Water Manag. 2019, 222, 221–230. [Google Scholar] [CrossRef]
  10. Fentabil, M.M.; Nichol, C.F.; Jones, M.D.; Neilsen, G.H.; Neilsen, D.; Hannam, K.D. Effect of drip irrigation frequency, nitrogen rate and mulching on nitrous oxide emissions in a semi-arid climate: An assessment across two years in an apple orchard. Agric. Ecosyst. Environ. 2016, 235, 242–252. [Google Scholar] [CrossRef]
  11. Tahir, I.I.; Johansson, E.; Olsson, M.E. Improvement of quality and storability of apple cv. Aroma by adjustment of some pre-harvest conditions. Sci. Hortic. 2007, 112, 164–171. [Google Scholar] [CrossRef]
  12. Kowalczyk, W.; Wrona, D.; Przybylko, S. Content of minerals in soil, apple tree leaves and fruits depending on nitrogen fertilization. J. Elem. 2017, 22, 67–77. [Google Scholar] [CrossRef]
  13. Li, Y.K.; Xue, X.Z.; Guo, W.Z.; Wang, L.C.; Duan, M.J.; Chen, H.; Chen, F. Soil moisture and nitrate-nitrogen dynamics and economic yield in the greenhouse cultivation of tomato and cucumber under negative pressure irrigation in the North China Plain. Sci. Rep. 2019, 9, 9. [Google Scholar] [CrossRef] [Green Version]
  14. Topcu, S.; Kirda, C.; Dasgan, Y.; Kaman, H.; Cetin, M.; Yazici, A.; Bacon, M.A. Yield response and N-fertiliser recovery of tomato grown under deficit irrigation. Eur. J. Agric. 2007, 26, 64–70. [Google Scholar] [CrossRef]
  15. Wang, H.; Li, J.; Cheng, M.; Zhang, F.; Wang, X.; Fan, J.; Wu, L.; Fang, D.; Zou, H.; Xiang, Y. Optimal drip fertigation management improves yield, quality, water and nitrogen use efficiency of greenhouse cucumber. Sci. Hortic. 2019, 243, 357–366. [Google Scholar] [CrossRef]
  16. Kumar, A.; Pramanick, B.; Mahapatra, B.S.; Singh, S.P.; Shukla, D.K. Growth, yield and quality improvement of flax (Linum usitattisimum L.) grown under tarai region of Uttarakhand, India through integrated nutrient management practices. Ind. Crops Prod. 2019, 140, 111710. [Google Scholar] [CrossRef]
  17. Ramananjatovo, T.; Chantoiseau, E.; Guillermin, P.; Guenon, R.; Delaire, M.; Buck-Sorlin, G.; Cannavo, P. Growth of Vegetables in an Agroecological Garden-Orchard System: The Role of Spatiotemporal Variations of Microclimatic Conditions and Soil Properties. Agron. Basel 2021, 11, 1888. [Google Scholar] [CrossRef]
  18. Raese, J.T. Response of apple and pear trees to nitrogen, phosphorus, and potassium fertilizers. J. Plant Nutr. 1998, 21, 2671–2696. [Google Scholar] [CrossRef]
  19. Raese, J.T.; Drake, S.R.; Curry, E.A. Nitrogen fertilizer influences fruit quality, soil nutrients and cover crops, leaf color and nitrogen content, biennial bearing and cold hardiness of ‘Golden Delicious’. J. Plant Nutr. 2007, 30, 1585–1604. [Google Scholar] [CrossRef]
  20. Kuhn, B.F.; Bertelsen, M.; Sorensen, L. Optimising quality-parameters of apple cv. ‘Pigeon’ by adjustment of nitrogen. Sci. Hortic. 2011, 129, 369–375. [Google Scholar] [CrossRef]
  21. Kucukyumuk, C.; Kacal, E.; Yildiz, H. Effects of Different Deficit Irrigation Strategies on Yield, Fruit Quality and Some Parameters: ‘Braeburn’ Apple Cultivar. Not. Bot. Horti Agrobot. Cluj-Napoca 2013, 41, 510–517. [Google Scholar] [CrossRef] [Green Version]
  22. Chenafi, A.; Monney, P.; Arrigoni, E.; Boudoukha, A.; Carlen, C. Influence of irrigation strategies on productivity, fruit quality and soil-plant water status of subsurface drip-irrigated apple trees. Fruits 2016, 71, 69–78. [Google Scholar] [CrossRef] [Green Version]
  23. Yu, N.; Zhang, Y.-l.; Zou, H.-t.; Huang, Y.; Zhang, Y.-l.; Dang, X.-l.; Yang, D. Fuzzy evaluation of different irrigation and fertilization on growth of greenhouse tomato. In Proceedings of the Fuzzy Information and Engineering; Springer: Berlin/Heidelberg, Germany, 2007; pp. 980–987. [Google Scholar]
  24. Wu, C.-K. A game theory approach for assessing risk value and deploying search-and-rescue resources after devastating tsunamis. Environ. Res. 2018, 162, 18–26. [Google Scholar] [CrossRef]
  25. Li, S.P.; Gong, Q.X.; Yang, S. A Sustainable, Regional Agricultural Development Measurement System Based on Dissipative Structure Theory and the Entropy Weight Method: A Case Study in Chengdu, China. Sustainability 2019, 11, 5313. [Google Scholar] [CrossRef] [Green Version]
  26. Tao, Y.; Li, Y.; Zhou, R.; Chu, D.-T.; Su, L.; Han, Y.; Zhou, J. Neuro-fuzzy modeling to predict physicochemical and microbiological parameters of partially dried cherry tomato during storage: Effects on water activity, temperature and storage time. J. Food Sci. Technol. 2016, 53, 3685–3694. [Google Scholar] [CrossRef] [Green Version]
  27. He, Z.H.; Hong, T.T.; Cai, Z.L.; Yang, Z.; Li, M.N.; Zhang, Z. Determination of amount of irrigation and nitrogen for comprehensive growth of greenhouse cucumber based on multi-level fuzzy evaluation. Int. J. Agric. Biol. Eng. 2021, 14, 35–42. [Google Scholar] [CrossRef]
  28. Yao, X.; Deng, H.; Zhang, T.; Qin, Y. Multistage fuzzy comprehensive evaluation of landslide hazards based on a cloud model. PLoS ONE 2019, 14, e0224312. [Google Scholar] [CrossRef] [PubMed] [Green Version]
  29. IUSS Working Group WRB. World Reference Base for Soil Resources. International Soil Classification System for Naming Soils and Creating Legends for Soil Maps, 4th ed.; International Union of Soil Sciences (IUSS): Vienna, Austria, 2022; p. 234. [Google Scholar]
  30. De Pascale, S.; Maggio, A.; Orsini, F.; Barbieri, G. Cultivar, soil type, nitrogen source and irrigation regime as quality determinants of organically grown tomatoes. Sci. Hortic. 2016, 199, 88–94. [Google Scholar] [CrossRef]
  31. Dordas, C.A.; Sioulas, C. Safflower yield, chlorophyll content, photosynthesis, and water use efficiency response to nitrogen fertilization under rainfed conditions. Ind. Crop. Prod. 2008, 27, 75–85. [Google Scholar] [CrossRef]
  32. Neilsen, G.H.; Neilsen, D.; Herbert, L.C.; Hogue, E.J. Response of apple to fertigation of N and K under conditions susceptible to the development of K deficiency. J. Am. Soc. Hortic. Sci. 2004, 129, 26–31. [Google Scholar] [CrossRef]
  33. Milosevic, T.; Milosevic, N. Apple fruit quality, yield and leaf macronutrients content as affected by fertilizer treatment. J. Soil Sci. Plant Nutr. 2015, 15, 76–83. [Google Scholar]
  34. Fallahi, E.; Neilsen, D.; Neilsen, G.H.; Fallahi, B.; Shafii, B. Efficient Irrigation for Optimum Fruit Quality and Yield in Apples. Hortscience 2010, 45, 1616–1619. [Google Scholar] [CrossRef] [Green Version]
  35. Ebel, R.C.; Proebsting, E.L.; Evans, R.G. Apple tree and fruit responses to early termination of irrigation in a semi-arid environment. Hortscience 2001, 36, 1197–1201. [Google Scholar] [CrossRef] [Green Version]
  36. Ucar, Y.; Kadayifci, A.; Askin, M.A.; Kankaya, A.; Senyigit, U.; Yildirim, F. Yield and Quality Response of Young ‘Gala, Galaxy’ Trees under Different Irrigation Regimes. Erwerbs-Obstbau 2016, 58, 159–167. [Google Scholar] [CrossRef]
  37. Fallahi, E.; Fallahi, B.; Kiester, M.J. Evapotranspiration-based Irrigation Systems and Nitrogen Effects on Yield and Fruit Quality at Harvest in Fully Mature ‘Fuji’ Apple Trees over Four Years. Hortscience 2018, 53, 38–43. [Google Scholar] [CrossRef]
  38. Hajnajari, H.; Akbari, H.; Abdossi, V. Genesis of ultra-specialized histology with stable traits in mesophyll of drought tolerant apple cultivars. Sci. Hortic. 2019, 249, 168–176. [Google Scholar] [CrossRef]
  39. Lopez, G.; Boini, A.; Manfrini, L.; Torres-Ruiz, J.M.; Pierpaoli, E.; Zibordi, M.; Losciale, P.; Morandi, B.; Corelli-Grappadelli, L. Effect of shading and water stress on light interception, physiology and yield of apple trees. Agric. Water Manag. 2018, 210, 140–148. [Google Scholar] [CrossRef]
  40. Kilili, A.W.; Behboudian, M.H.; Mills, T.M. Composition and quality of ‘Braeburn’ apples under reduced irrigation. Sci. Hortic. 1996, 67, 1–11. [Google Scholar] [CrossRef]
  41. Christmann, A.; Weiler, E.W.; Steudle, E.; Grill, E. A hydraulic signal in root-to-shoot signalling of water shortage. Plant J. 2007, 52, 167–174. [Google Scholar] [CrossRef]
  42. Coyago-Cruz, E.; Meléndez-Martínez, A.J.; Moriana, A.; Girón, I.F.; Martín-Palomo, M.J.; Galindo, A.; Pérez-López, D.; Torrecillas, A.; Beltrán-Sinchiguano, E.; Corell, M. Yield response to regulated deficit irrigation of greenhouse cherry tomatoes. Agric. Water Manag. 2019, 213, 212–221. [Google Scholar] [CrossRef]
  43. Sandhu, O.S.; Gupta, R.K.; Thind, H.S.; Jat, M.L.; Sidhu, H.S.; Yadvinder, S. Drip irrigation and nitrogen management for improving crop yields, nitrogen use efficiency and water productivity of maize-wheat system on permanent beds in North-West India. Agric. Water Manag. 2019, 219, 19–26. [Google Scholar] [CrossRef]
  44. Zhong, F.; Hou, M.; He, B.; Chen, I. Assessment on the coupling effects of drip irrigation and organic fertilization based on entropy weight coefficient model. PeerJ 2017, 5, e3855. [Google Scholar] [CrossRef] [PubMed] [Green Version]
  45. Wang, F.; Ge, S.F.; Lyu, M.X.; Liu, J.Q.; Li, M.; Jiang, Y.; Xu, X.X.; Xing, Y.; Cao, H.; Zhu, Z.L.; et al. DMPP reduces nitrogen fertilizer application rate, improves fruit quality, and reduces environmental cost of intensive apple production in China. Sci. Total Environ. 2022, 802, 149813. [Google Scholar] [CrossRef] [PubMed]
  46. Drake, S.R.; Eisele, T.A. Quality of ‘Gala’ apples as influenced by harvest maturity, storage atmosphere and concomitant storage with ‘Bartlett’ pears. J. Food Qual. 1997, 20, 41–51. [Google Scholar] [CrossRef]
  47. Thewes, F.R.; Both, V.; Brackmann, A.; Weber, A.; Anese, R.D. Dynamic controlled atmosphere and ultralow oxygen storage on ‘Gala’ mutants quality maintenance. Food Chem. 2015, 188, 62–70. [Google Scholar] [CrossRef] [Green Version]
  48. He, Z.H.; Su, C.J.; Cai, Z.L.; Wang, Z.; Li, R.; Liu, J.C.; He, J.Q.; Zhang, Z. Multi-factor coupling regulation of greenhouse environment based on comprehensive growth of cherry tomato seedlings. Sci. Hortic. 2022, 297, 110960. [Google Scholar] [CrossRef]
  49. Hou, M.M.; Lin, Z.Y.; Chen, J.N.; Zhai, Y.M.; Jin, Q.; Zhong, F.L. Optimization on theBuried Depth of Subsurface Drainage under Greenhouse Condition Based on Entropy Evaluation Method. Entropy 2018, 20, 859. [Google Scholar] [CrossRef] [Green Version]
  50. Wang, Q.S.; Yuan, X.L.; Zhang, J.; Gao, Y.; Hong, J.L.; Zuo, J.; Liu, W. Assessment of the Sustainable Development Capacity with the Entropy Weight Coefficient Method. Sustainability 2015, 7, 13542–13563. [Google Scholar] [CrossRef] [Green Version]
  51. Kundu, S.; Khare, D.; Mondal, A. Landuse change impact on sub-watersheds prioritization by analytical hierarchy process (AHP). Ecol. Inform. 2017, 42, 100–113. [Google Scholar] [CrossRef]
  52. Miranda, J.M.D.; Cavalcante, I.H.L.; Oliveira, I.V.D.; Lopes, P.R.C. Advances on apple production under semiarid climate: N fertigation. Emir. J. Food Agric. 2015, 27, 744–748. [Google Scholar] [CrossRef] [Green Version]
  53. Tian, G.; Li, H.-F.; Tian, M.; Liu, X.-X.; Chen, Q.; Zhu, Z.-L.; Jiang, Y.-M.; Ge, S.-F. Effects of different integration of water and fertilizer modes on the absorption and utilization of nitrogen fertilizer and fruit yield and quality of apple trees. Ying Yong Sheng Tai Xue Bao J. Appl. Ecol. 2020, 31, 1867–1874. [Google Scholar] [CrossRef]
  54. Dai, Z.G.; Fei, L.J.; Zeng, J.; Huang, D.L.; Liu, T. Optimization of water and nitrogen management for surge-root irrigated apple trees in the Loess Plateau of China. J. Integr. Agric. 2021, 20, 260–273. [Google Scholar] [CrossRef]
Figure 1. Meteorological information from the experimental site in Baishui, Shaanxi Province, China. Radiation (grey line), rain (blue line), maximum temperature (red line), and minimum temperature (green line) were recorded daily in 2021.
Water 15 00468 g001
Figure 2. The comprehensive hierarchical evaluation system for apples in Baishui, Shaanxi Province, China. The a1–a4 is yield, the shape of the fruit, the fruit quality indicators, and the profit index, respectively. The a11 is the single fruit weight (SFW), a12 is fruit number per plant (FNP), a13 is the apple yield (Y); a21 is the fruit shape index (FSI), a22 is the fruit firmness (FF); a31 is the total soluble solids (TSS), a32 is the organic acids (OA), a33 is the soluble sugar content (SSC), a34 is the sugar-acid ratio (SAR); a41 is the irrigation water use efficiency (IWUE), and a42 is the partial factor productivity of applied N (PFPN).
Water 15 00468 g002
Figure 3. Single fruit weight (SFW), fruit number per plant (FNP), and yield (Y) are influenced by irrigation (W1, W2, and W3) and nitrogen (N1, N2, and N3). Error bars indicate the standard error of the mean values (n = 3). The different letters for each data point represent the differences between the treatments based on Duncan’s analysis at p < 0.05. The statistical comparisons between different factors are listed in Table 3.
Water 15 00468 g003
Figure 4. Fruit shape index (FSI) and fruit firmness (FF) as influenced by irrigation (W1, W2, and W3) and nitrogen (N1, N2, and N3). The error bars indicate the standard error of the mean values (n = 3). The different letters for each data point represent the differences between the treatments based on Duncan’s analysis at p < 0.05. The statistical comparisons between different factors are listed in Table 3.
Water 15 00468 g004
Figure 5. Total soluble solids (TSS), organic acids (OA), soluble sugar content (SSC), and sugar-acid ratio (SAR) as influenced by irrigation (W1, W2, and W3) and nitrogen (N1, N2, and N3). The error bars indicate the standard error of the mean values (n = 3). The different letters for each data point represent the differences between the treatments based on Duncan’s analysis at p < 0.05. The statistical comparisons between different factors are listed in Table 3.
Water 15 00468 g005
Figure 6. Irrigation water use efficiency (IWUE) and partial factor productivity of applied N (PFPN) as influenced by irrigation (W1, W2, and W3) and nitrogen (N1, N2, and N3). The error bars indicate the standard error of the mean values (n = 3). The different letters for each data point represent the differences between the treatments based on Duncan’s analysis at p < 0.05. The statistical comparisons between different factors are listed in Table 3.
Water 15 00468 g006
Figure 7. Multilevel comprehensive fuzzy evaluation value of all treatments of apple in Baishui, Shaanxi province, China.
Water 15 00468 g007
Figure 8. Interactive effects of irrigation and N fertilizer application on the comprehensive growth of apples in Baishui, Shaanxi Province, China. The x, y, and z axes represent the values for irrigation, N fertilization, and standardized comprehensive evaluation based on the multilevel fuzzy comprehensive evaluation method. The depth of the color bar denotes the size of the standardized comprehensive evaluation value.
Water 15 00468 g008
Table 1. Soil nutrient concentrations in the initial soil profile (0–100 cm soil layer at the experimental site at Baishui, Shaanxi province, China).
LayerpHSOMNitrate−NAmmonia−NPaKaSBDPWPFC
0−20 cm8.2214.4041.741.5912.00410.681.4410.422.39
20−40 cm8.2911.9527.461.284.66502.031.5510.424.76
40−60 cm8.0311.325.240.914.10480.201.3411.525.24
60−80 cm8.1412.120.40.863.85402.351.5012.826.30
80−100 cm8.2811.818.20.853.24380.211.5614.326.10
Note: pH is the value of Pondus Hydrogenii; SOM is soil organic matter (g∙kg−1); nitrate-N is the nitrate nitrogen content of the soil (mg∙kg−1); ammonia-N is ammonia nitrogen content of the soil (mg∙kg−1); Pa is available phosphorus content of the soil (mg∙kg−1); Ka is available potassium content of the soil (mg∙kg−1); SBD is soil bulk density (g∙cm−3); PWP is the permanent wilting point (%); FC is the field capacity (%).
Table 2. Amounts of irrigation and N fertilizer at the experimental site in Baishui, Shaanxi Province, China.
TreatmentNitrogen
Level
Amount of
Nitrogen/kg·hm−2
Irrigation
Level
Amount of
Irrigation/mm
T1N1160W1 (50% Δf)18.4
T2N218018.4
T3N320018.4
T4N1160W2(70% Δf)36.8
T5N218036.8
T6N320036.8
T7N1160W3(90% Δf)64.8
T8N218064.8
T9N320064.8
Note: Δf is the amount of water required to irrigate a 0–60 cm soil layer from 50%, 70%, and 90% to 100% field capacity.
Table 3. Effect of different levels of nitrogen application (N) and irrigation (W) and their interaction effects (N × W) on different apple indicators in Baishui, Shaanxi Province, China.
FactorsSFWFNPYFSIFFTSSOASSCSARIWUEPFPN
N1145.73 b45.00 c11,004.57 c0.8710.86 a13.82 b0.41 a11.21 b28.87 b307.54 b68.78 c
N2162.24 a54.44 ab14,964.26 ab0.8610.36 a14.26 a0.32 b12.83 a45.82 a409.43 ab83.13 a
N3162.60 a56.00 a15,202.94 a0.889.87 b14.57 a0.29 c12.30 a47.21 a438.80 a76.01 b
W1135.81 b37.67 b8488.28 b0.8710.6814.79 a0.32 b12.59 a42.02 b461.32 a46.86 b
W2166.59 a58.44 a16,188.54 a0.8810.3214.12 b0.24 c12.38 a54.81 a439.91 ab89.40 a
W3168.19 a59.33 a16,494.95 a0.8610.0913.73 b0.46 a11.38 b25.09 c254.55 c91.66 a
N***ns*************
W***nsns*************
N × W*ns*nsns***********
Note: SFW is the single fruit weight (g), FNP is the fruit number per plant, Y is the apple yield (kg∙hm−2); FSI is the fruit shape index, FF is the fruit firmness (kg∙cm−2); TSS is the total soluble solids (%), OA is the organic acids (%), SSC is the soluble sugar content (%), SAR is the sugar-acid ratio; IWUE is the irrigation water use efficiency (kg∙mm−1), PFPN is the partial factor productivity of applied N (kg∙kg−1). The letters after values indicate significant differences after ANOVA based on Duncan’s analysis. In addition, * = p < 0.05, ** = p < 0.01, *** = p < 0.001, ns = no significance.
Table 4. Subjective weights of factors and objective weights of subfactors based on AHP and entropy method.
Treatmenta1a2a3a4
a11a12a13a21a22a31a32a33a34a41a42
N1W10.0900.0720.0570.1120.1250.1110.1280.1060.0810.1110.065
N2W10.0980.0740.0640.1100.1140.1110.1070.1110.1020.1250.065
N3W10.1000.0960.0850.1100.1040.1250.0780.1290.1610.1640.076
N1W20.1100.0980.0950.1100.1120.1050.1030.1090.1030.0920.107
N2W20.1270.1400.1560.1120.1100.1200.0640.1290.1990.1510.156
N3W20.1170.1380.1420.1150.1100.1060.0670.1020.1480.1380.128
N1W30.1090.1190.1150.1120.1130.1080.1730.0930.0520.0630.130
N2W30.1200.1360.1430.1070.1090.1030.1450.1120.0750.0790.144
N3W30.1280.1270.1430.1110.1030.1120.1340.1080.0780.0780.129
AHP0.3240.1250.3040.247
Entropy0.0730.3150.6130.1120.8880.0130.0360.3690.5820.4990.501
Note: a1–a4 is the yield, shape of the fruit, fruit quality indicators, and profit index, respectively. The a11 is the single fruit weight (SFW), a12 is fruit number per plant (FNP), a13 is the apple yield (Y); a21 is the fruit shape index (FSI), a22 is the fruit firmness (FF); a31 is the total soluble solids (TSS), a32 is the organic acids (OA), a33 is the soluble sugar content (SSC), a34 is the sugar-acid ratio (SAR); a41 is the irrigation water use efficiency (IWUE), and a42 is the partial factor productivity of applied N (PFPN). Regarding the AHP method, the consistency ratio index (CR) is 0.027 < 0.1, so subjective weights are reasonable.
Disclaimer/Publisher’s Note: The statements, opinions and data contained in all publications are solely those of the individual author(s) and contributor(s) and not of MDPI and/or the editor(s). MDPI and/or the editor(s) disclaim responsibility for any injury to people or property resulting from any ideas, methods, instructions or products referred to in the content.

