Article

Predictive Model Based on K-Nearest Neighbor Coupled with the Gray Wolf Optimizer Algorithm (KNN_GWO) for Estimating the Amount of Phenol Adsorption on Powdered Activated Carbon

1
Laboratoire de Recherche sur le Médicament et le Développement Durable (ReMeDD), Faculté de Génie des Procédés, Université de Salah BOUBNIDER Constantine 3, Constantine 25000, Algeria
2
Laboratory of Biomaterials and Transport Phenomena (LBMPT), University of MÉDÉA, Nouveau Pôle Urbain, Médéa 26000, Algeria
3
Research Unit on Analysis and Technological Development in Environment (URADTE-CRAPC), BP 384, Bou-Ismail, Tipaza 42004, Algeria
4
Laboratoire E2Lim, Université de Limoges, 123 Avenue Albert Thomas, 87060 Limoges, France
5
Ecole Nationale Supérieure de Chimie de Rennes, University of Rennes, CNRS, ISCR—UMR6226, 35000 Rennes, France
6
Laboratory of Management and Valorization of Natural Resources and Quality Assurance, SNVST Faculty, Akli Mohand Oulhadj University, Bouira 10000, Algeria
*
Authors to whom correspondence should be addressed.
Water 2023, 15(3), 493; https://doi.org/10.3390/w15030493
Submission received: 14 November 2022 / Revised: 18 January 2023 / Accepted: 20 January 2023 / Published: 26 January 2023
(This article belongs to the Special Issue Adsorption Technology for Water and Wastewater Treatments)

Abstract

:
In this work, the adsorption mechanism of phenol on activated carbon from aqueous solutions was investigated. Batch experiments were performed as a function of adsorbent rate, solution temperature, phenol initial concentration, stirring speed, and pH. The optimal operating condition of phenol adsorption were: mass/volume ratio of 0.6 g.L−1, temperature of 20 °C and stirring speed of 300 rpm. The equilibrium data for the adsorption of phenol were analyzed by Langmuir, Freundlich, and Temkin isotherm models. It was found that the Freundlich and Temkin isotherm models fitted well the phenol adsorption on the activated carbon and that the adsorption process is favorable. The Langmuir equilibrium isotherm provides a maximum adsorption of 156.26 mg.g−1 at 20 °C. The pseudo-first-order, pseudo-second-order, intraparticle diffusion, and Boyd models were used to fit the kinetic data. The adsorption kinetics data were well described by the pseudo-second-order model. The kinetic was controlled by the external diffusion by macropore and mesopore, as well as by the micropore diffusion. The thermodynamic study revealed the exothermic and spontaneous nature of phenol adsorption on activated carbon with increased randomness at the solid-solution interface. On the other hand, a very large model based on the optimization parameters of phenol adsorption using k-nearest neighbor coupled with the gray wolf optimizer algorithm was launched to predict the amount of phenol adsorption. The KNN_GWO model showed an advantage in giving more precise values related to very high statistical coefficients (R = 0.9999, R2 = 0.9998 and R2adj = 0.9998) and very low statistical errors (RMSE = 0, 0070, MSE = 0.2347 and MAE = 0.2763). These advantages show the efficiency and performance of the model used.

1. Introduction

Water is the major constituent of our planet and is of great importance for living beings (humans, animals, and plants) for the balance of the aquatic ecosystems. Water is covering about 70% of the earth’s surface, which is why we call the earth the Blue Planet. However, 97.5% of this water is salty; it represents the oceans, the seas, and some groundwater, while only 2.5% of all the water on earth is fresh water.
About 2.1% of the world’s freshwater is in the form of polar ice and permanent snow in the mountains, so it is not available for consumption or agricultural uses. The very small remaining percentage of freshwater is estimated at 0.4%, of which one-third is groundwater hidden in the earth’s crust and often difficult to access [1]. This low percentage of this vital source has reduced and continues to be threatened year after year, as the consequences of climate change impact the planet, on the one hand, and on the other hand, by pollution caused by industrial and agricultural activities. In addition, urban wastes include many toxic substances that contribute strongly to the degradation of freshwater quality and limited access to water resources.
Water pollution is a major concern and is tied to the top worry of states and organizations for the protection of the aquatic environment. Among the emerging chemicals of concern and greatest risks to the aquatic environment are phenol and phenolic compounds. These tend to enter and persist extensively in the environmental ecosystem, accumulate and exert toxic effects on humans and animals [2].
The presence of phenol in the aquatic environment is mainly due to discharges from the plastics, dyes, pulp, and paper industries [3]. Phenols are also released from the industries of solid fuel gasification, crude oil processing, phytosanitary chemicals, pharmaceutical plants, perfume-manufacturing industries, disinfectants, and insecticides [4]. Due to their wide use, phenols or phenolic compounds are released with the effluents of these industries. This often leads to the contamination of groundwater and surface water. Phenol and phenolic compounds are not easily biodegradable, due to their resistance and complex structure; they constitute a major menace to public health and the aquatic environment [5].
Phenol is toxic to aquatic organisms, plants, and humans at concentrations of 5 μg.L−1 [6,7]. Intoxication and ingestion of phenol into the human body can occur through the skin, inhalation, or ingestion of phenol-contaminated products (water, foods that have been treated with phenol, etc.). Inhalation of phenol vapors can cause pulmonary edema, while prolonged contact with the skin can cause pulmonary edema and burns. Chronic exposure to phenol causes oral irritation, visual disturbances, diarrhea, deep necrosis, cardiac dysrhythmias, respiratory distress, metabolic acidosis, renal failure, and methemoglobinemia; in the most complicated cases, it causes cardiovascular shock, coma, and can even result in death [6,7,8,9]. Therefore, the World Health Organization (WHO) recommends that the maximum allowable concentration of phenol in drinking water should be less than 1 μg.L−1 [6,8].
Thus, the elimination of this generated toxic pollutant from the industries requires the implementation of reliable and efficient treatment processes. The treatment of water contaminated by phenol is an environmental challenge, and it has been investigated by many authors using several processes; the biological treatment is efficient only for low concentrations of phenols, which are lower than the discharging limits required and not toxic for the microbial flora [4].
However, the choice of such a process is based on its efficiency to remove different large concentrations of pollutants from wastewater with an economical treatment cost. The processes often used are the membrane technique, electrocoagulation, ion exchange, precipitation, flotation, and oxidation processes [10,11,12,13]. However, these processes have some limits and weaknesses, such generation of highly toxic byproducts or the high cost. On the other hand, adsorption is an alternative, and very effective, classic technique for the elimination of different kinds of pollution [14,15,16,17,18].
Adsorption has been conducted in this work and seems to be the most appropriate for the removal of phenol from contaminated water. Nevertheless, adsorption remains complex [19], because it is a non-linear process, both time-consuming and expensive compared to digital modeling techniques, especially if dealing with large areas. Recently, many authors have studied the parameters affecting water quality using an artificial intelligence approach [20].
Several works deal with great success in the simulation and prediction approaches of environmental parameters and can be used for management decisions [21], such as: Artificial neural networks [22,23,24], support vector machine [24,25], multiple linear regressions [23], and adaptive neuro-fuzzy inference System [24].
To evaluate the suggested approach, the machine learning process is considered as one of the advanced methods capable of efficiently solving complex optimization problems [19]. Notably, k-nearest neighbor (KNN) uses many sets of nearest neighbors for processing [19]. The KNN searches for the nearest neighbor match using the pre-processed data and this data is used for the prediction process [19]. Moreover, the use of optimization algorithms remains an effective process methodology for advanced evaluation progression with time consumption [19]. Among these algorithms is the gray wolf optimization algorithm (GWO), a bio-inspired algorithm coupled with a very popular prediction-based classifier, named as KNN algorithm, to categorize data with data made up of datasets [19]. The effectiveness of the prediction process can be actualized with the experience of the data to validate the degree of effectiveness of the properties measured through the optimization process in the product [19].
In our work, powdered activated carbon (PAC) has been considered for elimination of phenol from aqueous solution. Activated carbon adsorption (PAC) is a highly efficient and flexible process for water treatment, and has been successfully used to reduce environmental pollution. The adsorption mechanism of phenol on activated carbon is affected by several factors, including not only the characteristics of the PAC but also the physical and chemical characteristics of the phenol [26].
The main goal of this study is to investigate the adsorption capacity of PAC in the field of wastewater treatment for removing phenol as a toxic molecule using artificial intelligence that will allow the prediction and optimization of parameters that have a significant effect on the phenol removal mechanism.
Isotherm blindness study follow-up: In the end, k-nearest neighbor coupled with the gray wolf optimizer algorithm (KNN_GWO) was used to create an extended model to overcome traditional methods and to predict the amount of phenol adsorbed on PAC. The GWO algorithm has been used to solve a wide variety of optimization problems such as improving machine-learning performance by optimizing model hyper-parameters. It has been followed by an application executable on windows to facilitate optimization by GWO and prediction by KNN_GWO. To date and to our knowledge, the prediction of phenol adsorption quantity using KNN_GWO has never been investigated before.

2. Materials and Methods

2.1. Reagents

All chemicals used were of analytical grade and were used as received (from Sigma-Aldrich, St. Louis, Missouri, USA) without further purification: Phenol (99.9%) was used as an adsorbate. Sodium hydroxide (NaOH) (98%) was supplied by Labosi. Hydrochloric acid (HCl) (37%) and sodium thiosulfate (Na2S2O3) were purchased from Panreac, Barcelona, Spain. Sodium bicarbonate (NaHCO3) (99.5%), iodine (I2) (99%), sodium carbonate (Na2CO3) (99.5%) and methylene blue (99%) were supplied by Biochem Chemopharma, Cosne-Cours-sur-Loire, France, and powdered activated carbon (PAC) was supplied by Biochem Chemopharma.

2.2. Solution Preparation

The stock solution at a concentration of 1 g/L−1, was prepared by dissolving 1 g of phenol powder accurately weighted in one liter of distilled water. The solution was agitated until complete dissolution of phenol. The experimental solutions were obtained by diluting the stock solutions to the desired initial concentrations.

2.3. Adsorption Kinetics Experiments

The adsorption kinetics were performed in discontinuous mode at a constant temperature of 20 °C ± 1 °C. The temperature was kept constant by a water bath (Kottermann Labortechnik, Uetze, Germany). Therefore, a mass volume ratio of 0.6 ((g) adsorbent. (L−1) phenol solution) at a concentration of 25 mg.L−1 was stirred by a stirrer and heating plate (IKAMAG, Snijders, Tilburg, The Netherlands) at 300 rpm. During the adsorption process, a volume of 4 mL was sampled and filtered with a Millipore filter (0.45 µm). The recovered filtrate was immediately analyzed by spectrophotometer (Shimadzu mini 1601, Kyoto, Japan) at a wavelength of 272 nm. The amount of phenol adsorbed (mg.g−1) at time t, and the pollutant removal efficiency (%) were calculated by the following equations:
q t = C 0 C t m V
E % = C 0 C t C 0 100 %
where: qt(mg.g−1) is the amount adsorbed at time t, V (L) is the volume of the solution, m (g) is the mass of the adsorbent, C0 and Ct are the initial and residual concentration of the adsorbate in solution (mg.L−1), and E (%) is percent removal of pollutant.
To examine the effect of the operating parameters on the amount of phenol removed, the experiments were carried out at different adsorbent rates from 0.4 to 1.6 g.L−1; the temperature of the solution was varied from 20 to 50 °C and the stirring speed from 200 to 600 tr.min−1. The effect of the initial concentration of phenol was studied by varying the phenol concentration from 10 to 200 mg.L−1, while the pH effect is conducted in the range of pH from 2 to 12. The pH value was adjusted by hydrochloric acid (0.1 N) or sodium hydroxide (0.1 N). The pseudo-first-order and pseudo-second-order kinetic models have been widely used to describe the adsorption rate [27,28,29], and they are given by following the equations:
d q d t   = k 1   q e q t
d q t d t = k 2 q e q t 2
where qt (mg.g−1) is the adsorption capacity at time t (min), k1 is the rate constant of pseudo-first-order adsorption (1.min−1), k2 (g.mg−1.min−1) is the pseudo-second-order rate constant, and qe (mg.g−1) is the equilibrium adsorption capacity.
In order to understand the adsorption mechanism of phenol on the PAC and to identify the limiting steps in the adsorption mechanism process, the data kinetics of phenol adsorption on activated carbon were modeled by Weber–Morris intra-particle diffusion [27,28,29] and Boyd’s [27,28,29] kinetic models, which are expressed as:
q t = K D t + c d
B t = 0.4977 l n   1 F
KD is the intraparticle diffusion parameter; cd is the thickness of the boundary layer, and F is the extent of exchange at time t, which is expressed in terms:
F = q / q e

2.4. Adsorption Isotherms

The equilibrium data of adsorption isotherm of phenol on activated carbon at different temperature were modeled by Langmuir [30,31], Freundlich [31], and Temkin [31] isotherms, whose mathematical expressions are expressed as:
q e = q m . K L . C e 1 + K L . C e
q e = K F . C e 1 n
θ = q e q m = R T b T . l n A T . C e
where Ce is the phenol concentration at equilibrium (mg.L−1),qe is the adsorption capacity at equilibrium (mg.g−1), qm is the maximum adsorption capacity (mg.g−1), KL is the Langmuir constant (mg.L−1), KF is the Freundlich adsorbent capacity, n is the heterogeneity factor, R is the universal gas constant (8.314 J.mol−1K−1), bT and AT are characteristic constants of the Temkin isotherm, and ϴ is the recovery rate.

2.5. K-Nearest Neighbor

K-nearest neighbor (KNN) is a well-known method in machine learning, where it has recently been applied for the classification and parametric estimation analysis of difficult-to-evaluate unknown probabilities [19,20]. The KNN is inferred to classify the model, which has an idea of the k nearest neighbor rule [19,20], by proposing a new classification technique based on the distance between distributions [19,20]. The concept of KNN is to classify individual data that contains the nearest neighbor majority [19,20]. On the other hand, the KNN consists of classifiers and regressions for the prediction process [19,20], since the classification involves identifying and classifying groups based on the characteristics of the data [19,20]. In addition, for regression, one needs to use existing data to predict future data [19,20].
In this work, the KNN model was used to create an extended model to overcome traditional methods for predicting the amount of phenol adsorbed onto the best adsorbent (PCA). Another advantage is that the KNN model can easily handle large amounts of noisy data from dynamic and nonlinear systems. For this purpose, the results of the adsorbed quantity of phenol obtained at each instant by the optimization of the adsorption parameters were collected in a single database; the database collected with the dimension [376:7] includes seven parameters considered as inputs and one output parameter. The independent parameters were the contact time of each sample (×1), the phenol concentration (×2), the mass of adsorbent (×3), the stirring speed (×4), the temperature (×5), and the pH of the solution (×6). On the other hand, output (y) was the quantity of adsorbed phenol obtained at each instant.
To obtain the optimal result from KNN, a strategy based on design and optimization was followed. From the start, the database was normalized once in the interval [−1, +1] using MATLAB “mapminmax” function. Then, a small database of size [50:7] was hidden for later use to test the performance of the best obtained model. Therefore, the rest of the size database [326:7] was split in half: 80% of the dataset for training and 20% of validation samples. Subsequently, 11 distance metrics were optimized (Euclidean, Chebychev, Minkowski, Mahalanobis, Cosine, Correlation, Spearman, Hamming, Jaccard, Cityblock, Seuclidean) with their distance weighting functions (equal, inverse and squared inverse). Knowing this, each distance metric was also optimized for its specific parameters (number of neighbors and exponent in the case of “Minkowski” cubic distance metrics).
For this, the gray wolf optimizer (GWO) algorithm was coupled with KNN (KNN_GWO) to optimize the specific parameters of each distance metric, since this optimization of the algorithm has been used to solve a wide variety of optimization problems [19,21]. Among these solved problems are different machine learning optimization problems, fundamental values, and penalty parameters, which were sent by the GWO to train machine learning using training data [19,21]. This last point was confirmed by some studies that proved that machine learning performance was achieved when hyper-parameters were optimized using the GWO algorithm [19,21].
At the end, to evaluate the performance and to select the best model, statistical criteria were used, including: the correlation coefficient (R), coefficient of determination (R2), adjusted coefficient (Radj2), root mean square error (RMSE), mean square error (MSE) and mean absolute error (MAE). These criteria are calculated considering the following equations [22,23,24,25].
R = i = 1 N y exp y ¯ exp y pred y ¯ pred i = 1 N y exp y ¯ exp 2 i = 1 N y pred y ¯ pred 2
R a d j 2 = 1 1 R 2 N 1 N K 1
R M S E = 1 N i = 1 N y exp y ¯ exp 2
M S E = 1 N i = 1 N y exp y pred 2
M A E = 1 N i = 1 N y exp y pred
where N is the number of data samples; K is the number of variables (inputs); y ¯ exp and y pred are the experimental and the predicted values, respectively; and y ¯ exp and y ¯ pred are the average values of the experimental and the predicted values, respectively [22,23,24,25].

3. Results and Discussions
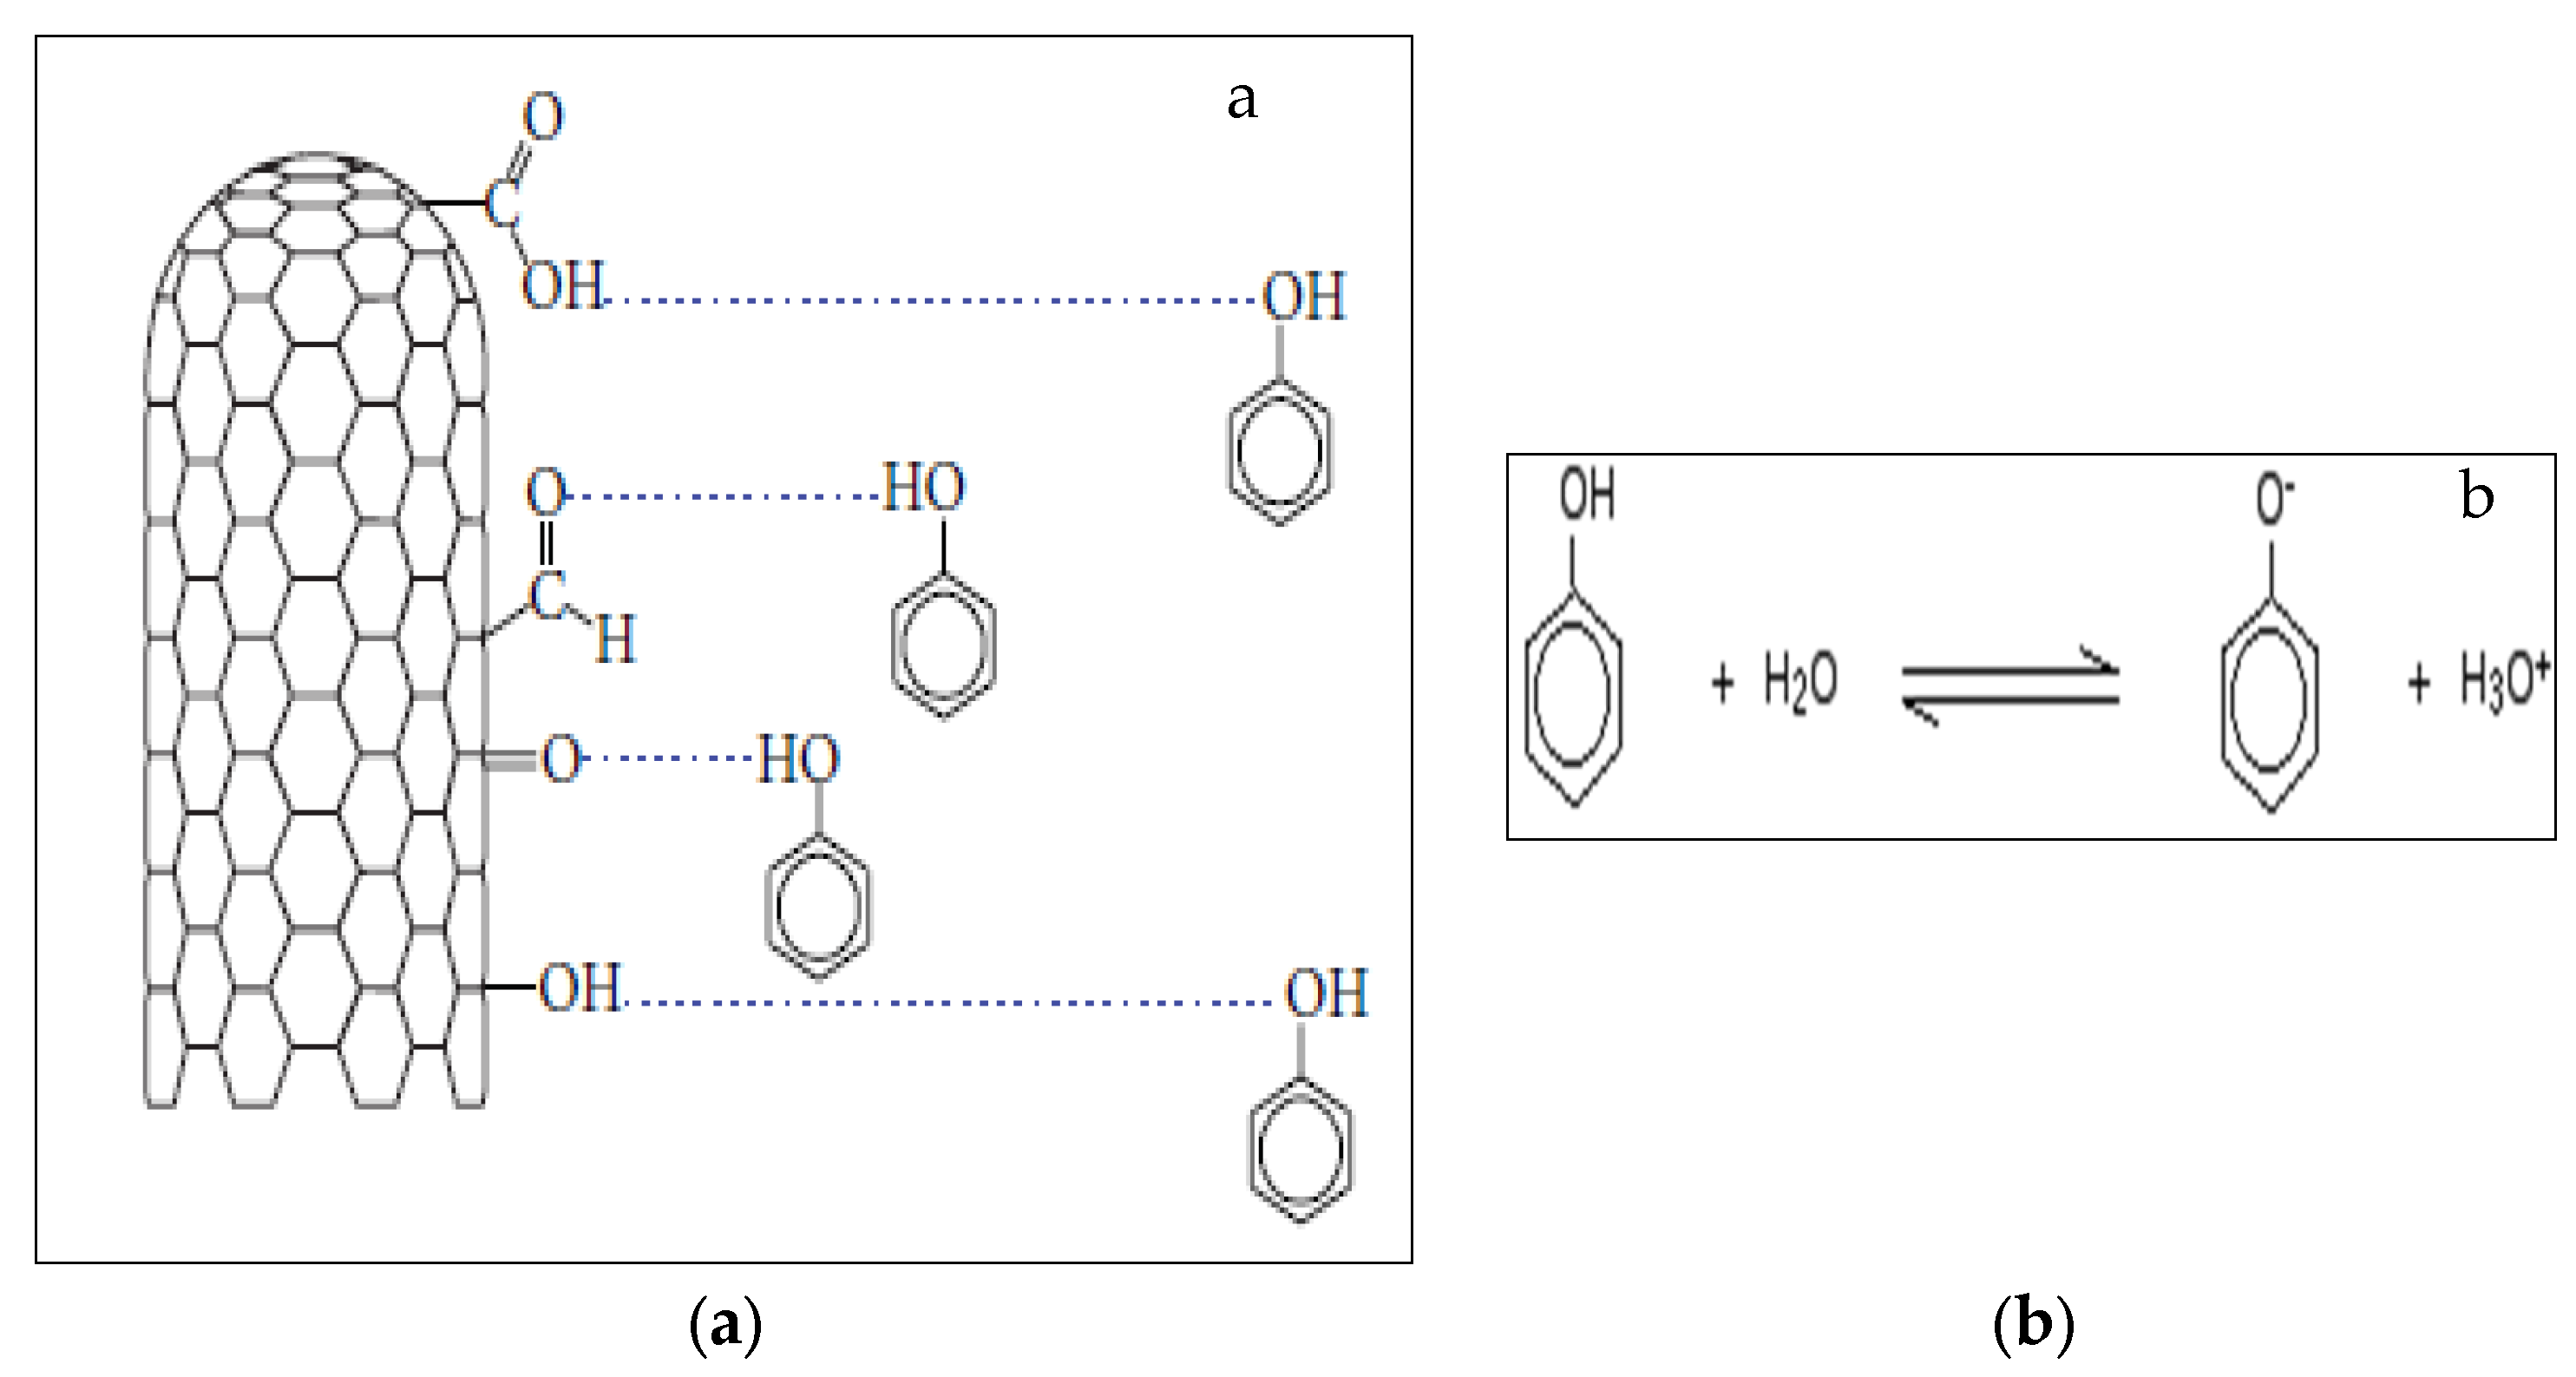
3.1. Phenol

Phenol has a chemical formula C6H5OH with a molecular weight of 94.11 g.mol−1. It is a weak acid with pKa = 9.99, a mass density 1.07 g.cm−3 and an aqueous solubility of 83.11 mg.L−1 at 293.15 K [18].

3.2. Characterization of PAC

The powdered active carbon (PAC) used in this study was the same one that was prepared and used previously for the adsorption of ketoprofen [32]. Its characterization results are summarized in the Table 1.
The iodine number estimates the capacity of activated carbon to adsorb molecules of microporous size (less than or equal to that of the iodine molecule, i.e., 0 to 20 Å) [33]. The methylene blue (MB) index is used to estimate the amount of both the mesopores and macropores, which is indicative of a high adsorption ability of larger molecules. The iodine and the methylene blue numbers found were equal to 752 and 244 mg.g−1, respectively. It is quite clear that the iodine index is higher than the methylene blue one, which indicates that the surface of the powdered activated carbon is mostly composed of micropores rather than of macro- or mesopores. Thus, this PAC has a strong adsorptive ability for microporous particles. This finding is coherent, since the phenol molecule is microporous (diameter of phenol = 0.56 nm), therefore it can easily be adsorbed by microporous adsorbents.

3.3. Effect of Operating Parameters

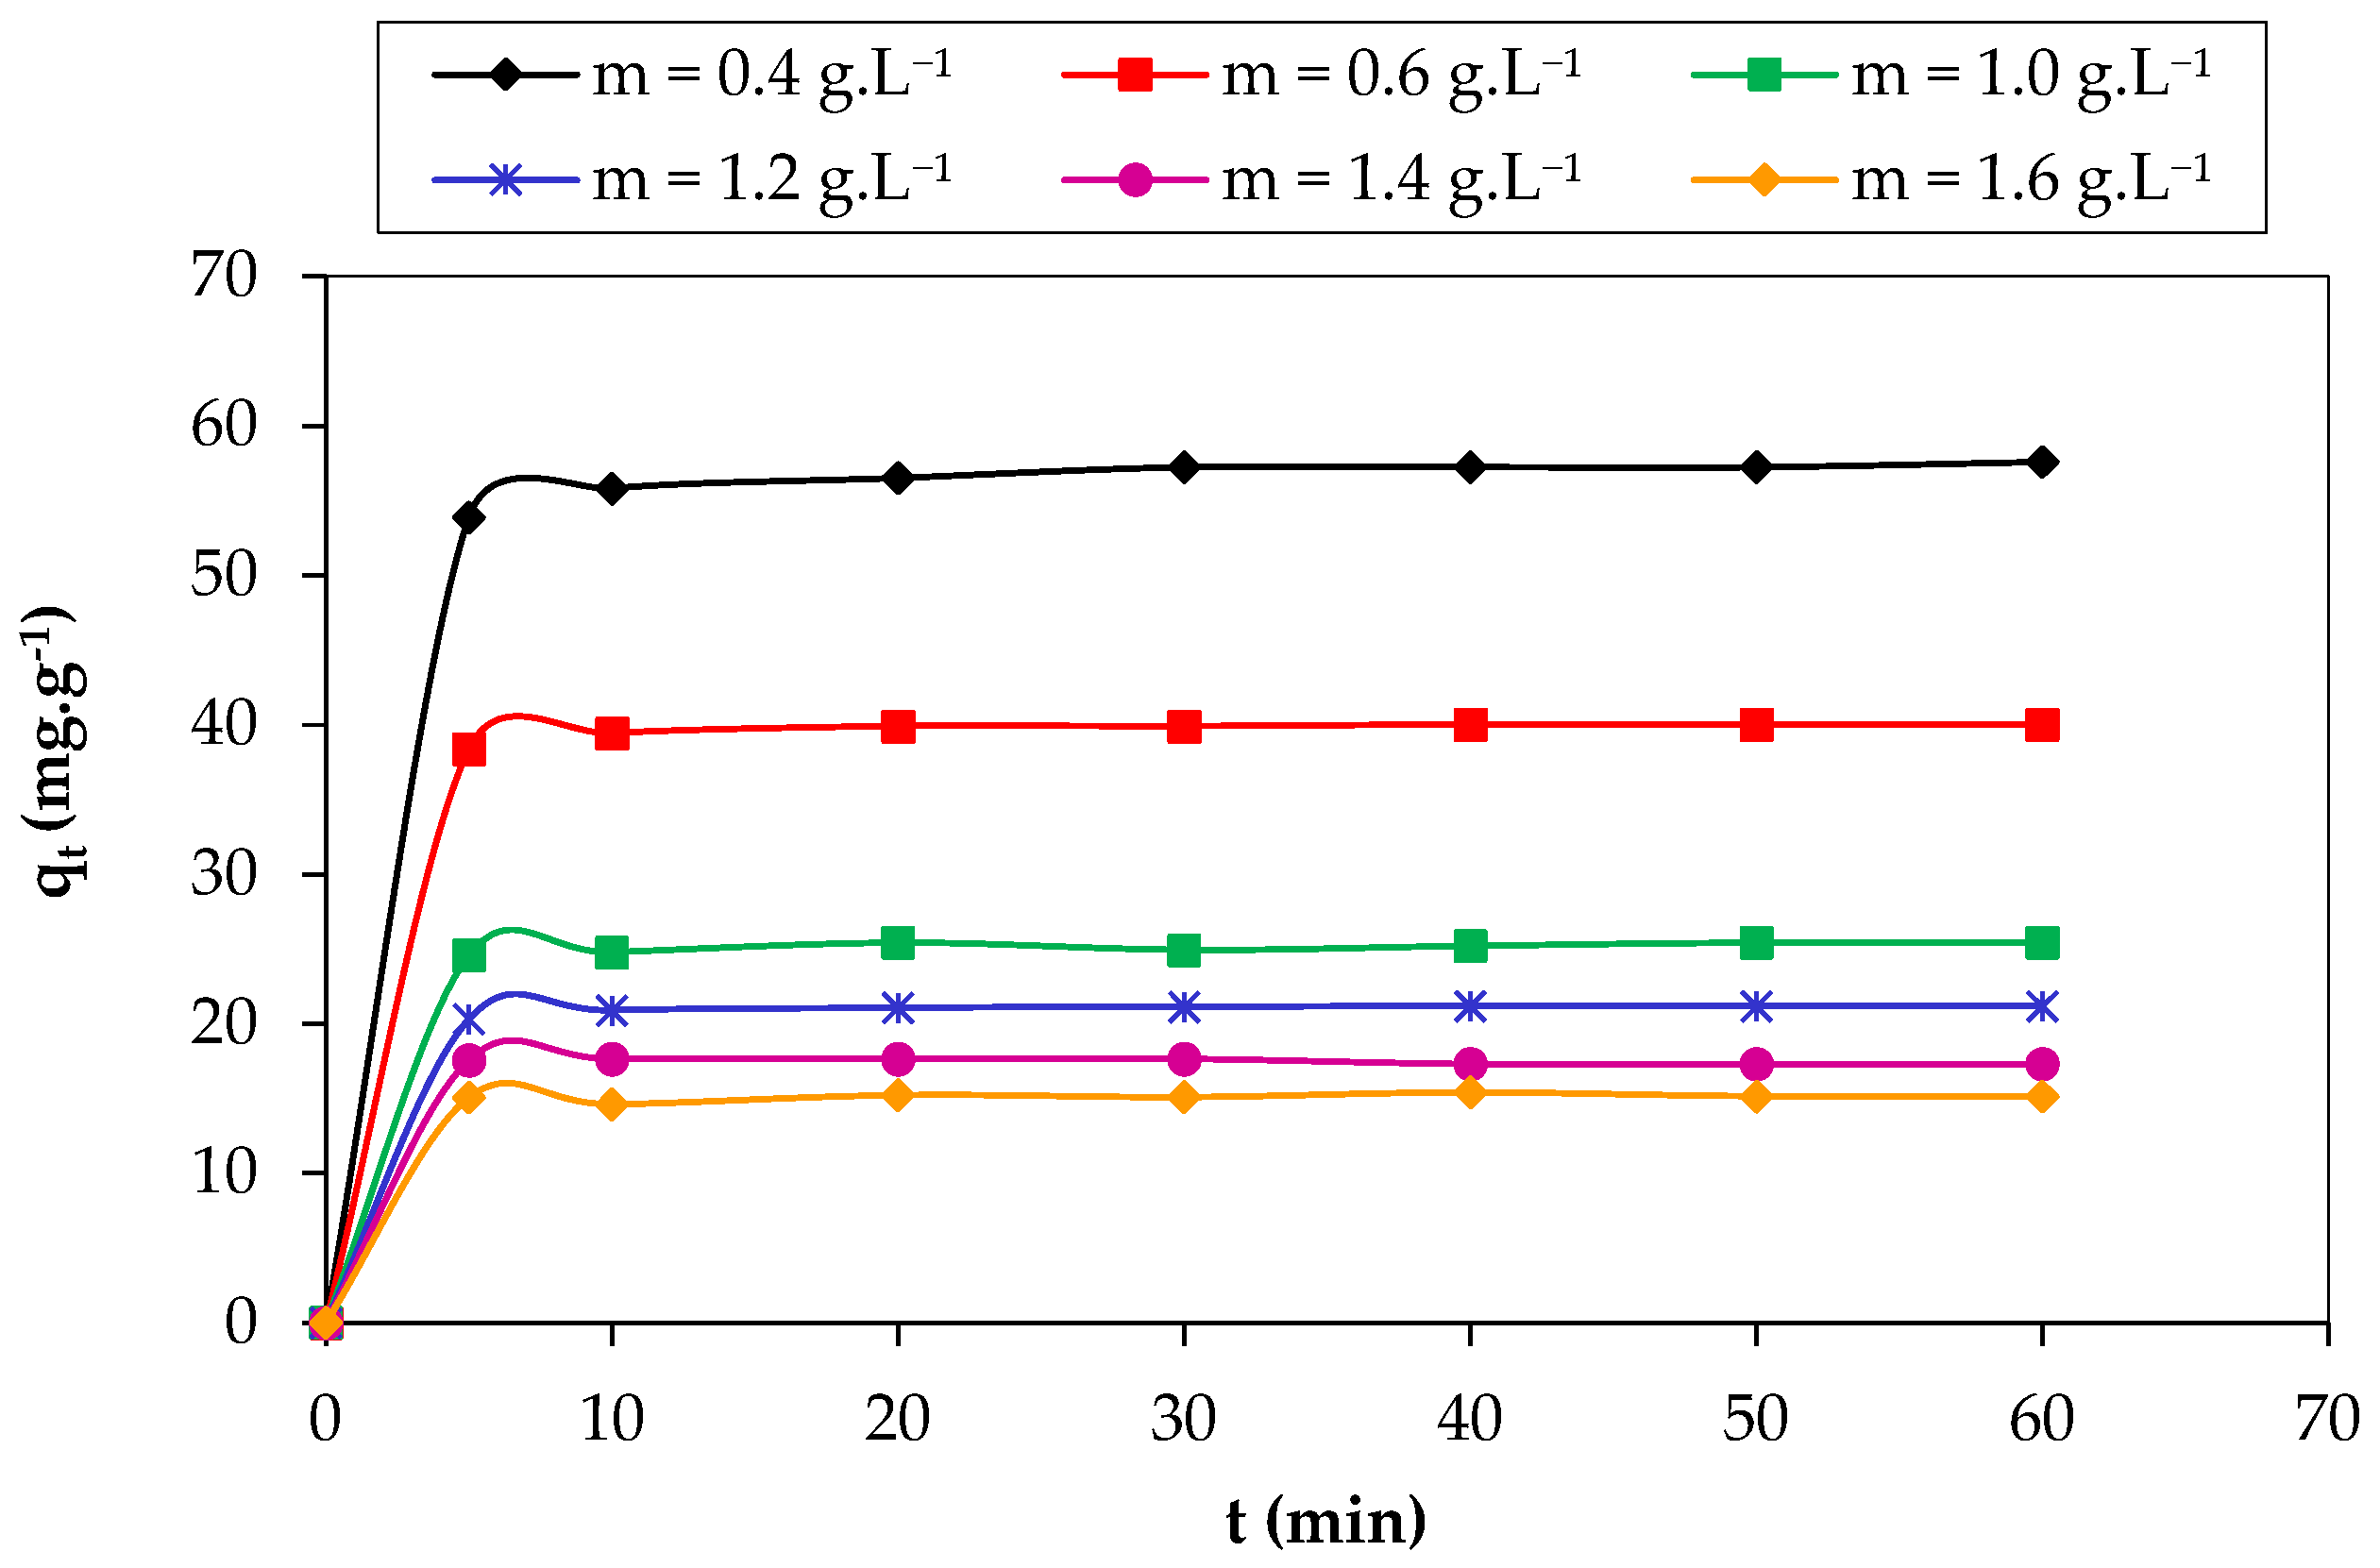
3.3.1. Effect of the Adsorbent Mass to Volume

To examine the influence of the adsorbent mass on the phenol adsorption, the ratio of activated carbon mass to solution volume was investigated in the range 0.4 to 1.6 g.L−1, while maintaining the solution temperature at 20 °C and the phenol concentration at 25 mg.L−1. According to Figure 1, the equilibrium adsorption capacity per gram of adsorbent decreased from 57.57 to 15.14 mg.g−1, when the adsorbent mass to volume ratio increased from 0.4 g to 1.6 g.L−1, while the percentage removal increased from 95.83 to 99.94%. The increase in phenol removal was due to the increase in the adsorption surface area with the disposal of a greater number of adsorption sites [32]. It was also noted that the adsorption was very fast at the beginning, which may be related to the large concentration gradient of phenol and powdered activated carbon; then the equilibrium was achieved due to the saturation of adsorbent sites. For all the studied adsorbent mass to solution volume ratios, a rapid removal of phenol (99.94%) occurred in a few minutes (te ≤ 5 min). Phenol removal increased up to the ratio of 0.6 g.L−1, and then did not significantly change. Thus, the optimal mass/volume ratio chosen to continue this work was 0.6 g.L−1.

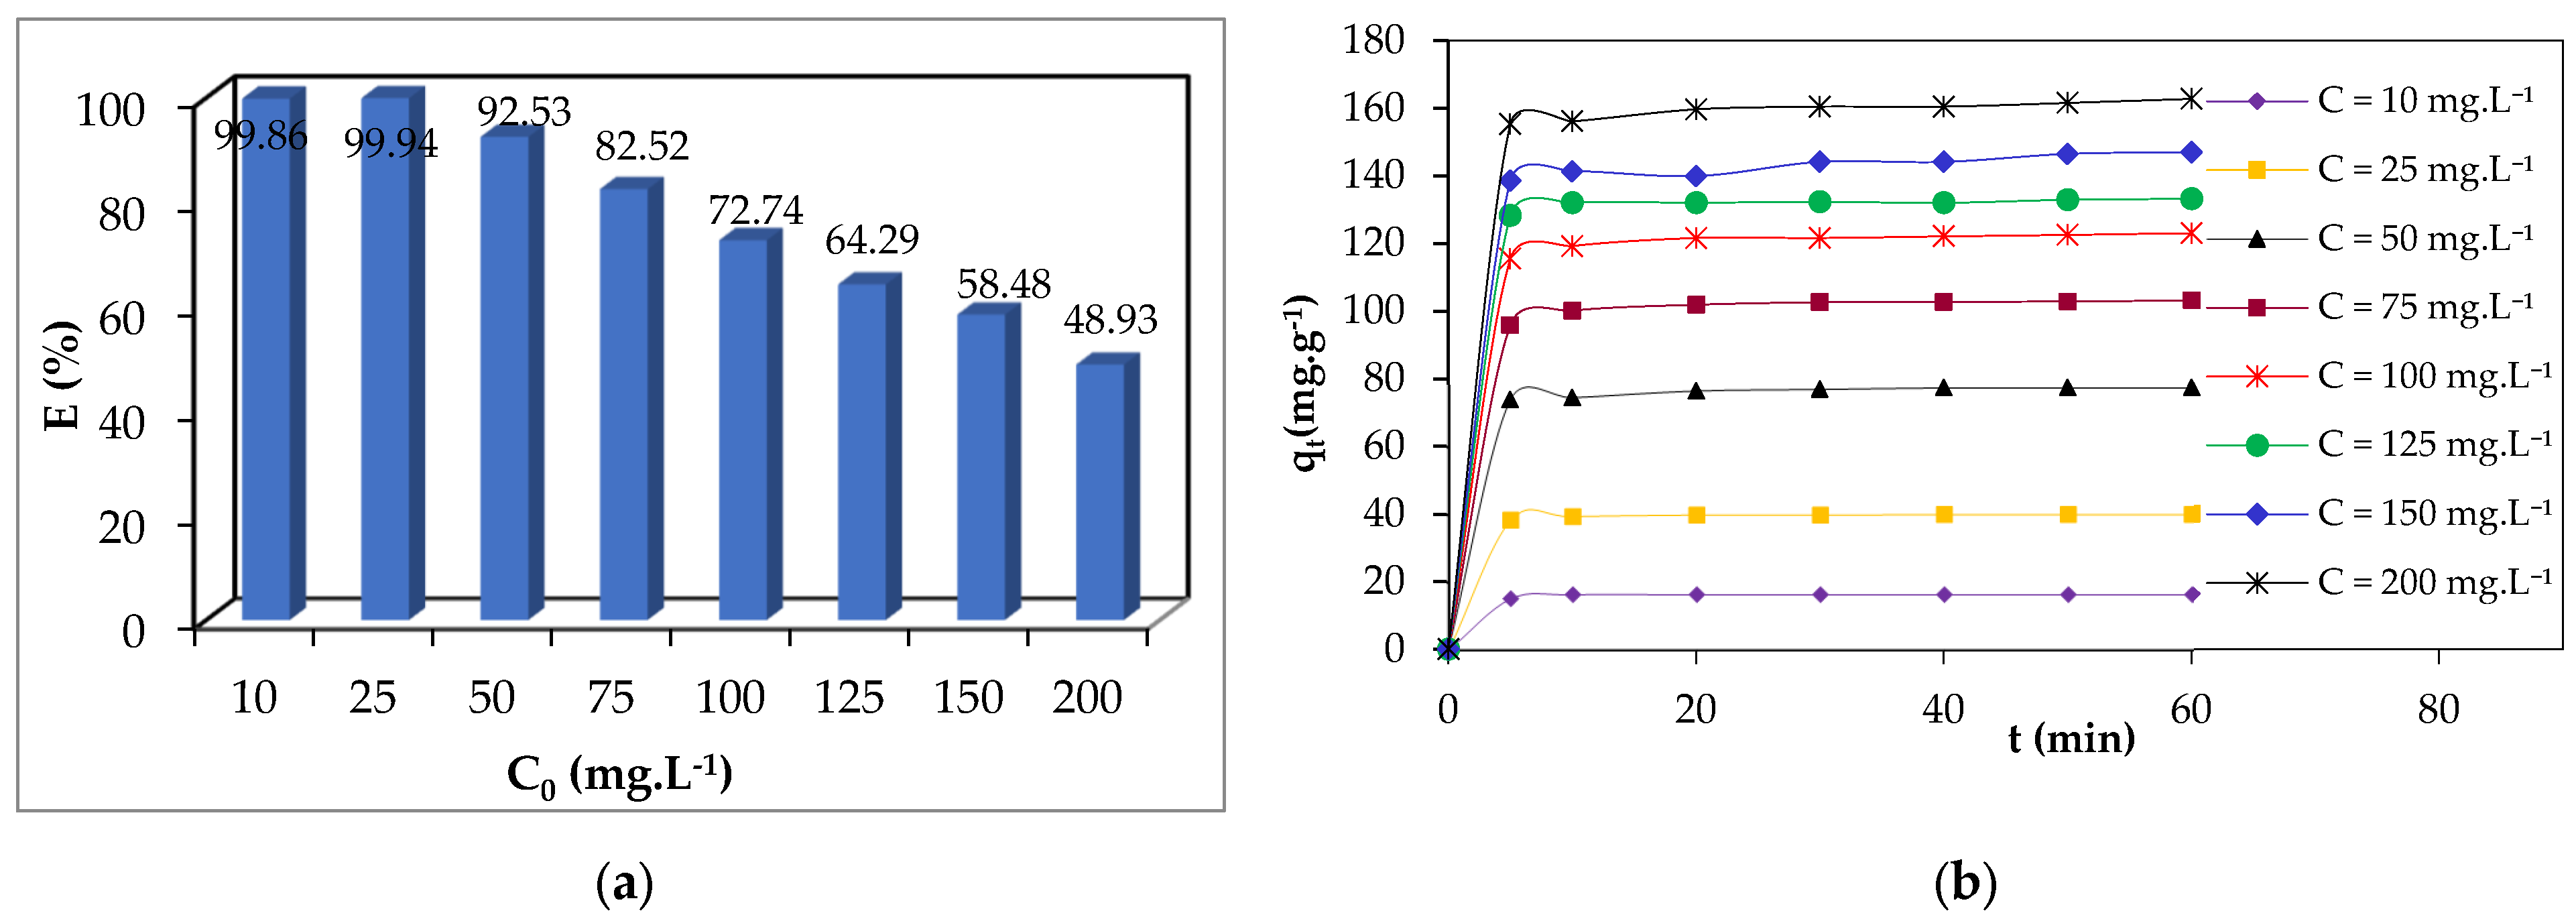
3.3.2. Effect of the Initial Concentration of Phenol

To study the effect of the initial concentration of phenol by adsorption on PAC, the initial concentrations of phenol was varied from 10 to 200 mg.L−1. The obtained results, shown in Figure 2, indicate that the amount of adsorbate fixed on the PAC increased from 16.31 to 162.54 mg.g−1 with the increase in the initial concentration of phenol from 10 to 200 mg.L−1. The initial concentration provides a significant driving force required to overcome all mass transfer resistances of all the phenol molecules between the aqueous and the solid phases [34]. It is also shown that the removal yield decreased from 99.94 to 48.92% with increasing the initial concentration of phenol. The increase in the initial phenol concentration enhances the interaction between phenol and the active sites on the surface of the activated carbon, increasing the removal of phenol. This can be attributed to the saturation of the adsorption sites for increasing phenol concentrations [34,35].

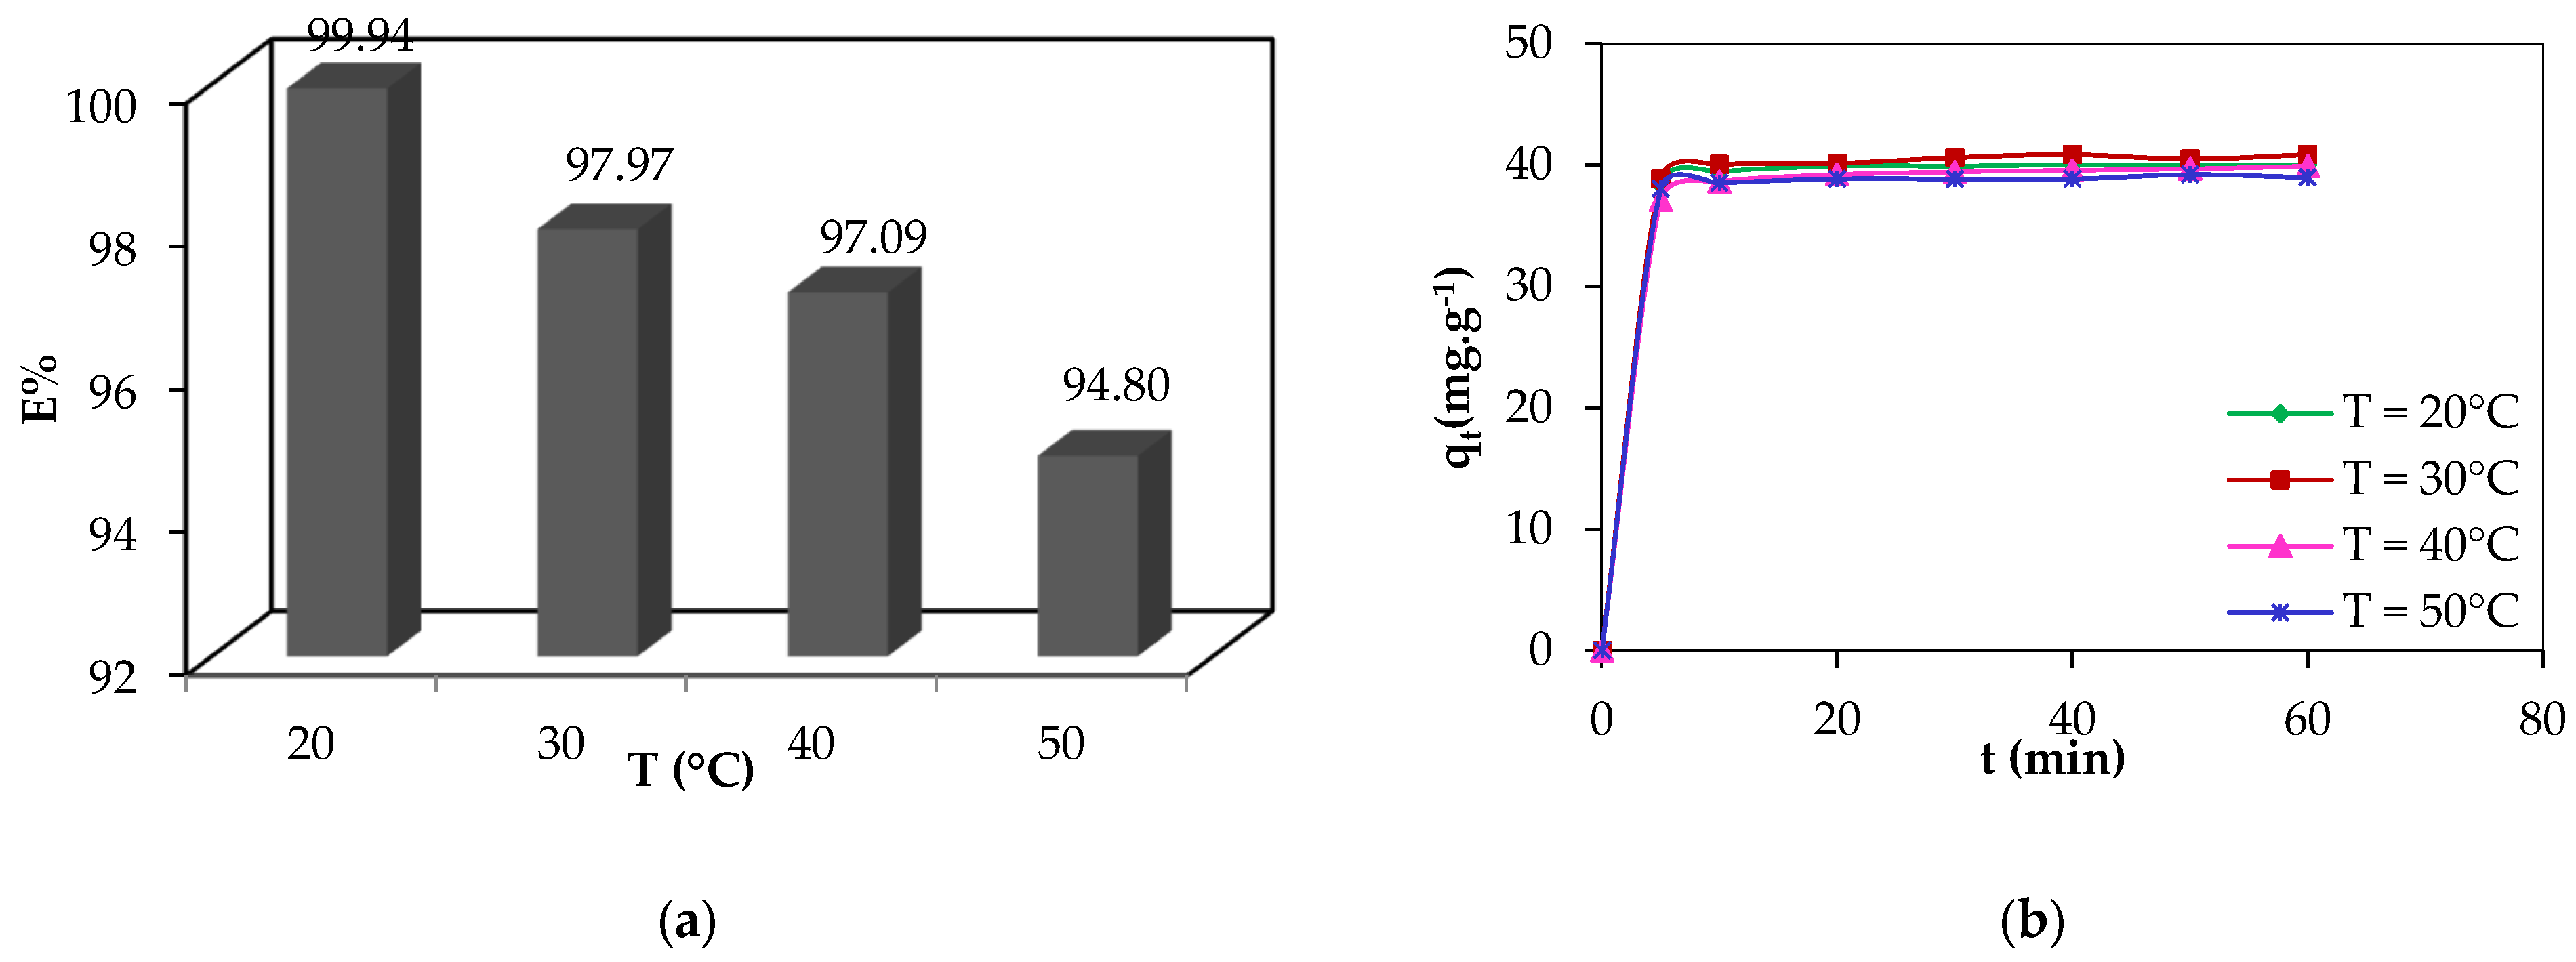
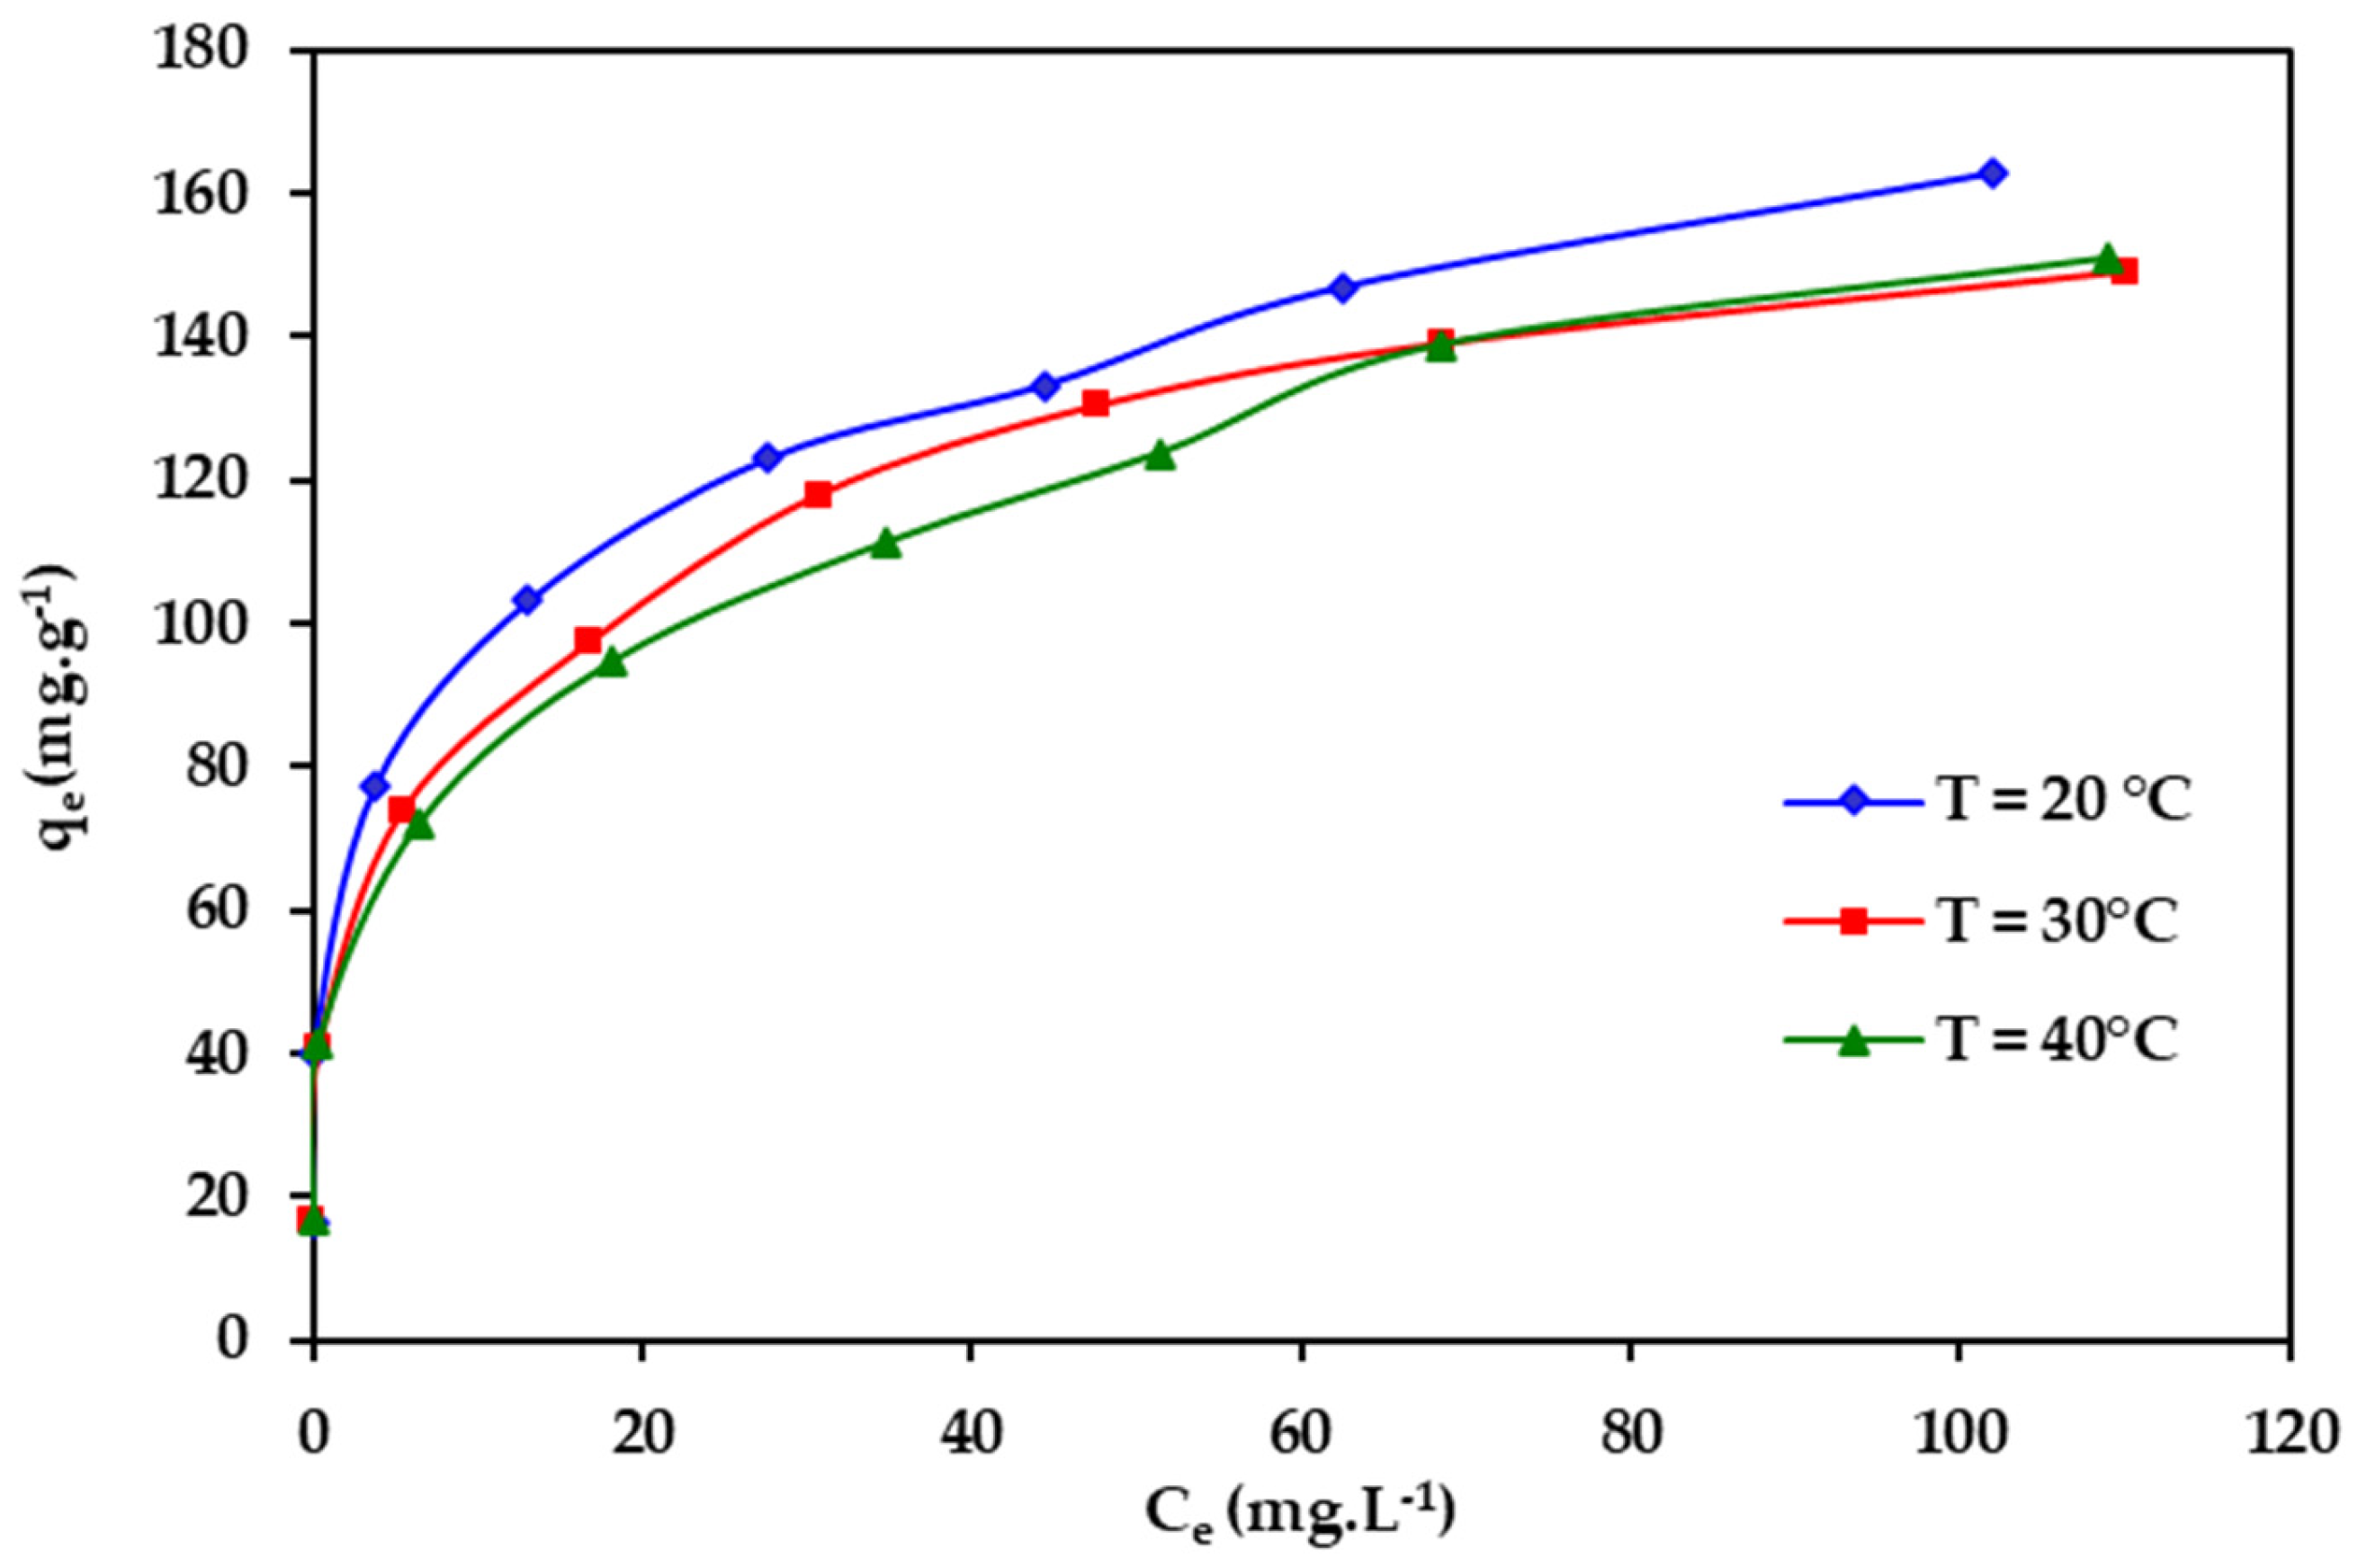
3.3.3. Effect of Temperature

Temperature is an indicator of the adsorption nature, whether it is an exothermic or an endothermic process [35]. Figure 3 shows that the equilibrium adsorption capacity of PAC decreased from 40.02 to 38.96 mg.g−1 with an increase of the temperature from 20 to 50 °C, on the one hand, and the removal percentage decreased from 99.94 to 94.80%, on the other hand. According to the study carried out by Abdelwahab and Amin [35], the decrease in the removal efficiency for increasing temperatures is due to the weakening of the adsorption forces between the active sites on the surface of the adsorbent and the adsorbate species and probably the damage of the active sites on the adsorbent [35]. The weakening of the adsorption forces results in a decrease in the adsorption efficiency. Consequently, the reduction in the rate of adsorbed phenol with increasing temperature reveals that the adsorption is an exothermic process [34]. The maximum removal was observed at the optimum temperature of 20 °C; further increase in temperature is inappropriate as it leads to the decrease in the percentage removal.

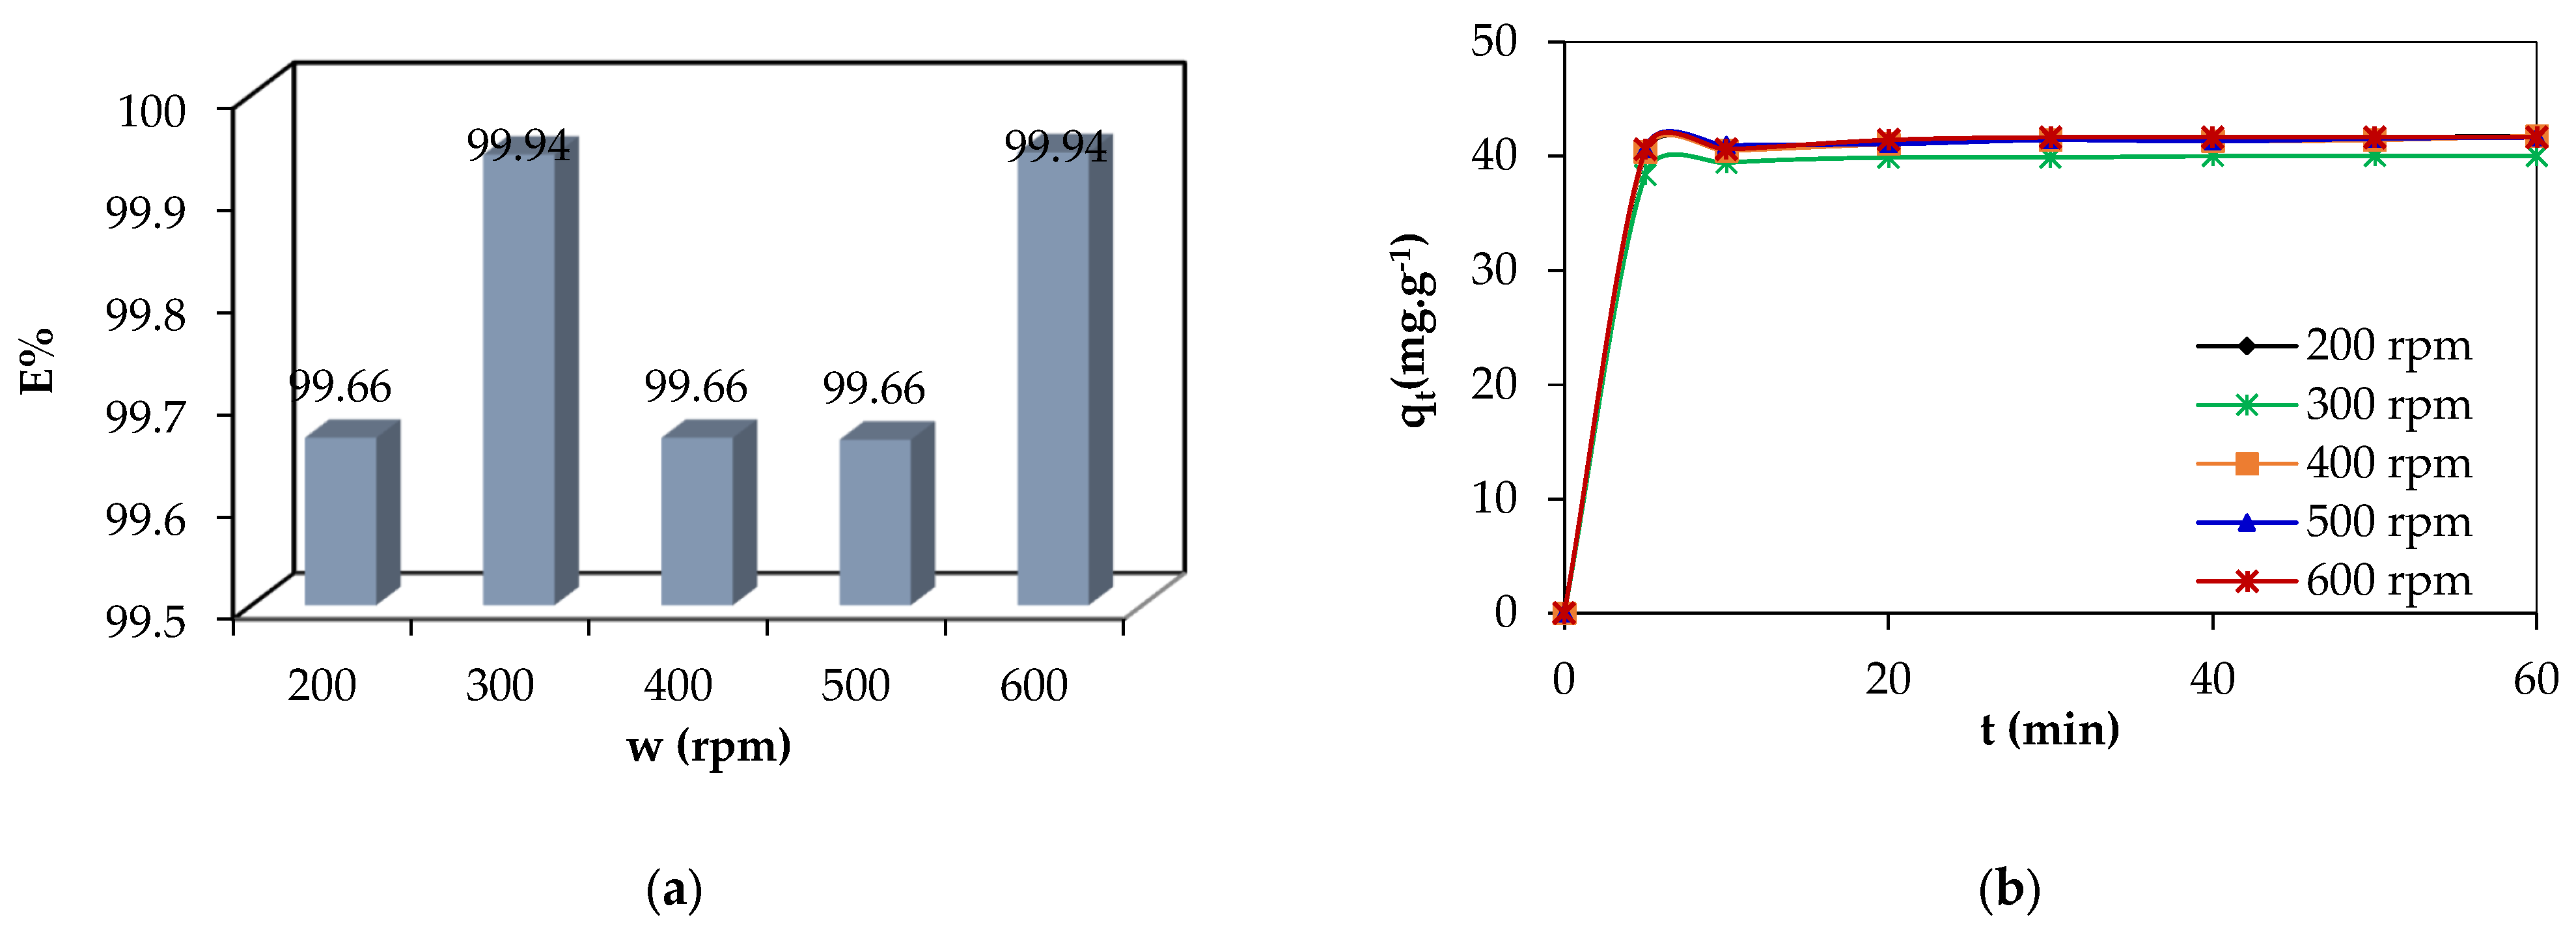
3.3.4. Effect of the Stirring Speed

The effect of the stirring speed was evaluated from 200 to 600 rpm. The results obtained are illustrated in Figure 4, showing that the stirring speed did not affect the phenol adsorption, most likely due to the very fast adsorption that was achieved in the first contact minutes. Thus, the speed of 300 rpm was chosen as an optimal; this speed is sufficient to favor the contact between the PAC particles and the phenol molecules without slowing down the adsorption forces [36].

3.3.5. Effect of the pH

In order to study the influence of this parameter on the phenol adsorption by PAC, pH values in the range of 2 to 12 were considered.
Figure 5 shows that the amount of phenol adsorbed by the PAC remained stable within the range pH of 2–8, with an almost total elimination. Beyond pH 8, phenol percent removal decreased until reaching a value of 57.34% at pH 12.
In the pH range between 2 and 8, an almost invariable total elimination has been observed. In this pH range, the surface of PAC is positively charged, since pH < pHPZC = 7.5 (Table 1); while phenol, is neutral when pH < pKa = 9.99. Thus, the adsorption of phenol on the PAC surface is favored by hydrogen bonding, according to Luz-Asunción et al. [37] (Figure 6a).
It has been reported [37] that the presence of carboxylic and hydroxyl groups on the surface of the adsorbent promotes the removal of phenol by hydrogen bonding. The Boehm titration performed on PAC showed that strong carboxylic acid, and hydroxyl and phenol groups are favored to be adsorbed on the surface of the PAC, increasing the probability that the phenol adsorption occurs by hydrogen bonding.
As mentioned previously [37], phenol is a weak acid with an acid dissociation constant (pKa) equal to 9.99; at pH > pKa it dissociates into phenolate ions (Figure 6b) [38]. Therefore, at pH > pKa, the concentration of negatively charged phenolate ions increases in solution and the surface of the PAC is negatively charged (pH > pHPZC = 7.5), hence, electrostatic repulsions occur between the negative surface charge of the PAC and the phenolate anions in solution, which caused the decrease in adsorption efficiency at pH values above 8.

3.4. Kinetics Study

The study of adsorption kinetics provides a description for the rate of adsorbate uptake and gives information of the mechanism controlling the rate of adsorption [39]. The kinetics parameters of Lagergren, Blanchard, and Webber and Morris for different concentrations of adsorbate at a 20 °C are gathered in Table 2 and Table 3.
According to the results assembled in Table 2, the coefficients of correlation obtained by the pseudo-first-order model were very low, showing a bad correlation; the maximum capacities given by the pseudo-first-order model were not in agreement with those obtained experimentally, accounting for the poor fit obtained. On the other hand, the obtained R2 values for the Blanchard model were very good (≈1); the equilibrium-adsorbed amounts calculated theoretically by this pseudo-second-order model were almost identical to those found experimentally. Consequently, the adsorption process of phenol by PAC was found to be more suitable with the pseudo-second-order model.
The application of the Weber and Morris model to the kinetics data gave more or less acceptable coefficients correlations R2 (>0.902) (Table 3), with some exceptions for the two concentrations of 10 and 20 mg.L−1.
The linear plot did not pass through the origin (cd ≠ 0), which indicates that the intra-particle diffusion was not the only mechanism controlling the kinetics adsorption of phenol [40]. The obtained lines were multi linear consisting of two segments; the first linear area represented the external diffusion by macropore and mesopore, while the second segment of the fitting slope represented the micropore diffusion by the intraparticle diffusion [18,41].
The application of Boyd model to the experimental data shows that lines did not cross the origin, which indicates that the extra-particle diffusion was not the limiting stage of the adsorption process of phenol by the PAC.

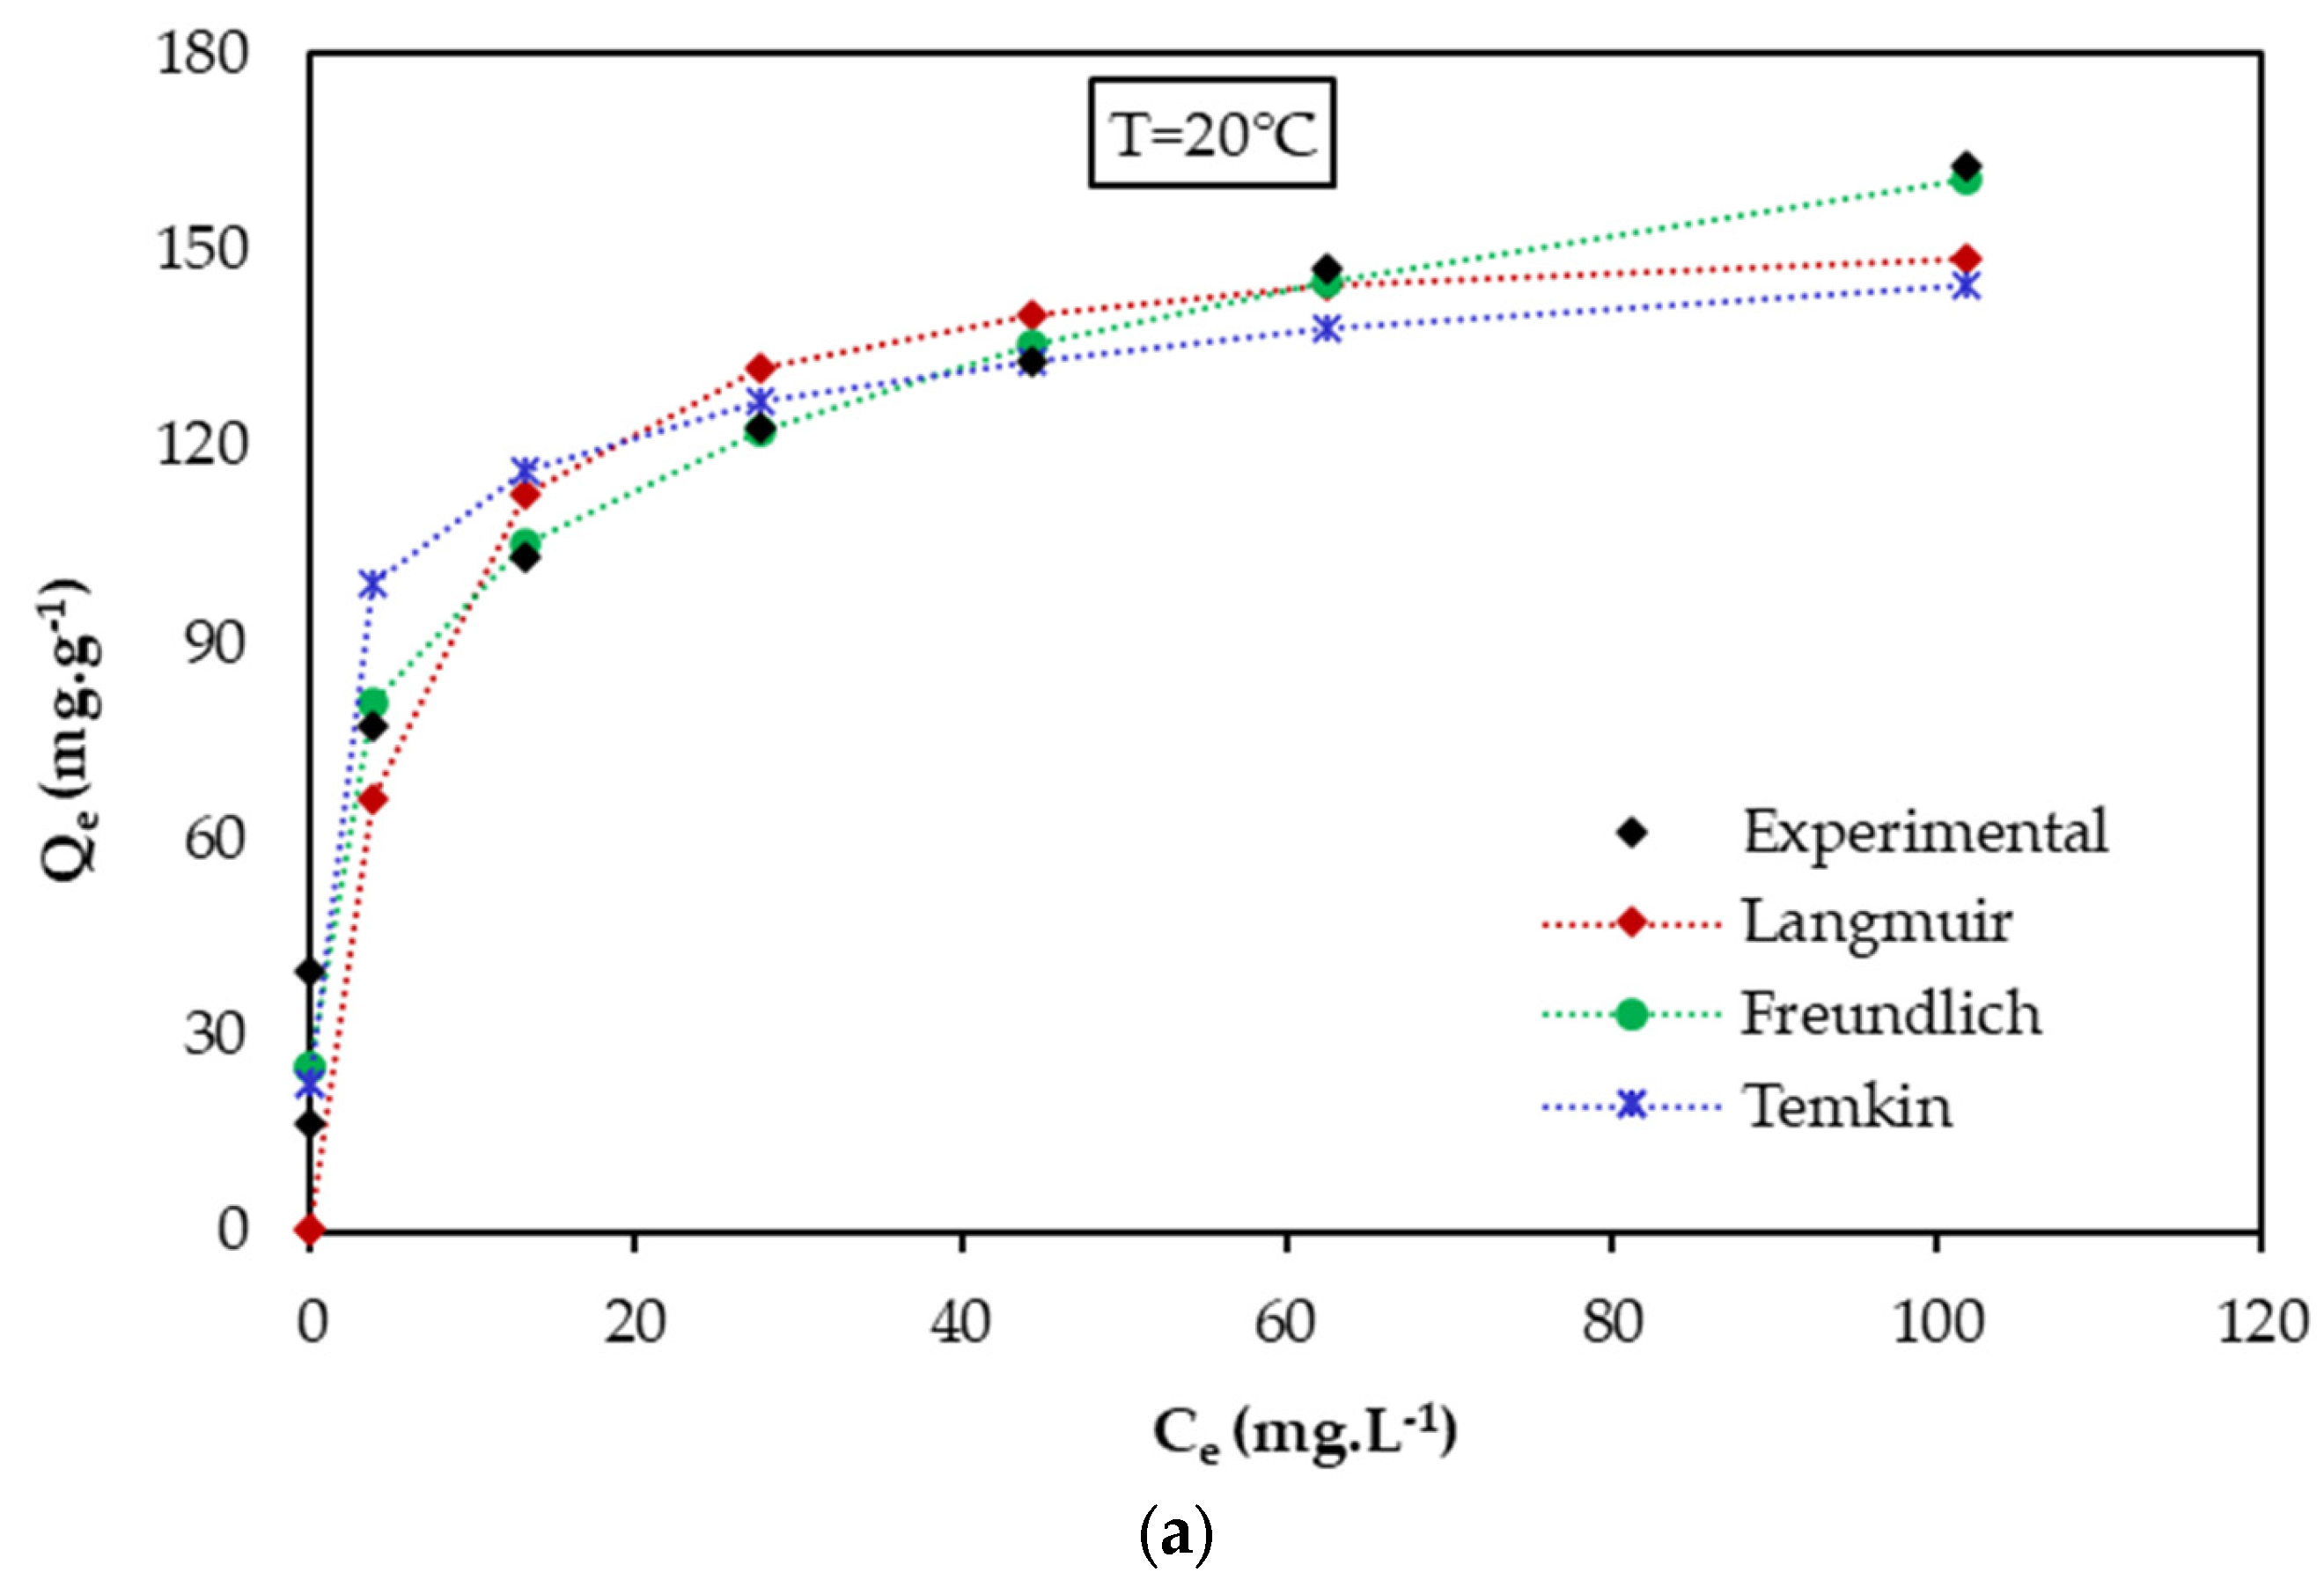
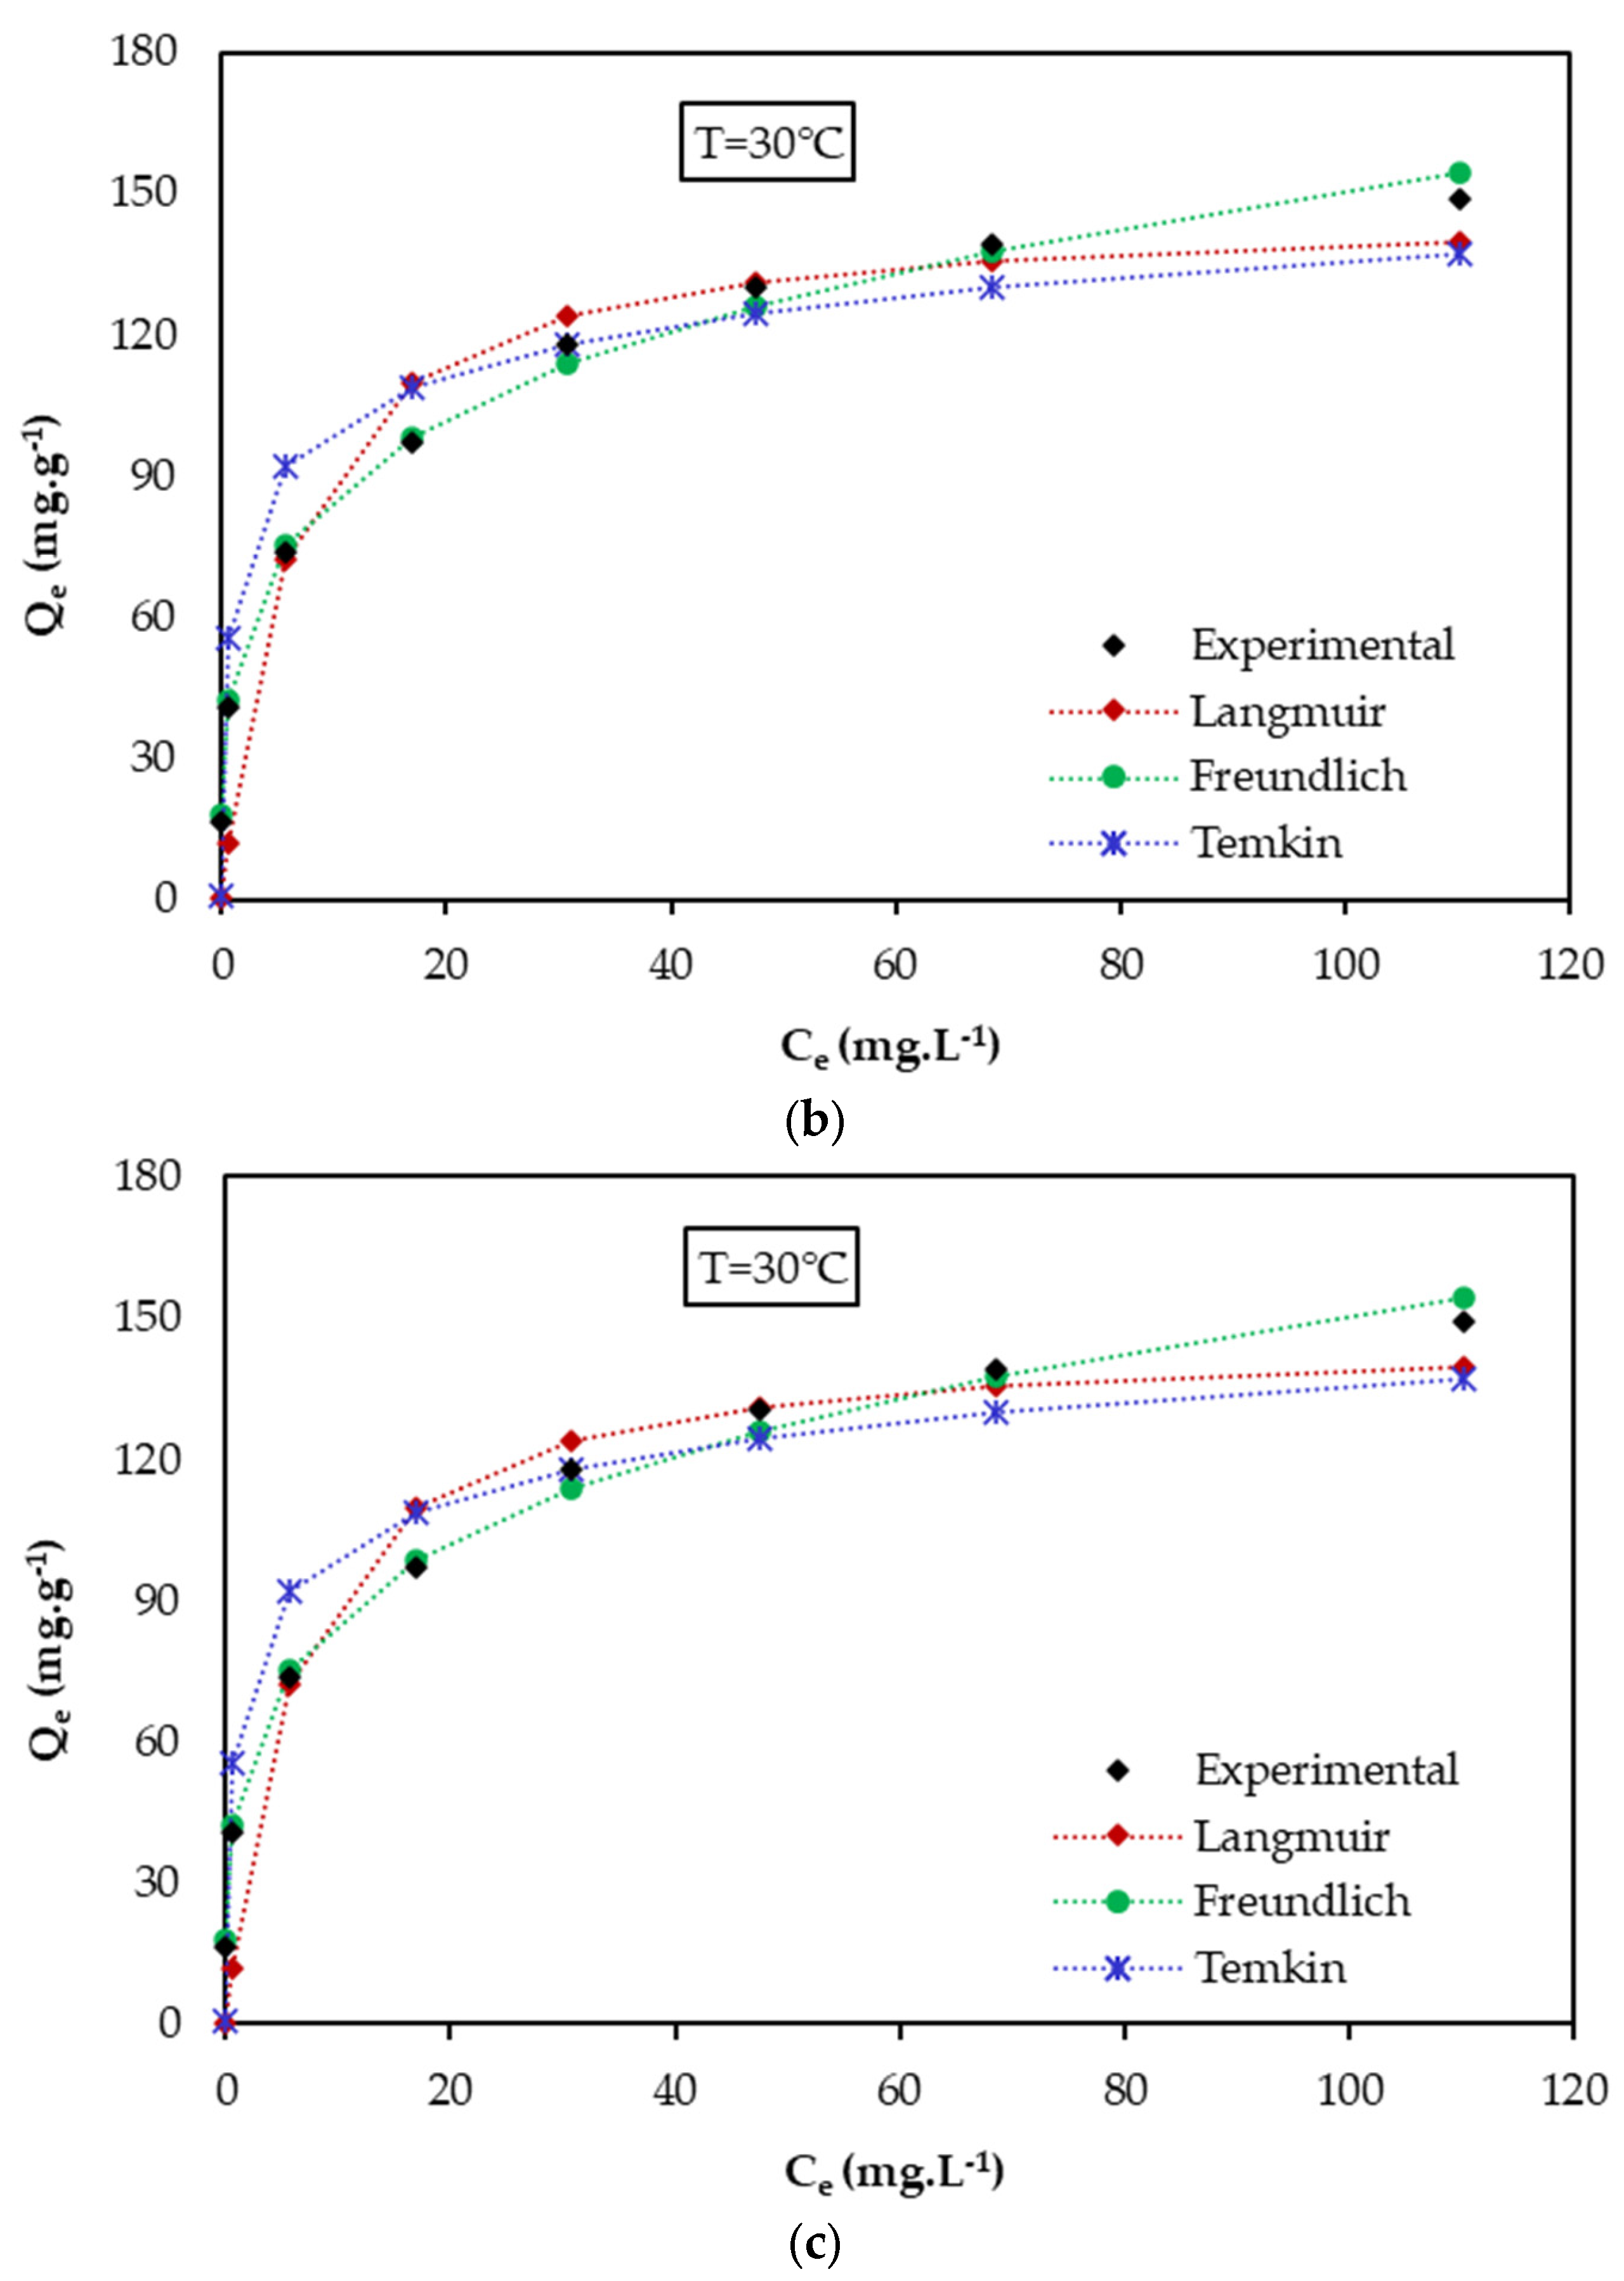
3.5. Isotherms Study

Adsorption isotherms of phenol on powdered activated carbon were performed at temperatures ranging from 20° to 40 °C. Figure 7 shows the variation of the equilibrium adsorbent amount (qe) as a function of the equilibrium adsorbate concentration (Ce). The isotherm plots of phenol adsorption on PAC show that the quantity of phenol adsorbed at equilibrium increased with the increase in the phenol equilibrium concentration; a slowing down was then observed, which corresponds to the equilibrium saturation of the adsorption sites.
Moreover, the obtained isotherms show that the adsorbed amount at equilibrium decreased with the increase of temperature from 20 to 40 °C. This decrease in the adsorbed amount suggests a weak adsorption interaction between the PAC surface and phenol, which favors the physisorption nature [42].
To evaluate the adsorption mechanisms, the experimental equilibrium data were fitted by different adsorption isotherm models, namely Langmuir, Freundlich, and Temkin, at different temperatures (Figure 8). The fitting parameters are reported in Table 4.
From Table 4, the R2 obtained by Langmuir was more or less satisfactory (R2 ≤ 0.975). The values of maximum adsorption capacity values determined by Langmuir were in the range from 146.9 to 156.26 mg.g−1. These values were comparable to those reported by Fierro [43], where the obtained maximum adsorption capacities varied from 74 to 137.36 mg.g−1 for different commercial activated carbon used to adsorb phenol from aqueous solution [43].
The “favorability” of the Langmuir isotherm for an initial concentration C0 is verified by the Hall parameter (RL), which is given by [44,45]:
R L = 1 1 + K L C 0
where:
  • C0: initial concentration of phenol (mg.L−1)
  • KL: the constant related to the energy of adsorption (Langmuir constant)
  • RL: value indicates the adsorption nature to be either unfavorable if RL > 1, linear if RL = 1, favorable if 0 < RL < 1 and irreversible if RL = 0.
From the results reported in Table 4, the calculated RL parameters were between 0 and 1, indicating that the Langmuir isotherm is favorable [44,45].
The value of the Freundlich parameter n was greater than 1 (n > 4) for all temperature studies, indicating that the adsorption of phenol by PAC is favorable and physical [45,46]. It is in agreement with the findings of adsorption isotherms for different temperatures, since the amount adsorbed at equilibrium was inversely proportional to the temperature.
The correlation coefficients of Freundlich are overall very satisfactory, and they are higher than those obtained by Langmuir, suggesting that the adsorption of phenol by PAC is well described by the Freundlich model.
The Temkin isotherm can model the equilibrium data of phenol adsorption on PAC, due to the satisfactory values obtained for the correlation coefficients. The Temkin constant (bT) related to the adsorption energy was positive at all studied temperatures, which shows that phenol adsorption by powdered activated carbon is exothermic [32].
The results of the modeling equilibrium data reveal that the Langmuir, Freundlich, and Temkin isotherms well fitted the experimental data. It is also concluded that the adsorption is physical, favorable, and may be an exothermic type.

3.6. Thermodynamics Study

The thermodynamic study of phenol adsorption over PAC was conducted by calculating the Gibbs free energy change (ΔG°), enthalpy change (ΔH°), and entropy change (ΔS°) as function of temperature. The Gibbs free energy of adsorption (ΔG°) can be expressed as [47,48]:
Δ G ° = R T   l n K L °
where R is the universal gas constant (8.314 J.mol−1K−1), T the temperature (K), and KL° is the (dimensionless) “thermodynamic” Langmuir constant for the adsorption process.
The value of KL (L.mg−1), calculated from Langmuir model (Equation (8)) and given in Table 4 (Section 3.5), should be converted to molar concentration unity considering the standard state C° = 1 mol.L−1 [47,48]:
K L ° = K L L . m g 1 × 1000   m g . g 1 × M P h e n o l   g . m o l 1 × C ° m o l . L 1
where MPhenol is the phenol molar mass = 94.11 g.mol−1 and the factor 1000 to convert g to mg.
The enthalpy (ΔH°) and entropy (ΔS°) parameters were estimated from the classical relationships [47,48,49]:
Δ G ° = Δ H ° T Δ S °
l n K L ° = Δ S ° R Δ H ° R T
The plot was drawn between ln KL° versus 1/T and the determined slope and intercept was used to calculated ΔH° (kJ.mol−1) and ΔS° (J.mol−1), respectively (see Table 5).
The value of ΔH° was negative, indicating that the process of phenol adsorption by PAC is exothermic and the adsorption behavior may be of physical nature [50]. The value of ΔH° < 40 kJ.mol−1, suggesting a physically driven process [49]. The positive and small value of ΔS° indicated that the adsorption proceeds with an increase in the number of species at solid–solution interfaces, showing an increased disorder and randomness at the solid–solution interface during the adsorption of phenol on the activated carbon [51,52]. The variation of ∆G° was negative for all the temperatures studied, which confirmed the feasibility and spontaneous nature of the phenol adsorption by PAC [51,53].

3.7. KNN Model

The goal in this work, as previously reported, was to develop the KNN model. The 11 distance metrics (Euclidean, Chebychev, Minkowski, Mahalanobis, Cosine, Correlation, Spearman, Hamming, Jaccard, Cityblock, Seuclidean) were optimized with their distance weighting functions (equal, inverse and squared inverse). From this, each metric distance was optimized for its specific parameters by GWO (number of neighbors and exponent in the case of cubic “Minkowski” distance metrics).
Table 6 shows the results of optimizing the 11 distance metrics and their weighting functions, distance. It also shows the statistical coefficients and errors (R, R2, R2adj, RMSE, MSE, MAE) for training data, validation data, and for all data (training+validation) according to specific parameters (num neighbors and exponent). In addition, the GWO settings were used for optimization.
The results of Table 6 show that most of the models have coefficients (R, R2, R2adj) equal to 1 with very low statistical errors (almost 0) in the learning phase (except distance weight “equal” of each distance, and the “Spearman” distance with the three distance weights, “Equal, Inverse and Inverse Squared”, which were very small).
This is why the choice of the best model was based on the coefficients and the statistical errors of the validation phase.
According to the results reported in Table 6, the “Jaccard” distance with distance weight “Squared Inverse” led to the best results for the coefficients and the statistical errors compared to the other models in the validation phase, R, R2, R2adj, RMSE, MSE, and MAE were 0.9971, 0.9942, 0.9935, 0.0156, 0.0002, and 0.0078, respectively.
This result was confirmed by the statistical coefficients and errors obtained for all the data (the training and validation data): R, R2, R2adj, RMSE, MSE, and MAE were 0.9999, 0.9998, 0.9998, 0.0070, 0.2347, and 0.2763, respectively. In addition, the statistical coefficients and errors of the learning phase were: R = 1.0000, R2 = 1.0000, R2adj = 1.0000, RMSE = 0.0010, MSE = 0.0000, and MAE = 0.0001.
From these results, the model optimized by the distance “Jaccard” with distance weight “Squared Inverse” was considered as the best one, and it is presented graphically in Figure 9.

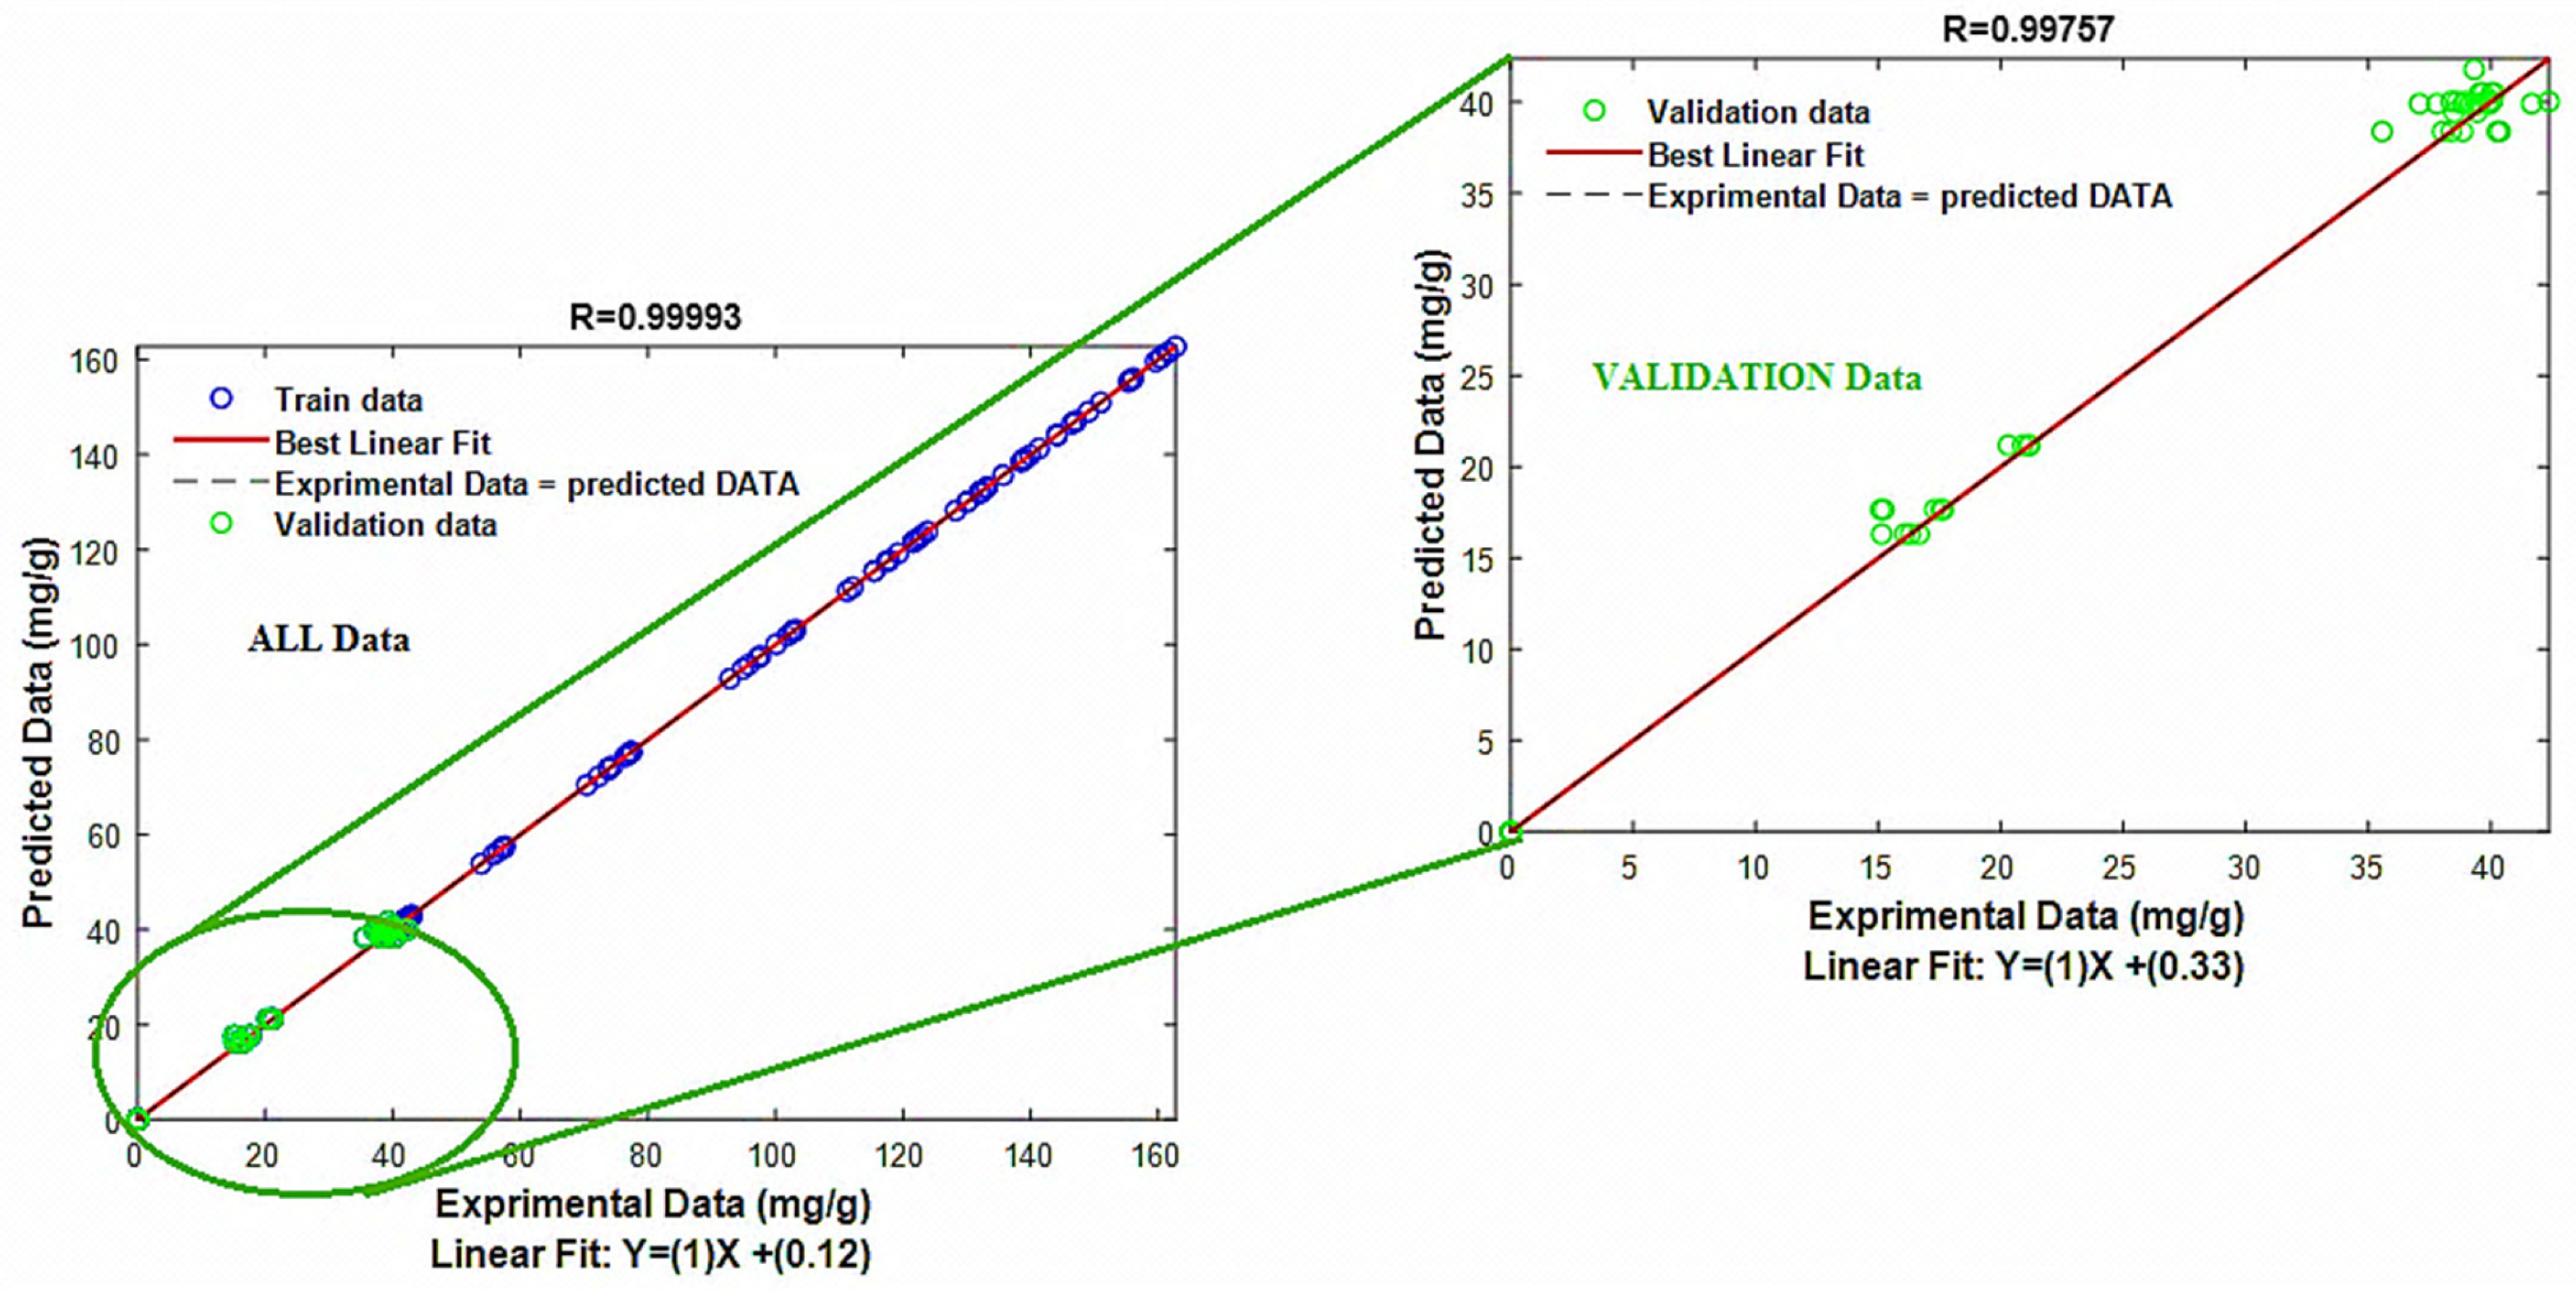
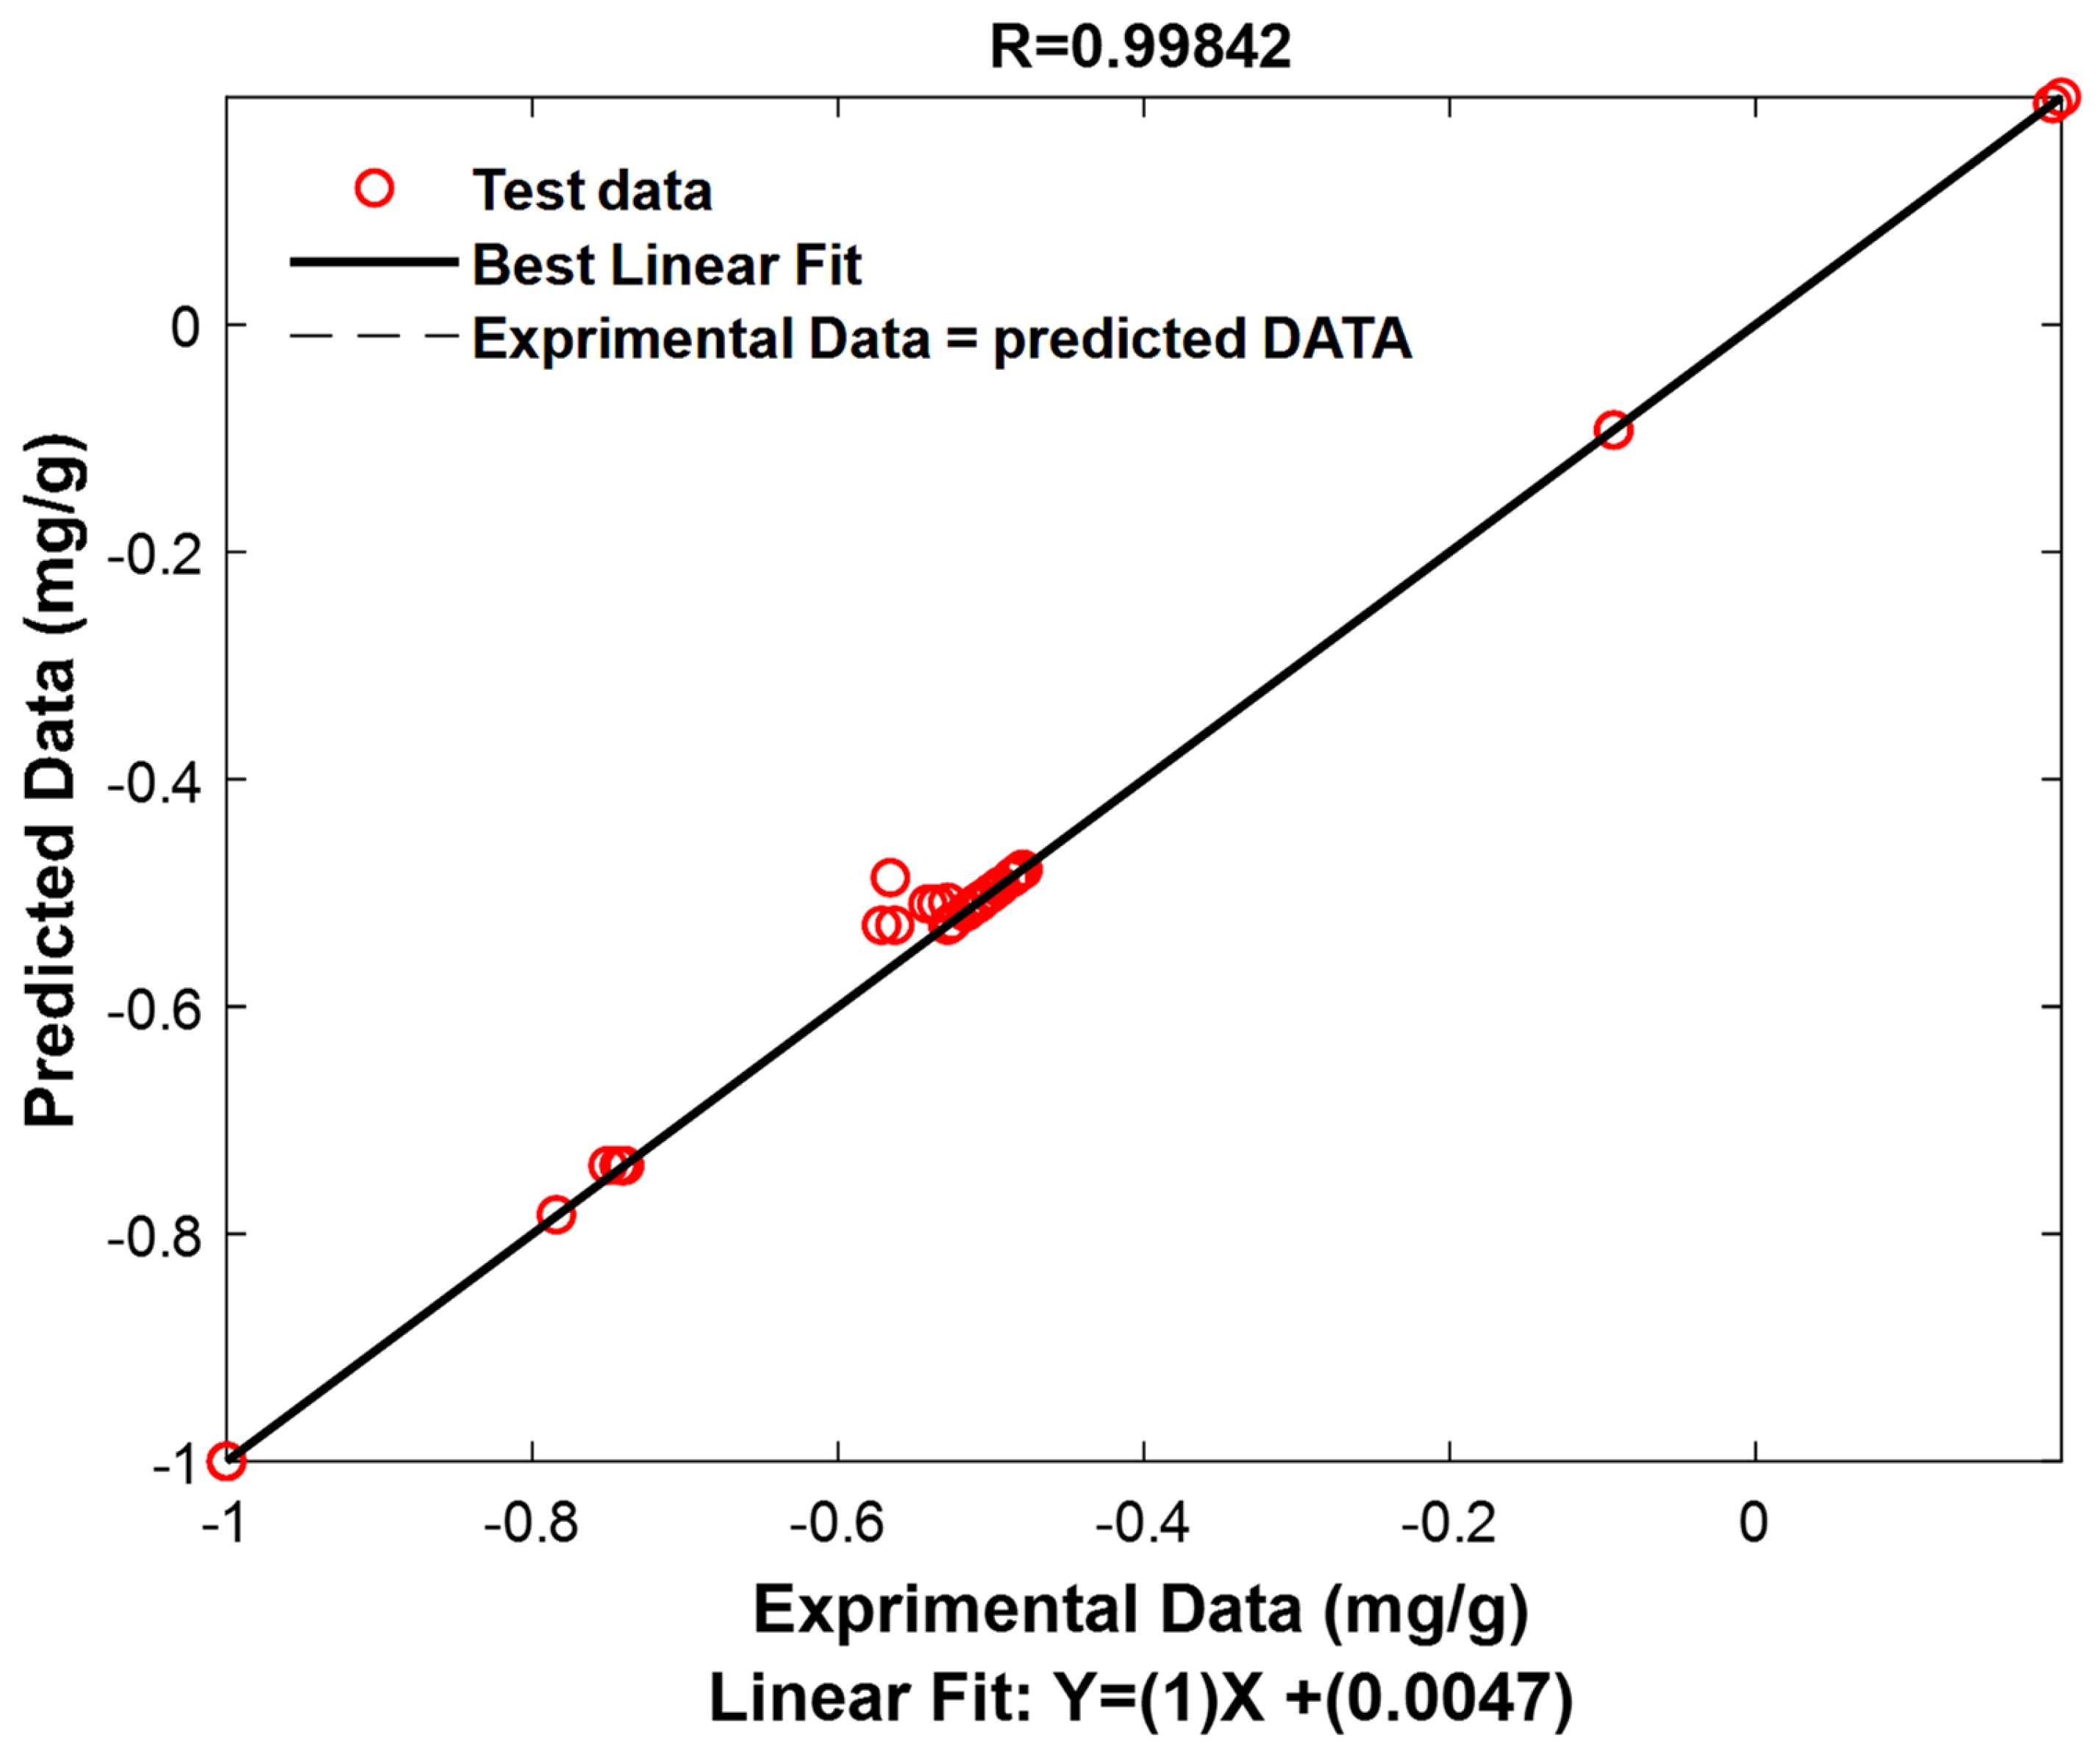
3.7.1. Model Performance Test

In order to test the performance of the KNN_ GWO model, which was obtained by the distance “Jaccard” with distance weight “Squared Inverse”, an interpolation was carried out. For this, a previously cached database containing 50 experimental data points was used, and this database was not used in training the model. The results are presented in Table 7 in terms of coefficients and statistical errors.
Table 7 shows very high coefficients, showing the performance and efficiency of our model.
This result was represented graphically (Figure 10) in terms of the experimental values and the predicted values.

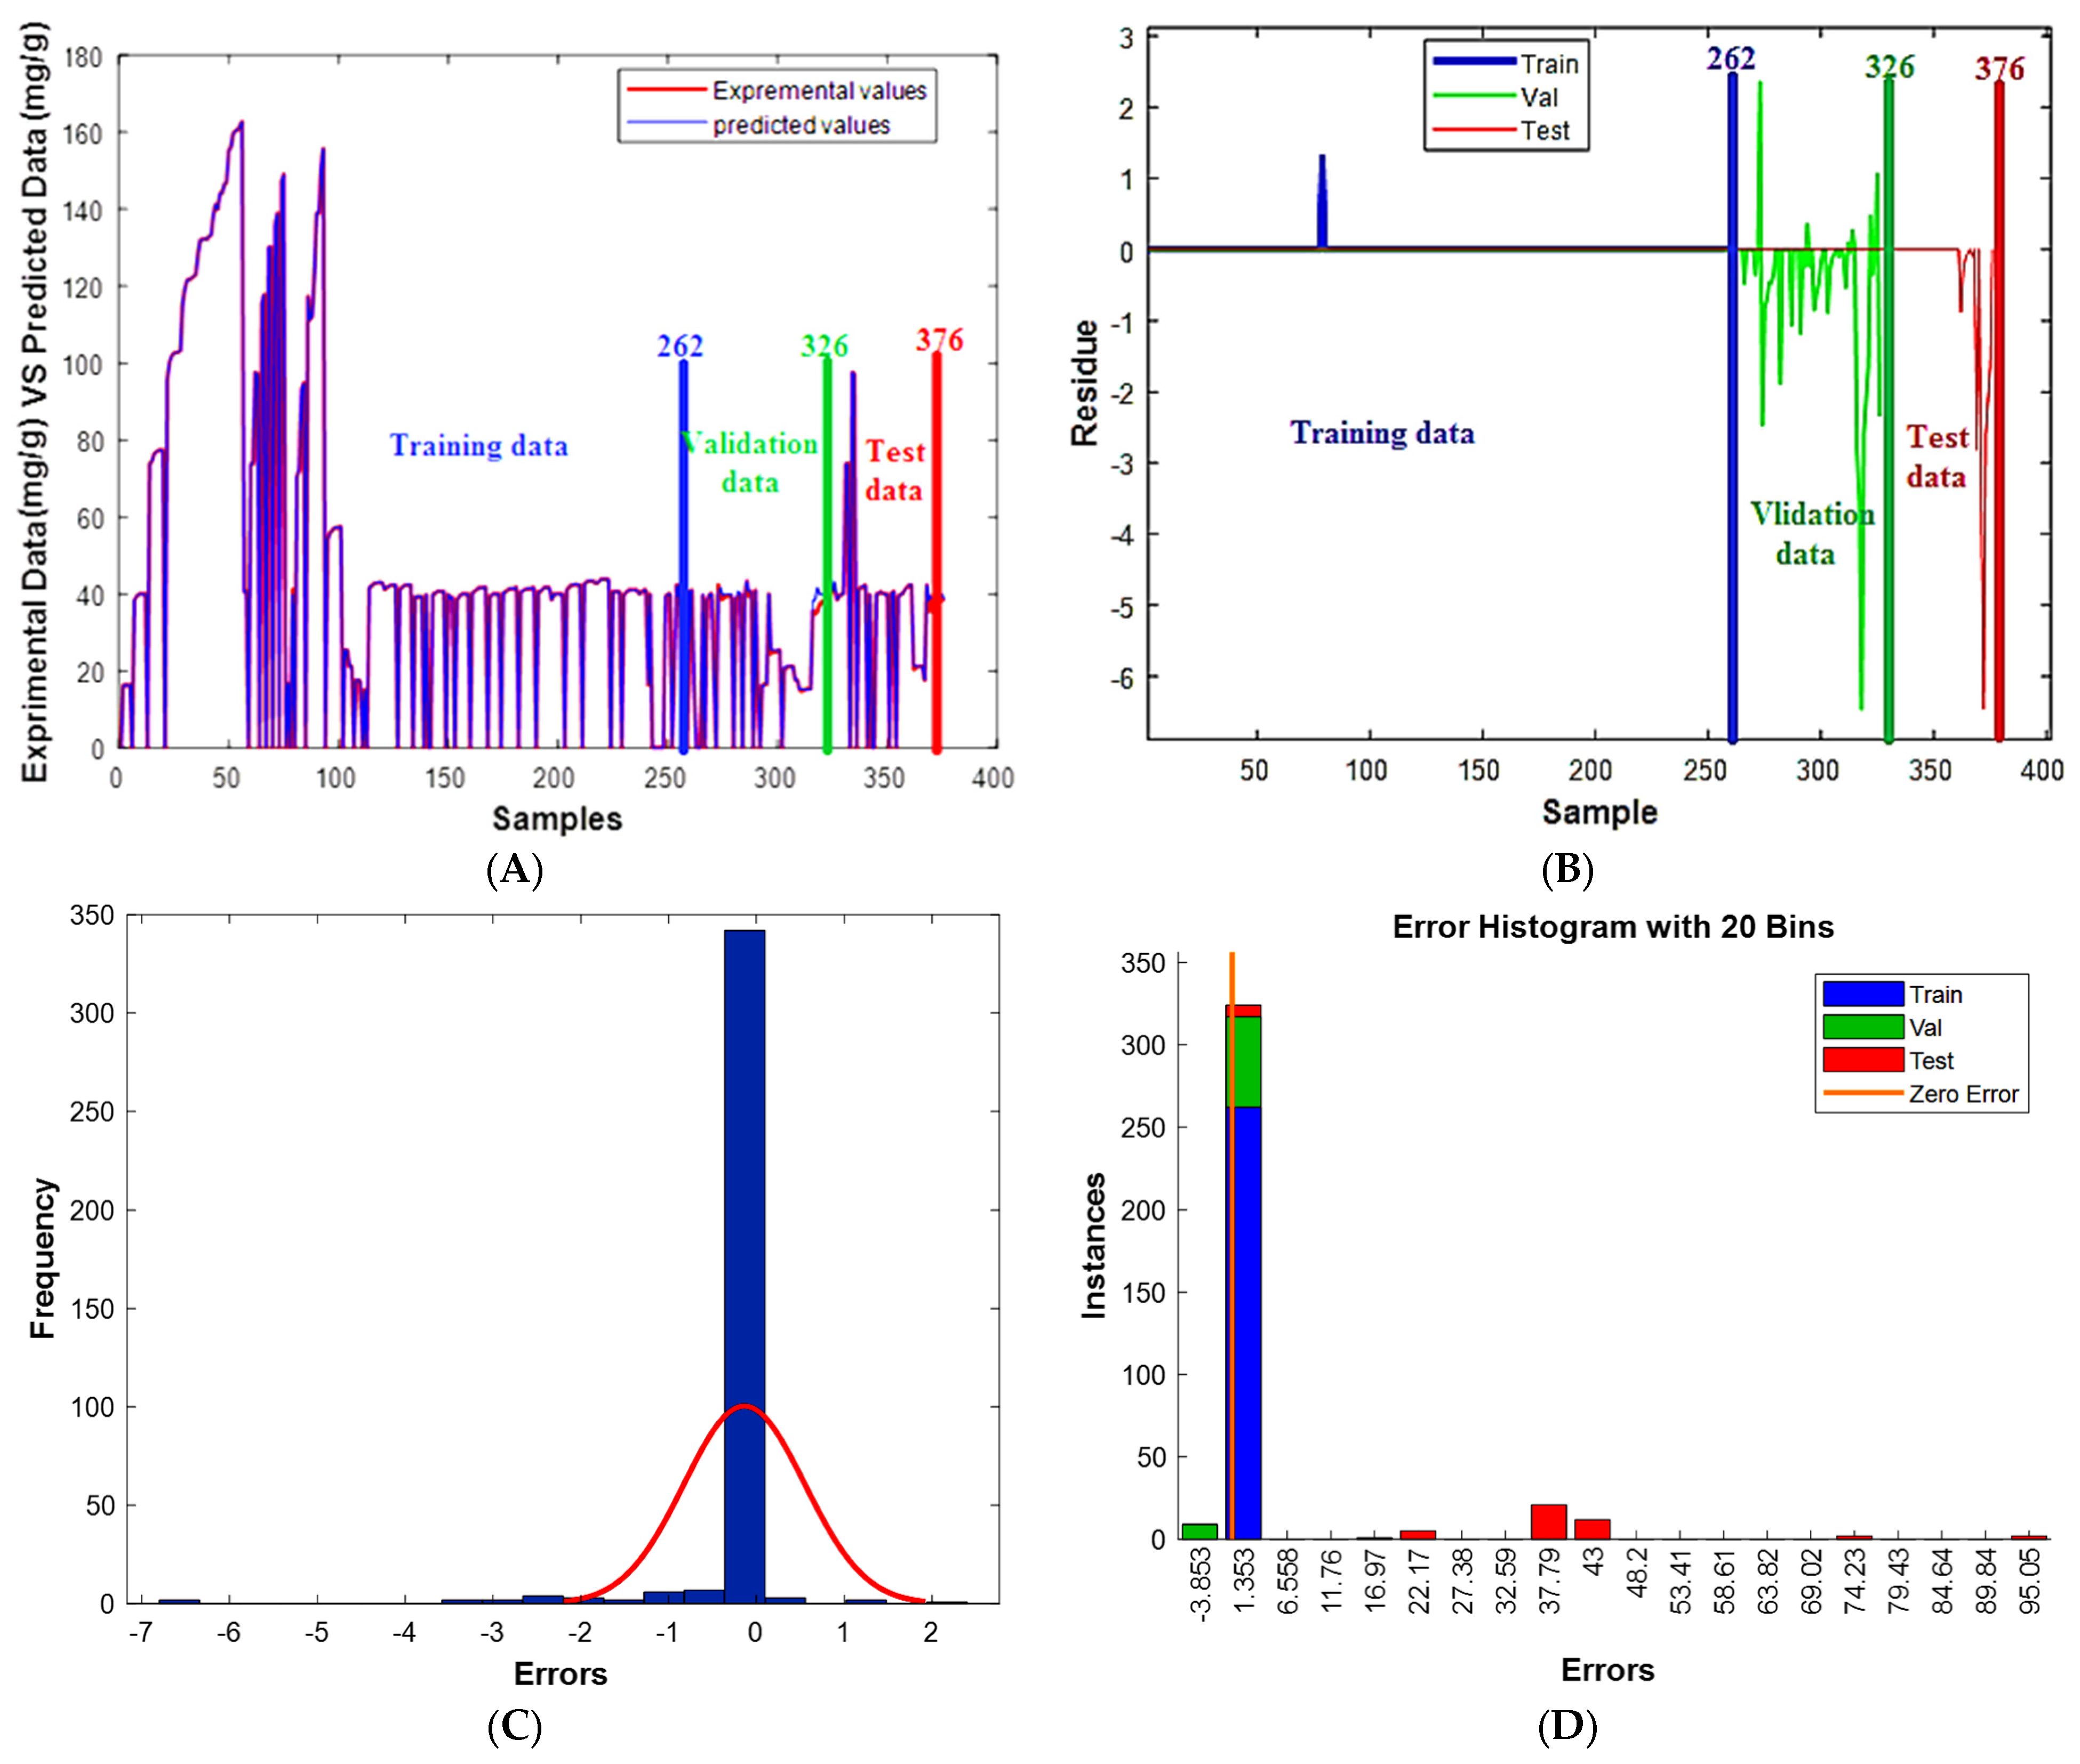
3.7.2. Residues Study

The method of residuals was used in this work in order to study the relationship of the experimental values with the predicted values, on the one hand, and the efficiency and performance of the selected model, on the other hand [2,8]. For this purpose, the experimental values and the predicted values were plotted in parallel as a function of samples (Figure 11A) for all data (including data training, data validation, and data test performance) [8,9,10].
On the other hand, the error was calculated by the difference between the experimental values and the predicted values for all data (including data training, data validation, and data test performance). This error was plotted graphically (Figure 11B–D) by three methods (residue, frequency, and instances) [19,20,21,54,55].
Figure 11A shows the high convergence between the experimental values and the predicted values, confirming once again the effectiveness of the obtained model.
Moreover, Figure 11B shows small errors obtained in the three phases. Indeed, in the training phase, the error did not exceed 2 mg.g−1; in the validation phase, the error values were in the intervals [−7–3], and the error values of the test phase were in the intervals [−7–0]. It can be therefore concluded that the errors obtained from our model are very small. This was again confirmed at the examination of Figure 11C and 11D, which shows that a very high frequency was obtained with zero error for the former (Figure 11C) and that most errors were 0, regardless of training, validation, and testing data for the latter (Figure 11D).
From these results and interpretations, the efficiency and performance of our model based on the distance “Jaccard” with distance weight “Squared Inverse” is demonstrated.

3.7.3. Optimization of the Optimal Analysis and Validation

An optimization method was run using GWO and PSO to find the optimum of the independent parameters to obtain the maximum adsorption quantity of phenol. The optimization results are displayed in Table 8.
Table 8 shows that the optima obtained by the two algorithms, GWO and particle swarm (PSO), were almost equal (Figure 11A,B). By comparing the predicted values of adsorbed phenol obtained by the optimal conditions of GWO and PSO with the experimental value, it is seen that the results obtained are the same (Figure 11C), with very small error (0.6687 mg.g−1), confirming again the efficiency and performance of the KNN_GWO model.

4. Conclusions

In this study, phenol, which is considered a very hazardous substance, was efficiently removed by powdered activated carbon. The effect of operating parameters on the efficiency removal of phenol by powdered activated carbon revels that the maximum removal (99.94%) of phenol was reached at pH 8, adsorbent rate of 0.6 g.L−1, and temperature of 20 °C when using an initial concentration of phenol of 20 mg.L−1.
Batch adsorption experiments allowed the determination of adsorption isotherm parameters. The results of the equilibrium data modeling show that the Langmuir, Freundlich, and Temkin isotherms fit the experimental data very well. The maximum adsorption capacity values found by Langmuir were 146.9, 150.8, and 156.26 mg.g−1 for temperature values 20, 30, and 40°C respectively.
The adsorption kinetic was well described by the pseudo-second-order model, while the intra-particle diffusion was not the only mechanism controlling the kinetics adsorption of phenol; kinetic data was controlled by the external diffusion (by macropore and mesopore) and the micropore diffusion. The thermodynamic study revealed that the adsorption of phenol by activated carbon is spontaneous, exothermic, and physical, and proceeds with an increase randomness at the solid–solution interface.
The KNN_GWO model showed an advantage of giving more precise values related to very high statistical coefficients (close to 1) and very low statistical errors (close to 0). Moreover, the efficiency of the model was confirmed by several techniques, including test interpolation, residual studies, and by validation of the optimal input conditions. Hence, the results obtained showed a very high efficiency and performance.

Author Contributions

Conceptualization, M.Z., M.C., Z.K. and L.M.; methodology, Z.K., M.C. and M.Z.; validation, J.-C.B., A.A., H.T. and L.M.; formal analysis, M.Z. and M.K.; investigation, M.Z.; resources, L.M. and M.K.; data curation, Z.K., M.C. and L.M.; writing—review and editing, L.M., A.A. and J.-C.B.; visualization, M.Z., L.M. and J.-C.B.; supervision, L.M., A.A. and J.-C.B.; project administration, L.M. and M.Z. All authors have read and agreed to the published version of the manuscript.

Funding

This research received no external funding.

Data Availability Statement

Not applicable.

Acknowledgments

The authors wish to thank all who assisted in conducting this work.

Conflicts of Interest

The authors declare no conflict of interest.

References

  1. Mishra, R.; Dubey, S. Fresh Water Availability and It’s Global Challenge. Int. J. Eng. Sci. Invent. Res. Dev. 2015, 2, 351–407. [Google Scholar]
  2. Bruce, R.M.; Santodonato, J.; Neal, M.W. Summary Review of the Health Effects Associated with Phenol. Toxicol. Ind. Health 1987, 3, 535–568. [Google Scholar] [CrossRef] [PubMed]
  3. Chimuka, L.; Nefale, F.; Masevhe, A. Determination of phenols in water samples using a supported liquid membrane extraction probe and liquid chromatography with photodiode array detection. S. Afr. J. Chem. 2007, 60, 102–108. [Google Scholar]
  4. Puszkarewicz, A.; Kaleta, J.T.; Papciak, D. Adsorption of Phenol from Water on Natural Minerals. J. Ecol. Eng. 2018, 19, 132–138. [Google Scholar] [CrossRef]
  5. Dehmani, Y.; Khalki, O.E.; Mezougane, H.; Abouarnadasse, S. Comparative study on adsorption of cationic dyes and phenol by natural clays. Chem. Data Collect. 2021, 33, 100674. [Google Scholar] [CrossRef]
  6. Dehmani, Y.; Dridi, D.; Lamhasni, T.; Abouarnadasse, S.; Chtourou, R.; Lima, E.C. Review of phenol adsorption on transition metal oxides and other adsorbents. J. Water Process. Eng. 2022, 49, 102965. [Google Scholar] [CrossRef]
  7. Lammini, A.; Dehbi, A.; Omari, H.; Elazhari, K.; Mehanned, S.; Bengamra, Y.; Dehmani, Y.; Rachid, O.; Alrashdi, A.A.; Gotore, O.; et al. Experimental and theoretical evaluation of synthetized cobalt oxide for phenol adsorption: Adsorption isotherms, kinetics, and thermodynamic studies. Arab. J. Chem. 2022, 15, 104364. [Google Scholar] [CrossRef]
  8. Dehmani, Y.; Lainé, J.; Daouli, A.; Sellaoui, L.; Bonilla-Petriciolet, A.; Lamhasni, T.; Abouarnadasse, S.; Badawi, M. Unravelling the adsorption mechanism of phenol on zinc oxide at various coverages via statistical physics, artificial neural network modeling and ab initio molecular dynamics. Chem. Eng. J. 2023, 452, 139171. [Google Scholar] [CrossRef]
  9. Ahangar, R.M.; Farmanzadeh, D. Theoretical study for exploring the adsorption behavior of aniline and phenol on pristine and Cu-doped phosphorene surface. Appl. Surf. Sci. 2023, 614, 156194. [Google Scholar] [CrossRef]
  10. Dougna, A.A.; Gombert, B.; Kodom, T.; Djaneye-Boundjou, G.; Boukari, S.O.B.; Leitner, N.K.V.; Bawa, L.M. Photocatalytic removal of phenol using titanium dioxide deposited on different substrates: Effect of inorganic oxidants. J. Photochem. Photobiol. A Chem. 2015, 305, 67–77. [Google Scholar] [CrossRef]
  11. Yasmina, M.; Mourad, K.; Mohammed, S.H.; Khaoula, C. Treatment Heterogeneous Photocatalysis; Factors Influencing the Photocatalytic Degradation by TiO2. Energy Procedia 2014, 50, 559–566. [Google Scholar] [CrossRef] [Green Version]
  12. Suzuki, H.; Araki, S.; Yamamoto, H. Evaluation of advanced oxidation processes (AOP) using O3, UV, and TiO2 for the degradation of phenol in water. J. Water Process Eng. 2015, 7, 54–60. [Google Scholar] [CrossRef]
  13. García-Ballesteros, S.; Mora, M.; Vicente, R.; Vercher, R.F.; Sabater, C.; Castillo, M.A.; Amat, A.M.; Arques, A. A new methodology to assess the performance of AOPs in complex samples: Application to the degradation of phenolic compounds by O3 and O3/UV-A–Vis. Chemosphere 2019, 222, 114–123. [Google Scholar] [CrossRef]
  14. Chedri Mammar, A.; Mouni, L.; Bollinger, J.-C.; Belkhiri, L.; Bouzaza, A.; Assadi, A.A.; Belkacemi, H. Modeling and optimization of process parameters in elucidating the adsorption mechanism of Gallic acid on activated carbon prepared from date stones. Sep. Sci. Technol. 2020, 55, 3113–3125. [Google Scholar] [CrossRef]
  15. Ververi, M.; Goula, A.M. Pomegranate peel and orange juice by-product as new biosorbents of phenolic compounds from olive mill wastewaters. Chem. Eng. Process. Process Intensif. 2019, 138, 86–96. [Google Scholar] [CrossRef]
  16. Sahu, J.N.; Karri, R.R.; Jayakumar, N.S. Improvement in phenol adsorption capacity on eco-friendly biosorbent derived from waste Palm-oil shells using optimized parametric modelling of isotherms and kinetics by differential evolution. Ind. Crops Prod. 2021, 164, 113333. [Google Scholar] [CrossRef]
  17. Franco, D.S.P.; Georgin, J.; Netto, M.S.; Allasia, D.; Oliveira, M.L.S.; Foletto, E.L.; Dotto, G.L. Highly effective adsorption of synthetic phenol effluent by a novel activated carbon prepared from fruit wastes of the Ceiba speciosa forest species. J. Environ. Chem. Eng. 2021, 9, 105927. [Google Scholar] [CrossRef]
  18. Park, K.-H.; Balathanigaimani, M.S.; Shim, W.-G.; Lee, J.-W.; Moon, H. Adsorption characteristics of phenol on novel corn grain-based activated carbons. Microporous Mesoporous Mater. 2010, 127, 1–8. [Google Scholar] [CrossRef]
  19. Adithiyaa, T.; Chandramohan, D.; Sathish, T. Optimal prediction of process parameters by GWO-KNN in stirring-squeeze casting of AA2219 reinforced metal matrix composites. Mater. Today Proc. 2020, 21, 1000–1007. [Google Scholar] [CrossRef]
  20. Parul Sinha, P.S. Comparative Study of Chronic Kidney Disease Prediction using KNN and SVM. Int. J. Eng. Res. Technol. 2015, 4, 608–612. [Google Scholar] [CrossRef]
  21. Mirjalili, S.; Mirjalili, S.M.; Lewis, A. Grey Wolf Optimizer. Adv. Eng. Softw. 2014, 69, 46–61. [Google Scholar] [CrossRef] [Green Version]
  22. Tahraoui, H.; Amrane, A.; Belhadj, A.-E.; Zhang, J. Modeling the organic matter of water using the decision tree coupled with bootstrap aggregated and least-squares boosting. Environ. Technol. Innov. 2022, 27, 102419. [Google Scholar] [CrossRef]
  23. Tahraoui, H.; Belhadj, A.-E.; Amrane, A.; Houssein, E.H. Predicting the concentration of sulfate using machine learning methods. Earth Sci. Inform. 2022, 15, 1023–1044. [Google Scholar] [CrossRef]
  24. Tahraoui, H.; Belhadj, A.-E.; Hamitouche, A.-e.; Bouhedda, M.; Amrane, A. Predicting the concentration of sulfate (SO42-) in drinking water using artificial neural networks: A case study: Médéa-Algeria. Desalin. Water Treat. 2021, 217, 181–194. [Google Scholar] [CrossRef]
  25. Tahraoui, H.; Belhadj, A.; Moula, N.; Bouranene, S.; Amrane, A. Optimisation and Prediction of the Coagulant Dose for the Elimination of Organic Micropollutants Based on Turbidity. Kem. Ind. 2021, 70, 675–691. [Google Scholar] [CrossRef]
  26. Xie, B.; Qin, J.; Wang, S.; Li, X.; Sun, H.; Chen, W. Adsorption of Phenol on Commercial Activated Carbons: Modelling and Interpretation. Int. J. Environ. Res. Public Health 2020, 17, 789. [Google Scholar] [CrossRef] [Green Version]
  27. Yao, J.; Wen, J.; Li, H.; Yang, Y. Surface functional groups determine adsorption of pharmaceuticals and personal care products on polypropylene microplastics. J. Hazard. Mater. 2022, 423, 127131. [Google Scholar] [CrossRef]
  28. Lima, E.C.; Sher, F.; Guleria, A.; Saeb, M.R.; Anastopoulos, I.; Tran, H.N.; Hosseini-Bandegharaei, A. Is one performing the treatment data of adsorption kinetics correctly? J. Environ. Chem. Eng. 2021, 9, 104813. [Google Scholar] [CrossRef]
  29. Simonin, J.-P. On the comparison of pseudo-first order and pseudo-second order rate laws in the modeling of adsorption kinetics. Chem. Eng. J. 2016, 300, 254–263. [Google Scholar] [CrossRef] [Green Version]
  30. Guo, X.; Wang, J. Comparison of linearization methods for modeling the Langmuir adsorption isotherm. J. Mol. Liq. 2019, 296, 111850. [Google Scholar] [CrossRef]
  31. Tran, H.N.; You, S.-J.; Hosseini-Bandegharaei, A.; Chao, H.-P. Mistakes and inconsistencies regarding adsorption of contaminants from aqueous solutions: A critical review. Water Res. 2017, 120, 88–116. [Google Scholar] [CrossRef]
  32. Zamouche, M.; Mouni, L.; Ayachi, A.; Merniz, I. Use of commercial activated carbon for the purification of synthetic water polluted by a pharmaceutical product. Desalin. Water Treat. 2019, 172, 86–95. [Google Scholar] [CrossRef]
  33. Atunwa, B.T.; Dada, A.O.; Inyinbor, A.A.; Pal, U. Synthesis, physiochemical and spectroscopic characterization of palm kernel shell activated carbon doped AgNPs (PKSAC@AgNPs) for adsorption of chloroquine pharmaceutical waste. Mater. Today Proc. 2022, 65, 3538–3546. [Google Scholar] [CrossRef]
  34. Girish, C.R.; Ramachandra Murty, V. Adsorption of Phenol from Aqueous Solution Using Lantana camara, Forest Waste: Kinetics, Isotherm, and Thermodynamic Studies. Int. Sch. Res. Not. 2014, 2014, 201626. [Google Scholar] [CrossRef] [Green Version]
  35. Abdelwahab, O.; Amin, N.K. Adsorption of phenol from aqueous solutions by Luffa cylindrica fibers: Kinetics, isotherm and thermodynamic studies. Egypt. J. Aquat. Res. 2013, 39, 215–223. [Google Scholar] [CrossRef] [Green Version]
  36. El Gaidoumi, A.; Benabdallah, A.; Lahrichi, A.; Kherbeche, A. Adsorption of phenol in aqueous medium by a raw and treated moroccan pyrophyllite. J. Mater. Environ. Sci. 2015, 6, 2247–2259. [Google Scholar]
  37. De la Luz-Asunción, M.; Sánchez-Mendieta, V.; Martínez-Hernández, A.L.; Castaño, V.M.; Velasco-Santos, C. Adsorption of Phenol from Aqueous Solutions by Carbon Nanomaterials of One and Two Dimensions: Kinetic and Equilibrium Studies. J. Nanomater. 2015, 2015, 405036. [Google Scholar] [CrossRef] [Green Version]
  38. Gundogdu, A.; Duran, C.; Senturk, H.B.; Soylak, M.; Ozdes, D.; Serencam, H.; Imamoglu, M. Adsorption of Phenol from Aqueous Solution on a Low-Cost Activated Carbon Produced from Tea Industry Waste: Equilibrium, Kinetic, and Thermodynamic Study. J. Chem. Eng. Data 2012, 57, 2733–2743. [Google Scholar] [CrossRef]
  39. Hudaib, B. Treatment of real industrial wastewater with high sulfate concentrations using modified Jordanian kaolin sorbent: Batch and modelling studies. Heliyon 2021, 7, e08351. [Google Scholar] [CrossRef]
  40. Weber, W.J.; Morris, J.C. Kinetics of Adsorption on Carbon from Solution. J. Sanit. Eng. Div. 1963, 89, 31–59. [Google Scholar] [CrossRef]
  41. Kiki, C.; Qiu, Y.; Wang, Q.; Ifon, B.E.; Qin, D.; Chabi, K.; Yu, C.-P.; Zhu, Y.-G.; Sun, Q. Induced aging, structural change, and adsorption behavior modifications of microplastics by microalgae. Environ. Int. 2022, 166, 107382. [Google Scholar] [CrossRef]
  42. Jnr, M.H.; Spiff, A.I. Effects of temperature on the sorption of Pb2+ and Cd2+ from aqueous solution by Caladium bicolor (Wild Cocoyam) biomass. Electron. J. Biotechnol. 2005, 8, 43–50. [Google Scholar]
  43. Fierro, V.; Torné-Fernández, V.; Montané, D.; Celzard, A. Adsorption of phenol onto activated carbons having different textural and surface properties. Microporous Mesoporous Mater. 2008, 111, 276–284. [Google Scholar] [CrossRef]
  44. Dada, A.O.; Olalekan, A.P.; Olatunya, A.M.; Dada, O.J.I.J.C. Langmuir, Freundlich, Temkin and Dubinin–Radushkevich Isotherms Studies of Equilibrium Sorption of Zn 2+ Unto Phosphoric Acid Modified Rice Husk. J. Appl. Chem. 2012, 3, 38–45. [Google Scholar]
  45. Kumar, P.; Das, S. Kinetics and adsorption isotherm model of 2-thiouracil adsorbed onto the surface of reduced graphene oxide-copper oxide nanocomposite material. J. Mol. Struct. 2022, 1268, 133723. [Google Scholar] [CrossRef]
  46. Dawood, S.; Sen, T.K. Removal of anionic dye Congo red from aqueous solution by raw pine and acid-treated pine cone powder as adsorbent: Equilibrium, thermodynamic, kinetics, mechanism and process design. Water Res. 2012, 46, 1933–1946. [Google Scholar] [CrossRef]
  47. Tran, H.N. Improper estimation of thermodynamic parameters in adsorption studies with distribution coefficient KD (qe/Ce) or Freundlich constant (KF): Conclusions from the derivation of dimensionless thermodynamic equilibrium constant and suggestions. Adsorpt. Sci. Technol. 2022, 2022, 5553212. [Google Scholar] [CrossRef]
  48. Mouni, L.; Belkhiri, L.; Bollinger, J.-C.; Bouzaza, A.; Assadi, A.; Tirri, A.; Dahmoune, F.; Madani, K.; Remini, H. Removal of Methylene Blue from aqueous solutions by adsorption on Kaolin: Kinetic and equilibrium studies. Appl. Clay Sci. 2018, 153, 38–45. [Google Scholar] [CrossRef]
  49. Imessaoudene, A.; Cheikh, S.; Bollinger, J.-C.; Belkhiri, L.; Tiri, A.; Bouzaza, A.; El Jery, A.; Assadi, A.; Amrane, A.; Mouni, L. Zeolite Waste Characterization and Use as Low-Cost, Ecofriendly, and Sustainable Material for Malachite Green and Methylene Blue Dyes Removal: Box-Behnken Design, Kinetics, and Thermodynamics. Appl. Sci. 2022, 12, 7587. [Google Scholar] [CrossRef]
  50. Mohammed, N.A.S.; Abu-Zurayk, R.A.; Hamadneh, I.; Al-Dujaili, A.H. Phenol adsorption on biochar prepared from the pine fruit shells: Equilibrium, kinetic and thermodynamics studies. J. Environ. Manag. 2018, 226, 377–385. [Google Scholar] [CrossRef]
  51. Lima, H.H.C.; Maniezzo, R.S.; Llop, M.E.G.; Kupfer, V.L.; Arroyo, P.A.; Guilherme, M.R.; Rubira, A.F.; Girotto, E.M.; Rinaldi, A.W. Synthesis and characterization of pecan nutshell-based adsorbent with high specific area and high methylene blue adsorption capacity. J. Mol. Liq. 2019, 276, 570–576. [Google Scholar] [CrossRef]
  52. Kumbhar, P.; Narale, D.; Bhosale, R.; Jambhale, C.; Kim, J.-H.; Kolekar, S. Synthesis of tea waste/Fe3O4 magnetic composite (TWMC) for efficient adsorption of crystal violet dye: Isotherm, kinetic and thermodynamic studies. J. Environ. Chem. Eng. 2022, 10, 107893. [Google Scholar] [CrossRef]
  53. Kasbaji, M.; Mennani, M.; Grimi, N.; Barba, F.J.; Oubenali, M.; Simirgiotis, M.J.; Mbarki, M.; Moubarik, A. Implementation and physico-chemical characterization of new alkali-modified bio-sorbents for cadmium removal from industrial discharges: Adsorption isotherms and kinetic approaches. Process Biochem. 2022, 120, 213–226. [Google Scholar] [CrossRef]
  54. Tahraoui, H.; Belhadj, A.; Hamitouche, A.-E. Prediction of the Bicarbonate Amount in Drinking Water in the Region of Médéa Using Artificial Neural Network Modelling. Kem. Ind. 2020, 69, 595–602. [Google Scholar] [CrossRef]
  55. Bousselma, A.; Abdessemed, D.; Tahraoui, H.; Amrane, A. Artificial Intelligence and Mathematical Modelling of the Drying Kinetics of Pre-treated Whole Apricots. Kem. Ind. 2021, 70, 651–667. [Google Scholar] [CrossRef]
Figure 1. Effect of the mass volume ratio of PAC on the removal of phenol. (C0 = 25 mg.L−1, w = 300 rpm, T = 20 °C).
Water 15 00493 g001
Figure 2. Percent removal of phenol by PAC as a function of the initial concentration (a), amount of phenol adsorbed as a function of time at different phenol initial concentration (b) (r = 0.6 g.L−1, w = 300 rpm, T = 20 °C).
Water 15 00493 g002
Figure 3. Percentage of elimination of phenol (a) and amount adsorbed of phenol (b) by PAC as a function of temperature. (r = 0.6 g.L−1, w = 300 rpm, C0 = 25 mg.L−1).
Water 15 00493 g003
Figure 4. Evolution of the percent removal (a) and amount adsorbed of phenol (b) at equilibrium as a function of the stirring speed (r = 0.6 g.L−1, T = 20 °C, C0 = 25 mg.L−1).
Water 15 00493 g004
Figure 5. Evolution of the percentage removal (a) and amount adsorbed of phenol (b) at equilibrium as a function of the pH of the solution (r = 0.6 g.L−1, T = 20 °C, C0 = 25 mg.L−1, w = 300 rpm).
Water 15 00493 g005
Figure 6. (a) Interaction mechanism between AC surface functions and phenol. (b) Phenol dissociation at pH > pKa.
Water 15 00493 g006
Figure 7. Phenol adsorption isotherms by PAC at different temperatures of 20, 30, and 40 °C.
Water 15 00493 g007
Figure 8. Nonlinear fitting of the equilibrium data by Langmuir, Freundlich, and Temkin isotherms at different temperatures (a) T = 20 °C; (b) T = 30 °C, (c) T = 40 °C.
Water 15 00493 g008aWater 15 00493 g008b
Figure 9. Comparison between experimental and predicted values.
Water 15 00493 g009
Figure 10. Comparison between experimental and predicted values to assess performance.
Water 15 00493 g010
Figure 11. Residuals relating to the models established by the different techniques according to the estimated values: (A) Relationship between experimental data and the predicted data of samples, (B) residues relating to the models established, (C) frequency distribution of errors, and (D) instances distribution of errors.
Water 15 00493 g011
Table 1. Results of PAC characterization.
ParametersValue
pHPZC7.5
S(BET) (m2.g−1)463.4
Ø (pore size) (Å)27.36
ṽ (total pore volume) (cm3.g−1)0.13
Iodine number (mg.g−1)752
Methylene blue number (mg.g−1)244
Strong acid carboxylic group (meq.g−1)0.026
Hydroxyl and phenol groups (meq.g−1)0.725
Table 2. Kinetics parameters of Lagergren and Blanchard for different initial concentrations of phenol.
C0 (mg.L−1)qeexp (mg.g−1)LagergrenBlanchard
k1
(1.min−1)
qetheo
(mg.g−1)
R2k2
(g.mg−1.min−1)
qetheo
(mg.g−1)
R2
1016.310.2900.0040.4770.33916.361
2540.020.24613.3350.8960.13540.161
5077.340.379141.580.8540.03678.1251
75103.10.09518.240.7740.025104.21
100123.10.196101.250.6320.021123.51
125133.20.08113.560.5890.038133.31
150146.950.191159.620.6240.01147.00.999
200162.70.06926.080.6480.014163.90.999
Table 3. Kinetics parameters of Weber and Morris for different initial concentrations of phenol.
C0 (mg.L−1)10255075100125150200
Kd1 (mg.mg−1 min−1/2)5.45713.33825.28333.72340.28544.63547.87453.08
Cd1 (mg.g−1)0.6661.9383.9174.6145.7576.4397.1248.30
R1²0.9510.9310.9230.9390.9330.9320.9280.921
Kd2 (mg.mg−1 min−1/2)−1 × 10−140.0440.5060.3510.4500.3492.0510.893
Cd2 (mg.g−1)16.31539.70474.135100.45119.36130.34131.56155.4
R2²−7 × 10−150.7730.9980.9130.9020.7140.9020.886
Table 4. Fitting parameters by nonlinear regression expression of Langmuir, Freundlich, and Temkin isotherms at different temperatures.
TypeLangmuirFreundlichTemkin
qm (mg.g−1)KL (L.mg−1)RLKF [(mg.g−1)/
((mg/L)1/n)]
nbT (J.mol−1)AT (L.g−1)
T = 20 °C156.260.1960.1700.97661.314.790.99242.60361.00.962
T = 30 °C146.990.1740.1870.98149.884.160.99839.8074.960.963
T = 40 °C150.80. 1180.0010.97547.644.080.99843.0088.000.958
Table 5. Thermodynamic parameters of phenol adsorption.
T (°K)KL (L.mg−1)KL° (×104) (Dimensionless)Ln KL°ΔG° (kJ.mol−1)ΔH° (KJ.mol−1)ΔS° (J.mol−1)
2930.1961.849.823−24.04−19.2316.433
3030.1741.649.704−24.20
3130.1181.119.315−24.37
Table 6. Performances of the different KNN models tested.
GWOMax_iteration = 100
SearchAgents_no = 50
DistanceDistance WeightNum NeighborsExponentlossR/R2/R2adjRMSE/MSE/MAE
TrainVALALLTrainVALALL
EuclideanEqual8 /0.53560.7938
0.6302
0.6199
0.7183
0.5159
0.4565
0.8002
0.6403
0.6324
0.3553
0.1262
0.1606
0.1448
0.0210
0.0659
0.3244
0.3317
0.3605
Inverse8 /0.02711.0000
1.0000
1.0000
0.6632
0.4398
0.3711
0.9896
0.9792
0.9788
0.0010
0.0000
0.0001
0.1650
0.0272
0.0808
0.0737
0.2768
0.3237
Squared Inverse15 /0.02711.0000
1.0000
1.0000
0.7221
0.5214
0.4627
0.9919
0.9838
0.9835
0.0010
0.0000
0.0001
0.1463
0.0214
0.0725
0.0653
0.2455
0.2905
bychevEqual12 /0.61020.7405
0.5483
0.5358
0.6528
0.4262
0.3557
0.7482
0.5597
0.5500
0.3988
0.1591
0.1964
0.1556
0.0242
0.0718
0.3636
0.2202
0.2836
Inverse7 /0.02371.0000
1.0000
1.0000
0.7036
0.4951
0.4330
0.9900
0.9802
0.9797
0.0010
0.0000
0.0001
0.1629
0.0266
0.0842
0.0728
0.2153
0.2767
Squared Inverse11 /0.03051.0000
1.0000
1.0000
0.8005
0.6408
0.5967
0.9932
0.9864
0.9861
0.0010
0.0000
0.0001
0.1332
0.0177
0.0662
0.0595
0.2977
0.3528
MinkowskiEqual11 40.56270.7172
0.5143
0.5009
0.8218
0.6753
0.6355
0.7322
0.5361
0.5259
0.4156
0.1727
0.1920
0.1149
0.0132
0.0426
0.3754
0.2907
0.3370
Inverse14 20.02711.0000
1.0000
1.0000
0.7220
0.5214
0.4626
0.9921
0.9843
0.9840
0.0010
0.0000
0.0001
0.1426
0.0203
0.0627
0.0637
0.2129
0.2830
Squared Inverse29 20.02371.0000
1.0000
1.0000
0.7511
0.5642
0.5107
0.9927
0.9854
0.9851
0.0010
0.0000
0.0001
0.1387
0.0192
0.0647
0.0619
0.2603
0.3026
MahalanobisEqual3 /0.39320.8902
0.7925
0.7868
0.7330
0.5372
0.4804
0.8920
0.7956
0.7911
0.2531
0.0640
0.0732
0.1360
0.0185
0.0507
0.2344
0.2661
0.3091
Inverse4 /0.02711.0000
1.0000
1.0000
0.6717
0.4512
0.3838
0.9909
0.9818
0.9814
0.0010
0.0000
0.0001
0.1537
0.0236
0.0697
0.0686
0.2444
0.3133
Squared Inverse25 /0.02031.0000
1.0000
1.0000
0.6895
0.4755
0.4110
0.9904
0.9810
0.9805
0.0010
0.0000
0.0001
0.1584
0.0251
0.0724
0.0707
0.1528
0.2224
CosineEqual6 /0.52200.7670
0.5883
0.5770
0.6574
0.4321
0.3624
0.7714
0.5950
0.5861
0.3746
0.1403
0.1598
0.1533
0.0235
0.0698
0.3421
0.3488
0.3663
Inverse7 /0.03051.0000
1.0000
1.0000
0.7365
0.5424
0.4862
0.9928
0.9856
0.9853
0.0010
0.0000
0.0001
0.1363
0.0186
0.0595
0.0609
0.2628
0.3039
Squared Inverse152 /0.03391.0000
1.0000
1.0000
0.7427
0.5516
0.4965
0.9919
0.9838
0.9834
0.0010
0.0000
0.0001
0.1460
0.0213
0.0702
0.0652
0.1785
0.2333
CorrelationEqual5 /0.48810.7687
0.5909
0.5796
0.6676
0.4457
0.3776
0.7756
0.6015
0.5928
0.3757
0.1412
0.1632
0.1499
0.0225
0.0725
0.3428
0.3025
0.3452
Inverse67 /0.03391.0000
1.0000
1.0000
0.7197
0.5180
0.4588
0.9916
0.9832
0.9829
0.0010
0.0000
0.0001
0.1481
0.0219
0.0723
0.0662
0.2443
0.3136
Squared Inverse101 /0.03731.0000
1.0000
1.0000
0.7284
0.5306
0.4729
0.9921
0.9843
0.9840
0.0010
0.0000
0.0001
0.1432
0.0205
0.0635
0.0640
0.2359
0.2746
SpearmanEqual3 /0.55590.6513
0.4242
0.4082
0.6004
0.3605
0.2819
0.6662
0.4438
0.4315
0.4508
0.2032
0.2098
0.1797
0.0323
0.1062
0.4113
0.2929
0.3173
Inverse6 /0.45420.6569
0.4315
0.4158
0.6158
0.3792
0.3030
0.6723
0.4520
0.4399
0.4359
0.4359
0.1791
0.1740
0.0303
0.0930
0.3977
0.3259
0.3532
Squared Inverse4 /0.47800.6534
0.4270
0.4111
0.6373
0.4062
0.3333
0.6684
0.4468
0.4346
0.4392
0.1929
0.1848
0.1725
0.0298
0.0960
0.4004
0.3133
0.3516
HammingEqual3 /0.48810.5071
0.2572
0.2366
0.9238
0.8534
0.8354
0.5241
0.2747
0.2587
0.5326
0.2837
0.2700
0.0737
0.0054
0.0232
0.4777
0.3612
0.3989
Inverse5 /0.03391.0000
1.0000
1.0000
0.9678
0.9365
0.9288
0.9991
0.9983
0.9982
0.0010
0.0000
0.0001
0.0471
0.0022
0.0169
0.0210
0.2165
0.2718
Squared Inverse4 /0.04411.0000
1.0000
1.0000
0.9894
0.9790
0.9764
0.9997
0.9994
0.9994
0.0010
0.0000
0.0001
0.0275
0.0008
0.0114
0.0123
0.2746
0.3129
JaccardEqual3 /0.50510.5119
0.2620
0.2416
0.9522
0.9066
0.8952
0.5282
0.2790
0.2631
0.5395
0.2910
0.2823
0.0583
0.0034
0.0233
0.4834
0.3731
0.4090
Inverse3 /0.04751.0000
1.0000
1.0000
0.9703
0.9414
0.9342
0.9992
0.9984
0.9984
0.0010
0.0000
0.0001
0.0452
0.0020
0.0179
0.0202
0.2700
0.3193
Squared Inverse4 /0.02011.0000
1.0000
1.0000
0.9975
0.9942
0.9935
0.9999
0.9998
0.9998
0.0010
0.0000
0.0001
0.0156
0.0002
0.0078
0.0070
0.2347
0.2763
CityblockEqual4 /0.44410.8309
0.6905
0.6819
0.7616
0.5801
0.5285
0.8364
0.6995
0.6929
0.3200
0.1024
0.1231
0.1288
0.0166
0.0529
0.2921
0.3097
0.3459
Inverse5 /0.02711.0000
1.0000
1.0000
0.7373
0.5436
0.4875
0.9924
0.9848
0.9844
0.0010
0.0000
0.0001
0.1407
0.0198
0.0637
0.0628
0.2579
0.2991
Squared Inverse18 /0.02371.0000
1.0000
1.0000
0.7286
0.5308
0.4732
0.9922
0.9844
0.9840
0.0010
0.0000
0.0001
0.1424
0.0203
0.0636
0.0636
0.2245
0.2733
SeuclideanEqual5 /0.45420.7971
0.6353
0.6252
0.7683
0.5902
0.5399
0.8042
0.6467
0.6389
0.3537
0.1251
0.1434
0.1270
0.0161
0.0518
0.3215
0.3367
0.3586
Inverse13 /0.02711.0000
1.0000
1.0000
0.7397
0.5471
0.4915
0.9918
0.9837
0.9834
0.0010
0.0000
0.0001
0.1460
0.0213
0.0688
0.0652
0.2176
0.2901
Squared Inverse23 /0.02371.0000
1.0000
1.0000
0.7707
0.5940
0.5442
0.9926
0.9852
0.9848
0.0010
0.0000
0.0001
0.1400
0.0196
0.0653
0.0625
0.2424
0.2879
Table 7. Model test performance.
R/R2/R2adjRMSE/MSE/MAE
ALLALL
0.9984
0.9968
0.9963
0.0152
2.3172 × 10⁻⁴
0.0051
Table 8. Results of adsorption quantity of phenol under the optimal conditions.
GWO: ×1 = 60 min, ×2 = 200 mg.L−1, ×3 = 0.1504 g.L−1, ×4 = 306,683 rpm, ×5 = 20 °C, ×6 = 4.7526
Predicted quantity of adsorbed phenol (mg.g−1)163.4230
PSO: ×1 = 60 min, ×2 = 200 mg.L−1, ×3 = 0.1506 g.L−1, ×4 = 308.793 rpm, ×5 = 20 °C, ×6 = 4.7447
Predicted quantity of adsorbed phenol (mg.g−1)163.4230
Experimental quantity of adsorbed phenol (mg.g−1)162.7543
Error (mg.g−1)0.6687
Disclaimer/Publisher’s Note: The statements, opinions and data contained in all publications are solely those of the individual author(s) and contributor(s) and not of MDPI and/or the editor(s). MDPI and/or the editor(s) disclaim responsibility for any injury to people or property resulting from any ideas, methods, instructions or products referred to in the content.

