
High Spatial Resolution Nitrogen Emission and Retention Maps of Three Danish Catchments Using Synchronous Measurements in Streams
 ,
,
Abstract
:
1. Introduction
2. Materials and Methods
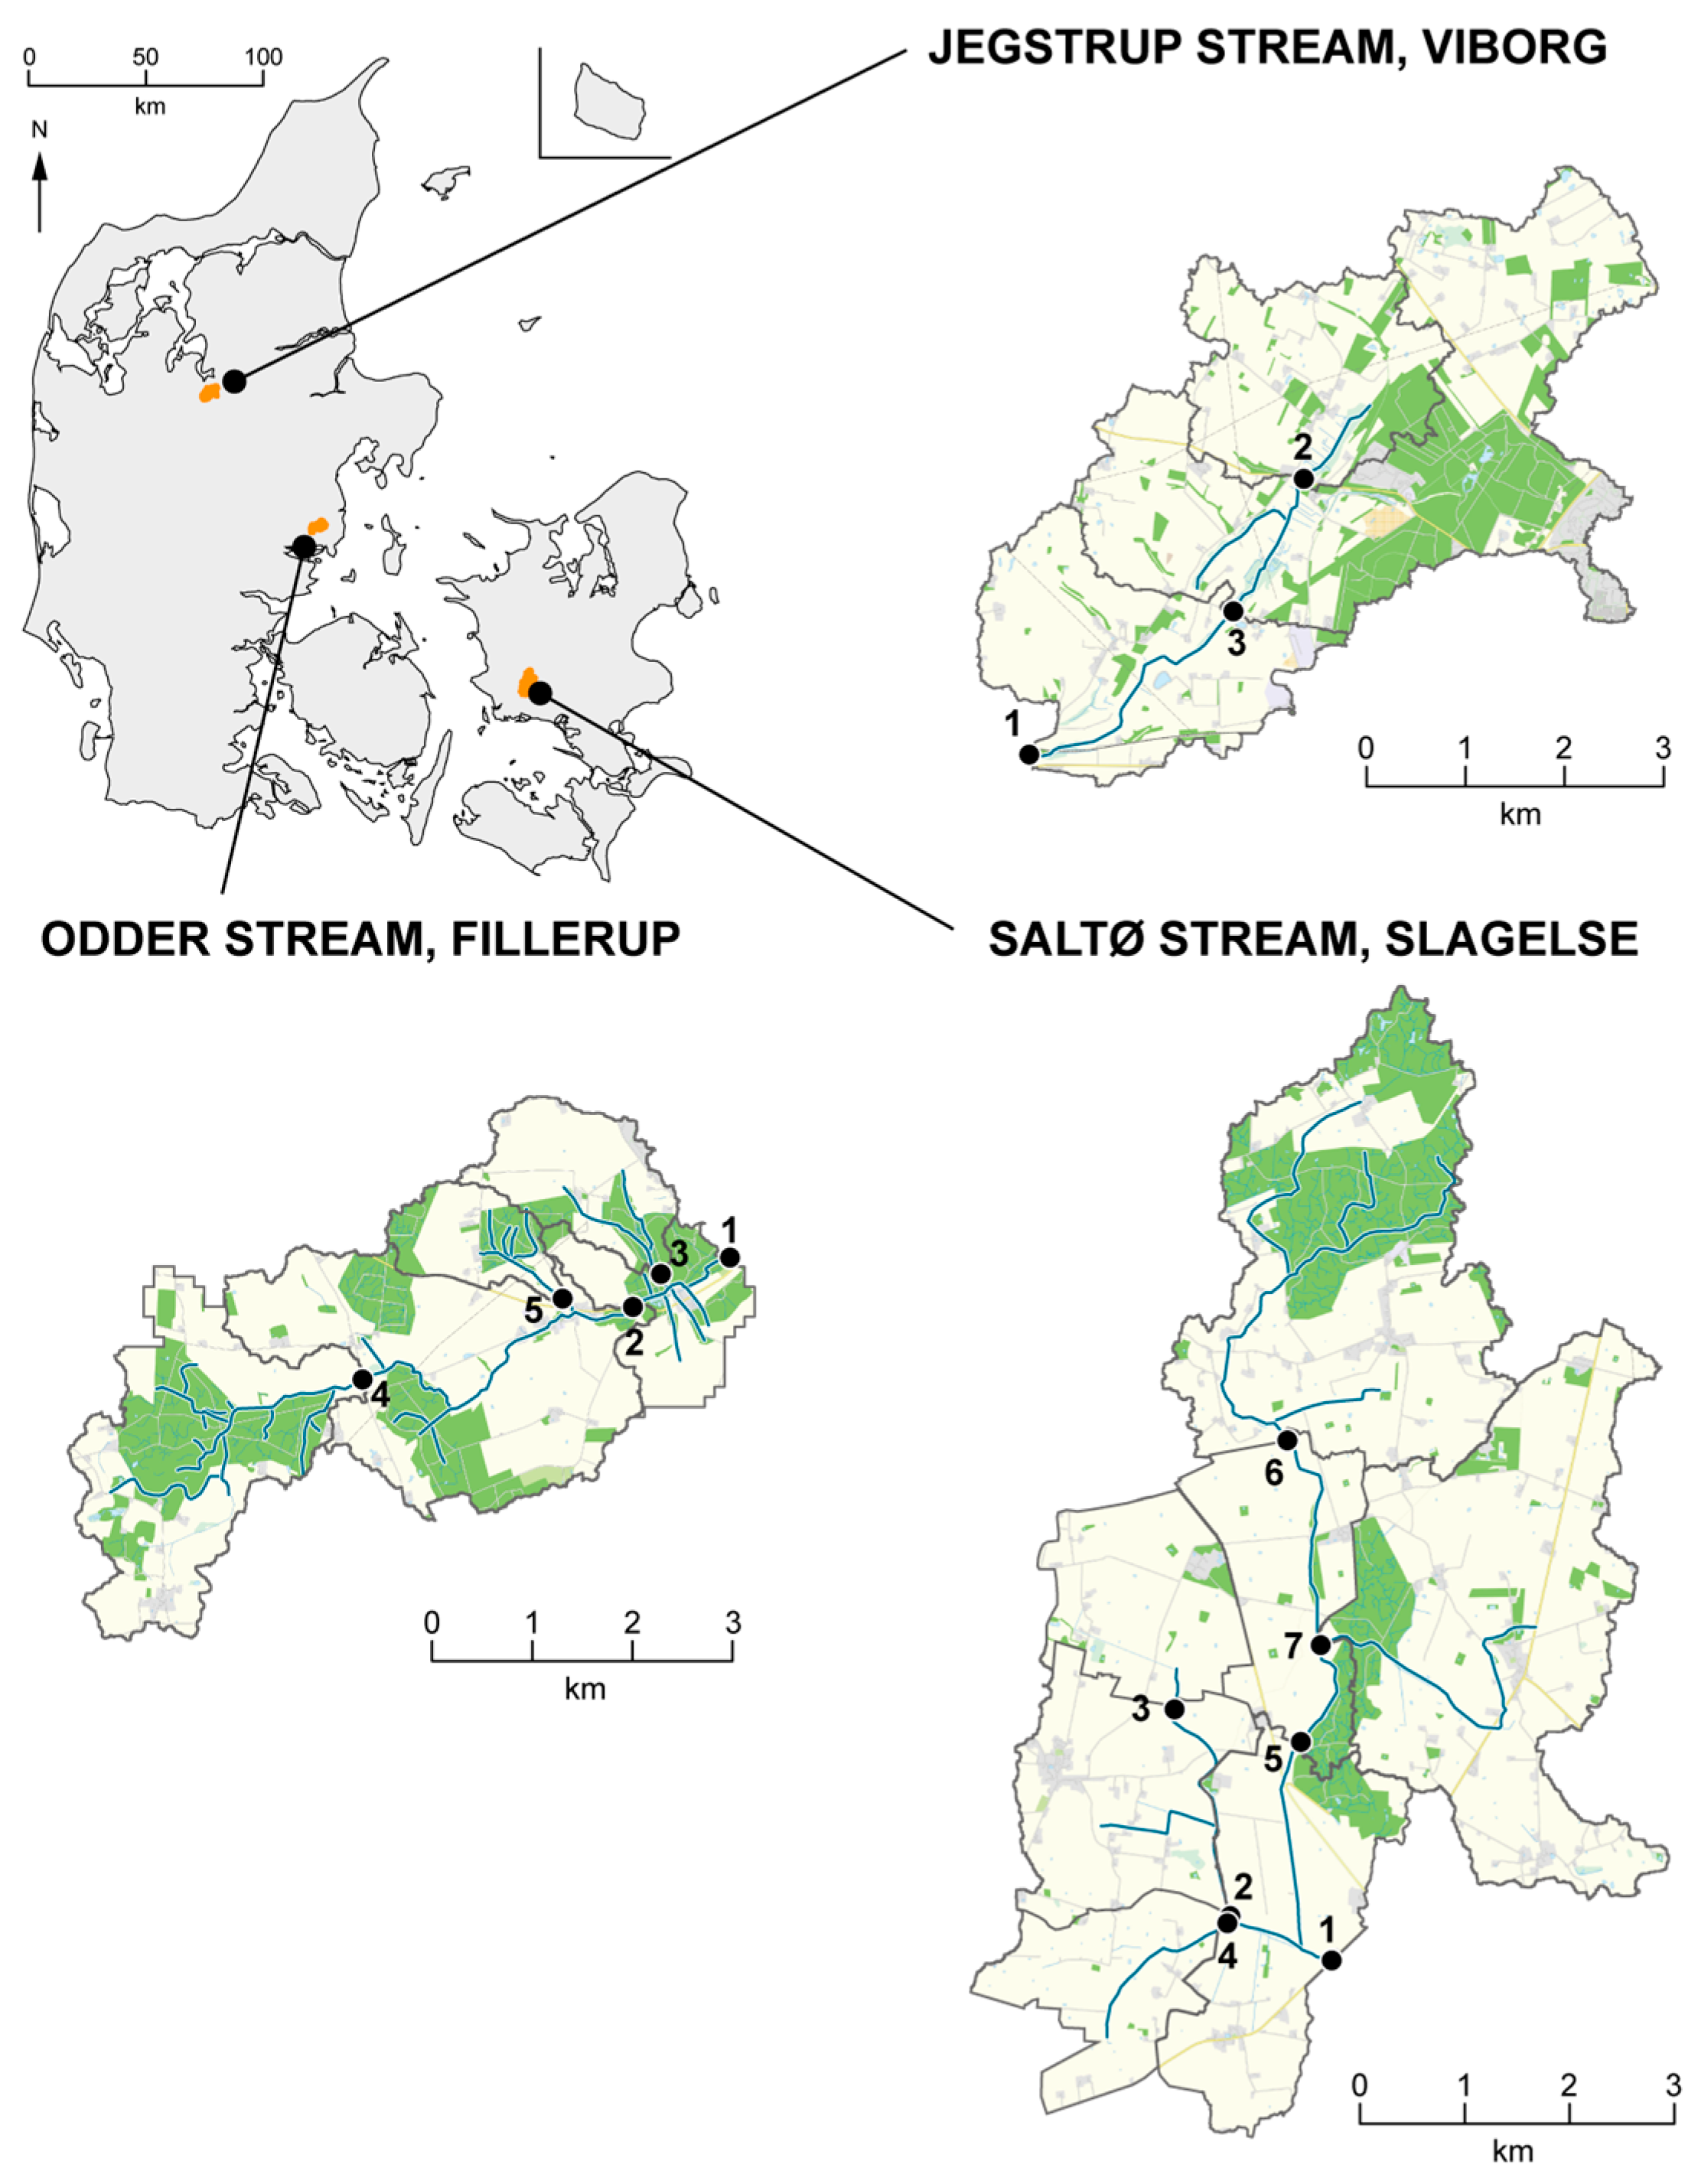
2.1. Study Sites

| Catchment ID | Area (km2) | Precipitation, 25 October 2014–24 October 2015 (mm) | Precipitation, 25 October 2015–24 October 2016 (mm) | Main Agricultural Soil Type (Danish JB-Soil Classification System) | Agricultural Areas (%) * | Drain Areas (% of the Agricultural Area) ** | N Application (Agricultural Land). Commercial and Manure (kg ha) | Main Crop Type (2015) |
|---|---|---|---|---|---|---|---|---|
| 1 | 5.4 | 955 | 965 | 77 | 7 | 162 | Winter Rye | |
| 2 | 4.5 | 939 | 966 | 68 | 2 | 167 | Spring Barley | |
| 3 | 11.8 | 944 | 966 | 54 | 4 | 171 | Spring Barley | |
| Total catchment Jegstrup stream | 21.7 | 946 | 966 | coarse sandy soil 86% | 63 | 5 | 167 | Spring Barley (33%) |
| 1 | 2 | 830 | 897 | 59 | 77 | 128 | Winter Wheat | |
| 2 | 6.9 | 870 | 951 | 72 | 76 | 159 | Winter Wheat | |
| 3 | 2.2 | 869 | 950 | 71 | 93 | 183 | Winter Barley | |
| 4 | 5.4 | 869 | 947 | 55 | 66 | 134 | Winter Wheat | |
| 5 | 1.3 | 870 | 951 | 54 | 89 | 166 | Spring Barley | |
| Total catchment Odder stream | 17.9 | 865 | 944 | sandy loam 55%, clayey sandy soil 42% | 57 | 76 | 160 | Winter Wheat (62%) |
| 1 | 4.9 | 683 | 719 | 79 | 98 | 194 | Winter Wheat | |
| 2 | 4 | 683 | 719 | 87 | 97 | 167 | Winter Wheat | |
| 3 | 3 | 683 | 719 | 88 | 99 | 180 | Winter Wheat | |
| 4 | 2.7 | 683 | 719 | 94 | 99 | 193 | Winter Wheat | |
| 5 | 3.5 | 683 | 719 | 83 | 98 | 183 | Winter Wheat | |
| 6 | 9.5 | 683 | 719 | 55 | 96 | 162 | Winter Wheat | |
| 7 | 9.9 | 684 | 725 | 80 | 98 | 155 | Winter Wheat | |
| Total catchment Saltø stream | 37.4 | 683 | 721 | sandy loam 69% | 77 | 97 | 173 | Winter Wheat (55%) |
2.2. Discharge Measurement and Water Sampling in the Streams
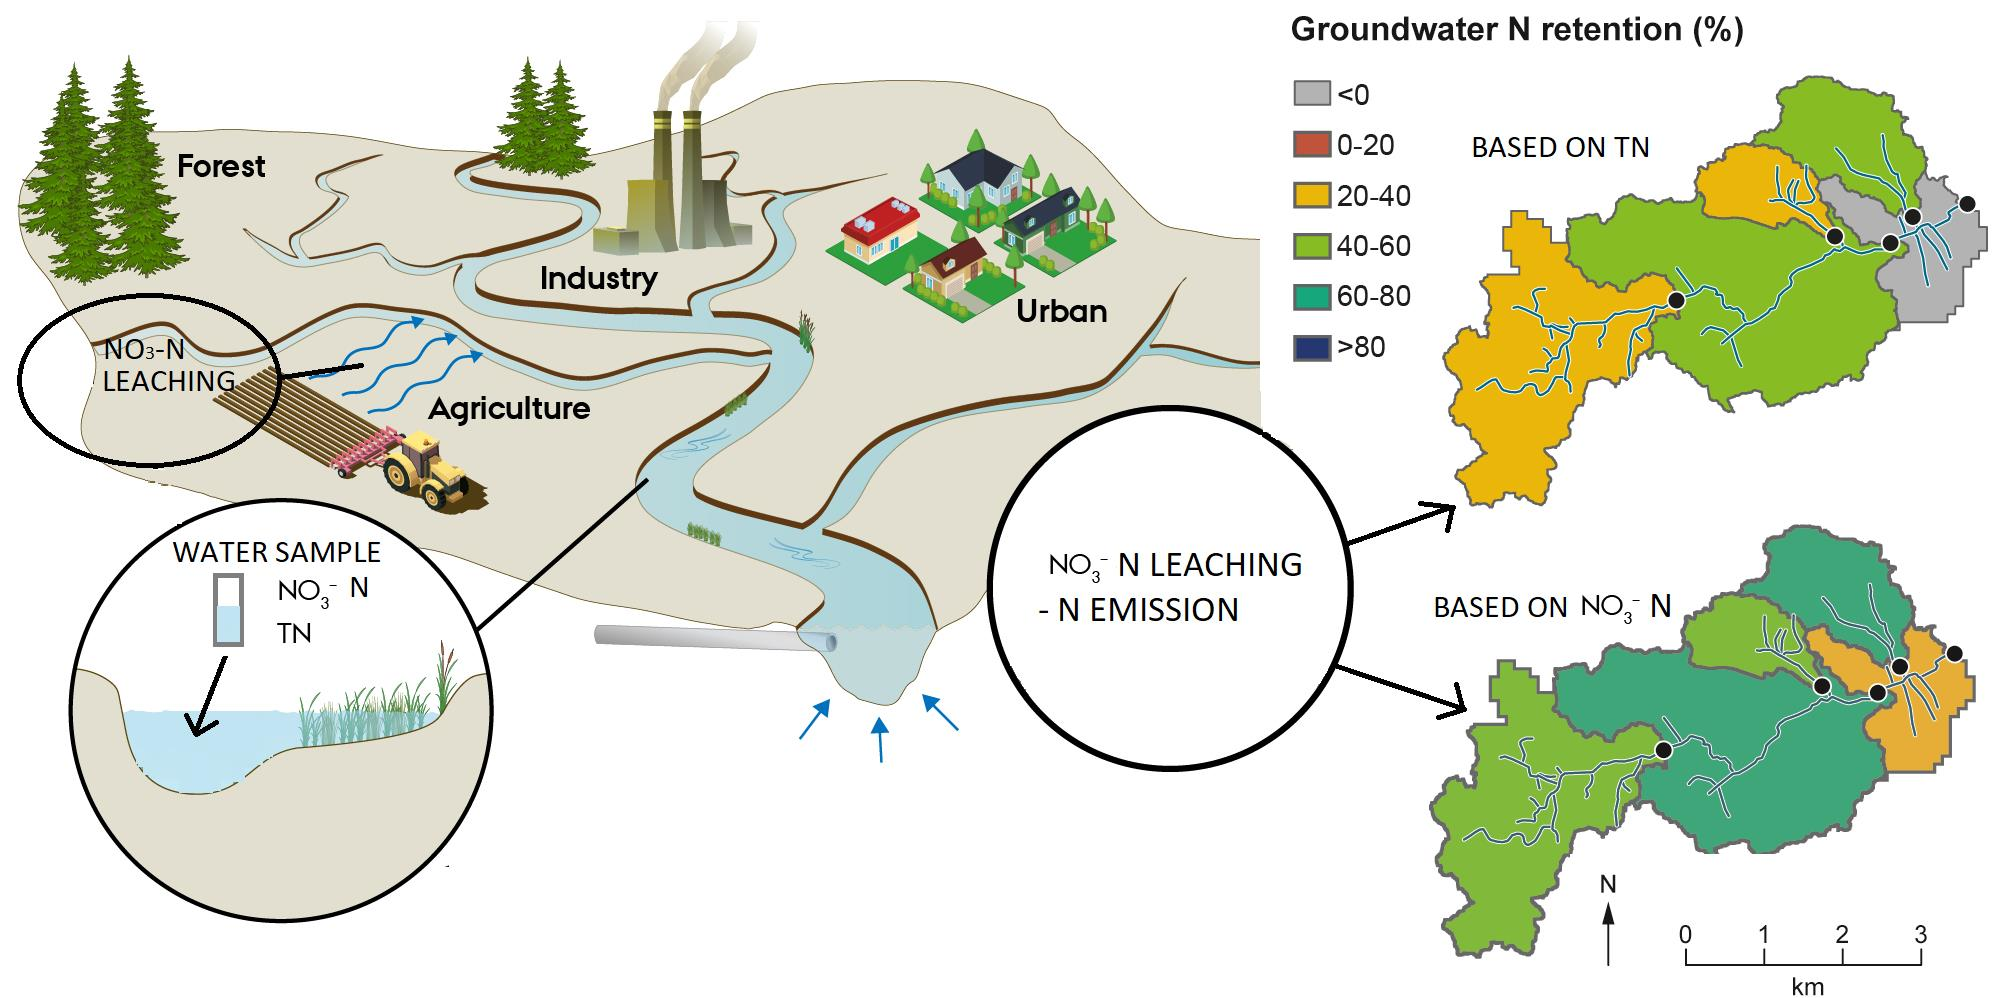
2.3. NO3-N Leaching from Agricultural Areas
2.4. TN and NO3-N Transport and Emission
2.5. N Retention in Groundwater
2.6. Statistical Methods for N Transport Calculation
3. Results
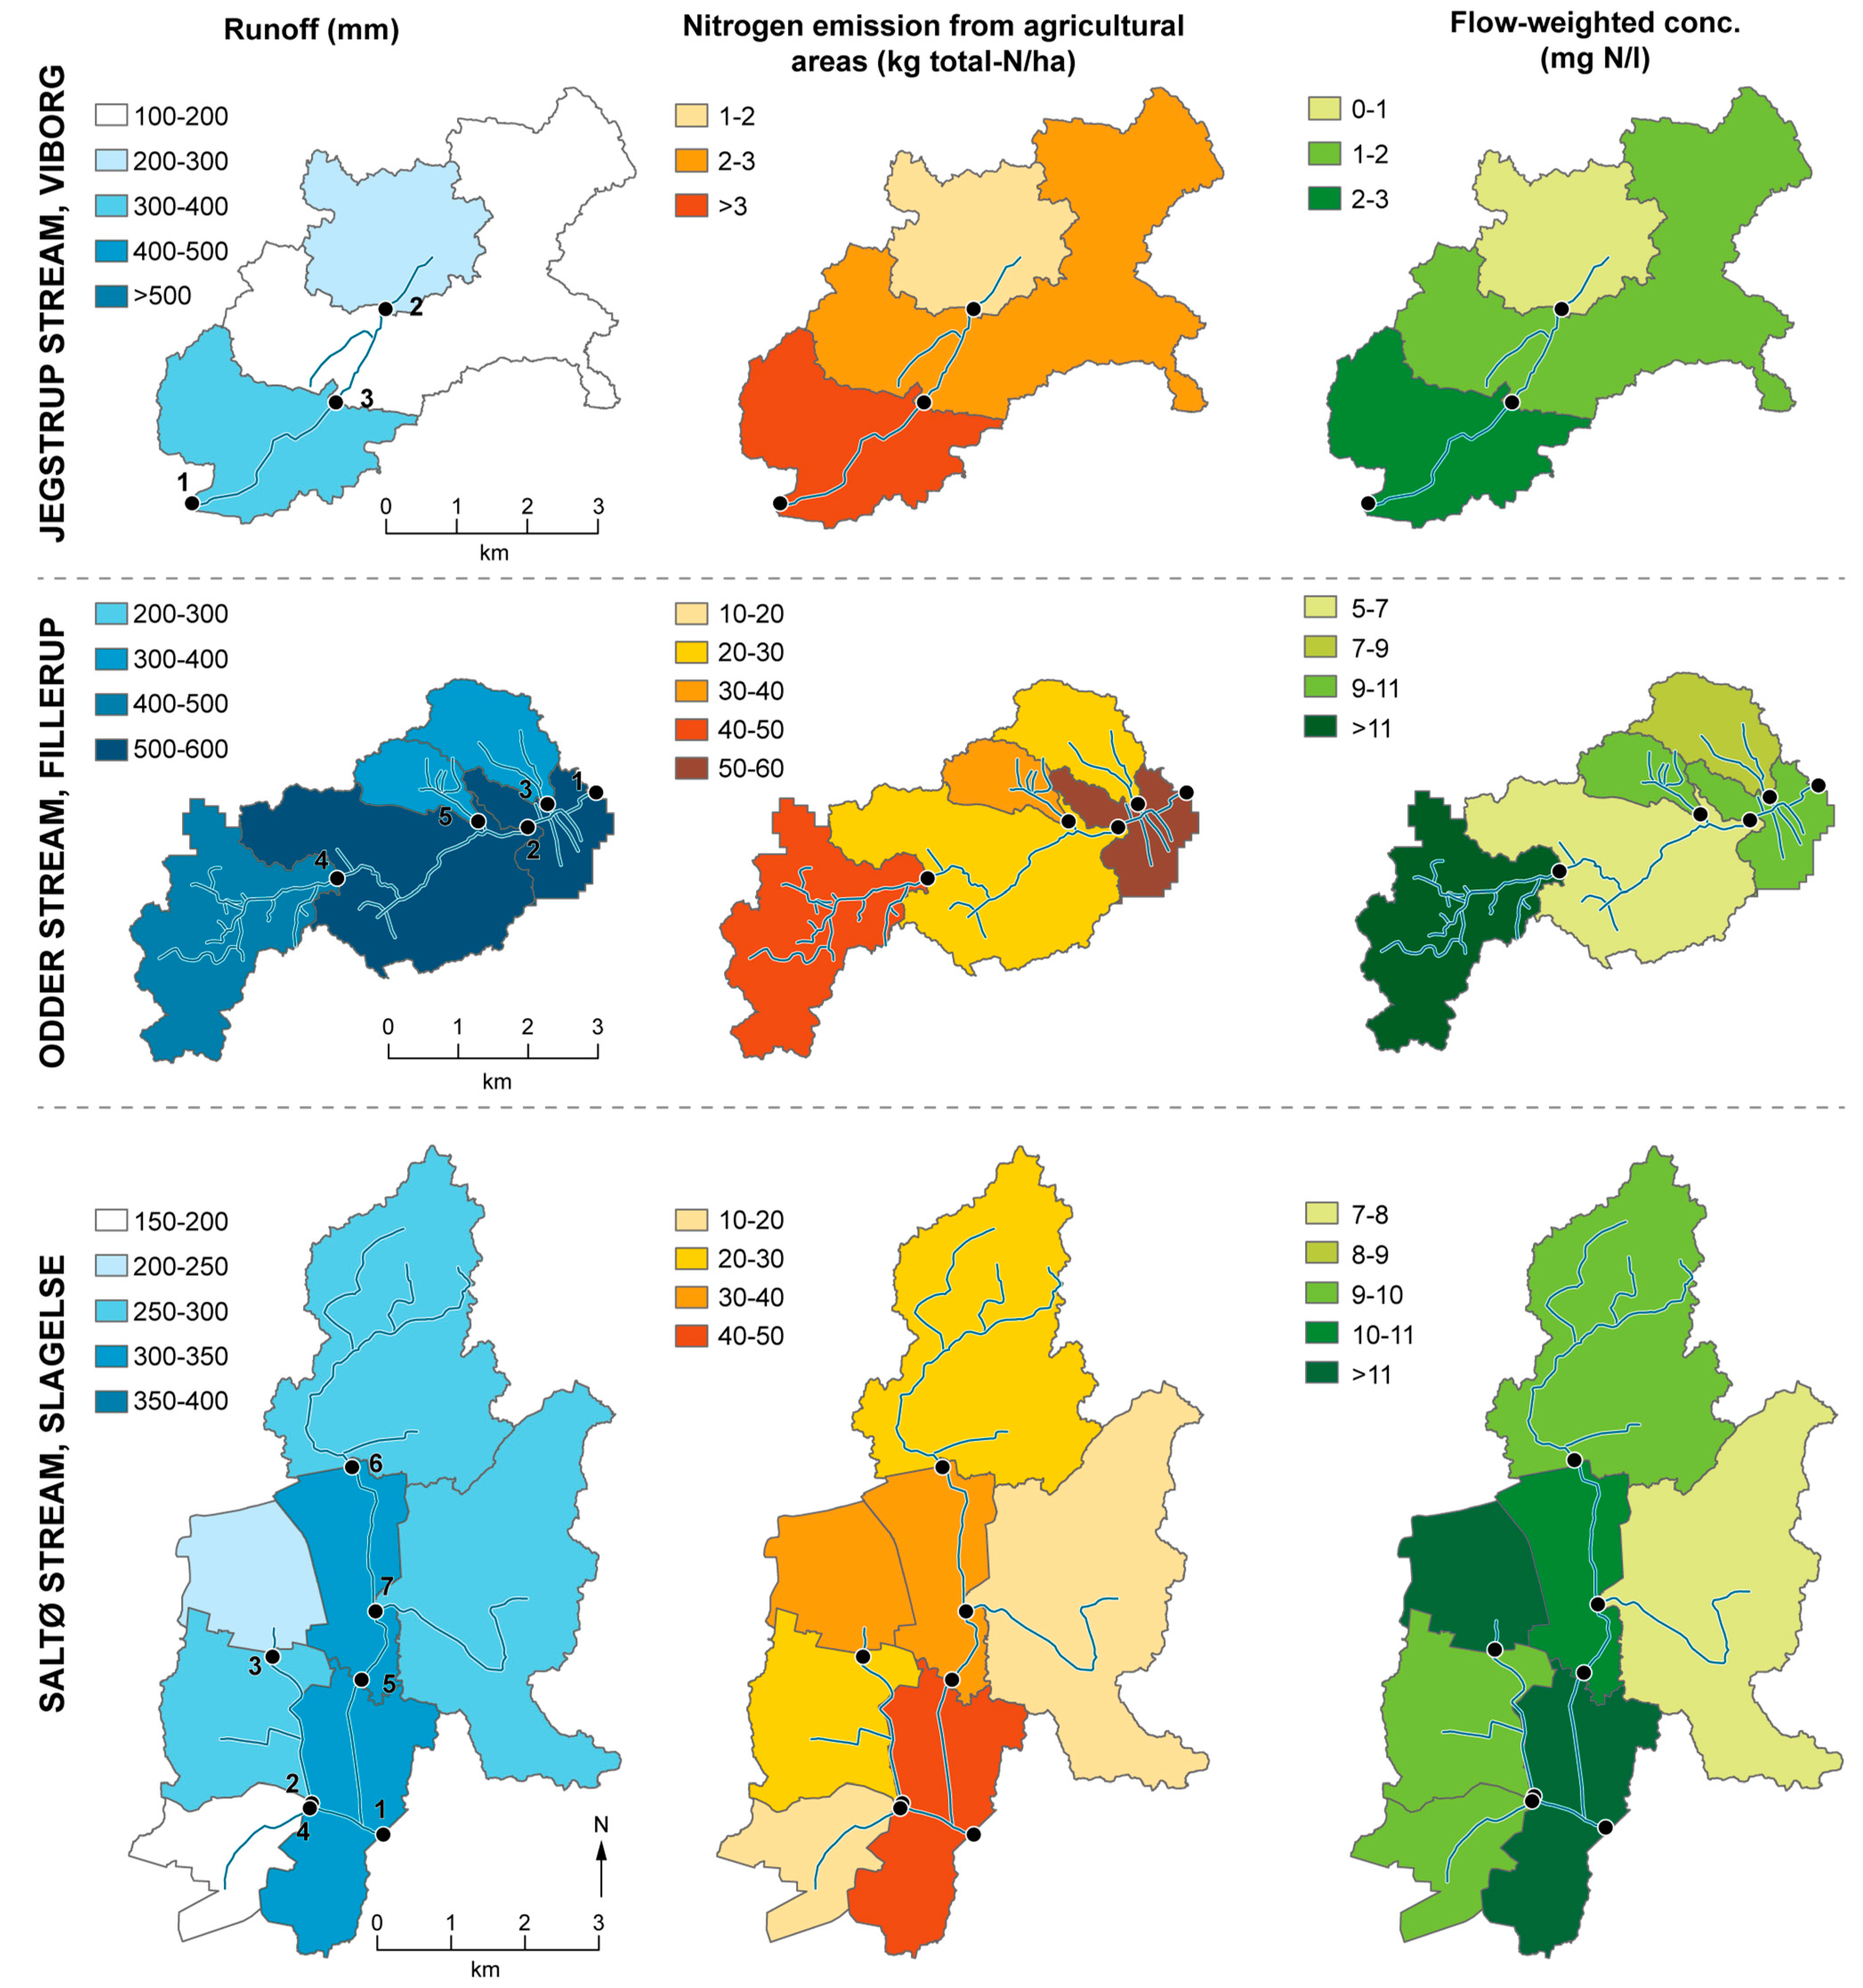
3.1. NO3-N Leaching from Agricultural Areas
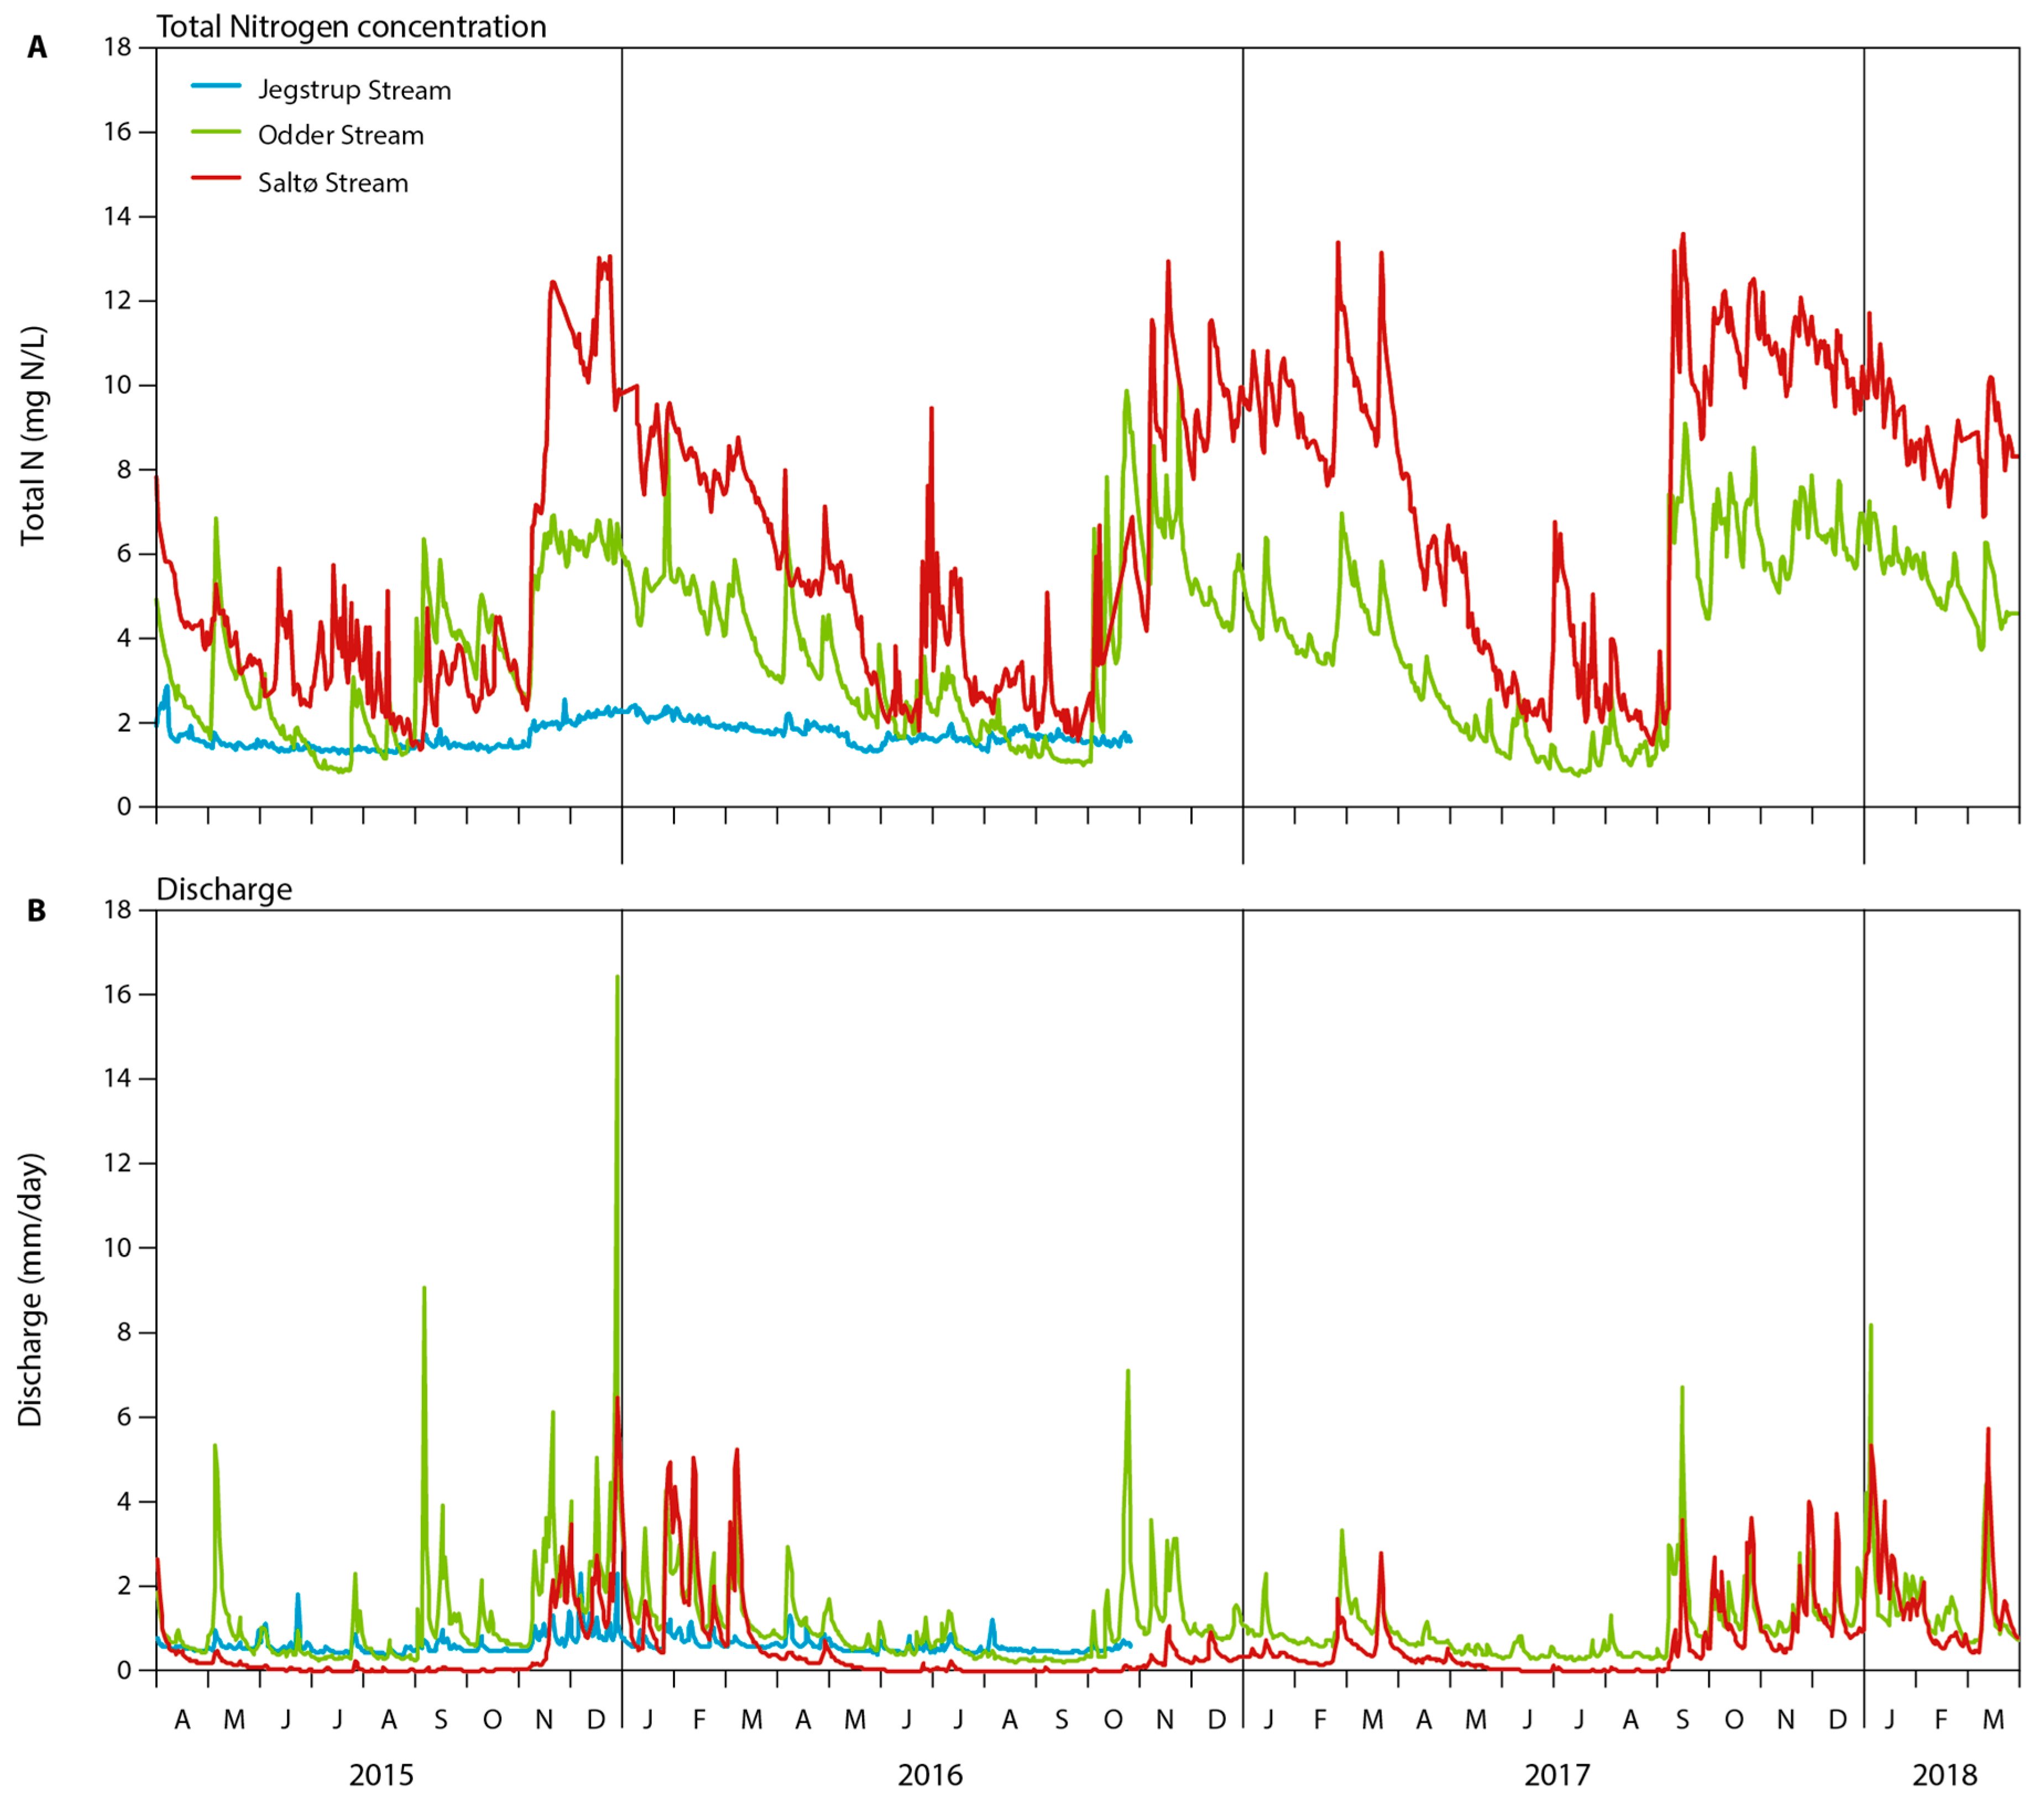
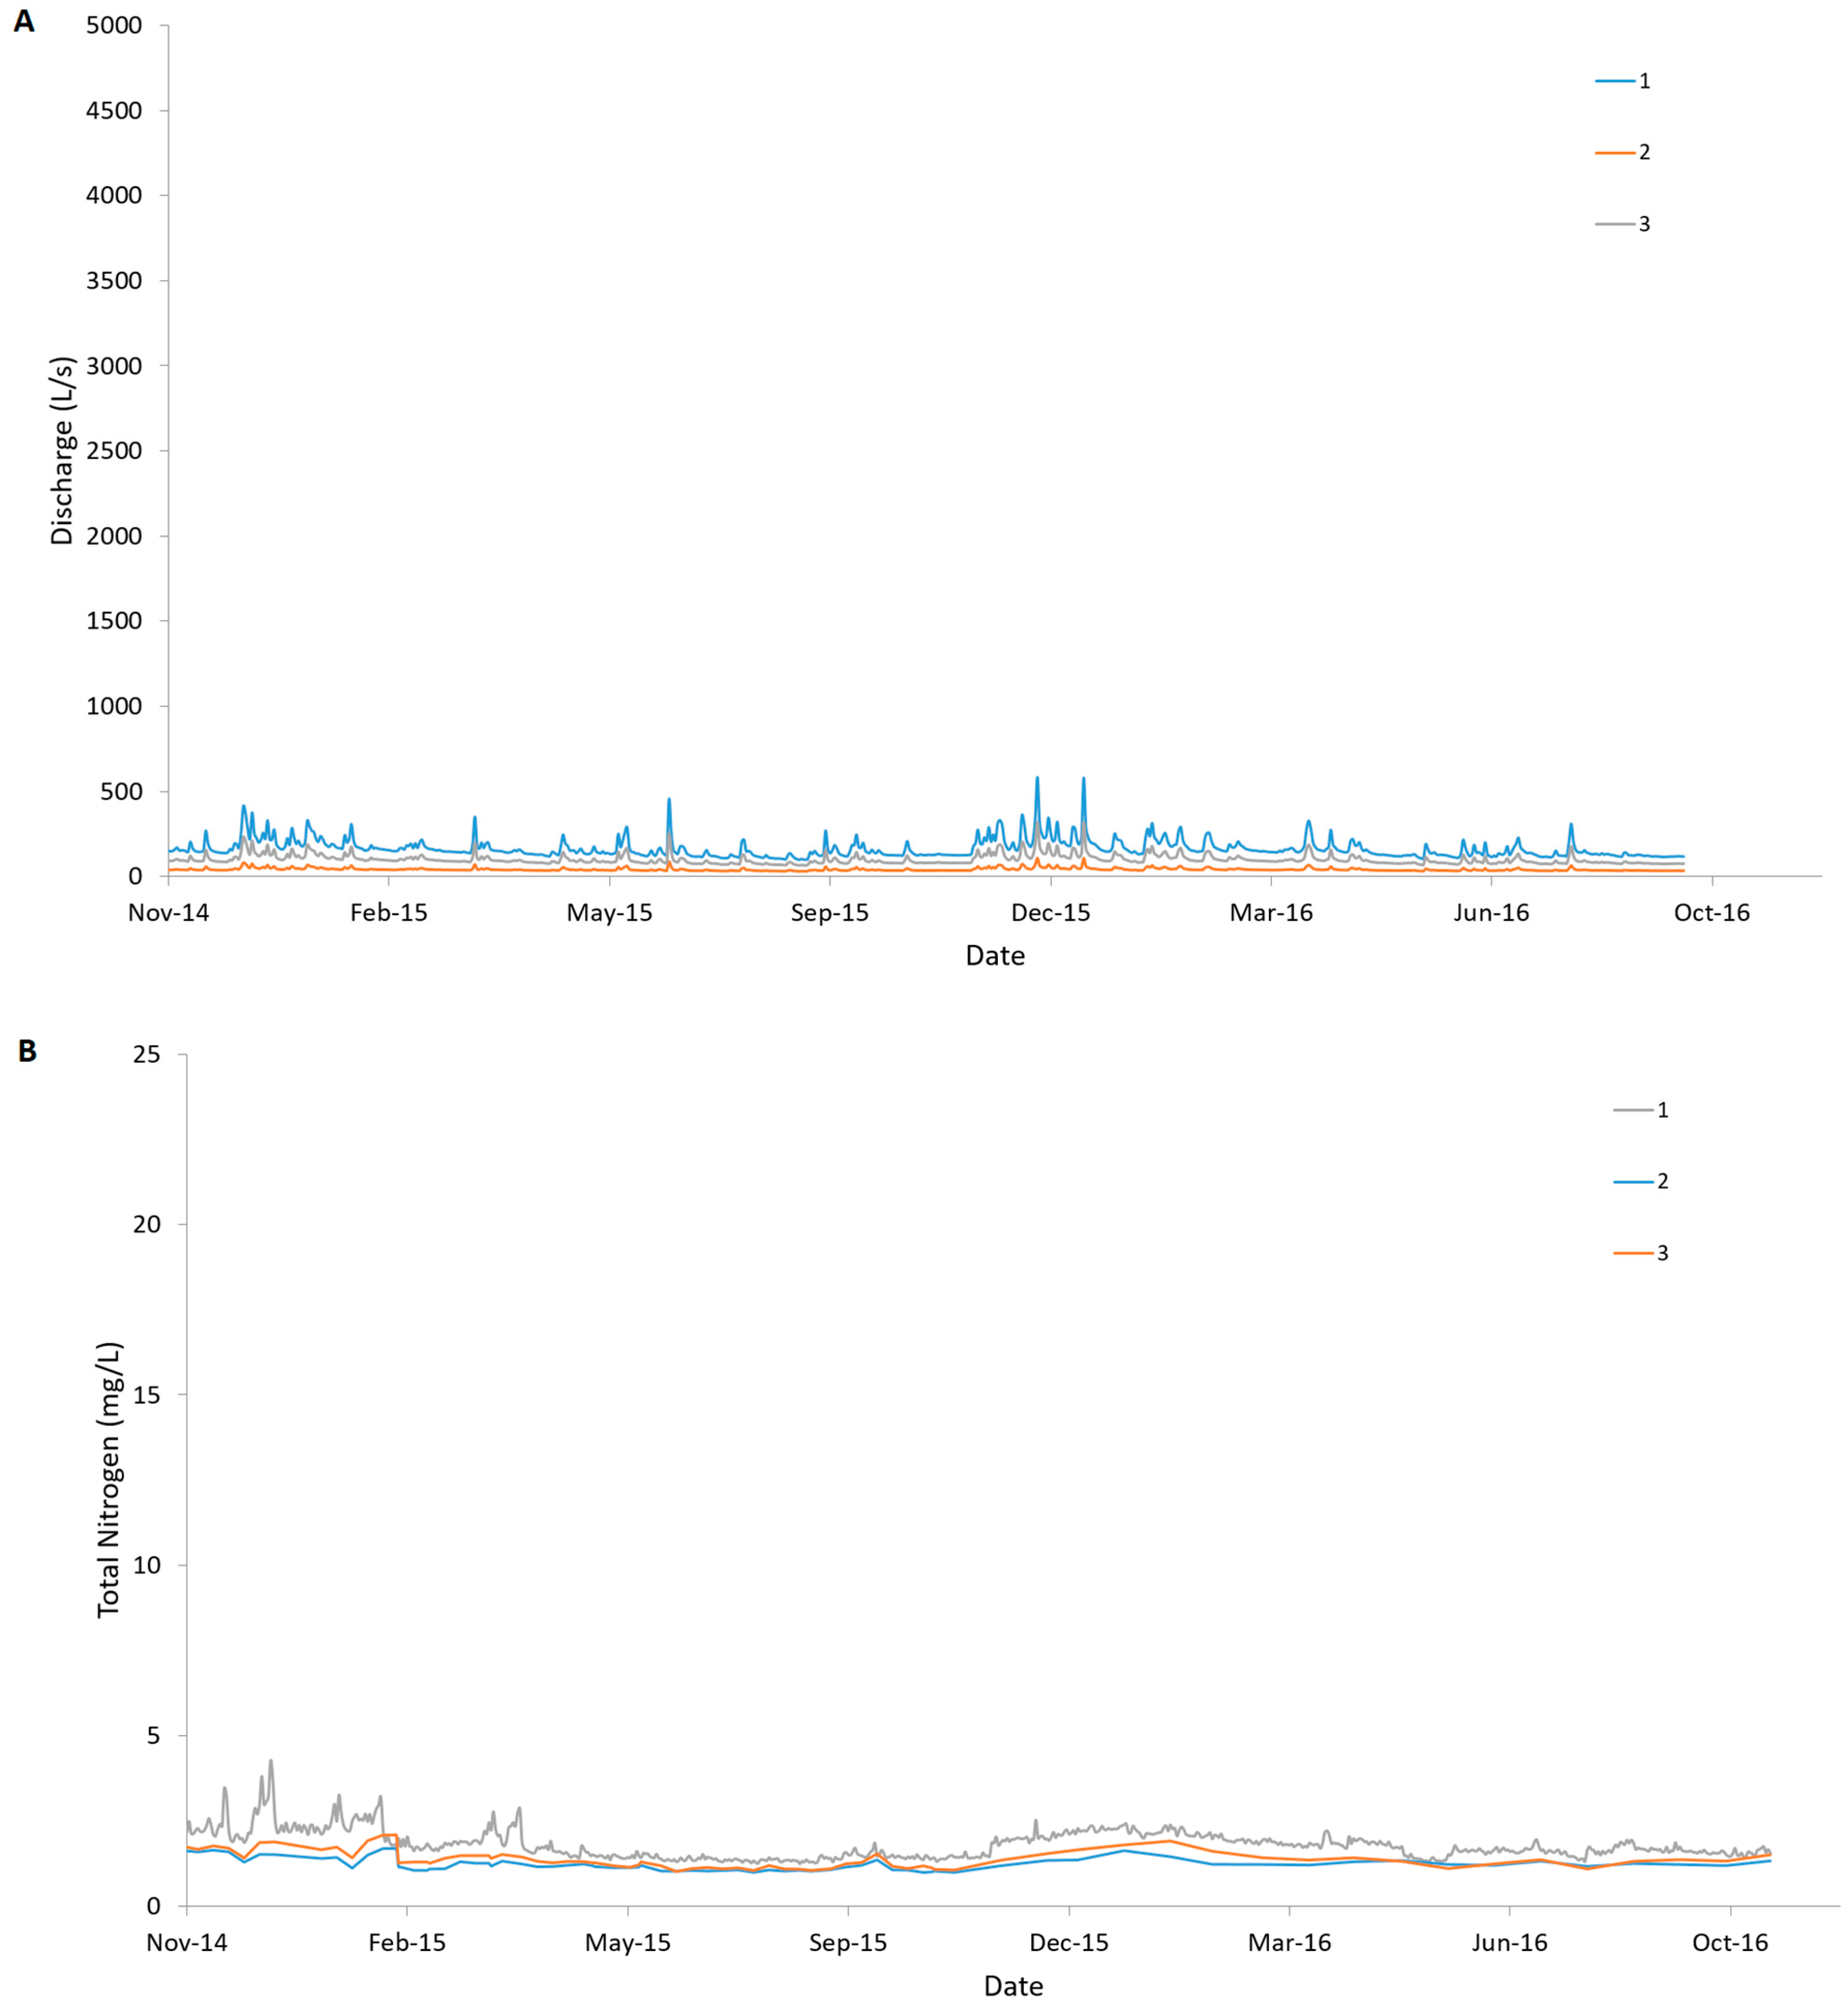
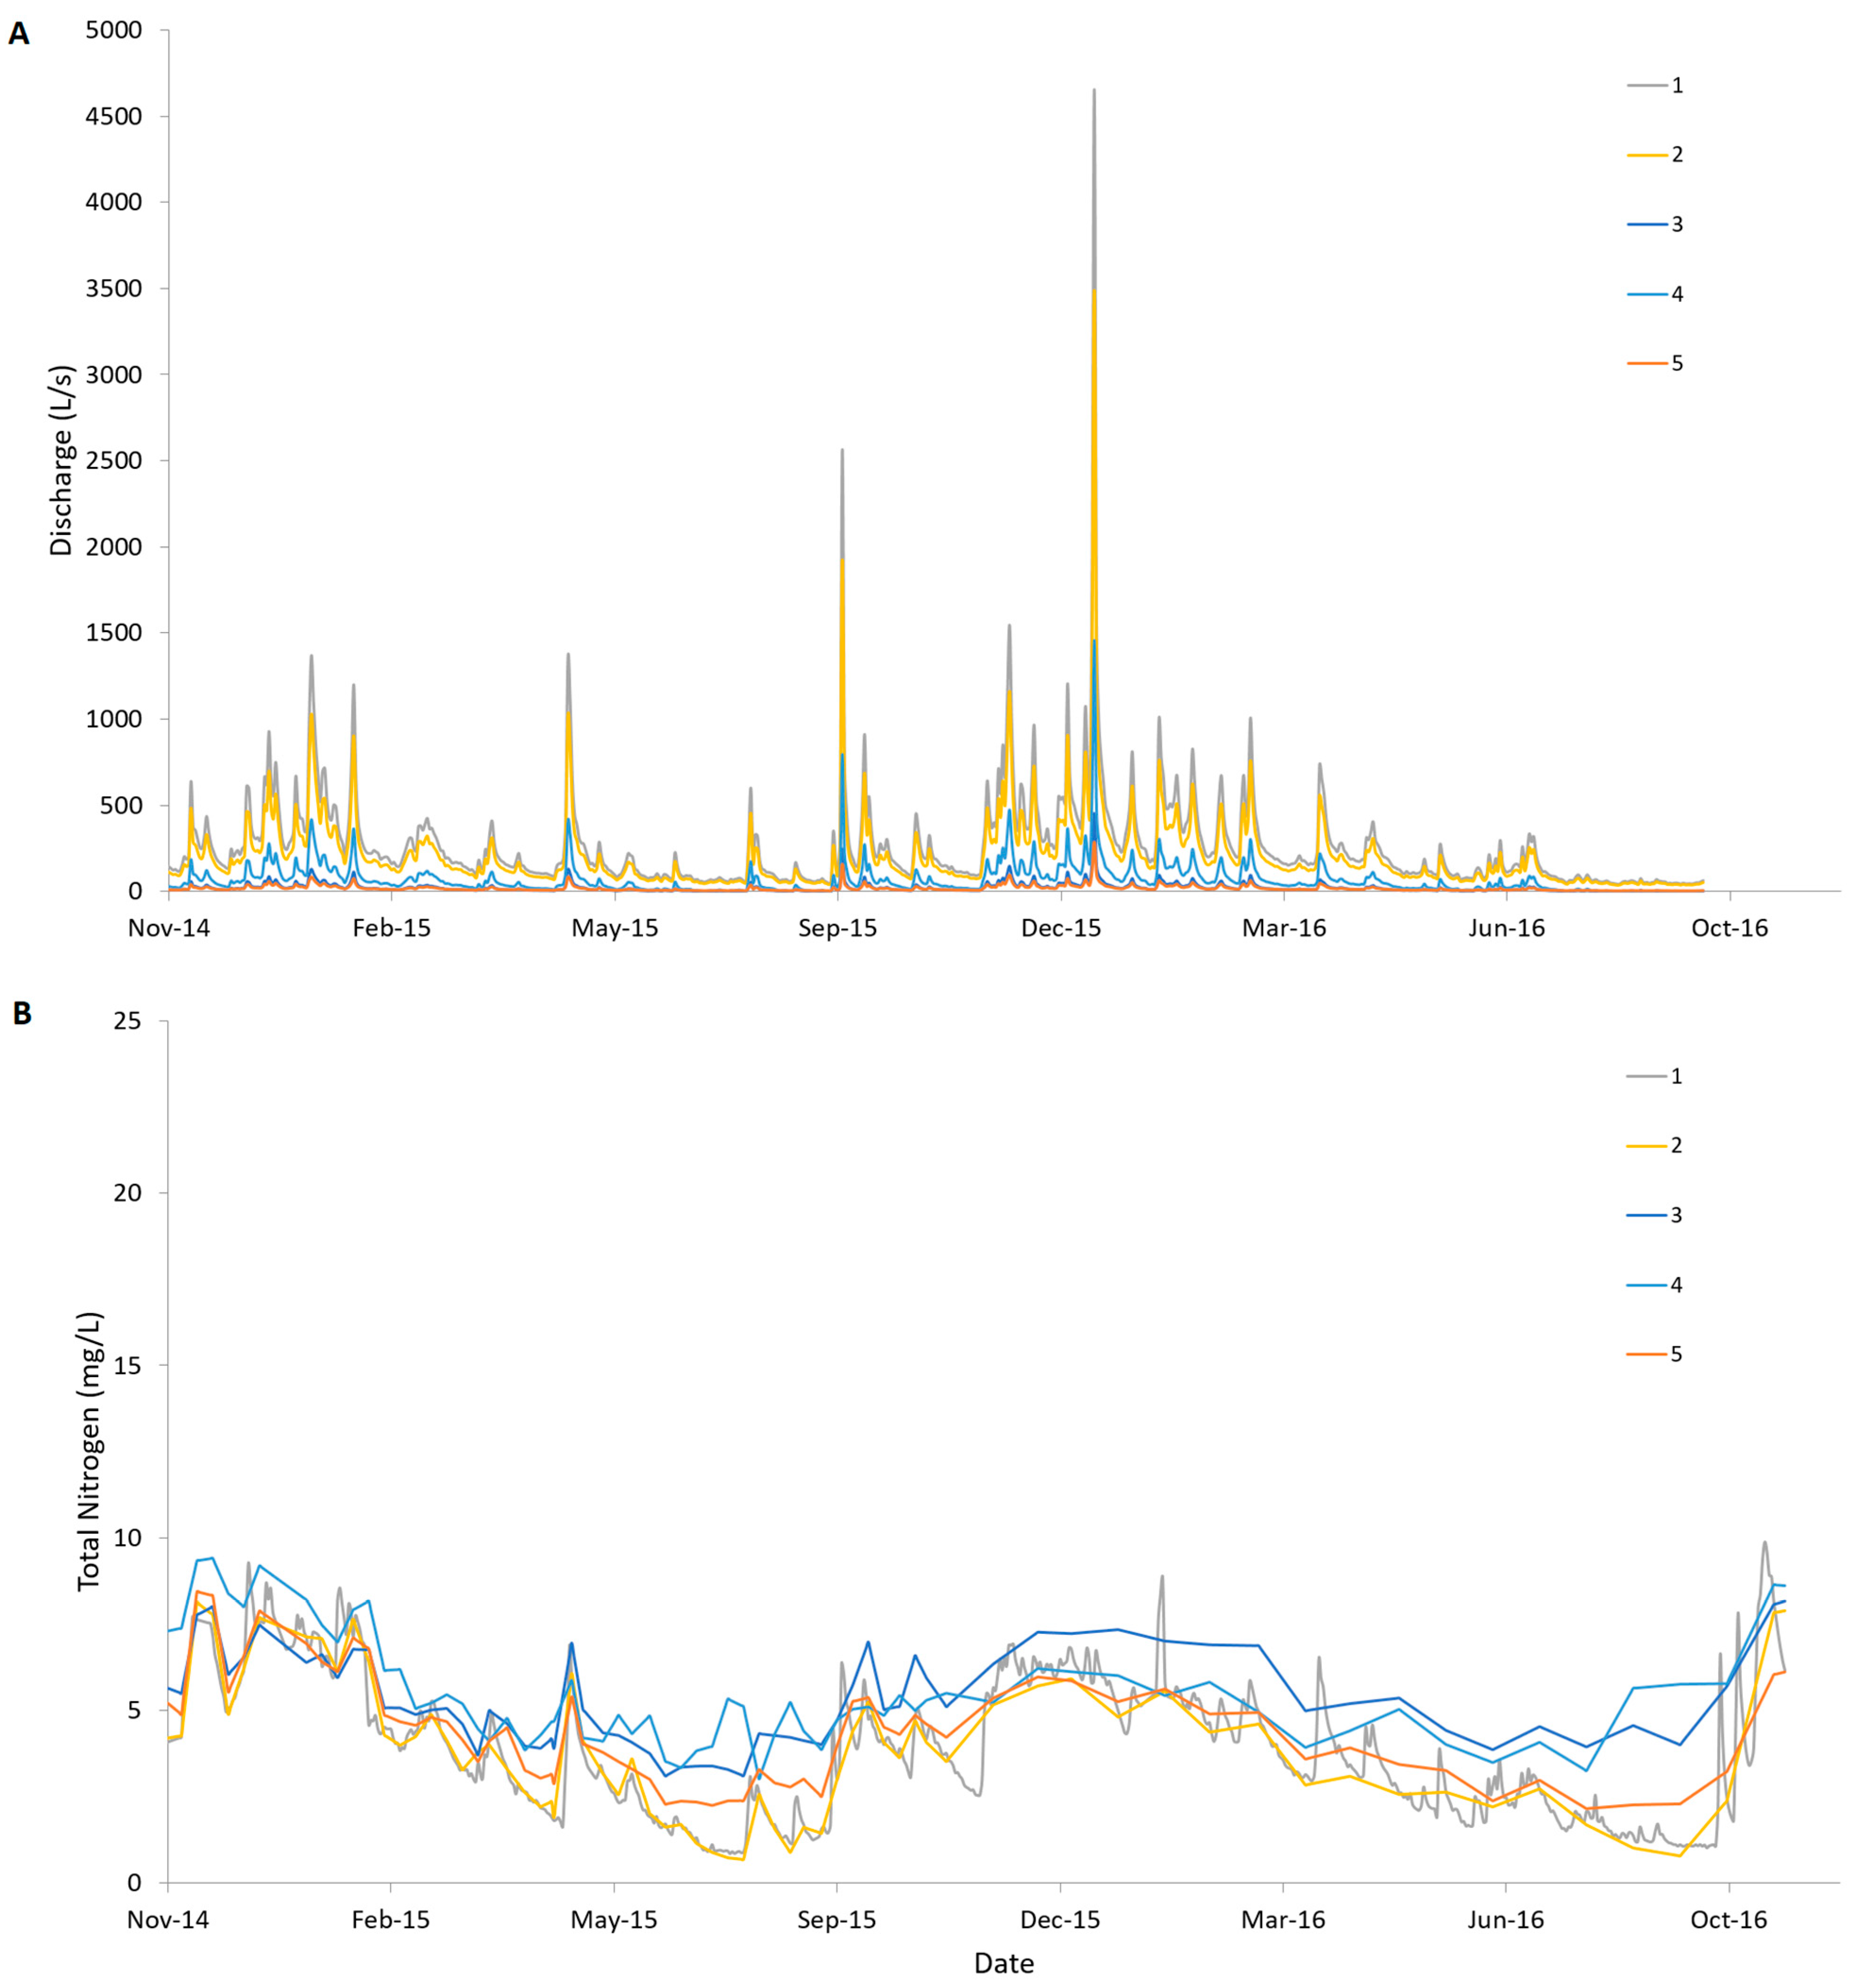
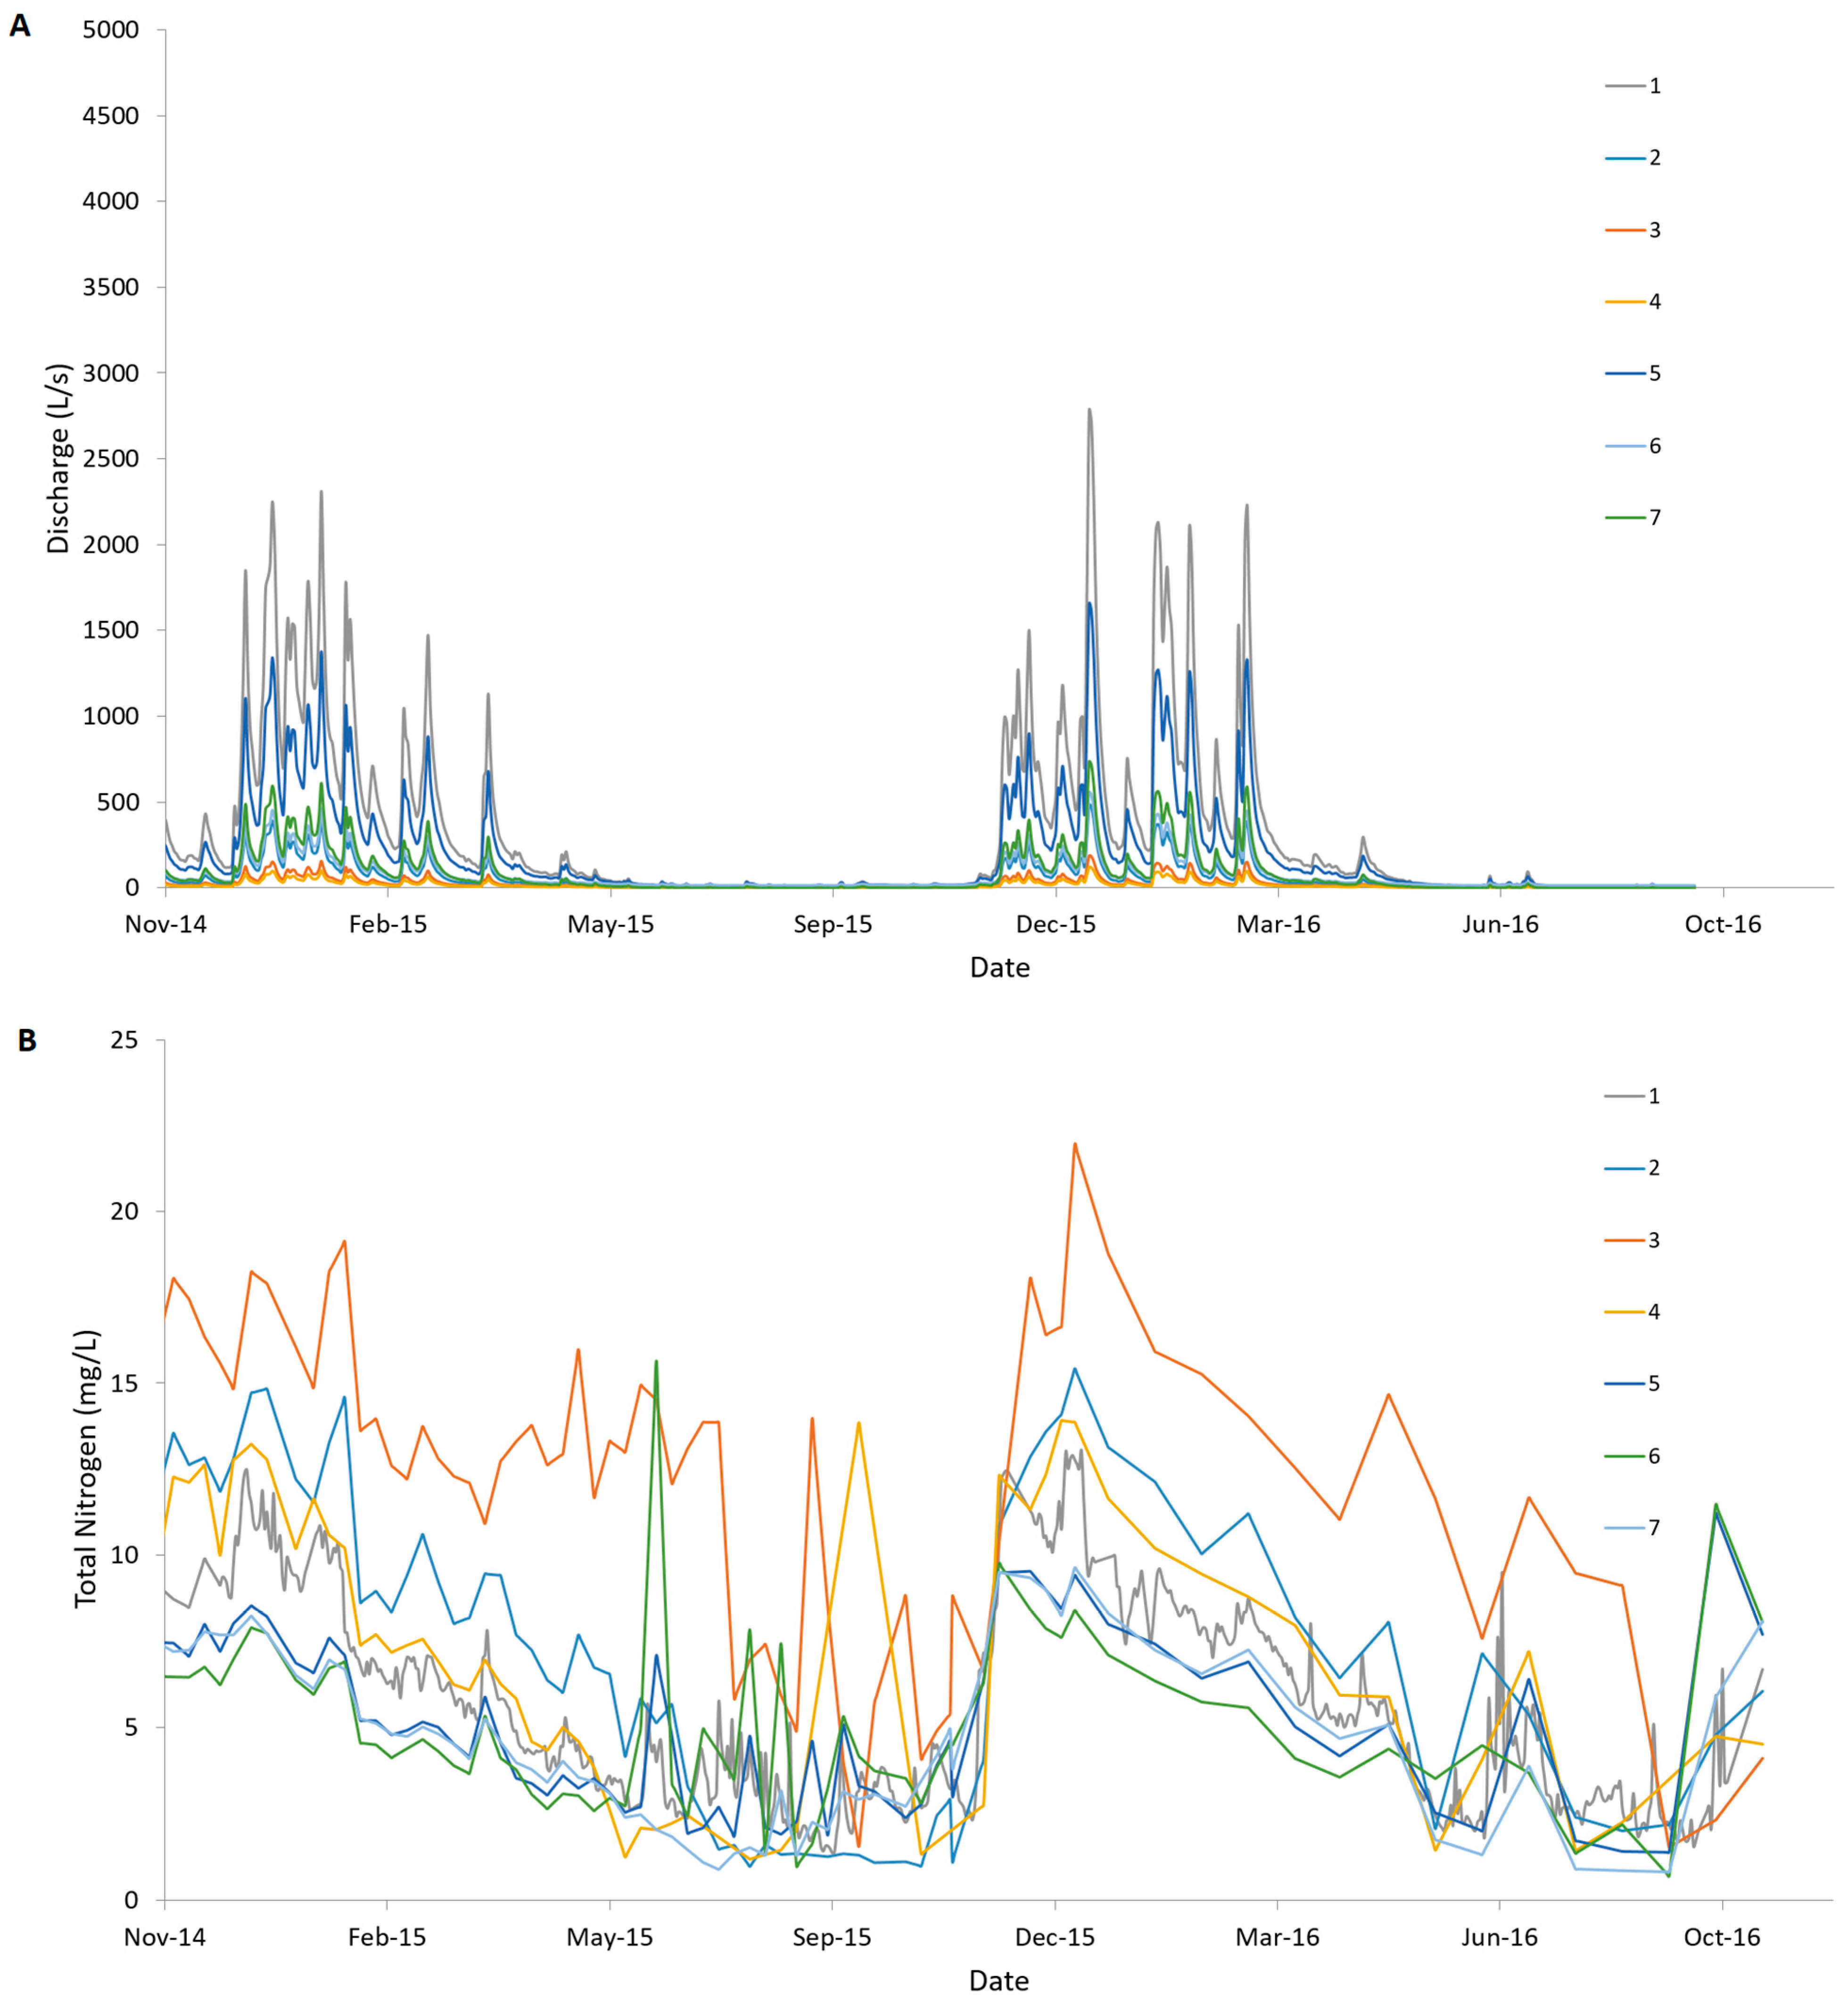
3.2. Catchment Hydrology and N Concentrations
3.3. N Emission from Agricultural Areas
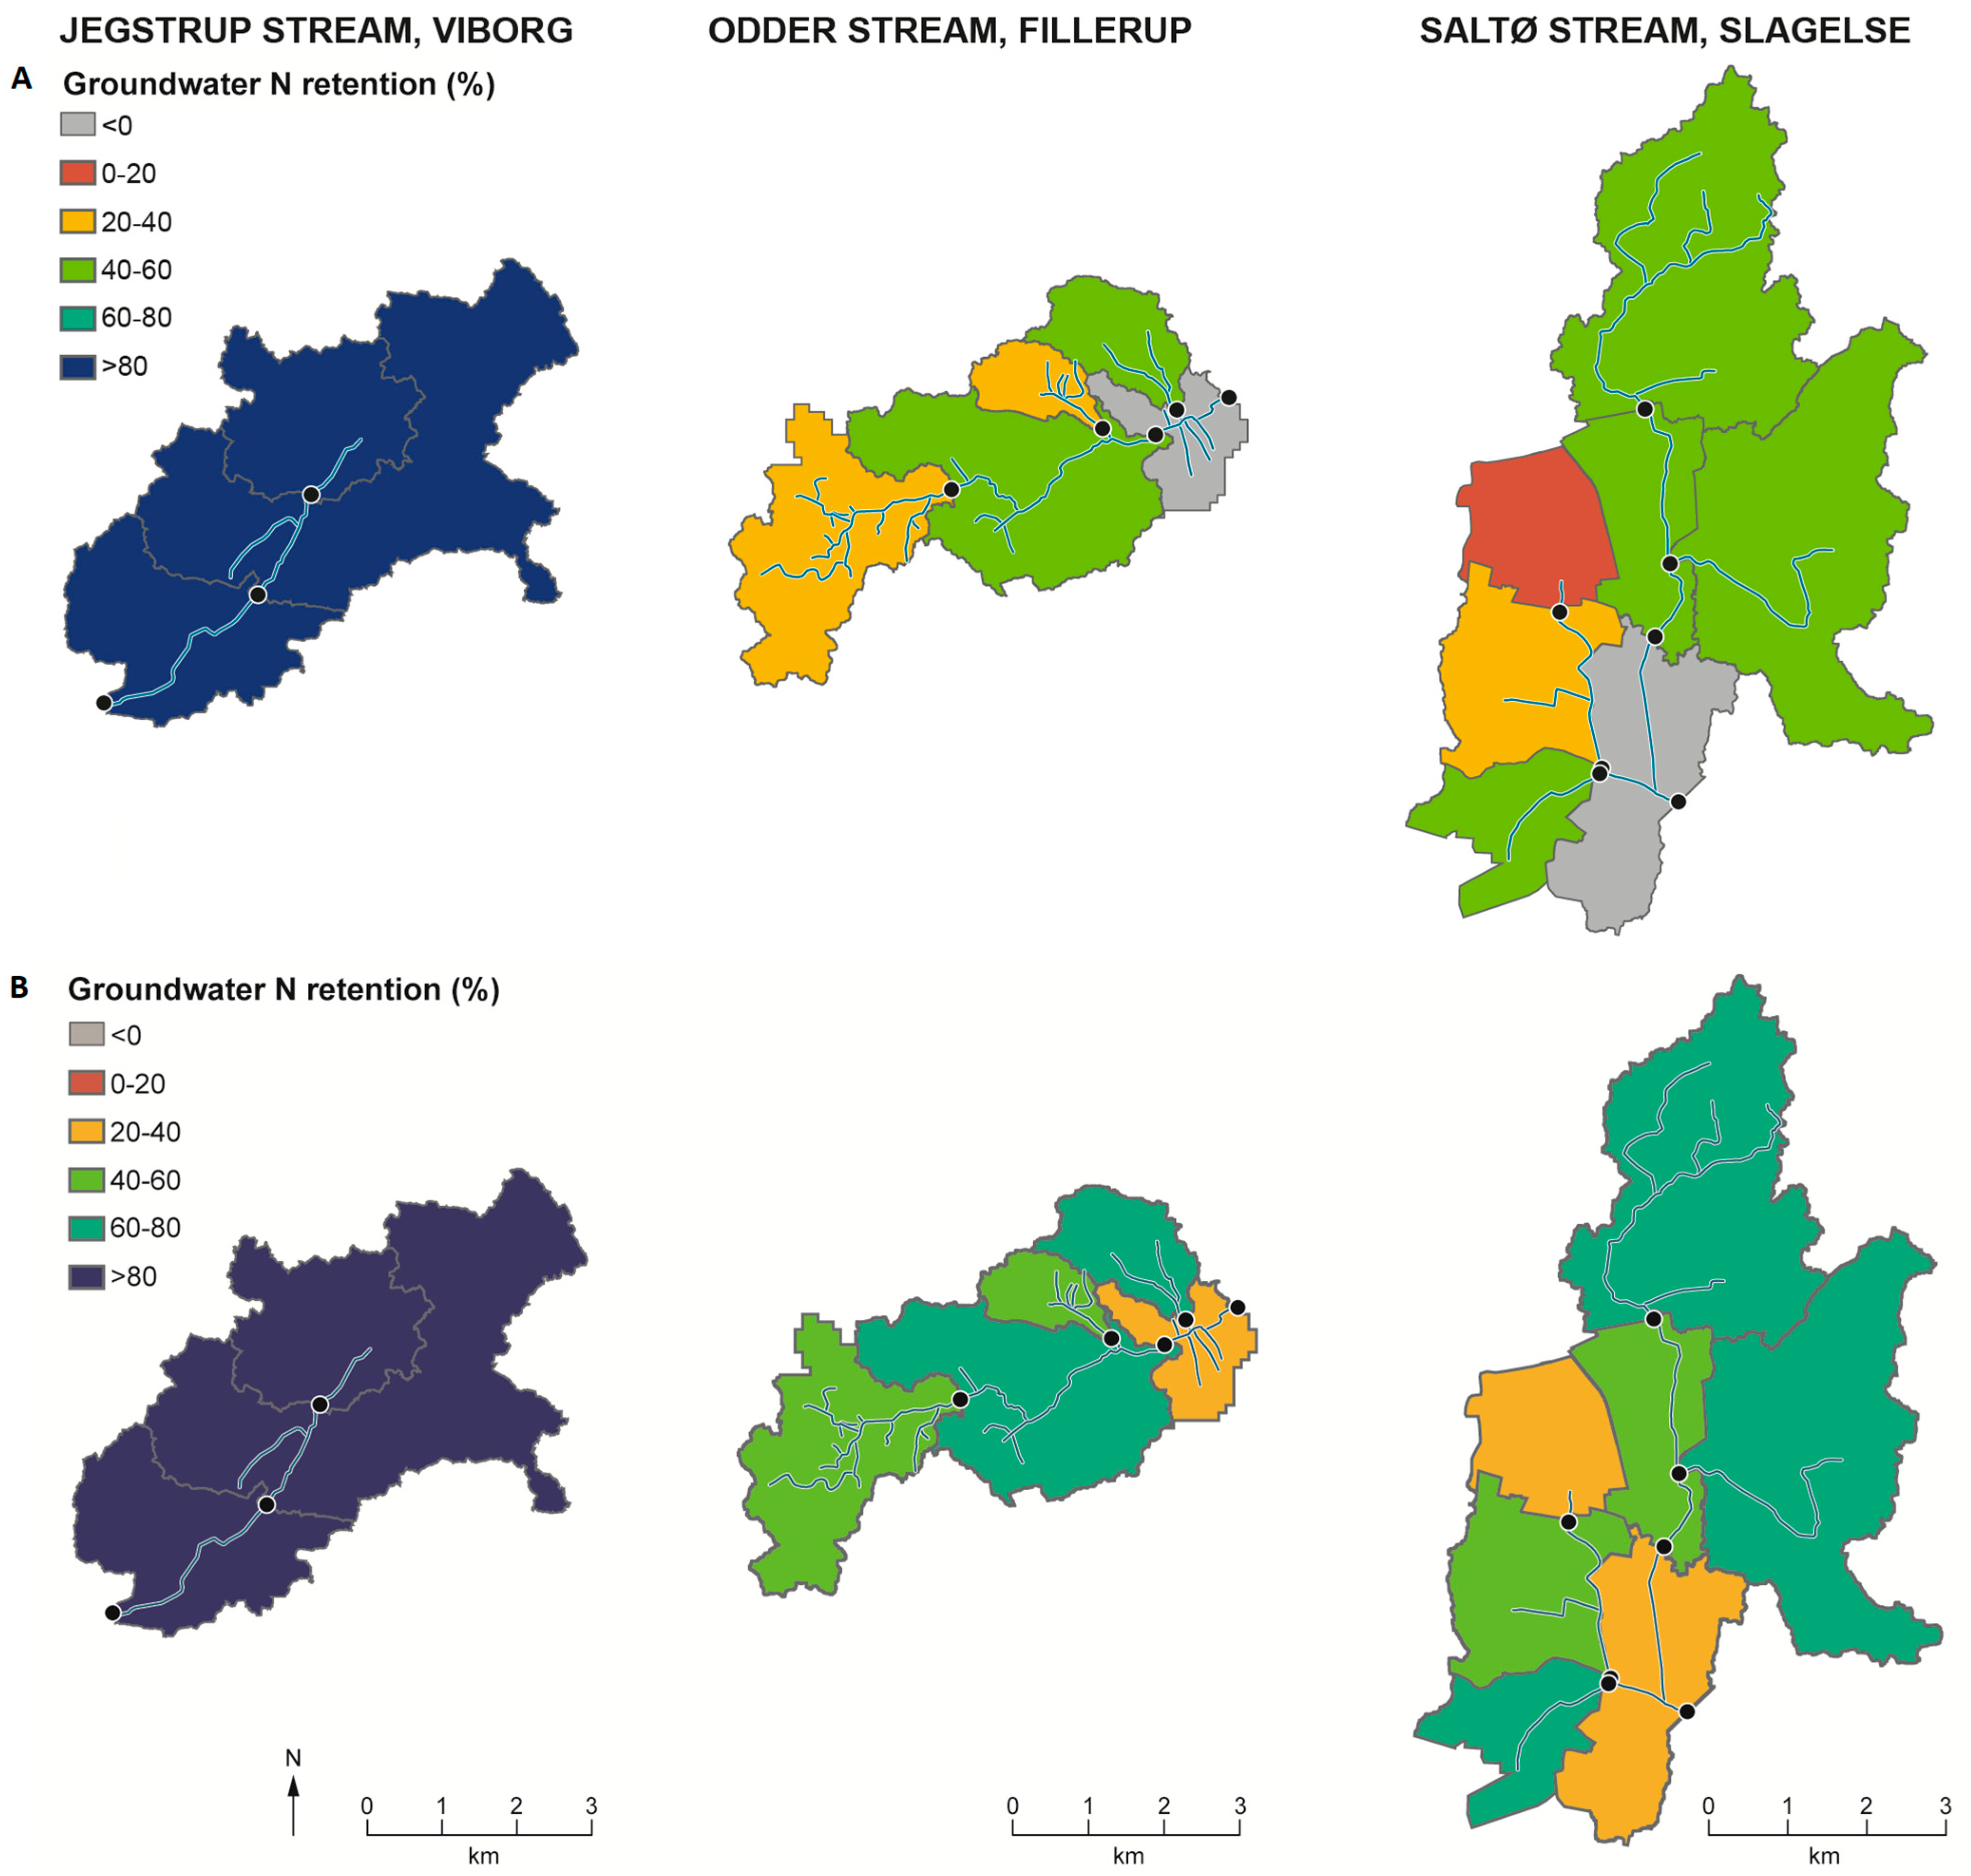
3.4. Groundwater N Retention Mapping
4. Discussion
4.1. Groundwater N Retention
4.2. N Emission and Danish Water Quality Targets
5. Conclusions
Author Contributions
Funding
Institutional Review Board Statement
Informed Consent Statement
Data Availability Statement
Acknowledgments
Conflicts of Interest
Appendix A
| Jegstrup catchment stations | 2 | 3 | 4 | 5 | 6 | 7 |
| Equation | y = 0.173x | y = 0.0662x + 0.3399 | y = 0.0432x + 2.3957 | y = 0.5912x + 7.7666 | y = 0.1955x + 14.674 | y = 0.2647x |
| Explanation value (R2) | 0.9705 | 0.9843 | 0.7812 | 0.9962 | 0.9406 | 0.9566 |
| Odder catchment stations | 2 | 3 | 4 | 5 | ||
| Equation | y = 0.7478x + 6.4106 | y = 0.0975x − 3.1895 | y = 0.3162x − 12.933 | y = 0.0613x − 1.1226 | ||
| Explanation value (R2) | 0.987 | 0.9265 | 0.9749 | 0.8978 | ||
| Jegstrup catchment stations | 2 | 3 | ||||
| Equation | y = 0.1637x + 12.828 | y = 0.524x + 16.49 | ||||
| Explanation value (R2) | 0.7178 | 0.878 |
Appendix B


Appendix C
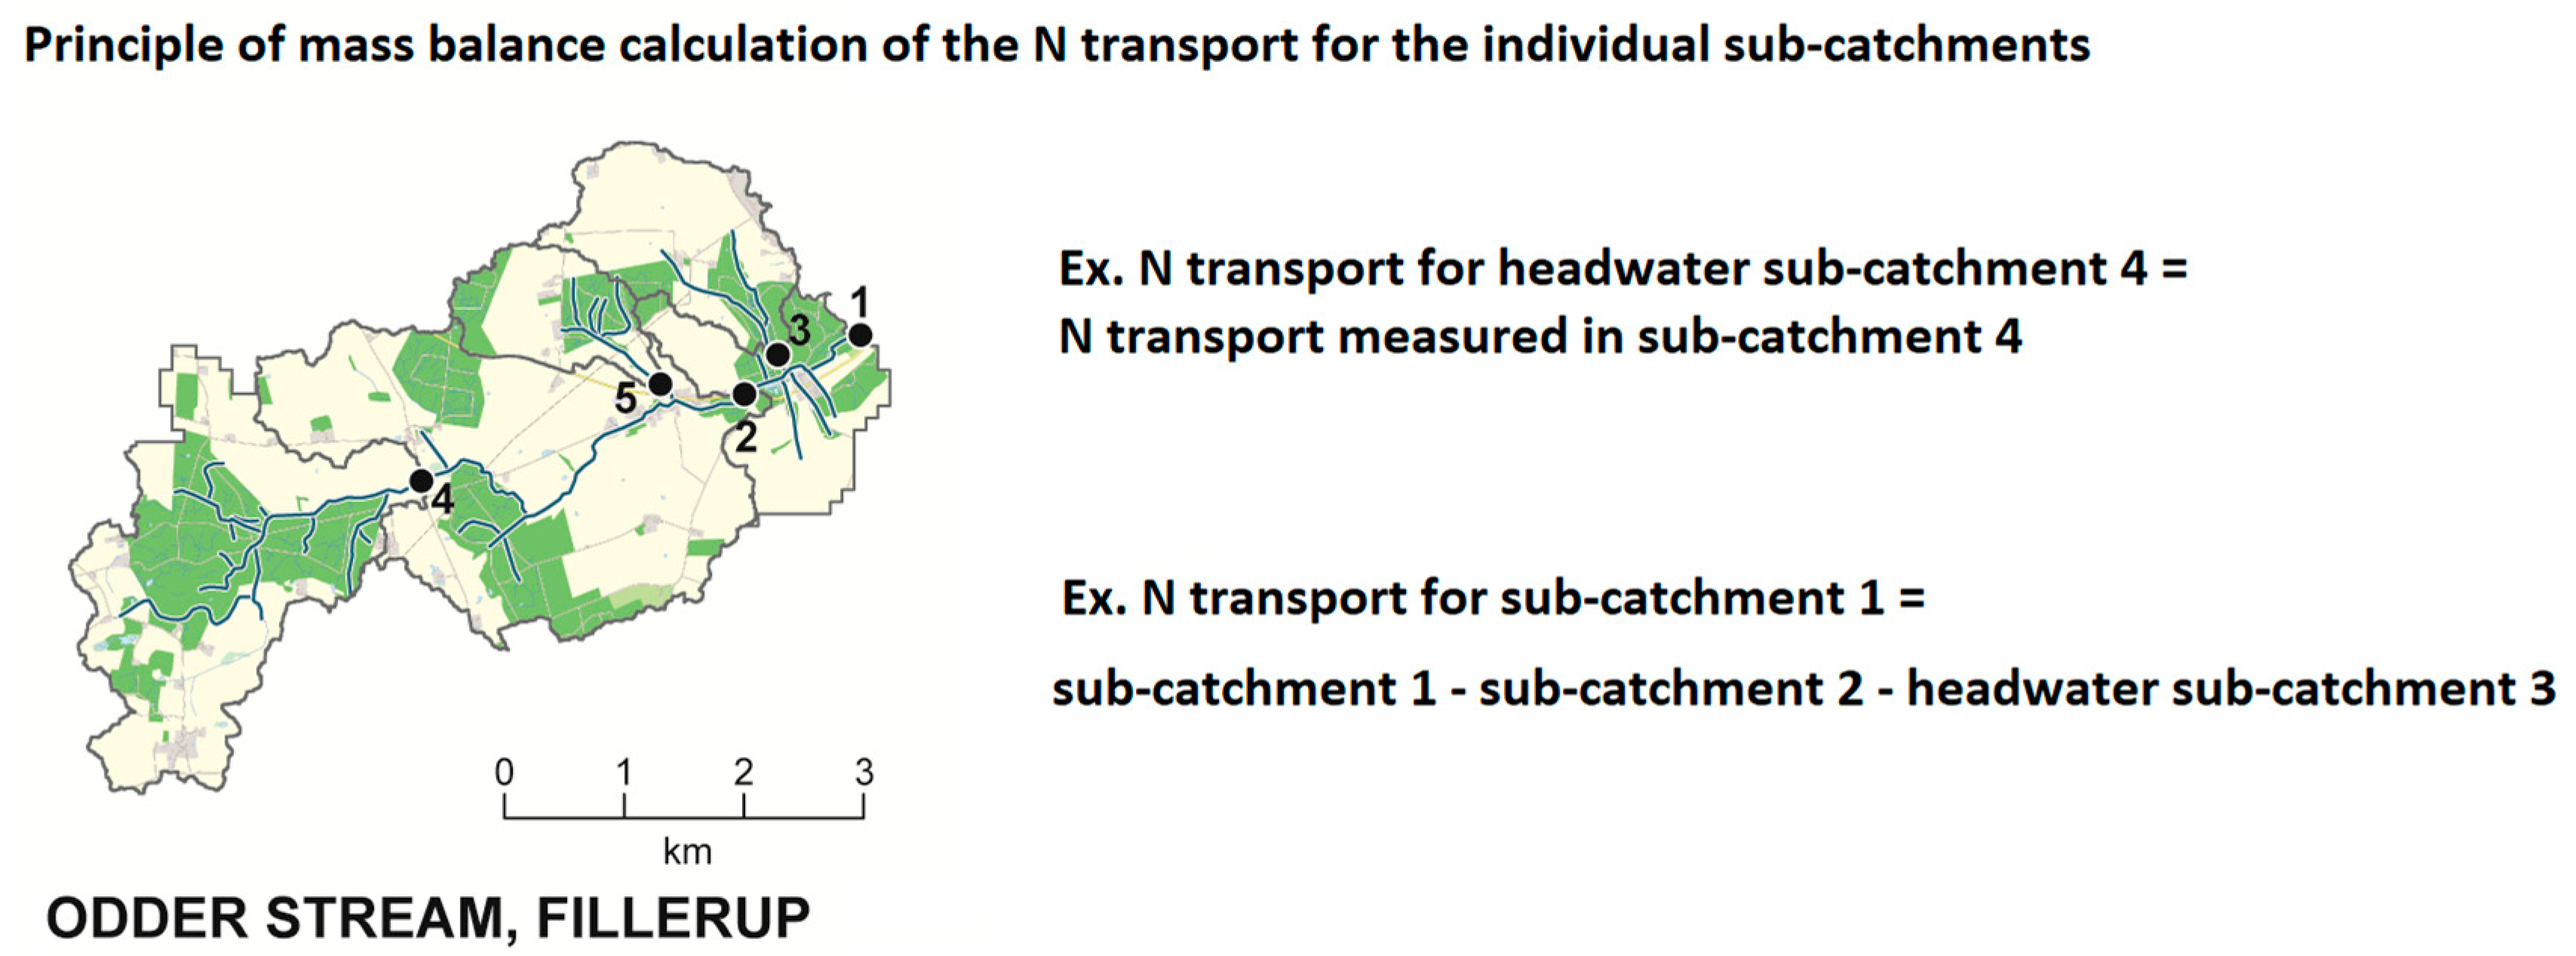
| Main Catchment | Catchment ID | Head Water Catchment * | Calculation Used for Measuring the N Transport and Runoff for the Individual Sub-Catchment ** |
|---|---|---|---|
| Jegstrup stream | 1 | 1 = 1−3 | |
| Jegstrup stream | 2 | X | |
| Jegstrup stream | 3 | 3 = 3−2 | |
| Odder stream | 1 | 1 = 1−2−3 | |
| Odder stream | 2 | 2 = 2−4−5 | |
| Odder stream | 3 | X | |
| Odder stream | 4 | X | |
| Odder stream | 5 | X | |
| Saltø stream | 1 | 1 = 1−2−4−5 | |
| Saltø stream | 2 | 2 = 2−3 | |
| Saltø stream | 3 | X | |
| Saltø stream | 4 | X | |
| Saltø stream | 5 | 5 = 5−6−7 | |
| Saltø stream | 6 | X | |
| Saltø stream | 7 | X |

References
- European Environment Agency; Kristensen, P.; Whalley, C.; Néry, F.; Zal, N.; Christiansen, T. European Waters: Assessment of Status and Pressures 2018; EEA: Copenhagen, Denmark, 2018; ISBN 978-92-9213-947-6. [Google Scholar]
- Riemann, B.; Carstensen, J.; Dahl, K.; Fossing, H.; Hansen, J.W.; Jakobsen, H.H.; Josefson, A.B.; Krause-Jensen, D.; Markager, S.; Stæhr, P.A.; et al. Recovery of Danish Coastal Ecosystems After Reductions in Nutrient Loading: A Holistic Ecosystem Approach. Estuaries Coasts 2016, 39, 82–97. [Google Scholar] [CrossRef] [Green Version]
- Mitsch, W.J.; Day, J.W.; Wendell Gilliam, J.; Groffman, P.M.; Hey, D.L.; Randall, G.W.; Wang, N. Reducing Nitrogen Loading to the Gulf of Mexico from the Mississippi River Basin: Strategies to Counter a Persistent Ecological Problem. BioScience 2001, 51, 373. [Google Scholar] [CrossRef]
- Kronvang, B.; Grant, R.; Kristensen, P.; Aertebjerg, G.; Hovmand, M.; Kirkegaard, J. Nationwide Monitoring of Nutrients and Their Ecological Effects: State of the Danish Aquatic Environment. Ambio J. Hum. Environ. Res. Manag. 1993, 22, 176–187. [Google Scholar]
- Collins, S.; Singh, R.; Rivas, A.; Palmer, A.; Horne, D.; Manderson, A.; Roygard, J.; Matthews, A. Transport and Potential Attenuation of Nitrogen in Shallow Groundwaters in the Lower Rangitikei Catchment, New Zealand. J. Contam. Hydrol. 2017, 206, 55–66. [Google Scholar] [CrossRef]
- Carey, J. The Complex Case of Chesapeake Bay Restoration. Proc. Natl. Acad. Sci. USA 2021, 118, e2108734118. [Google Scholar] [CrossRef]
- The European Commission. Report from the Commission to the Council and the European Parliament on the Implementation of Council Directive 91/676/EEC Concerning the Protection of Waters against Pollution Caused by Nitrates from Agricultural Sources Based on Member State Reports for the Period 2016–2019; EC: Brussels, Belgium, 2021. [Google Scholar]
- Miljøstyrelsen. Tilstanden i Det Danske Vandmiljø. Vand Og Jord 2021, 3, 64. [Google Scholar]
- Miljø- og Fødevareministeriet. Vandområdeplan 2015–2021 for Vandområdedistrikt Jylland og Fyn; Miljø- og Fødevareministeriet: Copenhagen, Denmark, 2016. [Google Scholar]
- Dalgaard, T.; Hansen, B.; Hasler, B.; Hertel, O.; Hutchings, N.J.; Jacobsen, B.H.; Stoumann Jensen, L.; Kronvang, B.; Olesen, J.E.; Schjørring, J.K.; et al. Policies for Agricultural Nitrogen Management—Trends, Challenges and Prospects for Improved Efficiency in Denmark. Environ. Res. Lett. 2014, 9, 115002. [Google Scholar] [CrossRef]
- Hashemi, F.; Olesen, J.E.; Hansen, A.L.; Børgesen, C.D.; Dalgaard, T. Spatially Differentiated Strategies for Reducing Nitrate Loads from Agriculture in Two Danish Catchments. J. Environ. Manag. 2018, 208, 77–91. [Google Scholar] [CrossRef] [PubMed]
- The European Commission. Directive 2000/60/EC of the European Parliament and of the Council of 23 October 2000 Establishing a Framework for Community Action in the Field of Water Policy 2000; EC: Brussels, Belgium, 2000. [Google Scholar]
- HELCOM. Sources and Pathways of Nutrients to the Baltic Sea; Baltic Sea Environment Proceedings No. 153; HELCOM: Helsinki, Finland, 2018. [Google Scholar]
- Miljø- og Fødevareministeriet Aftale Om Fødevare- Og Landbrugspakken. Officiel Aftale om Fødevare- og Landbrugspakken; Miljø- og Fødevareministeriet: Copenhagen, Denmark, 2015. [Google Scholar]
- Petersen, R.J.; Blicher-Mathiesen, G.; Rolighed, J.; Andersen, H.E.; Kronvang, B. Three Decades of Regulation of Agricultural Nitrogen Losses: Experiences from the Danish Agricultural Monitoring Program. Sci. Total Environ. 2021, 787, 147619. [Google Scholar] [CrossRef]
- Miljø- og Fødevareministeriet. Aftale om Målrettet Regulering; Miljø- og Fødevareministeriet: Copenhagen, Denmark, 2018. [Google Scholar]
- Miljøministeriet Departementet. Forslag Til Vandområdeplanerne 2021–2027; Miljøministeriet: Copenhagen, Denmark, 2021. [Google Scholar]
- Højberg, A.L.; Windolf, J.; Børgesen, C.D.; Troldborg, L.; Tornbjerg, H.; Blicher-Mathiesen, G.; Kronvang, B.; Thodsen, H.; Ernstsen, V. National Kvælstofmodel. Oplandsmodel Til Belastning og Virkemidler, Kortleverencer; GEUS, DCE og DCA, Aarhus Universitet: Aarhus, Denmark, 2015. [Google Scholar]
- Hvid, S.K. Kvælstofregulering Og Målretning Med Målinger. Vand Og Jord 2018, 4, 147–149. [Google Scholar]
- Wall, D.; Jordan, P.; Melland, A.R.; Mellander, P.-E.; Buckley, C.; Reaney, S.M.; Shortle, G. Using the Nutrient Transfer Continuum Concept to Evaluate the European Union Nitrates Directive National Action Programme. Environ. Sci. Policy 2011, 14, 664–674. [Google Scholar] [CrossRef]
- Wit, H.A.; Lepistö, A.; Marttila, H.; Wenng, H.; Bechmann, M.; Blicher-Mathiesen, G.; Eklöf, K.; Futter, M.; Kortelainen, P.; Kronvang, B.; et al. Land-use Dominates Climate Controls on Nitrogen and Phosphorus Export from Managed and Natural Nordic Headwater Catchments. Hydrol. Process. 2020, 34, 4831–4850. [Google Scholar] [CrossRef]
- Kyllmar, K.; Forsberg, L.S.; Andersson, S.; Mårtensson, K. Small Agricultural Monitoring Catchments in Sweden Representing Environmental Impact. Agric. Ecosyst. Environ. 2014, 198, 25–35. [Google Scholar] [CrossRef]
- Singh, R.; Elwan, A.; Horne, D.; Manderson, A.; Patterson, M.; Roygard, J. Predicting Land-Based Nitrogen Loads and Attenuation in the Rangitikei River Catchment—The Model Development; Fertilizer and Lime Research Centre, Massey University: Palmerston North, New Zealand, 2017; p. 13. [Google Scholar]
- Müller-Wohlfeil, D.-I.; Jørgensen, J.O.; Kronvang, B.; Wiggers, L. Linked Catchment and Scenario Analysis of Nitrogen Leaching and Loading: A Case-Study from a Danish Catchment-Fjord System, Mariager Fjord. Phys. Chem. Earth Parts A/B/C 2002, 27, 691–699. [Google Scholar] [CrossRef]
- Wendland, F.; Kunkel, R.; Grimvall, A.; Kronvang, B.; Müller-Wohlfeil, D.I. The SOIL-N/WEKU Model System--a GIS-Supported Tool for the Assessment and Management of Diffuse Nitrogen Leaching at the Scale of River Basins. Water Sci. Technol. 2002, 45, 285–292. [Google Scholar] [CrossRef]
- Hvid, S.K. Projektidé Og Pilotoplande. Vand Og Jord 2018, 4, 144–145. [Google Scholar]
- Danmarks Metrologiske Institut. Vejret i Danmark—Året 2016; Danmarks Metrologiske Institut, DMI: Copenhagen, Denmark, 2017. [Google Scholar]
- Van’t Veen, S.G.M.; Kjeldgaard, A.; Tornbjerg, H.; Windolf, J.; Ovesen, N.B.; Blicher-Mathiesen, G.; Kronvang, B. Et Kvælstofudledningskort. Vand Og Jord 2018, 4, 174–178. [Google Scholar]
- Møller, A.B.; Beucher, A.; Iversen, B.V.; Greve, M.H. Predicting Artificially Drained Areas by Means of a Selective Model Ensemble. Geoderma 2018, 320, 30–42. [Google Scholar] [CrossRef]
- Poulsen, J.; Tornbjerg, H.; Windolf, J.; Larsen, S.E.; Kronvang, B.; Højberg, A.L. Vandløbsmålinger som Grundlag for Emissionsbasseret Kvælstofregulering; Institut for Bioscience, Aarhus Universitet: Aarhus, Denmark, 2016; p. 73. [Google Scholar]
- Kronvang, B.; Bruhn, A.J. Choice of Sampling Strategy and Estimation Method for Calculating Nitrogen and Phosphorus Transport in Small Lowland Streams. Hydrol. Process. 1996, 10, 1483–1501. [Google Scholar] [CrossRef]
- Carstensen, M.V.; Zak, D.; van’t Veen, S.G.M.; Wisniewska, K.; Ovesen, N.B.; Kronvang, B.; Audet, J. Nitrogen Removal and Greenhouse Gas Fluxes from Integrated Buffer Zones Treating Agricultural Drainage Water. Sci. Total Environ. 2021, 774, 145070. [Google Scholar] [CrossRef]
- DS/EN 12260; Water Quality—Determination of Nitrogen—Determination of Bound Nitrogen (TNB), Following Oxidation to Nitrogen Oxides. Dansk Standard: Copenhagen, Denmark, 2003.
- DS/EN ISO 10304; Water Quality—Determination of Dissolved Anions by Liquid Chromatography of Ions—Part 1: Determination of Bromide, Chloride, Fluoride, Nitrate, Nitrite, Phosphate and Sulfate. Dansk Standard: Copenhagen, Denmark, 2009.
- Gustard, A.; Bullock, A.; Dixton, J.M. Low Flow Estimation in the United Kingdom; Institute of Hydrology: Crowmarsh Gifford, UK, 1992; p. 292. [Google Scholar]
- Kristensen, K.; Waagepetersen, J.; Børgesen, C.D.; Vinther, F.P.; Grant, R.; Blicher-Mathiesen, G. Reestimation and Further Development in the Model N-LES; Aarhus University, Faculty of Agricultural Sciences: Tjele, Denmark, 2008; p. 30. [Google Scholar]
- Blicher-Mathiesen, G.; Andersen, H.E.; Carstensen, J.; Børgesen, C.D.; Hasler, B.; Windolf, J. Reprint of “Mapping of Nitrogen Risk Areas”. Agric. Ecosyst. Environ. 2014, 198, 83–93. [Google Scholar] [CrossRef]
- Børgesen, C.D.; Pullens, J.W.; Zhao, J.; Blicher-Mathiesen, G.; Sørensen, P.; Olesen, J.E. NLES5—An Empirical Model for Estimating Nitrate Leaching from the Root Zone of Agricultural Land. Eur. J. Agron. 2022, 134, 126465. [Google Scholar] [CrossRef]
- Vervloet, L.S.C.; Binning, P.J.; Børgesen, C.D.; Højberg, A.L. Delay in Catchment Nitrogen Load to Streams Following Restrictions on Fertilizer Application. Sci. Total Environ. 2018, 627, 1154–1166. [Google Scholar] [CrossRef] [PubMed]
- Olesen, J.E.; Børgesen, C.D.; Hashemi, F.; Jabloun, M.; Bar-Michalczyk, D.; Wachniew, P.; Zurek, A.J.; Bartosova, A.; Bosshard, T.; Hansen, A.L.; et al. Nitrate Leaching Losses from Two Baltic Sea Catchments under Scenarios of Changes in Land Use, Land Management and Climate. Ambio 2019, 48, 1252–1263. [Google Scholar] [CrossRef]
- Larsen, S.E.; Kristensen, K. Udvaskningsmodellen N-LES3: Usikkerhed og Validering; [1. oplag]; Aarhus Universitet, Det Jordbrugsvidenskabelige Fakultet: Tjele, Denmark, 2007; ISBN 978-87-91949-24-1. [Google Scholar]
- Abrahamsen, P.; Hansen, S. Daisy: An Open Soil-Crop-Atmosphere System Model. Environ. Model. Softw. 2000, 15, 313–330. [Google Scholar] [CrossRef]
- Miljø- og Fødevareministeriet. Punktkilder 2015; Miljø- og Fødevareministeriet: Copenhagen, Denmark, 2017. [Google Scholar]
- Miljø- og Fødevareministeriet. Punktkilder 2016—NOVANA Punktkilder; Miljø- og Fødevareministeriet: Copenhagen, Denmark, 2018. [Google Scholar]
- Højberg, A.L.; Troldborg, L.; Tornbjerg, H.; Windolf, J.; Blicher-Mathiasen, G.; Thodsen, H.; Kronvang, B.; Børgesen, C.D. Development of a Danish national nitrogen model—Input to a new spatial differentiated regulation. In Proceedings of the LuWQ2015, Land Use and Water Quality: Agricultural Production and the Environment, Vienna, Austria, 21–24 September 2015. [Google Scholar]
- Ellermann, T.; Bossi, R.; Nygaard, J.; Christensen, J.; Løfstrøm, P.; Monies, C.; Grundahl, L.; Geels, C. Atmosfærisk Deposition 2015. NOVANA; Aarhus Universitet, DCE—Nationalt Center for Miljø Og Energi: Roskilde, Denmark, 2016; p. 70. [Google Scholar]
- Ellermann, T.; Bossi, R.; Nygaard, J.; Christensen, J.; Løfstrøm, P.; Monies, C.; Grundahl, L.; Geels, C.; Nielsen, I.E.; Poulsen, M.B. Atmosfærisk Deposition 2016. NOVANA; Aarhus Universitet, DCE—Nationalt Center for Miljø Og Energi: Roskilde, Denmark, 2018; p. 67. [Google Scholar]
- Styrelsen for Dataforsyning og Effektivisering Hydrologisk Informations- Og Prognosesystem. Modelberegninger 100 m Grid, Terrænnært Grundvand; Styrelsen for Dataforsyning og Effektivisering Hydrologisk Informations- Og Prognosesystem: Copenhagen, Denmark, 2023. [Google Scholar]
- Van’t Veen, S.G.W.; Tornbjerg, H.; Windolf, J.; Kjeldgaard, A.; Ovesen, N.B.; Poulsen, J.; Kronvang, B. Hvordan Måles Kvælstof i Vandløb? Vand Og Jord 2018, 4, 169–173. [Google Scholar]
- Blicher-Mathiesen, G.; Tornbjerg, H.; Windolf, J.; Thodsen, H.; Andersen, H.E.; Ovesen, N.B.; Kronvang, B. Nitrat N-Udledning for Typeoplande og Havbelastningsoplande Med Målt Kontinuert Tidsserie 1990–2016; Aarhus Universitet, DCE—Nationalt Center for Miljø og Energi: Roskilde, Denmark, 2017; p. 19. [Google Scholar]
- Larsen, S.E.; Tornbjerg, H.; Thodsen, H.; Kronvang, B.; Blicher-Mathiesen, G. Analyse af Organisk Kvælstof Koncentrationer i Vandløb i to Perioder Med Henblik På at Udvikle en Korrektionsformel for Perioden 2009–2014; Aarhus Universitet, DCE—Nationalt Center for Miljø og Energi: Roskilde, Denmark, 2021; p. 115. [Google Scholar]
- Christensen, I.M.V.; Højberg, A.L. Udfordringer Ved Estimering Af Lokal Nitratretention. Vand Og Jord 2018, 4, 183–186. [Google Scholar]
- Blicher-Mathiesen, G.; Bøgestrand, J.; Kjeldgaard, A.; Ernstsen, E.; Højberg, A.L.; Jakobsen, P.R.; von Platen, F.; Tougaard, L.; Hansen, J.R.; Børgesen, C.D. Kvælstofreduktionen fra Rodzonen Til Kyst for Danmark. Fagligt Grundlag for et Nationalt Kort; Danmarks Miljøundersøgelser, Aarhus Universitet: Aarhus, Denmark, 2007; p. 68. [Google Scholar]
- Højberg, A.L.; Hansen, A.L.; Wachniew, P.; Żurek, A.J.; Virtanen, S.; Arustiene, J.; Strömqvist, J.; Rankinen, K.; Refsgaard, J.C. Review and Assessment of Nitrate Reduction in Groundwater in the Baltic Sea Basin. J. Hydrol. Reg. Stud. 2017, 12, 50–68. [Google Scholar] [CrossRef]
- Ocampo, C.J.; Oldham, C.E.; Sivapalan, M. Nitrate Attenuation in Agricultural Catchments: Shifting Balances between Transport and Reaction: Shifting Balances in Nitrate Attenuation. Water Resour. Res. 2006, 42, W01408. [Google Scholar] [CrossRef]
- Ørum, J.E.; Kjærgaard, C.; Thomsen, I.K. Landbruget og Vandområdeplanerne: Omkostninger og Implementering af Virkemidler i Oplandet Til Norsminde Fjord; Institut for Fødevare- og Ressourceøkonomi, Københavns Universitet: Copenhagen, Denmark, 2017. [Google Scholar]
- Hvid, S.K.; SEGES INNOVATION, Aarhus, Denmark. Personal Communication, 2018.


| Catchment | Coastal Area (Final Recipient) | Maximum Average Emission from Agricultural Areas at Target Emission 2027 According to River Basin Management Plans 2015–2021 (kg N/ha) | Normalized N Emissions from Agricultural Areas Minus the Retention (kg N/ha) |
|---|---|---|---|
| Jegstrup stream | Hjarbæk | 9.7 | 3.7 |
| Odder stream | Norsminde | 6.6 | 19.4 |
| Saltø stream | Karrebæk | 10.7 | 21.9 |
Disclaimer/Publisher’s Note: The statements, opinions and data contained in all publications are solely those of the individual author(s) and contributor(s) and not of MDPI and/or the editor(s). MDPI and/or the editor(s) disclaim responsibility for any injury to people or property resulting from any ideas, methods, instructions or products referred to in the content. |
© 2023 by the authors. Licensee MDPI, Basel, Switzerland. This article is an open access article distributed under the terms and conditions of the Creative Commons Attribution (CC BY) license (https://creativecommons.org/licenses/by/4.0/).
Share and Cite
van’t Veen, S.G.M.; Rolighed, J.; Laugesen, J.R.; Blicher-Mathiesen, G.; Kronvang, B. High Spatial Resolution Nitrogen Emission and Retention Maps of Three Danish Catchments Using Synchronous Measurements in Streams. Water 2023, 15, 498. https://doi.org/10.3390/w15030498
van’t Veen SGM, Rolighed J, Laugesen JR, Blicher-Mathiesen G, Kronvang B. High Spatial Resolution Nitrogen Emission and Retention Maps of Three Danish Catchments Using Synchronous Measurements in Streams. Water. 2023; 15(3):498. https://doi.org/10.3390/w15030498
Chicago/Turabian Stylevan’t Veen, Sofie G. M., Jonas Rolighed, Jane R. Laugesen, Gitte Blicher-Mathiesen, and Brian Kronvang. 2023. "High Spatial Resolution Nitrogen Emission and Retention Maps of Three Danish Catchments Using Synchronous Measurements in Streams" Water 15, no. 3: 498. https://doi.org/10.3390/w15030498