
Hydraulic Conditions of Incipient Rill by Raindrop-Induced Overland Flow on Steep Slopes of Sandy Soil

1
Institute for Disaster Prevention, Gangneung-Wonju National University, Gangneung 25457, Gangwon, Republic of Korea
2
Department of Civil Engineering, Gangneung-Wonju National University, Gangneung 25457, Gangwon, Republic of Korea
3
KSM Engineering Co., Anyang 14053, Gyeonggi, Republic of Korea
4
Department of Soil and Water Systems, University of Idaho, Boise, ID 83702, USA
*
Author to whom correspondence should be addressed.
Water 2023, 15(3), 502; https://doi.org/10.3390/w15030502
Submission received: 30 November 2022
/
Revised: 10 January 2023
/
Accepted: 20 January 2023
/
Published: 27 January 2023
(This article belongs to the Special Issue Recent Advances in Soil Erosion and Sedimentation: From the Hillslope to Watershed)
Abstract
:Hydraulic characteristics of rill incipience on steep slopes with sandy soils are different from those of gentle slopes in the mountainous watersheds. In other to better understand the processes of the incision and expansion of rill, rainfall simulations were conducted in a laboratory soil box with an inflow device installed at the top of the steep slope. The location and shape of the rill incision were tested with respect to different slopes (20, 24, and 28°), rainfall intensity (80 and 100 mm/h), and segment distances with various inflow rates (0.0, 8.8, 17.5, and 26.3 ml/s). The result showed that rills with heatcut were mostly incised on the 2.4 m segments and progressively moved upslope on the 3.2 m segments. The steps of rill evolution with increase of inflow are identified as four stages; (1) sheet flow with impact of raindrops, (2) overland flow with flowpaths, (3) microrill with headcut incision, and (4) rill enhanced by headcut expansion. It appears that incision and headcut of rill is prevalent when the Froude number (Fr) changes from subcritical flow to supercritical flow and the maximum velocity of rill reaches over 0.065 m/s. Unit stream power using the maximum velocity of rill was the best parameter for estimating rill erosion as rill evolution greatly depends on maximum velocity of the local flow enhanced by rill incision and expansion As a result, it was found that critical conditions for rill incipient of sandy soils on steep slope are observed greater than those of loamy soils or gentle slopes.
1. Introduction
According to the distribution data of slope and soil in the Republic of Korea, hillslopes with a slope of 20° or more account for 82.8% of forest areas, and sandy loam occupies the largest proportion [1]. On most hillslopes of forest and rangeland, the interrill erosion occupies the dominant area rather than rill erosion due to interception and infiltration enhanced by ample vegetation cover [2,3,4,5,6]. However, rill erosion is more important than interrill erosion because the amount of sediment transported from rills is significant as opposed to the amount removed from interrill areas [6,7,8,9,10,11,12]. Several studies reported that the sediments occupying more than 70% of soil loss from hillslopes are transported from rills [13,14,15,16]. In the Republic of Korea, rill erosion has increased significantly, driven by highland agriculture, constructions, and serious wildfire [17,18,19,20,21,22,23]. The strong disturbances not only changed coverages of vegetation, and roughness, micromorphology, hardness, and pores of hillslope beds but also exposed extensively subsoil containing few loams and coarser grains [20,23,24,25,26].
Research on rill development on gentle slopes with agricultural soils has been actively conducted for several decades due to the serious increase of sediment yield worldwide [6,7,27,28,29,30,31,32,33,34,35,36,37]. Abrahams et al., [33] and Nearing et al. [6] stated that slope and soil materials are as influential on flow velocity as is the discharge of rill on a rangeland hillslope. The incision and evolution of rill depends on the hydraulic capacity of overland flow to detach and transport sediment. In recent years, rill studies have expanded to steep hillslopes in agricultural highlands, rangelands, and construction and wildfire areas [23,33,38,39,40,41,42,43,44,45,46]. Soil particles located on the surface of a steep slope are susceptible to erosion because their potential energy is high, but critical shear stress for initial motion is small compared to gentle slopes [25,39,47]. Density, volume, and the erosion rate of rills increase exponentially with slope gradient and flow rate as higher flow rates and steeper slopes can increase flow velocity, flow shear force, and erosivity [37,48,49].
Rill erosion is more sensitive to hydrodynamic characteristics of rill flow rather than hydraulic parameters of overland flow [6,36,42,45,46,48,49,50,51]. Rill experiments on field or laboratory of steep slope can help to understand hydraulic and hydrodynamic characteristics of rill development and processes [33,37,38,40,42,43,44,45,48,52,53]. Studies showed that silt and loamy soils are much more susceptible to interrill and rill erosion than clay or sandy soils [12,54,55]. Most of their studies, therefore, have been conducted on silt loam, loam, or sandy loam. There are little studies on the incipience and evolution of rill on sandy soil containing few loams and coarser grains as we demonstrate in this paper.
The experiments are divided into the inflow supply conditions [33,37,38,44,45] and the simulation of rainfall on plot of long length (>5 m) [40,43,48,52,53]. Tian et al. [42] stated that the interaction of rainfall and inflow enhances rill erosion. The simulation test of rainfall on a plot of long length makes more meaningful than inflow supply conditions in identifying the process by which the rill is initiated and developed by interaction of rainfall and overland flow. However, it is not easy to measure accurately flow velocity and overland flow rate in the incipience of rill incised by rainfall impact and inflow. Separate measurements are required for the segments of a long plot on which rills may form. In this study, rill experiments were performed by using short plots in which rainfall and runoff were supplied simultaneously. The objectives of this study were to: (1) find out the critical conditions of rill incised by raindrop-induced overland flow; and (2) evaluate the hydraulic and hydrodynamic characteristics of rill evolution on a steep slope with sandy soil.
2. Rainfall Simulation
2.1. Experimental Condition
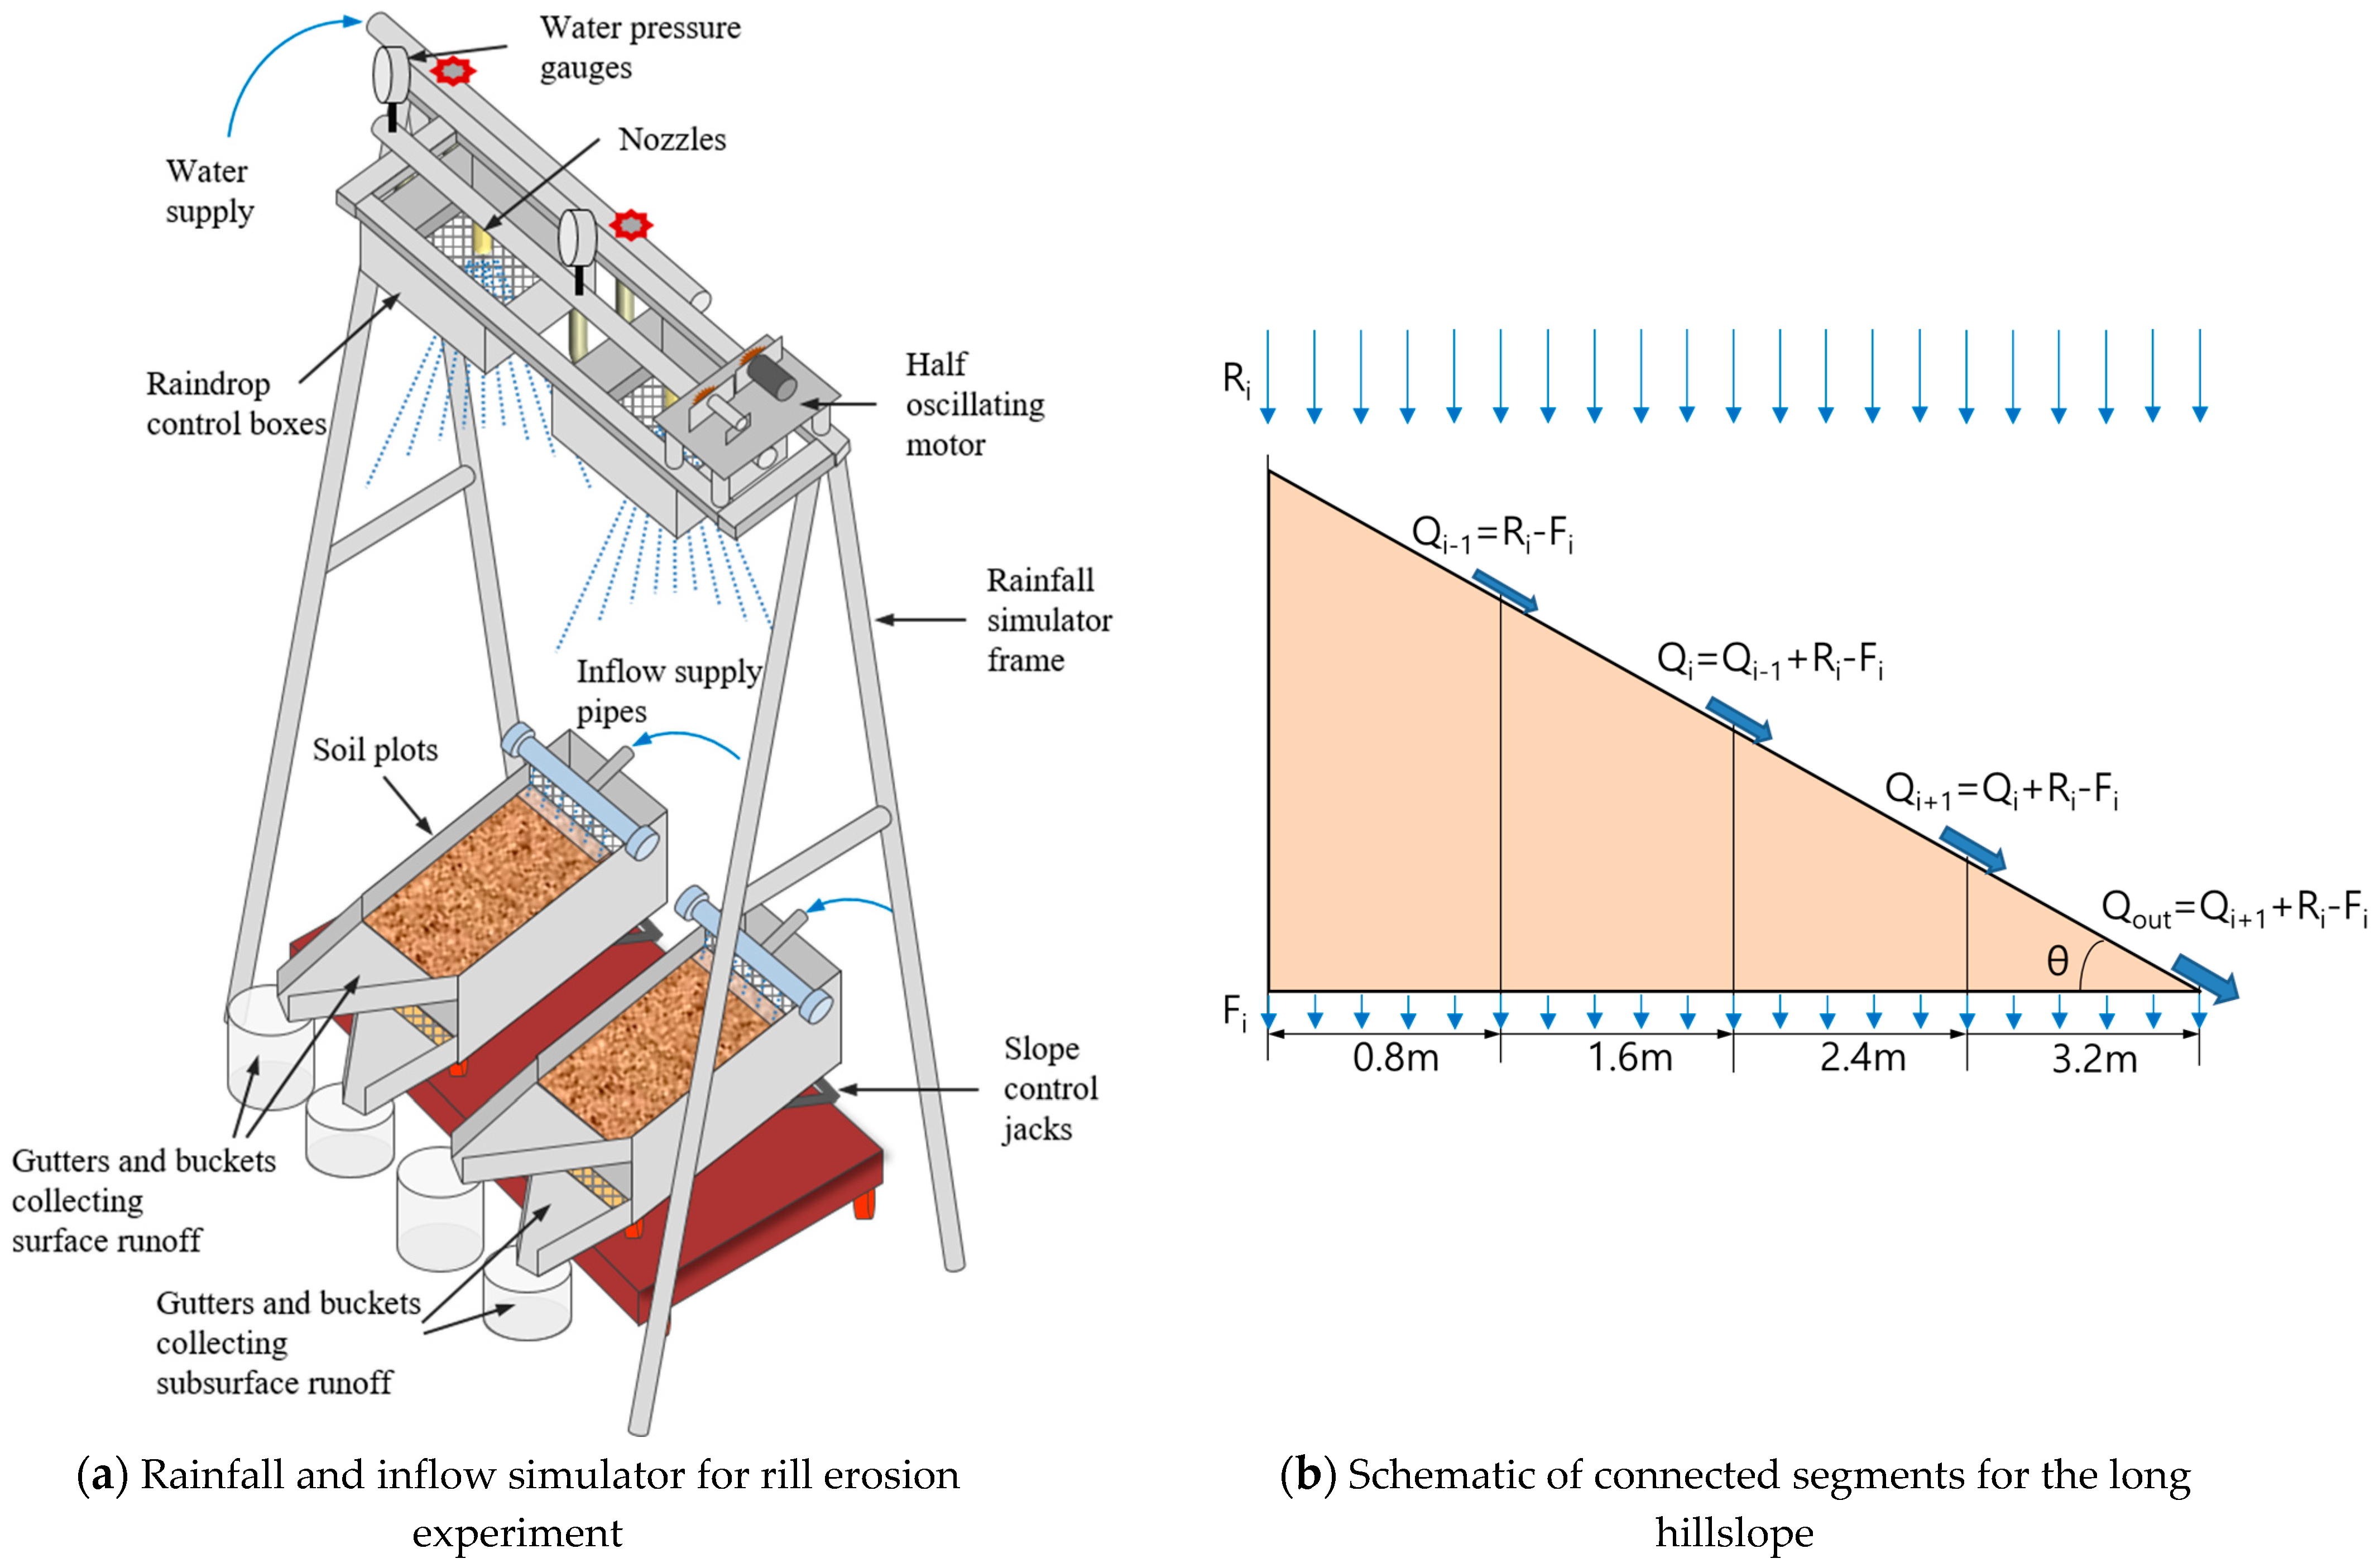
The experimental equipment for rill erosion as shown in Figure 1a had been invented by Shin et al. [56] and have been used by Nam et al. [57] and Shin et al. [58] to study interrill erosion by interaction of raindrops and sheetflow. The rainfall simulator used VeeJet80100 nozzles connected with a half-oscillating motor. Soil boxes of 0.6 m × 0.8 m size were designed to control the slope from horizontal to steep slope (<30°) and induce subsurface runoff and surface runoff. At the outlet of the soil box, a guide plate is installed to collect of surface runoff and sediment. Drainage nets and guide plates are installed so that infiltrated water flows out in the form of subsurface flow. The rainfall intensity of simulated rainfall was measured using a steel container. A specific PVC pipes to supply inflow were installed at the upslope end of the soil box as the method presented by Tian et al. [42]. Four inflow conditions were established to reproduce the long hillslope of 3.2 m length using a soil box 0.8 m in length (Figure 1b). According to the research of Yao et al. [40], it was confirmed that the incision of the rill appears within 3 m in the case of a steep slope. Although the division of segments is difficult to assess the continuity of rill development, it is easy to evaluate the hydrologic response and hydraulic characteristics of each stage. The first segment was supplied only rainfall without inflow water, while the second, third, and fourth segments were supplied both constant rainfall and inflow increasing with the distance of segments. The accumulated overland flow (= inflow) increases as it moves to the lower slopes, as shown in Figure 1b.
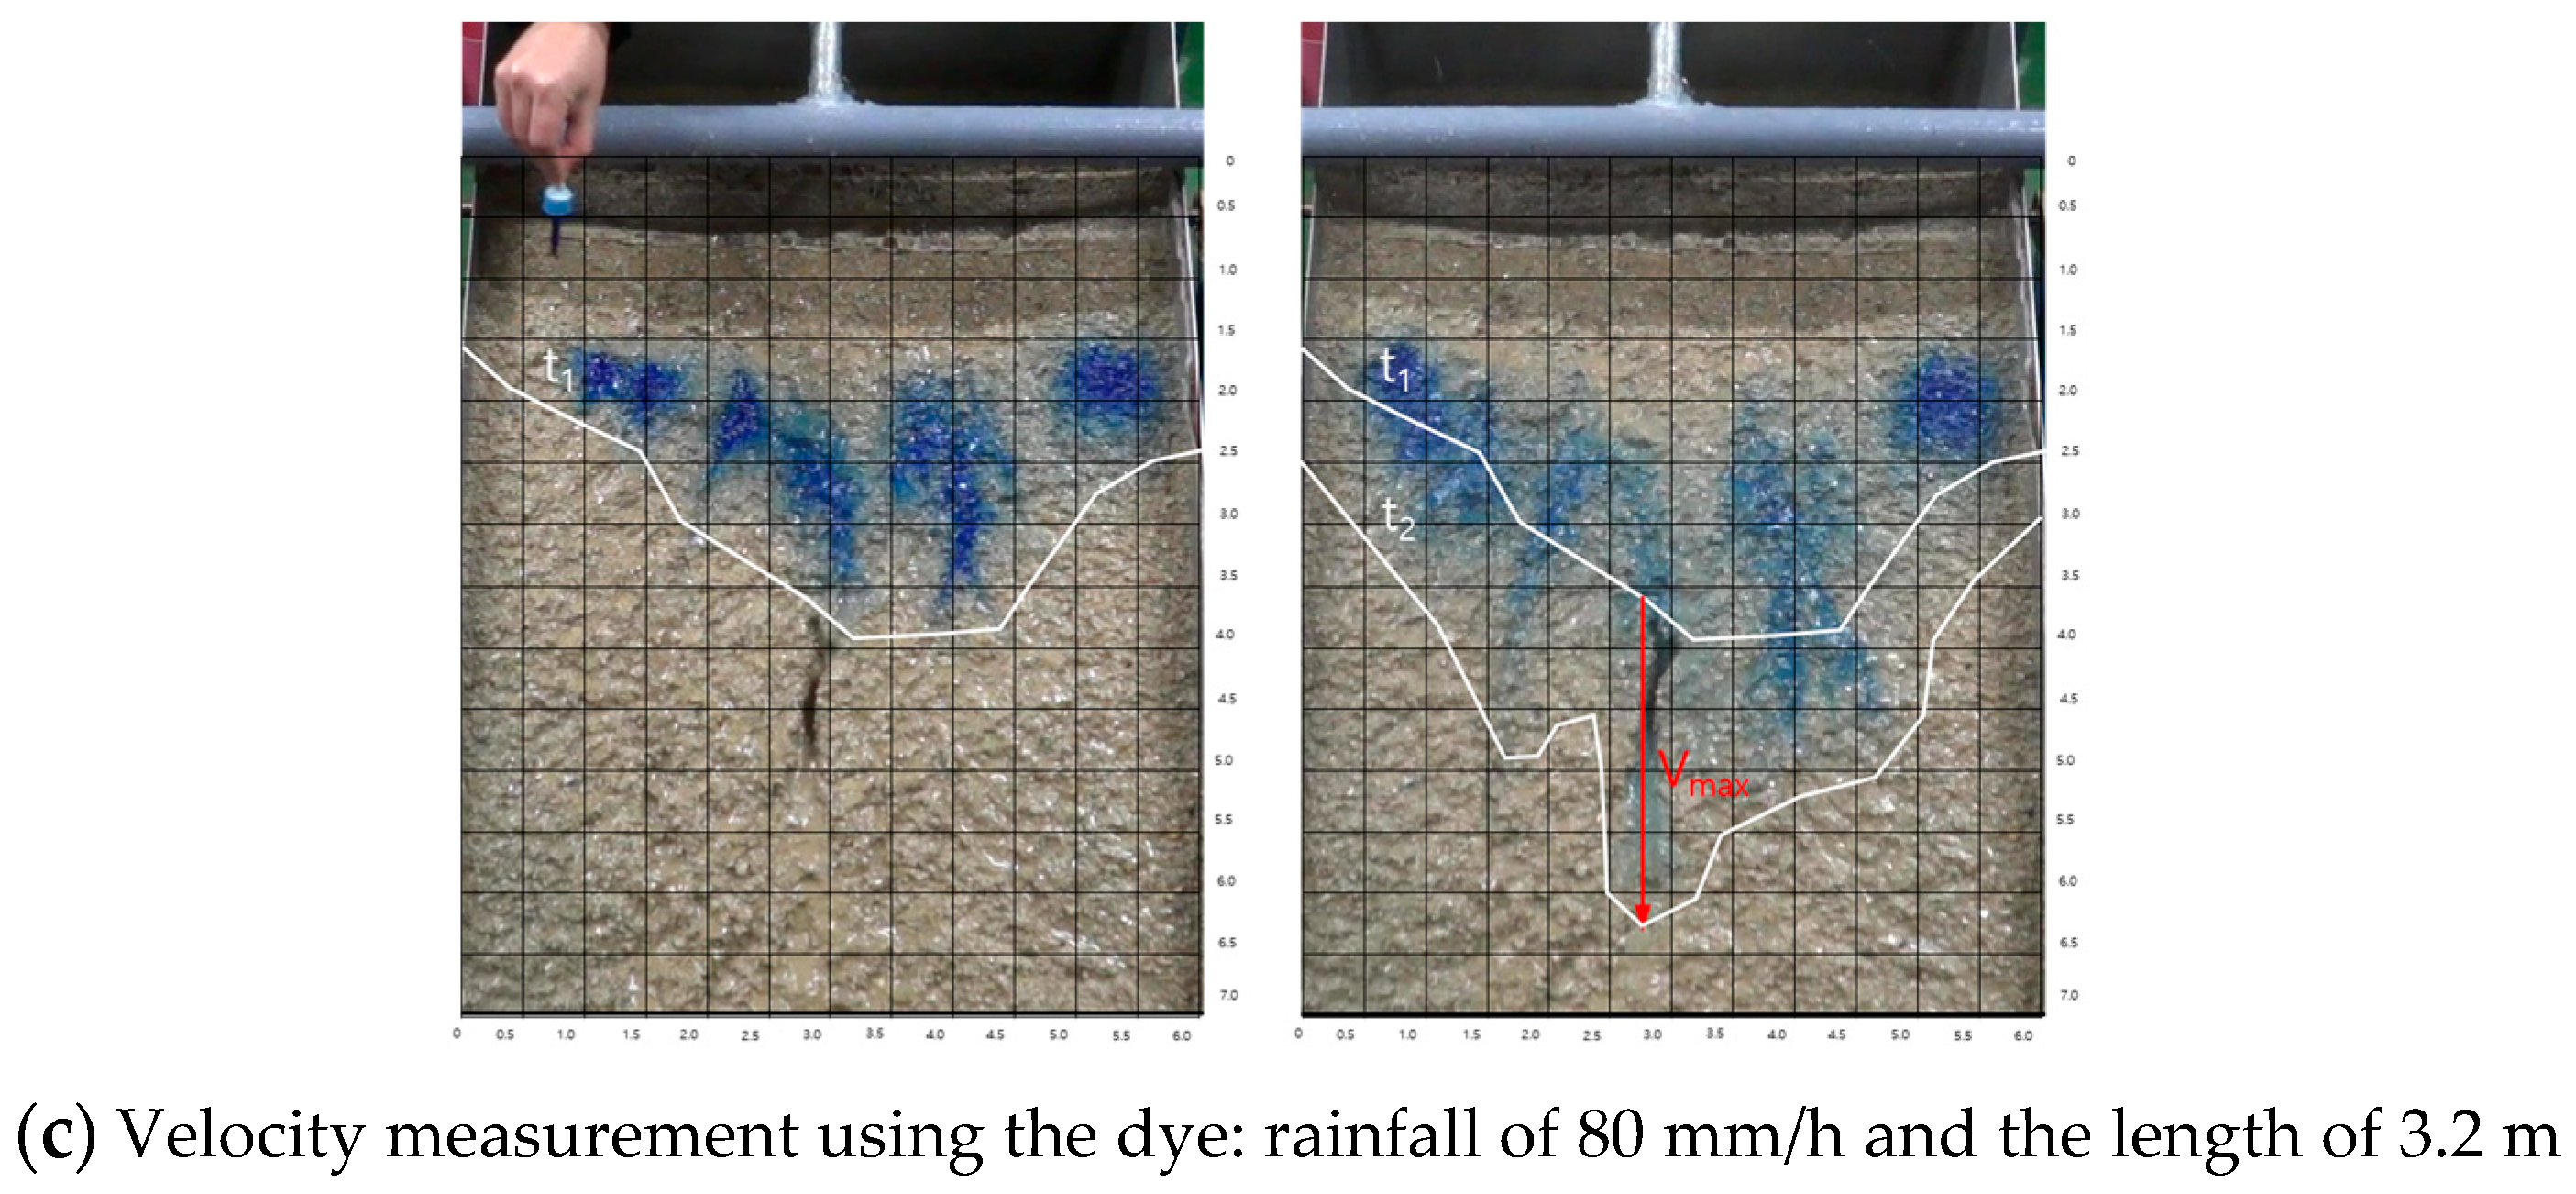
The experimental slopes were three steep slopes of 20°, 24°, and 28° because the hillslopes with a slope of 20° or more account for 82.8% of forest areas in the Republic of Korea. Rainfall simulations were conducted under rainfall intensities of 80 mm/h and 100 mm/h during 10 min. The simulated rainfall is an extreme rainfall with probability frequency of 200 years or more of the Gangneung area in the Republic of Korea. Discharges of inflow were calculated by rational method (Q = CIA) as considering runoff coefficient (C), simulated rainfall intensity (I), and projected area (A) of plot. The runoff coefficient used 0.8; Shin et al. [58] performed an interrill erosion experiment using the same soil as in this study. The soil used in the experiment was the mountain soil of Sacheonmyeon, Gangneung, an existing field site [25], used in the studies of Nam et al. [57], Park et al. [59], and Shin et al. [58]. The distribution of individual grain sizes separated by a sieve analysis was used to estimate soil texture and mean diameter. Soil types were classified into 11 types (e.g., sand with particle size distribution) based on the standards of the Natural Resources Conservation Service (NRCS). The ranges of erosivity factors, topography factors, and soil erodibility factors for the rill experiment are shown in Table 1. The velocity of the overland flow was recorded by a dye-tracing method using the analysis of images of the video. The dye injection was carried out four times at the upslope of the plot during the simulation of 10 min as in Figure 1c. A video camera was also set up to record the entire experiment. Through the recorded image analysis, the distance of the dye that moved for a certain time was checked after dye injection to calculate the flow velocity distribution for the cross-section, mean velocity of overland flow, and maximum velocity of the rill flow. The discharge of overland flow was obtained from the difference between the total weight of surface runoff collected in buckets and dry weight of sediment dried in an oven at 105 °C.
2.2. Rill Erosion
Rills were initiated when the overland flow had the ability to detach and transport significant soil particles and create microchannels [27,60]. Merritt [28] presented four stages in the development of rills: unconcentrated overland flow (sheetflow) overland flow with concentrated flow paths (flowlines), microchannels without headcuts, and microchannels with headcuts. The flow condition of the four stages changed smoothly as the Froude number (Fr) increased from subcritical to supercritical [27,32,61]. The formation of the rill was controlled by the effects of the raindrop impact on the flow, the shear strength of the soil particles, the effect of gravity by slope steepness, cohesion of the soil, changes of sediment concentration, and so forth [54,62].
Overland flow with increased flow depth increases the capacity of detachment and transport. The discharge of overland flow was determined by the infiltration rate of soil on the hydrological process. The runoff coefficient was calculated as the runoff discharge divided by the supply water discharge.
The hydraulic characteristic of overland flow with rill form is generally expressed by the Reynolds number (Re) and Froude number (Fr), which is calculated as:
where, is the mean velocity of overland flow (m/s), is the mean depth of overland flow (m), is kinematical viscosity (m2/s), and is acceleration of gravity (m/s2).
The hydrodynamic parameters of rill flows are shear stress, stream power [63], and unit stream power [64], which are calculated as:
where is the flow shear stress (N/m2), is the density of water (kg/s3), is surface slope (m/m), is flow stream power (N/m/s), is unit stream power (m/s), and is the maximum velocity of overland flow (m/s).
Each type of soil has a threshold under which the flow velocity does not produce sufficient force to dislodge the soil particles to form rills [65]. On many non-cohesive slopes, the shear velocity shows between 3.0 and 3.5 cm/s around at an angle of 2° [66]. Shear stress of flow within rill determines the rate of detachment of soil particle [67]. Torri et al. [61] stated that the criterion for rill formation is the relationship between shear stress exerted by the flow and shear strength of the soil. Gover [62] stated that the exponent of unit stream power increases with increasing grain size and presented the critical value which VcrS is 0.4 cm/s.
3. Results and Discussion
3.1. Rill Evolution
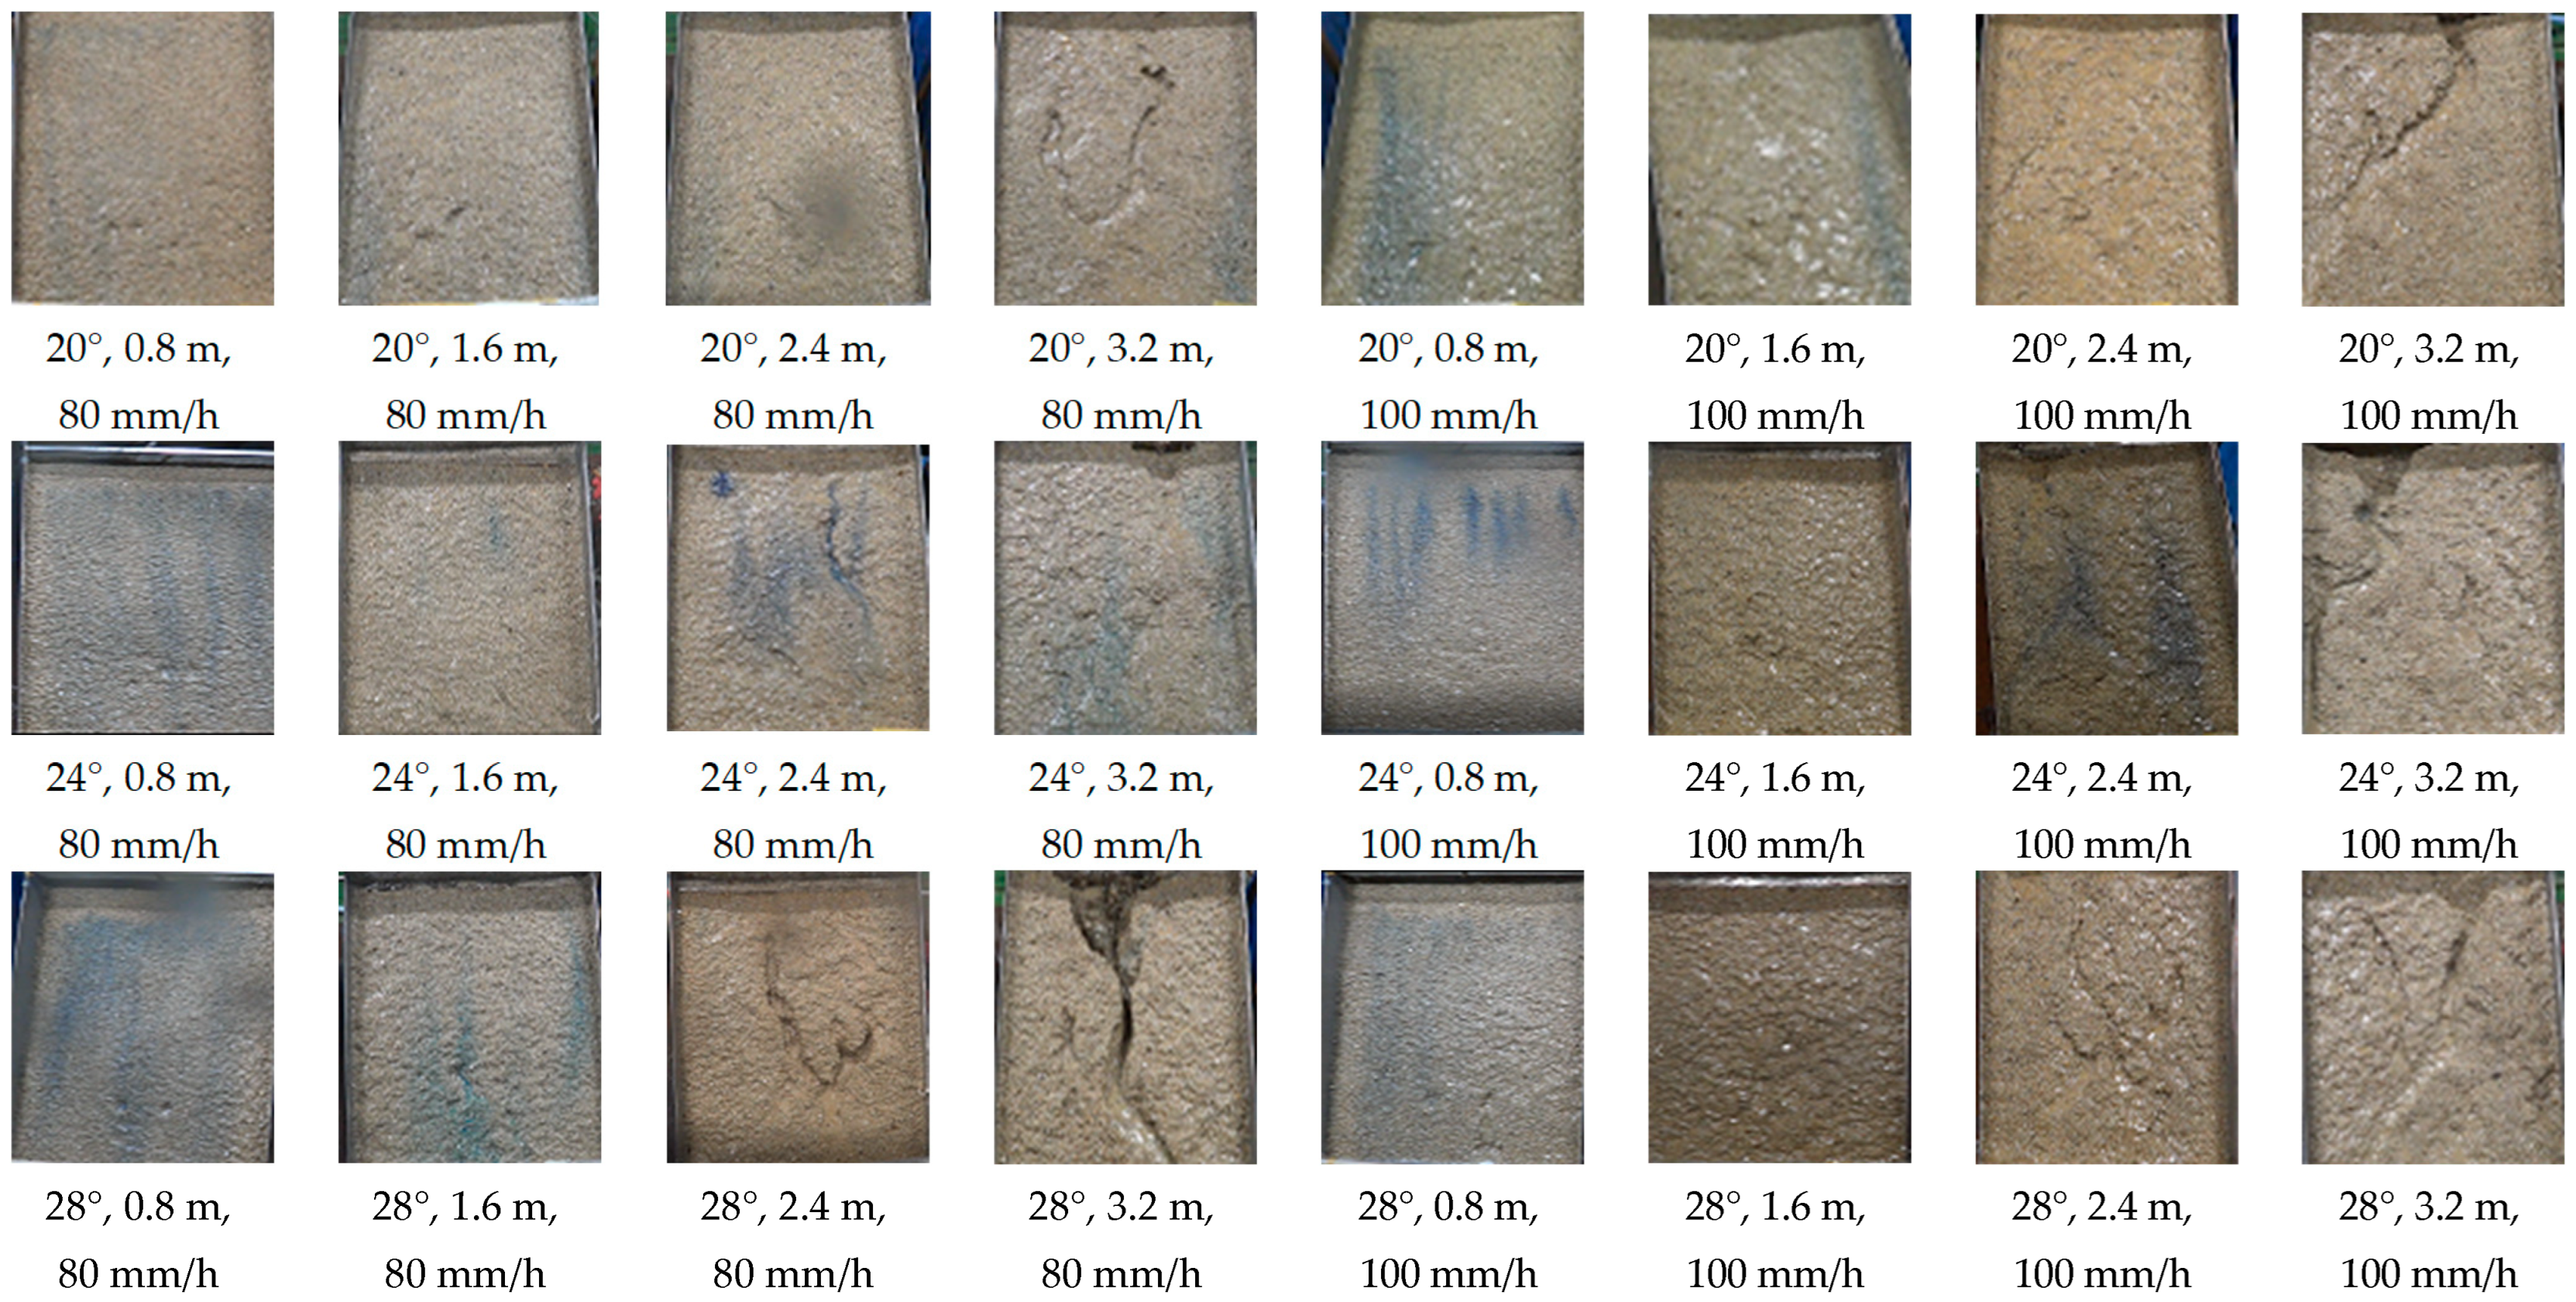
The rill evolution showed a different formation and size under the conditions of slope steepness, the segment location, and rainfall intensity, as shown in Figure 2. The longer the segment distance, the more clearly active the rill development. However, no real rill developed until 1.6 m segments. A rill with headcut clearly appeared on the 2.4 m segments except the segment of slope of 20° and rainfall intensity of 80 mm/h. This is similar to the study results of Yao et al. [40] that the distance of rill initiation was in the range of 2.11–2.40 m under conditions of rainfall intensity of 100 mm/h and slope of 20°–25°. Rill incisions began within 2–4 min on the 2.4 m segments and 0.5–1.5 min on the 3.2 m segments. The steeper the slope, the shorter the rill incision time. On the 3.2 m segments, the headcut of the rills moved progressively to the upslope and sidewall collapse and bed incision of rills appeared except the segments of slope of 20° and rainfall intensity of 80 mm/h. In general, the flow velocity and rill expansion increased with an increasing slope gradient. Although all rills were associated with headcut development, all headcuts did not develop into rills as presented by Slattery and Bryan [32]. The steps of rill evolution according to location of the segments are arranged as follows; (1) sheet flow with impact of raindrops, (2) overland flow with flowpaths, (3) microrill with headcut incision, and (4) rill enhanced by headcut expansion.
3.2. Velocity of Overland Flow
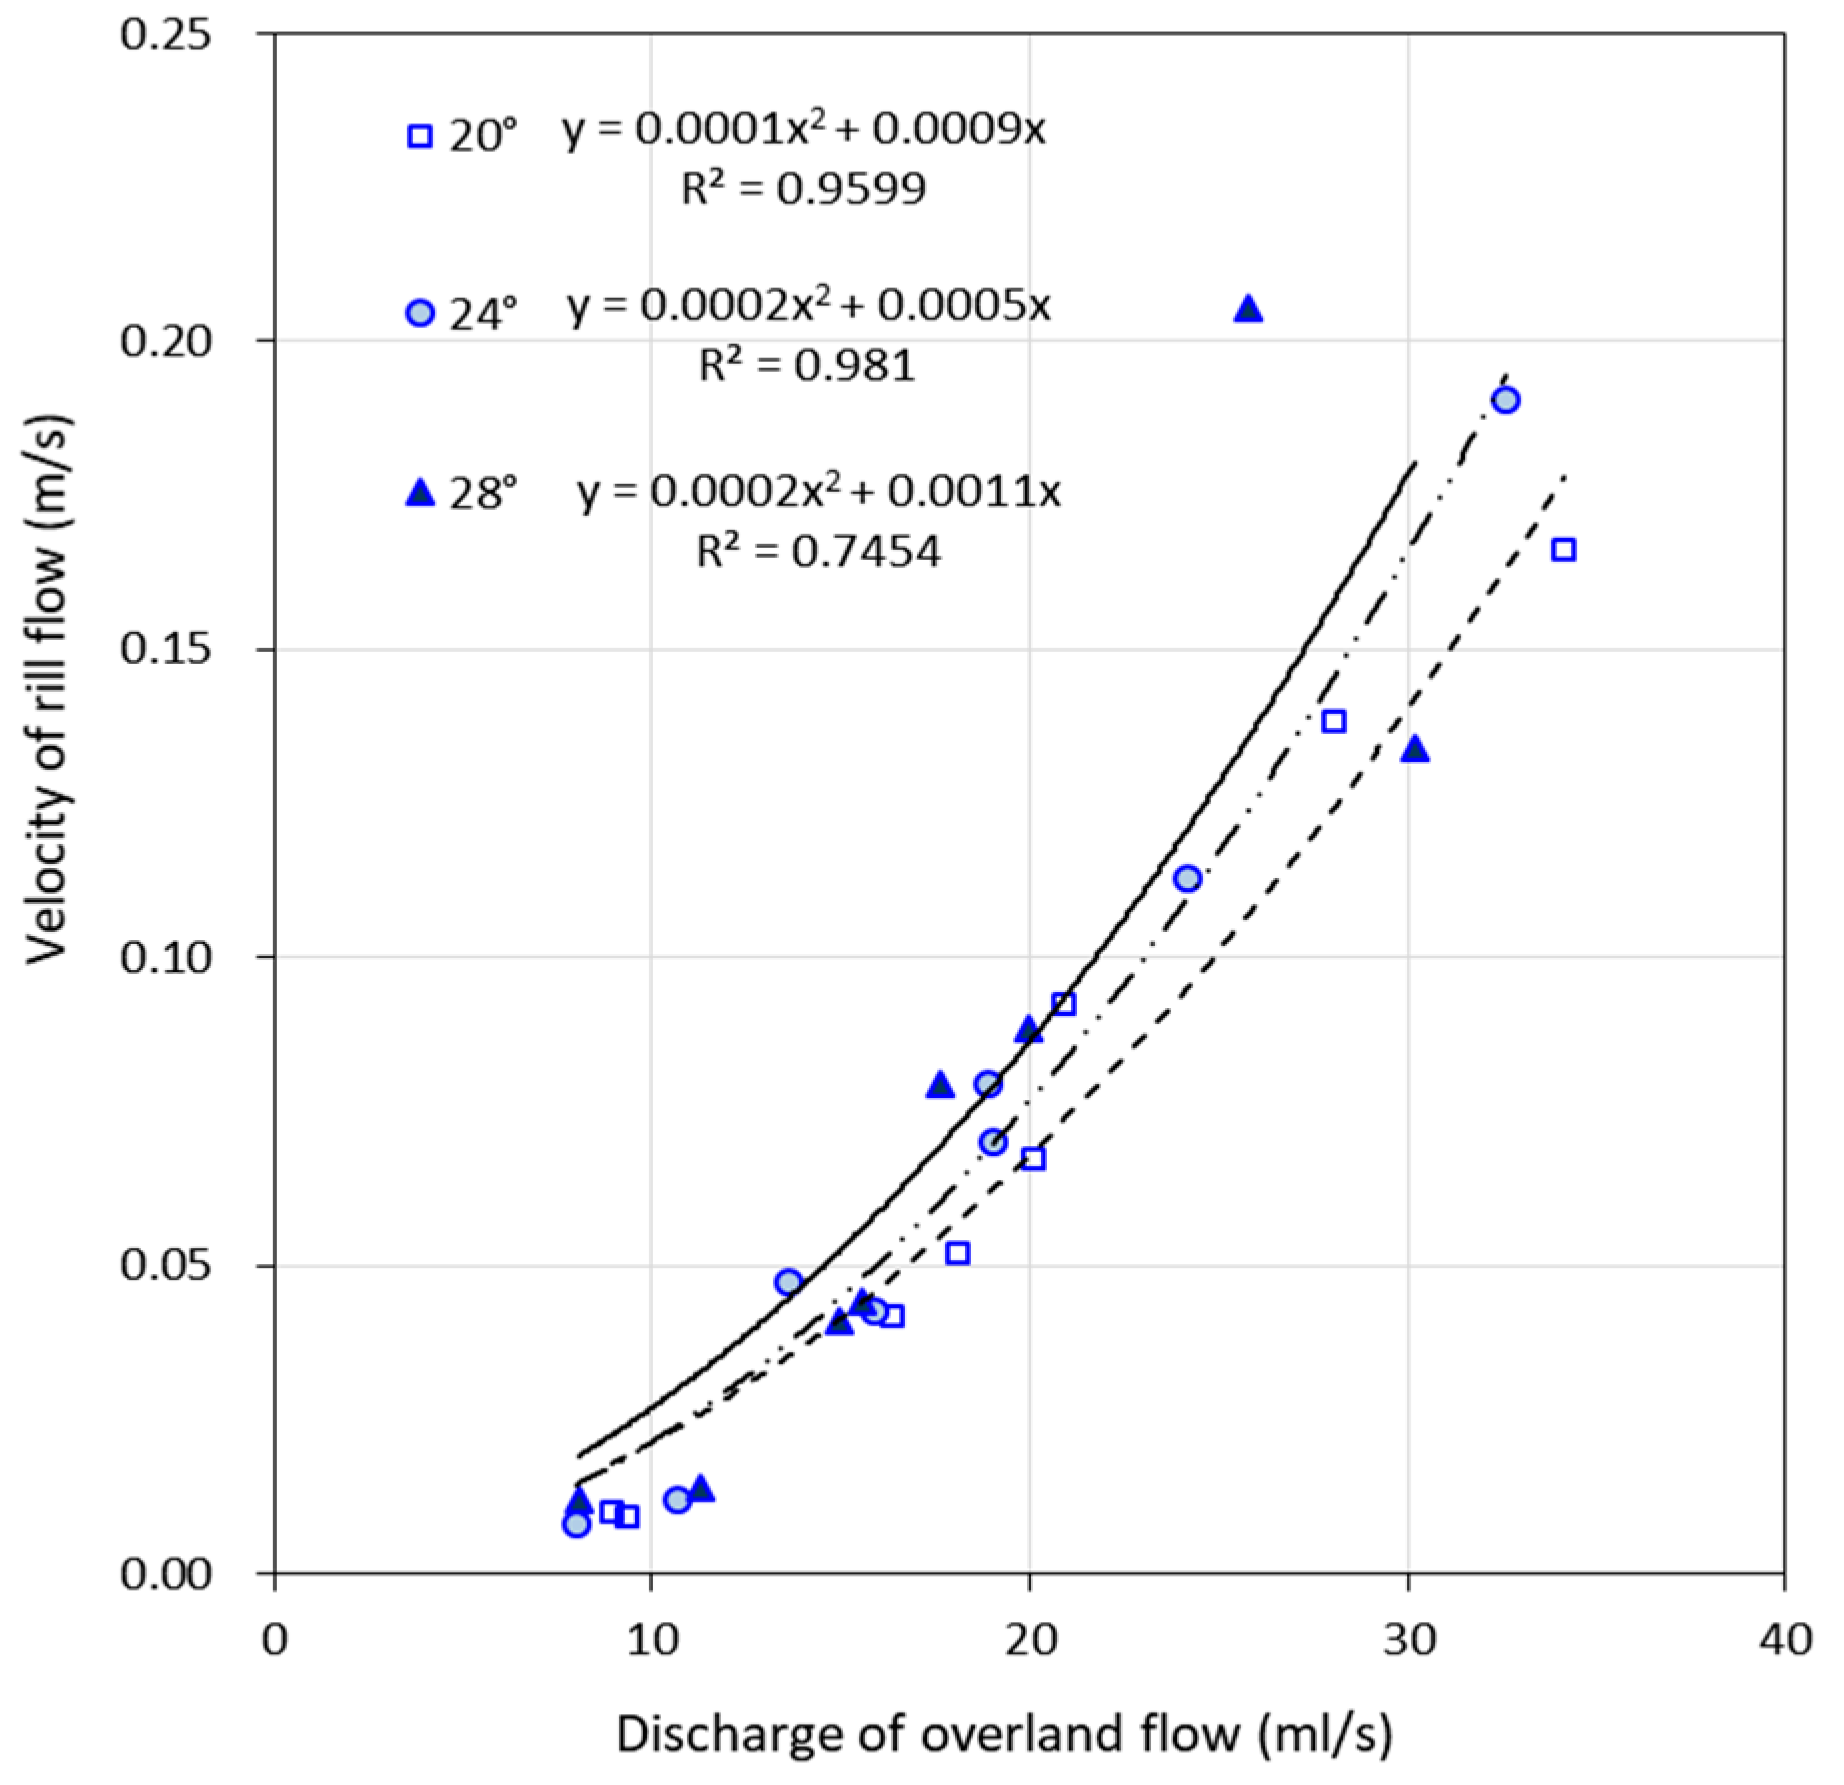
The rates of overland flow increased with an increase of rainfall intensity and inflow rate. Table 2 shows the unit flow rate, runoff coefficient, and mean flow velocity of overland flow according to segment distance. The runoff coefficient of mean 0.73 ± 0.07 generally decreased with an increase of rainfall intensity, inflow rate, and slope steepness because expansion and incision of rills increase the infiltration rate. The study of Shin et al. [16] for micromorphological changes of rill developed by simulated rainfall and inflow on steep slopes with length of 5.5 m also showed the result that the runoff coefficient decreased from 0.73 to 0.61 with an increase of rainfall intensity and inflow rate and slope steepness. The 2.4 m segments including headcut incision mostly showed the least runoff coefficient under each experimental condition. As the overland flow infiltrates easily into the sidewall and headcut of rill incision in 2.4 segments, the runoff coefficient consequently decreased. The result is presented in the study of Slattery and Bryan’s [32] study, which found that rill incision reduces runoff rate due to increased infiltration of the rill channel, but increases sediment yield. The mean velocity of overland flow greatly depended on inflow rate rather than the rainfall intensity and was influenced dominantly by the overland flow rate. The mean velocity of overland was the range of 0.006 to 0.116 m/s. Figure 3 shows the relationship between maximum velocity and discharge of overland flow. The maximum velocity of overland was the range of 0.010 to 0.205 m/s. The relationship as shown in Figure 3 exhibits a quadratic polynomial function under the general truth that if there is no flow discharge, then the flow velocity is zero. It is compared to the exponential functions from Govers [52], Abrahams et al. [33], and Nearing et al. [38] who presented the relationship between discharge and velocity of overland flow in different slopes and soil conditions. The velocity of rill flow responded more to inflow discharge rather than rainfall intensity on steep slope. The flow velocity increased generally with slope steepness (See Figure 3). Abrahams et al. [33] and Nearing et al. [38] stated that flow velocity is influenced by slope, bed roughness, and soil resistance to erosion as well as discharge.
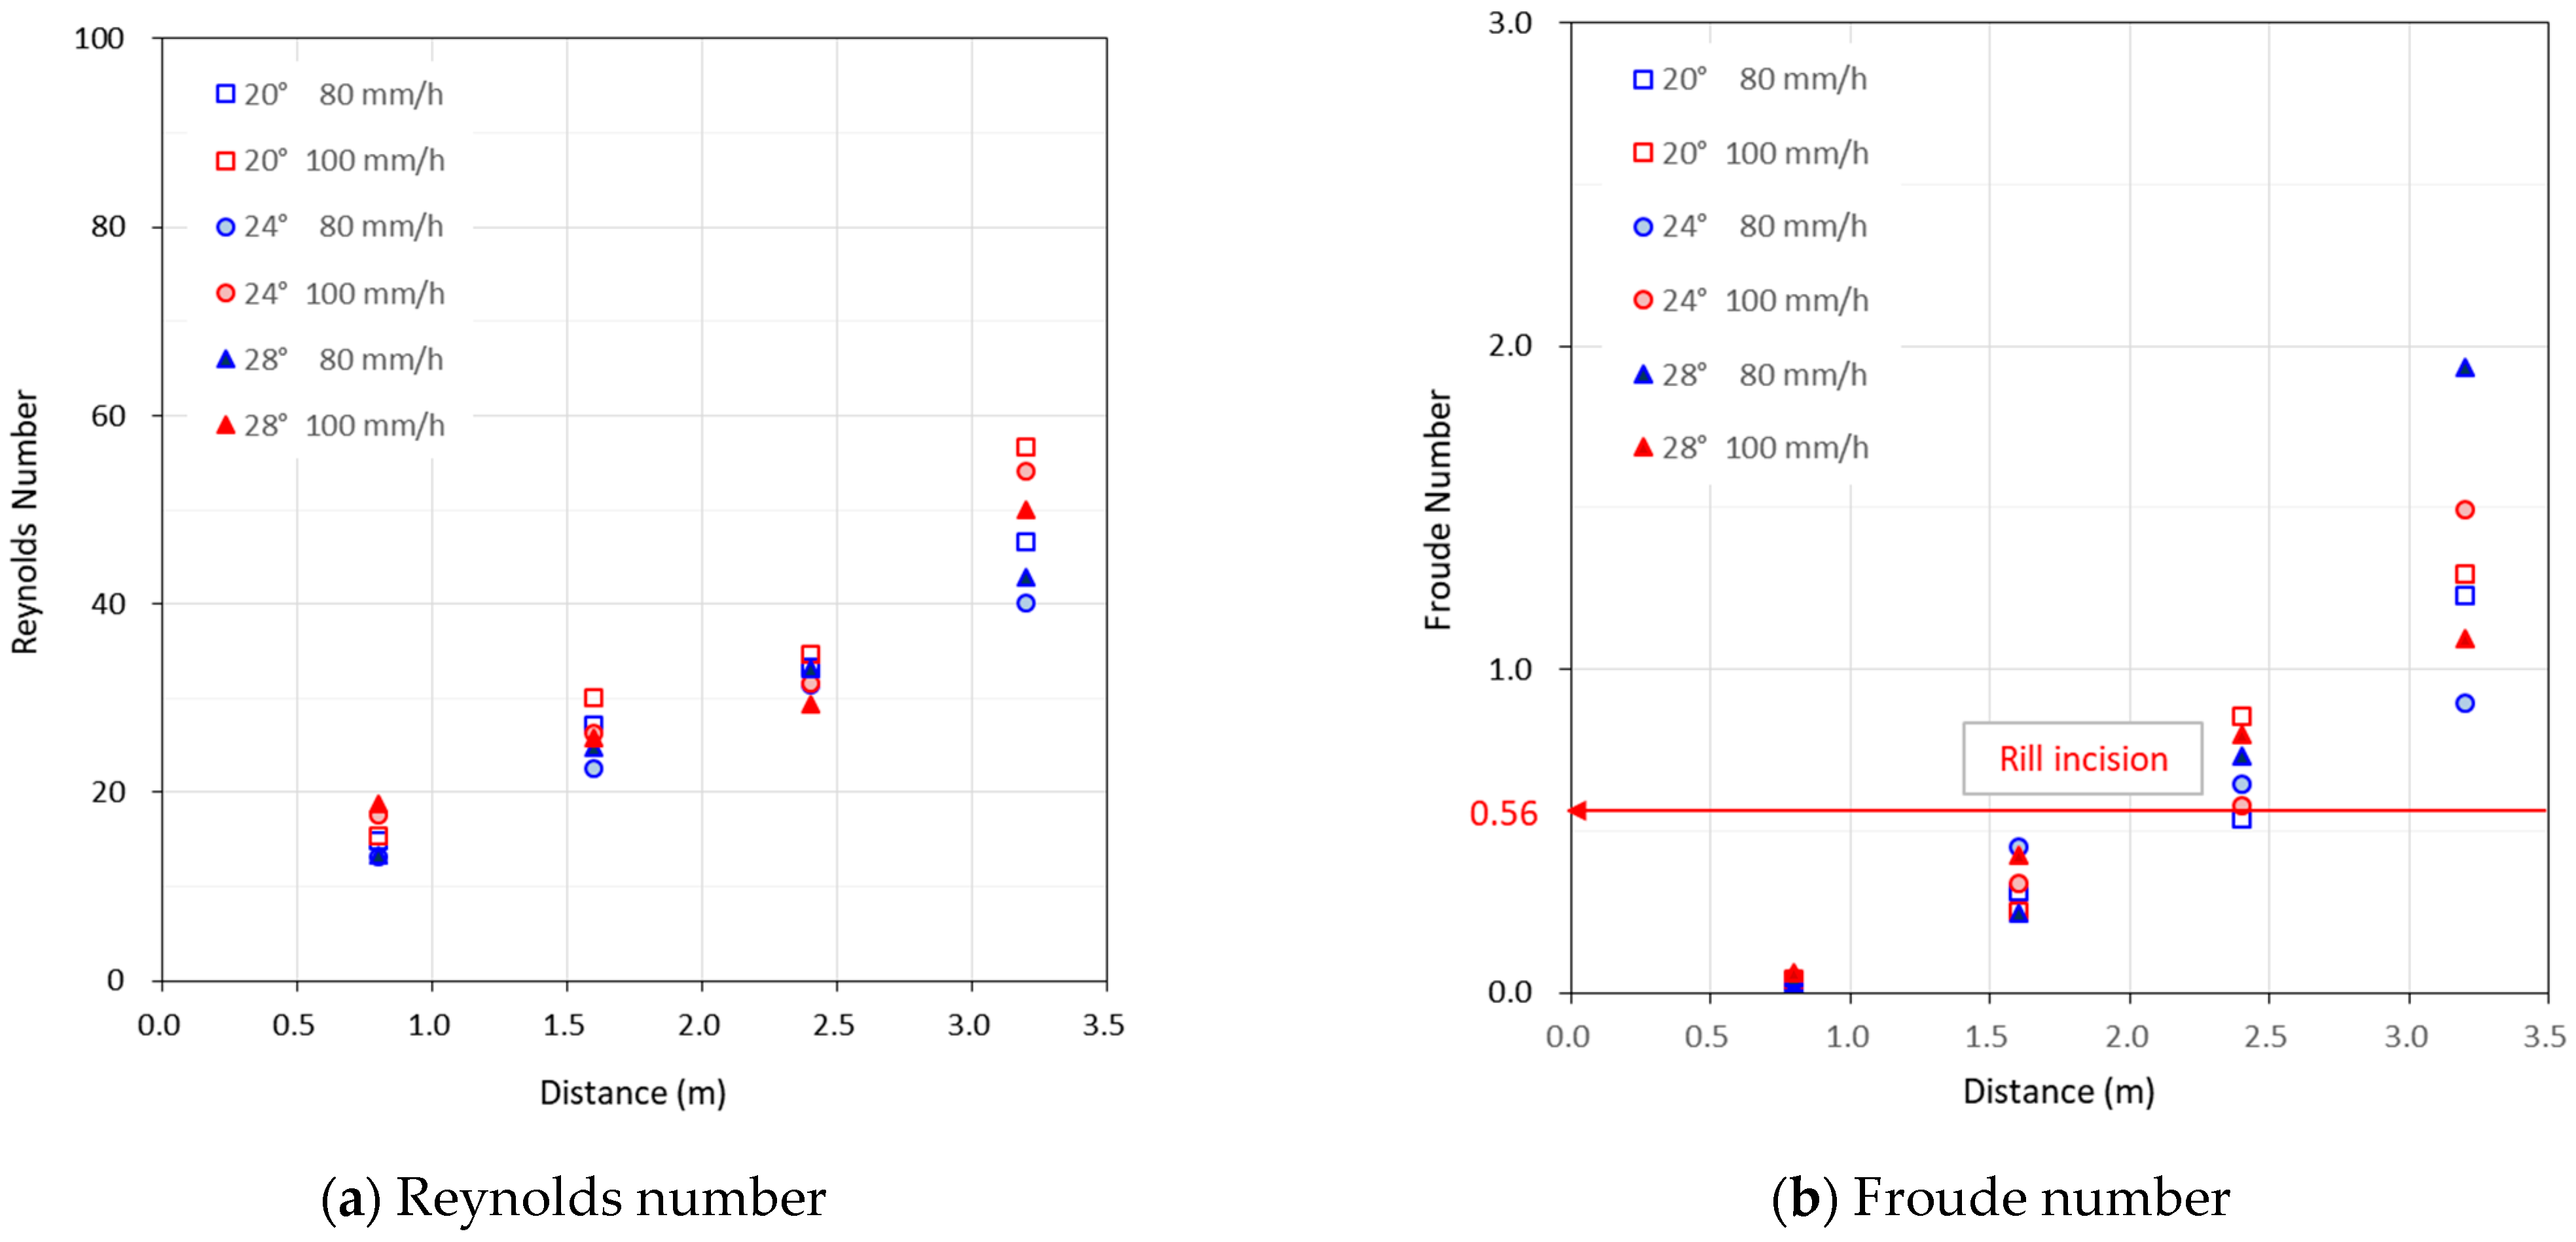
Re and Fr were calculated by mean velocities of overland flow. Re for overland flow increased with distance. The increase of Re slowed down at 2.4 m distances, where the headcut of rills was incised by concentrated flow (Figure 4a). It seems that flow velocity decreased due to the loss of surface runoff in the rill incision. The range of Re of overland flow clearly corresponds to laminar flow, but the actual flow was disturbed by the impact of raindrops. Fr showed mostly subcritical flow within a 2.4 m distance, and critical flow and supercritical flow at a 3.2 m distance (Figure 4b). When Fr for the mean velocity of overland flow was more than 0.56, rill incision appeared in all segments. This is a slightly larger value than Fr = 0.45–0.5 [61] that was shown for sandy soils on gentle slopes. When the maximum flow velocity of concentrated flow is used, Fr of the rill incision was more than 0.8. This is the same result with the previous studies for the flow process of rill incision as the Froude number (Fr) changes from subcritical flow to supercritical flow [27,32,61].
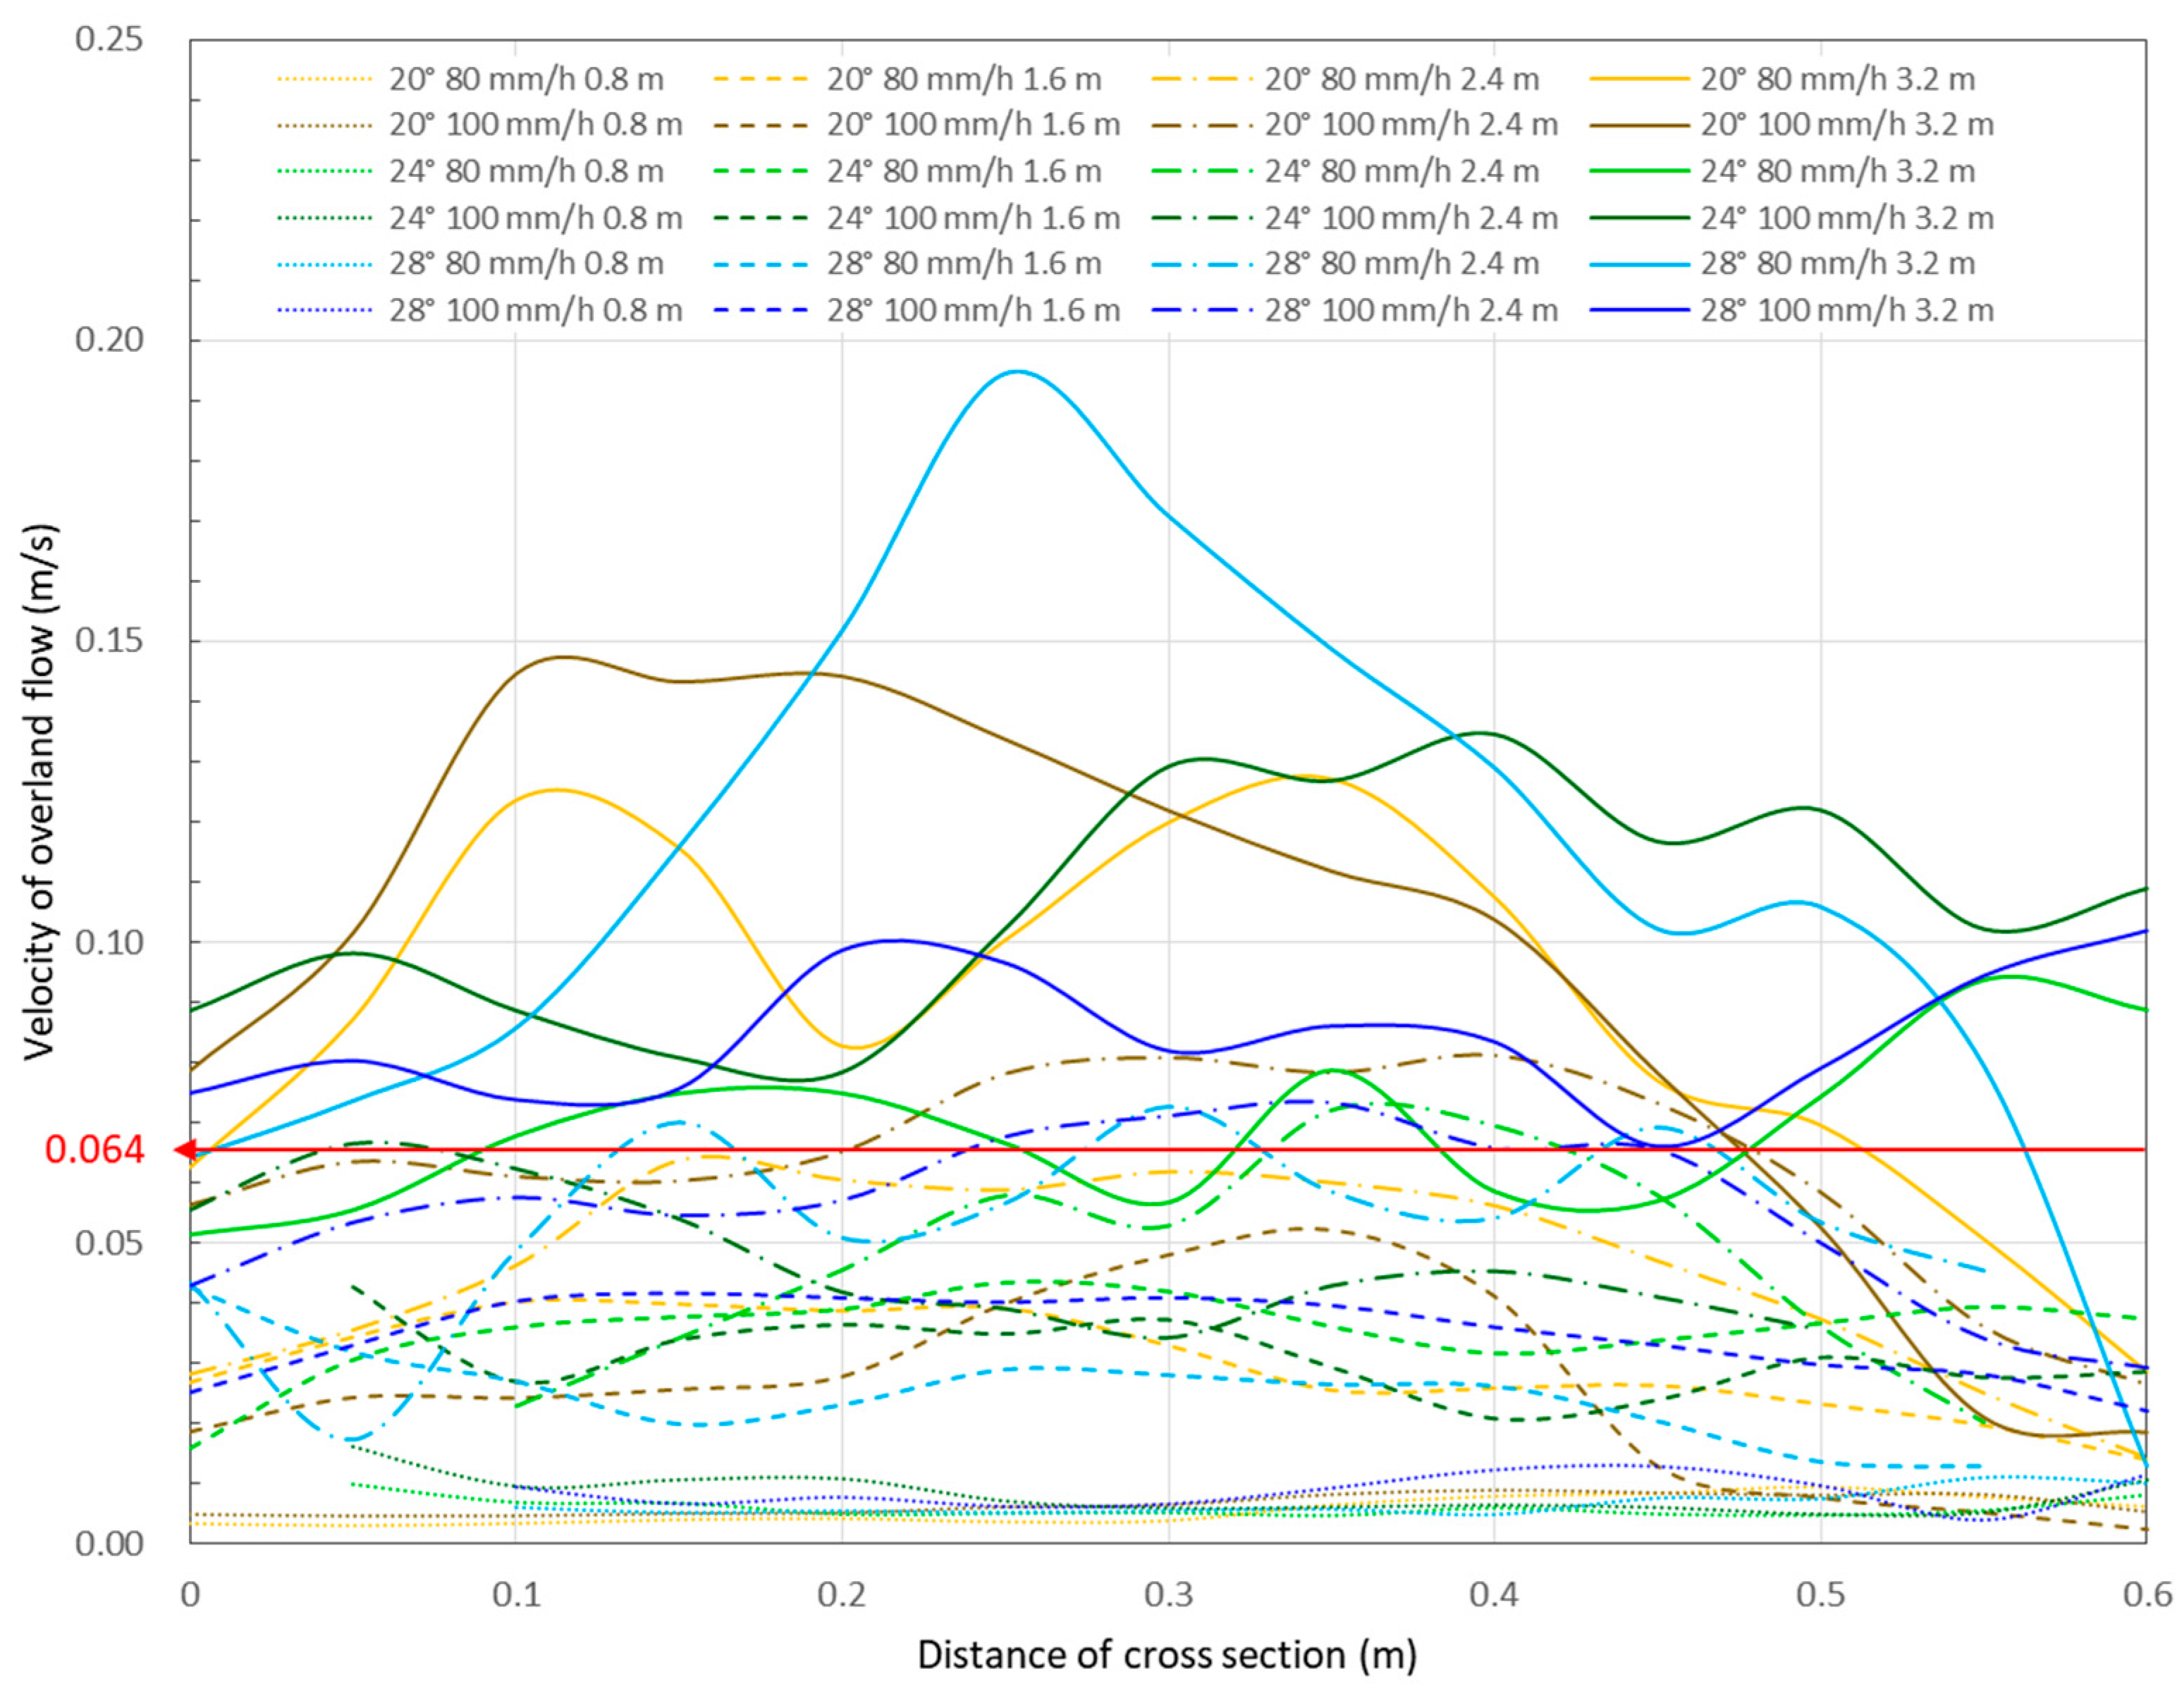
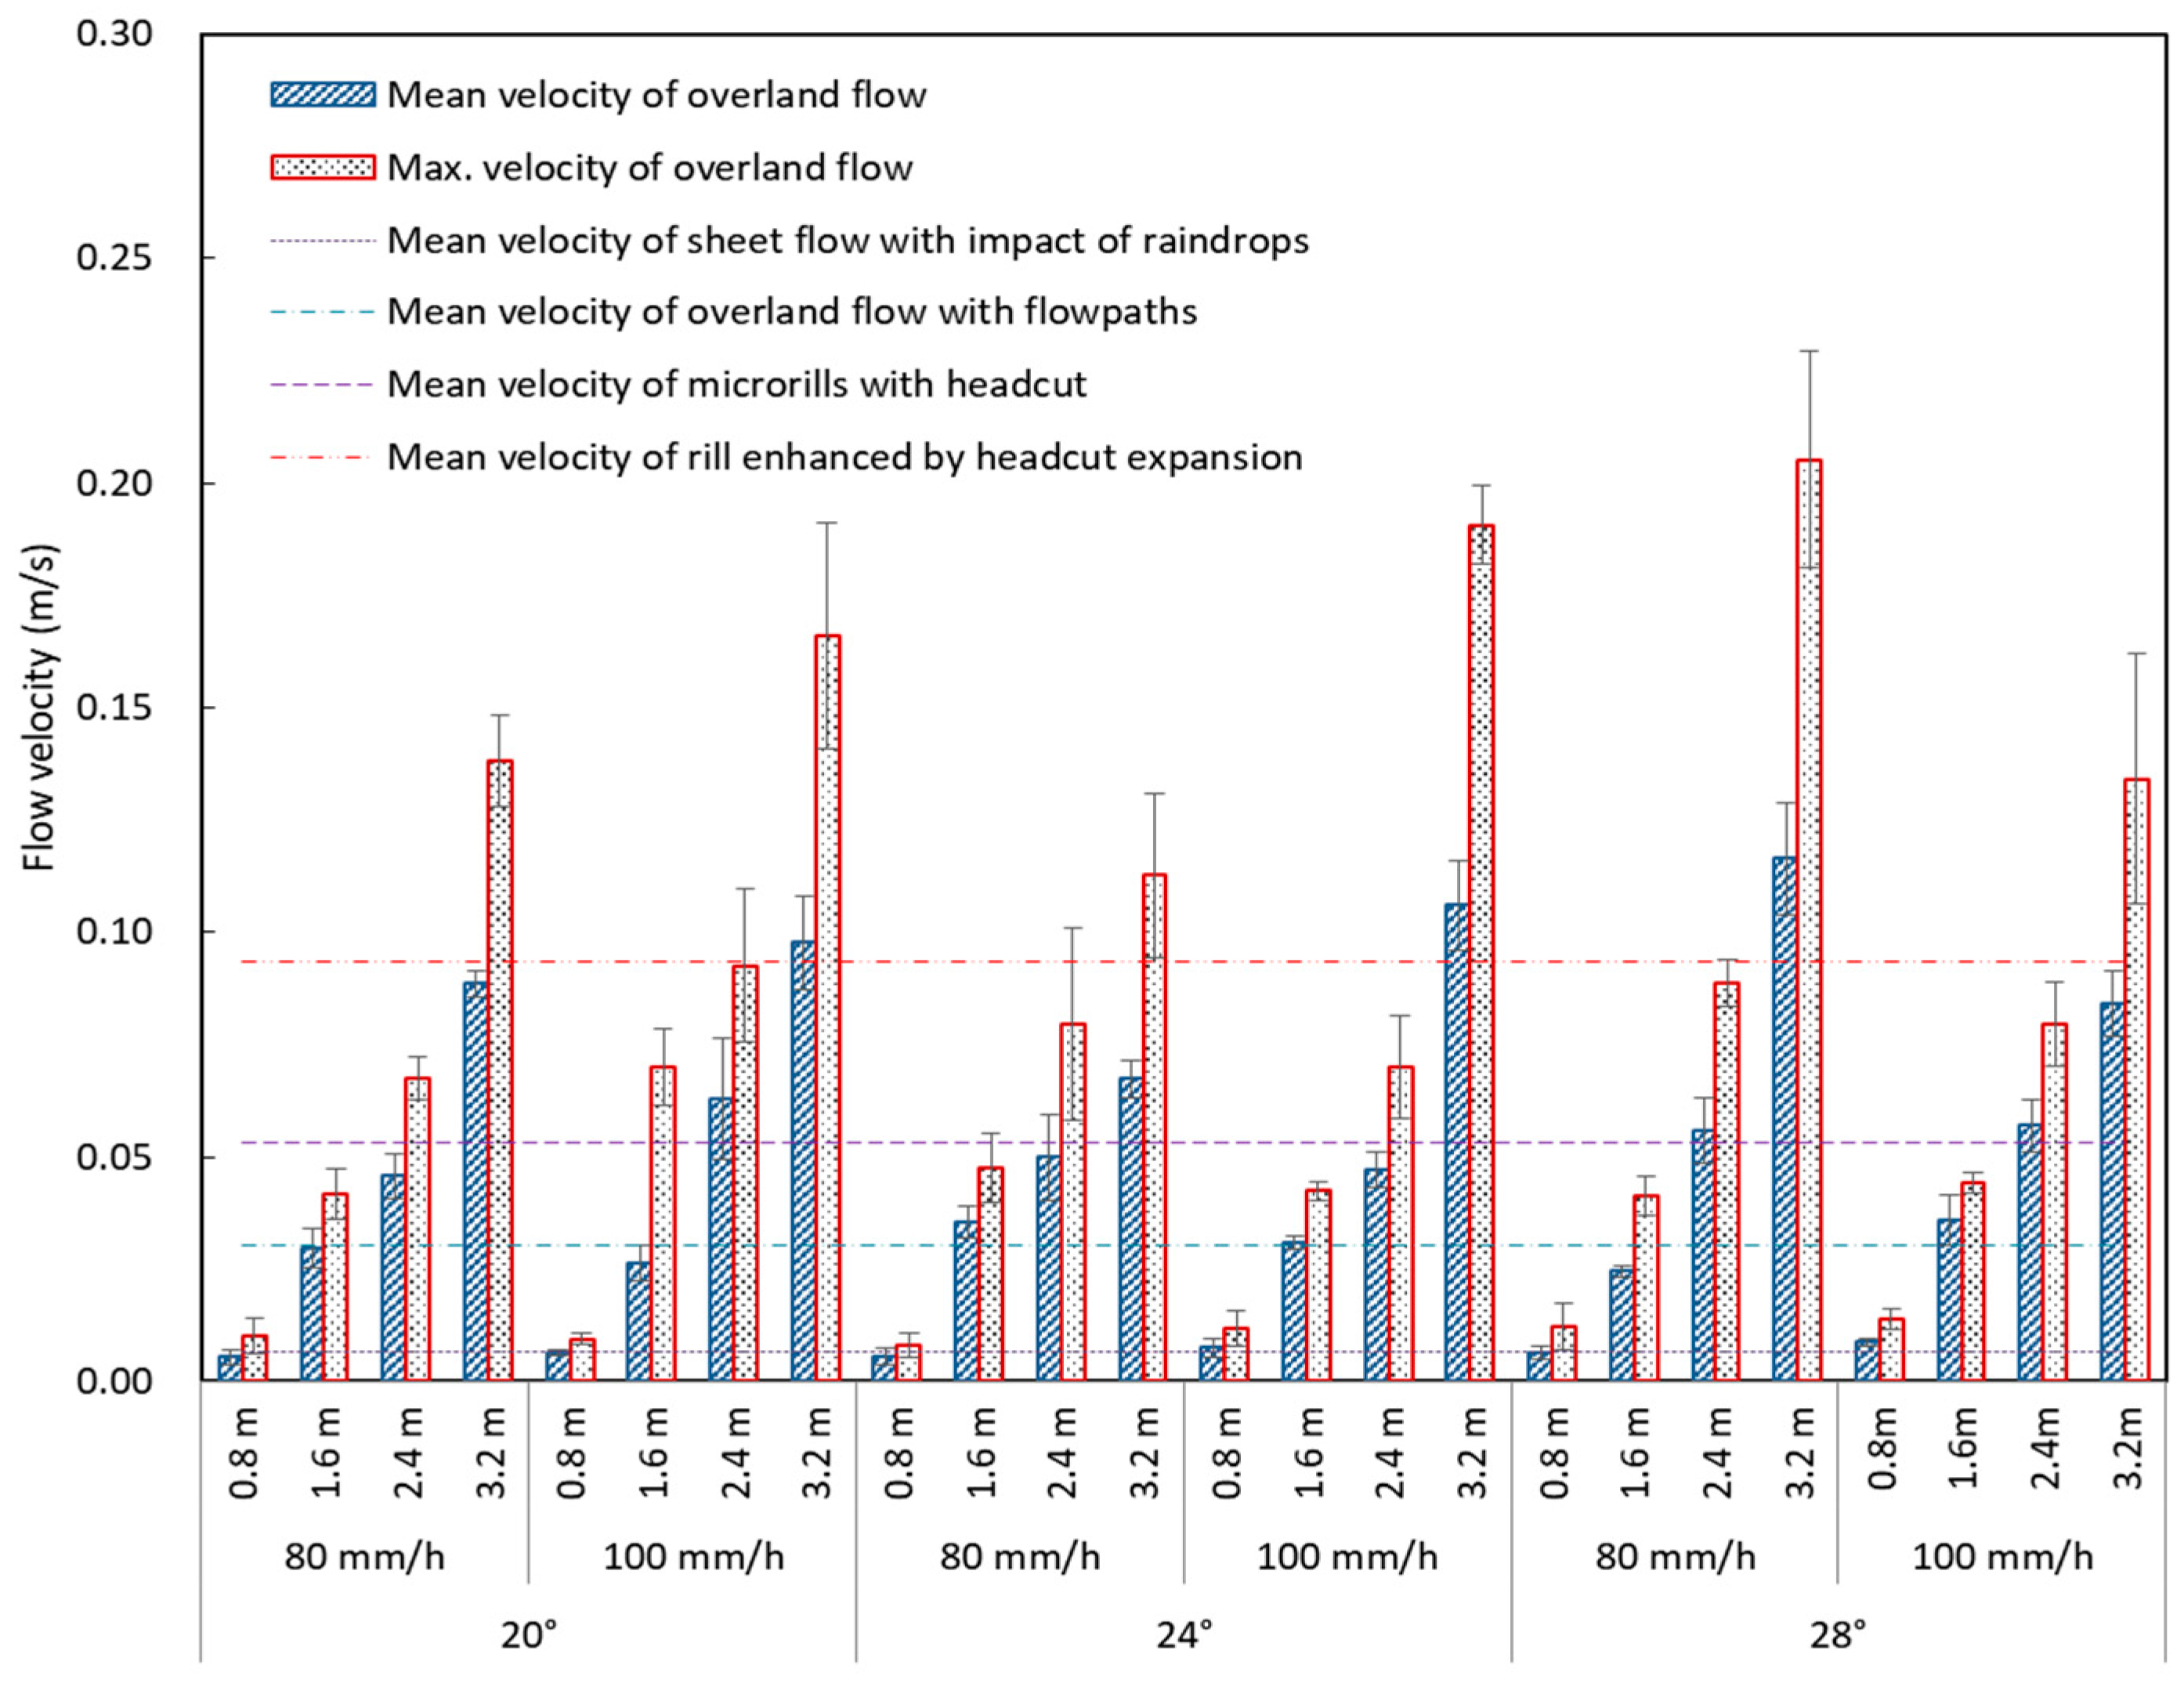
The accurate flow velocity is required to evaluate hydraulic factors such as the Reynolds number (Re) and Froude number (Fr). The velocity of the overland flow by a dye-tracing method was obtained from the analysis of images of a dye trace. Figure 5 shows the velocity distribution of overland flow according to the distance of the cross section of 0.6 m. The velocities of overland flow on the 0.8 m segments with impacting raindrops without inflow water did not exceed 0.02 m/s. They on the 1.6 m segments with impacting raindrops and inflow water were mostly smaller than 0.05 m/s. The maximum velocity of overland flow was 0.064 m/s on 2.4 m segment with slope of 20° and rainfall intensity of 80 mm/h that the headcut incision of rill was unclear. All maximum velocity of other segments with microrills exceeded 0.065 m/s, which is the critical velocity for rill incision in this study. The relationship between maximum velocity and mean velocity of overland flow showed a quadratic polynomial function (). Using this formula, the mean velocity of overland flow to incise rill was estimated about 0.044 m/s. The maximum velocity (0.195 m/s) of rill appeared on the 3.6 m segment with a slope of 28° while rainfall intensity of 80 mm/h and inflow of 23ml/s form the biggest width and depth due to sidewall collapse and bed incision of the rill. Figure 6 shows the distribution of mean velocities of overland flow according to slope steepness, rainfall intensity, and segment distance. The mean velocity of sheet flow with raindrops impact was 0.0067 m/s on 0.8 m segments and that of overland flow with flowpaths was 0.031 m/s on 1.6 m segments. The mean velocity of microrills with headcut incision was 0.053 m/s on 2.4 m segments and that of rills enhanced by headcut expansion was 0.093 m/s on 3.2 m segments.
3.3. Hydrodynamic for Rill Incipience
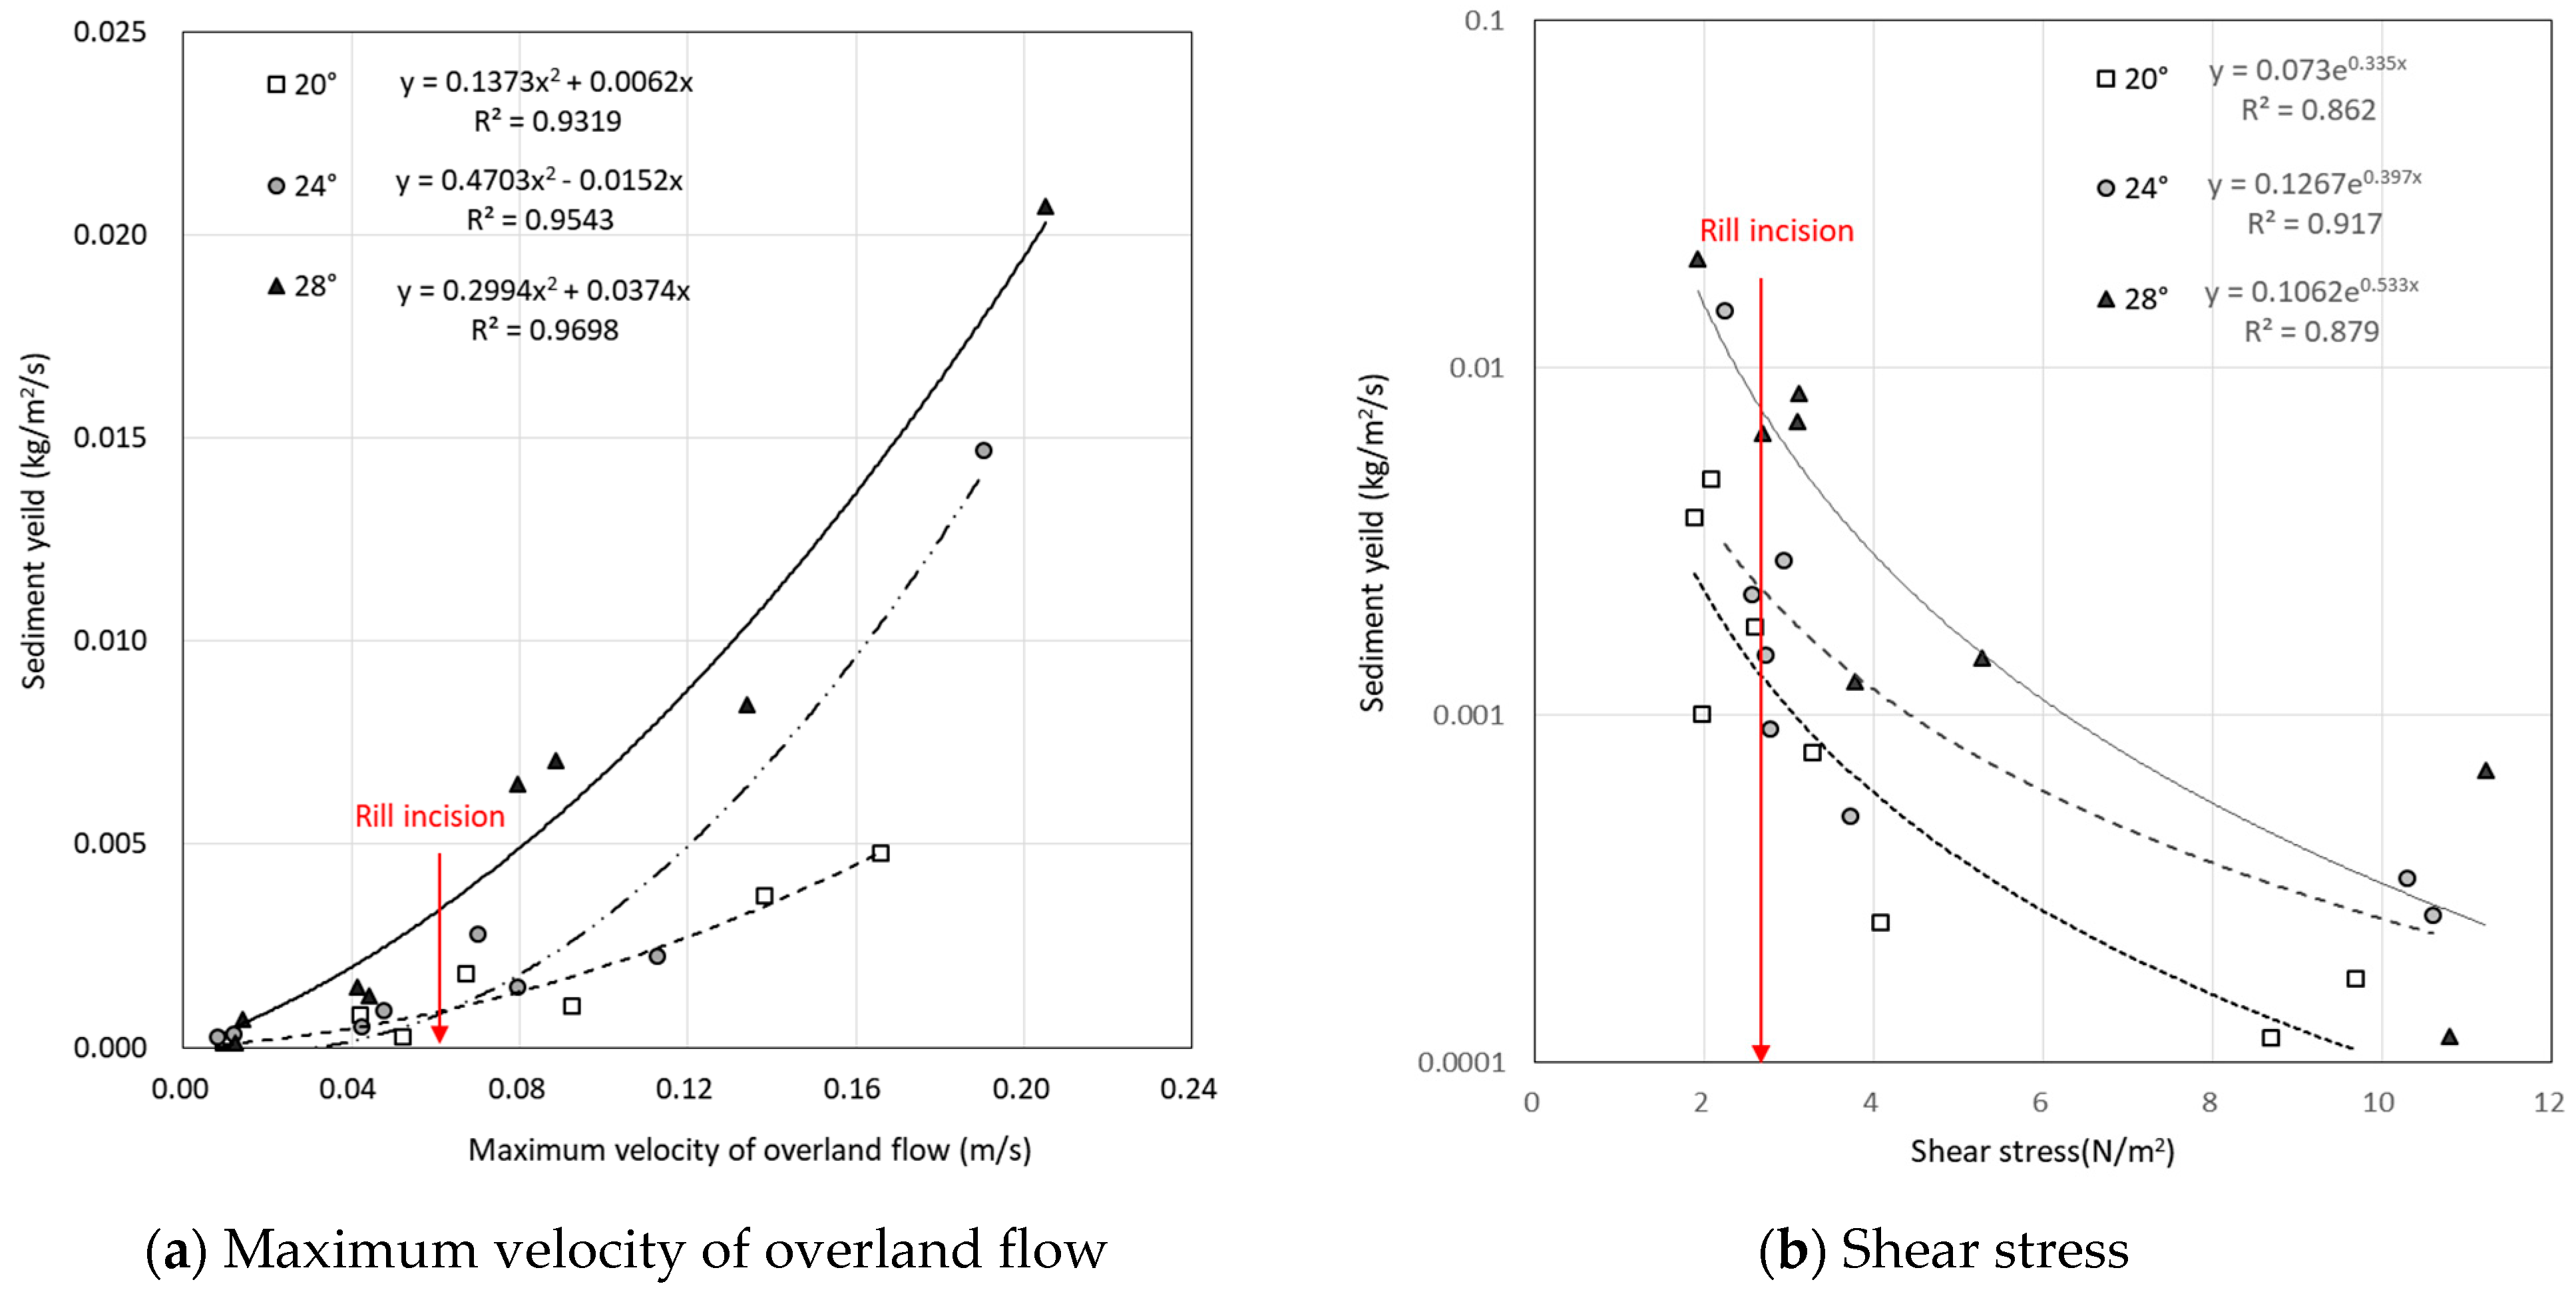
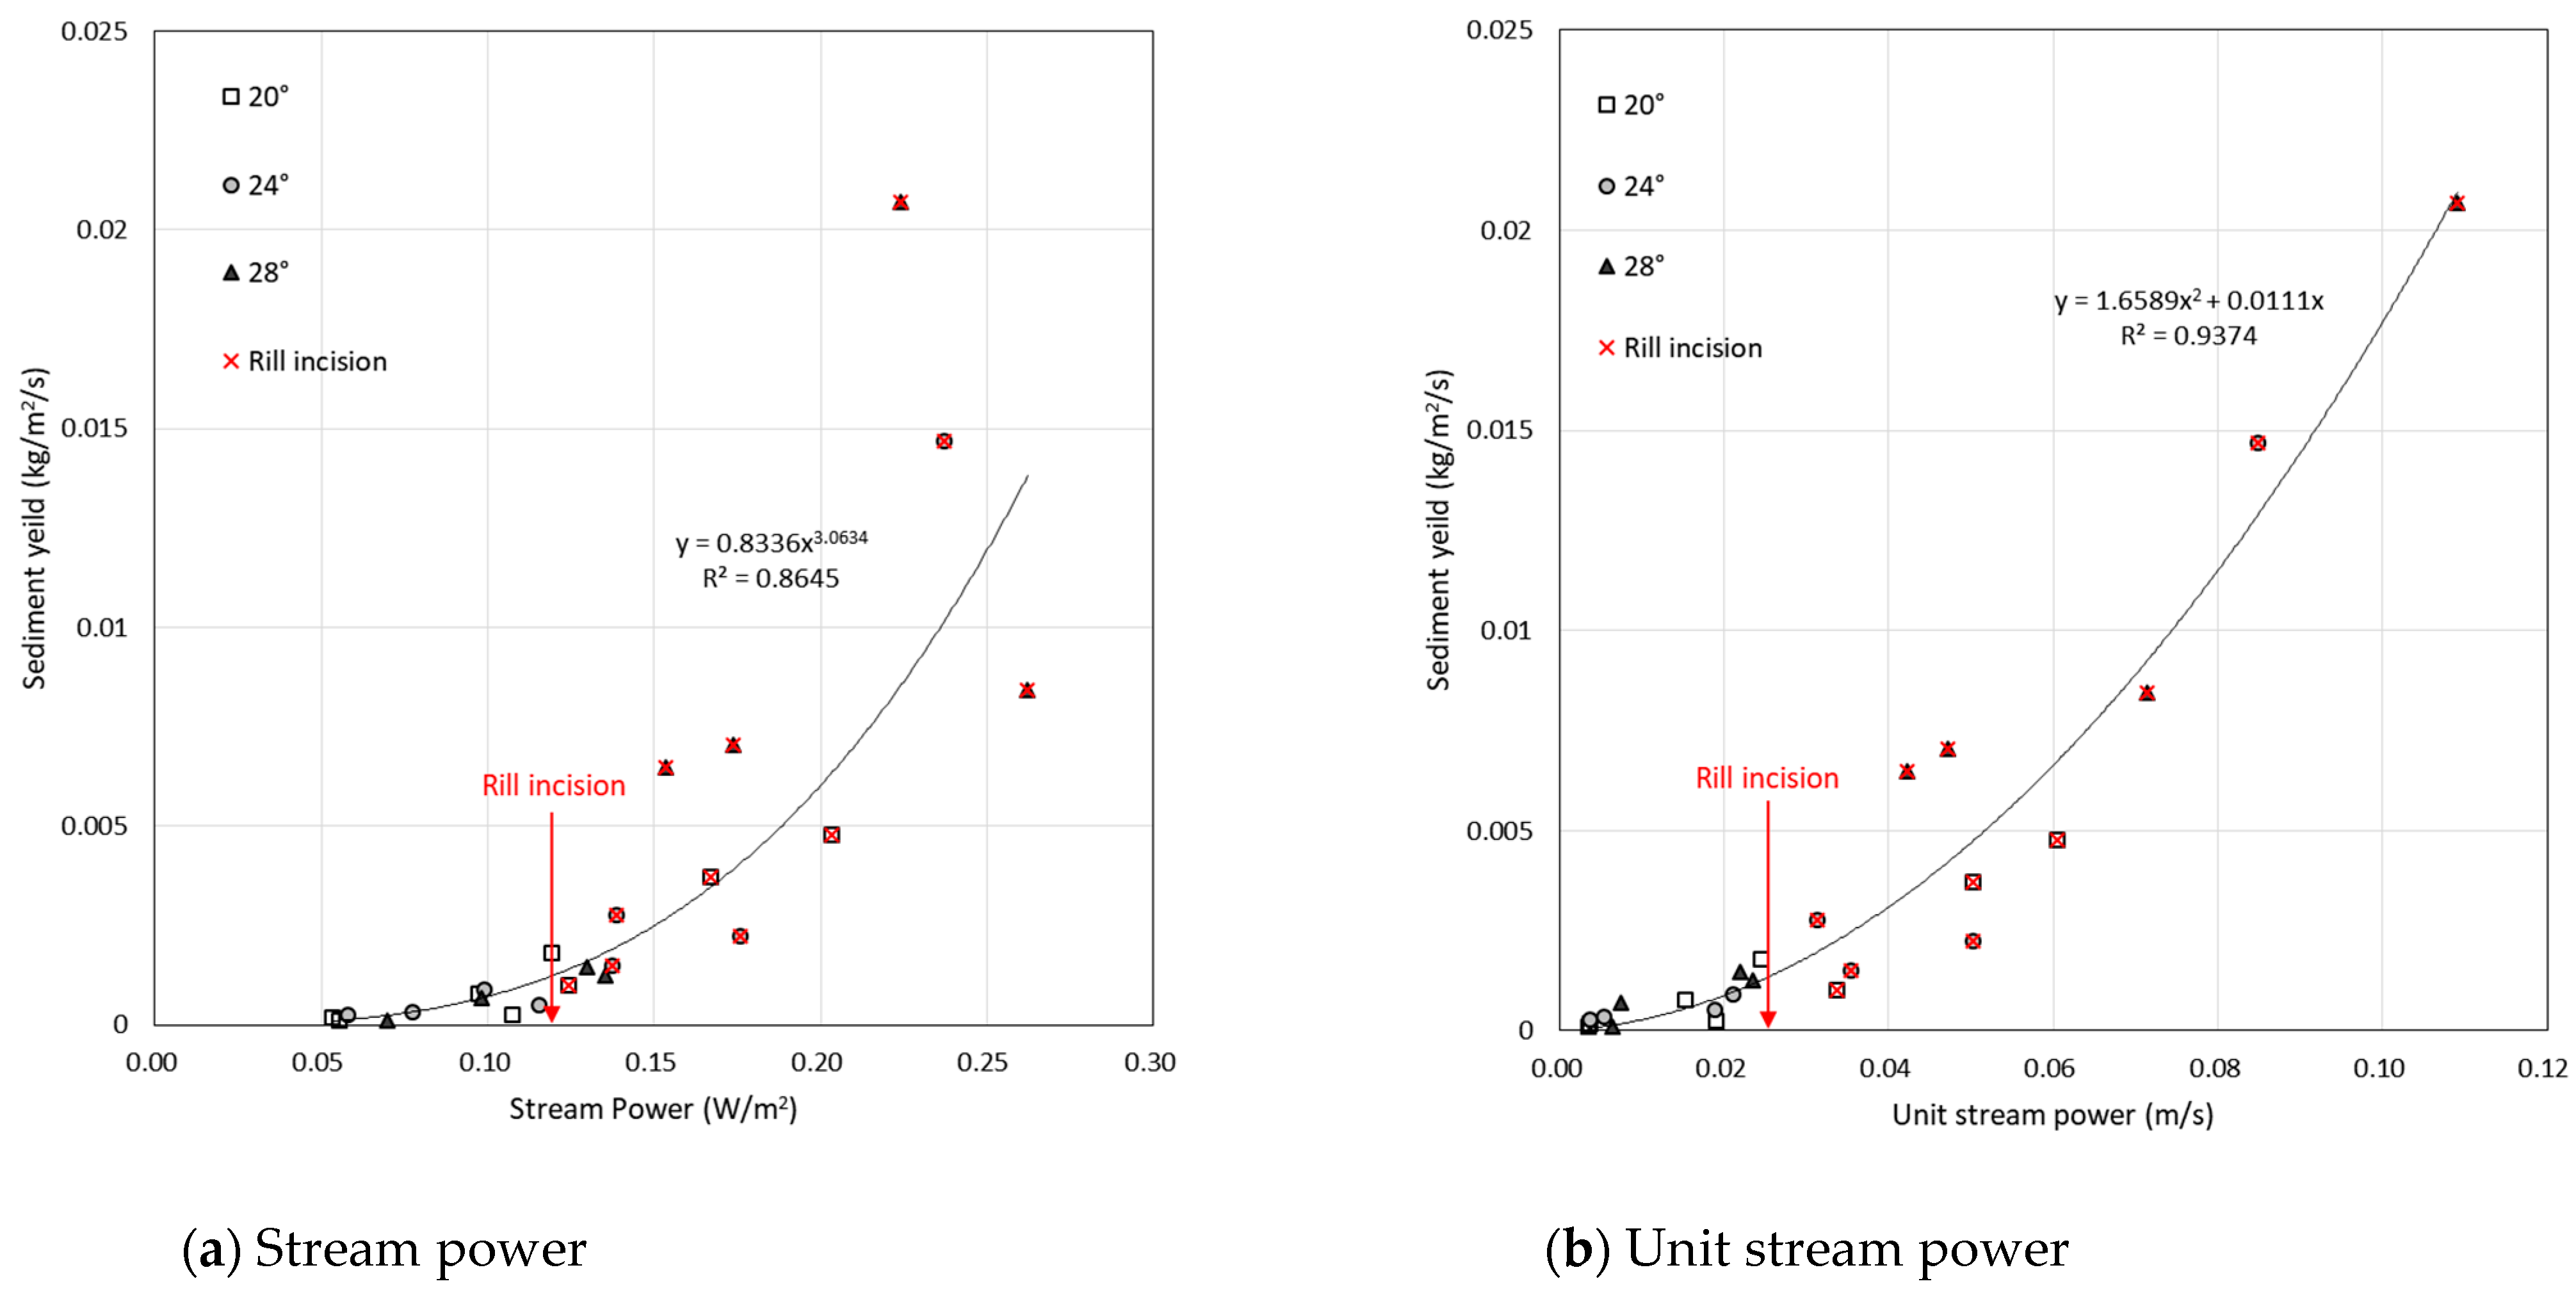
The rill erosion that increases with slope steepness is greatly influenced by the hydraulic properties of the concentrated flow in the rill evolution process. Figure 7a shows the relationship between sediment yield and the maximum velocity of overland flow. The steeper the slope, the greater potential energy of the soil mass and surface runoff, so sediment yield generally increased. However, this is a general trend and not an absolute phenomenon. In all experiments, the conditions such as raindrop-size distribution, inflow supply, soil-size distribution, surface roughness, and microtopography are not uniform and homogenous, so the rill develops disorderly by random incision and expansion. Therefore, headcut incision, bed erosion, and sidewall collapse of the rill developed by the complex interaction of extreme rainfall and concentrated flow can cause continuously uncertain microtopographic changes [16]. Shear stress, stream power [63], and unit stream power [64] were considered as hydrodynamic characteristics of the disordered rill. Yao et al. [40] stated that the critical shear stress was lower for the steeper slopes and was in the range of 1.411–1.755 Pa for a slope of 20°–24°. In this study, the critical shear stress showed a similar trend according to the slope, and also showed the average value of 2.67 ± 0.39 Pa in 2.4 m segments. However, the inverse relationship between shear stress and sediment yield is not reasonable, as shown in Figure 7b. As rills are incised, the mean velocity by maximum velocity of overland flow increases, but mean depth decreases. As the overland flow is concentrated with the incised rill, the water depth increases in the narrow width of the rill, and the local shear stress increases in the rill. However, the shear stress using mean water depth decreases with an increase of overland flow. Since the location and size of the randomly formed rill cannot be known, it is difficult to measure the water depth with the width of an evolving rill, and it is extremely difficult to separately measure discharges from interill flow and rill flow. The critical shear stress presented in this study requires additional investigation into additional physical processes. Torri et al. [61] presented rill formation criteria that the rill forms when the ratio of shear strength of the soil for shear stress exerted by the flow is bigger than 0.0001–0.0005 in a gentle slope (<17°). In this study, the ratio showed the range of 0.00006–0.00011 in rill incision. Figure 8a,b show the relationships between sediment yield and stream power and unit stream power indicating rill incision. The relationship between sediment yield and stream power showed the power function as in Figure 8a. The relationship between sediment yield and stream power showed the quadratic polynomial function as in Figure 8b. It was found that unit stream power with a high correlation coefficient is better than stream power to estimate sediment yield from rill erosion. Critical stream power and critical unit stream power were estimated to be 0.12 W/m2 and 0.024 m/s, respectively. Care should be taken in estimating stream power for overland flow when rill occurs. The mean velocity for sheet flow is useful for estimating mean flow depth, but as the rill evolves, overland flow is concentrated into the low micromorphology formed by rill incision, where the flow depth is greater than the mean depth of the sheet flow. However, even with the development of the rill, the stream power using the mean flow depth is underestimated than the actual value in rill flow. According to the correlation analysis as listed in Table 3, sediment yields from rill and interrill erosion depended on erosivity factors such as inflow discharge and supply water discharge, which is the sum of rainfall and inflow. It appears that a higher correlation coefficient with hydraulic parameters is observed rather than hydrological parameters, and especially the highest with unit stream power, which is the hydrodynamic parameter. Therefore, it should be reasonable to evaluate rill erosion by estimating the unit stream power using the maximum velocity of overland.
The early study of threshold conditions for incipient rilling was presented by Torri et al. [61]. The critical shear stress, which was in the range of 0.45 to 0.50 Pa, was obtained under the condition for rills in a gentle slope (<17°) with sandy loam to clay soils. Govers [31] evaluated stream power as well as critical shear stress, but also presented results for gentle slope (<12°) and presented that the shear velocity value of 0.03 m/s is a valuable threshold for rill initiation [66]. They provided that soil mechanical resistance is not too important in rill initiation. In the steep slope, Yao et al. [40] showed critical velocity and critical shear stress as the critical condition for the rill threshold, but soil was not sandy soil. Shen et al. [48] and Jiang et al. [43] presented hydrodynamic values for rill development in the steep slope, but they were not critical conditions. Recently, the critical velocity of the rill incipience of a steep slope was presented by Zhuang et al. [53]. Table 4 summarizes the results of the above studies involving similar slopes, soils, or analyses. The critical velocity and unit stream power for rill incision of the sandy soil used in this study were larger than those by Gover [31] and Yao et al. [40] and smaller than those by Tian et al. [41] and Zhuang et al. [53]. The critical shear stress for sandy soil in this study was larger than those of Torri et al. [61], Govers [31] and Yao et al. [40]. The critical velocity and unit stream power for rill incision were reasonable, especially compared to the study results of Tian et al. [42] and Zhuang et al. [53] conducted under similar experimental conditions of soil texture, slope steepness, and supply water. The results mean that the critical conditions for rill incipience of sandy soil in a steep slope generally were larger than that in silt loam or a gentle slope.
4. Conclusions
In this study, the experiments of rill erosion by the simulated rainfall and inflow were performed to better understand the hydraulic characteristic and hydrodynamic mechanism of rill incipience on steep slopes with sandy soil. A total of 24 experiments were conducted with respect to different slopes of 20, 24, and 28°, rainfall intensity of 80 and 100 mm/h, and segment distance by increasing inflow rates. The rill evolution showed different formations and sizes under the conditions of slope steepness, the segment location, and rainfall intensity. Rills with heatcut were mostly incised on the 2.4 m segments and progressively moved upslope on the 3.2 m segments. The steps of rill evolution according to the location of the segments were identified as follows: (1) sheet flow with impact of raindrops, (2) overland flow with flowpaths, (3) microrill with headcut incision, and (4) rill enhanced by headcut expansion. A runoff coefficient of mean 0.73 ± 0.07 decreases generally with an increase of rainfall intensity and inflow rate. As inflow and rainfall increase the rate of overland flow, the rill incised by concentrated flow increases the infiltration rate into headcuts, sidewall, and bed of rill. The relationship between maximum velocity and discharge of overland flow exhibits a polynomial function, which is different from the existing exponential function. The Reynolds number (Re) and Froude number (Fr) using a mean velocity of overland flow were influenced by rill incision. Incision and headcut of the rill appeared when the Froude number (Fr) using maximum velocity of rill flow changed from a subcritical flow to supercritical flow. The critical velocity, shear stress, stream power, and unit stream power of rill incision were 0.065 m/s, 2.67 Pa, 0.12 N/m/s, and 0.024 m/s, respectively. The inverse relationship between shear stress and sediment yield was not reasonable. The critical shear stress and stream power using mean water depth of overland flow before and after rill incision required additional investigation into physical processes. The critical velocity and unit stream power for rill incision showed reasonable results compared to previous studies. The unit stream power calculated by the maximum velocity of overland flow showed the highest correlation coefficient with sediment yield from rill incision and expansion. In this study, it was found that unit stream power is useful as a hydrodynamic parameter to estimate sediment yield by rill erosion.
Author Contributions
Conceptualization, S.S.S. and S.D.P.; methodology, S.S.S.; formal analysis, S.S.S. and Y.J.S.; investigation, Y.J.S.; writing—original draft preparation, S.S.S. and Y.J.S.; writing—review and editing, S.S.S., S.D.P. and J.H.R.; visualization, S.S.S. and J.H.R.; project administration, S.S.S. and S.D.P.; funding acquisition, S.S.S. and S.D.P. All authors have read and agreed to the published version of the manuscript.
Funding
This research was supported from National Research Foundation of Korea (NRF) grant funded by the Ministry of Science and ICT (No. 2019R1A2C1009285) and the Ministry of Education (No. 2021R1A6A1A03044326).
Institutional Review Board Statement
Not applicable.
Informed Consent Statement
Not applicable.
Data Availability Statement
The data presented in this study are available upon request from the corresponding author.
Conflicts of Interest
The authors declare no conflict of interest.
References
- Korean Statistical Information Service (KOSIS). Slope Distribution by Location, National Forest Inventory; Korean Statistical Information Service: Daejeon, South Korea, 2010. [Google Scholar]
- Miura, S.; Yoshinaga, S.; Yamada, T. Protective effect of floor cover against soil erosion on steep slopes forested with chamaecyparis obtusa (hinoki) and other species. J. For. Res. 2003, 8, 27–35. [Google Scholar] [CrossRef]
- Shakesby, R.A.; Doerr, S.H. Wildfire as a hydrological and geomorphological agent. Earth-Sci. Rev. 2006, 74, 269–307. [Google Scholar] [CrossRef]
- Cerdà, A.; Doerr, S.H. The effect of ash and needle cover on surface runoff and erosion in the immediate post-fire period. CATENA 2008, 74, 256–263. [Google Scholar] [CrossRef]
- Ghahramani, A.; Ishikawa, Y.; Gomi, T.; Shiraki, K.; Miyata, S. Effect of ground cover on splash and sheetwash erosion over a steep forested hillslope: A plot-scale study. CATENA 2011, 85, 34–47. [Google Scholar] [CrossRef]
- Nearing, M.A.; Norton, L.D.; Bulgakov, D.A.; Larionov, G.A.; West, L.T.; Dontsova, K.M. Hydraulics and erosion in eroding rills. Water Resour. Res. 1997, 33, 865–876. [Google Scholar] [CrossRef]
- Morgan, R.P.C. Soil Erosion in the United Kingdom: Field Studies in the Silsoe Area 1973–1975; Occasional Paper No. 4; National College of Agricultural Engineering: London, UK, 1977. [Google Scholar]
- Govers, G.; Rauws, G. Transporting capacity of overland flow on plane and irregular beds. Earth Surf. Proc. Landf. 1986, 11, 515–524. [Google Scholar] [CrossRef]
- Zheng, F.L.; Tang, K.L. Rill erosion process on steep slope land of the Loess Plateau. Int. J. Sediment Res. 1997, 12, 52–59. [Google Scholar]
- Bewket, W.; Sterk, G. Assessment of soil erosion in cultivated fields using a survey methodology for rills in the Chemoga watershed, Ethiopia. Agric. Ecosyst. Environ. 2003, 97, 81–93. [Google Scholar] [CrossRef]
- Zheng, F.; He, X.; Gao, X.; Zhang, C.; Tang, K. Effects of erosion patterns on nutrient loss following deforestation on the Loess Plateau of China. Agric. Ecosyst. Environ. 2005, 108, 85–97. [Google Scholar] [CrossRef]
- He, J.; Li, X.; Jia, L.; Gong, H.; Cai, Q. Experimental study of Rill Evolution Processes and Relation-ships between Runoff and Erosion on Clay Loam and Loess. Soil Sci. Soc. Am. J. 2014, 78, 1716–1725. [Google Scholar] [CrossRef]
- Govers, G.; Poesen, J. Assessment of the interrill and rill contributions to total soil loss from an upland field plot. Geomorphology 1988, 1, 343–354. [Google Scholar] [CrossRef]
- Shen, H.; Zheng, F.; Wen, L.; Lu, J.; Jiang, Y. An experimental study of rill erosion and morphology. Geomorphology 2015, 231, 193–201. [Google Scholar] [CrossRef]
- Zhang, P.; Tang, H.; Yao, W.; Zhang, N.; Xizhi, L.V. Experimental investigation of morphological characteristics of rill evolution on loess slope. CATENA 2016, 137, 536–544. [Google Scholar] [CrossRef]
- Shin, S.S.; Sim, Y.J.; Son, S.J.; Park, S.D. Micromorphological changes of rill developed by simulated rainfall and inflow on steep slopes. KSCE J. Civ. Eng. 2023, 43, 21–32. [Google Scholar]
- Lee, J.Y.; Yang, D.Y.; Kim, J.Y.; Chung, G.S. Application of landsat ETM image to estimate the distribution of soil types and erosional pattern in the wildfire area of Gangneung, Gangwon province, Korea. J. Korean Earth Sci. Soc. 2004, 25, 764–773. [Google Scholar]
- Kim, K.T.; Kim, J.H. Analysis of soil erosion hazard zone by cropland. J. Korean Wetl. Soc. 2005, 7, 107–117. [Google Scholar]
- Lee, H.H.; Joo, J.D. Characteristics of soil erosion on the forest fired sites by using rainfall simulator. J. Korean For. Soc. 2006, 95, 649–656. [Google Scholar]
- Kim, C.G.; Shin, K.; Joo, K.Y.; Lee, K.S.; Shin, S.S.; Choung, Y. Effects of soil conservation measures in a partially vegetated area after forest fires. Sci. Total Environ. 2008, 399, 158–164. [Google Scholar] [CrossRef]
- Shin, S.S.; Park, S.D.; Cho, J.W.; Lee, K.S. Effect of vegetation recovery for surface runoff and soil erosion in burned mountains, Yangyang. KSCE J. Civ. Eng. 2008, 28, 393–403. [Google Scholar]
- Seo, J.I.; Chun, K.W.; Kim, S.W.; Kim, M.S. Rainfall pattern regulating surface erosion and its effect on variation in sediment yield in post-wildfire area. J. Korean Soc. For. Sci. 2010, 99, 534–545. [Google Scholar]
- Shin, S.S.; Park, S.D.; Lee, K.S. Sediment and hydrological response to vegetation recovery following wildfire on hillslopes and the hollow of a small watershed. J. Hydrol. 2013, 499, 154–166. [Google Scholar] [CrossRef]
- Jeong, J.G.; Seo, B.M.; Ha, S.H.; Lee, D.W. A measurement of hydraulic conductivity of disturbed sandy soils by particle analysis and falling head method. J. Eng. Geol. 2006, 16, 15–21. [Google Scholar]
- Park, S.D.; Lee, K.S.; Shin, S.S. Statistical soil erosion model for burnt mountain areas in Korea - RUSLE approach. J. Hydrol. Eng. ASCE 2012, 17, 292–304. [Google Scholar] [CrossRef]
- Shin, S.S.; Park, S.D.; Pierson, F.B.; Williams, C.J. Evaluation of physical erosivity factor for interrill erosion on steep vegetated hillslopes. J. Hydrol. 2019, 571, 559–572. [Google Scholar] [CrossRef]
- Savat, J. Laboratory experiments on erosion and deposition of loess by laminar sheet flow and turbulent rill flow. In Agricultural Soil Erosion in Temperate Non Mediterranean Climate; Université de Strasbourg: Strasbourg, France, 1979; pp. 139–144. [Google Scholar]
- Merritt, E. The identification of four stages during micro-rill development. Earth Surf. Process. Landf. 1984, 9, 493–496. [Google Scholar] [CrossRef]
- Rauws, G.; Govers, G. Hydraulic and soil mechanical aspects of rill generation on agricultural soils. J. Soil Sci. 1988, 39, 111–124. [Google Scholar] [CrossRef]
- Bryan, R.B.; Poesen, J. Laboratory experiments on the influence of slope length on runoff, percolation and rill development. Earth Surf. Process. Landf. 1989, 14, 211–231. [Google Scholar] [CrossRef]
- Govers, G. Empirical relationships for the transport capacity of overland flow. Eros. Transp. Depos. Process. IAHS Publ. 1990, 189, 45–63. [Google Scholar]
- Slattery, M.; Bryan, R. Hydraulic conditions for rill incision under simulated rainfall: A laboratory experiment. Earth Surf. Process. Landf. 1992, 17, 127–146. [Google Scholar] [CrossRef]
- Abrahams, A.D.; Li, G. Rill hydraulics on a semiarid hillslope, southern Arizona. Earth Surf. Process-Es Landf. 1996, 21, 35–47. [Google Scholar] [CrossRef]
- Giménez, R.; Govers, G. Interaction between bed roughness and flow hydraulics in eroding rills. Water Resour. Res. 2001, 37, 791–799. [Google Scholar] [CrossRef]
- Wells, R.R.; Bennett, S.J.; Alonso, C.V. Modulation of headcut soil erosion in rills due to upstream sediment loads. Water Resour. Res. 2010, 46, W12531. [Google Scholar] [CrossRef]
- Li, G.; Zheng, F.; Lu, J.; Xu, X.; Hu, W.; Han, Y. Inflow rate impact on hillslope erosion processes and flow hydrodynamics. Soil Sci. Soc. Am. J. 2016, 80, 711–719. [Google Scholar] [CrossRef] [Green Version]
- Chen, X.; Zhao, Y.; Mi, H.; Mo, B. Estimating rill erosion process from eroded morphology in flume experiments by volume replacement method. CATENA 2016, 136, 135–140. [Google Scholar] [CrossRef]
- Nearing, M.A.; Simanton, J.R.; Norton, L.D.; Bulygin, S.J.; Stone, J. Soil erosion by surface water flow on a stony, semiarid hillslope. Earth Surf. Process. Landf. 1999, 24, 677–686. [Google Scholar] [CrossRef]
- Lei, T.W.; Zhang, Q.W.; Zhao, J.; Xia, W.S.; Pan, Y.H. Soil detachment rates for sediment loaded flow in rills. Trans. ASAE 2002, 45, 1897–1903. [Google Scholar]
- Yao, C.; Lei, T.; Elliot, W.J.; McCool, D.K.; Zhao, J.; Chen, S. Critical conditions for rill initiation. Trans. ASABE 2008, 51, 107–114. [Google Scholar] [CrossRef] [Green Version]
- Berger, C.; Schulze, M.; Rieke-Zapp, D.; Schlunegger, F. Rill development and soil erosion: A laboratory study of slope and rainfall intensity. Earth Surf. Process. Landf. 2010, 35, 1456–1467. [Google Scholar] [CrossRef]
- Tian, P.; Xu, X.; Pan, C.; Hsu, K.; Yang, T. Impacts of rainfall and inflow on rill formation and erosion processes on steep hillslopes. J. Hydrol. 2017, 548, 24–39. [Google Scholar] [CrossRef]
- Jiang, F.; Zhan, Z.; Chen, J.; Lin, J.; Wang, M.K.; Ge, H.; Huang, Y. Rill erosion processes on a steep colluvial deposit slope under heavy rainfall in flume experiments with artificial rain. CATENA 2018, 169, 46–58. [Google Scholar] [CrossRef]
- Tian, P.; Pan, C.; Xu, X.; Wu, T.; Yang, T.; Zhang, L. A field investigation on rill development and flow hydrodynamics under different upslope inflow and slope gradient conditions. Hydrol. Res. 2020, 51, 1201–1220. [Google Scholar] [CrossRef]
- Niu, Y.; Gao, Z.; Li, Y.; Lou, Y.; Zhang, S.; Zhang, L.; Due, J.; Zhang, X.; Luo, K. Characteristics of rill erosion in spoil heaps under simulated inflow: A field runoff plot experiment. Soil Tillage Res. 2020, 202, 104655. [Google Scholar] [CrossRef]
- Kou, P.; Xu, Q.; Yunus, A.P.; Dong, X.; Zhong, Y.; Chen, L.; Fang, S.; Luo, X.; Jin, Z. Rill development and its change rate: A field experiment under constant rainfall intensity. CATENA 2021, 199, 105112. [Google Scholar] [CrossRef]
- Moody, J.A.; Smith, J.D.; Ragan, B.W. Critical shear stress for erosion of cohesive soils subjected to temperatures typical of wildfires. J. Geophys. Res. 2005, 110, 1–13. [Google Scholar] [CrossRef] [Green Version]
- Shen, H.; Zheng, F.; Wen, L.; Han, Y.; Hu, W. Impacts of rainfall intensity and slope gradient on rill erosion processes at loessial hillslope. Soil Tillage Res. 2016, 155, 429–436. [Google Scholar] [CrossRef]
- Qin, C.; Zheng, F.; Xu, X.; Wu, H.; Shen, H. A laboratory study on rill network development and morphological characteristics on loessial hillslope. J. Soils Sediments 2017, 18, 1679–1690. [Google Scholar] [CrossRef]
- Shih, H.M.; Yang, C.T. Estimating overland flow erosion capacity using unit stream power. Int. J. Sediment Res. 2009, 24, 46–62. [Google Scholar] [CrossRef]
- Shi, Z.H.; Fang, N.F.; Wu, F.Z.; Wang, L.; Yue, B.J.; Wu, G.L. Soil erosion processes and sediment sorting associated with transport mechanisms on steep slopes. J. Hydrol. 2012, 454–455, 123–130. [Google Scholar] [CrossRef]
- Govers, G. Relationship between discharge, velocity and flow area for rills eroding loose, non-layered materials. Earth Surf. Process. Landf. 1992, 17, 515–528. [Google Scholar] [CrossRef]
- Zhuang, X.; Wang, W.; Ma, Y.; Huang, X.; Lei, T. Spatial distribution of sheet flow velocity along slope under simulated rainfall conditions. Geoderma 2018, 321, 1–7. [Google Scholar] [CrossRef]
- Savat, J. Common and uncommon selectivity in the process of fluid transportation: Field observations and laboratory experiments on bare surfaces. CATENA Suppl. 1982, 1, 139–160. [Google Scholar]
- Loch, R.J.; Thomas, E.C. Resistance to rill erosion: Observations on the efficiency of rill erosion on a tilled clay soil under simulated rain and run-on water. CATENA Suppl. 1987, 8, 71–83. [Google Scholar]
- Shin, S.S.; Park, S.D.; Lee, S.K.; Nam, M.J. Soil Erosion Experimental Equipment; 10-2016-0085990; Korean Intellectual Property Office: Daejeon, Republic of Korea, 2016. [Google Scholar]
- Nam, M.J.; Park, S.D.; Lee, S.K.; Shin, S.S. Interaction between raindrops splash and sheet flow in interrill erosion of steep hillslopes. J. Korea Water Resour. Assoc. 2015, 48, 595–604. [Google Scholar] [CrossRef] [Green Version]
- Shin, S.S.; Park, S.D.; Hwang, Y. Erodibility evaluation of sandy soils for sheet erosion on steep slopes. J. Korea Water Resour. Assoc. 2022, 55, 291–300. [Google Scholar]
- Park, S.D.; Shin, S.S.; Kim, S.J.; Chio, B. Effects of surface compaction treatment on soil loss from disturbed bare slopes under simulated rainfalls. J. Korea Water Resour. Assoc. 2013, 46, 559–568. [Google Scholar] [CrossRef] [Green Version]
- Moss, A.; Green, P.; Hutka, J. Small channels: Their formation, nature and significance. Earth Surf. Process. Landf. 1982, 7, 401–415. [Google Scholar] [CrossRef]
- Torri, D.; Sfalanga, M.; Del Sette, M. Splash detachment: Runoff depth and soil cohesion. CATENA 1987, 14, 149–155. [Google Scholar] [CrossRef]
- Govers, G. Spatial and temporal variability in rill development processes at the Huldenberg experimental Site. CATENA Suppl. 1987, 8, 17–33. [Google Scholar]
- Bagnold, R.A. An approach to the sediment transport problem form general physics; U.S., Geological Survey Professional Paper, 422-J; U.S. Government Printing Office: Washington, DC, USA, 1966.
- Yang, C.T. Unit stream power and sediment transport. J. Hydraul. Div. (ASCE) 1972, 98, 1805–1826. [Google Scholar] [CrossRef]
- Planchon, O.; Fritsch, E.; Valentin, C. Rill development in a wet Savannah environment. CATENA Suppl. 1987, 8, 55–70. [Google Scholar]
- Govers, G. Selectivity and transport capacity of thin flows in relation with rill erosion. CATENA 1985, 12, 35–49. [Google Scholar] [CrossRef]
- Foster, G. Modelling the soil erosion process. In Hydrologic Modelling of Small Watersheds; Haan, C., Johnson, H., Brakensiek, D., Eds.; American Society of Agricultural Engineers Monograph: St. Joseph, MI, USA, 1982; Volume 5, pp. 940–947. [Google Scholar]
Figure 1.
Processes and methods to rill erosion experiment; (a) schematic of a rainfall and inflow simulator; (b) schematic of connected segments for the long hillslope; (c) velocity measurement of overland flow using the dye.
Figure 1.
Processes and methods to rill erosion experiment; (a) schematic of a rainfall and inflow simulator; (b) schematic of connected segments for the long hillslope; (c) velocity measurement of overland flow using the dye.


Figure 2.
Views of rill development according to slope steepness, segment location, and rainfall intensity.
Figure 2.
Views of rill development according to slope steepness, segment location, and rainfall intensity.

Figure 3.
Relationship between maximum velocity and discharge of overland flow at three different steep slopes.
Figure 3.
Relationship between maximum velocity and discharge of overland flow at three different steep slopes.

Figure 4.
Variations of (a) Reynolds number and (b) Froude number with the segment distance.

Figure 5.
Velocity distribution of overland flow according to distance of cross section of 0.6 m.

Figure 6.
Distribution of mean and maximum velocities of overland flow according to slope steepness, rainfall intensity, and segment distance.
Figure 6.
Distribution of mean and maximum velocities of overland flow according to slope steepness, rainfall intensity, and segment distance.

Figure 7.
Relationships between sediment yield and (a) the maximum velocity of overland flow, and (b) shear stress.
Figure 7.
Relationships between sediment yield and (a) the maximum velocity of overland flow, and (b) shear stress.

Figure 8.
Relationships between sediment yield and (a) stream power, and (b) unit stream power indicating rill incision.
Figure 8.
Relationships between sediment yield and (a) stream power, and (b) unit stream power indicating rill incision.


Table 1.
Ranges of subfactors for erosivity, topography, and soil erodibility for the rill experiment.
Table 1.
Ranges of subfactors for erosivity, topography, and soil erodibility for the rill experiment.
| Factors | Subfactors | Range |
|---|---|---|
| Erosivity | Rainfall intensity, I (mm/h) | 80.0 ± 1.2, 100.0 ± 1.8 |
| Inflow discharge, Qin (ml/s) | 0.0, 8.8 ± 1.1, 17.5 ± 2.2, 26.3 ± 3.3 | |
| Duration of simulation (min) | 10 | |
| Topography | Length, L (m) | 0.8 |
| Width, W (m) | 0.6 | |
| Slope, S (°) | 20, 24, 28 | |
| Erodibility | Clay (%) | 1.1 |
| Silt (%) | 3.9 | |
| Sand (%) | 73.3 | |
| Gravel (%) | 21.7 | |
| Mean diameter, Dm (mm) | 0.936 | |
| Bulk density, ρs (g/cm3) | 1.78 | |
| Organic matter content, Om (%) | 2.05 ± 0.08 | |
| Share strength, τs (kg/cm2) | 0.312 ± 0.033 |
Table 2.
The results of mean flow velocity, runoff coefficient, and unit flow rate of overland flow according to slope steepness, rainfall intensity, segment location, and inflow fate.
Table 2.
The results of mean flow velocity, runoff coefficient, and unit flow rate of overland flow according to slope steepness, rainfall intensity, segment location, and inflow fate.
| Slope (°) | Rainfall Intensity, I (mm/h) | Segment Distance, Seg (m) | Inflow Rate, Qin (ml/s) | Unit Flow Rate, Qout (10−5 m2/s) | Runoff Coefficient, C | Flow Velocity, V (m/s) |
|---|---|---|---|---|---|---|
| 20 | 80 | 0.8 | 0.0 | 1.49 | 0.81 | 0.006 |
| 1.6 | 8.0 | 2.72 | 0.86 | 0.030 | ||
| 2.4 | 15.8 | 3.35 | 0.75 | 0.046 | ||
| 3.2 | 26.0 | 4.68 | 0.76 | 0.089 | ||
| 100 | 0.8 | 0.0 | 1.55 | 0.68 | 0.006 | |
| 1.6 | 11.0 | 3.01 | 0.73 | 0.026 | ||
| 2.4 | 19.3 | 3.48 | 0.64 | 0.063 | ||
| 3.2 | 31.0 | 5.69 | 0.77 | 0.098 | ||
| 24 | 80 | 0.8 | 0.0 | 1.33 | 0.75 | 0.005 |
| 1.6 | 7.9 | 2.26 | 0.73 | 0.036 | ||
| 2.4 | 15.9 | 3.15 | 0.71 | 0.051 | ||
| 3.2 | 23.0 | 4.02 | 0.71 | 0.068 | ||
| 100 | 0.8 | 0.0 | 1.78 | 0.79 | 0.008 | |
| 1.6 | 9.8 | 2.65 | 0.69 | 0.031 | ||
| 2.4 | 19.7 | 3.17 | 0.58 | 0.047 | ||
| 3.2 | 30.0 | 5.43 | 0.75 | 0.106 | ||
| 28 | 80 | 0.8 | 0.0 | 1.34 | 0.75 | 0.006 |
| 1.6 | 7.5 | 2.49 | 0.82 | 0.025 | ||
| 2.4 | 15.1 | 3.33 | 0.78 | 0.056 | ||
| 3.2 | 23.0 | 4.30 | 0.76 | 0.116 | ||
| 100 | 0.8 | 0.0 | 1.88 | 0.84 | 0.009 | |
| 1.6 | 9.7 | 2.60 | 0.66 | 0.036 | ||
| 2.4 | 18.8 | 2.94 | 0.55 | 0.057 | ||
| 3.2 | 29.0 | 5.03 | 0.71 | 0.084 |
Table 3.
Correlation matrix between sediment yield and sediment concentration and parameters for topography, erodibility, erosivity, hydraulic, and hydrodynamic.
Table 3.
Correlation matrix between sediment yield and sediment concentration and parameters for topography, erodibility, erosivity, hydraulic, and hydrodynamic.
| Factors | Sediment Yield (kg/m2/s) | Sediment Concentration (kg/m3) |
|---|---|---|
| Slope steepness, S (°) | 0.346 | 0.427 * |
| Shear strength of soil, τs(kg/cm2) | −0.124 | −0.138 |
| Inflow discharge, Qin (ml/sec) | 0.628 ** | 0.572 ** |
| Rainfall intensity, I (mm/hr) | 0.023 | −0.023 |
| Supply water discharge, Qsup (ml/sec) | 0.615 ** | 0.555 ** |
| Overland flow discharge, Oout (ml/sec) | 0.640 ** | 0.555 ** |
| Runoff coefficient, C | −0.049 | −0.111 |
| Mean velocity of overland flow, V (m/s) | 0.797 ** | 0.743 ** |
| Maximum velocity of overland flow, Vmax (m/s) | 0.831 ** | 0.766 ** |
| Mean water depth, h (mm) | −0.481 * | −0.492 * |
| Reynolds number | 0.640 ** | 0.555 ** |
| Froude number | 0.849 ** | 0.803 ** |
| Shear stress, τ (N/m2) | −0.442 * | −0.440 * |
| Ratio of shear stress for shear strength, τ/τs | −0.411 * | −0.409 * |
| Stream power, W (N/m/s) | 0.817 ** | 0.749 ** |
| Unit stream power, VS (m/s) | 0.916 ** | 0.873 ** |
* Significant effect (p < 0.05). ** High significant effect (p < 0.01).
Table 4.
Comparison with other rill velocities and hydrodynamic values for rill incision.
| Authors | Soil | Slope Length | Supply Water (Rainfall + Inflow) | Runoff | Velocity of Rill | Hydrodynamic |
|---|---|---|---|---|---|---|
| Torri et al. [61] | Sandy (flume) | 0.5°–17° 2.0 m | I = 30–60 mm/h | - | - | τcr = 0.45–0.50 Pa |
| Govers [31] | Silt to coarse sand(flume) | 1–12° 6.0 m | Qin = 0.023–0.117 L/s | - | Vcr = 0.03–0.035 m/s | τcr = 0.2–0. 35 Pa VcrS = 0.004 m/s |
| Yao et al. [40] | Silt loam(flume) | 20°, 25° 8.0 m | I = 100 mm/h | Qout = 0.048–0.071 L/s | Vcr = 0.048–0.052 m/s | τcr = 1.41–1.76 Pa VcrS= 0.017–0.024 m/s |
| Shen et al. [48] | Silt loam(flume) | 20° 10 m | I = 85–100 mm/h | - | Vave = 0.240–0.246 m/s | - |
| Tian et al. [42] | Sandy loam(field) | 26° 5.0 m | I = 60 mm/h Qin = 0.1–0.6 L/s | - | Vcr = 0.21 m/s | τcr = 2.76 Pa W = 0.15 N/m/s VcrS = 0.06 m/s |
| Jiang et al. [43] | Sandy loam(field) | 20° 5.0 m | I = 100–120 mm/h | Qout = 0.106–0.113 L/s | Vave = 0.10–0.13 m/s | τ = 17–23 Pa VS = 0.03–0.04 m/s |
| Zhuang et al. [53] | Coarse-sand loamy(flume) | 20° 8.0 m | I = 80–120 mm/h | - | Vcr = 0.073–0.079 m/s | VcrS = 0.027–0.029 m/s |
| In this study | Sandy(flume) | 20°– 28° 3.2 m | I = 80–100 mm/h Qin = 8.8–0.31 L/s | Qout = 0.08–0.34 L/s | Vcr = 0.065 m/s | τcr = 2.67 Pa W = 0.12 N/m/s VcrS = 0.024 m/s |
Disclaimer/Publisher’s Note: The statements, opinions and data contained in all publications are solely those of the individual author(s) and contributor(s) and not of MDPI and/or the editor(s). MDPI and/or the editor(s) disclaim responsibility for any injury to people or property resulting from any ideas, methods, instructions or products referred to in the content. |
© 2023 by the authors. Licensee MDPI, Basel, Switzerland. This article is an open access article distributed under the terms and conditions of the Creative Commons Attribution (CC BY) license (https://creativecommons.org/licenses/by/4.0/).
Share and Cite
MDPI and ACS Style
Shin, S.S.; Park, S.D.; Sim, Y.J.; Ryu, J.H. Hydraulic Conditions of Incipient Rill by Raindrop-Induced Overland Flow on Steep Slopes of Sandy Soil. Water 2023, 15, 502. https://doi.org/10.3390/w15030502
AMA Style
Shin SS, Park SD, Sim YJ, Ryu JH. Hydraulic Conditions of Incipient Rill by Raindrop-Induced Overland Flow on Steep Slopes of Sandy Soil. Water. 2023; 15(3):502. https://doi.org/10.3390/w15030502
Chicago/Turabian StyleShin, Seung Sook, Sang Deog Park, Young Ju Sim, and Jae Hyeon Ryu. 2023. "Hydraulic Conditions of Incipient Rill by Raindrop-Induced Overland Flow on Steep Slopes of Sandy Soil" Water 15, no. 3: 502. https://doi.org/10.3390/w15030502
Note that from the first issue of 2016, this journal uses article numbers instead of page numbers. See further details here.