
Research on the Influence of Siltation Height of Check Dams the on Discharge Coefficient of Broad-Crested Weirs

1
Institute of Soil and Water Conservation Science, Shanxi Agricultural University, Taiyuan 030013, China
2
College of Water Resource Science and Engineering, Taiyuan University of Technology, Taiyuan 030024, China
*
Author to whom correspondence should be addressed.
Water 2023, 15(3), 510; https://doi.org/10.3390/w15030510
Submission received: 9 December 2022
/
Revised: 17 January 2023
/
Accepted: 25 January 2023
/
Published: 27 January 2023
(This article belongs to the Section Hydraulics and Hydrodynamics)
Abstract
:With the continuous operation of check dams, the silting elevation of the whole dam gradually increases. When the silting height is close to the elevation of the broad-crested weir, it will result in a large change in the hydraulic characteristics of the original flow pattern. For subsequent reinforcement work, it is necessary to know how excessive sediment deposition affects the overflow from the broad-crested weir into the spillway. However, few studies about discharge coefficients are available in the case of spillways with sediment. In this paper, the hydraulic characteristics and discharge coefficient of a broad-crested weir whose width is 270 mm are investigated with physical experiments under different siltation heights and discharges. The research shows that: (1) With the increase in siltation height, the water level on the weir decreases and the drop of the flow becomes smaller. The overall flow pattern tends to the open-channel flow pattern. (2) In the same siltation height condition, the water surface profile along the broad-crested weir rises with the increase in discharge, and the surface velocity of the water in front of the weir increases with the increase in discharge. However, in the same discharge condition, the water surface profile along the broad-crested weir decreases with the increase in siltation height, and the surface velocity of the water in front of the weir gradually increases, which reflects that the increase in siltation height improves the overflow capacity of the broad-crested weir. (3) The present empirical formulas for the discharge coefficient have large errors when there is sediment accumulation. Therefore, a new formula for the discharge coefficient with sediment deposition is obtained using experimental data and its maximum relative error is 4.02%, which can provide a theoretical basis for risk elimination and reinforcement work on check dams in the Loess Plateau.
1. Introduction
Check dams are an important measure to manage the Loess Plateau and achieve ecological protection and high-quality development of the Yellow River Basin. In order to solve the various problems caused by soil erosion, working people have made various attempts in practice, and gradually worked out the engineering measures of check dams, which can intercept sediment and increase production. According to the literature, the oldest check dam is a natural product made more than 400 years ago. The beginning of artificial check dams started from the Ming Dynasty, after 1573 AD, in the northern part of Linfen, Shanxi Province, China [1]. Simple dams similar to current check dams appeared. During the Qing Dynasty, artificial check dam technology spread. The people in Shanxi and northwest Shaanxi also gradually tried to build dams in channels. In the Republic of China, Mr. Li, a modern Chinese water conservancy expert, systematically and completely proposed the check dam as a ditch-management measure and further summarized the check-dam scheme as part of a strategic vision for the management of the Yellow River [2]. Since the founding of China, experts and scholars at home and abroad have developed check-dam projects into an important water- and soil-conservation measure through extensive research.
Accurate quantitative analysis of the total amount of sediment intercepted by check dams is of great significance in scientific research on check dams. At present, experts and scholars at home and abroad mainly combine early topographic map data with surveying and mapping technology to make a quantitative estimation of the amount of sediment deposited by check dams. Wei [3,4] measured the siltation of a selected check dam quantitatively in layers and combined it with the reservoir capacity curve of the dam area. She determined that the main influencing factors of the siltation amount of the silt layer are I30, P, and R, and established a ternary regression equation for these three indicators. Ye [5] used the dynamic measurement technology in GPS and the analysis function of China Geographic Information System (MAPGIS) software to estimate the sediment deposition rate in the selected check dam. At the same time, combined with the existing historical data in the area and the analysis of the sediment, he determined the annual average total sediment deposition of the check dam. Wang [6] measured the total sediment deposition of a check dam in the Yangguangou watershed by combining GPS technology with the reservoir capacity curve and calculated and analyzed the average erosion modulus of the check dam since 1979 for 26 years. This study provided theoretical guidance for similar check dam projects to use GPS technology to study sediment deposition. Ramos [7] conducted a complete topographic survey of a selected check dam through instruments and equipment. Using a variety of calculation methods and comparing the results of each method with the actual historical data, it was found that the data calculated with the section method had the highest consistency with the actual data and the best effect. Tang [8] integrated the hydrologic-response and sediment-transport models and studied the influences of filled check dams with different deployment strategies in a Loess Plateau catchment. The results showed that optimizing the check dam deployment strategies can help reduce erosion.
The broad-crested weir is a key structure in the spillway of the check dam, and its discharge coefficient is related to the flood discharge capacity of the project. Some experts have conducted systematic research on the discharge coefficient of broad-crested weirs and found that it ranged from 0.32 to 0.385. The factors that affect the discharge coefficient of a broad-crested weir in free flow are primarily the inlet form and the relative weir height. At present, most engineering practices in China still use relevant theoretical knowledge [9]. In the practical application of a project, the typical weir can be determined by consulting the relevant data, and the nontypical weir can be determined by specific test research. Hua [10] believed that the outflow capacity of broad-crested weirs under submerged outflow conditions was greatly affected by lateral shrinkage, and modified the weir-flow formula with a lateral shrinkage coefficient. Wang [11] used the boundary-layer theory to study the submergence coefficient of a streamlined broad-crested weir with an arc inlet, and gave the corresponding calculation method. Yu [12] derived the common weir discharge calculation formula for a broad-crested weir mainly using the critical submergence method. Tian [13] deduced a revised formula for weir flow calculation of a broad-crested weir without a sill. He pointed out that it is usually difficult for the discharge coefficient to reach 0.385 in practical projects because of local energy loss at the inlet of the broad-crested weir. According to the least squares method of regression analysis, Shan [14] selected 33 functional equation mathematical models one by one, and deduced an empirical formula for the discharge coefficient of a broad-crested weir without a sill. Li [15] found that the traditional empirical formula for the discharge coefficient has some errors when calculating the free outflow discharge coefficient of the sluice hole, especially when the outflow of the sluice hole is close to the weir flow. After much experimental analysis and theoretical derivation, a new formula with a higher accuracy and stronger pertinence was proposed. Yang [16] studied the gate hole outflow phenomenon of two broad-crested weirs with and without a sill and analyzed the post jump water depth of weir flow in both cases. The analysis showed that the weir will affect the critical water jump of weir flow, and the post jump water depth of a broad-crested weir without a sill is greater. Kim [17] estimated debris flow discharge coefficients considering the sediment concentration in an experiment. The results showed that the discharge coefficients increase as the sediment concentration increases. Banihabib [18] estimated the discharge coefficient of slit dam outlets in clear water flow (without sediment) and debris flow (with sediment) and derived the correction coefficient to consider the effect of sediment concentration. Říha [19] compared shallow-water numerical modelling with seven sets of previous experimental observations of flow over a frontal broad-crested weir to assess the effect of vertical contraction and surface roughness on the accuracy of the computational results. The results show that the model accuracy meets the application requirements. Dehghani [20] studied the spillway discharge capacity of dams with Labyrinth weirs and found S up to 60% P have a significant effect.
According to the Bulletin of the First National Water Resources Census, there are 58,445 check dams on the Loess Plateau with an area of 927.57 km2. There are 5655 large check dams whose storage capacity is 500,000 to 5,000,000 m3, with a total storage capacity of 5.701 billion m3. Most of these large check dams are “two pieces”, lacking flood discharge facilities, so the main reinforcement work is to add a spillway. However, there is still a lack of relevant research on how to discharge floods using check dam under massive siltation. In this paper, the broad-crested weir of the spillway of a check dam is taken as the research subject, and the influence of the siltation height close to the bottom of the spillway on the hydraulic characteristics and discharge coefficient is studied, which can provide a theoretical reference for the risk elimination and reinforcement works in the Loess Plateau.
2. Experimental Design
In this study, the effect of different sediment heights on the hydraulic characteristics of a broad-crested weir is investigated through a hydraulic experiment in the case where the sediment height is close to the bottom elevation of the weir. The specific research scheme is as follows.
2.1. Experimental System
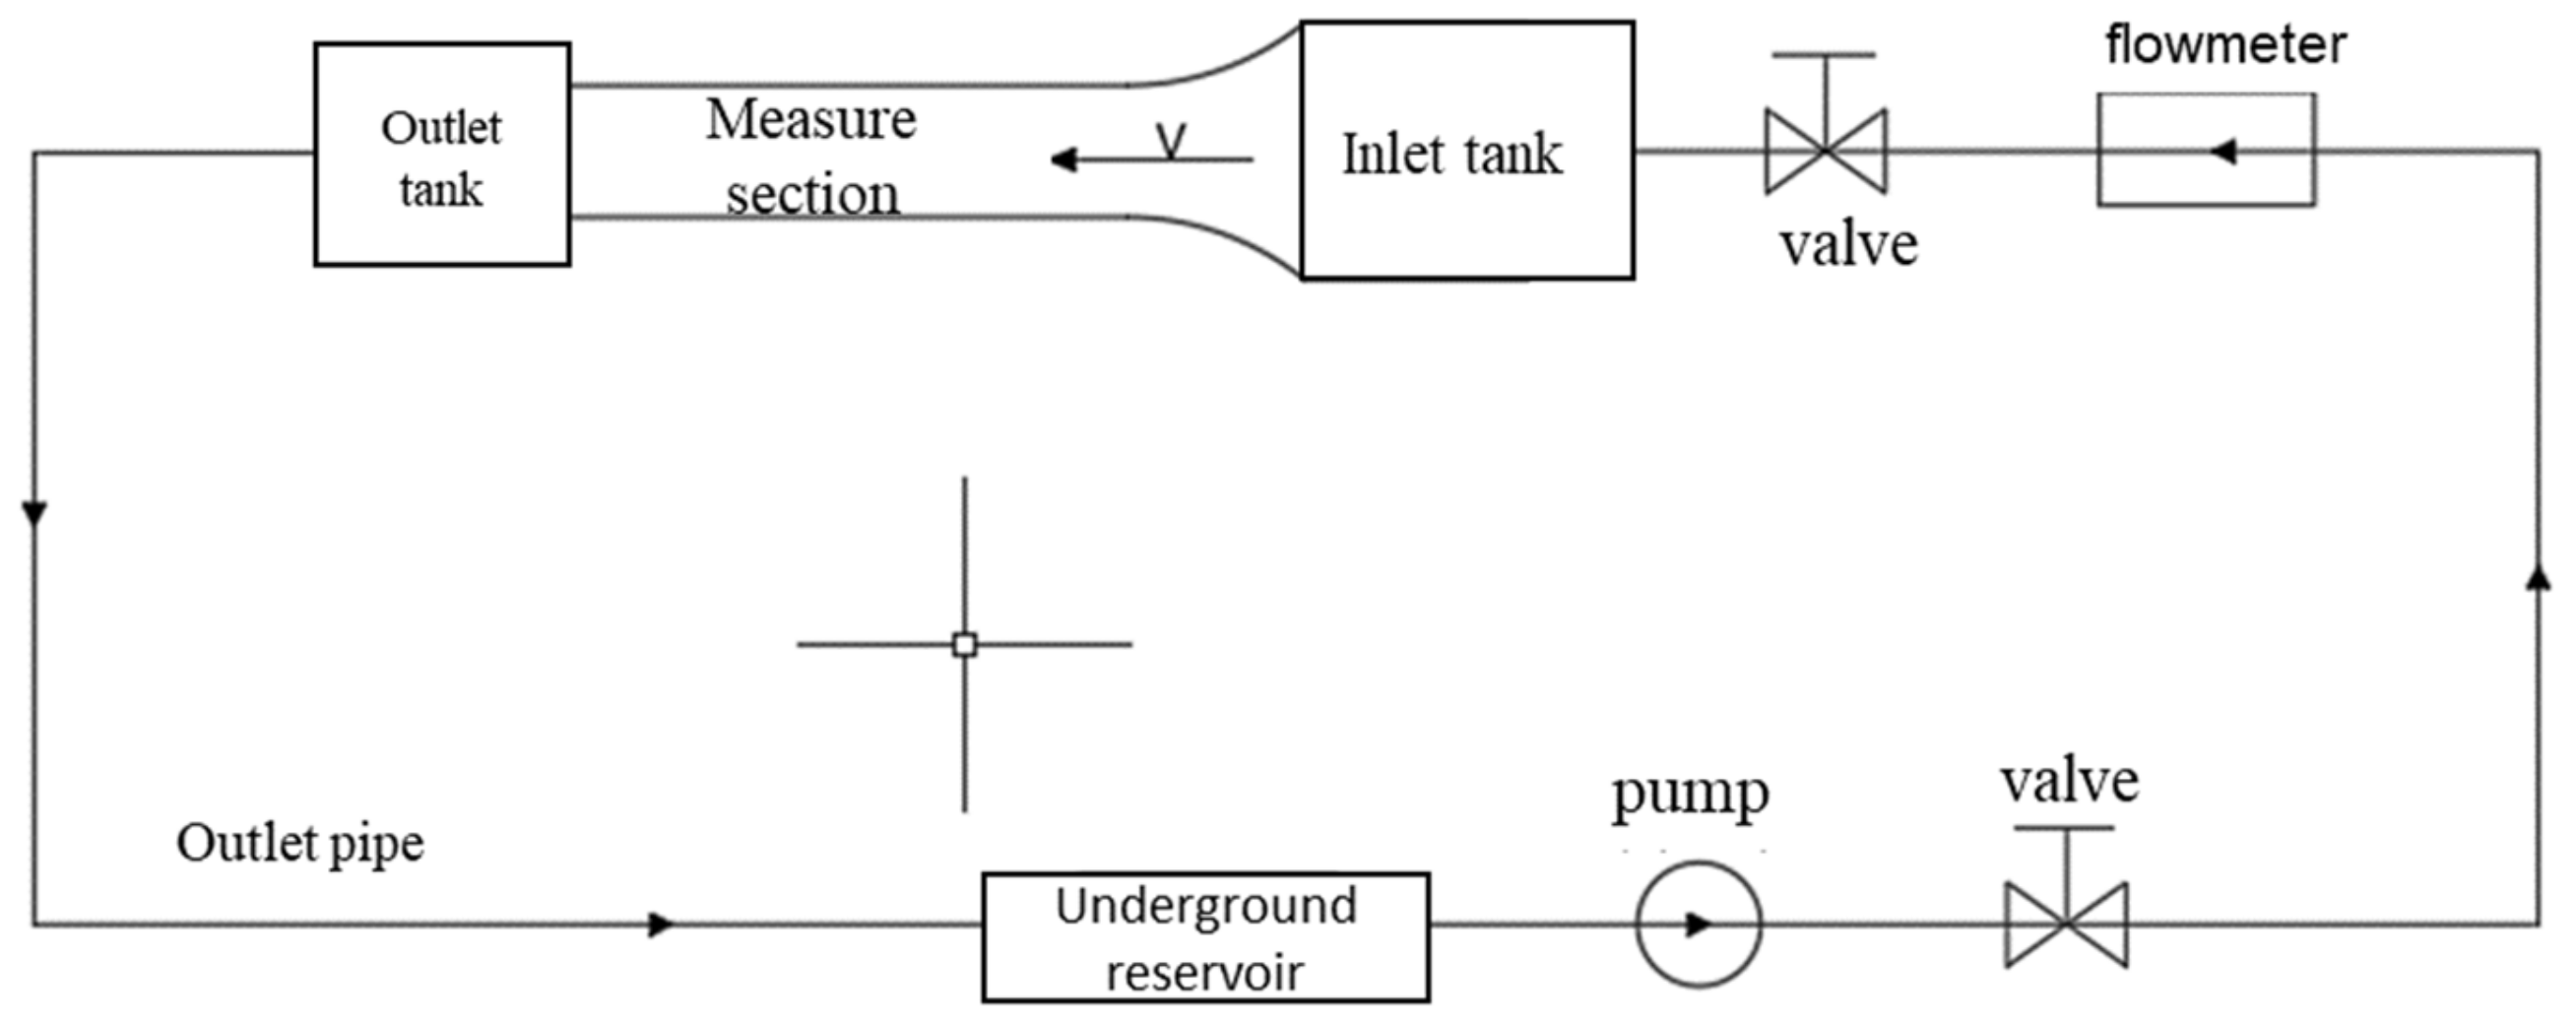
The whole test system includes inlet and outlet pipes, inlet and outlet water tanks, a pump, a self-balancing control valve, a physical test model, and other components. During the experiment, the flow is pumped by the power unit from the underground reservoir into the inlet tank, which is equipped with a water-stabilization grate to reduce fluctuations and make the water run smoothly into the subsequent model-test section. The specific discharge required for the experiment is adjusted with a self-balancing valve combined with an electromagnetic flow meter. Water flows sequentially through the channel siltation section, broad-crested weir, chute, etc. into the outlet tank. Finally, the water flows into the underground reservoir via the outlet pipe, forming a test system for water recycling. Figure 1 shows the layout of the test system.
2.2. Physical Model
The hydraulic model was designed and built based on the gravity similarity criterion following the provisions of the Hydraulic Model Test. After considering the site factor, energy consumption factor, and test conditions, we set the geometric scale of the model to λL = 14.8, the flow scale to λQ = λL2.5 = 842.66, and the discharge scale to λV = λL0.5 = 3.85.
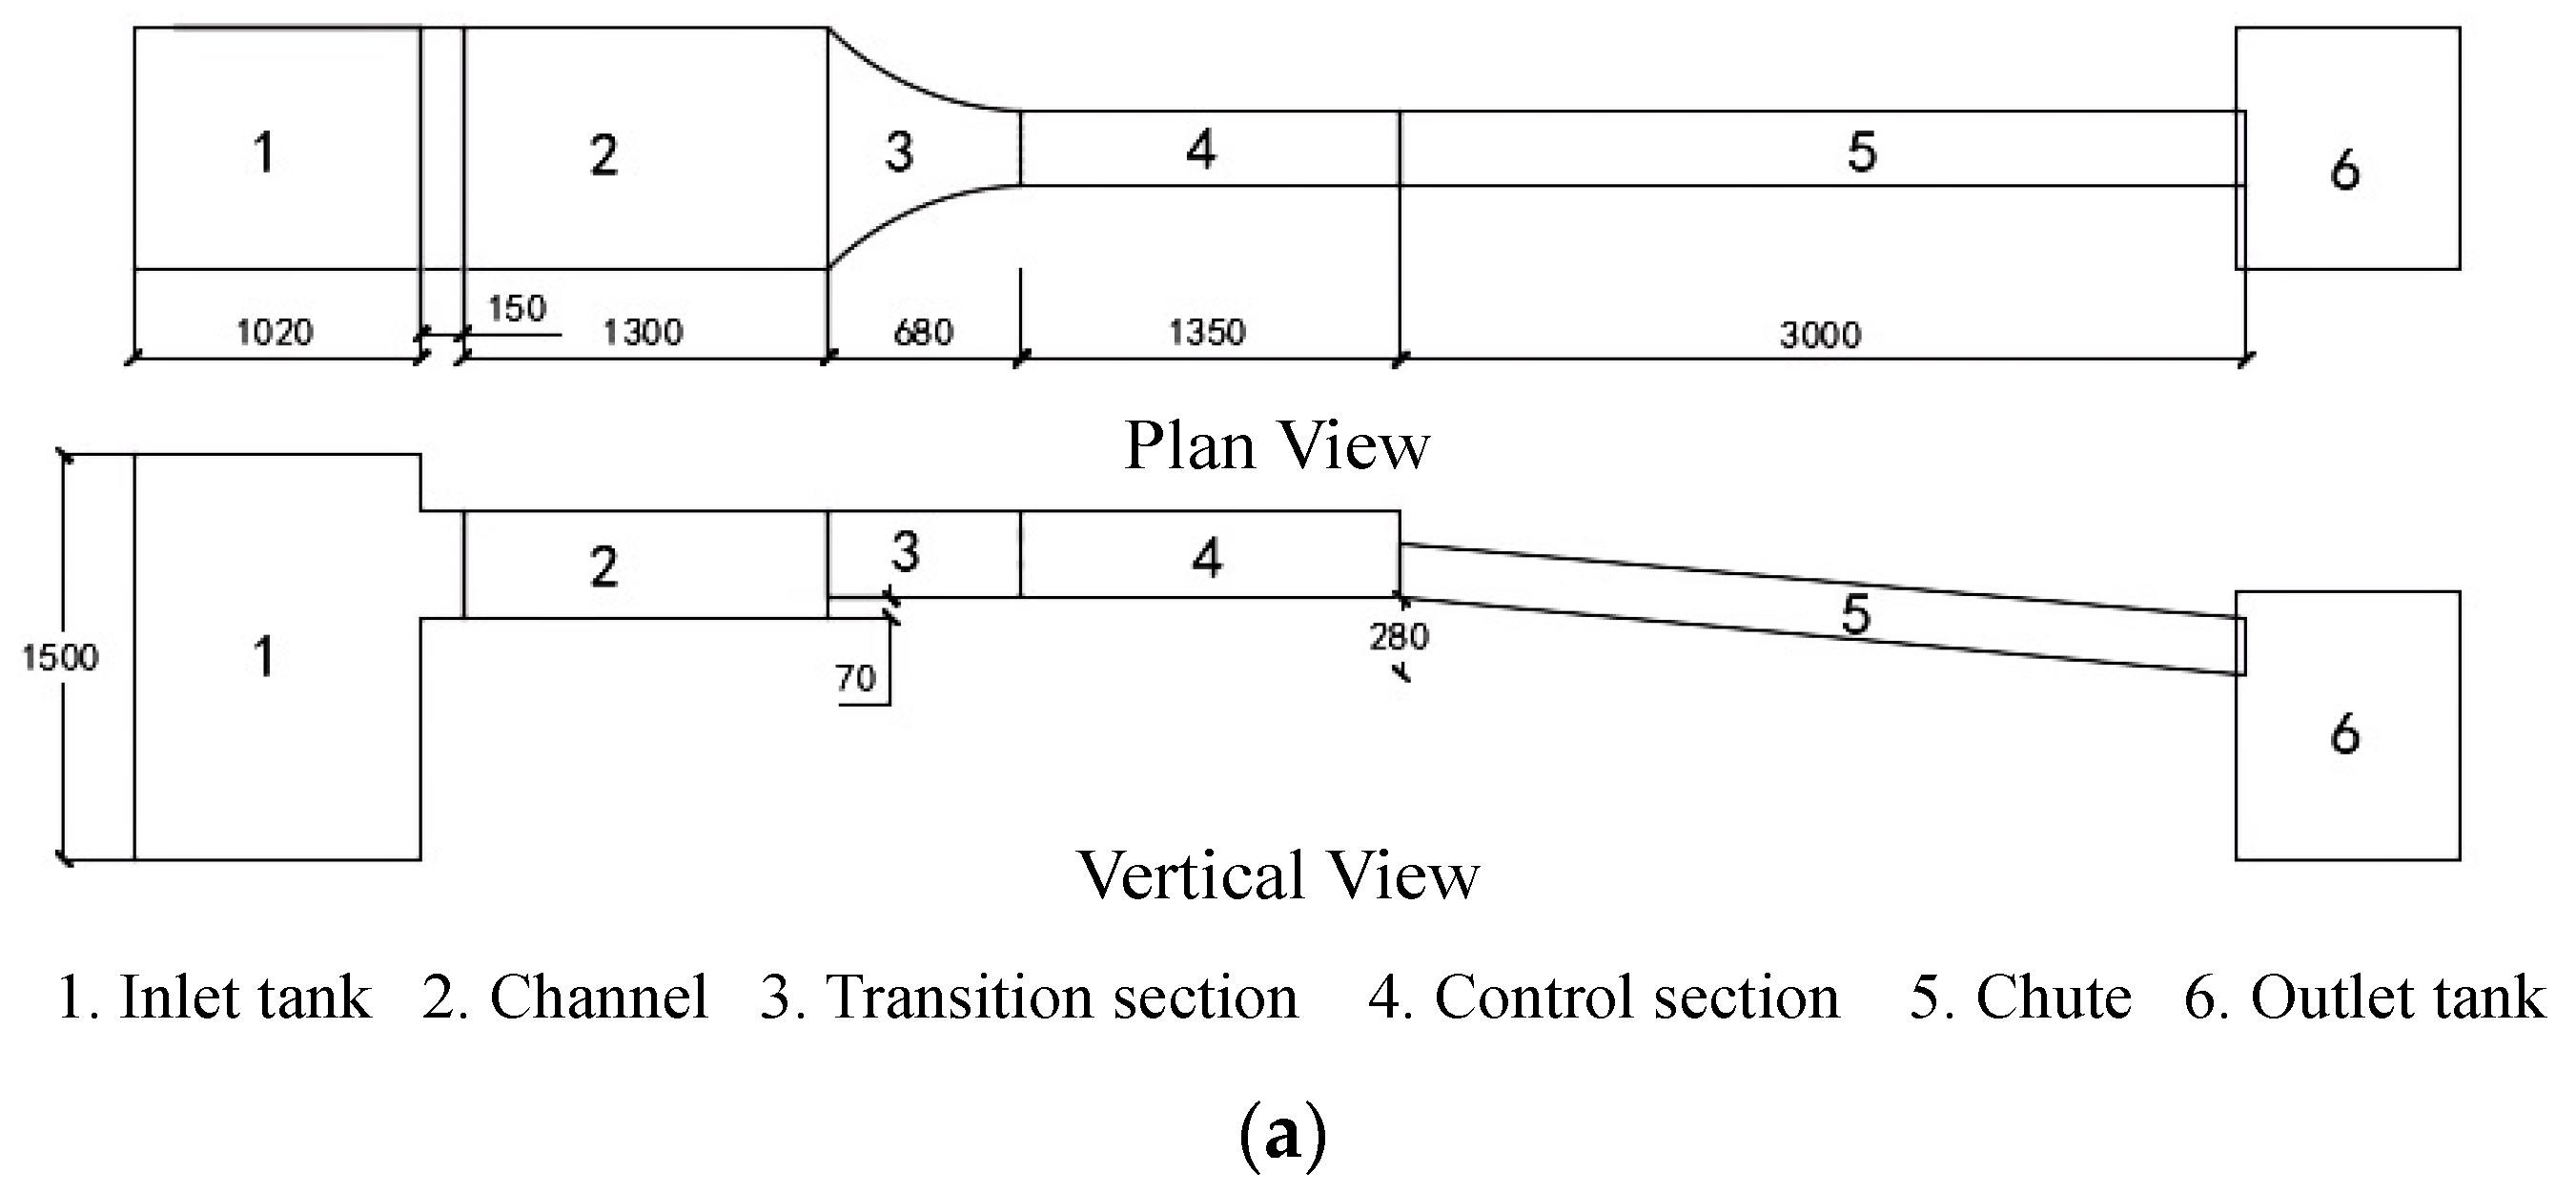
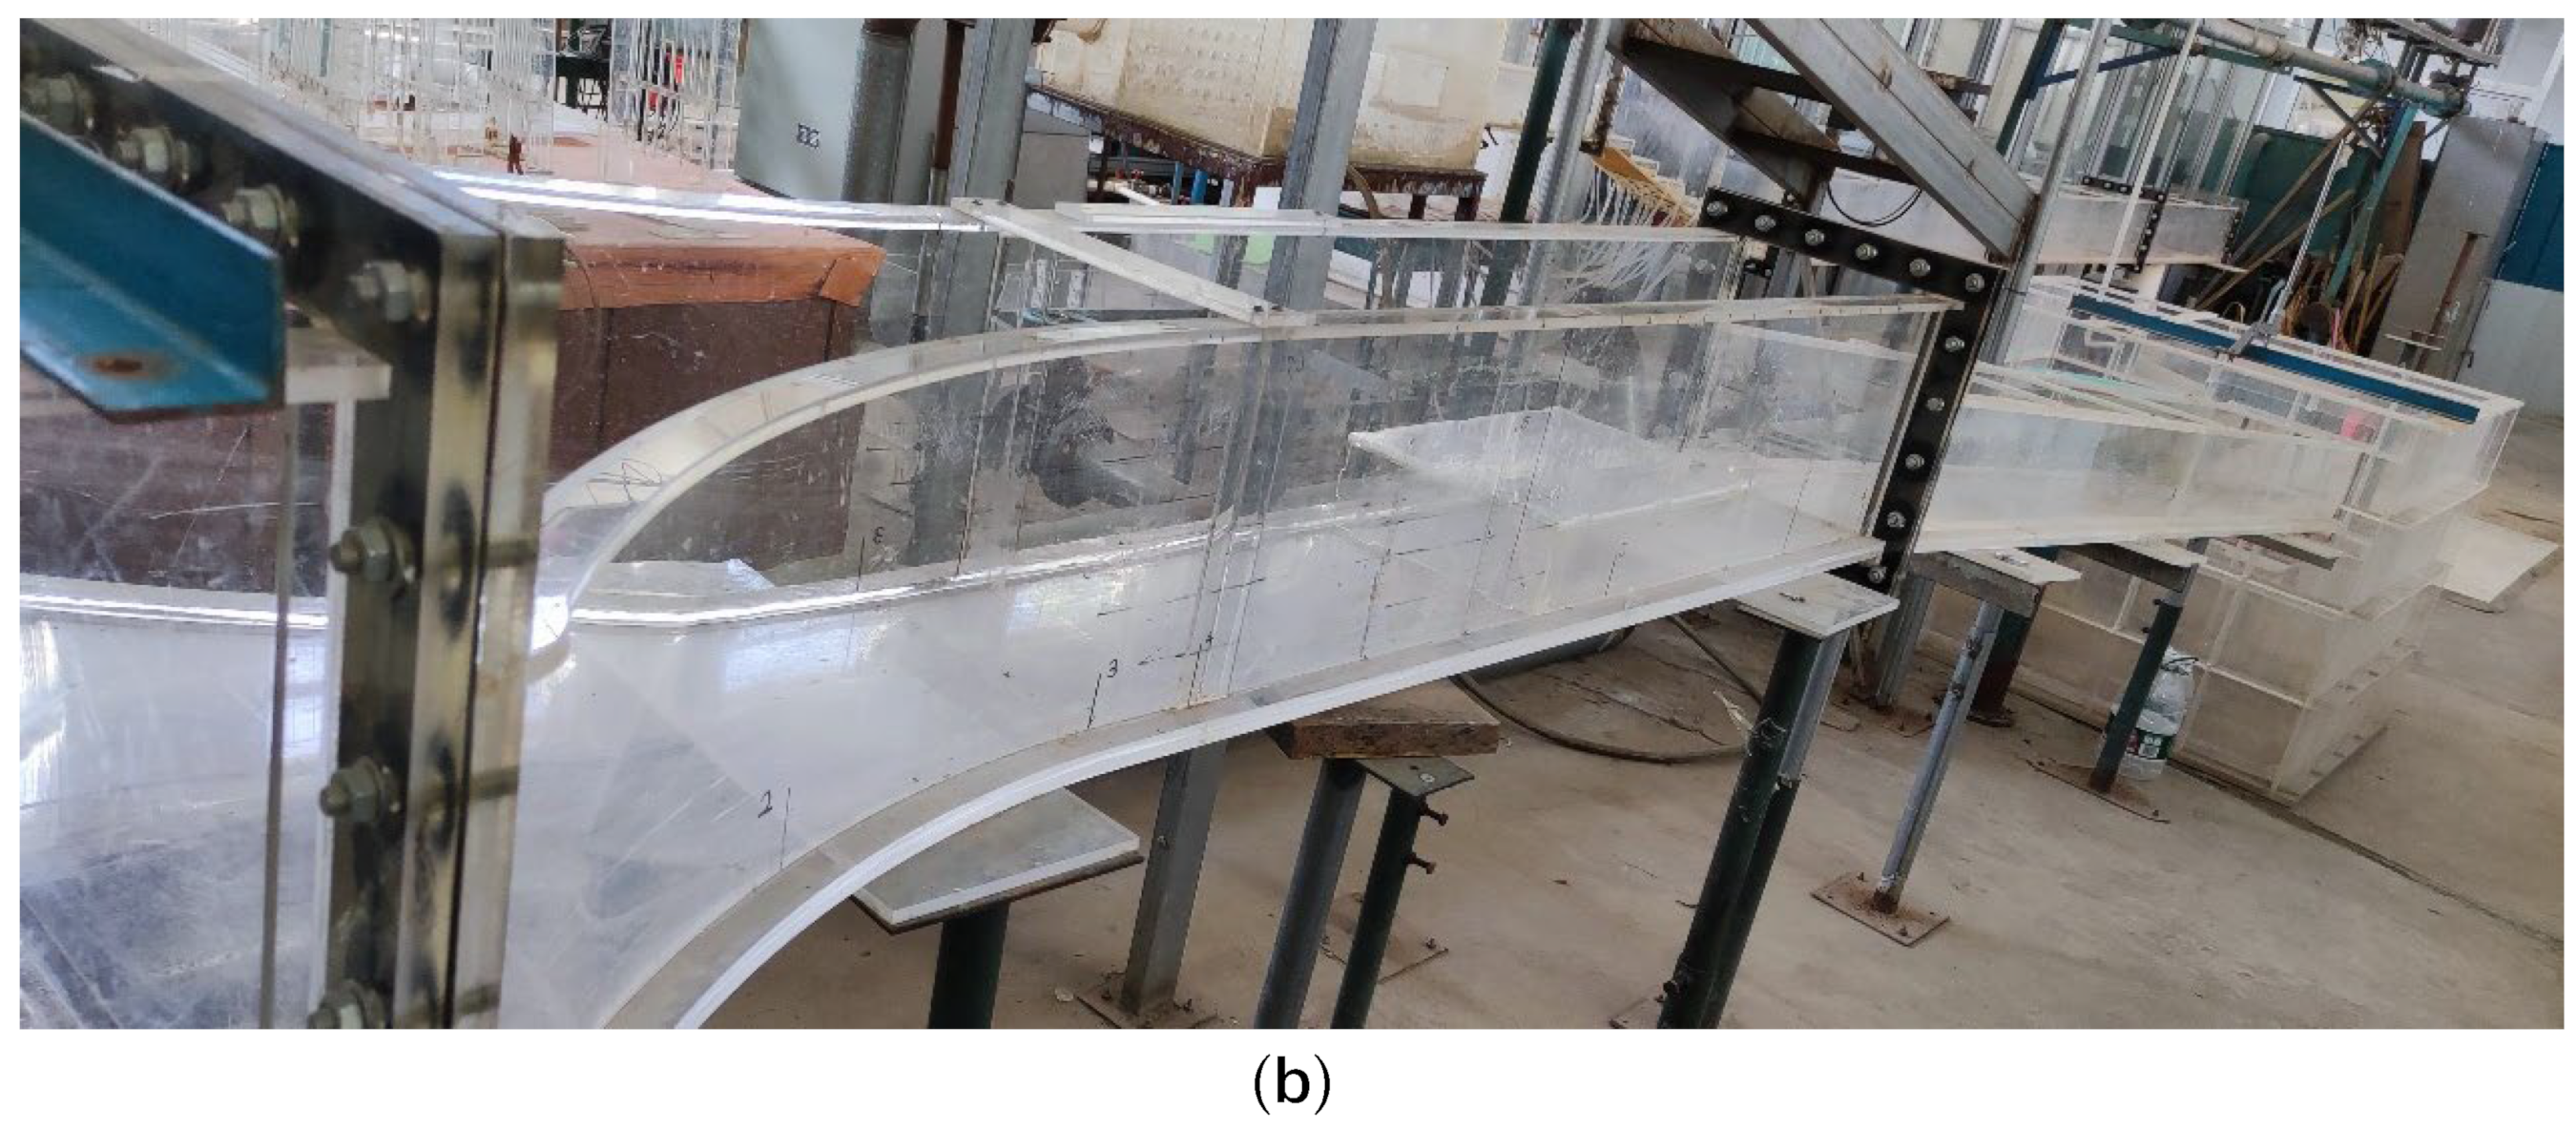
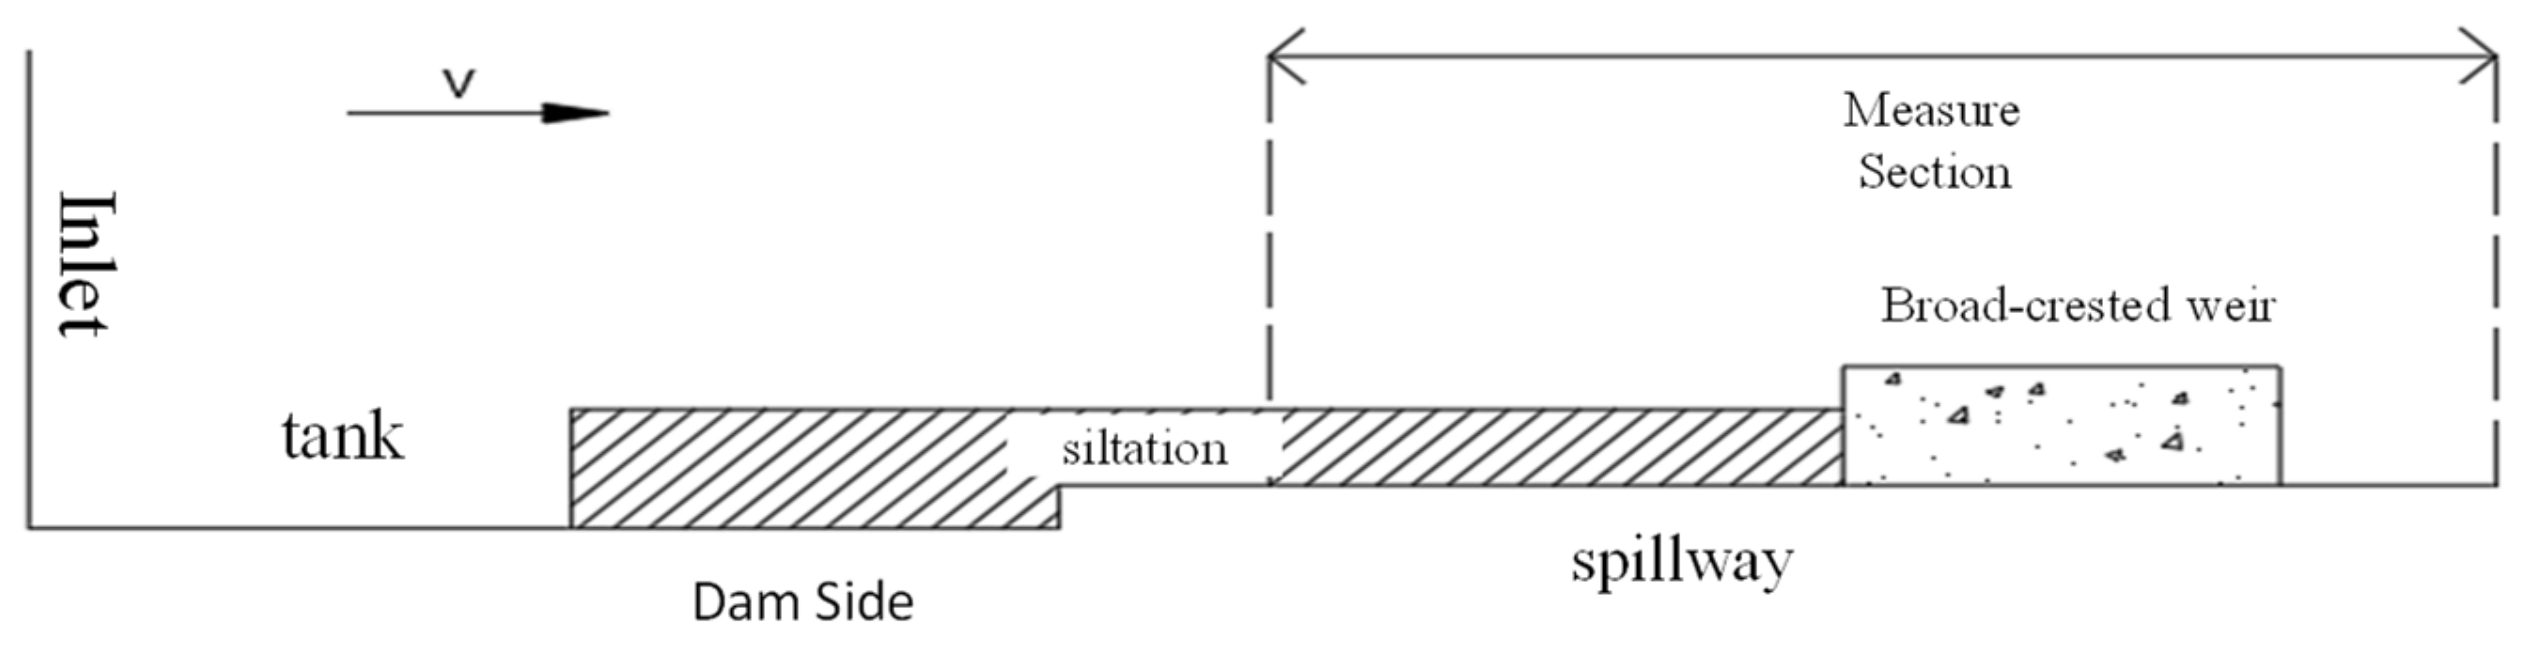
The whole test model is assembled of organic glass for the inlet water tank, approach channel section, spillway, and outlet water tank [21]. The approach channel section is 1.3 m in length and 0.9 m in width. The spillway consists of three parts: inlet transition section, control section, and chute. The inlet transition section is an arc with a length of 0.68 m. The upstream part is connected to the approach canal section, and the downstream part is connected to the control section. The width of the canal in the control section is 0.27 m, the length is 1.35 m, and the top elevation is flush with the spillway inlet section. The broad-crested weir is located at the control section, 0.65 m away from the entrance of the transition section, 0.4 m in length and 0.15 m in height. The horizontal length of the chute section is 3 m, and the slope ratio is 1:10.7. Figure 2 shows the specific model layout. The measuring section is arranged in the control section of the spillway. The model layout after sediment deposition is shown in Figure 3.
2.3. Measurement Scheme
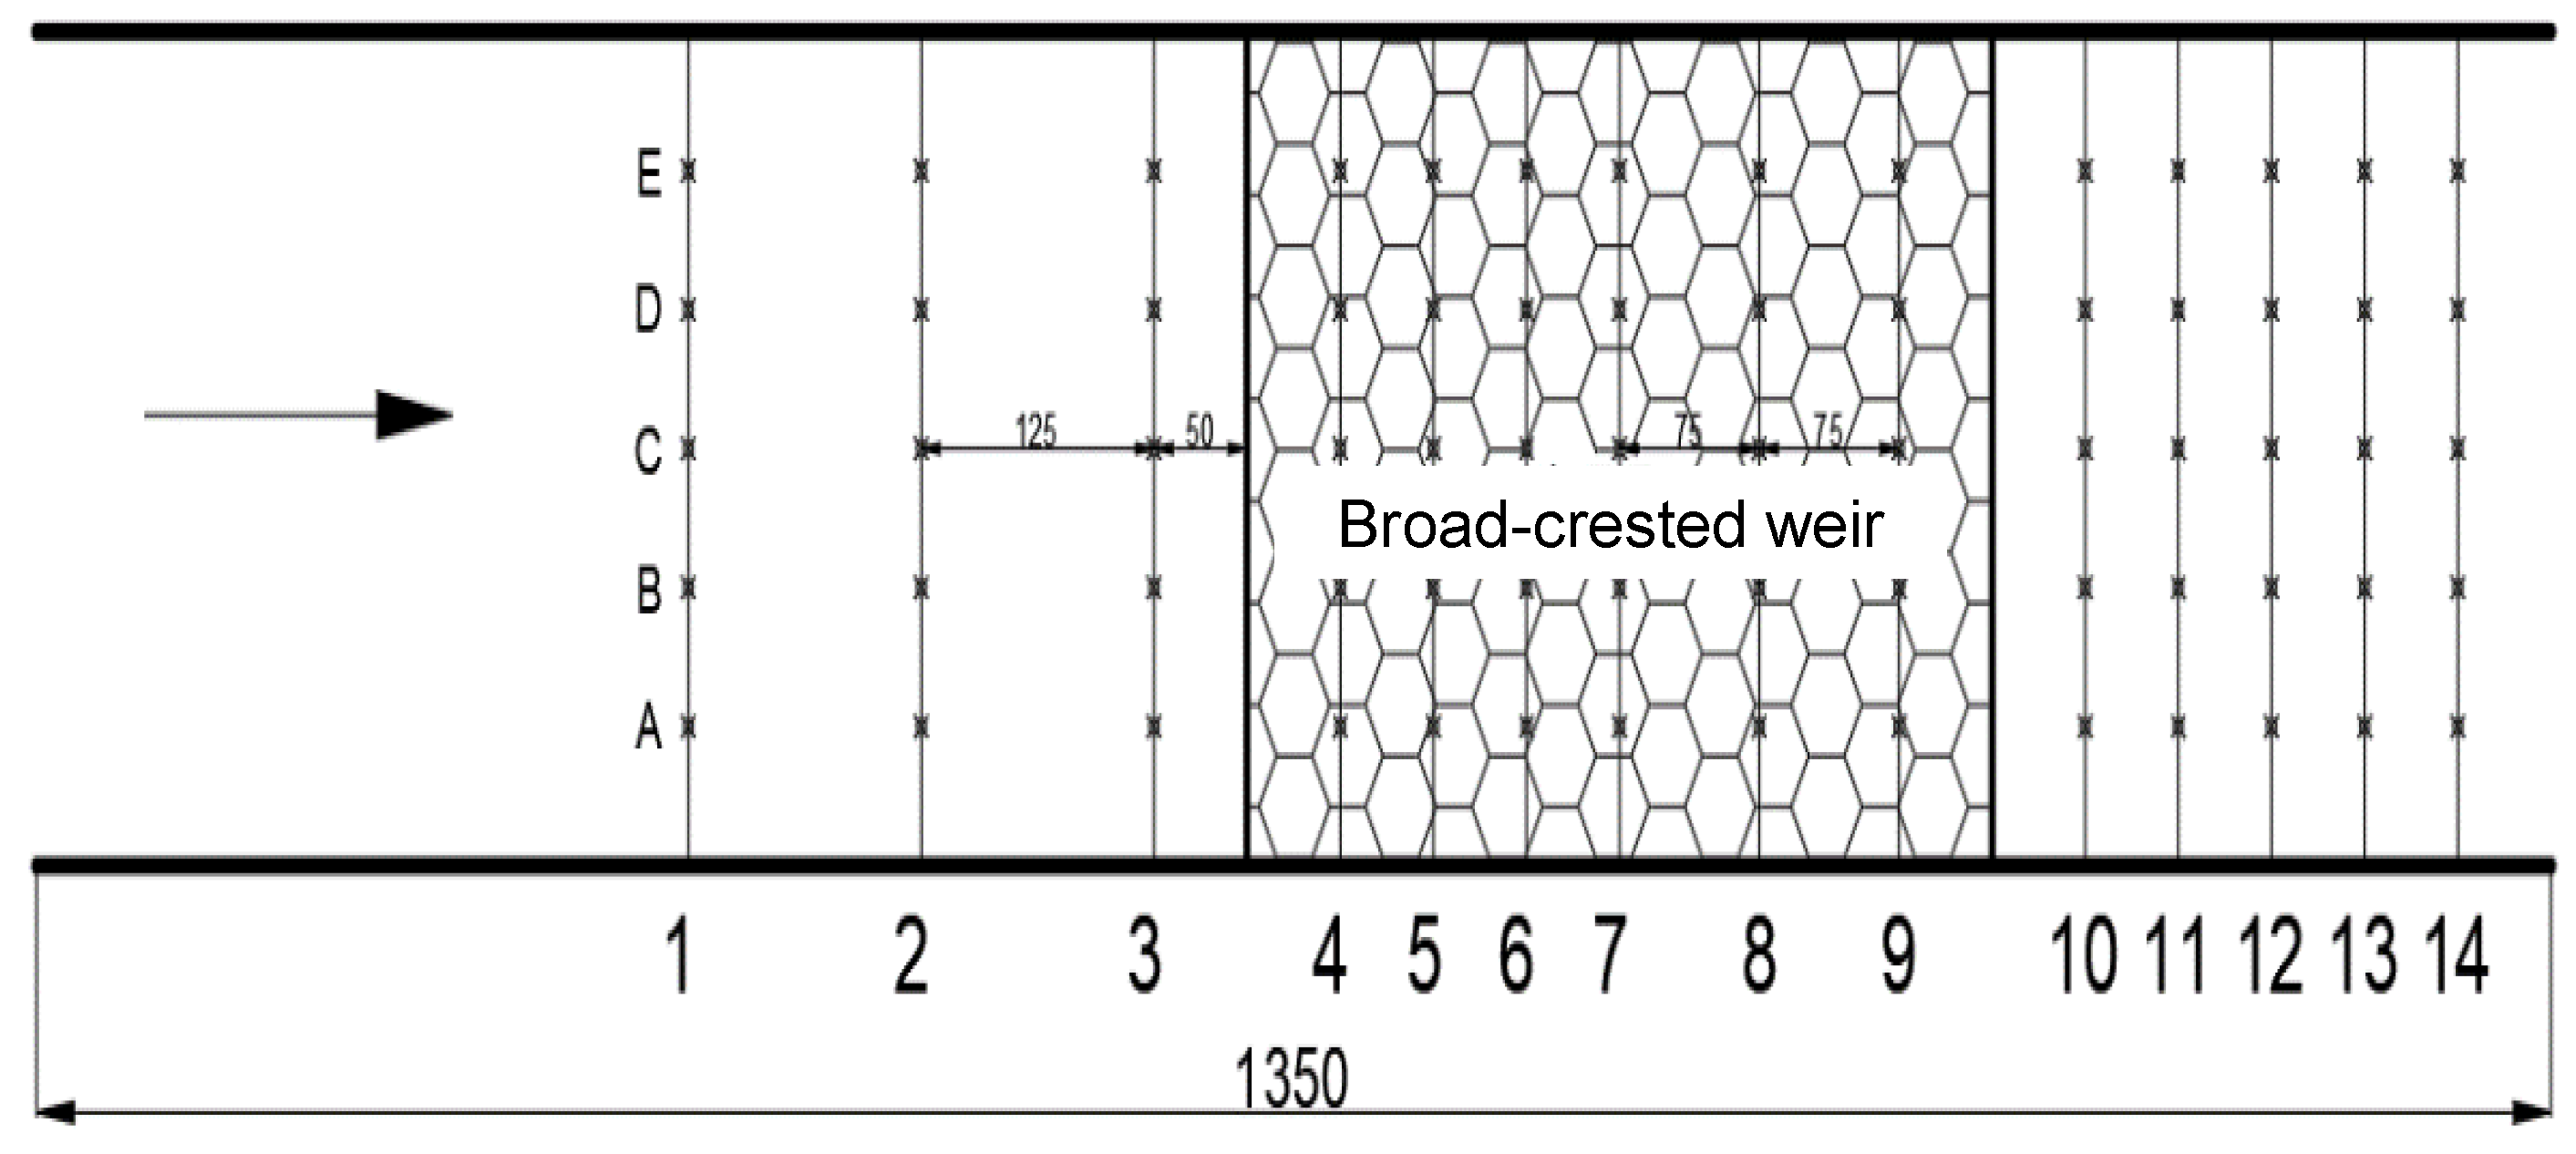
The two physical quantities of water depth and discharge were determined in the test. The water depth is measured with a measuring needle with an accuracy of 0.1 mm. The LGY-II hand-held intelligent flow meter is used to measure the velocity at each measuring point on the water surface. In the test, the method of taking the average of multiple determinations is adopted. The position of each velocity measuring point is set in the computer, and the system will automatically repeat the measurement three times. In order to better observe the flow change over the broad-crested weir, we adopt the method of uneven measuring point layout and increase the measuring points at the place where the flow regime changes greatly. The No. 1 measuring section is the place 30 cm upstream of the broad-crested weir where the water flow is stable, and then measuring sections No. 2–14 are arranged in turn. The distance between adjacent sections is shown in Figure 4. We set five measuring points on the water flow surface of each measuring section along the vertical water flow direction, which are respectively represented by Ai, Bi, Ci, Di, and Ei (i represents the serial number of the measuring section, for example, C5 represents measuring point C on measuring line 5). The surface velocity of the water flow is measured at each measuring point. The midpoint Ci of each measurement section is the water level measurement point. Figure 4 shows the layout of specific measuring sections and measuring points.
2.4. Experimental Case
In the test, the inlet of the broad-crested weir is at a right angle. The fixed weir is 270 mm in width and 150 mm in height. We set five siltation conditions of 0 mm, 50 mm, 70 mm, 100 mm, and 130 mm and five discharge conditions of 20 m3/h, 35 m3/h, 50 m3/h, 65 m3/h, and 75 m3/h. In the experiment, according to the principle of single variable, only one of the many target variables is changed in each case.
2.5. Test Principle
- (1)
- Average velocity of sectionwhere Q is the discharge, v is the average velocity of the discharge section, and A is the discharge section area.
- (2)
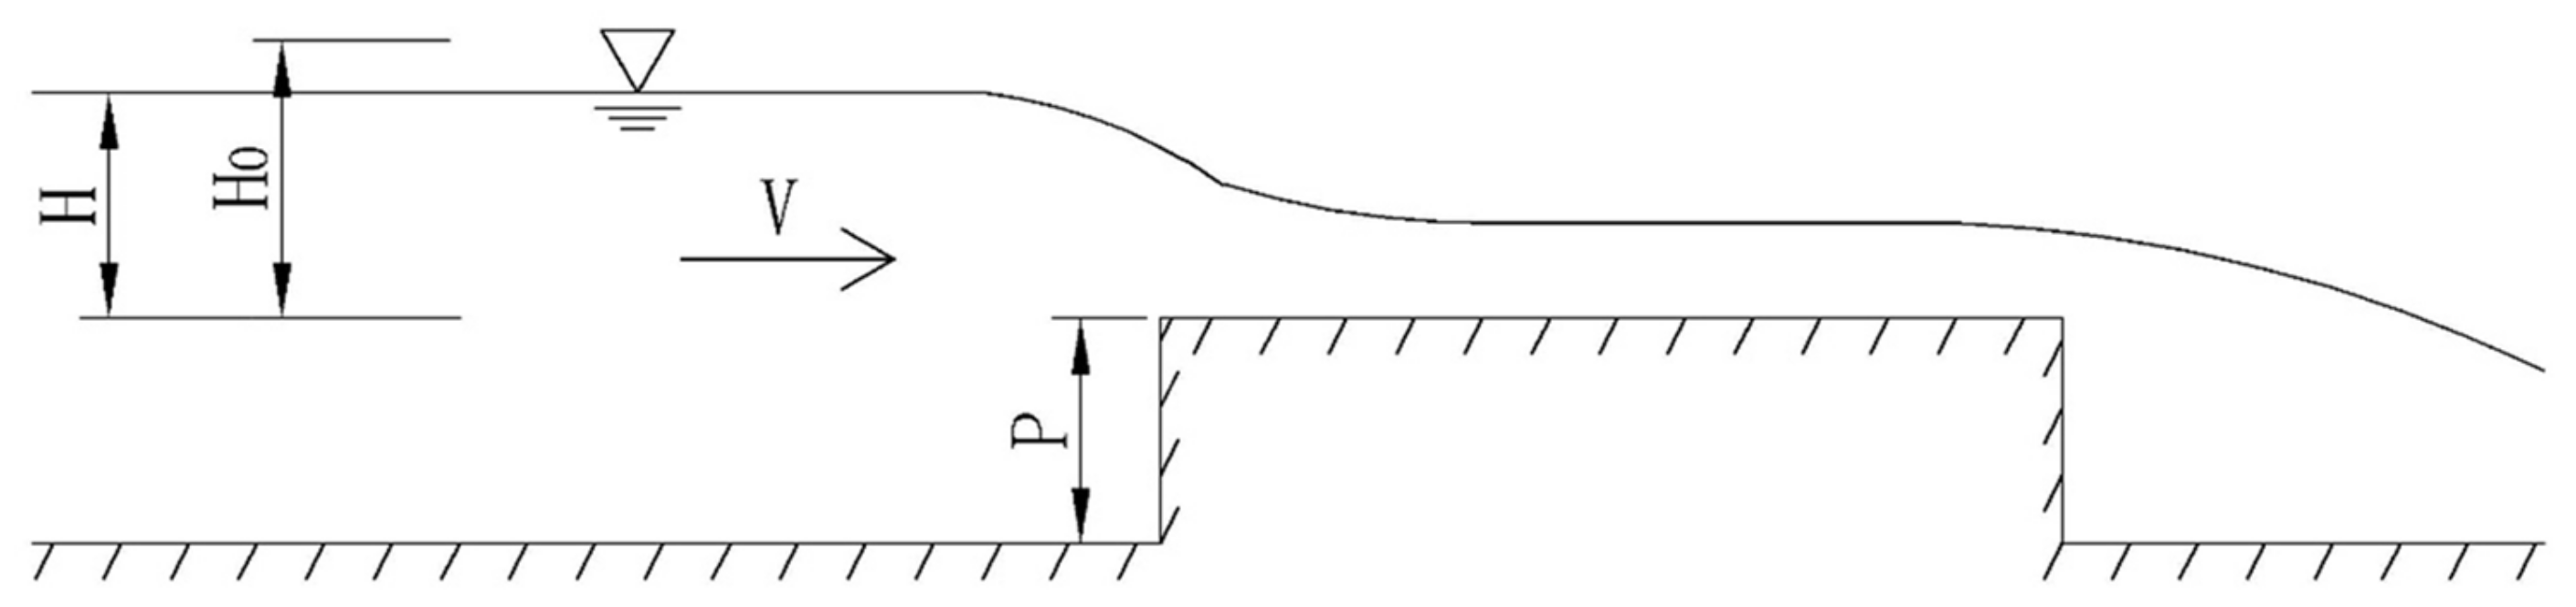
- Total hydraulic head over the weirwhere H0 is the total head over the weir; H is the hydraulic head, that is, the height of the upstream water surface above the weir crest; V0 is the average velocity of the discharge section.
- (3)
- Discharge calculation formula of the weirwhere Q is the discharge; is the submergence coefficient; is the coefficient of lateral shrinkage; m is discharge coefficient; b is width of the weir; H0 is the total head over the weir.
Figure 5 shows the free outflow of the broad-crested weir. In this test, the lateral shrinkage coefficient ε = 1, and the flow is free outflow. Thus, the discharge coefficient can be inversely deduced using the weir flow formula:
3. Results
The physical experimental study of the hydraulic characteristics of a broad-crested weir with a width of 270 mm at different sediment heights mainly includes the flow pattern, water depth, velocity, and the empirical equation of the discharge coefficient with the sediment.
3.1. Flow Pattern
The test used a broad-crested weir model with a sidewall height of 400 mm. The maximum value of hydraulic head on the weir was 138 mm and the minimum value was 61 mm for all cases, which is the standard flow pattern of a broad-crested weir. The test shows that the flow pattern of water is overall stable and uniformly distributed. In the free-outflow case, the increase in discharge raises the overall water surface, while the increase in siltation height lowers the water surface slightly. In the low-discharge case (e.g., Q = 20 m3/h and Q = 35 m3/h) the water level over the weir decreases more obviously as the siltation height increases. The water level decreases significantly when the siltation height increases to 13 cm, and the overall flow pattern is close to the open channel. In the high-discharge case, the change in siltation height has less influence on the flow pattern, and the overall flow pattern is still presented as a broad-created weir flow pattern.
3.2. Variation in Water Surface Profile along the Weir
3.2.1. Influence of Discharge on the Level of Flow at the Same Siltation Height
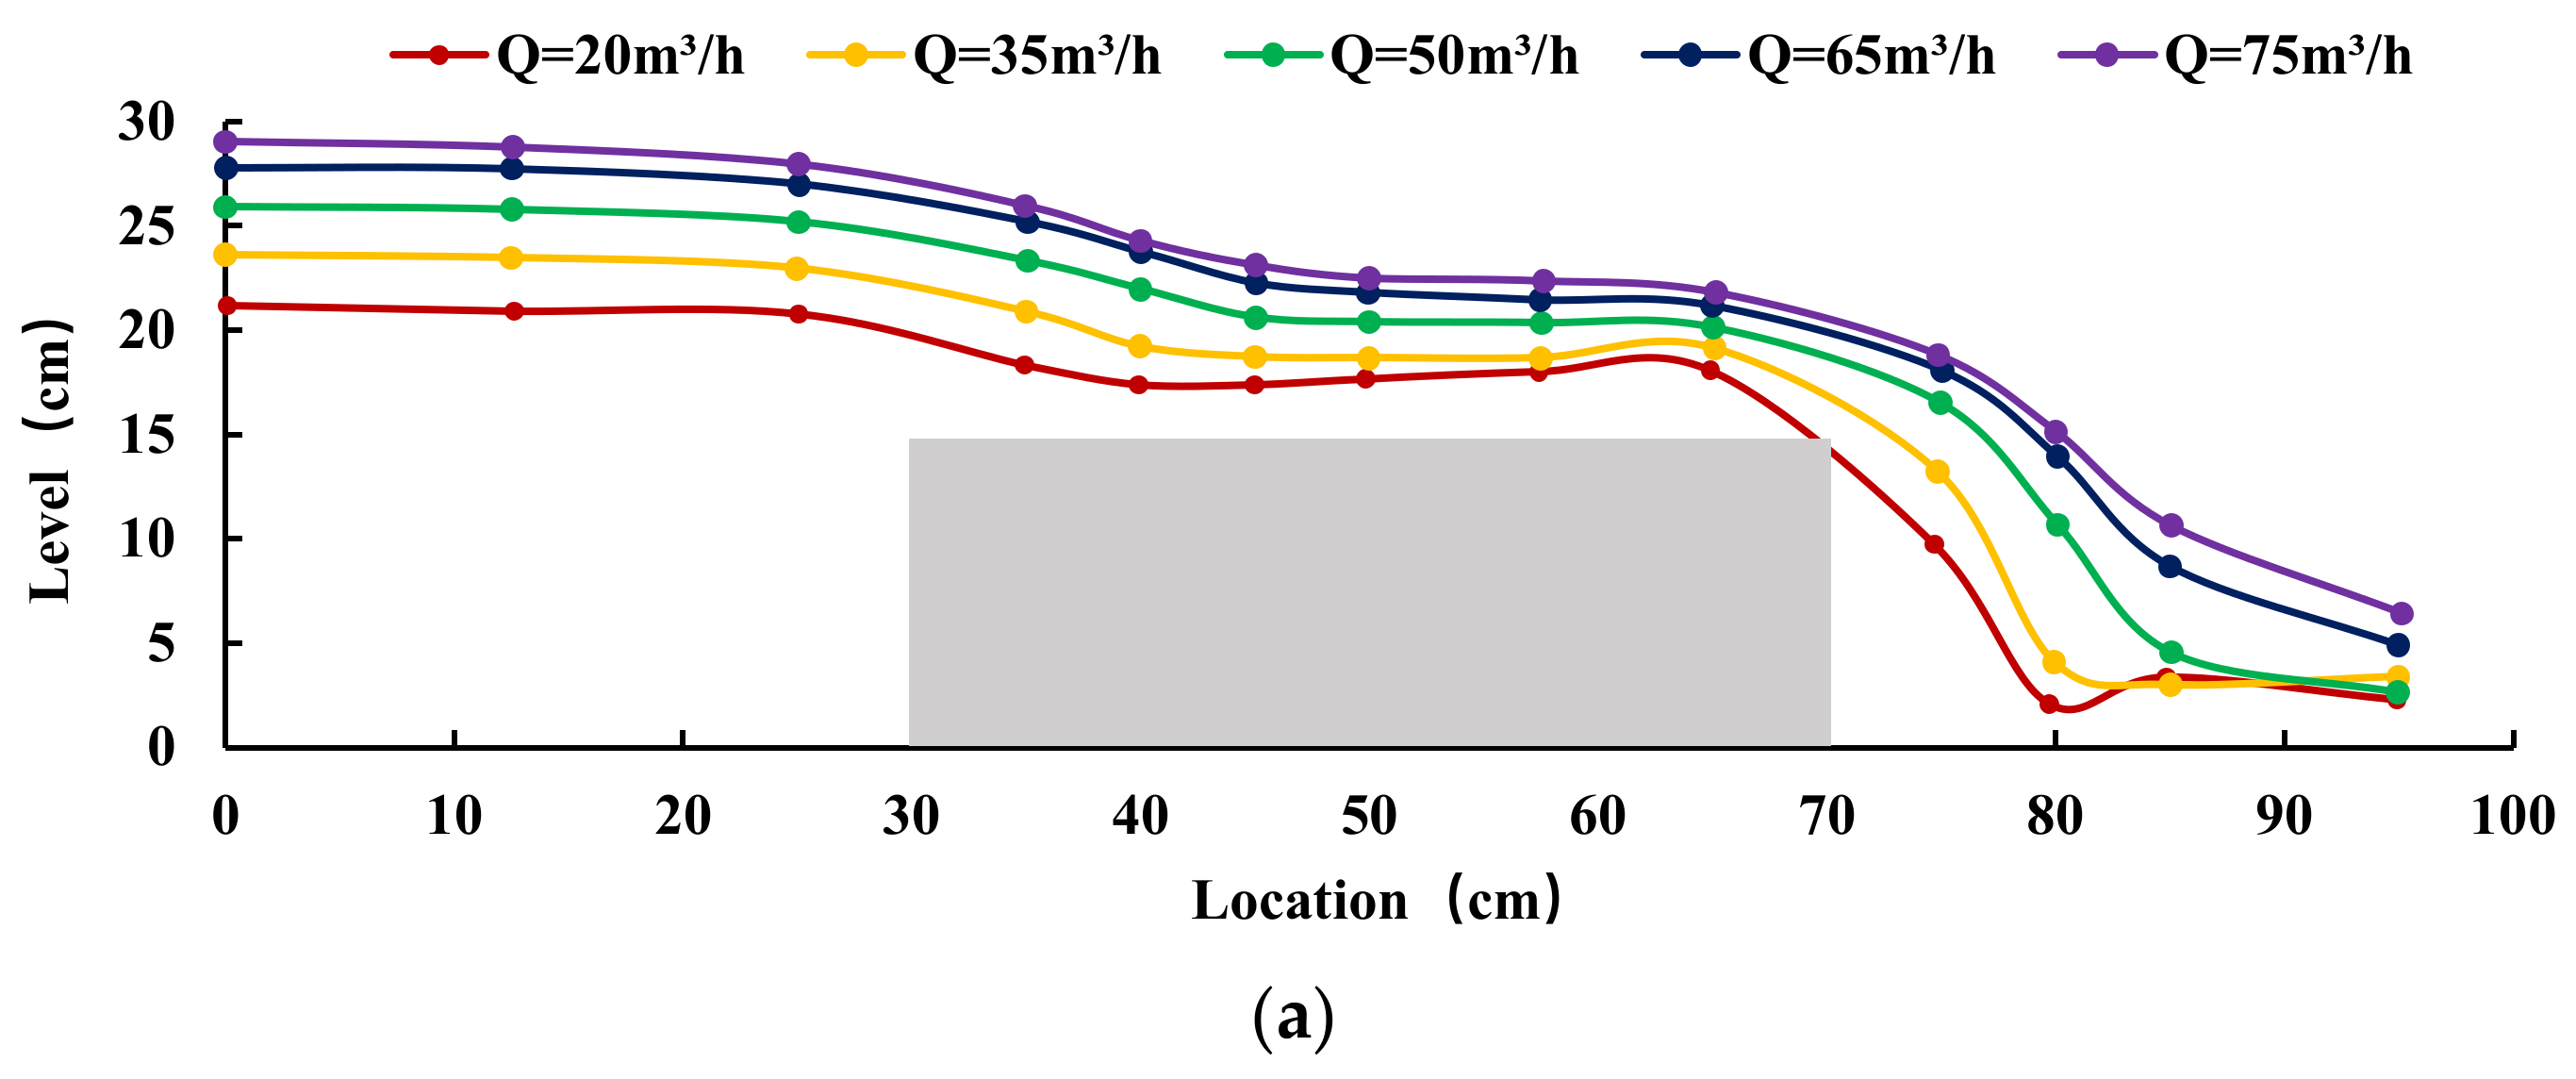
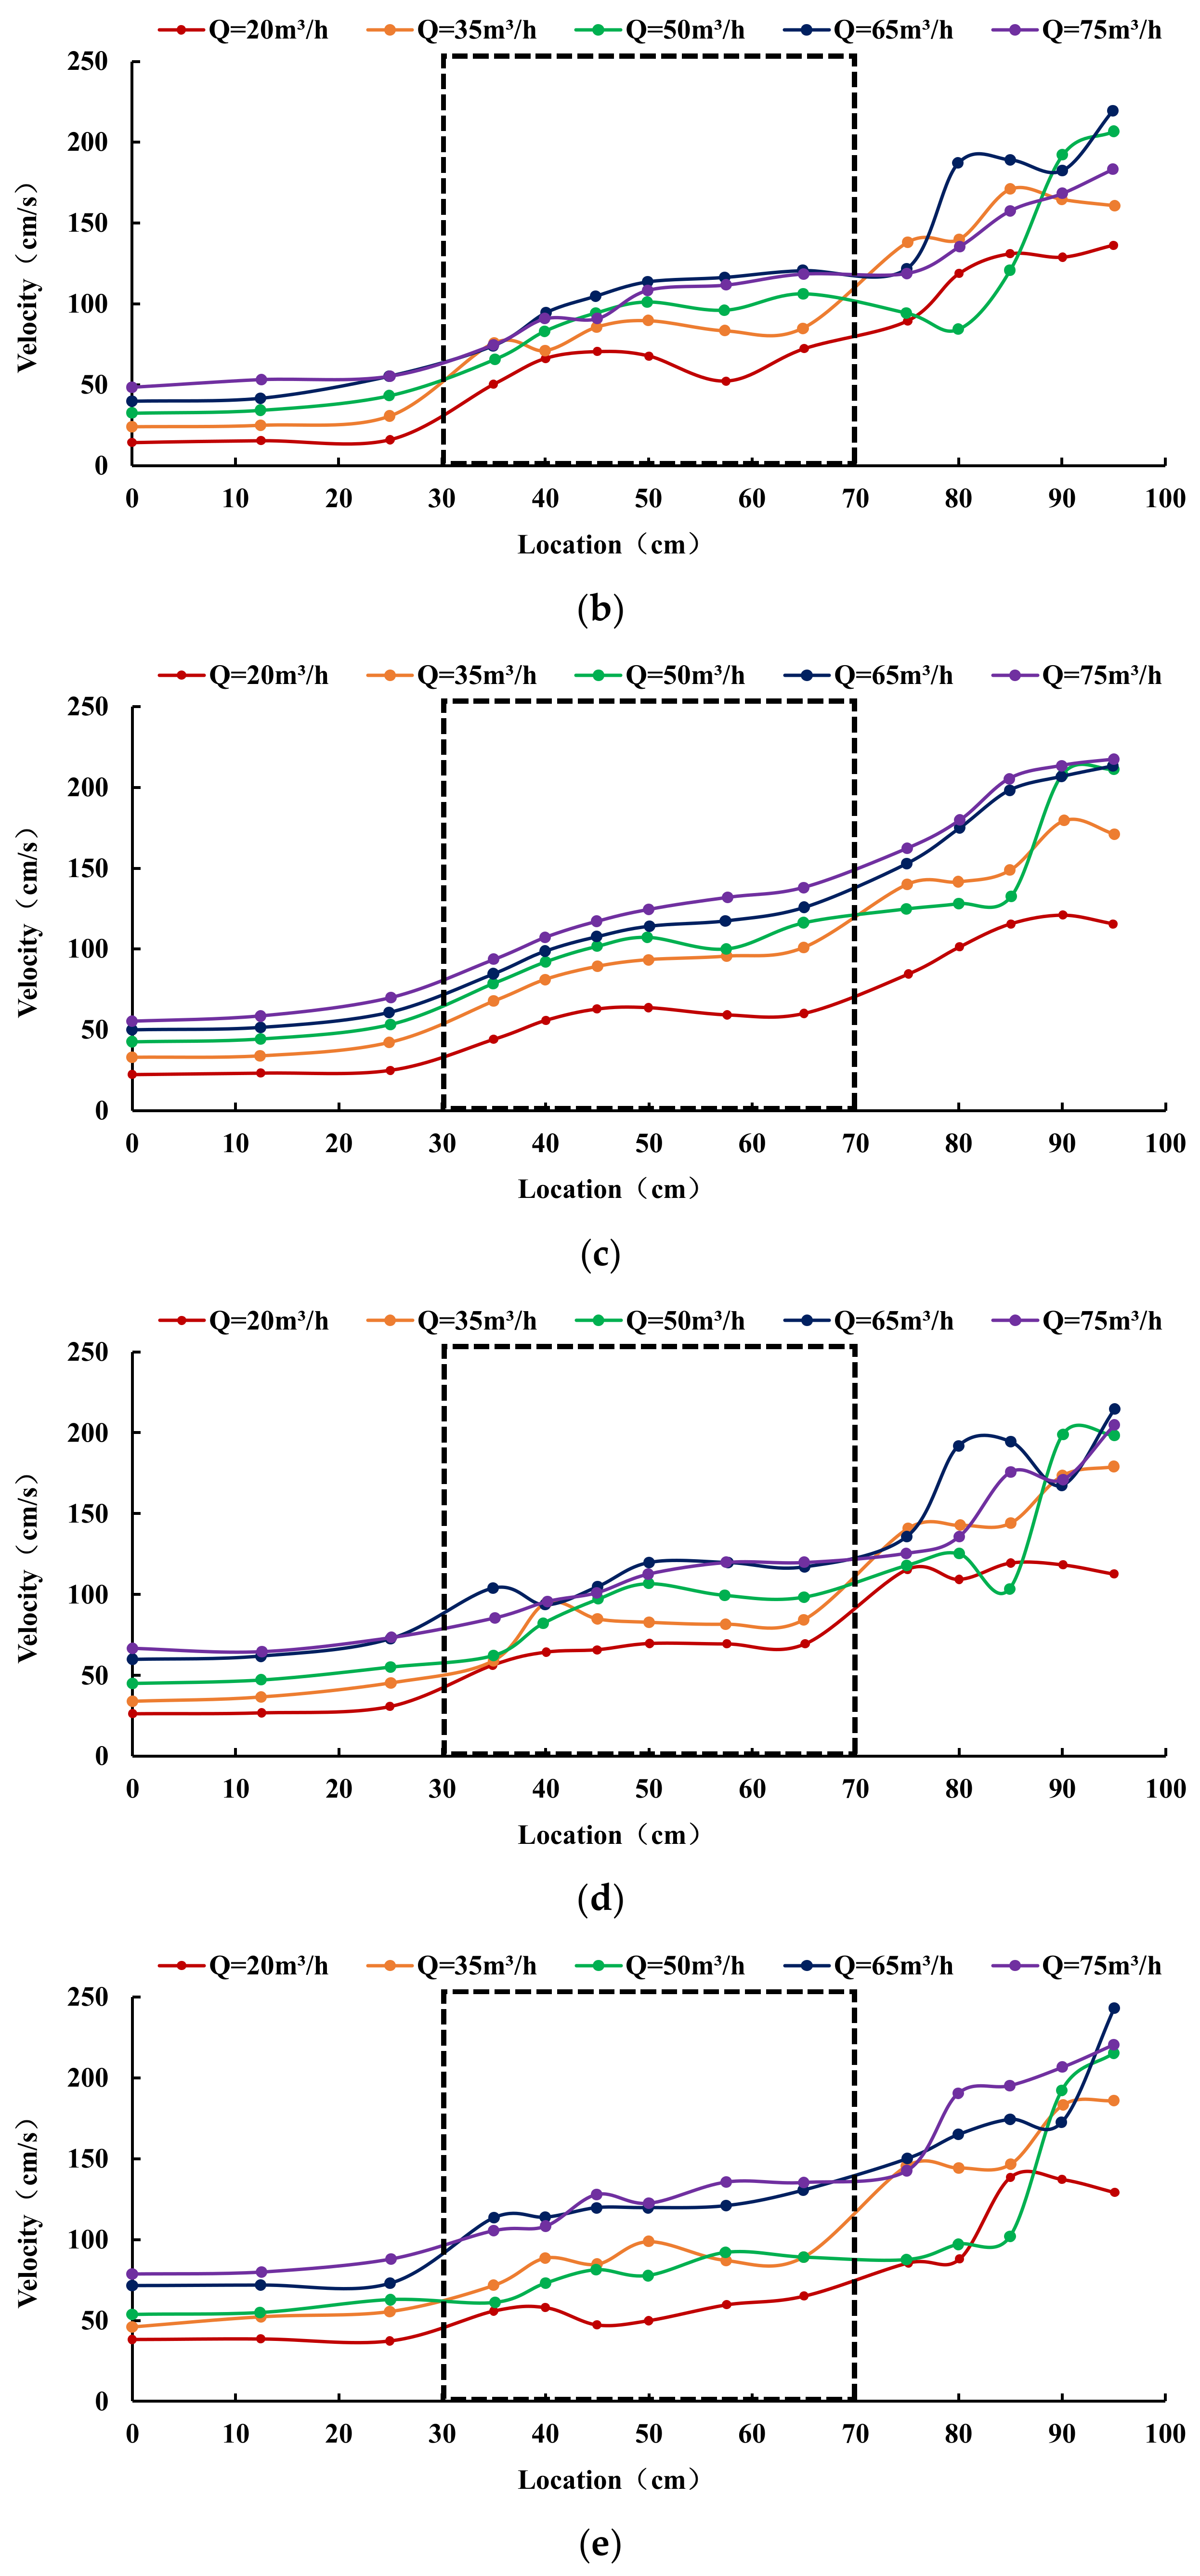
The surface profile along the flow is an important indicator for analyzing the effect of sedimentation height on the hydraulic characteristics of broad-crested weirs. Based on the measured data at each measurement point in the test, we plotted the water surface profile along the flow at the same siltation height for a discharge of 20 m3/h, 35 m3/h, 50 m3/h, 65 m3/h, and 75 m3/h, as shown in Figure 6.
It can be seen from Figure 6 that the shape of the water surface profile along the flow under different sedimentation heights is roughly similar. That is, due to the backwater effect of the broad-crested weir, the water surface profile is approximately a straight line at 3–5 times H from the upstream weir wall. The water level begins to fall when closing to the upstream position of the weir, and then the water surface profile is close to the horizontal state due to the top-supporting effect of the broad-crested weir. After that, the water level falls again at the downstream position of the weir, until it falls into the flat channel and is horizontal again.
With the increase in discharge Q, the water surface profile along the flow maintained the overall trend of elevation under each siltation height condition, but the magnitude of the water surface profile change was different at different locations along the range. In the 0–30 cm measurement section, the water level changes more obviously at the upstream position of the broad-crested weir, which is strongly influenced by the congestion effect of the broad-crested weir, and the water level changes more in the range of 2–3 cm under the adjacent flow conditions. In the 70–100 cm measurement section, the downstream position of the wide-top weir in this section, the water surface fluctuates more and the flow pattern is more turbulent due to the water falling from the wide-top weir, and the water level changes in a larger range.
3.2.2. Influence of Siltation Height on the Level of Flow at the Same Discharge
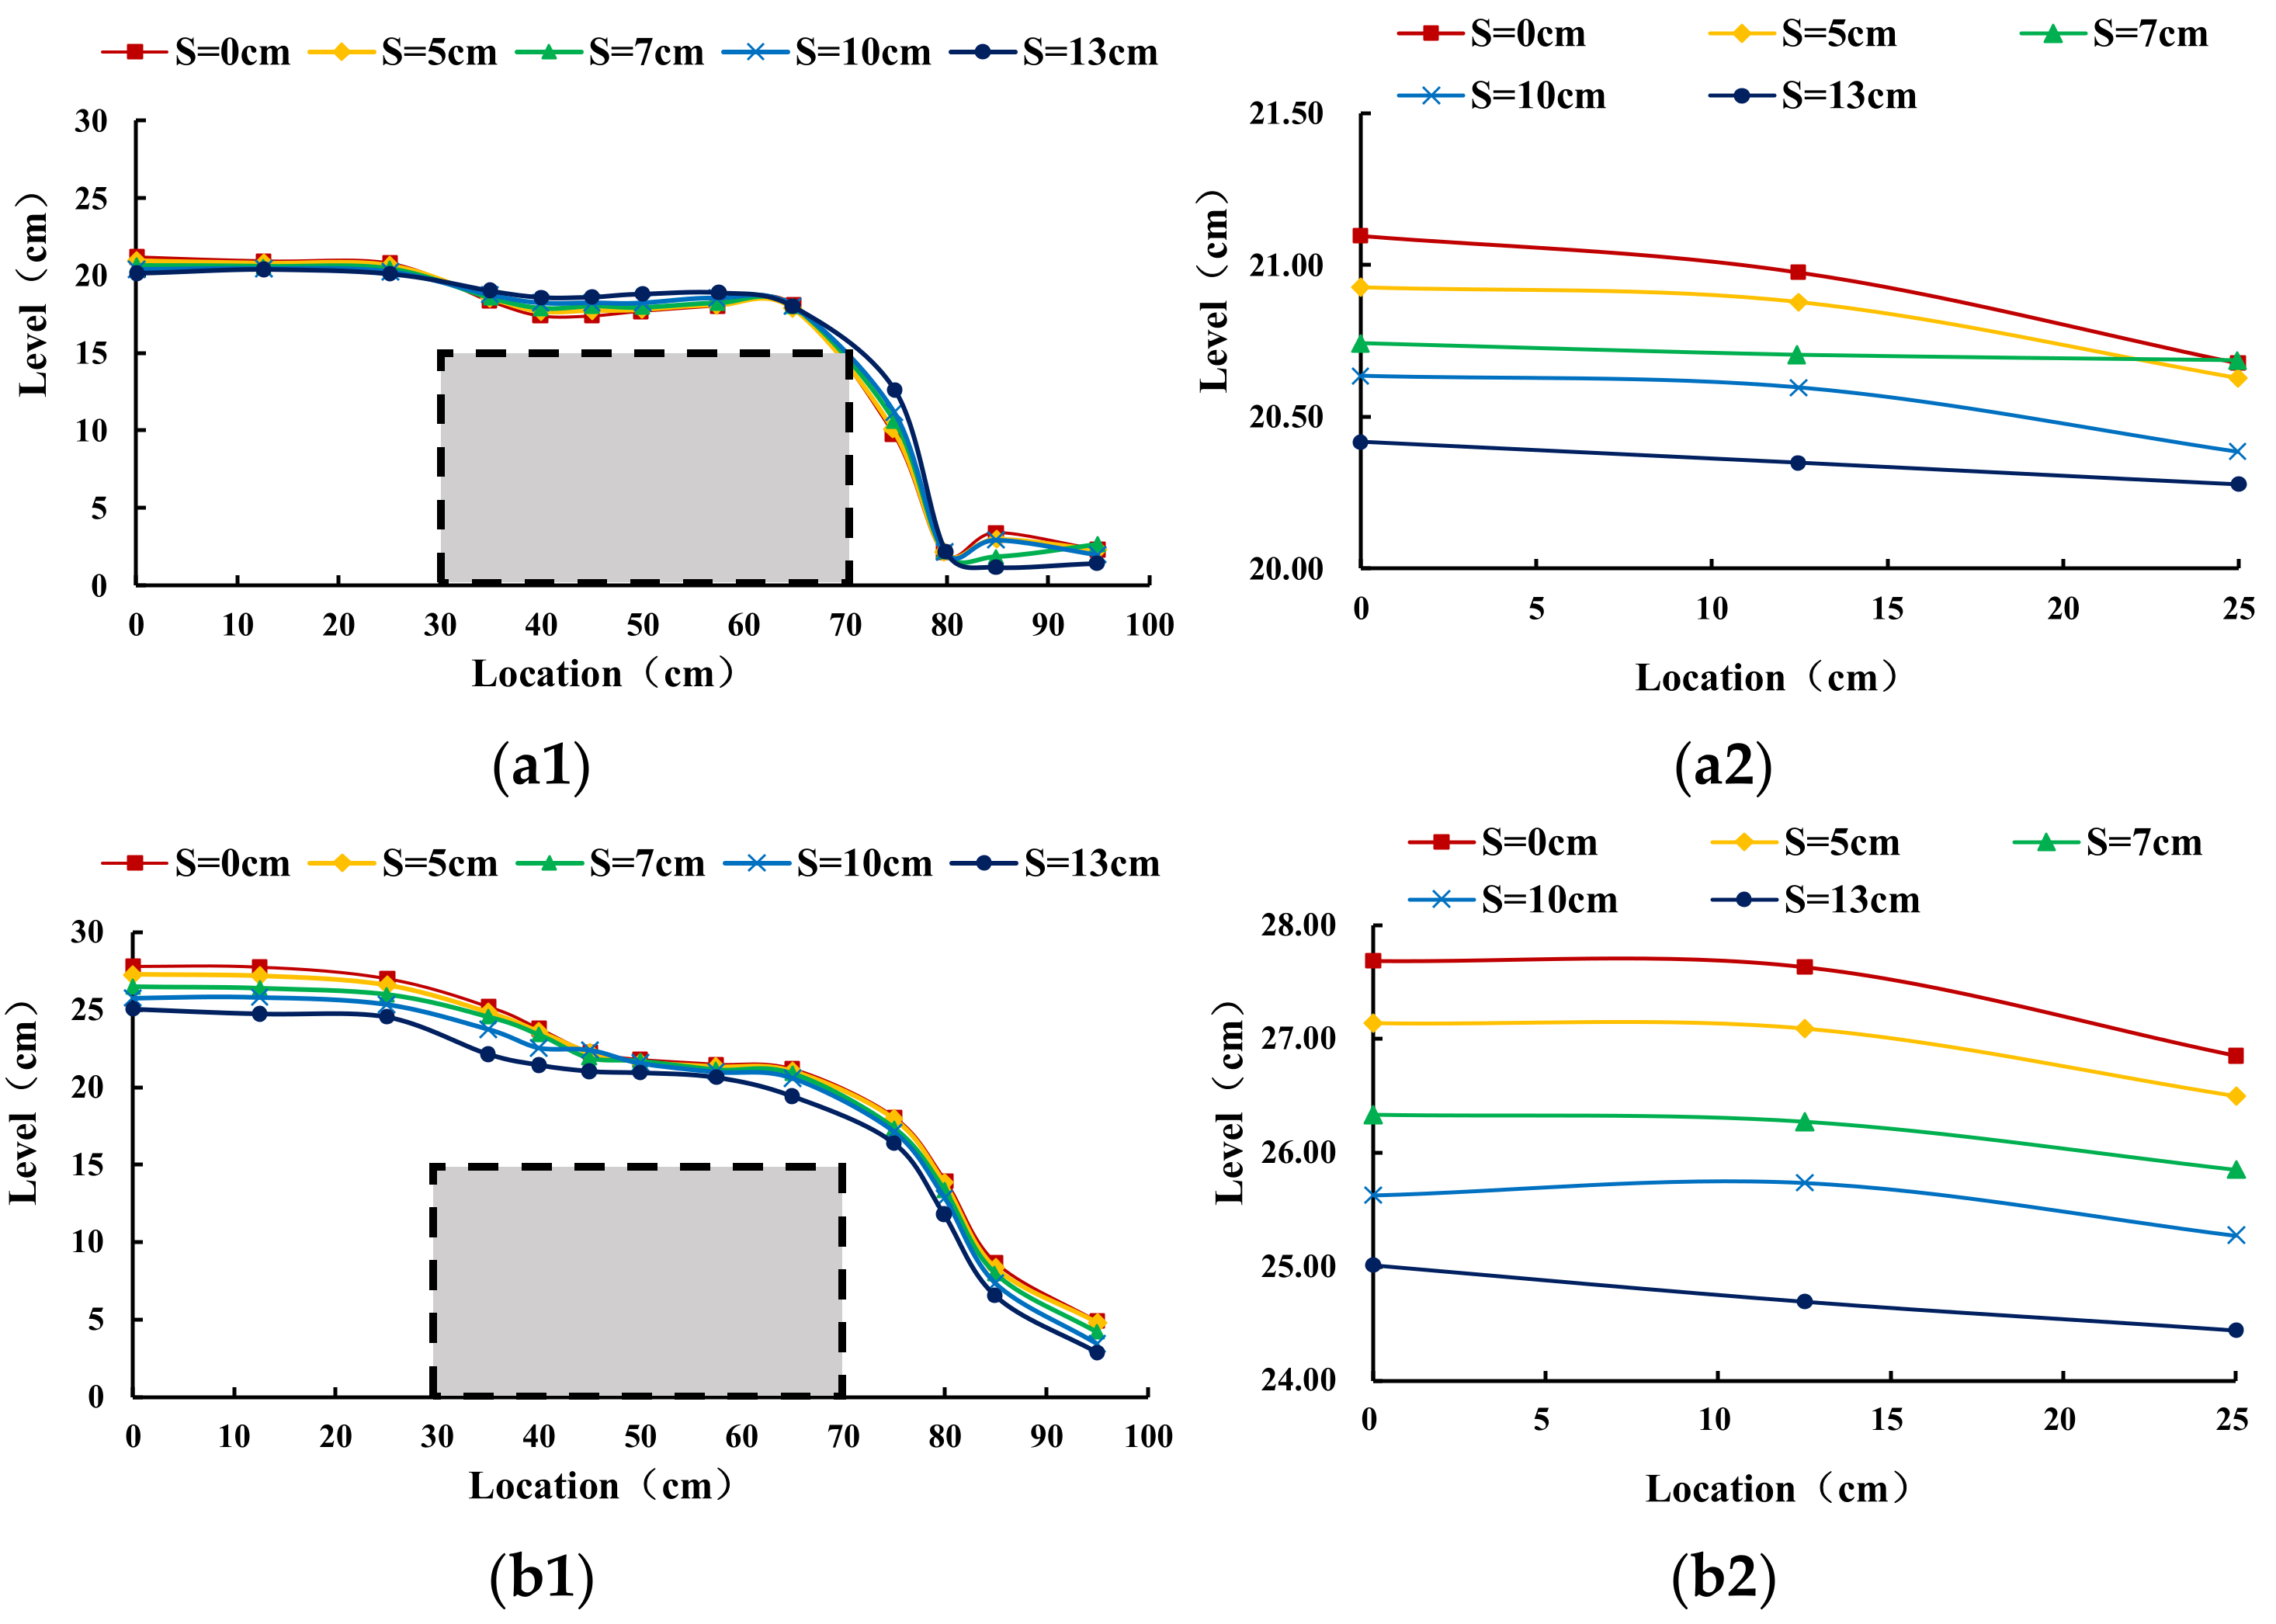
From Figure 7, it can be seen that the influence of siltation height on the surface profile of the flow is mainly concentrated in the upstream section of the broad-crested weir (within the measurement section 0–30 cm), while over the broad-crested weir and its downstream section (within the section 30–100 cm) are less influenced. Under the same discharge condition, the upstream water level of the broad-crested weir is inversely proportional to the siltation height. The water level upstream of the weir shows a decreasing trend with the increase in siltation height, and the trend is still maintained under each discharge condition. The minimum drop in water level is 0.11 cm and the maximum is 0.80 cm between adjacent siltation height conditions in the first measurement section (30 cm in front of the weir), the minimum change is Q = 20 m3/h, and the maximum change is Q = 65 m3/h. Taking the discharge Q = 20 m3/h as an example, at a siltation height of S = 0 cm, S = 5 cm, S = 7 cm, S = 10 cm, and S = 13 cm, the water surface profile reduction values of the adjacent siltation height in the first measurement section (30 cm before the weir) are 0.17 cm, 0.18 cm, 0.11 cm, and 0.22 cm, respectively, and the rates of change in the water surface line from the previous siltation height are 0.81%, 0.86%, 0.53%, and 1.06%, respectively. Compared with a discharge of Q = 20 m3/h, when the discharge was Q = 65 m3/h, the decrease in the water surface profile in the adjacent siltation height of the first measurement section (30 cm before the weir) is 0.55 cm, 0.80 cm, 0.72 cm, and 0.61 cm, respectively, and the rate of change in the water surface profile from the last siltation height is 1.99%, 2.95%, 2.73%, and 2.38%, respectively. The above analysis shows that the change in siltation height can affect the magnitude of the water surface profile of the weir flow, but the intensity of this effect is related to the discharge. The change in siltation height has the least effect on the surface line of weir flow at an incoming flow rate of Q = 20 m3/h, and the greatest effect is at a discharge of Q = 65 m3/h. The trend in the change in siltation height on the surface profile of the flow is as follows: with an increase in the siltation height, the surface profile of the flow under the same discharge condition gradually decreases.
3.3. Distribution of the Velocity along the Weir
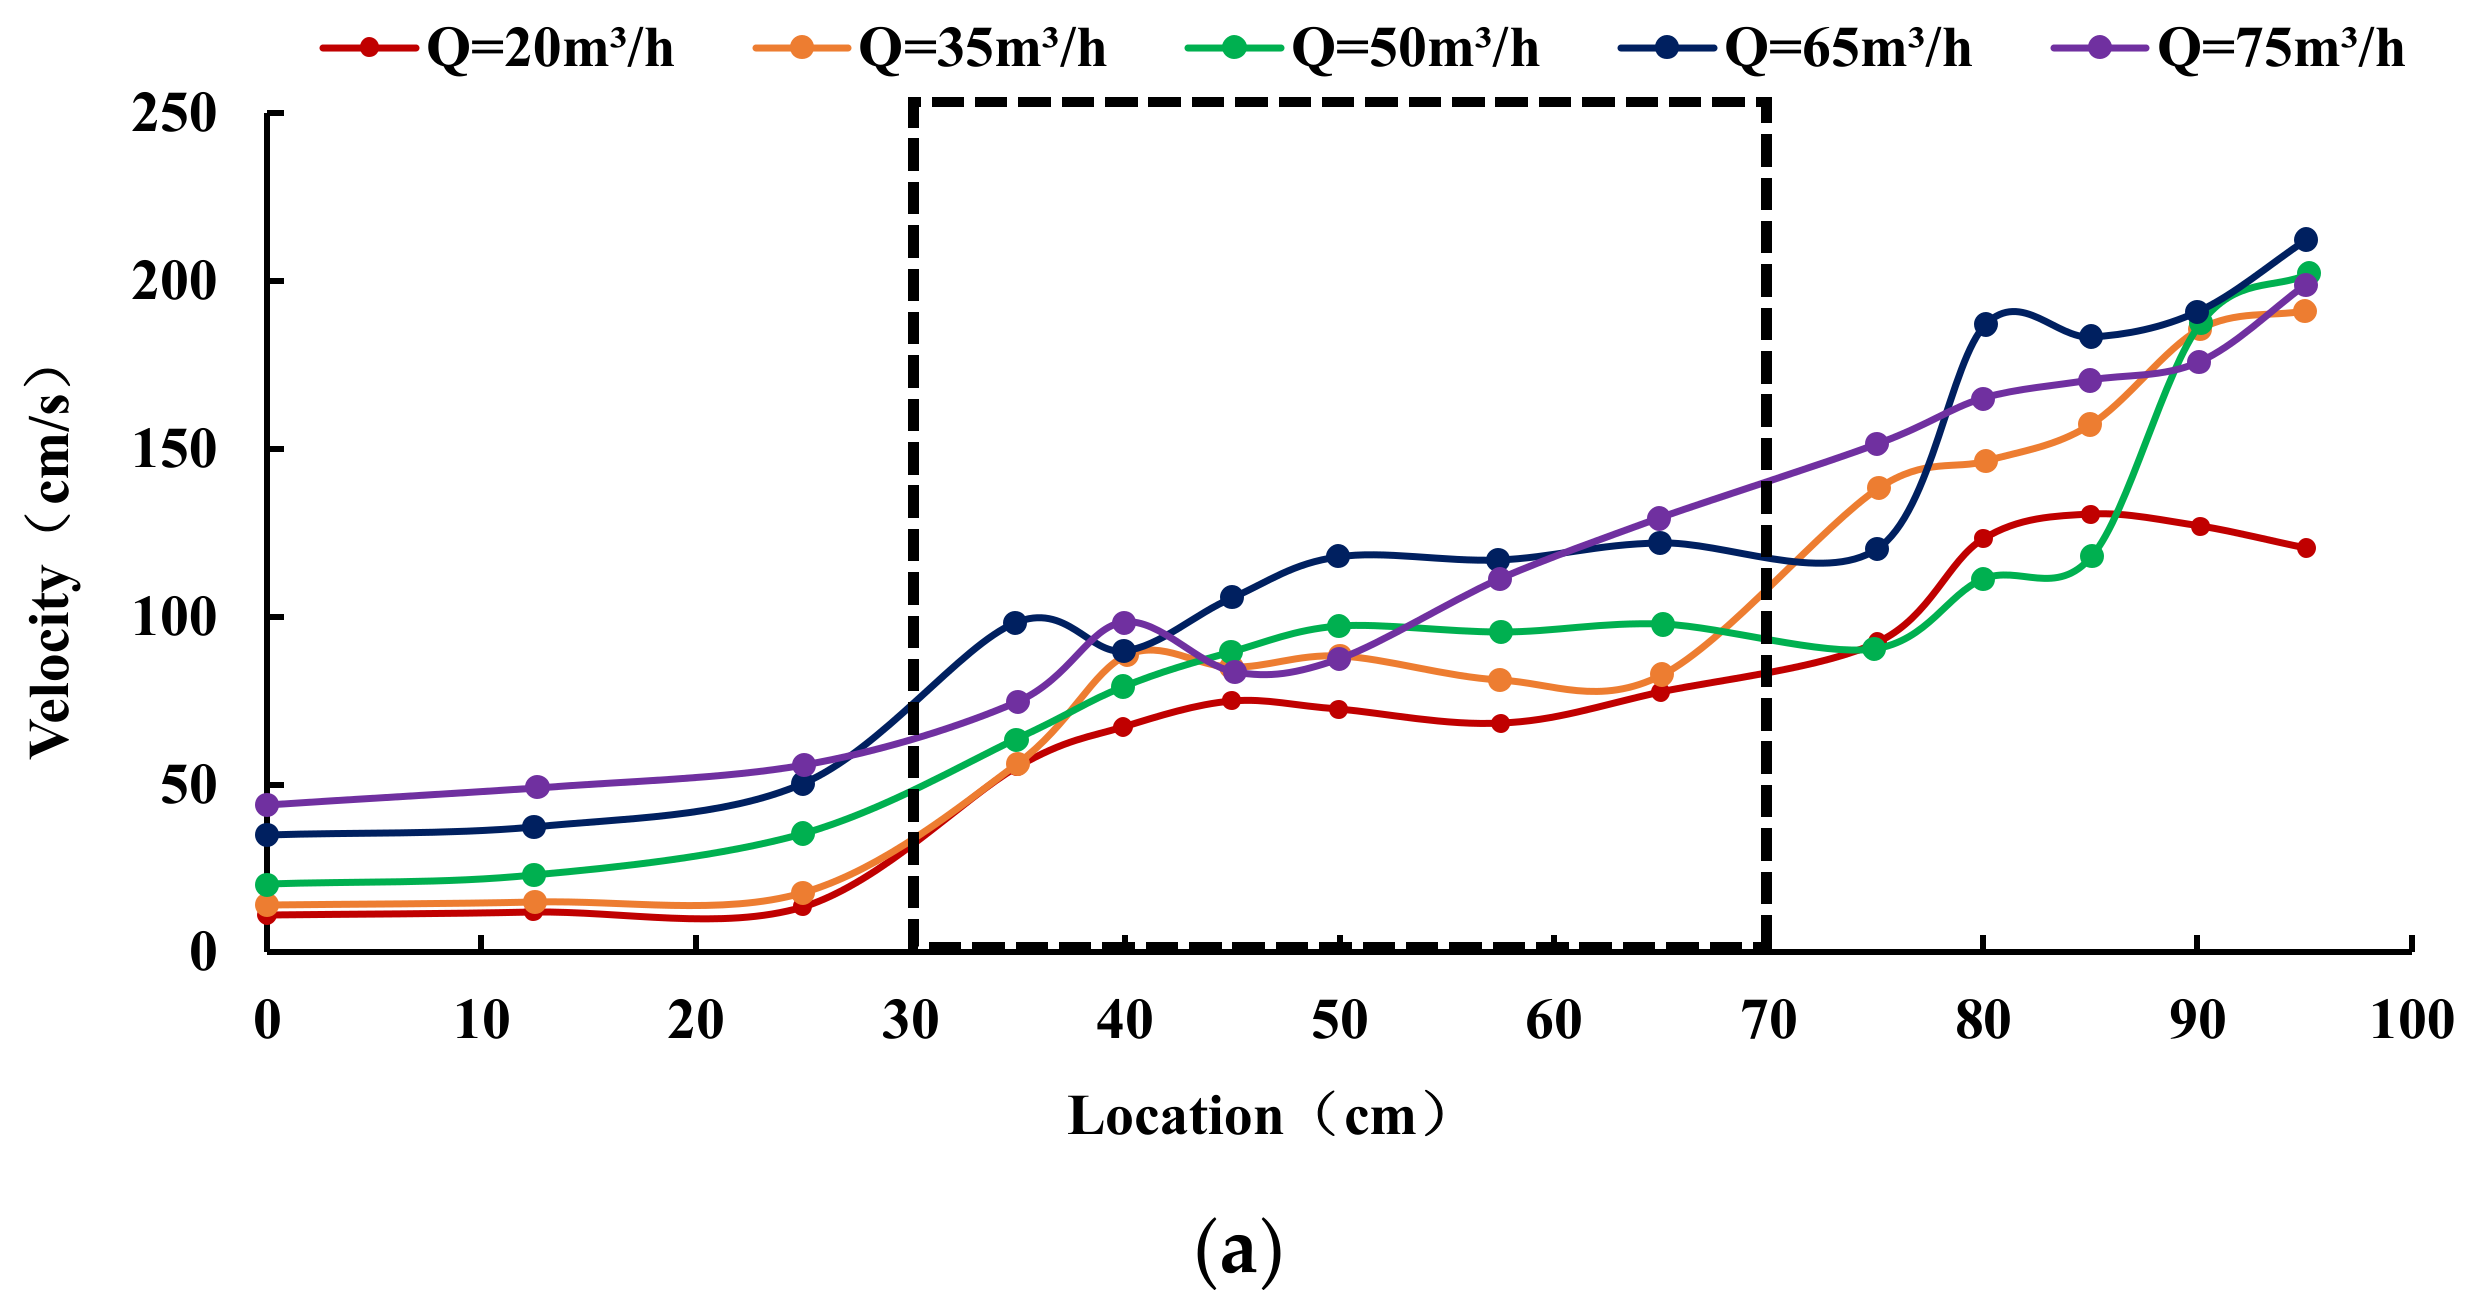
3.3.1. Influence of Discharge on the Velocity of Flow at the Same Siltation Height
According to the data from each measurement point in the test, we plotted the along-range velocity distribution of the water surface at the same discharge, including the siltation height of 0 cm, 5 cm, 7 cm, 10 cm, and 13 cm for each case. Through sorting and analyzing the test data, it is found that the surface velocity distribution along the A, B, C, D, and E horizontal axes (Figure 4) is similar. Therefore, the surface velocity distribution along the C axis is plotted as an example, as shown in Figure 8.
It can be seen from Figure 8 that the overall trend in surface velocity along the weir flow is more consistent for each discharge condition. Except for the surge in flow velocity at the top and bottom edges of the weir, the overall flow velocity of the weir shows a general trend of steady increase along the course. Comparing the graphs of the velocity at different discharge conditions, it can also be seen that the velocity increases gradually with an increase in the discharge. Taking the siltation height S = 0 cm as an example, the velocity changes smoothly at the position before the weir (measurement interval 0–25 cm), and the overall velocity distribution is close to horizontal. Therefore, under the same siltation conditions, the velocity maintains an increasing trend with discharge. At the upper edge of the weir (measurement interval 25–35 cm), a surge in velocity was observed in all cases. The main reason for this is that the boundary conditions of the weir have changed and the cross section has suddenly contracted, resulting in a change from gradual to rapid flow and a more intensive streamline. In the position over the weir (measurement interval 35–65 cm) the velocity changes more smoothly, but still maintains a slowly increasing trend. This is mainly due to the top-supporting effect of the broad-crested weir on the flow: there is a more horizontal water surface profile after the water drops, so the velocity changes more smoothly. However, because the water surface profile as a whole gradually decreases, the velocity will also gradually increase. At the position of the edge under the weir (measurement interval 65–75 cm), a second surge of velocity occurs at each flow condition. This is mainly due to the rapid increase in velocity caused by the change of gravitational potential energy into kinetic energy due to the flow from the weir down into the channel at this location, and the decrease in water depth in this section also intensifies the rapid increase in the velocity.
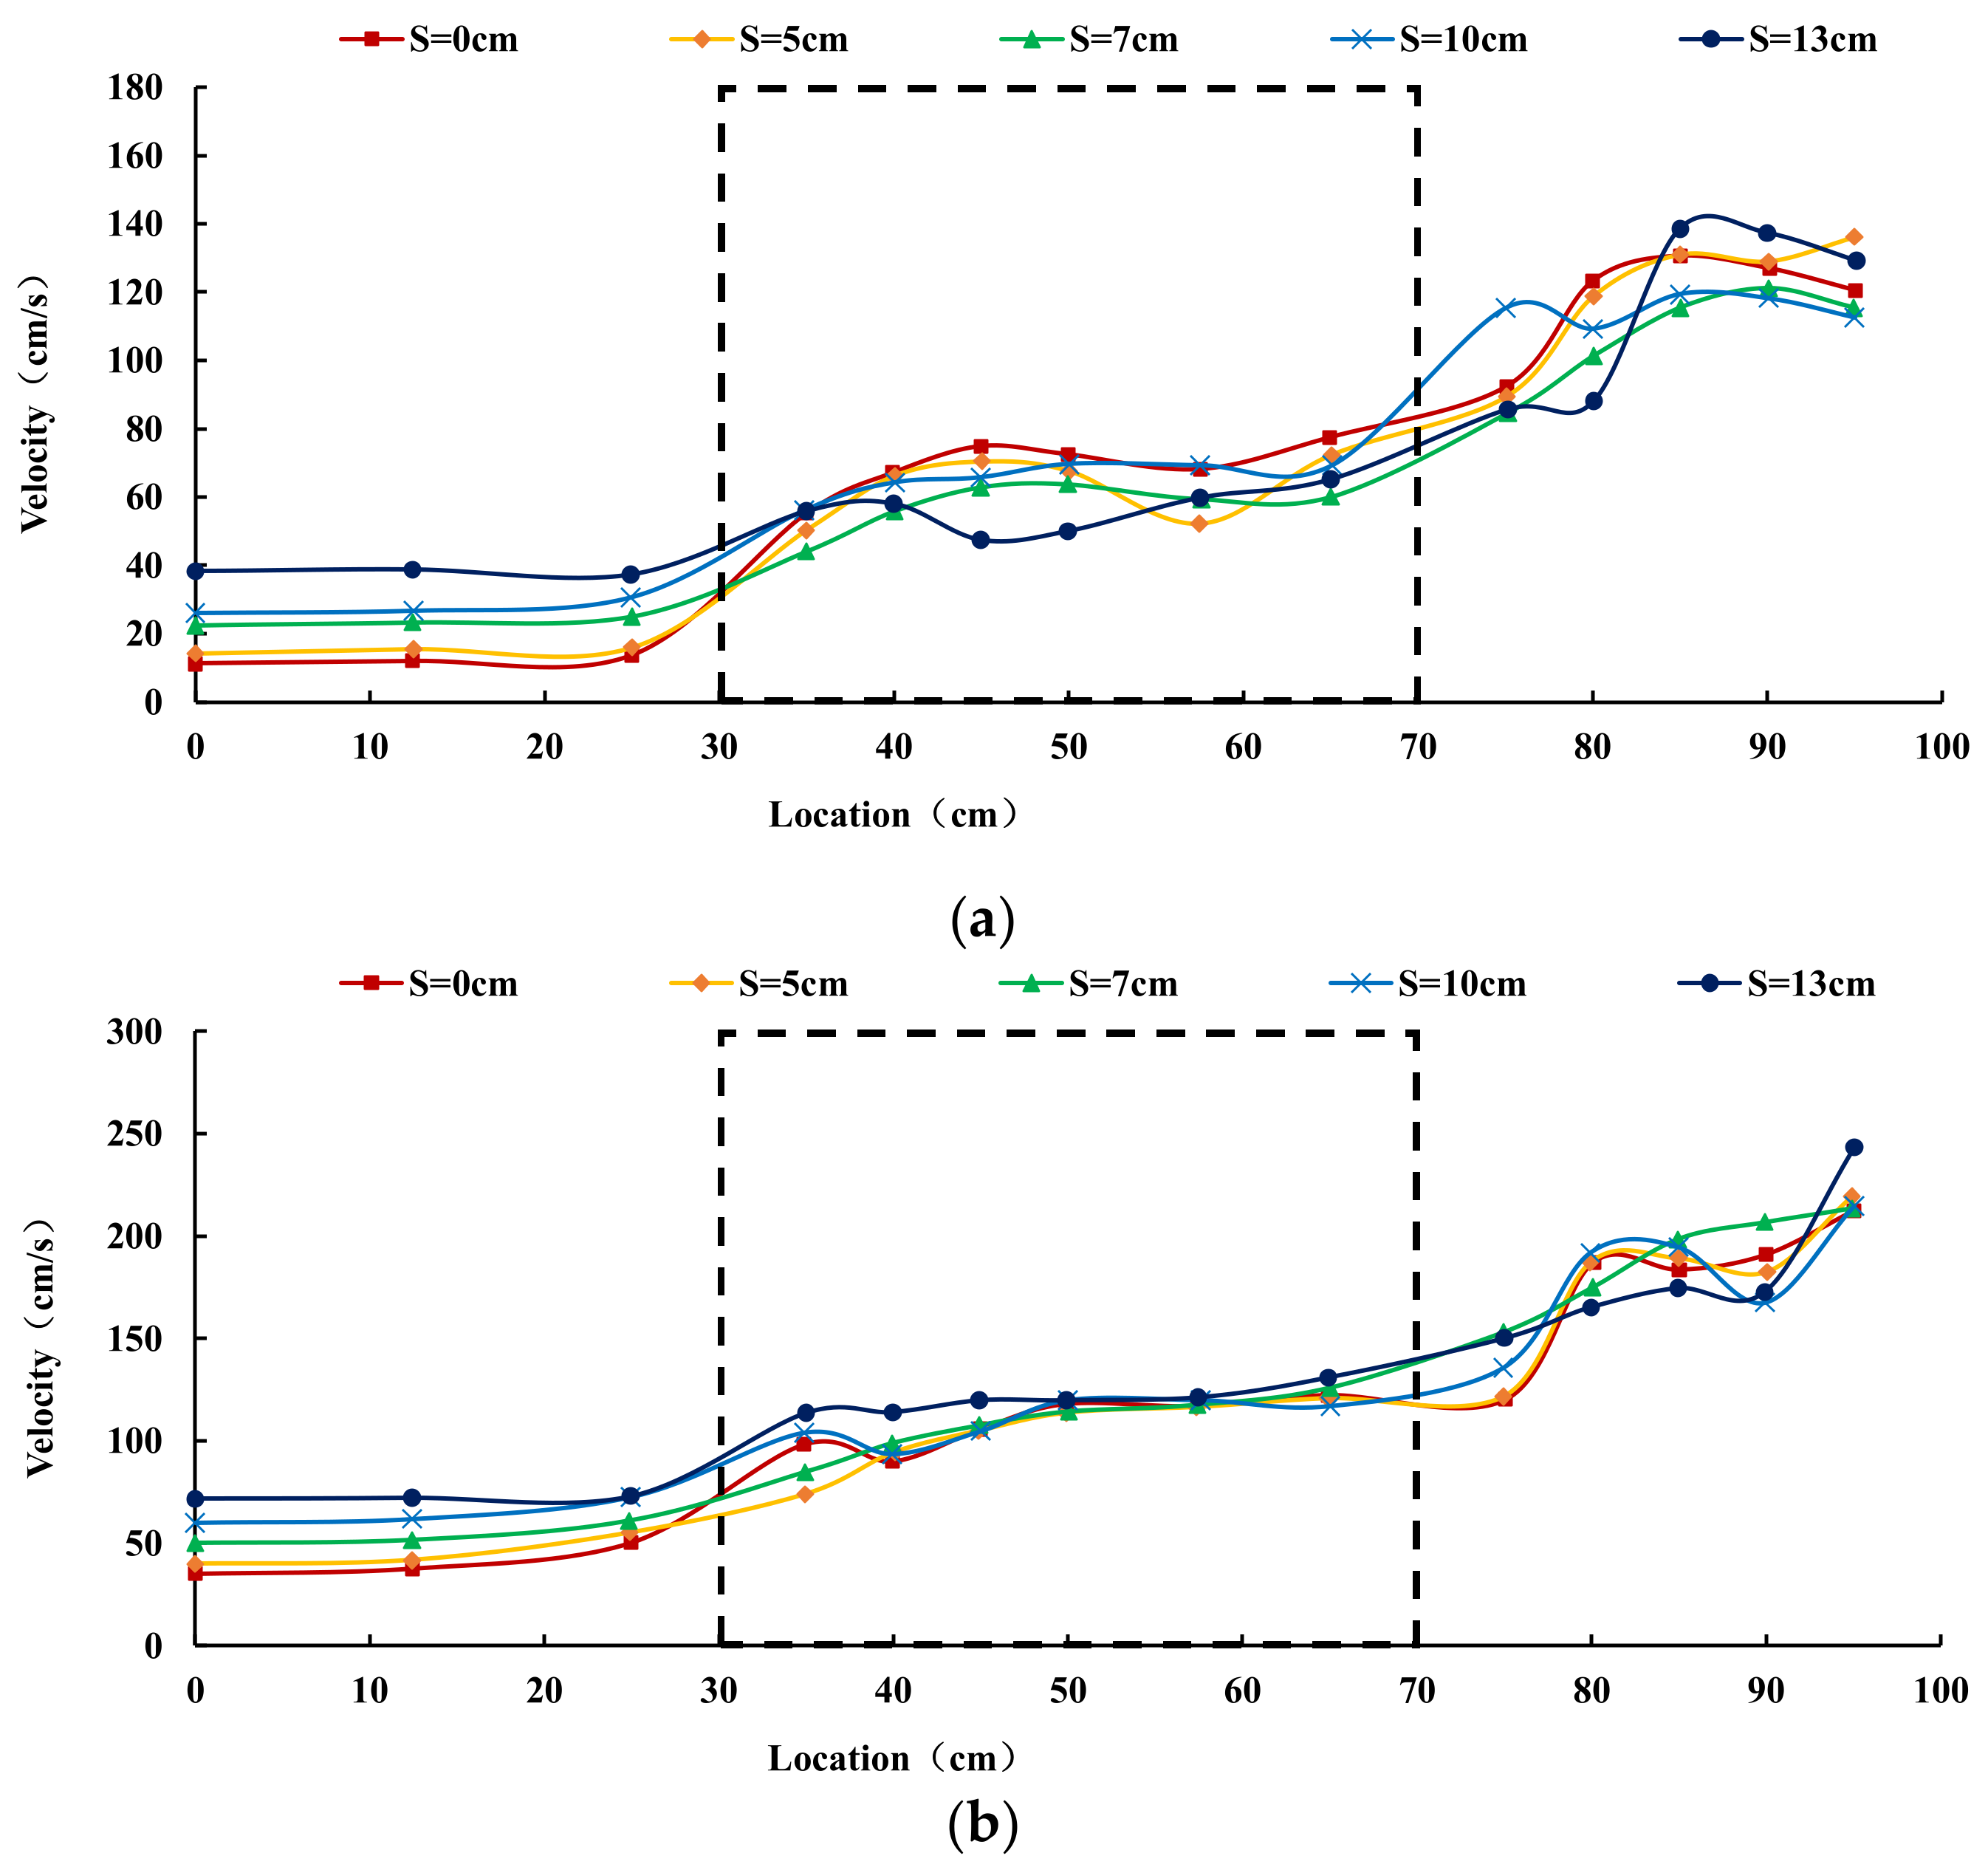
3.3.2. Influence of Siltation Height on the Velocity of Flow at the Same Discharge
From Figure 9, it can be seen that the distribution of the velocity along the weir under each siltation condition is generally similar. Except for the upstream and downstream boundary positions (measurement intervals 25–35 cm and 65–75 cm) where there is a surge in velocity, the overall flow velocity trend is relatively increasing. Under the same discharge condition, the velocity increases with the increase in siltation height at the position before the weir (measurement interval 0–25 cm), which is mainly because the channel bottom is raised with the increase in siltation height, and then the water depth of the overflow section decreases and the water flow changes from gradual to rapid. According to the velocity formula v = Q/A, the velocity increases due to the decrease in the overflow section area under a given discharge, while the velocity curve of each measurement section on the weir and behind the weir has a small change. However, the variation in the velocity of each measured section on the weir and behind the weir is small. In summary, the influence of the change in siltation height on the surface velocity along the weir is mainly concentrated in the front position of the weir, and the influence on the flow velocity on the weir and after the weir is smaller. The velocity at the front of the weir increases with the increase in the siltation height.
3.4. Relationship between Hydraulic Head and Discharge or Siltation Height
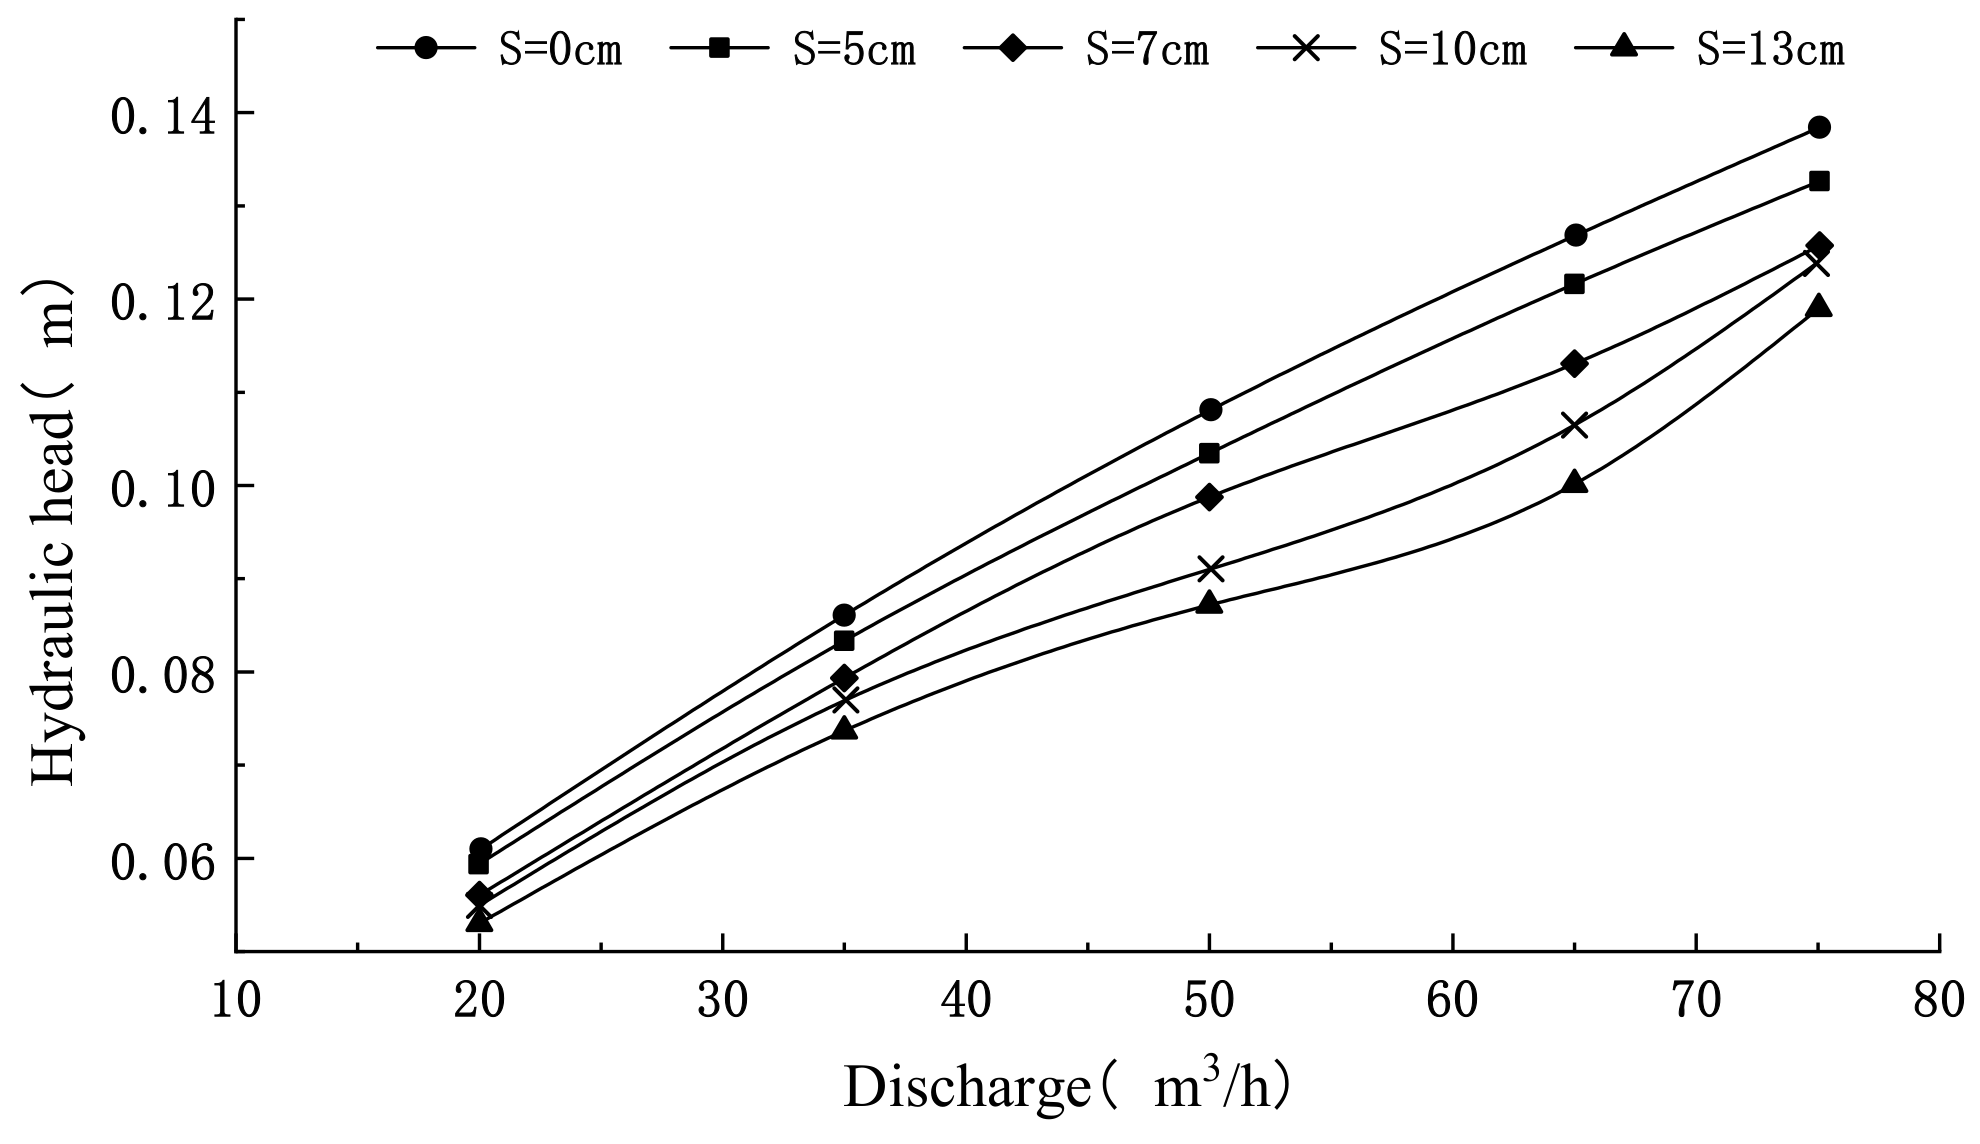
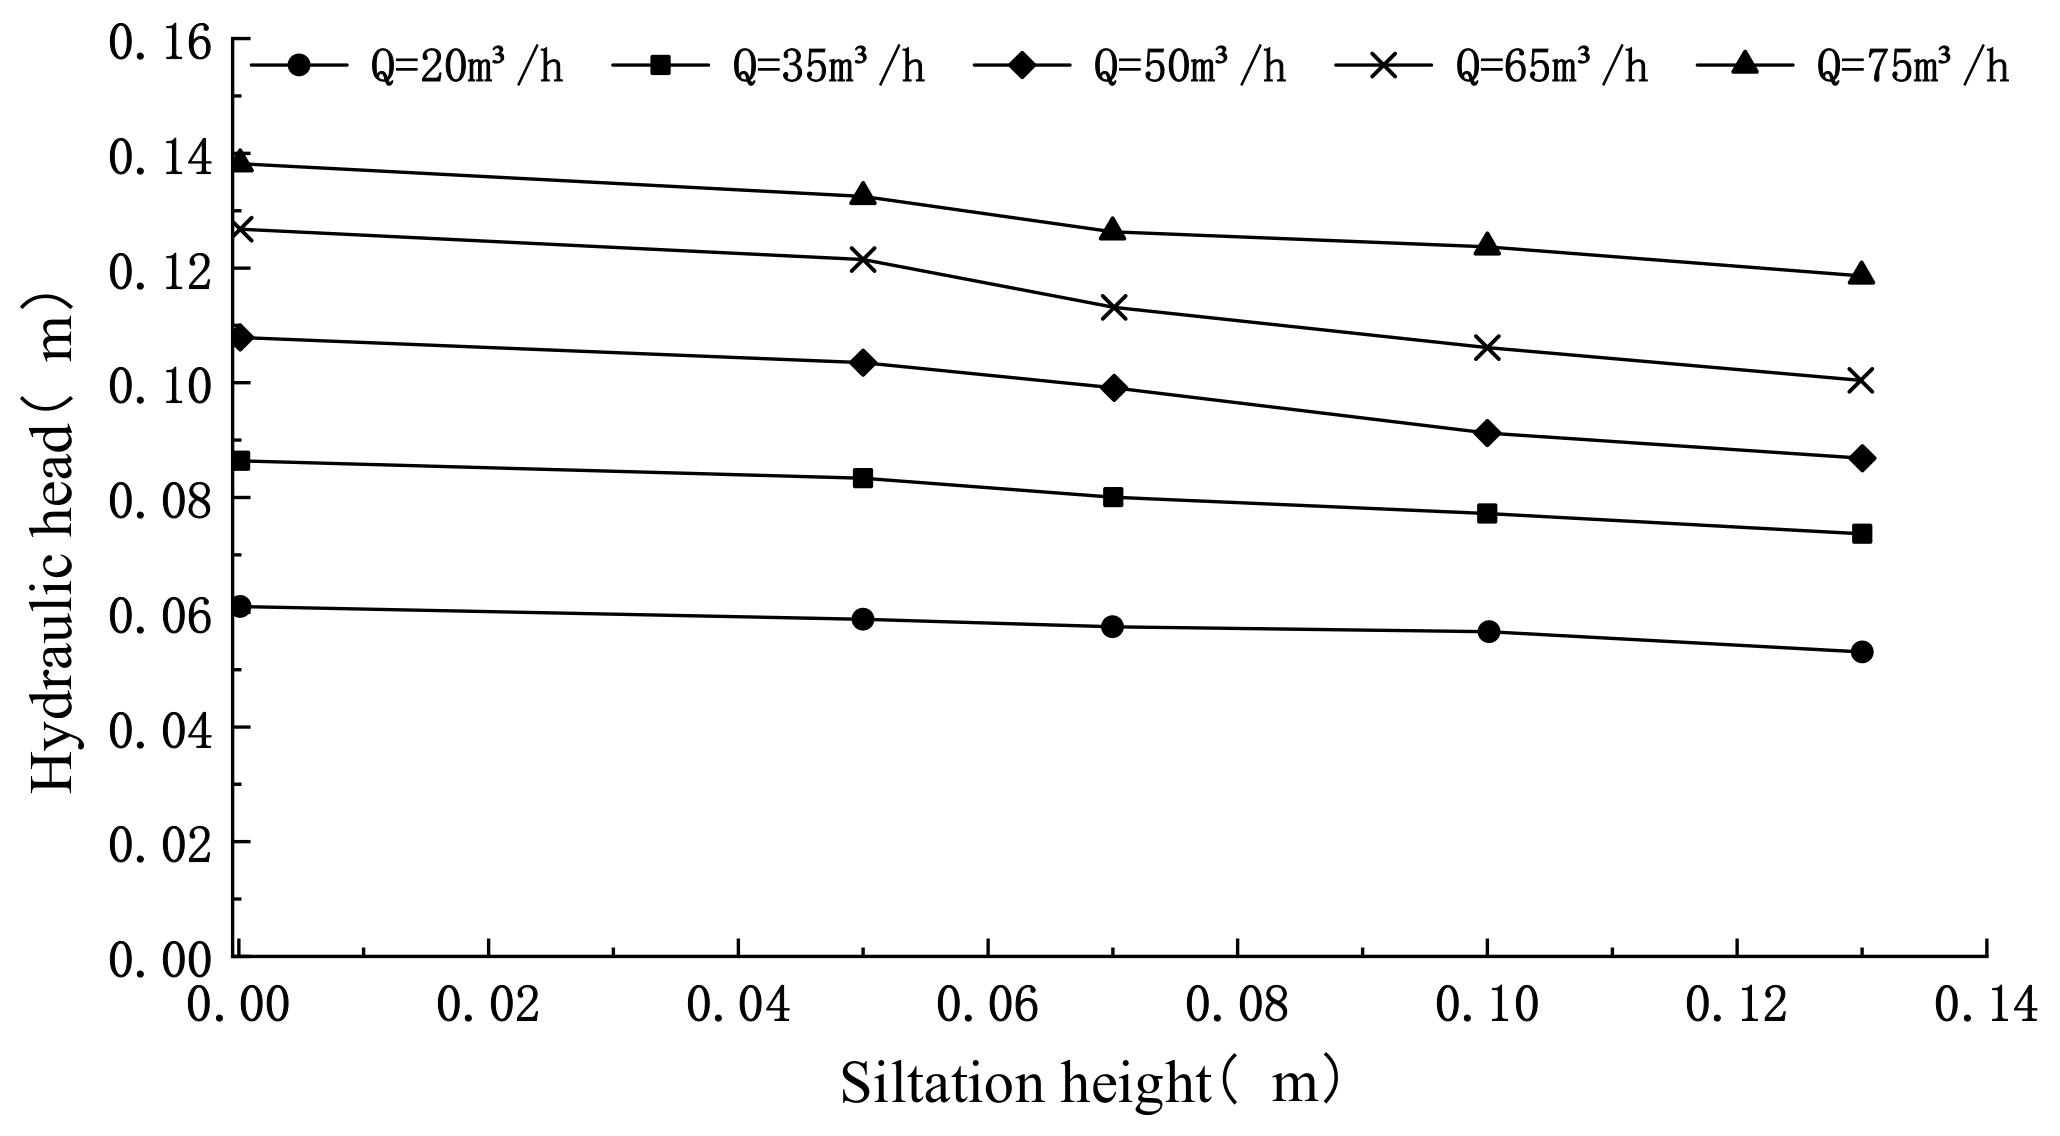
The measurement position of the hydraulic head over the weir should be at a constant position upstream water level. According to experience, it is generally taken at a distance of L = (3~5) H upstream from the weir wall, and the average velocity v0 of its overflow section is called the flow velocity in front of the weir. The measurement points should be selected at 15 to 75 cm upstream from the weir wall. To ensure consistent accuracy, the water level value of the C measurement point 30 cm upstream from the weir wall is used for calculation (see Figure 4). According to the test results, the relationship between the hydraulic head over the weir H and the discharge Q and the relationship between the hydraulic head over the weir H and the siltation height S are plotted, respectively, for each siltation height, in Figure 10 and Figure 11.
From Figure 10 and Figure 11, it can be seen that the hydraulic head H over the top of the weir increases steadily with the increase in discharge, and the trends of each curve are roughly similar. This indicates that the hydraulic head H over the weir remains positively correlated with the discharge Q in the free-outflow case as the siltation height changes. Under the same discharge condition, the siltation height S and the hydraulic head H over the weir are negatively correlated. That is, with the increase in siltation height, the hydraulic head will gradually decrease. This indicates that the overflow capacity of the broad-crested weir gradually increases with the increase in the siltation height. By analysis, the average rate of change of the hydraulic head with the change in siltation height for each discharge (Q = 20 m3/h, Q = 35 m3/h, Q = 50 m3/h, Q = 65 m3/h, and Q = 75 m3/h) are −0.07, −0.11, −0.18, −0.24, and −0.17, respectively. It can be seen that the overall change in the hydraulic head with the siltation height is most obvious at a discharge of Q = 65 m3/h.
3.5. Formula for Discharge Coefficient of the Broad-Crested Weir
In practice, in order to facilitate calculation, the weir crest water level H is usually directly used to calculate the discharge, and the influence of other factors is included in the discharge coefficient m0.
where m0 represents the discharge coefficient, H is the hydraulic head, and B is the weir width.
The common broad-crested weir discharge Equation (5) is still applicable to a weir with siltation. However, considering the presence of siltation, the discharge coefficient needs to be re-rated and expressed by ma0. Therefore, the discharge equation can be derived as
where ma0 represents the discharge coefficient of the weir with siltation, H is the hydraulic head, and B is the weir width.
In the experiment, there are five siltation height conditions when the weir width is 270 mm including no siltation, S = 0 cm. Five discharge conditions were set for each siltation condition, and 25 data points of the hydraulic head were measured in total. Each value was measured several times and averaged. From Equation (6), it is known that in the case where the discharge Q, hydraulic head over the weir H, and weir width B are known, the discharge coefficient ma0 is
The discharge coefficients for each case are obtained by substituting the known physical quantities into Equation (7) with the test data.
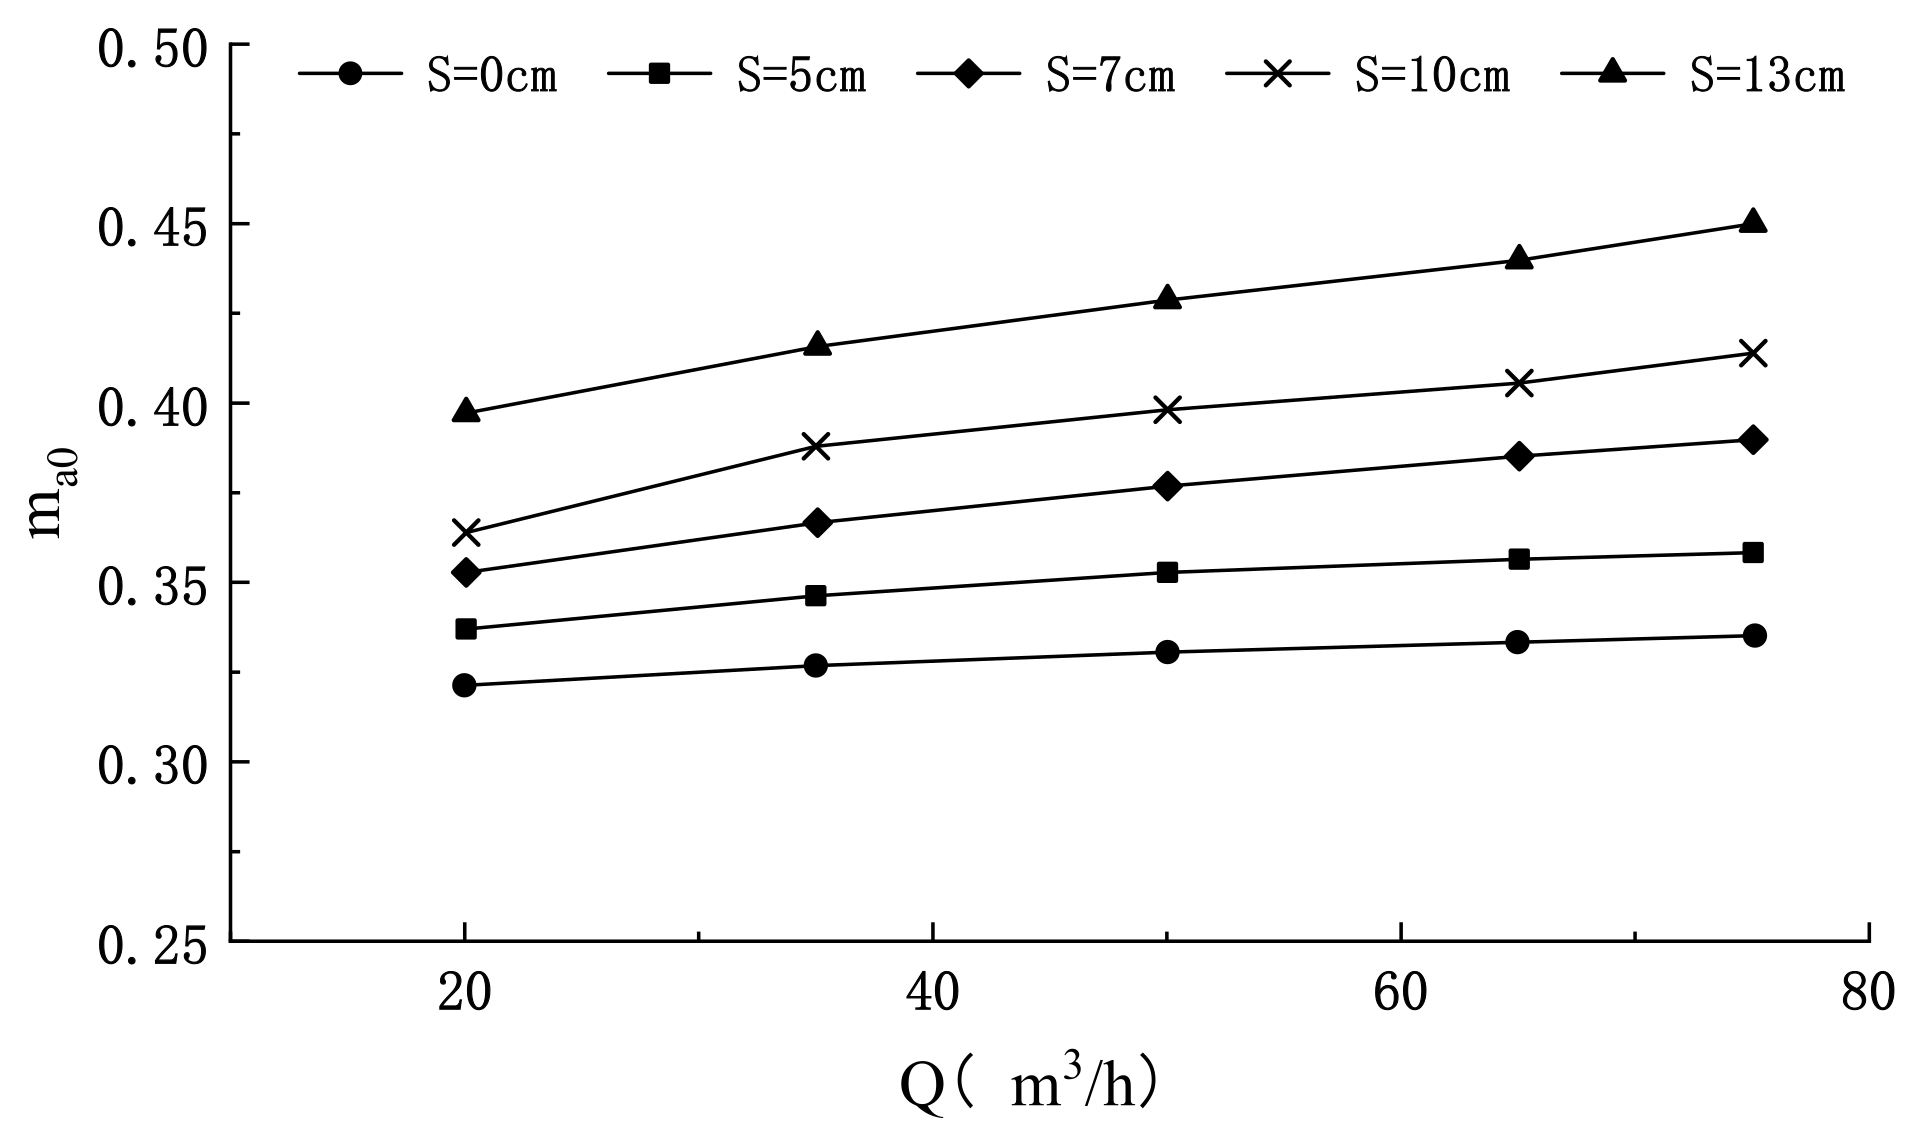
Figure 12 shows the relationship between the discharge coefficient and discharge. From the analysis in the figure, it can be seen that the discharge coefficient increases with increasing discharge at the same siltation height and they maintain a roughly similar increasing trend. At the same discharge condition, the discharge coefficient increases with an increase in siltation height and the extent of the increase becomes gradually larger with an increase in the discharge.
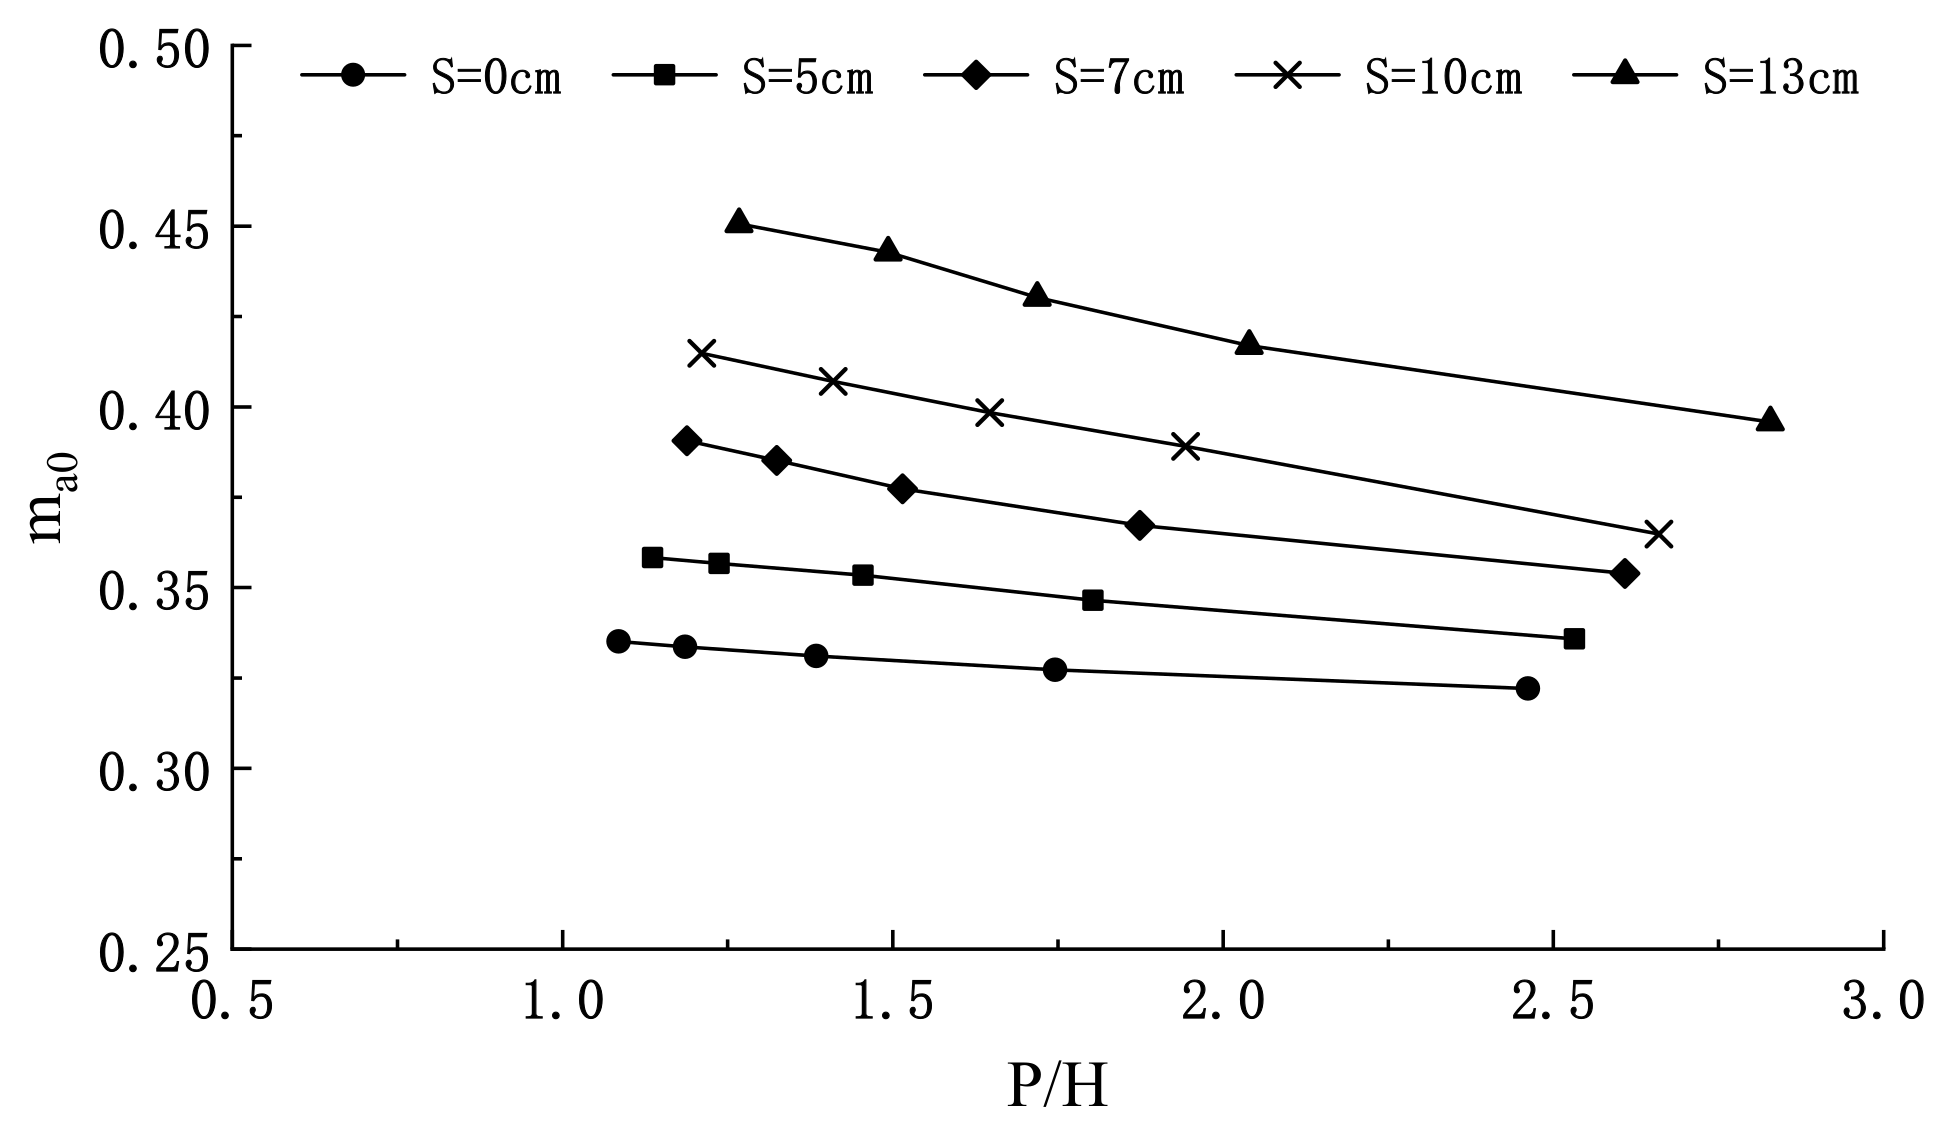
Figure 13 shows the relationship between the discharge coefficient ma0 and relative weir height P/H. From the analysis in the figure, it can be seen that the discharge coefficient gradually decreases with an increase in relative weir height at the same siltation height. Similarly, the trend of discharge coefficient change at each siltation height is roughly similar. The curvature of the discharge coefficient ma0 versus weir height P/H gradually decreases with the increase in relative weir height P/H, and the decreasing trend gradually becomes slower.
The discharge coefficient m of the broad-crested weir depends on the form of the inlet of the weir and the relative height of the weir P/H. When the broad-crested weir is a right-angle inlet, the discharge coefficient m is usually calculated using the following formula, as shown in Equation (8).
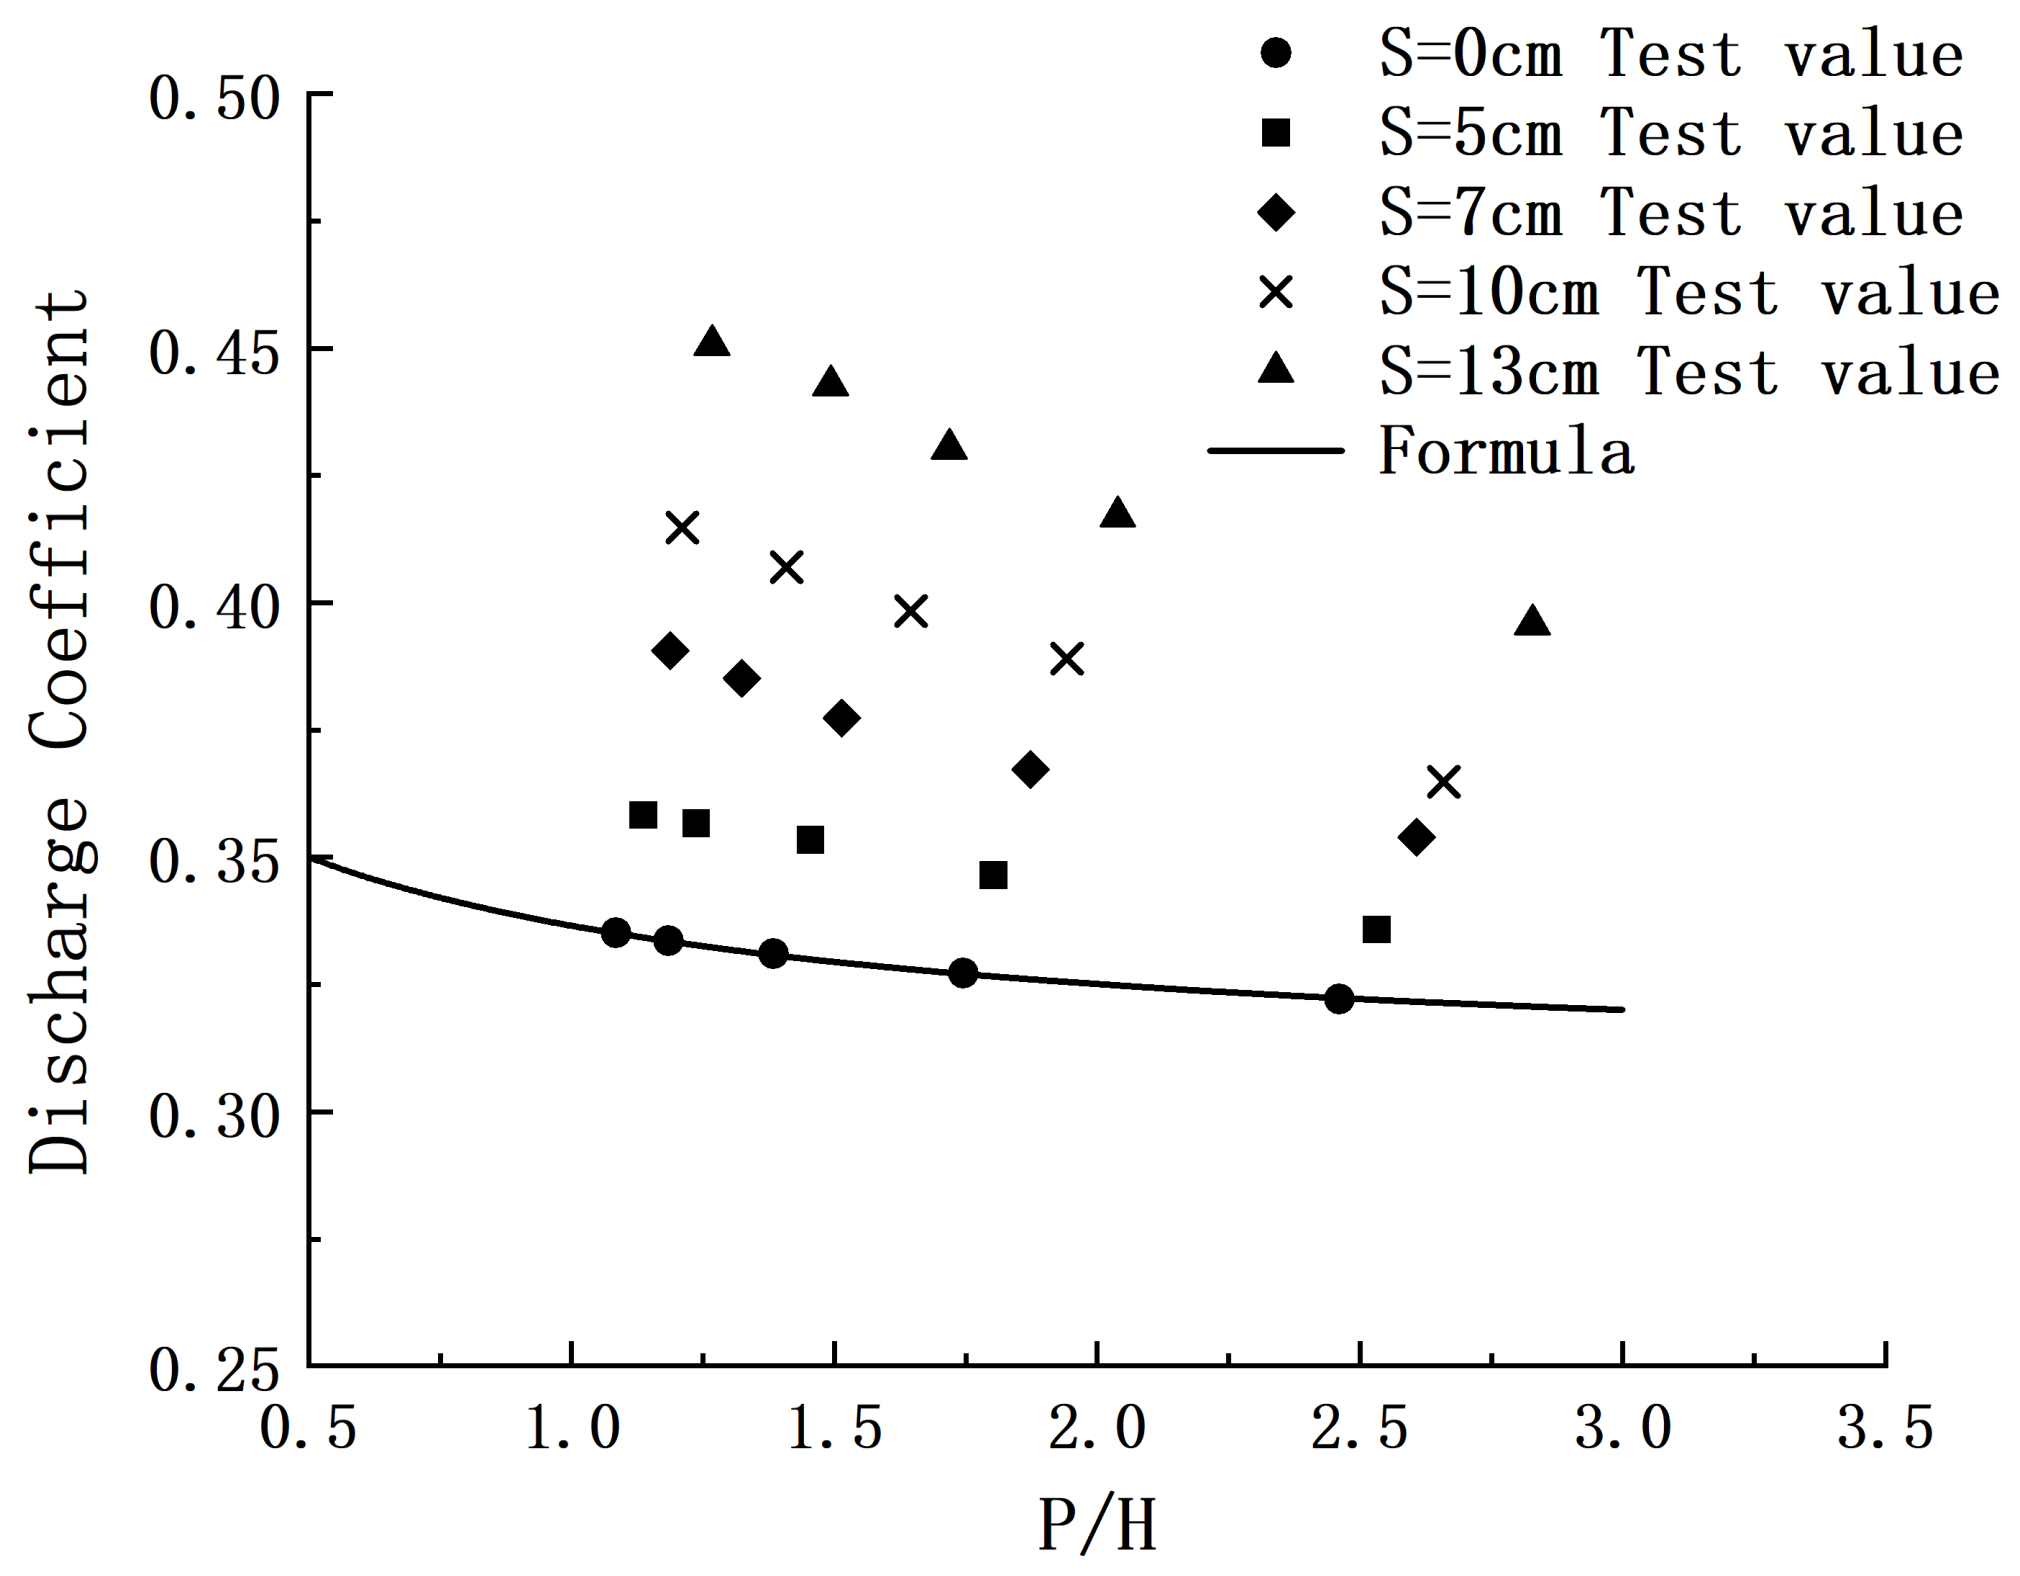
The above equation applies to 0 ≤ P/H ≤ 3. When P/H > 3, m can be considered a constant and is taken as 0.32. We calculated the formula value of the discharge coefficient m by substituting the measured value of the head over the weir under each case with the weir width of 270 mm into Equation (8), and compared it with the test value of the integrated discharge coefficient ma0 calculated by Equation (7). Figure 14 shows the discharge coefficient comparison diagram.
For the case of no siltation, S = 0 cm, the discharge coefficient obtained from the test has a very high agreement with the existing empirical formula. For others, the error between the measured value and the calculated value of the existing empirical formula is large. Therefore, a new empirical formula for the discharge coefficient needs to be fit for each case with different siltation heights.
From the above analysis, it can be seen that the integrated discharge coefficient ma0 in the presence of siltation is a function of the relative weir height P/H and the siltation height S together, ma0 = f(P/H,S). On the one hand, the new formula is considered to be compatible with the established empirical Formula (8). On the other hand, it can accurately reflect the current siltation state of the dam. Therefore, we make dimensionless the new derivation and introduce the concept of relative siltation height α = S/H. Then the overall equation functional relationship should be ma0 = f(P/H,S/P). Finally, from the actual measured data, the formula for the discharge coefficient ma0 of a broad-crested weir in the presence of siltation can be obtained using MATLAB 2021b software and statistical analysis.
The empirical equation of the discharge coefficient of the broad-crested weir is obtained by fitting as follows:
where α > 0.
The accuracy of the fitted formula was verified using Excel 2019 software, and a combination of graphs and relative error diagrams were used for further visual analysis, as shown in Figure 15.
Figure 15 shows the error diagram of the comparison between the test value of the discharge coefficient of the broad-crested weir and the calculated value of the new fitting formula. From the figure, it can be seen that the test values of the discharge coefficient of the broad-crested weir at each siltation height agree well with the fitted formula when the weir width is 270 mm. The absolute value of the relative error of each group of data is less than 5%, of which the maximum error is 4.02% and the minimum error is 0.15%. Therefore, this formula is helpful for the calculation of discharge in reinforcement projects of check dams.
4. Conclusions
The flow pattern, water surface profile, velocity, and discharge coefficient are several important indexes in the study of flow. This paper focuses on the hydraulic characteristics of broad-crested weirs with a weir width of 270 mm and siltation conditions of 0 cm, 5 cm, 7 cm, 10 cm, and 13 cm, and the main conclusions are as follows.
- (1)
- With an increase in the siltation height, the backwater phenomenon of the flow in the upstream part of the broad-crested weir gradually decreases. The water level over the weir decreases, and the overall flow pattern gradually develops towards the open channel. This means that floods will pass more easily through spillways.
- (2)
- In the same siltation height condition, the water surface profile along the flow increases with an increase in discharge. However, in the same discharge condition, the water surface profile along the flow decreases with an increase in the siltation height, which reflects that the increase in siltation height improves the overflow capacity of the broad-crested weir.
- (3)
- The effects of discharge and siltation height change on the surface velocity of a broad-crested weir are concentrated in the front part of the weir, and the effects on the back part of the weir are smaller. In the same siltation condition, the surface velocity of the flow in front of the weir increases with an increase in the discharge. In the same discharge condition, the surface velocity of the water in front of the broad-crested weir gradually increases with an increase in the siltation height.
- (4)
- From the above analysis of hydraulic characteristics, we know that the influence of siltation on overflow should be considered in engineering design work. Therefore, we propose a new formula to calculate the discharge coefficient that meets the accuracy requirements. It can be applied to the estimation of discharge in practical reinforcement work on check dams.
Author Contributions
Data curation, Z.W. and L.G.; Funding acquisition, Z.W.; Investigation, Z.W., L.G., J.Z., and Y.L.; Writing—original draft, Z.W.; Writing—review and editing, L.G. All authors have read and agreed to the published version of the manuscript.
Funding
The funding sources are the Shanxi Province Water Conservancy Science and Technology Research and Promotion Project “Study on Spillway Discharge Coefficient in Warping Dam Reinforcement Project” (201818) and a special project for academic restoration and scientific research of Shanxi Agricultural University, “Study on discharge coefficient of overflow weir under high siltation condition of warping dam” (2020xshf61).
Institutional Review Board Statement
Not applicable.
Informed Consent Statement
Not applicable.
Data Availability Statement
Some or all of the data, models, or code that support the findings of this study are available from the corresponding author upon reasonable request.
Acknowledgments
This research was supported by the Collaborative Innovation Center of New Technology of Water-Saving and Secure and Efficient Operation of Long-Distance Water Transfer Project at the Taiyuan University of Technology.
Conflicts of Interest
The authors declare no conflict of interest.
References
- Fang, X. Discuss check dam and Yellow River treatment. ZHIHUANGKEJIXINXI 1994, 6, 7–8. [Google Scholar]
- Gu, Y. Li Yizhi, pioneer of modern water conservancy in China. ZHIHUAI 2014, 10, 37–38. [Google Scholar]
- Wei, X.; Li, Z.; Li, P. Study on depositing process of check dam on the loess plateau. Bull. Soil Water Conserv. 2006, 26, 10–13, 31. [Google Scholar]
- Wei, X.; Li, Z.; Li, X. Analysis of the grey correlation between sediment effect for dam-land of typical checking dam and corresponding erosive rainfall. J. Saf. Environ. 2007, 7, 101–104. [Google Scholar]
- Ye, H.; Shi, J.; Hou, H. Exploration on the sedimentary rate assessment in silt retention dam based on GIS and GPS. Acta Geol. Sin. 2006, 80, 1633–1636. [Google Scholar]
- Wang, Y.; Fu, B.; Hou, F. Estimation of sediment volume trapped by check-dam based on differential GPS technique. Trans. Chin. Soc. Agric. Eng. 2009, 25, 79–83. [Google Scholar]
- Ramos, I.; Navarro, J.; Martin, F. Analysis of methods to determine the sediment retained by check dams and to estimate erosion rates in badlands. Environ. Monit. Assess. 2016, 188, 405. [Google Scholar] [CrossRef]
- Tang, H.; Pan, H.; Ran, Q. Impacts of filled check dams with different deployment strategies on the flood and sediment transport processes in a loess plateau catchment. Water 2020, 12, 1319. [Google Scholar] [CrossRef]
- Niu, Y. Existing problems and solutions of reservoir spillway. Yellow River 1995, 10, 37–40. [Google Scholar]
- Hua, Z. A calculating formula for spillway capacity of drowned wide crest weirs. J. Hohai Univ. 1998, 3, 99–103. [Google Scholar]
- Wang, X.; Zhang, Y. Discharge coefficient and submerged coefficient of streamlined broad crest weir. Power Syst. Clean Energy 2012, 11, 82–84, 89. [Google Scholar]
- Yu, H. Critical submerged method applied to the computation of flow over broad crested weirs. J. Chongqing Jiaotong Univ. 1998, 17, 28–30. [Google Scholar]
- Tian, J.; Li, G.; Ji, A. Discussion on weir flow coefficient for broad-crest ridge-free weirs. Adv. Sci. Technol. Water Resour. 2003, 3, 34–35, 70. [Google Scholar]
- Shan, C.; Qi, Q. The calculation and discussion of the discharge coefficient for stepless, broad-crest weirs. Traffic Eng. Technol. Natl. Def. 2008, 5, 31–32, 58. [Google Scholar]
- Li, R.; Tian, Z.; Deng, J. Experimental and theoretical study on gated free flow discharge coefficient for broad-crested ridge-free weir. Water Resour. Power 2015, 11, 88–90, 154. [Google Scholar]
- Yang, L.; Liang, Y.; Fan, R.; Wu, Q. Research on outflow of gate hole of broad-crested weir with sill. Yellow River 2010, 2, 107–108. [Google Scholar]
- Kim, N.; Nakagawa, H.; Kawaike, K.; Zhang, H. Estimation of debris flow discharge coefficient considering sediment concentration. Int. J. Sediment Res. 2019, 34, 1–7. [Google Scholar] [CrossRef]
- Banihabib, M.; Bibak, A.; Tanhapour, M. Empirical equation for the assessment of the effect of sediment concentration on the discharge coefficient of slit dams. Arab. J. Geosci. 2022, 15, 574. [Google Scholar] [CrossRef]
- Říha, J.; Duchan, D.; Zachoval, Z.; Erpicum, S.; Archambeau, P.; Pirotton, M.; Dewals, B. Performance of a shallow-water model for simulating flow over trapezoidal broad-crested weirs. J. Hydrol. Hydromech. 2019, 67, 322–328. [Google Scholar] [CrossRef] [Green Version]
- Dehghani, H.; Varaki, M. Experimental investigation of upstream sedimentation and downstream bed levels’ effects on discharge coefficients of trapezoidal labyrinth weirs. Arab. J. Geosci. 2021, 14, 1999. [Google Scholar] [CrossRef]
- Khan, M.A.; Sharma, N.; Lama, G.F.C.; Hasan, M.; Garg, R.; Busico, G.; Alharbi, R.S. Three-dimensional hole size (3DHS) Approach for water flow turbulence analysis over emerging sand bars: Flume-scale experiments. Water 2022, 14, 1889. [Google Scholar] [CrossRef]
Figure 1.
Layout of experimental system.

Figure 2.
Physical model: (a) Sketch map; (b) Entity diagram.


Figure 3.
Layout diagram of siltation area.

Figure 4.
Layout of the measuring section.

Figure 5.
The free outflow of the broad-crested weir.

Figure 6.
Variation in water surface profile at different discharges: (a) S = 0 cm; (b) S = 5 cm; (c) S = 7 cm; (d) S = 10 cm; (e) S = 13 cm.
Figure 6.
Variation in water surface profile at different discharges: (a) S = 0 cm; (b) S = 5 cm; (c) S = 7 cm; (d) S = 10 cm; (e) S = 13 cm.


Figure 7.
Variation in water surface profile at different siltation heights: (a1) Q = 20 m3/h; (a2) Q = 20 m3/h part; (b1) Q = 65 m3/h; (b2) Q = 65 m3/h part.
Figure 7.
Variation in water surface profile at different siltation heights: (a1) Q = 20 m3/h; (a2) Q = 20 m3/h part; (b1) Q = 65 m3/h; (b2) Q = 65 m3/h part.

Figure 8.
Velocity distribution diagram of flow at different discharges: (a) S = 0 cm; (b) S = 5 cm; (c) S = 7 cm; (d) S = 10 cm; (e) S = 13 cm.
Figure 8.
Velocity distribution diagram of flow at different discharges: (a) S = 0 cm; (b) S = 5 cm; (c) S = 7 cm; (d) S = 10 cm; (e) S = 13 cm.


Figure 9.
Velocity distribution diagram of flow at different siltation heights: (a) Q = 20 m3/h; (b) Q = 65 m3/h.
Figure 9.
Velocity distribution diagram of flow at different siltation heights: (a) Q = 20 m3/h; (b) Q = 65 m3/h.

Figure 10.
The relation between H and Q.

Figure 11.
The relationship between H and S.

Figure 12.
The relationship between ma0 and Q.

Figure 13.
The relationship between ma0 and P/H.

Figure 14.
Comparison of discharge coefficient between test value and formula value.

Figure 15.
Comparison of discharge coefficient between test value and new formula value (a) Fitting curve; (b) Relative error.
Figure 15.
Comparison of discharge coefficient between test value and new formula value (a) Fitting curve; (b) Relative error.

Disclaimer/Publisher’s Note: The statements, opinions and data contained in all publications are solely those of the individual author(s) and contributor(s) and not of MDPI and/or the editor(s). MDPI and/or the editor(s) disclaim responsibility for any injury to people or property resulting from any ideas, methods, instructions or products referred to in the content. |
© 2023 by the authors. Licensee MDPI, Basel, Switzerland. This article is an open access article distributed under the terms and conditions of the Creative Commons Attribution (CC BY) license (https://creativecommons.org/licenses/by/4.0/).
Share and Cite
MDPI and ACS Style
Wang, Z.; Gui, L.; Zhang, J.; Li, Y. Research on the Influence of Siltation Height of Check Dams the on Discharge Coefficient of Broad-Crested Weirs. Water 2023, 15, 510. https://doi.org/10.3390/w15030510
AMA Style
Wang Z, Gui L, Zhang J, Li Y. Research on the Influence of Siltation Height of Check Dams the on Discharge Coefficient of Broad-Crested Weirs. Water. 2023; 15(3):510. https://doi.org/10.3390/w15030510
Chicago/Turabian StyleWang, Zhijian, Lili Gui, Jiaxuan Zhang, and Yongye Li. 2023. "Research on the Influence of Siltation Height of Check Dams the on Discharge Coefficient of Broad-Crested Weirs" Water 15, no. 3: 510. https://doi.org/10.3390/w15030510
Note that from the first issue of 2016, this journal uses article numbers instead of page numbers. See further details here.