
Removal of Chromium Species from Low-Contaminated Raw Water by Different Drinking Water Treatment Processes
 , and
, and
Abstract
:1. Introduction
2. Materials and Methods
2.1. Materials
2.2. Raw Water
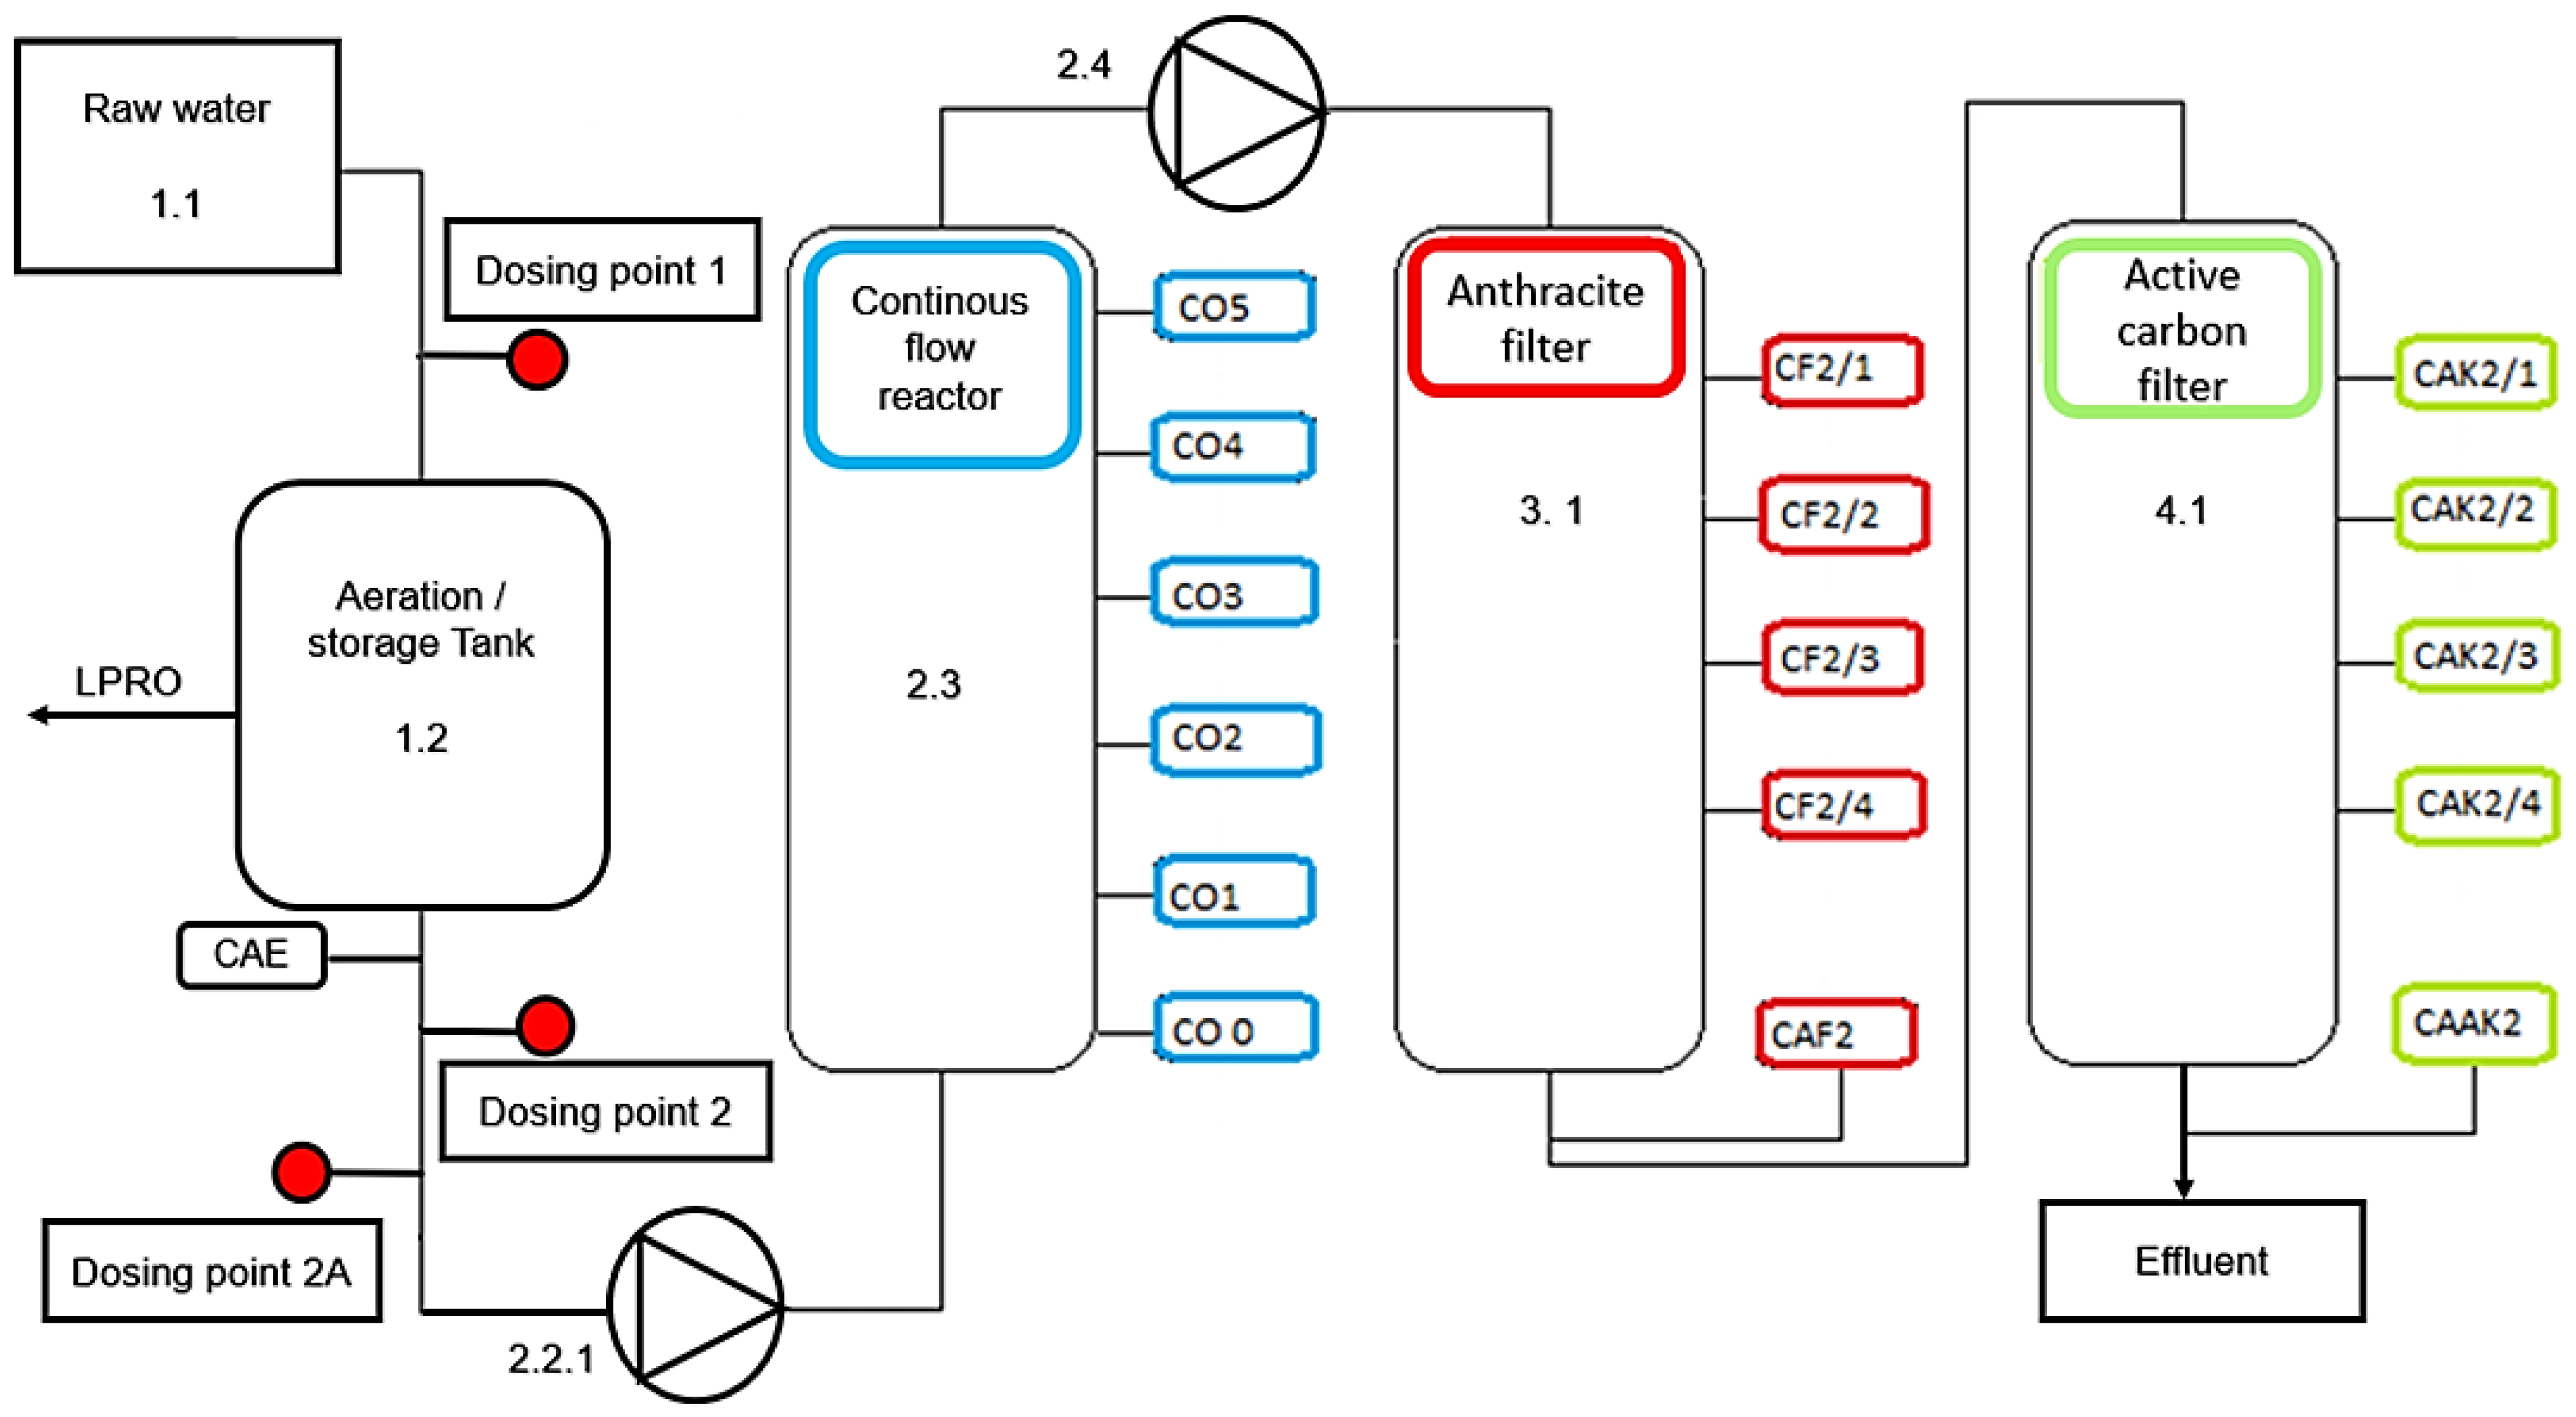
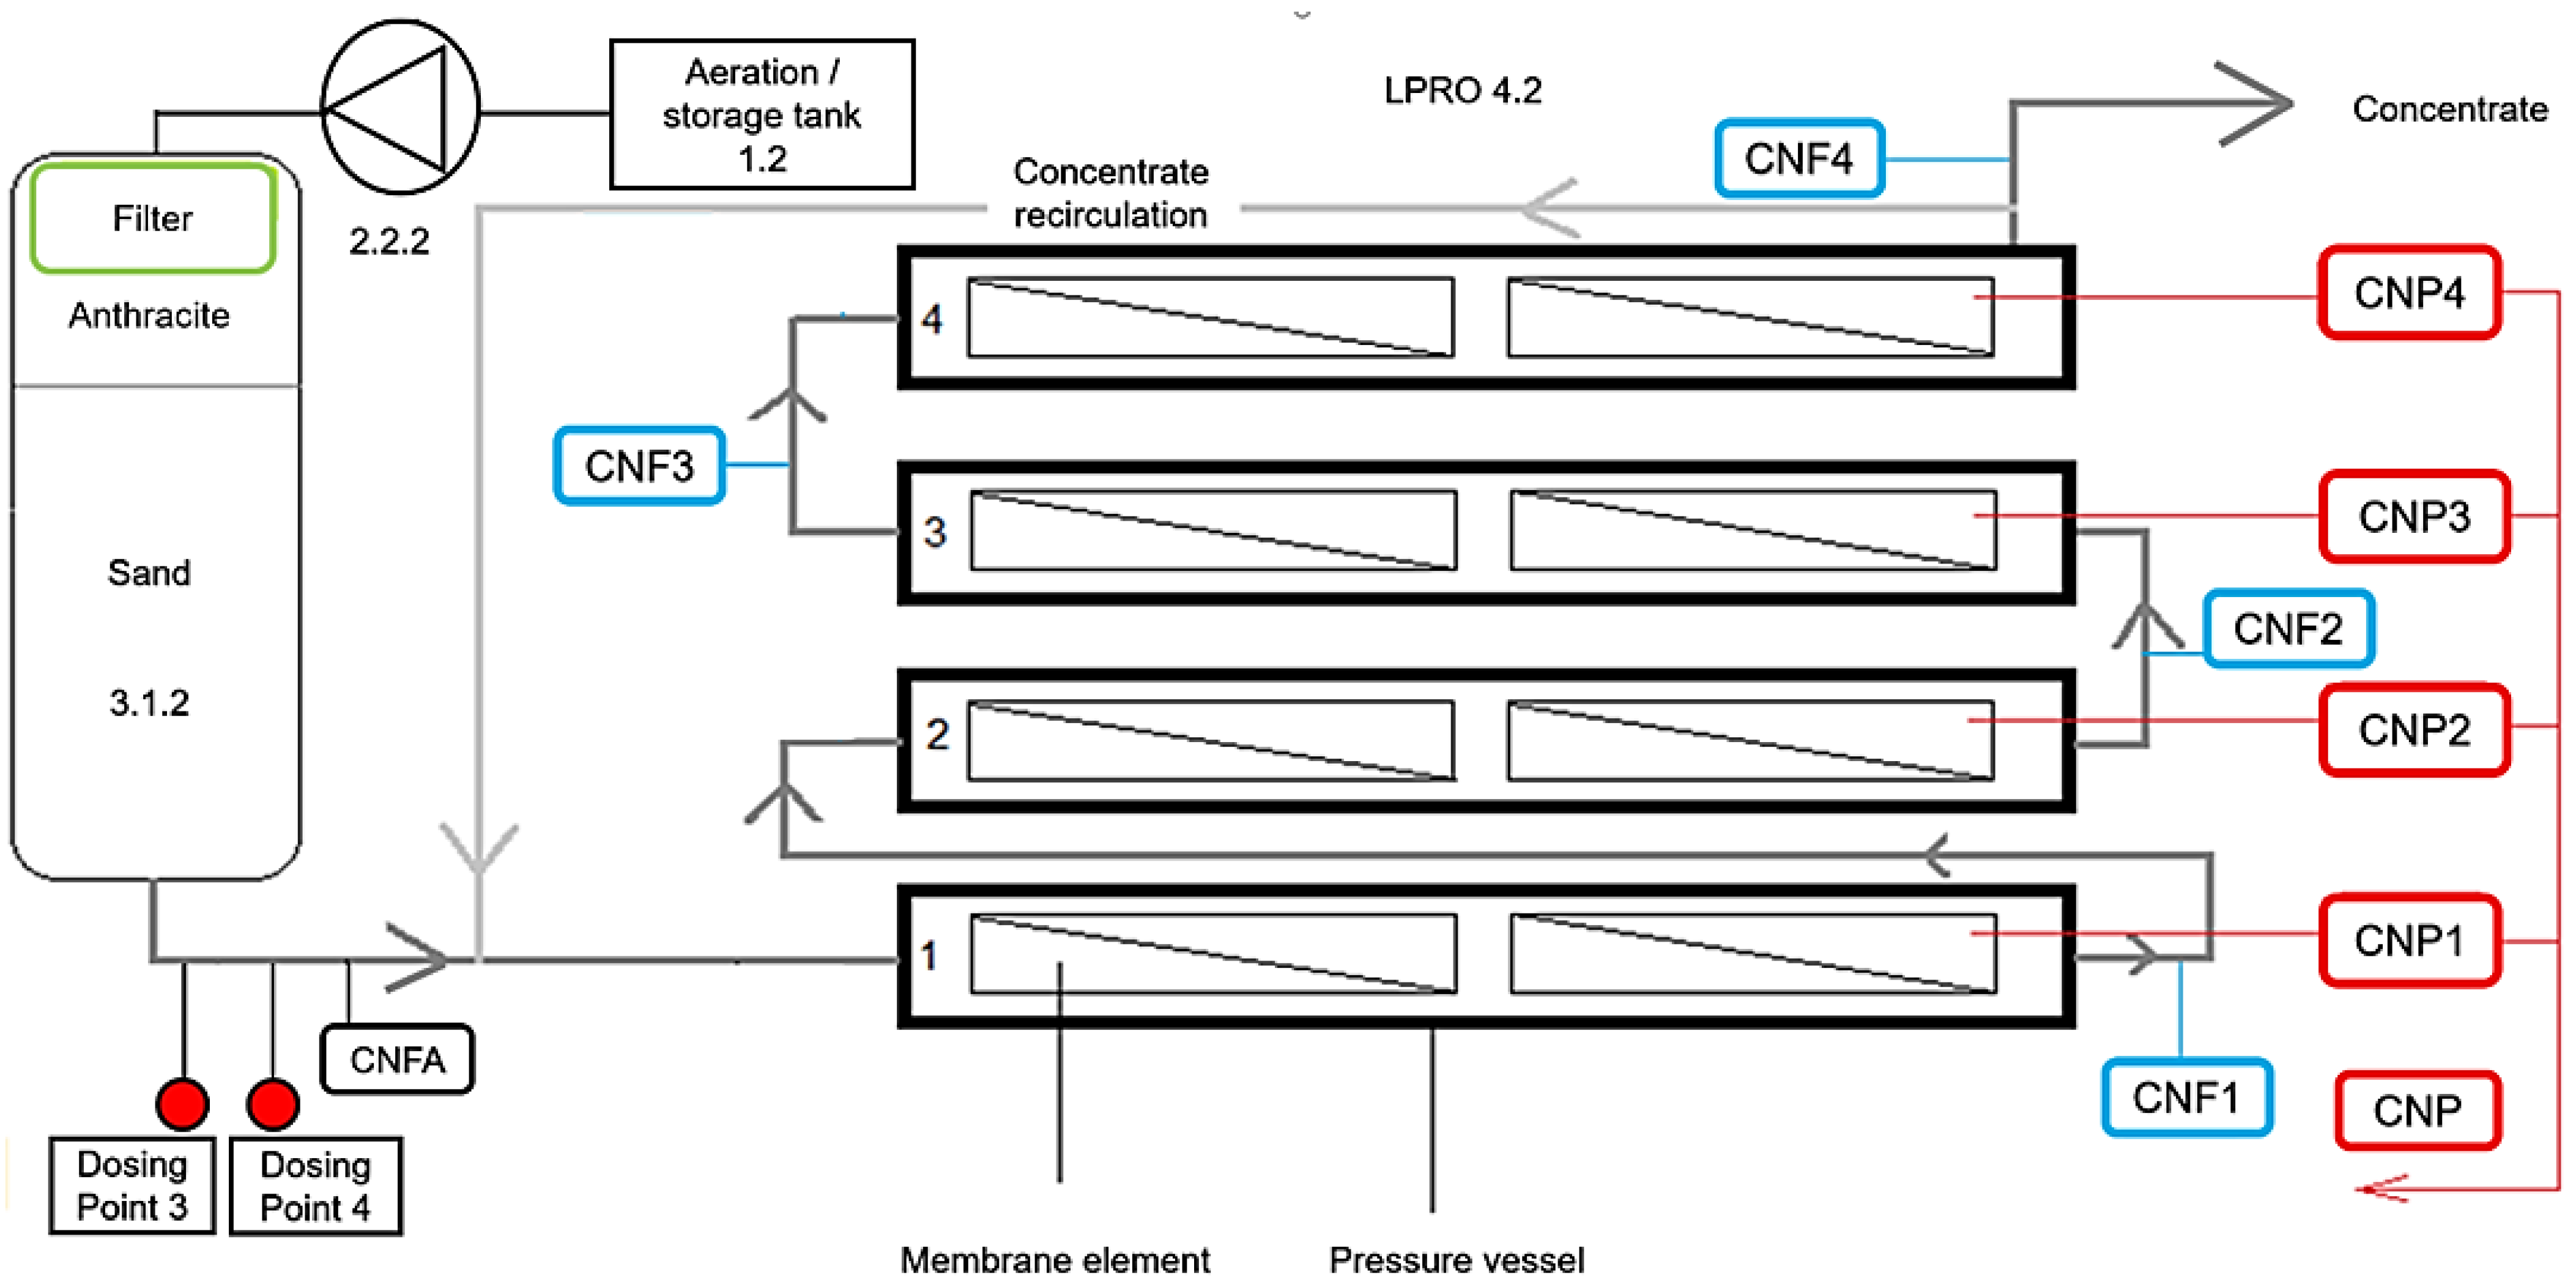
2.3. Pilot Plant
2.4. Spiking Experiments with the ACF Line
2.5. Spiking Experiments under RCF Conditions
2.6. Spiking Experiments with the LPRO Line
2.7. RCF Laboratory Experiments
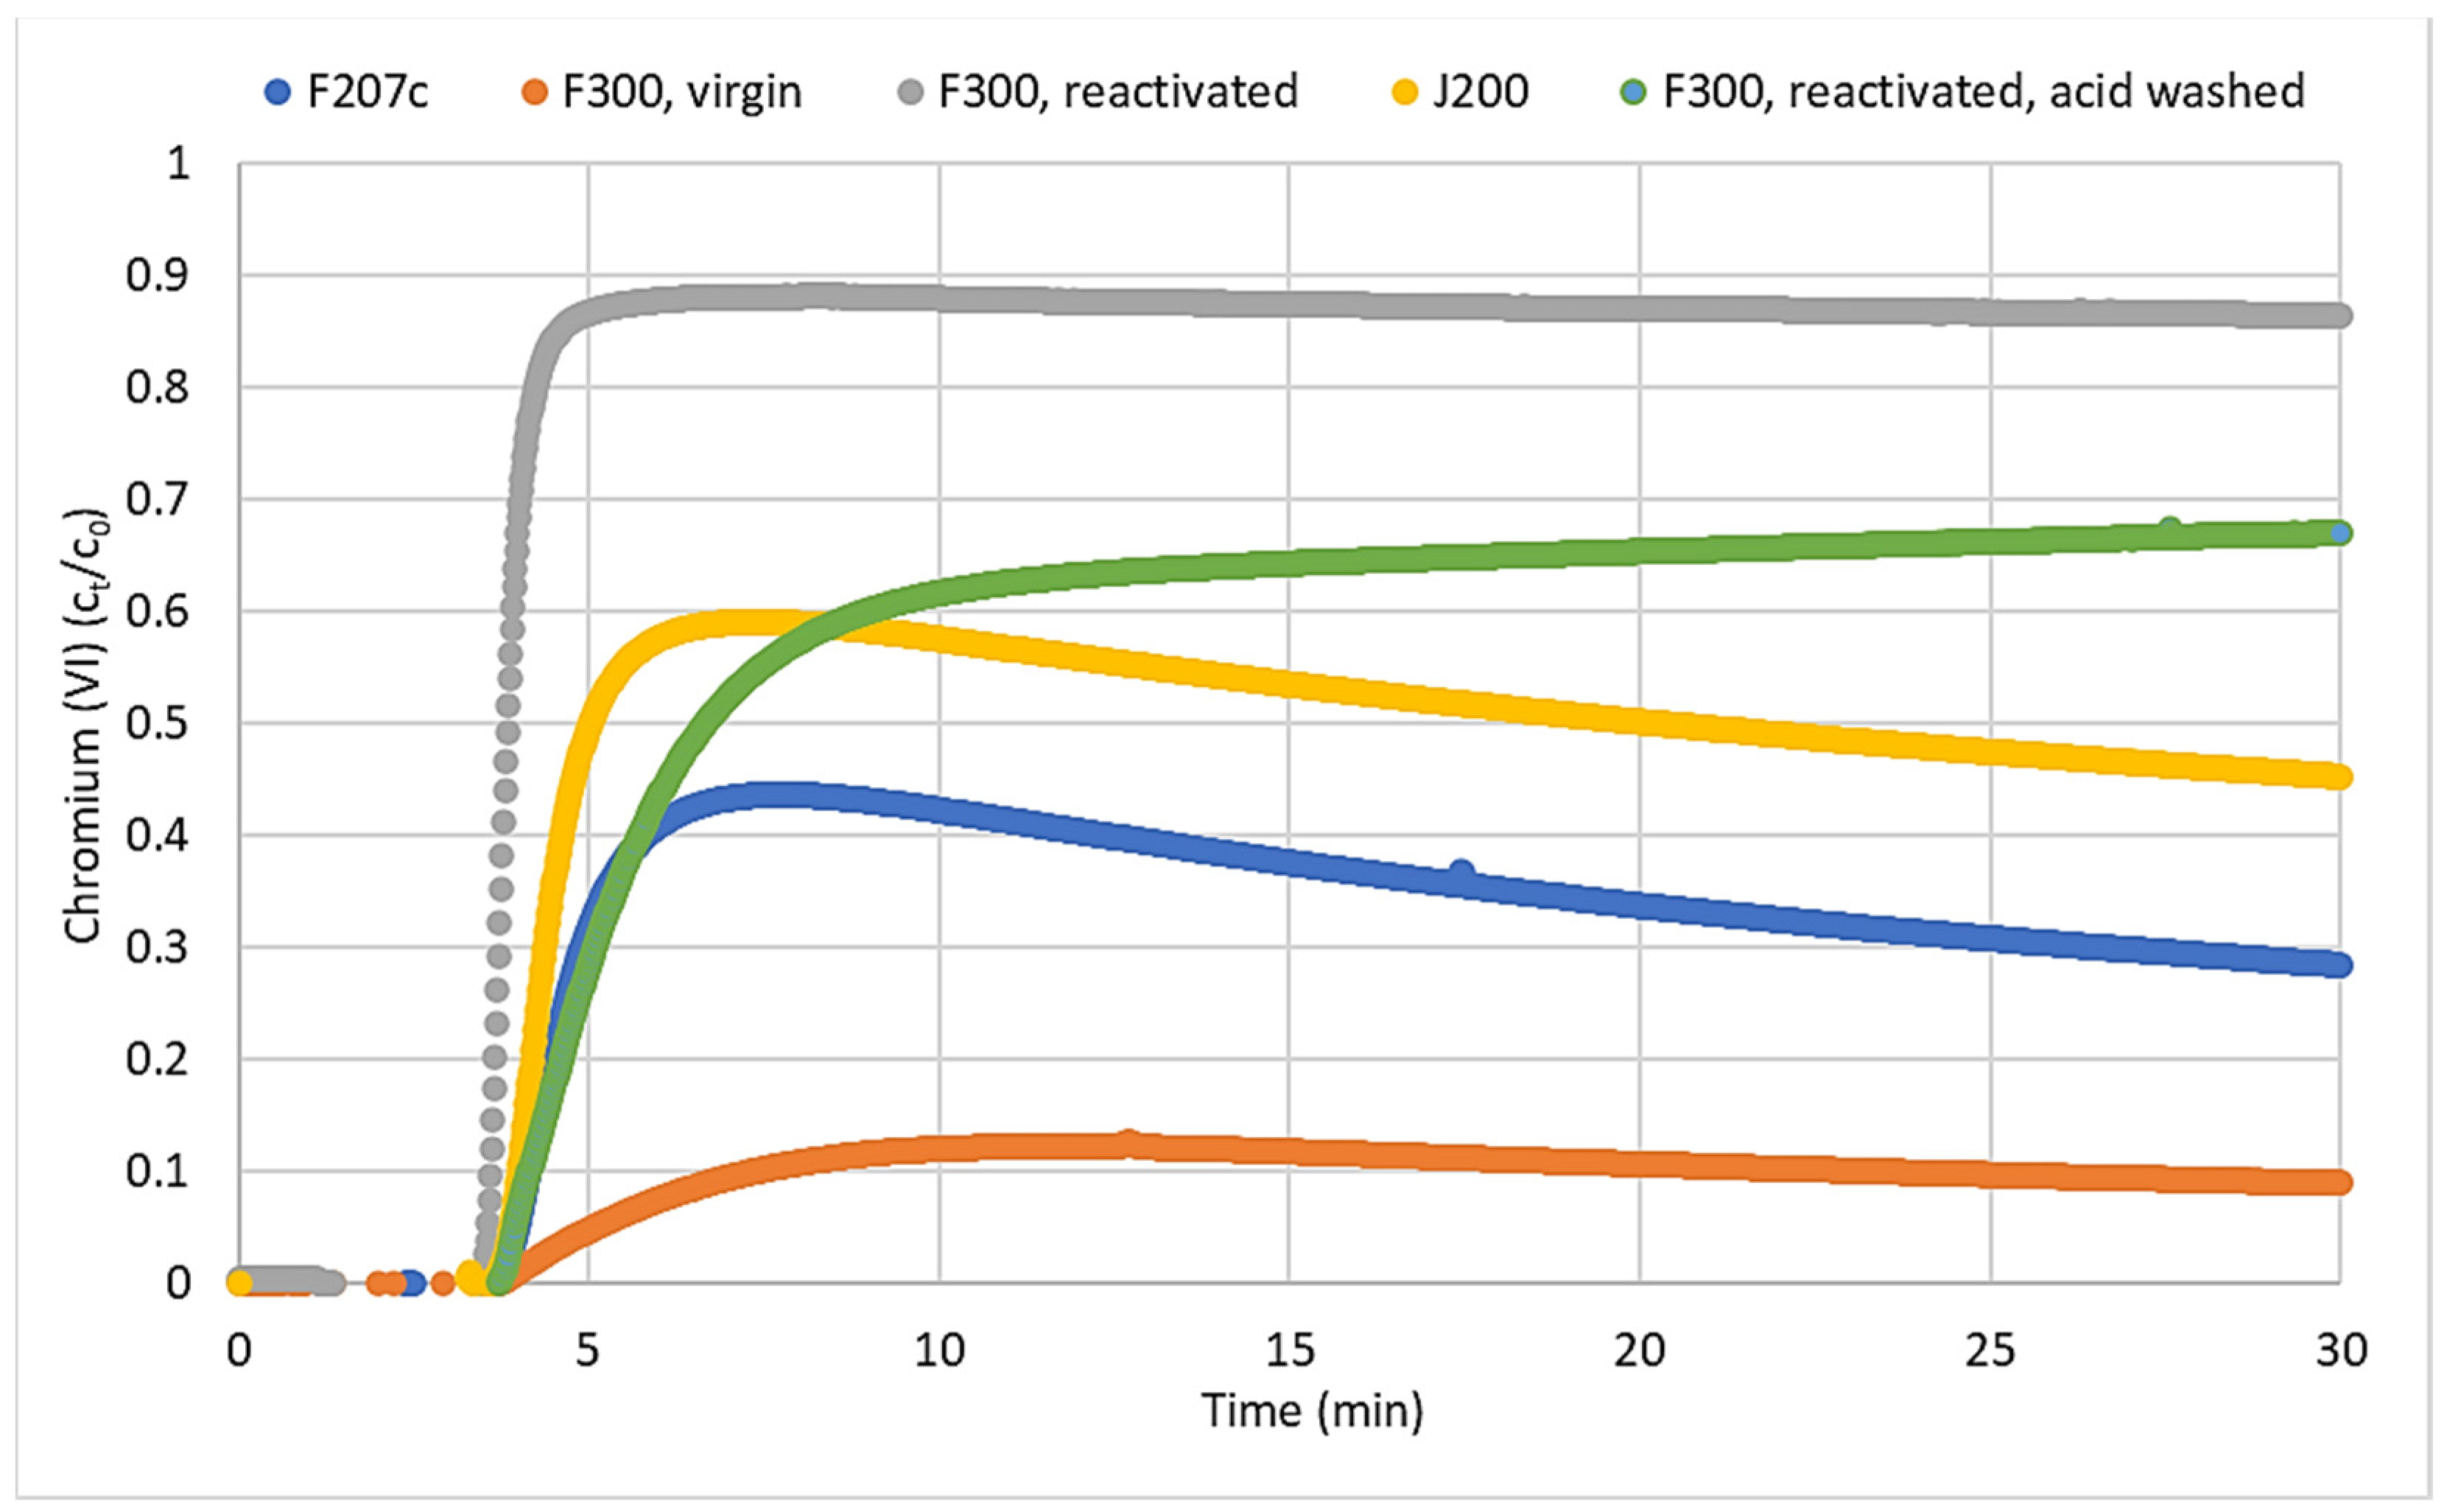
2.8. Laboratory Experiments on the Kinetics of Adsorption on Activated Carbon
2.9. Investigation on the Transferability of Pilot Plant Results into Technical Scale
2.10. ICP-MS Analytics
2.11. Acid Treatment of Reactivated Activated Carbon
3. Results and discussion
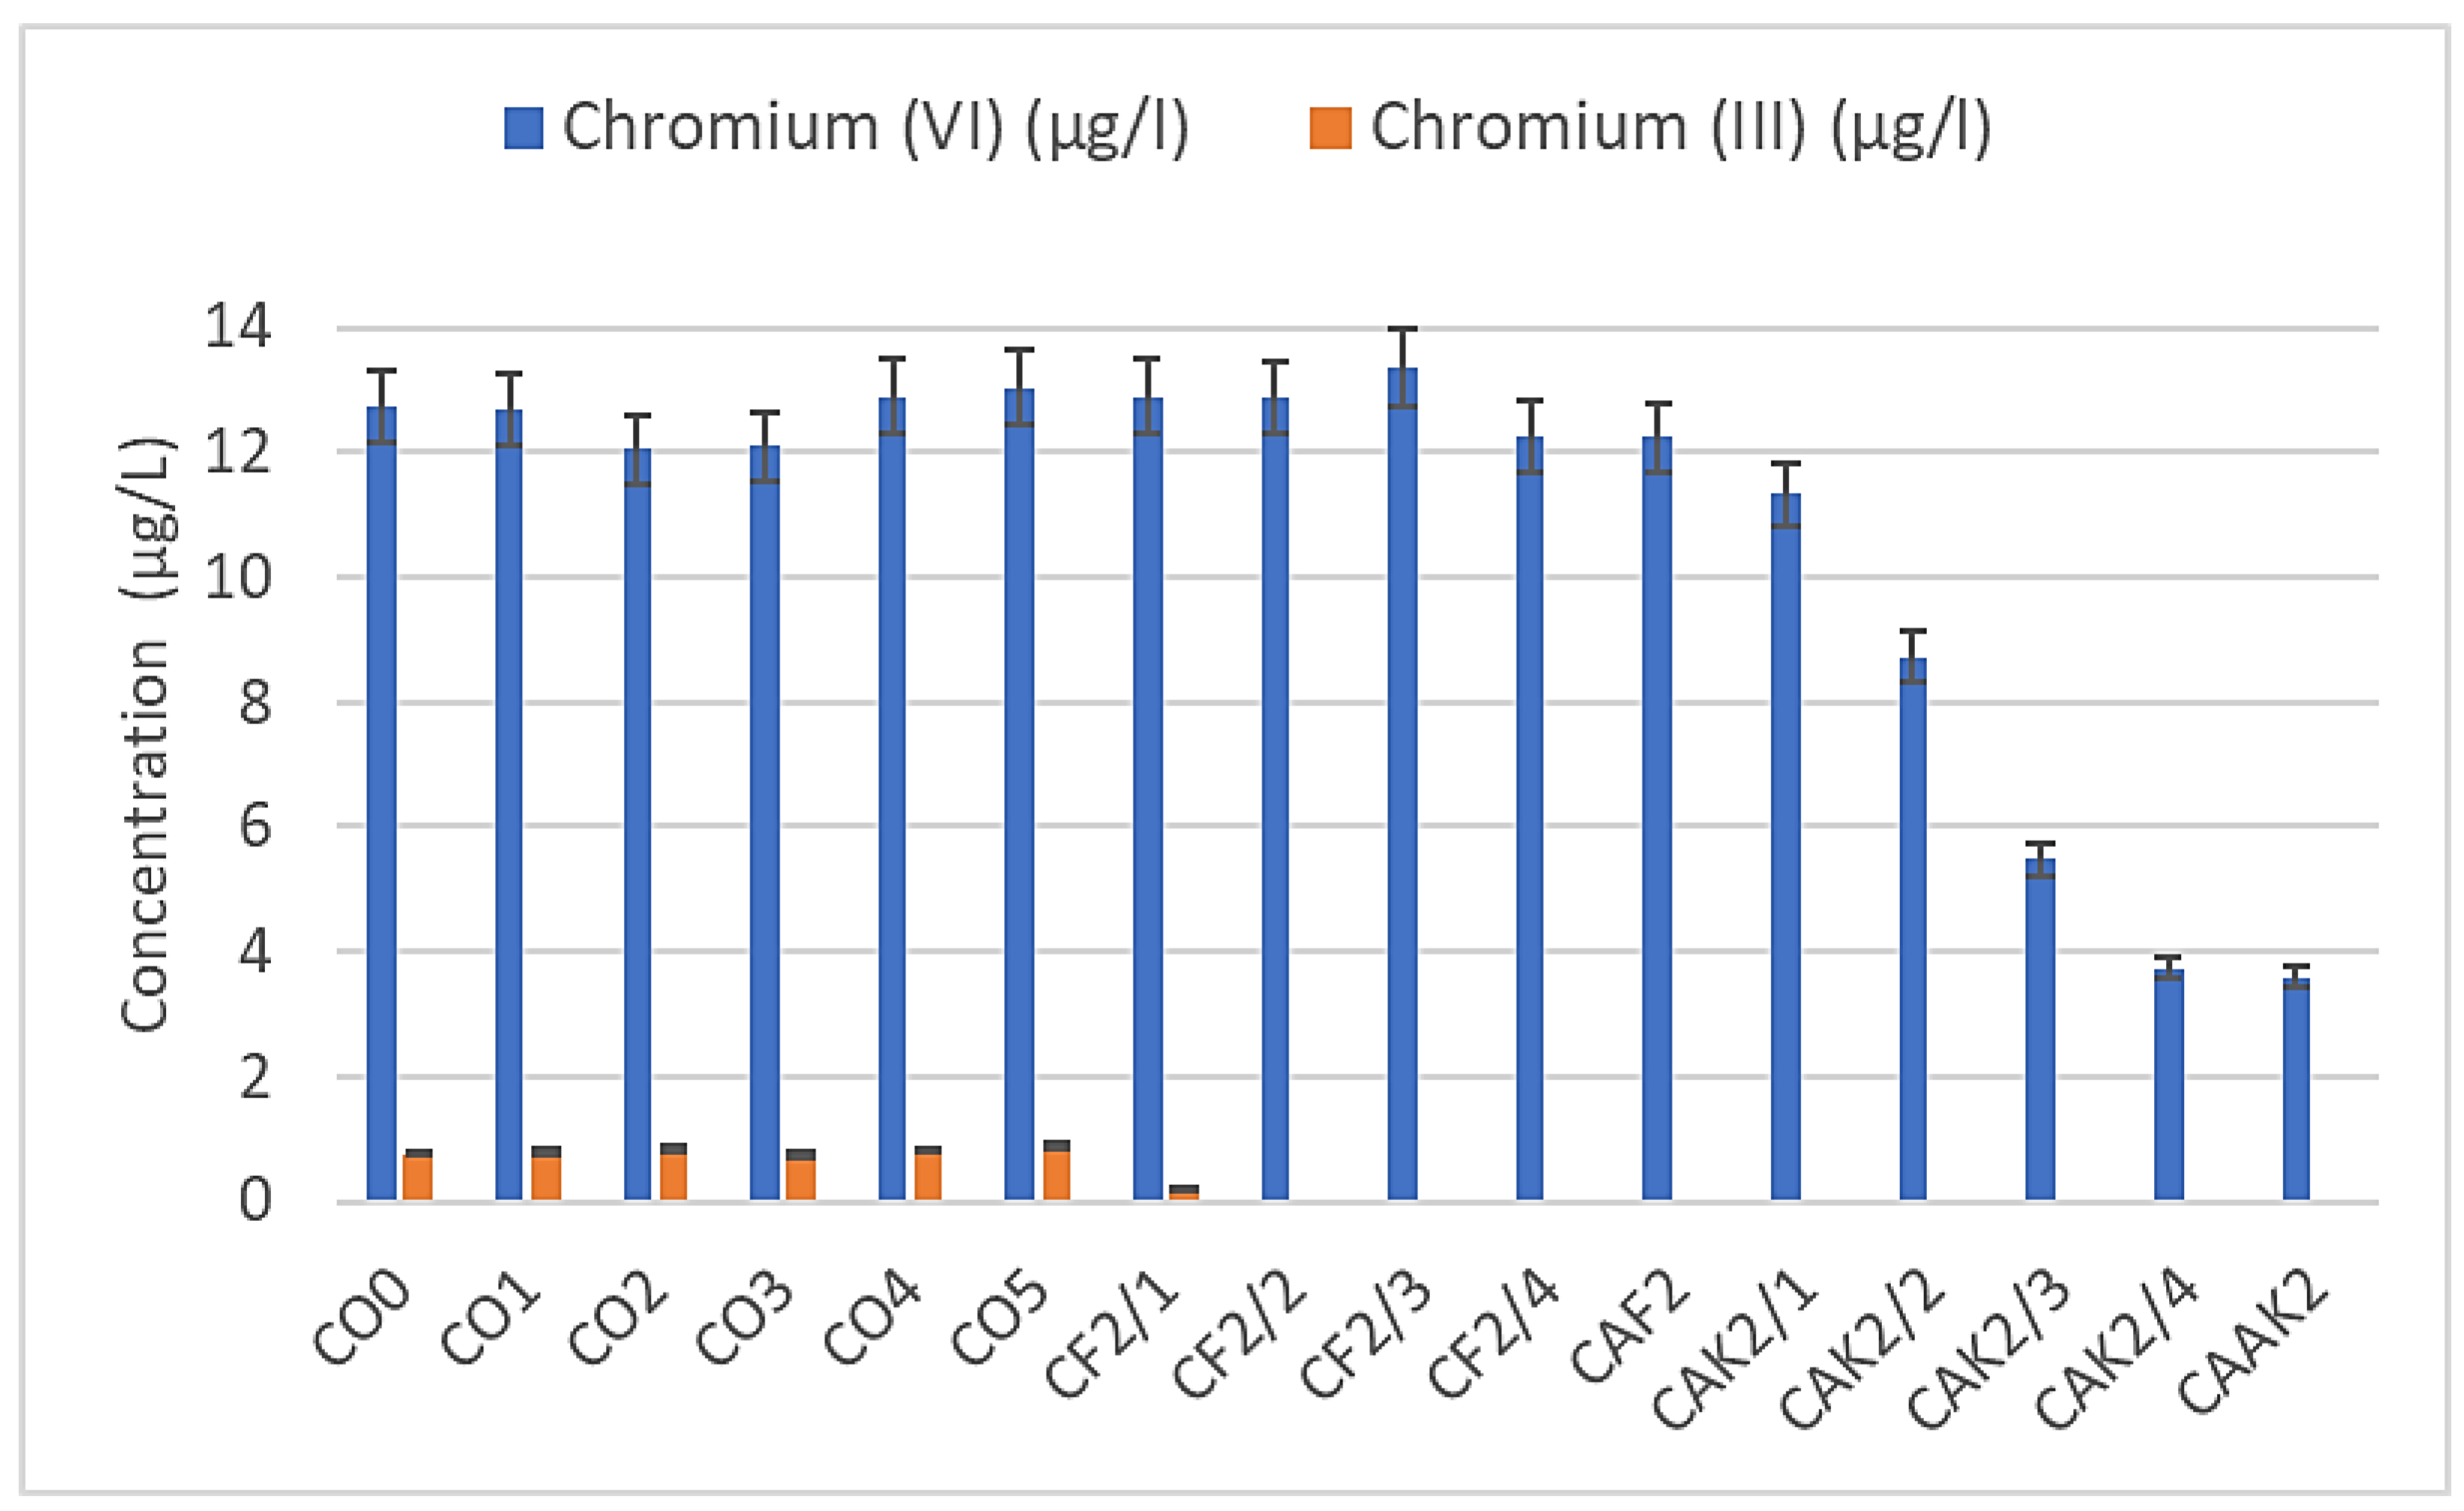
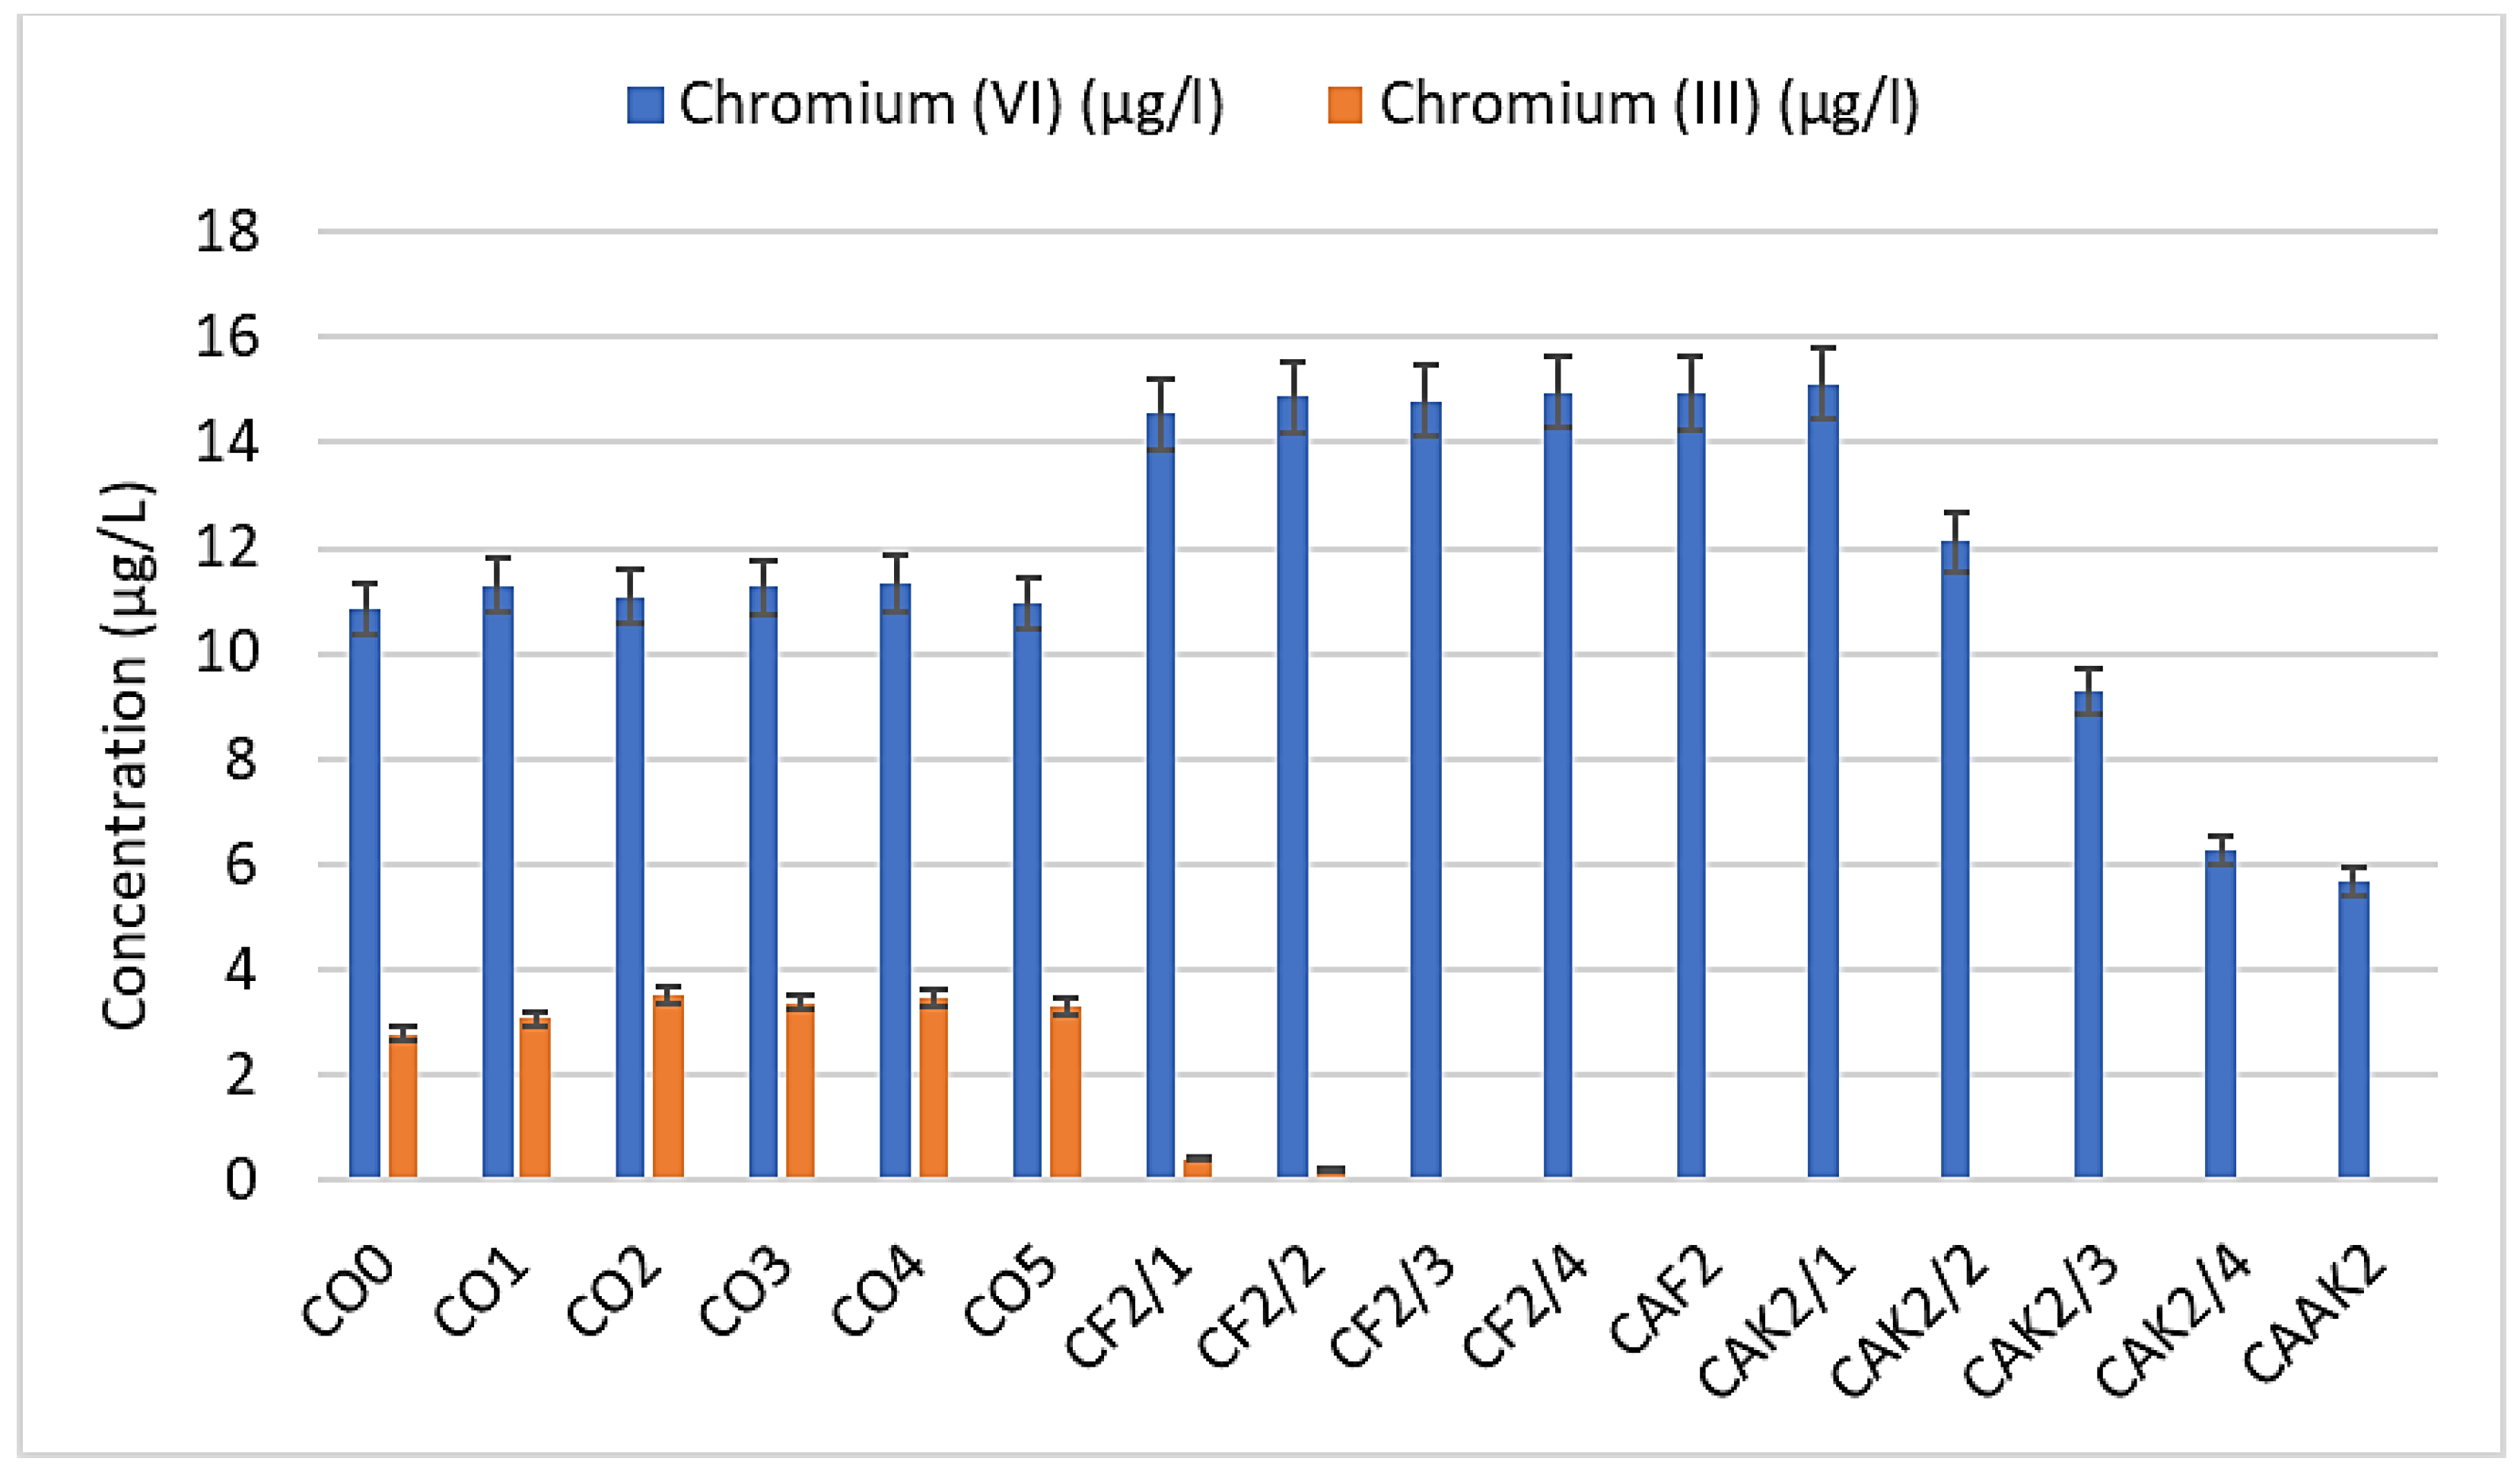
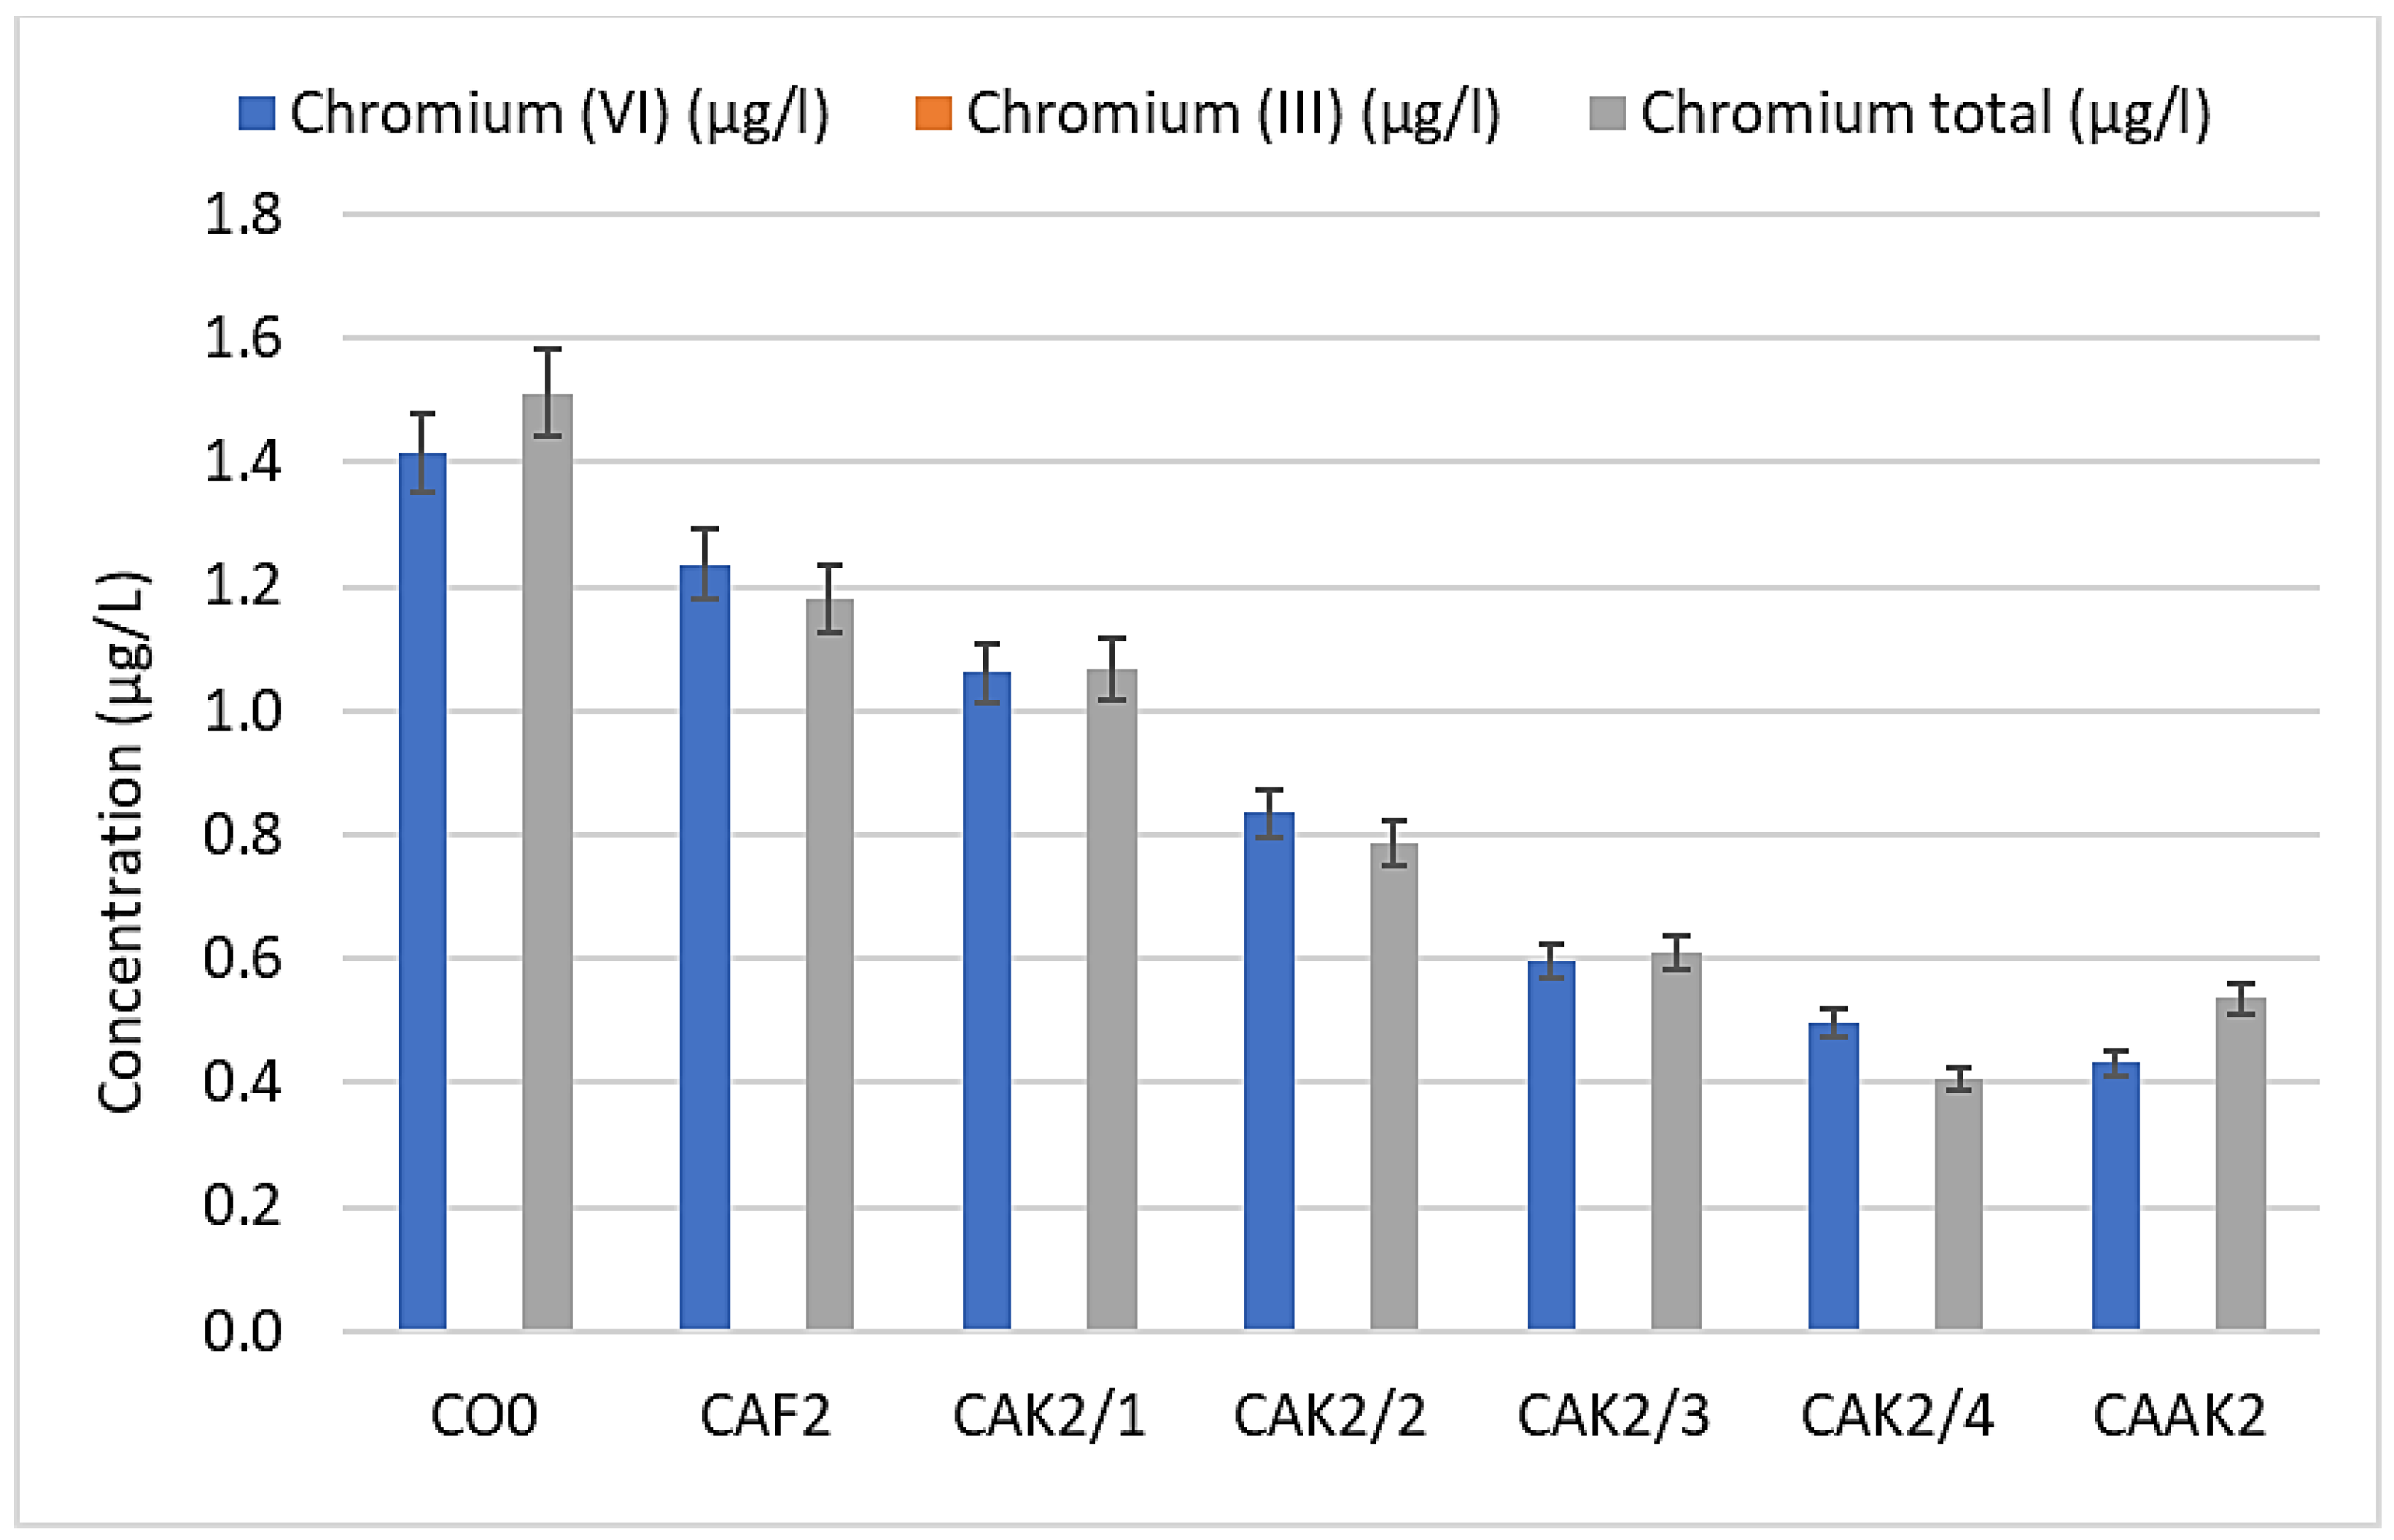
3.1. Chromium Removal by ACF Treatment
3.1.1. Pilot Plant Experiments
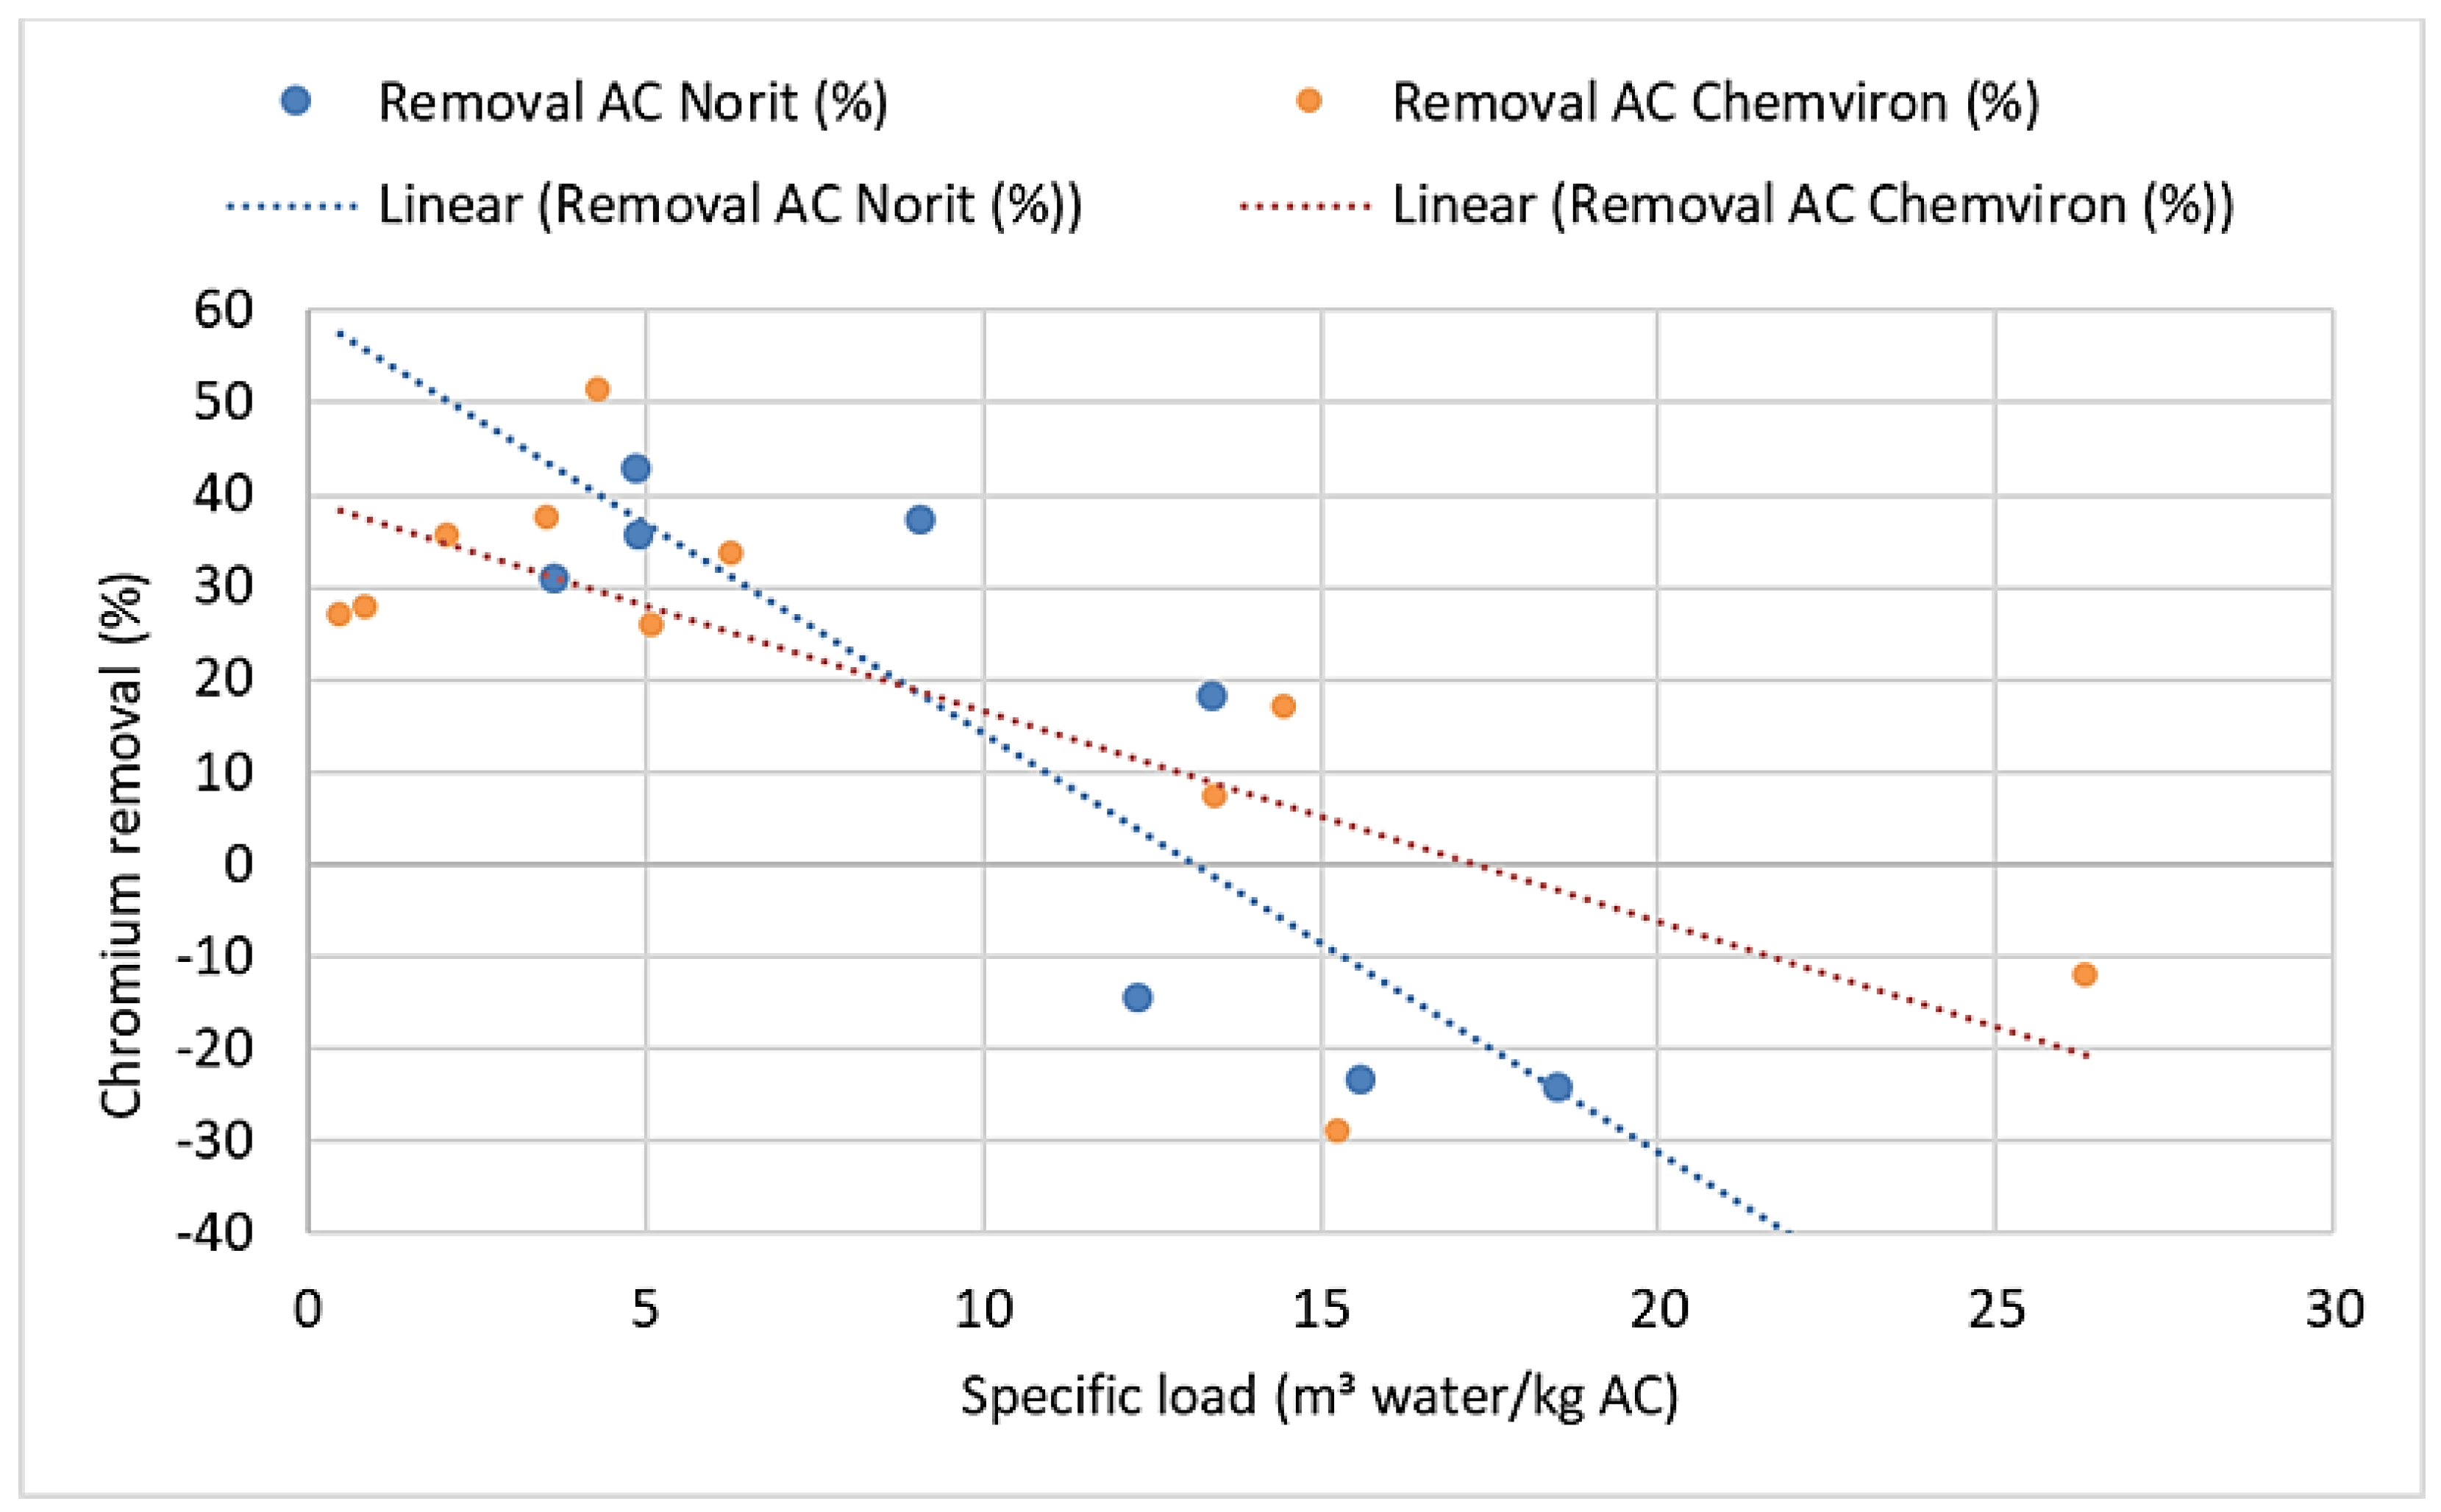
3.1.2. Transferability Investigations
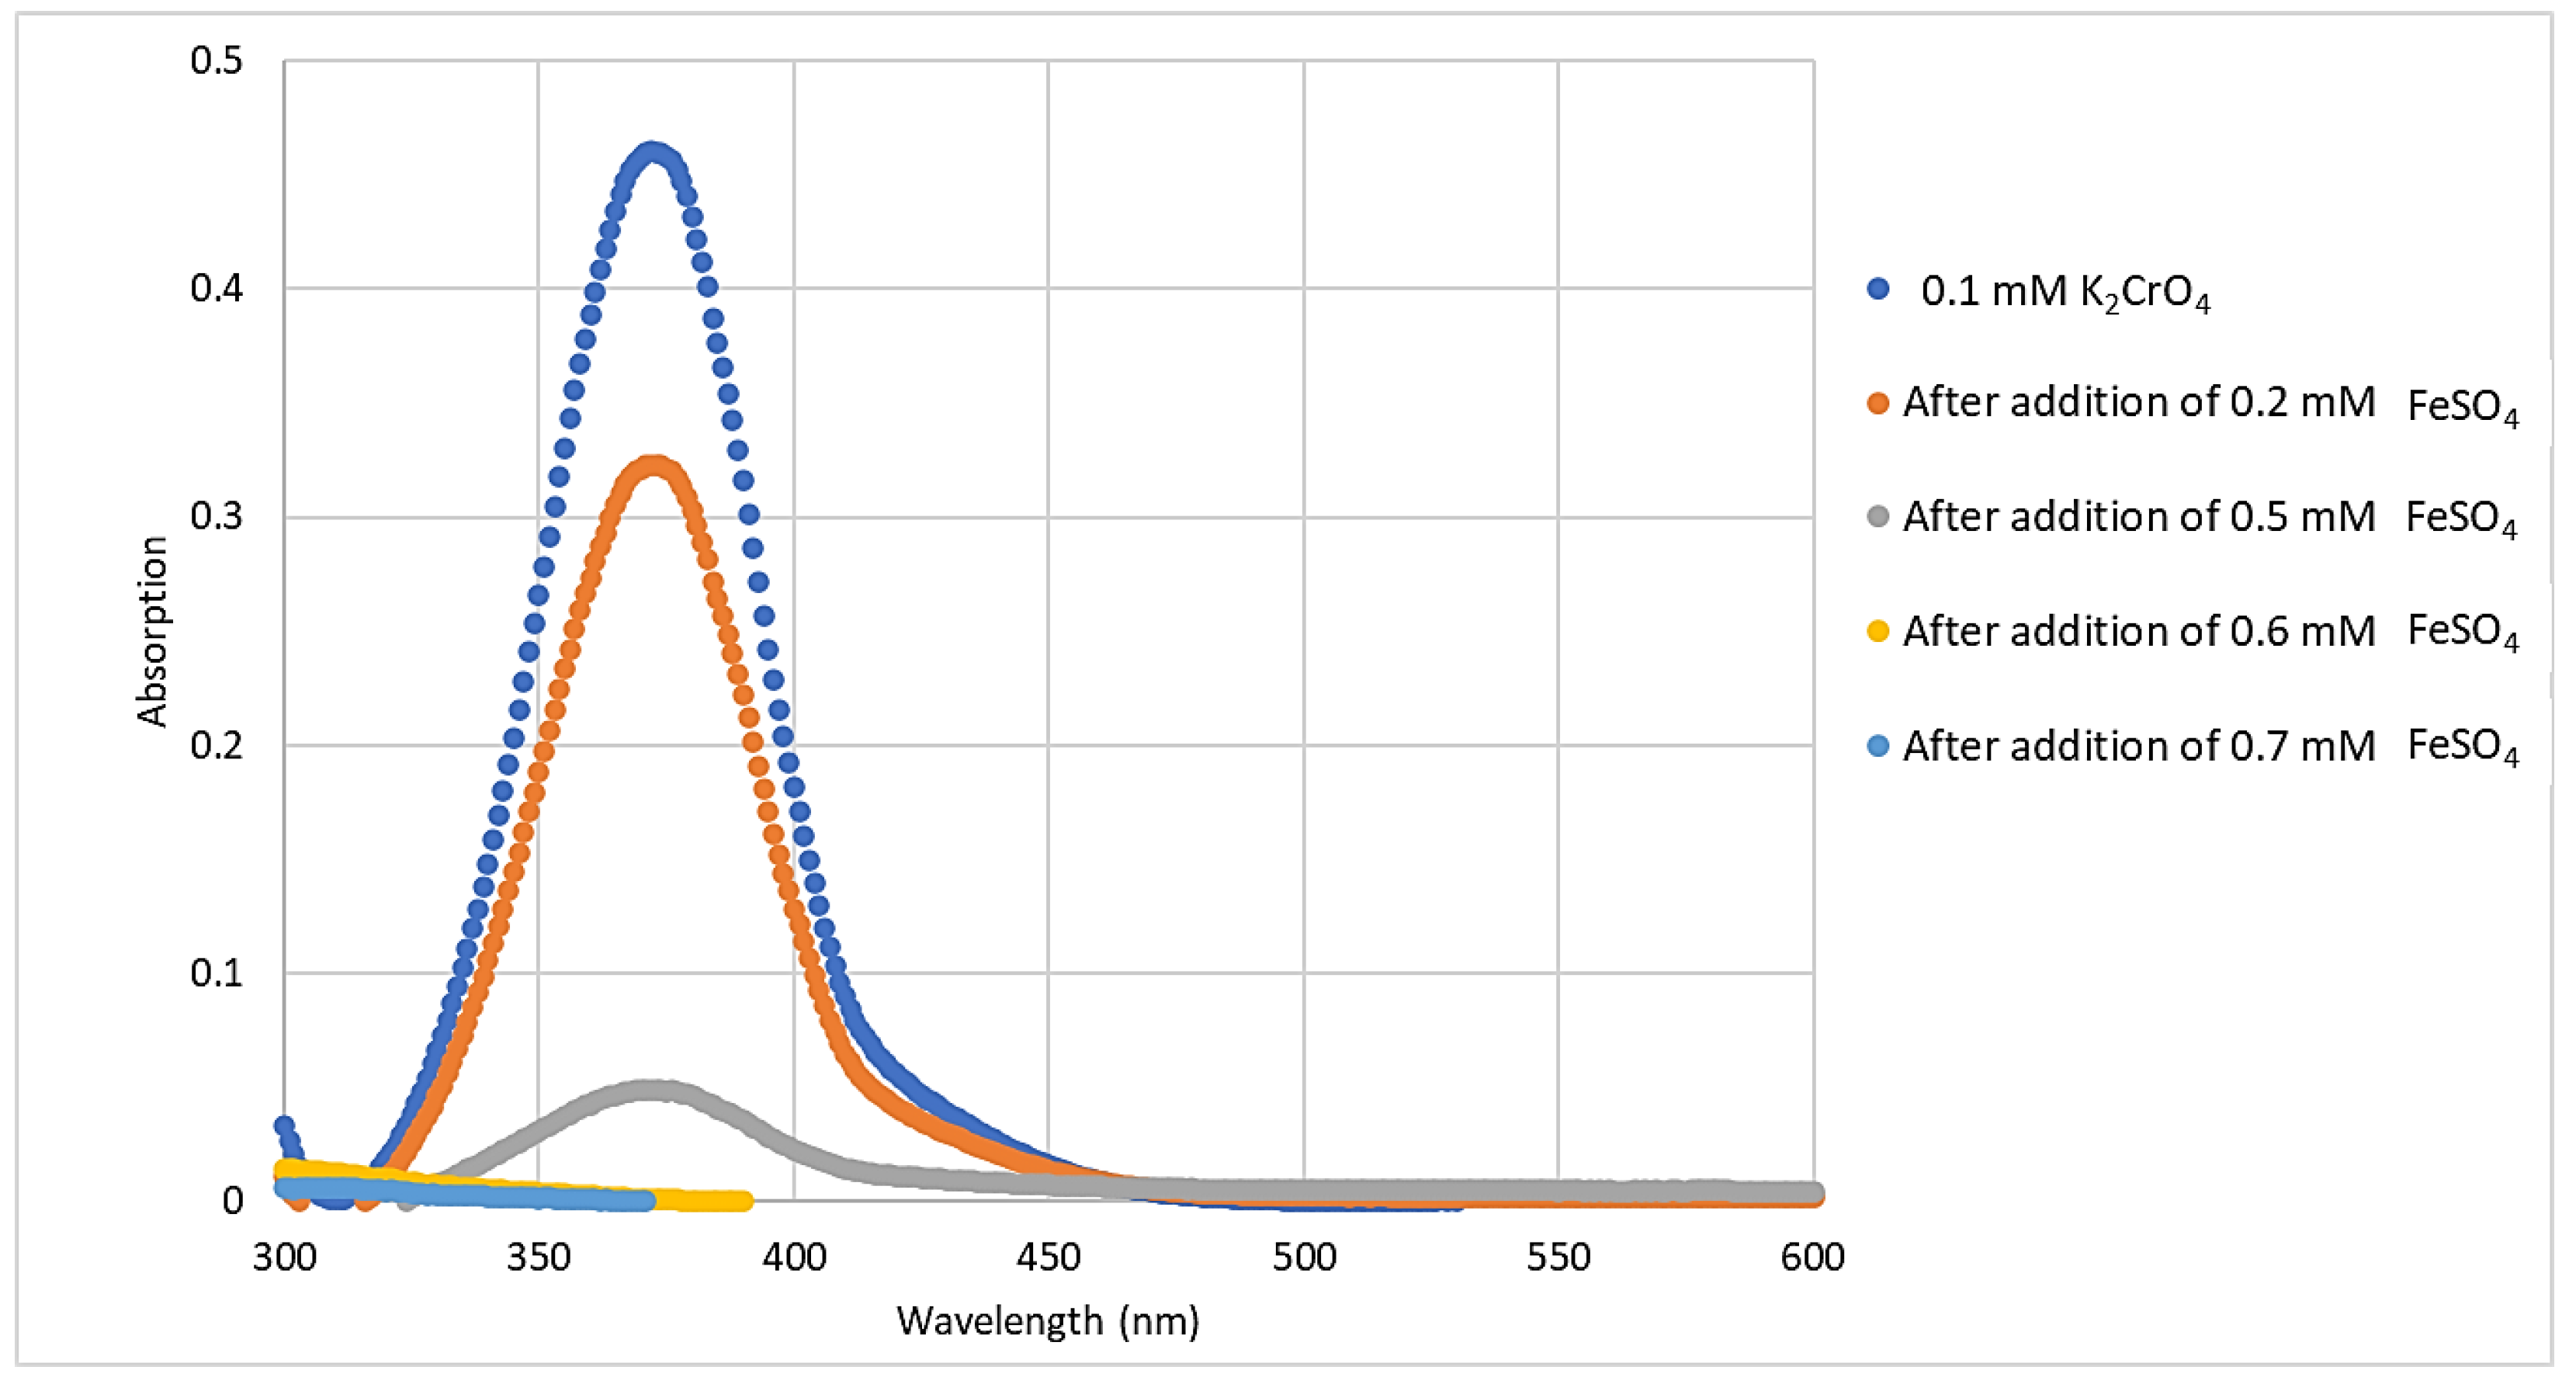
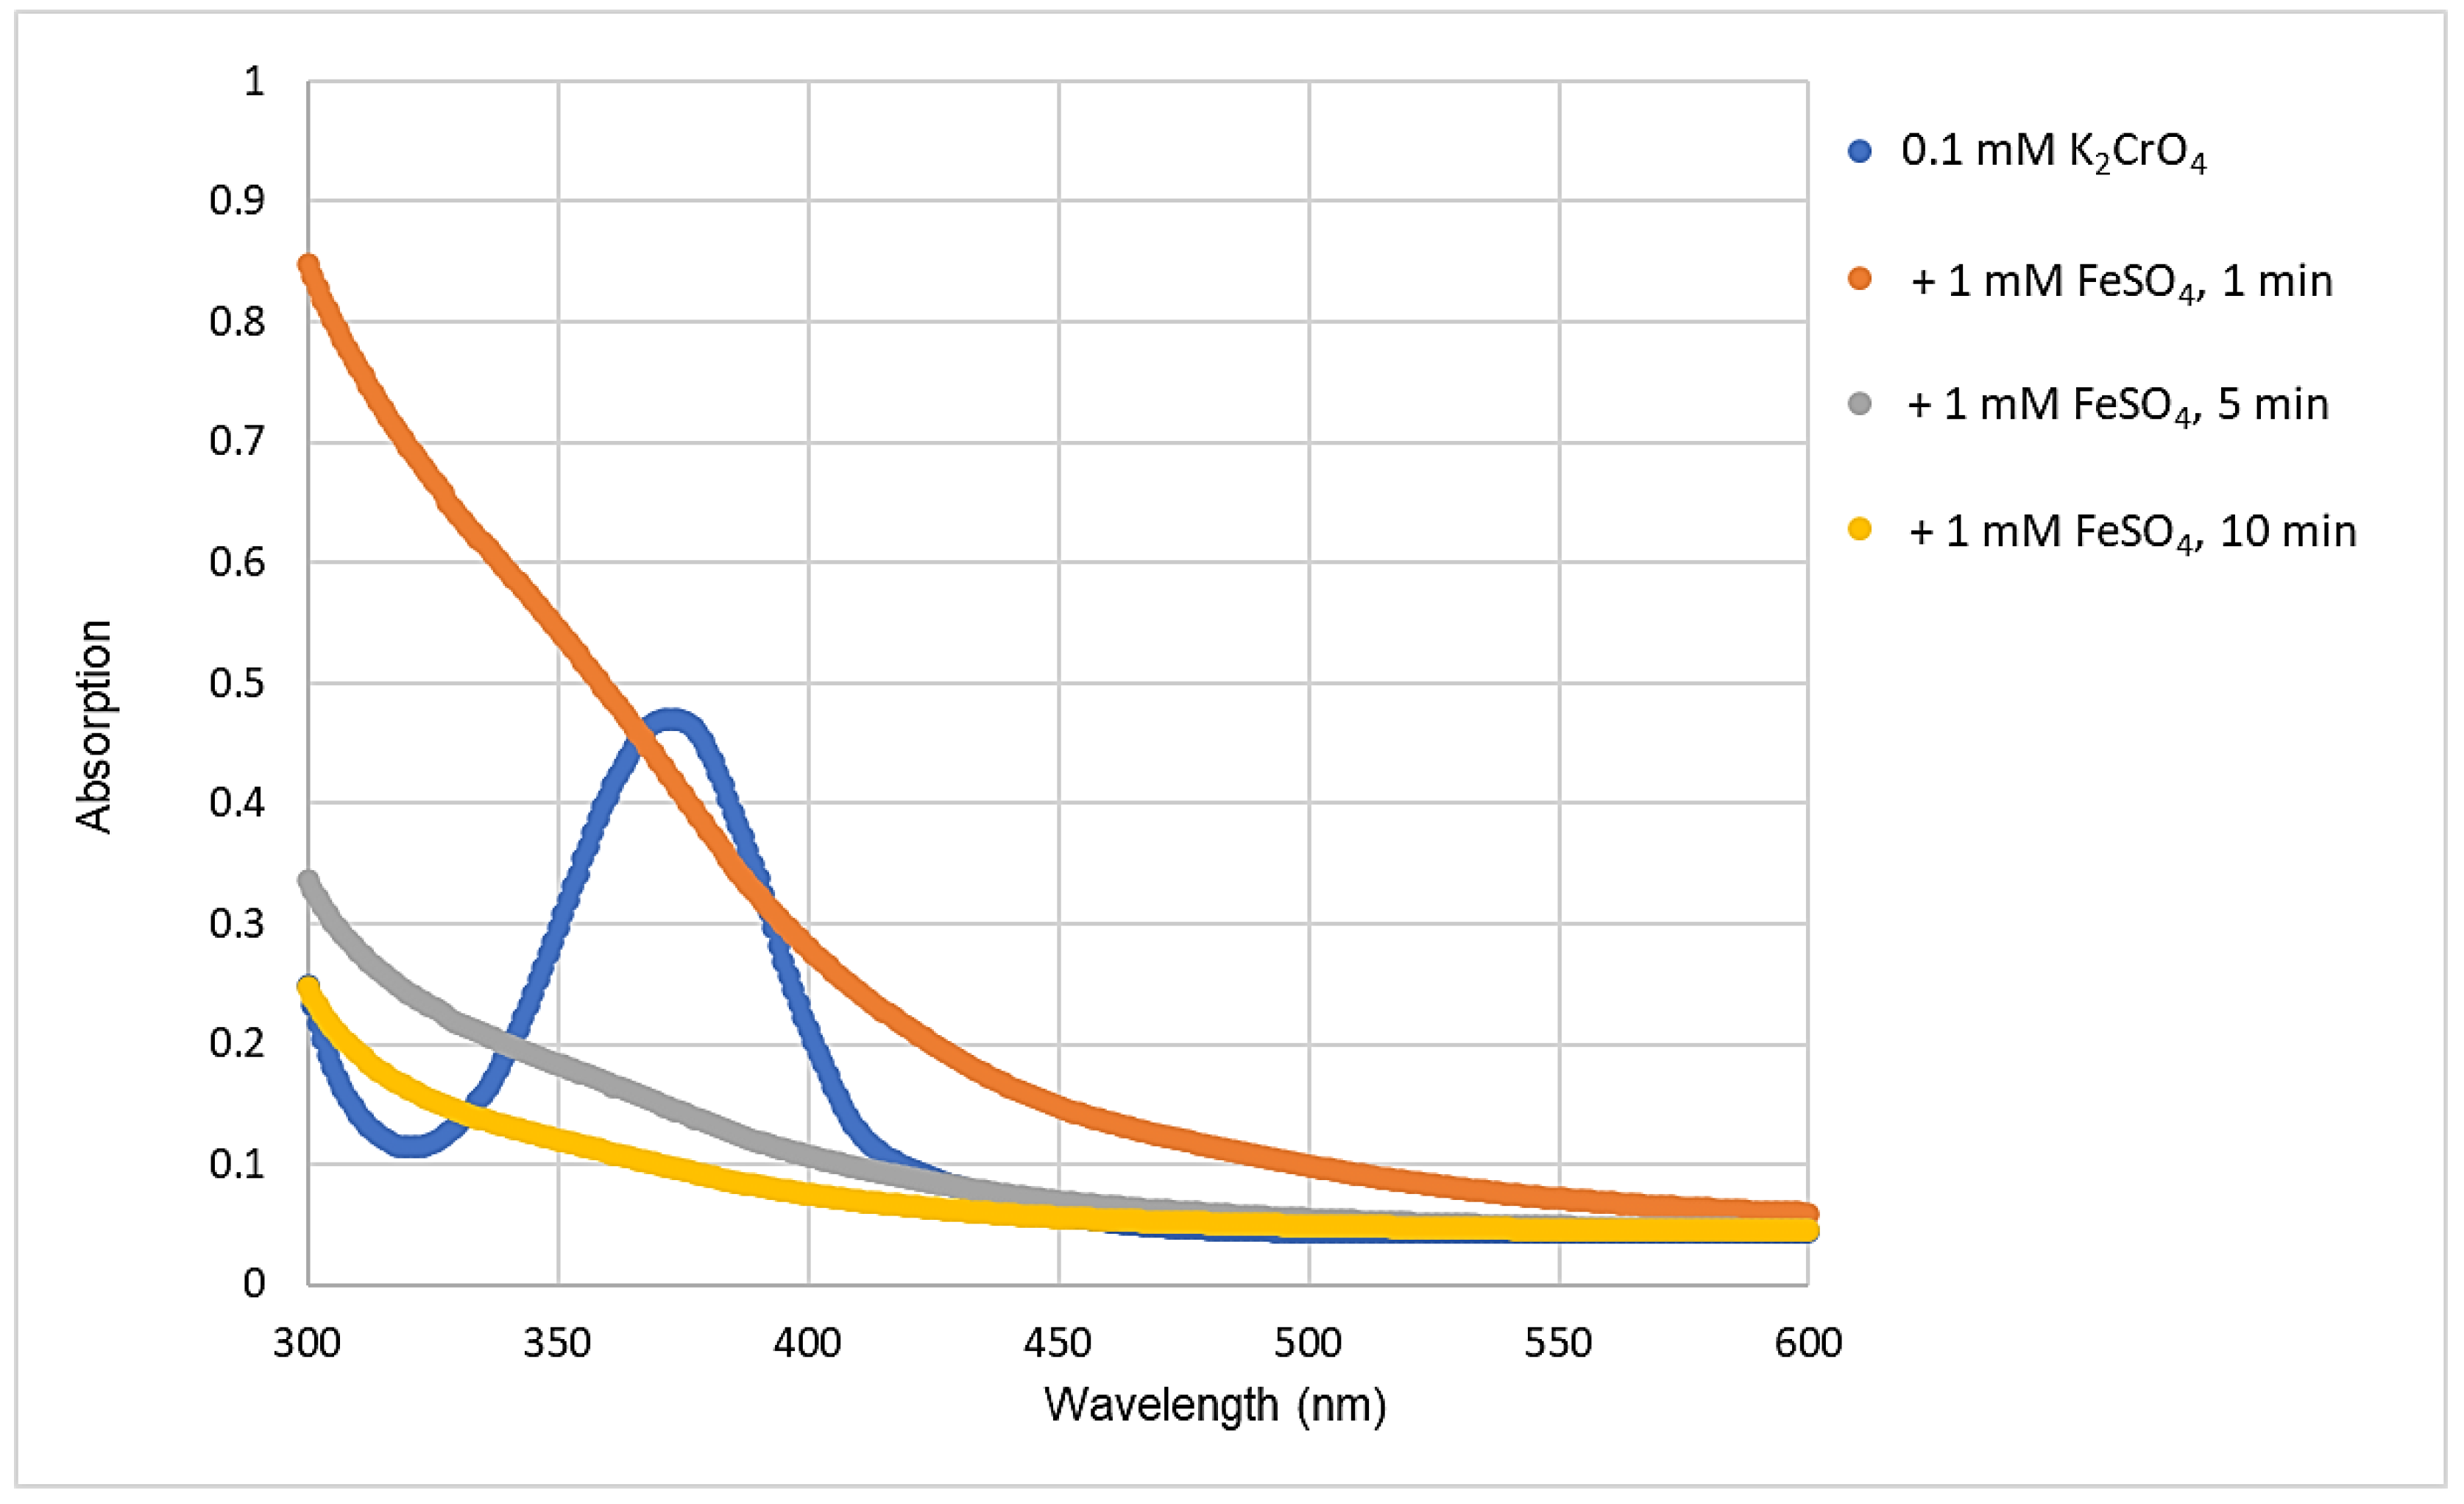
3.2. Chromium (VI) Removal by RCF Treatment
3.3. Chromium Removal by LPRO Process
4. Conclusions
Supplementary Materials
Author Contributions
Funding
Institutional Review Board Statement
Informed Consent Statement
Data Availability Statement
Acknowledgments
Conflicts of Interest
References
- Rafferty, J.P. What Is Hexavalent Chromium (or Chromium-6)? Available online: https://www.britannica.com/story/what-is-hexavalent-chromium-or-chromium-6 (accessed on 6 July 2022).
- Anger, G.; Halstenberg, J.; Hochgeschwender, K.; Scherhag, C.; Korallus, U.; Knopf, H.; Schmidt, P.; Ohlinger, M. Chromium Compounds. In Ullmann’s Encyclopedia of Industrial Chemistry; Wiley-VCH Verlag GmbH & Co.: Weinheim, Germany, 2000. [Google Scholar]
- Gorny, J.; Billon, G.; Noiriel, C.; Dumoulin, D.; Lesven, L.; Madé, B. Chromium behavior in aquatic environments: A review. Environ. Rev. 2016, 24, 503–516. [Google Scholar] [CrossRef]
- IARC Working Group on the Evaluation of Carcinogenic Risks to Humans. Arsenic, Metals, Fibres and Dusts; International Agency for Research on Cancer: Lyon, France, 2012; Volume 100. [Google Scholar]
- World Health Organization. Background Document for Development of WHO Guidelines for Drinking-Water Quality; World Health Organization: Geneva, Switzerland, 2020.
- European Union. Directive (EU) 2020/2184 of the European Parliament and of the Council of 16 December 2020 on the quality of water intended for human consumption. Off. J. Eur. Union 2020, (EU) 2020/2184. [Google Scholar]
- European Commission. Pathway to a Healthy Planet for All, Action Plan: ‘Towards Zero Pollution for Air, Water and Soil’; European Commission: Brussels, Belgium, 2021; Volume COM(2021) 400 final. [Google Scholar]
- European Union. Chemicals Strategy for Sustainability, Towards a Toxic-Free Environment; European Union: Brussels, Belgium, 2020; Volume COM(2020) 667 final. [Google Scholar]
- Fenti, A.; Chianese, S.; Iovino, P.; Musmarra, D.; Salvestrini, S. Cr(VI) Sorption from Aqueous Solution: A Review. Appl. Sci. 2020, 10, 6477. [Google Scholar] [CrossRef]
- Saputro, S.; Yoshimura, K.; Matsuoka, S.; Takehara, K.; Aizawa, J.; Tennichi, Y. Speciation of dissolved chromium and the mechanisms controlling its concentration in natural water. Chem. Geol. 2014, 364, 33–41. [Google Scholar] [CrossRef]
- Rakhunde, R.; Deshpande, L.; Juneja, H.D. Chemical speciation of chromium in water: A review. Crit. Rev. Environ. Sci. Technol. 2012, 42, 776–810. [Google Scholar] [CrossRef]
- Johnson, C.A.; Xyla, A.G. The oxidation of chromium(III) to chromium(VI) on the surface of manganite (γ-MnOOH). Geochim. Cosmochim. Acta 1991, 55, 2861–2866. [Google Scholar] [CrossRef]
- Hausladen, D.M.; Fendorf, S. Hexavalent Chromium Generation within Naturally Structured Soils and Sediments. Environ. Sci. Technol. 2017, 51, 2058–2067. [Google Scholar] [CrossRef] [PubMed]
- Jongh, C.D.; Hofman, R.; Puijker, L.; Stuyfzand, P.J. Hexavalent Chromium in Drinking Water and Its Sources—A Literature Study; KWR Watercycle Research Institute: Nieuwegein, The Netherlands, 2012. [Google Scholar]
- Pakade, V.E.; Tavengwa, N.T.; Madikizela, L.M. Recent advances in hexavalent chromium removal from aqueous solutions by adsorptive methods. RCS Adv. 2019, 9, 26142–26164. [Google Scholar] [CrossRef] [Green Version]
- McGuire, M.; Blute, N.; Fong, L.; Froelich, D.; Kavounas, P.; Qin, G. Hexavalent Chromium Removal Using Anion Exchange and Reduction with Coagulation and Filtration; AWWA Research Foundation: Glendale, CA, USA, 2007. [Google Scholar]
- Owlad, M.; Aroua, M.K.; Daud, W.A.W.; Baroutian, S. Removal of Hexavalent Chromium-Contaminated Water and Wastewater: A Review. Water Air Soil Pollut. 2008, 200, 59–77. [Google Scholar] [CrossRef]
- Pan, C.; Troyer, L.D.; Catalano, J.G.; Giammar, D.E. Dynamics of Chromium (VI) Removal from Drinking Water by Iron Electrocoagulation. Environ. Sci. Technol. 2016, 50, 13502–13510. [Google Scholar] [CrossRef]
- Biswal, S.S.; Panda, C.; Parida, S.R.; Mallick, S.K.; Jena, T.; Sahoo, J.K.; Sahu, D. Removal of Hexavalent Chromium from Industrial Wastewater Using Adsorbent Prepared from Biomass IPOMOEA. Chem. Afr. 2022, 5, 1823–1835. [Google Scholar] [CrossRef]
- Nagababu, A.; Reddy, D.S.; Mohan, G.V.K. Toxic chrome removal from industrial effluents using marine algae: Modeling and optimization. J. Ind. Eng. Chem. 2022, 114, 377–390. [Google Scholar] [CrossRef]
- Deepa, A.; Sonal, S.; Mishra, B.K. Application of co-immobilized microbial biochar beads in hybrid biofilter towards effective treatment of chrome tanning wastewater. J. Water Process Eng. 2022, 48, 102821. [Google Scholar] [CrossRef]
- Staszak, K.; Kruszelnicka, I.; Ginter-Kramarczyk, D.; Góra, W.; Baraniak, M.; Lota, G.; Regel-Rosocka, M. Advances in the Removal of Cr(III) from Spent Industrial Effluents—A Review. Materials 2023, 16, 378. [Google Scholar] [CrossRef]
- Yuan, X.; Li, J.; Luo, L.; Zhong, Z.; Xie, X. Advances in Sorptive Removal of Hexavalent Chromium (Cr(VI)) in Aqueous Solutions Using Polymeric Materials. Polymers 2023, 15, 388. [Google Scholar] [CrossRef] [PubMed]
- Liu, B.; Xin, Y.N.; Zou, J.; Khoso, F.M.; Liu, Y.P.; Jiang, X.Y.; Yu, J.G. Removal of Chromium Species by Adsorption: Fundamental Principles, Newly Developed Adsorbents and Future Perspectives. Molecules 2023, 28, 639. [Google Scholar] [CrossRef]
- Brandhuber, P. Low-Level Hexavalent Chromium Treatment Options: Bench-Scale Evaluation; AWWA Research Foundation: Denver, CO, USA, 2004. [Google Scholar]
- Giagnorio, M.; Ruffino, B.; Grinic, D.; Steffenino, S.; Meucci, L.; Zanetti, M.C.; Tiraferri, A. Achieving low concentrations of chromium in drinking water by nanofiltration: Membrane performance and selection. Environ. Sci. Pollut. Res. 2018, 25, 25294–25305. [Google Scholar] [CrossRef]
- Pérez-Candela, M.; Martín-Martínez, J.; Torregrosa-Maciá, R. Chromium (VI) removal with activated carbons. Water Res. 1995, 29, 2174–2180. [Google Scholar] [CrossRef]
- Sharma, S.K.; Petrusevski, B.; Amy, G. Chromium removal from water: A review. J. Water Supply Res. Technol. AQUA 2008, 57, 541–553. [Google Scholar] [CrossRef]
- Han, I.; Schlautman, M.A.; Batchelor, B. Removal of Cr (VI) from Groundwater by Granular Activated Carbon. Water Environ. Res. 2000, 72, 29–39. [Google Scholar] [CrossRef]
- Eary, L.E.; Rai, D. Chromate Removal from Aqueous Wastes by Reduction with Ferrous Ion. Environ. Sci. Technol. 1988, 22, 972–977. [Google Scholar] [CrossRef] [PubMed]
- Ahn, M. Remediation of Chromium (VI) in the Vadose Zone: Stoichiometry and Kinetics of Chromium (VI) Reduction by Sulfur Dioxide; Texas A&M University: College Station, TX, USA, 2004. [Google Scholar]
- Barrera-Díaz, C.E.; Lugo-Lugo, V.; Bilyeu, B. A review of chemical, electrochemical and biological methods for aqueous Cr (VI) reduction. J. Hazard. Mater. 2012, 223–224, 1–12. [Google Scholar] [CrossRef] [PubMed]
- Papadopoulos, G.; Asimakidou, T.; Karfaridis, D.; Kellartzis, I.; Vourlias, G.; Mitrakas, M.; Simeonidis, K. An Optimized Cr (VI)-Removal System Using Sn-based Reducing Adsorbents. Water 2019, 11, 2477. [Google Scholar] [CrossRef] [Green Version]
- Umweltbundesamt. Bekanntmachung der Liste der Aufbereitungsstoffe und Desinfektionsverfahren gemäß § 11 der Trinkwasserverordnung—22 Änderung; Umweltbundesamt: Berlin, Germany, 2020; p. 31. [Google Scholar]
- Buerge, I.J.; Hug, S.J. Kinetics and pH dependence of chromium (VI) by iron. Environ. Sci. Technol. 1997, 31, 1426–1432. [Google Scholar] [CrossRef]
- Melin, T.; Rautenbach, R. Membranverfahren—Grundlagen der Modul- und Anlagenauslegung; Springer: Berlin/Heidelberg, Germany, 2007. [Google Scholar]
- Konradt, N.; Kuhlen, J.G.; Rohns, H.P.; Schmitt, B.; Fischer, U.; Binder, T.; Schumacher, V.; Wagner, C.; Kamphausen, S.; Müller, U.; et al. Removal of Trace Organic Contaminants by Parallel Operation of Reverse Osmosis and Granular Activated Carbon for Drinking Water Treatment. Membranes 2021, 11, 33. [Google Scholar] [CrossRef]
- Zargar, F.H. Separation of Hexavalent Chromium from Water Using Nanofiltration. In Proceedings of the International Conference on Trade, Tourism and Management (ICTTM’2012), Bangkok, Thailand, 21–22 December 2012; pp. 134–138. [Google Scholar]
- Mnif, A.; Bejaoui, I.; Mouelhi, M.; Hamrouni, B. Hexavalent Chromium Removal from Model Water and Car Shock Absorber Factory Effluent by Nanofiltration and Reverse Osmosis Membrane. Int. J. Anal. Chem. 2017, 2017, 7415708. [Google Scholar] [CrossRef]
- Barikbin, B.; Mortazavi, B.; Moussavi, G. Removal of Hexavalent Chromium and Total Dissolved Solids from Water Using Nanofiltration. In Proceedings of the 4th International Conference on Chemical, Biological and Environmental Engineering (IPCBEE), Singapore, 9–11 October 2009; pp. 140–143. [Google Scholar]
- Tandon, R.K.; Crisp, P.T.; Ellis, J.; Baker, R.S. Effect of pH on chromium (VI) species. Talanta 1984, 31, 227–228. [Google Scholar] [CrossRef]
- Toray. Ultra Low Pressure BWRO Elements—TMH10A; Toray Membrane Europe AG: Münchenstein, Switzerland, 2019. [Google Scholar]
- ISO 17294-2:2016; Application of Inductively Coupled Plasma Mass Spectrometry (ICP-MS)—Part 2: Determination of Selected Elements Including Uranium Isotopes. International Organization for Standardization (ISO): Geneva, Switzerland, 2016; p. 31.
- Kotaś, J.; Stasicka, Z.J.E.P. Chromium occurrence in the environment and methods of its speciation. Environ. Pollut. 2000, 107, 263–283. [Google Scholar] [CrossRef]
- Sullivan, P.; Wiederin, D. Low-Pressure Chromium Speciation in Drinking Water using the SC-DX chromFAST System with ICPMS Detection. In Application Note—Low-Pressure Cr Speciation; Elemental Scientific: Omaha, NE, USA, 2011. [Google Scholar]
- Rai, D.; Sass, B.M.; Moore, D.A. Chromium(III) hydrolysis constants and solubility of chromium(III) hydroxide. Inorg. Chem. 1987, 26, 345–349. [Google Scholar] [CrossRef]
- Attia, A.A.; Khedr, S.A.; Elkholy, S.A. Adsorption of Chromium Ion (VI) by acid Activated Carbon. Braz. J. Chem. Eng. 2010, 27, 183–193. [Google Scholar] [CrossRef]
- Di Natale, F.; Lancia, A.; Molino, A.; Musmarra, D. Removal of chromium ions form aqueous solutions by adsorption on activated carbon and charcoal. J. Hazard. Mater. 2007, 145, 381–390. [Google Scholar] [CrossRef] [PubMed]
- Chen, Y.; An, D.; Sun, S.; Gao, J.; Qian, L. Reduction and Removal of Chromium VI in Water by Powdered Activated Carbon. Materials 2018, 11, 269. [Google Scholar] [CrossRef] [PubMed] [Green Version]
- Pettine, M.; D’ottone, L.; Campanella, L.; Millero, F.J.; Passino, R. The Reduction of chromium (VI) by iron (II) in aqueous solutions. Geochim. Cosmochim. Acta 1998, 62, 1509–1519. [Google Scholar] [CrossRef]
- Mahringer, D.; Zerelli, S.S.; Dippon, U.; Ruhl, A.S. Pilot scale hexavalent chromium removal with reduction, coagulation, filtration and biological iron oxidation. Sep. Purif. Technol. 2020, 253, 117478. [Google Scholar] [CrossRef]


| pH | Chromate (%) | Hydrogen Chromate (%) |
|---|---|---|
| 5.6 | 13.7 | 86.3 |
| 6.5 | 50.0 | 50.0 |
| 7.6 | 92.6 | 7.4 |
| 8.3 | 99.4 | 1.6 |
| Parameter | F300 | F300, Multiple Reactivated | F207c |
|---|---|---|---|
| Base material | hard coal | hard coal | coconut |
| Iodine Number (mg/g) | 974 | n.a. 3 | 1100 |
| Abrasion number (min) | 85 | n.a. 3 | 97 |
| Ash, weight (%) 1 | 31.8 | 25.2 | 3.29 |
| Apparent density (g/mL) | 0.538 | 0.542 | 0.565 |
| Calcium (mg/kg) 2 | 695 | 5000 | 594 |
| Chromium (mg/kg) 2 | 640 | 422 | 557 |
| Iron (mg/kg) 2 | 5660 | 5790 | 3090 |
| Manganese (mg/kg) 2 | 48.1 | 83.9 | 44.1 |
| Component | Specification |
|---|---|
| Aeration/storage tank | Cylindrical tank, height: 120 cm, diameter 160 cm; filling height (control size): 70 cm, with built-in ventilation (air/water ratio = 1:3). |
| Continuous flow reactor (CFR) | Height 250 cm, diameter 75.5 cm; flow time from dosing point 2 to CO5 at a flow of 2 m3/h is 22 min. |
| Anthracite filter (ACF line) | Height: 150 cm, diameter 75.5 cm. Supporting layer: 10 cm gravel, grain size 30 mm; 150 cm anthracite (Aquazit N, Type I), grain size 0.8–1.6 mm; from Euroquarz, Dorsten, Germany; flow time from dosing point 2 to CAF2 at a flow of 2 m3/h is 48 min. |
| AC filter | Height 250 cm, diameter 75.5 cm filled with Hydraffin XC 30 (8 × 30), bulk density 450 kg/m3, 318.6 kg; reagglomerated activated carbon based on hard coal (Donau Carbon GmbH, Frankfurt, Germany); flow time from dosing point 2 to CAAK2 at a flow of 2.0 m3/h is 84 min. |
| Multilayer filter (LPRO line) | Height 150 cm, diameter 75.5 cm. Supporting layer: 10 cm gravel, grain size 30 mm; 80 cm silica sand, grain size 0.71–1.25 mm; and 70 cm anthracite, grain size 1.4–2.5 mm (Aquazit N, Type II); from Euroquarz, Dorsten, Germany. |
| Antiscalant | Cublen D 5113 (active substance: Diethylenetriamine pentakismethyl phosphonic acid, DTPMP) at 0.2 g P/m3 in feed; from Zschimmer & Schwarz Chemie GmbH, Lahnstein, Germany. |
| Parameter | Unit | Value |
|---|---|---|
| Medium flux | L/m2/h | 22 |
| Raw water flow | m3/h | 1.7 |
| Feed flow | m3/h | 2.1 |
| Total permeate flow | m3/h | 1.4 |
| Total concentrate flow | m3/h | 0.29 |
| Recirculation flow | m3/h | 0.44 |
| Recovery | % | 83 |
| Feed conductivity | µS/cm | 736–822 |
| Permeate conductivity | µS/cm | 32–62 |
| Feed pH | 7.4–7.5 | |
| Operating pressure | bar | 6.7 |
| Temperature | °C | 13 |
| Experiment | Dosage | Specific Load (m3 Water/kg AC) |
|---|---|---|
| 1. | 10 µg/L Cr (VI) as potassium chromate + 10 µg/L Cr (III) as chromium (III) chloride | 29.5 |
| 2. | 10 µg/L Cr (VI) as potassium chromate + 10 µg/L Cr (III) as chromium (III) nitrate | 38.5 |
| 3. | 1 µg/L Cr (VI) as potassium chromate + 1 µg/L Cr (III) as chromium (III) nitrate | 43.0 |
| 4. | 10 µg/L Cr (VI) as potassium chromate | 86.5 |
| Experiment | Dosage |
|---|---|
| 1. | 10 µg/L potassium chromate and 6 mg/L ferrous sulfate |
| 2. | 1 µg/L potassium chromate and 2 mg/L ferrous sulfate |
| 3. | 10 µg/L potassium chromate and 1 mg/L ferrous sulfate |
| 4. | 10 µg/L potassium chromate and 2 mg/L ferrous sulfate |
| Experiment | Dosage | pH Value |
|---|---|---|
| 1. | 10 µg/L chromium (III) chloride | 7.7 |
| 2. | 10 µg/L potassium chromate | 7.7 |
| 3. | 10 µg/L chromium (III) nitrate | 7.4 |
| 4. | 10 µg/L potassium chromate | 7.6 |
| 5. | 10 µg/L potassium chromate | 6.5 |
| 6. | 10 µg/L potassium chromate | 5.6 |
| 7. | 10 µg/L potassium chromate | 8.3 |
| Activated Charcoal | Cr (VI) Adsorption Capacity (mg/g) |
|---|---|
| F300, fresh | 1.89 |
| F300, reactivated | 0.28 |
| F300, reactivated, acid-treated | 0.34 |
| F207c, fresh | 1.49 |
| F207c, reactivated | 1.16 |
| Concentrations of Reactants | Ratio of Cr (VI)/Fe (II) | Removal of Cr (VI) (%) |
|---|---|---|
| 10 µg/L Cr (VI) + 6 mg/L Fe (II) | 1:559 | complete 1 |
| 10 µg/L Cr (VI) + 2 mg/L Fe (II) | 1:186 | complete 1 |
| 10 µg/L Cr (VI) + 1 mg/L Fe (II) | 1:93 | 97.5 |
| 1 µg/L Cr (VI) + 2 mg/L Fe (II) | 1:1862 | complete 1 |
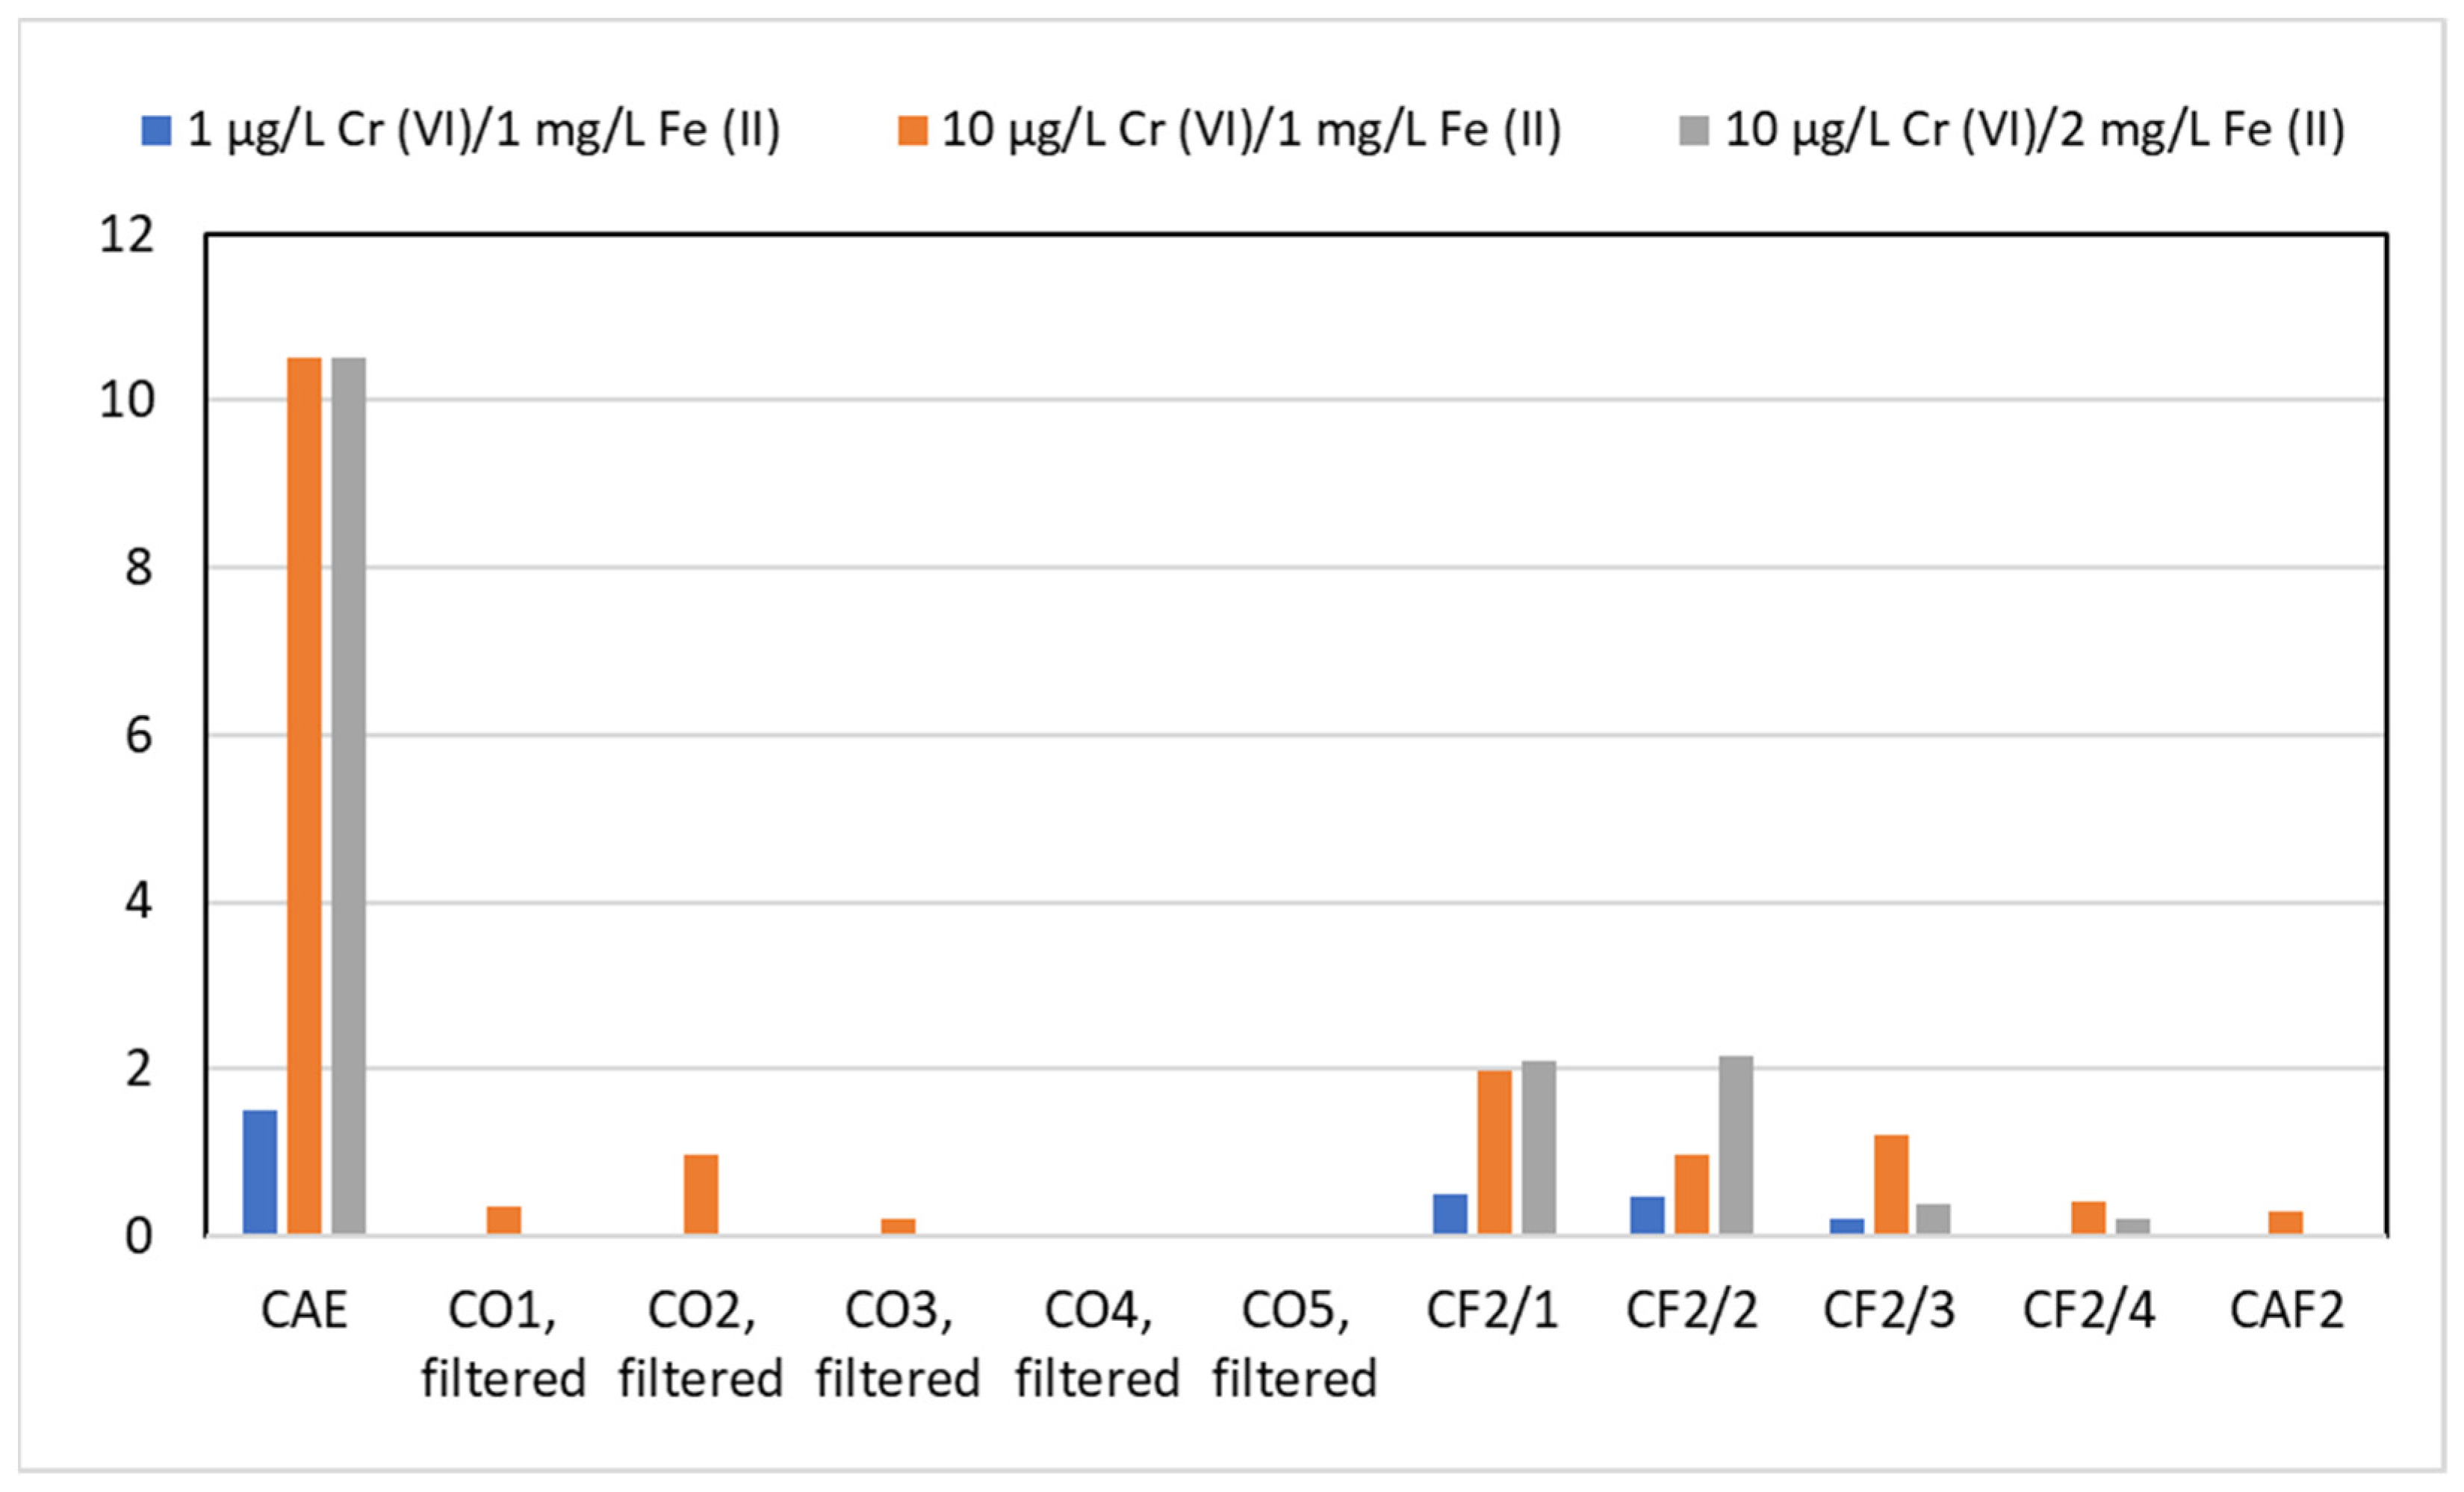
| Sampling Point | Total Chromium (µg/L) |
|---|---|
| CAE | 10.5 |
| CO1, filtered | <0.15 |
| CO2, filtered | <0.15 |
| CO3, filtered | <0.15 |
| CO4, filtered | <0.15 |
| CO5, filtered | <0.15 |
| CF2/1 | 2.11 |
| CF2/2 | 2.16 |
| CF2/3 | 0.39 |
| CF2/4 | 0.22 |
| CAF2 | <0.15 |
| Dosage | Sodium Rejection (%) | Calcium Rejection (%) | Chromium Rejection (%) |
|---|---|---|---|
| 10 µg/L Cr as Cr(NO3)3, pH 7.4 | 96.0 | >99.3 | >99.5 |
| 10 µg/L Cr as CrCl3, pH 7.7 | 96.2 | >99.1 | 98.9 |
| Dosage | pH-Value | Chromium (VI) Rejection (%) |
|---|---|---|
| 10 µg/L Cr as K2CrO4 | 5.6 | >99.2 |
| 10 µg/L Cr as K2CrO4 | 6.5 | >99.1 |
| 10 µg/L Cr as K2CrO4 | 7.6 | 99.2 |
| 10 µg/L Cr as K2CrO4 | 7.7 | >99.3 |
| 10 µg/L Cr as K2CrO4 | 8.3 | >99.2 |
| Sampling Point | Influent (µg/L) | Average in Bulk (µg/L) | Permeate (µg/L) | Rejection (%) |
|---|---|---|---|---|
| Influent LPRO with antiscalant | 9.5 | |||
| Pressure vessel 1 | 18.3 2 | 21.9 2 | <0.25 | >98.9 |
| Pressure vessel 2 | 25.6 | 28.5 2 | 0.34 | 98.8 |
| Pressure vessel 3 | 31.4 | 33.8 2 | 0.29 | 99.2 |
| Pressure vessel 4 | 36.1 | 43.9 2 | 0.30 | 99.3 |
| Outlet LPRO (brine) | 51.6 | |||
| Total | 30.0 2 | 0.25 | 99.2 |
Disclaimer/Publisher’s Note: The statements, opinions and data contained in all publications are solely those of the individual author(s) and contributor(s) and not of MDPI and/or the editor(s). MDPI and/or the editor(s) disclaim responsibility for any injury to people or property resulting from any ideas, methods, instructions or products referred to in the content. |
© 2023 by the authors. Licensee MDPI, Basel, Switzerland. This article is an open access article distributed under the terms and conditions of the Creative Commons Attribution (CC BY) license (https://creativecommons.org/licenses/by/4.0/).
Share and Cite
Konradt, N.; Dillmann, S.; Becker, J.; Schroden, D.; Rohns, H.-P.; Wagner, C.; Müller, U.; Konradt, D.; Janknecht, P.; Hobby, R.; et al. Removal of Chromium Species from Low-Contaminated Raw Water by Different Drinking Water Treatment Processes. Water 2023, 15, 516. https://doi.org/10.3390/w15030516
Konradt N, Dillmann S, Becker J, Schroden D, Rohns H-P, Wagner C, Müller U, Konradt D, Janknecht P, Hobby R, et al. Removal of Chromium Species from Low-Contaminated Raw Water by Different Drinking Water Treatment Processes. Water. 2023; 15(3):516. https://doi.org/10.3390/w15030516
Chicago/Turabian StyleKonradt, Norbert, Saskia Dillmann, Jennifer Becker, Detlef Schroden, Hans-Peter Rohns, Christoph Wagner, Uwe Müller, Daniel Konradt, Peter Janknecht, Ralph Hobby, and et al. 2023. "Removal of Chromium Species from Low-Contaminated Raw Water by Different Drinking Water Treatment Processes" Water 15, no. 3: 516. https://doi.org/10.3390/w15030516