
Interaction of Silica Nanoparticles with Microalgal Extracellular Polymers
by
 , , and
Petra Vukosav
1 ,
,
Lea Pašalić
2,
Danijela Bakarić
2,
Darija Domazet Jurašin
3 and
Tea Mišić Radić
1,* 1
Division for Marine and Environmental Research, Ruđer Bošković Institute, Bijenička 54, 10000 Zagreb, Croatia
2
Division of Organic Chemistry and Biochemistry, Ruđer Bošković Institute, Bijenička 54, 10000 Zagreb, Croatia
3
Division of Physical Chemistry, Ruđer Bošković Institute, Bijenička 54, 10000 Zagreb, Croatia
*
Author to whom correspondence should be addressed.
Water 2023, 15(3), 519; https://doi.org/10.3390/w15030519
Submission received: 25 November 2022
/
Revised: 25 January 2023
/
Accepted: 26 January 2023
/
Published: 28 January 2023
(This article belongs to the Special Issue Characterization of Organic Matter in Marine and Freshwater Environment)
Abstract
:The properties of engineered nanoparticles (NPs) in the marine environment are influenced not only by the high ionic strength of seawater but also by the interaction of NPs with naturally occurring components of seawater, especially natural organic matter. The aim of this study was to investigate the interaction of engineered silica nanoparticles (SiO2 NPs, diameter of 12 nm) with microalgal extracellular polymers (EPS) released by the marine diatom Cylindrotheca closterium. Dissolved organic carbon (DOC) content of the prepared EPS suspension (200 μg mL−1) used throughout the study was 3.44 mg C L−1. The incorporation of individual SiO2 NPs (height range 10–15 nm) and their nanoscale aggregates (height up to 25 nm, length up to 600 nm) into the EPS network was visualized by atomic force microscopy (AFM), whereas their molecular-level interaction was unraveled by the change in the signal of the Si-O group in their FTIR spectra. AFM imaging of C. closterium cells taken directly from the culture spiked with SiO2 NPs (10 μg mL−1) revealed that the latter are bound to the EPS released around the cells, predominantly as single NPs (height range 10–15 nm). Since AFM and dynamic and electrophoretic light scattering results demonstrated that SiO2 NPs dispersed in seawater without EPS showed enhanced aggregation (aggregate diameter of 990 ± 170 nm) and a 2.7-fold lower absolute zeta potential value compared to that measured in ultrapure water, our findings suggest that the presence of EPS biopolymers alters the aggregation affinity of SiO2 NPs in the marine environment. This might be of outmost importance during microalgal blooms when increased EPS production is expected because EPS, by scavenging and stabilizing SiO2 NPs, could prolong the presence of NPs in the water column and pose a threat to marine biota.
1. Introduction
The rapid development and expansion of the nanotechnology industry has ultimately led to the mass production of a variety of engineered nanoparticles (NPs) that are increasingly being released into the environment. As ultrafine particles with all three dimensions between 1 and 100 nm [1], a broad spectrum of NPs of different chemical composition, size, shape, and surface structure with numerous industrial, biotechnological, biomedical, and pharmaceutical applications are commercially available nowadays. Engineered oxide NPs (e.g., silica (SiO2), titania (TiO2), ceria (CeO2), and silver (Ag/Ag2O)) constitute a major component of the global production of nanomaterials, with a wide range of applications [2]. Among the various types of NPs, silicon dioxide NPs (SiO2 NPs), also known as silica nanoparticles or nanosilica, have found extensive applications in a variety of industries. SiO2 NPs are produced on an industrial scale as additives for cosmetics, drugs, printer toners, varnishes, and food [3], and more recently in car tire manufacturing [4]. In addition, SiO2 NPs are being developed for a host of biomedical and biotechnological applications, such as cancer therapy, DNA transfection, drug delivery, and enzyme immobilization [5,6,7,8].
Although commercially attractive due to their desirable and versatile physicochemical properties, the high stability of SiO2 NPs might cause them to accumulate in the environment, posing potential hazards to the environment and human health [3]. Since industrial products and household wastes tend to end up in waterways, the aquatic environment is of major concern [9,10]. Despite the fact that the stability of engineered NPs in the marine environment affects their mobility and bioavailability, there are a limited number of studies on the stability and aggregation of NPs in seawater [11,12,13,14,15,16]. In marine waters, NPs are expected to aggregate rapidly due to their high ionic strength and the resulting suppression of electrostatic repulsive forces between particles. In order to better understand their behavior in the marine environment, it is also important to characterize the interaction of NPs with naturally occurring seawater components, particularly natural organic matter (NOM), as these interactions may ultimately determine the fate of NPs in aquatic systems [17]. Given the complex composition of NOM, it is important to elucidate how specific components in NOM affect the aggregation behavior of NPs. More specifically, extracellular polymers (EPS) released by microorganisms, including microalgae, represent a major fraction of organic matter in marine systems [18,19]. Concentration of dissolved organic carbon (DOC) in the ocean euphotic zone is in the range 0.6–3 mg C L−1 [20,21], while in some areas during more productive and eutrophicated periods it can reach concentrations of up to 7.2 mg C L−1 [22,23], as measured in the northern Adriatic Sea. However, the interaction of EPS with NPs has been rarely studied. The interaction of marine EPS with engineered NPs has been reported for TiO2 NPs [24,25], quantum dots [26], CuO NPs [27], Ag NPs [28,29], and more recently for nanoplastics [16,30,31].
The aim of the present study was to better understand the effect of microalgal EPS, as the main component of NOM, on the stability of engineered NPs in the marine environment. With this aim, the interaction of SiO2 NPs with EPS released by the marine diatom Cylindrotheca closterium was investigated at the nanoscale using atomic force microscopy (AFM) imaging, and the interaction was identified at the molecular level using Fourier transform infrared (FTIR) spectroscopy. The findings obtained in this work further expand the knowledge about the persistence not only of SiO2 NPs but also very likely of other engineered NPs in the natural marine environment.
2. Materials and Methods
2.1. SiO2 Nanoparticles Suspensions
Silica NPs (Ludox® HS-40) were supplied by Sigma-Aldrich (St. Louis, MO, USA) in the form of a 40% (w/w) suspension in H2O with an average particle diameter of 12 nm, as reported by the manufacturer. Suspensions of SiO2 NPs were prepared in two different media: (a) ultrapure water (UPW; water filtered through the Milli-Q system); and (b) filtered natural seawater (SW). Seawater for the preparation of suspensions was sampled in the Adriatic Sea (25 m depth, 2 km offshore the island of Vis) and filtered through a cellulose nitrate membrane filter (Whatman: Cytiva, Marlborough, MA, USA) with a 0.2 μm pore size. Seawater had a salinity of 39, a pH of 8.0, and DOC content of 0.85 mg C L−1.
The original suspension of SiO2 NPs was vortexed for 1 min and used for preparation of the working stock suspension (500 µg mL−1). The prepared stock suspension was mixed for 30 min on a magnetic stirrer, further diluted to the final concentration of 10 µg mL−1 with UPW or SW, and mixed for an additional 30 min. Prepared suspensions of SiO2 NPs in UPW and SW were characterized by dynamic light scattering (DLS), electrophoretic light scattering (ELS), and atomic force microscopy (AFM).
2.2. DLS and ELS Measurements
SiO2 NPs suspensions in UPW and SW were characterized immediately after preparation of suspensions (0 h), then after 1 h and after 24 h by DLS. The size distributions and zeta potentials of SiO2 NPs suspensions were determined by means of dynamic light scattering (DLS) using a photon correlator spectrophotometer equipped with a 532 nm “green“ laser (Zetasizer Nano ZS, Malvern Instruments Ltd., Malvern, UK). The intensity of scattered light was detected at an angle of 173°. To avoid overestimation arising from the scattering of larger particles, the hydrodynamic diameter (dh) was obtained as a value at the peak maximum of size volume distribution. The zeta potential (ζ-potential) was measured by ELS and calculated from the measured electrophoretic mobility by means of the Henry equation using the Smoluchowski approximation. The data processing was conducted by Zetasizer software 6.32 (Malvern Instruments Ltd., Malvern, UK). All samples were measured six times, and the results were expressed as the average value. All measurements were conducted at 25 ± 0.1 °C.
2.3. Diatom Culture
The Cylindrotheca closterium (Bacillariophyceae) (CCMP1554) diatom monoculture was purchased from the Culture Collection Bigelow Laboratory for Ocean Sciences (East Boothbay, ME, USA). For diatom cultivation, 100 mL of f/2 growth medium [32] was used. Seawater for the preparation of f/2 growth medium was taken from the Adriatic Sea (2 km offshore the island of Vis, 25 m depth) and filtered as previously described (Section 2.1. SiO2 nanoparticles suspensions). Diatom cultures were grown in 250-mL Erlenmeyer flasks that were placed in a water bath at a temperature of 18 °C. The flasks were subjected to constant shaking (20 rpm) and exposed to 12:12 light:dark (L:D) cycles at an irradiance of 31 µmol photons m–2 s–1.
2.4. Microalgal Extracellular Polymers Isolation
Extracellular polymers were extracted from the culture of diatom C. closterium in the stationary growth phase (18 days). The EPS was extracted following a slightly modified procedure described in [33]. Briefly, microalgal culture was centrifuged at 2200× g for 5 min at 18 °C using a Hicen21 centrifuge (Herolab, Wiesloch, Germany). After centrifugation, EPS was recovered from the supernatant by precipitation with 96% ethanol in a volumetric ratio of 1:4 at 4 °C for 24 h. The precipitate was then centrifuged at 3200× g for 5 min at 4 °C, and the obtained pellet was dialyzed against ultrapure water using 3.5 kDa dialysis tubes (Spectra/Por 6, Repligen, Waltham, MA, USA) to remove low-molecular impurities, including salts and ethanol. After dialysis for 24 h, the EPS solution was lyophilized and stored at 4 °C until use. For characterization of EPS supramolecular structure and composition, lyophilized EPS was suspended in SW at a concentration of 200 µg mL−1 and the prepared suspension was mixed for 45 min on a magnetic stirrer to obtain the homogeneous suspension prior to FTIR spectroscopy and AFM analysis. The concentration of EPS of 200 μg mL−1 was needed in order to obtain the network structure of EPS in SW. Since, with a lower EPS concentration (100 μg mL−1), we obtained only partially branched fibrils, and a fibrillar network was not formed (Supplementary Material, Figure S1). The DOC content of the prepared EPS suspension was determined with the high-temperature catalytic oxidation method (HTCO) using a TOC–VCPH (Shimadzu, Kyoto, Japan) carbon analyzer with a platinum/silica catalyst (Elemental Microanalysis, Okehampton, UK) and a non-dispersive infrared (NDIR) detector for CO2 measurements.
2.5. Interaction of SiO2 NPs with Microalgal EPS
2.5.1. Interaction of SiO2 NPs with Isolated EPS
The suspension of extracellular polymers isolated from C. closterium in SW (200 µg mL−1) was mixed for 45 min on a magnetic stirrer to obtain a homogeneous suspension. The prepared EPS suspension was then spiked with SiO2 NPs stock suspension (500 μg/mL) (previously briefly vortexed) to reach a final SiO2 NPs concentration of 10 μg mL−1 and mixed on a magnetic stirrer for 45 min. The prepared EPS–SiO2 NPs suspension was then analyzed by AFM and FTIR.
2.5.2. Interaction of SiO2 NPs with Released EPS at the Single-Cell Level
The visualize the interaction of SiO2 NPs with released EPS on the cell-level, a C. closterium monoculture in the exponential phase (3rd day of growth) was spiked with SiO2 NPs (10 μg mL−1) and grown in the laboratory conditions previously described (Section 2.3. Diatom culture). The samples for AFM imaging were taken when the cells reached the stationary phase (15th day of incubation).
2.6. AFM Imaging: Measurements Condition and Samples Preparation
A multimode scanning probe microscope with Nanoscope IIIa controller (Bruker, Billerica, MA, USA) and a 125 µm scanner with vertical engagement (JV) were used for AFM imaging. The characterization of samples of SiO2 NPs suspensions, EPS, and EPS spiked with SiO2 NPs was performed in tapping mode using silicon probes (TESP-V2, nominal resonance frequency 320 kHz, nominal spring constant 42 N m−1; Bruker, Billerica, MA, USA) with a linear scanning rate between 1.0 and 1.5 Hz. In order to minimize the interaction forces between the tip and the sample, the ratio of the setpoint amplitude and the free amplitude (A/A0) was kept at 0.9. The characterization of C. closterium cells taken directly from the culture spiked with SiO2 NPs was performed by AFM imaging in contact mode using silicon-nitride probes (DNP-10, nominal frequency 12–24 kHz, spring constant 0.06 N m−1; Bruker, Billerica, MA, USA) and a linear scanning rate of 1.5–2.0 Hz. The image analysis was performed with NanoScopeTM software (NanoScope Analysis, version 2.0; Bruker, Billerica, MA, USA). All images are given as raw data except for the first-order two-dimensional flattening. All AFM measurements were performed in air at room temperature and 30–40% relative humidity, which keeps a small hydration layer on the sample that helps to preserve the original structure [34].
For preparation of AFM samples of SiO2 NP suspension in UPW, SW, and EPS with and without SiO2 NPs, the drop deposition method modified for marine samples was used [35,36]. Briefly, a 5 µL aliquot of sample was deposited directly on fresh cleaved mica, immediately after 30 min of mixing suspensions on a magnetic stirrer. The samples were then placed in enclosed Petri dishes and left to dry for 45 min. All AFM samples that were prepared with SW were then rinsed three times with 50 µL of ultrapure water to remove the excess salt crystals and again left to dry in enclosed Petri dishes. For the preparation of AFM samples of C. closterium culture spiked with SiO2 NPs, the 5 µL aliquots were taken directly from Erlenmeyer flasks used for growing microalgae, and the drop deposition protocol described previously was applied.
2.7. Fourier Transform Infrared Spectroscopy
FTIR spectra of EPS, SiO2 NPs, and a mixture of EPS and SiO2 NPs prepared in SW or UPW, as well as of pure SW and UPW, were acquired on an Invenio-S spectrometer equipped with the photovoltaic LN-MCT detector and BioATR II unit (Bruker, Ettlingen, Germany). The BioATR II unit is circular with a radius of 2 mm, with the upper ATR crystal made of silicon and the lower one of zinc selenide (ZnSe). The unit is purged with N2 gas, connected to an external supply, and temperature-controlled using a circulating water bath of Ministat 125 (25 °C) (Huber, Offenburg, Germany). The solvents and solutions were pipetted directly on the ATR crystal unit (30 μL), and their spectra were collected with a nominal resolution of 2 cm−1 and 256 scans using OPUS 8.5 SPI (20200710) software (Bruker, Ettlingen, Germany). In all measurements, the air was used as a background.
The spectrum of SW (and UPW, Supplementary Material, Figure S2) was subtracted from the spectra of SW suspensions of EPS, SiO2 NPs, and a mixture of EPS + SiO2 NPs, respectively. As the spectral range 1850–950 cm−1 displays the signatures of the functional groups involved in all sorts of intermolecular interactions between EPS and SiO2 NPs ((de)protonated carboxylic moieties and Si−O groups), we made a thorough analysis of this spectral range in a way that subtracted spectra were smoothed (Savitzky-Golay, 60 points, polynom of a 3rd order), baseline-corrected, and normalized with respect to the strongest signal.
3. Results and Discussion
3.1. SiO2 NPs Stability in Natural Seawater
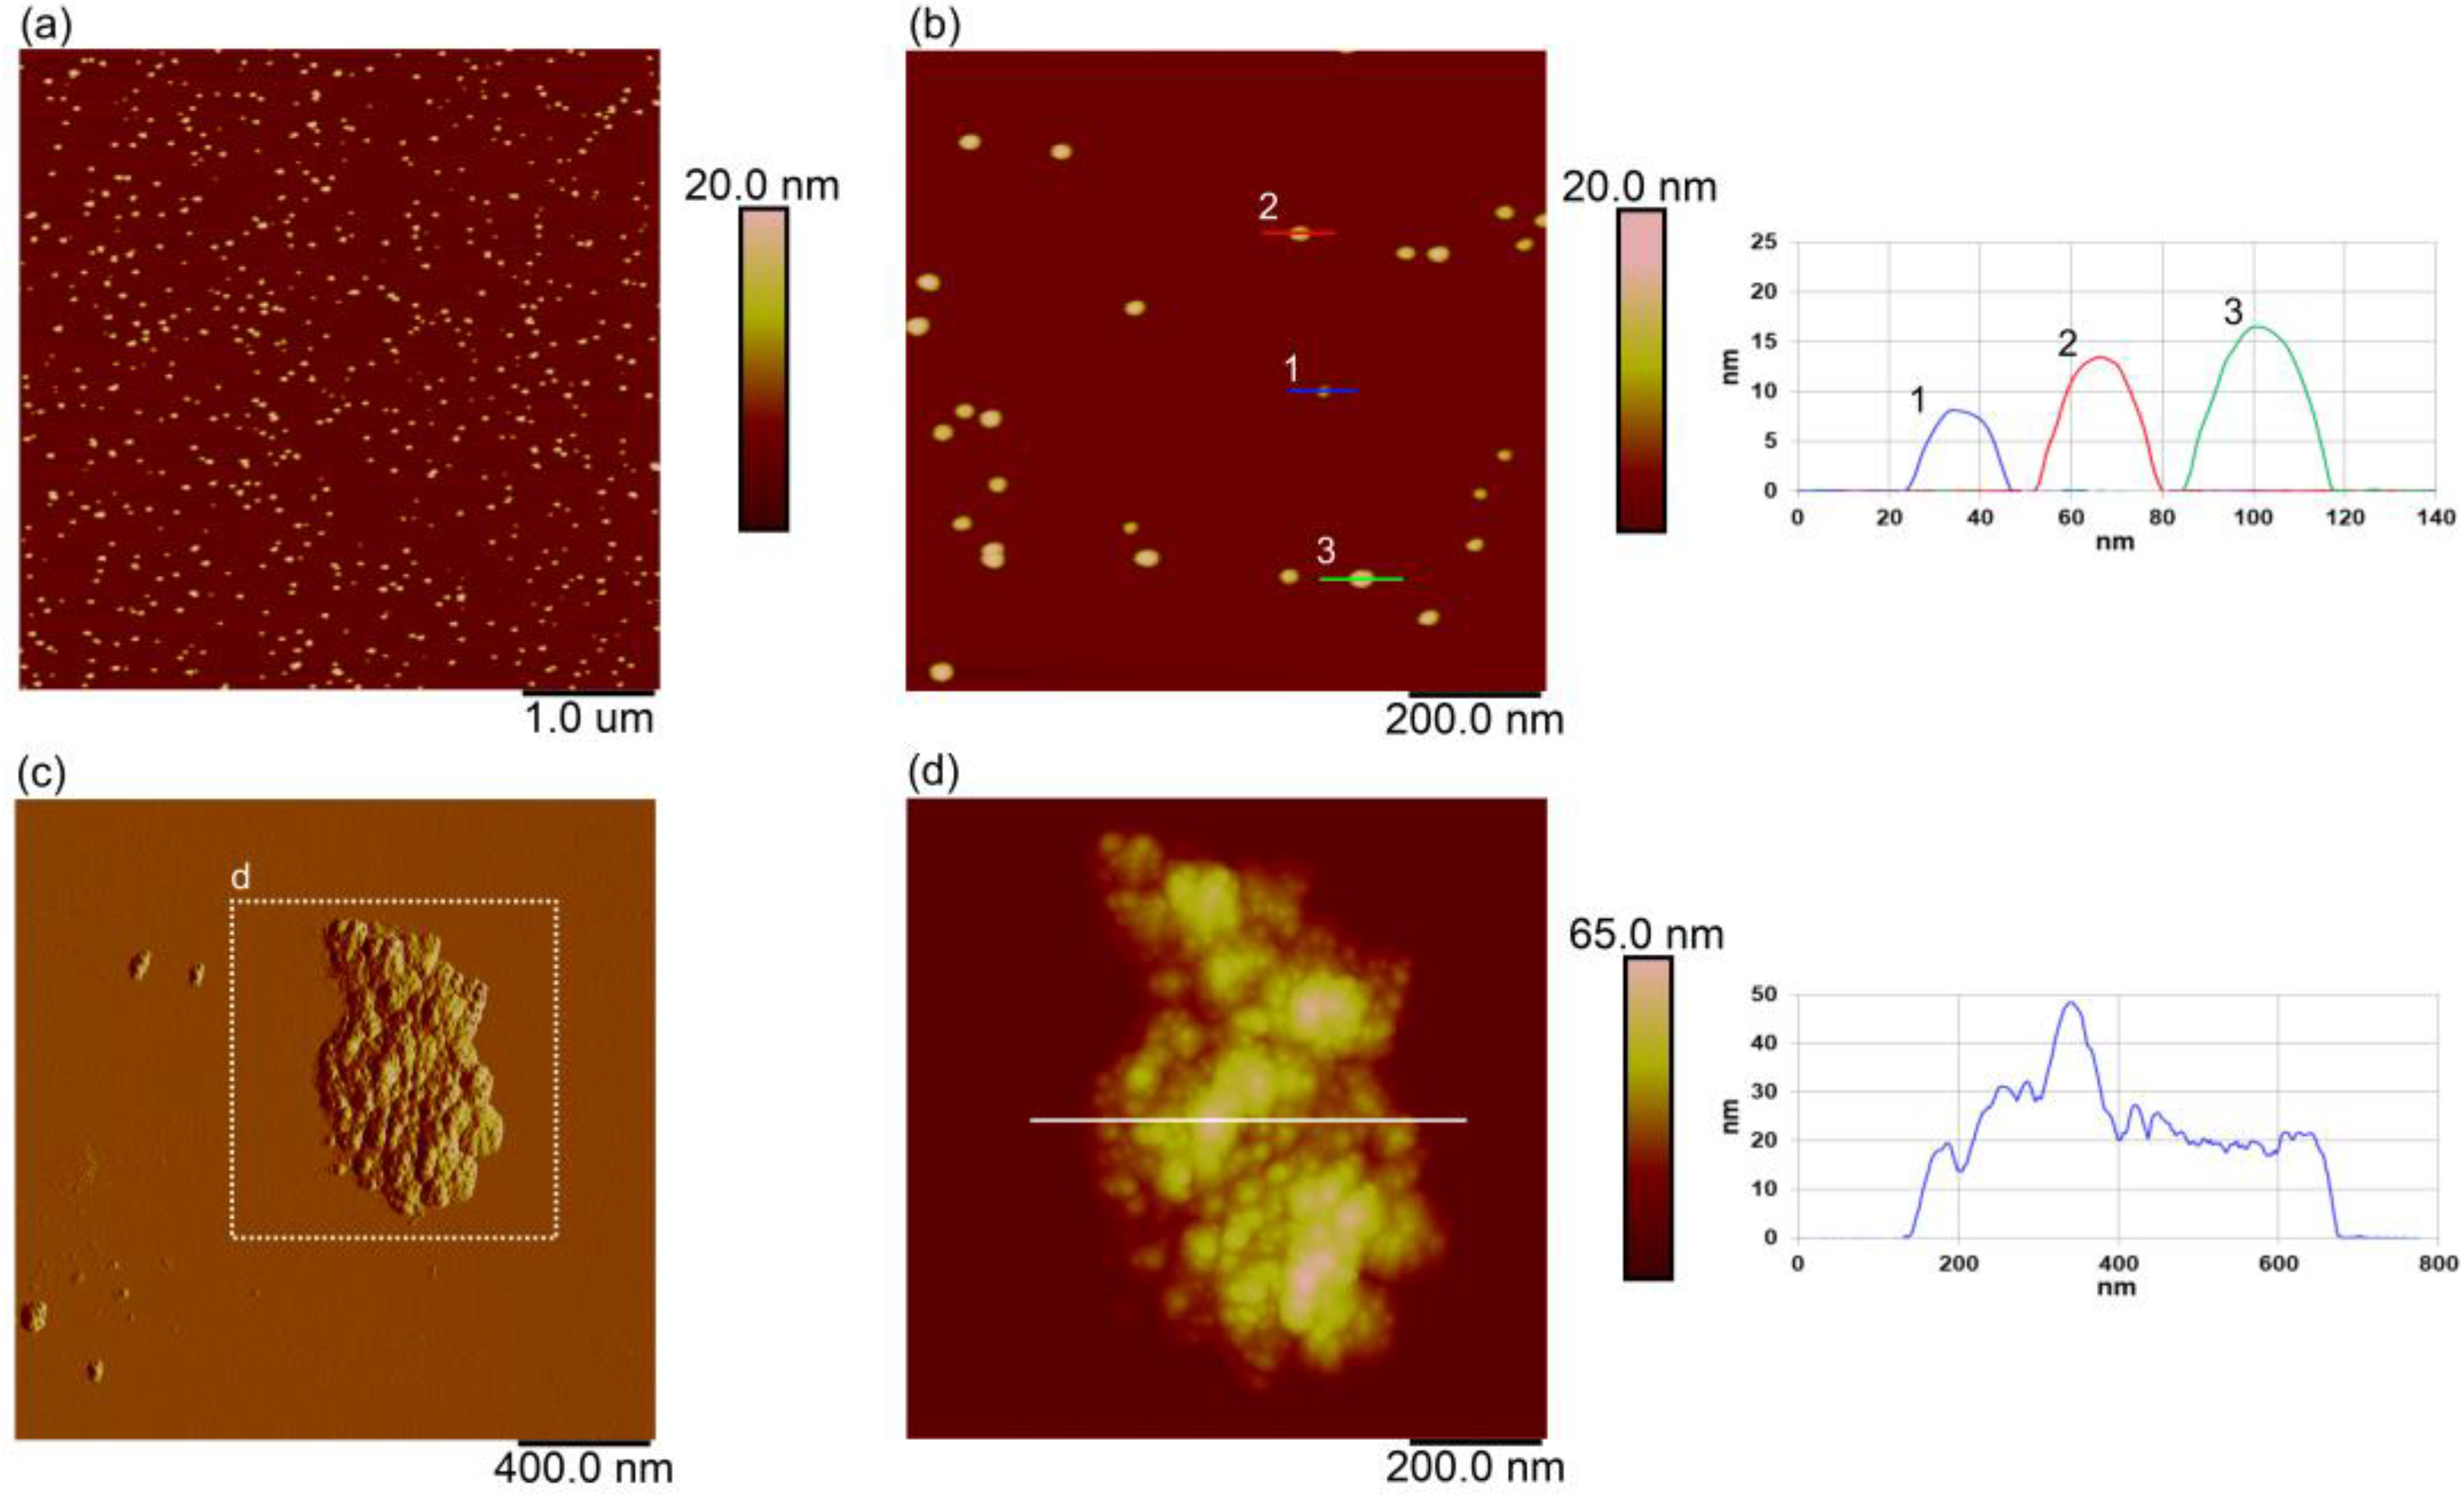
To observe the stability of SiO2 NPs in natural seawater, NPs were suspended in SW and their physicochemical properties were compared with those of SiO2 NPs suspended in UPW. The hydrodynamic diameter and zeta-potential of SiO2 NPs in UPW and SW were determined using DLS and ELS, respectively (Table 1). The mean dh value of SiO2 NPs in UPW was 21.4 ± 1.1 nm and the mean ζ-potential was −14.2 ± 3.2 mV, and both values showed no significant change within the uncertainty of the DSL measurements for 24 h of observation. The dh values obtained from the DLS measurements are larger than the average particle diameter (12 nm) reported by the manufacturer. However, the overestimation of particle diameter measured by DLS is expected, since the diameter determined by DLS measurements is the diameter of a hypothetical hard sphere that diffuses with the same speed as the particle under examination. Thus, the dh value calculated from the diffusion properties of the particle is an indicator of the apparent size of the dynamic hydrated nanoparticle. Therefore, the NP dimension obtained by DLS measurements is expected to be larger compared to other microscopy techniques. The predominance of singly dispersed NPs in UPW was also confirmed by AFM images (Figure 1a,b), which showed mainly singly dispersed SiO2 NPs along with a few small nanoscale aggregates. The SiO2 NPs were typically spherical with a very narrow size distribution ranging in height from 7.3 to 16.7 nm with an average height of 12.7 ± 2.5 nm, indicating the presence of mainly singly dispersed particles in the sample. The mean diameter of the NPs was 30.4 ± 5.0 nm, but since the size of the tip and its geometry lead to a broadening of the lateral dimensions of the NPs (the tip convolution effect) [37], their real diameter is very difficult to measure accurately. Nevertheless, in the case of NPs that are assumed to be spherical, a reliable method for determining the size of spherical NPs from topographical AFM images is to measure their height.
Significantly higher mean dh values were measured in SW, indicating the formation of aggregates (Table 1). The DLS data showed that the aggregates in SW increased in size with time. Immediately after suspension preparation, dh values of 54 ± 14 nm and 345 ± 68 nm were measured, followed by 780 ± 120 nm after 1h and 990 ± 170 nm after 24h. The increase in size is consistent with the AFM images of SiO2 NPs dispersed in SW, which confirm aggregate formation (Figure 1c,d) with a very broad distribution of aggregate sizes. The aggregates in SW ranged in length from a few hundred nm to 1 µm and in height from 10 to 150 nm.
Regarding particle charge, SiO2 NPs had negative ζ-potential in both UPW and SW, but lower absolute ζ-potential values were obtained for SiO2 NPs suspension in SW (−6.0 ± 1.0; measured immediately after suspension preparation) compared to −14.2 ± 3.2 mV measured in UPW (Table 1). The more negative zeta potential indicates higher stability of SiO2 NPs in UPW because it provides repulsive forces that keep the NPs away from each other and they are not aggregated. However, in SW, the zeta potential approaches zero and interparticle repulsion decreases, as does the stability of the dispersion, leading to aggregation. While SiO2 NPs were stable in UPW, their stability in SW is quite different, due to the fact that higher ionic strength usually strongly destabilizes the colloidal systems. According to the classical Derjaguin–Landau–Verwey–Overbeek (DLVO) theory, the stability of NPs is determined by two main contributions: the repulsive double layer interactions and the attractive van der Walls forces [38,39]. While the electrical double layer maintains their electrostatic equilibrium, the increasing ionic strength of the media compresses the double layer and weakens the repulsive forces by reducing the zeta potential, thus decreasing colloid stability.
Overall, the obtained AFM and DLS results showed that while SiO2 NPs in UPW were stable and mostly singly dispersed with constant size and shape over time, SiO2 NPs dispersed in SW showed aggregation with a significant reduction of the absolute values of ζ-potential. Our results are also consistent with the fact that in marine waters, due to the increase in ionic strength and resulting charge screening effects, the aggregation behavior of NPs is expected to significantly change, since high ionic strength enhances aggregation as the attractive van der Waals forces dominate [40].
3.2. Interaction of SiO2 NPs with Isolated EPS at the Nanoscale- and Molecular-Level
Besides the high ionic strength of seawater, the interaction of NPs with natural organic matter is of crucial importance. To investigate the interaction of SiO2 NPs with NOM at the nanoscale and molecular level, EPS isolated from diatom C. closterium culture was spiked with SiO2 NPs and analyzed by AFM imaging and FTIR spectroscopy. DOC content of the prepared EPS suspension (concentration 200 μg mL−1) was 3.44 mg C L−1.
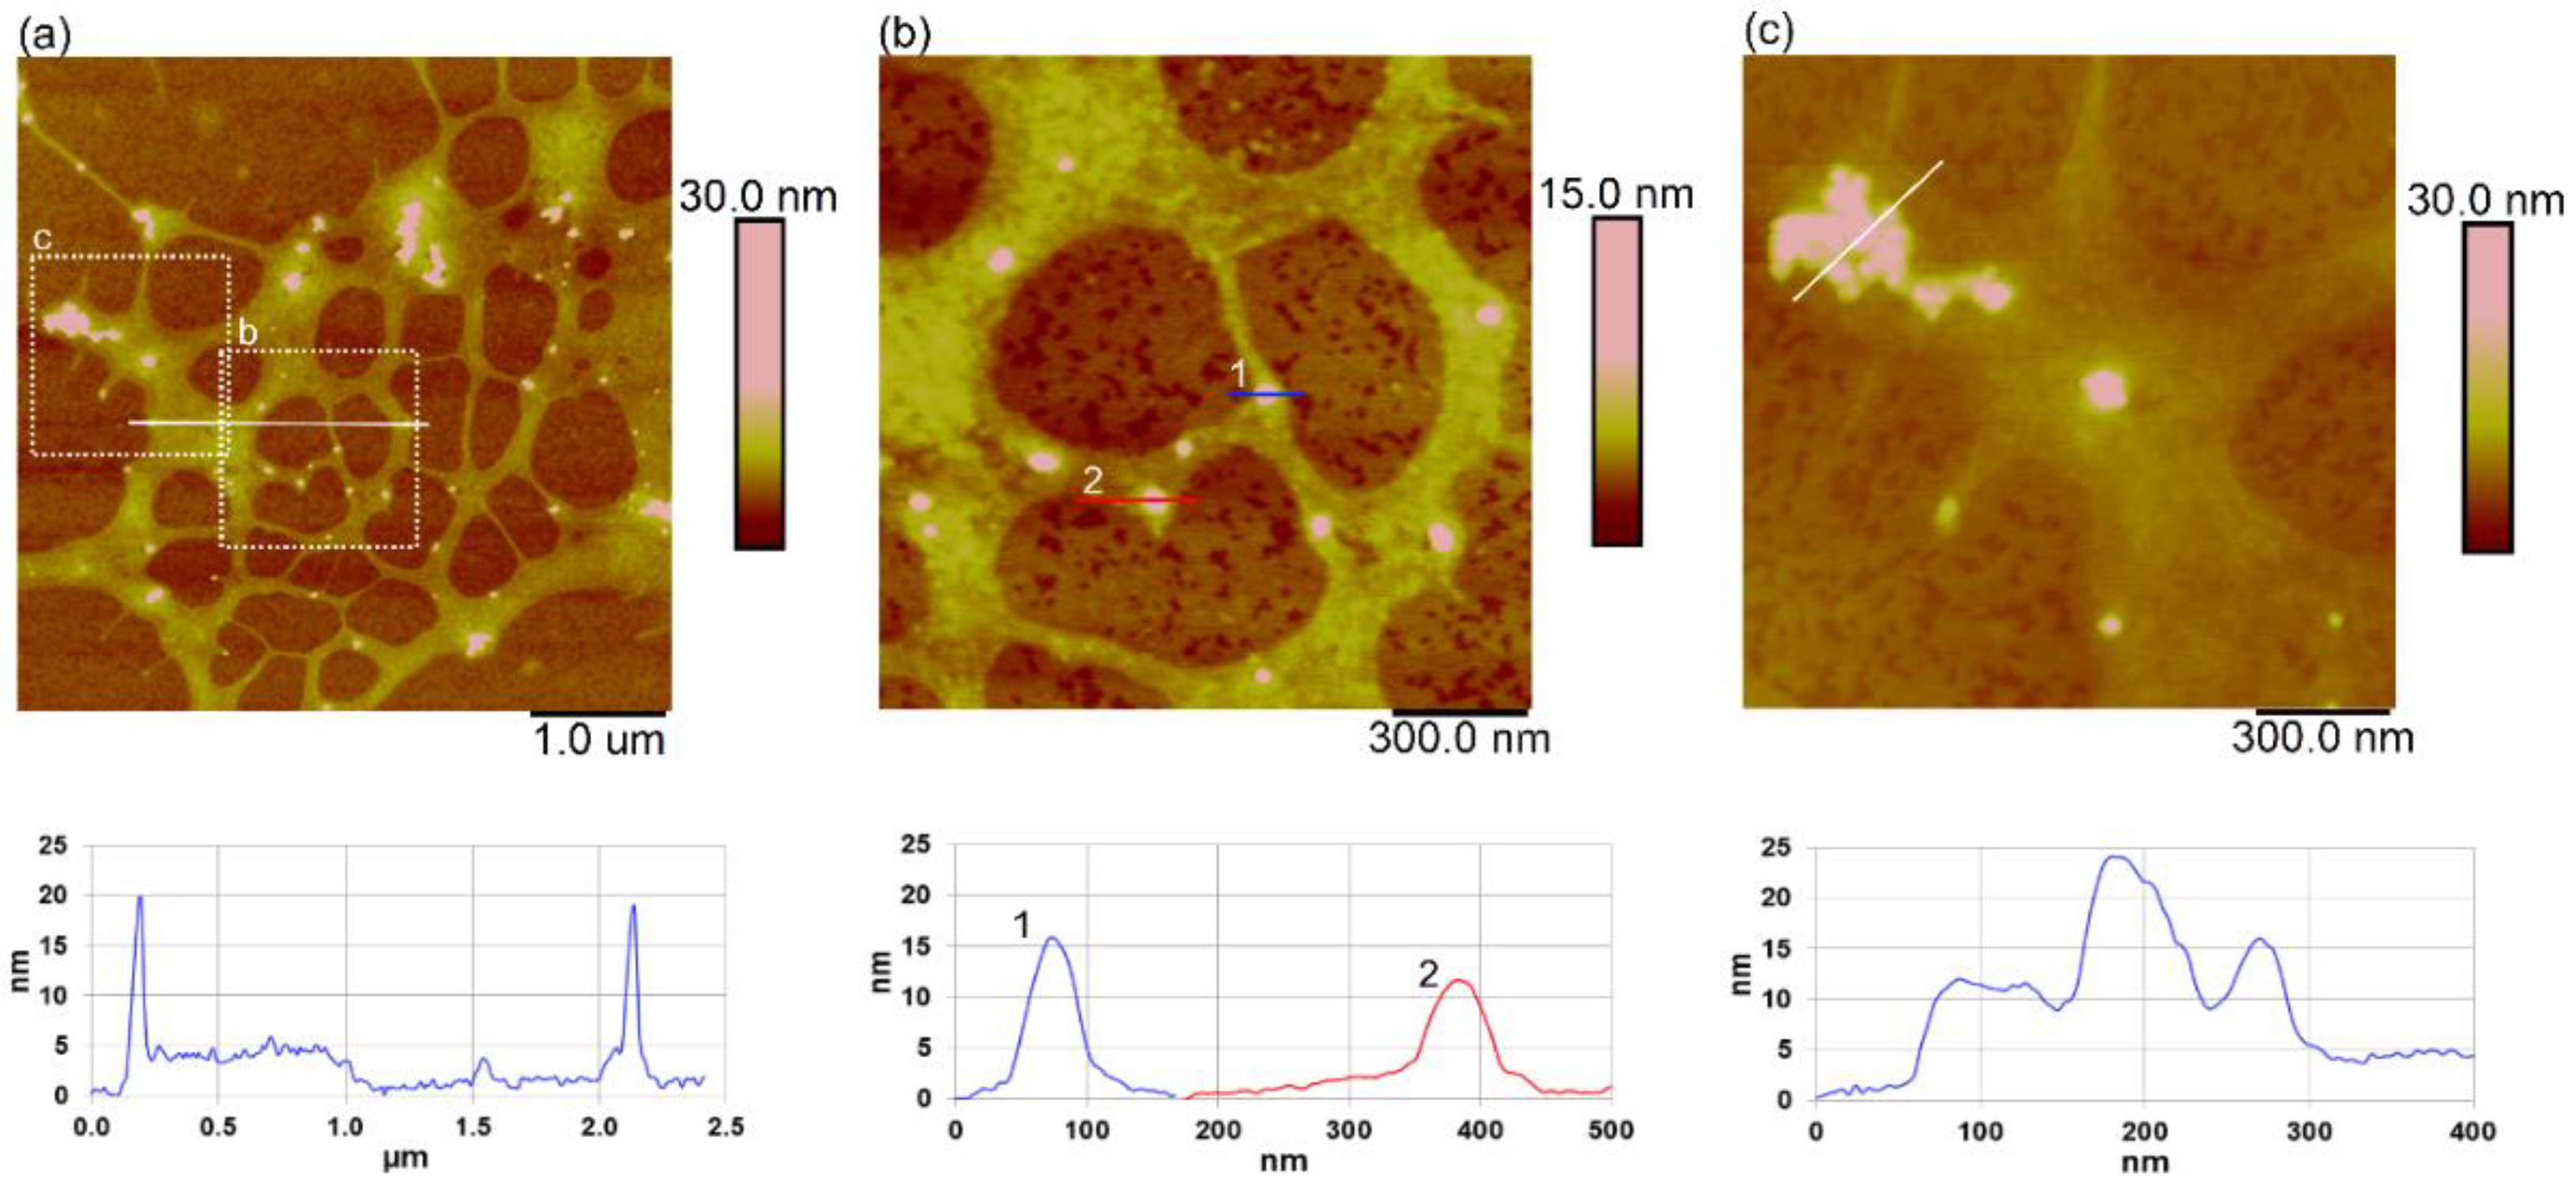
AFM images of EPS suspended in SW (200 µg mL−1) showed a fibrillar network structure with fibril heights ranging from 0.5 to 4 nm and fibril widths from 20 to 150 nm (Figure 2). The lowest height value of 0.5 nm probably corresponds to the height of the single fibril, and fibrils with higher values of width and height represent the association of two or more fibrils. The supramolecular structure of EPS and fibril dimensions are consistent with our previous research, where we characterized isolated EPS of C. closterium (isolated from the Adriatic Sea). Although in that work EPS was suspended in UPW and thus the effect of ionic strength on the supramolecular structure of EPS was neglected, EPS formed a similar fibrillar network with fibril heights ranging from 0.9–2.6 nm [36].
The EPS suspended in SW showed strong interaction with SiO2 NPs, and incorporation of individual NPs into the gel network was observed (Figure 3a–c). SiO2 NPs were bound to the EPS network both as individual NPs (Figure 3b) and as nanoscale aggregates (Figure 3c). The height of the individual SiO2 NPs embedded in the network was consistent with those measured in UPW for single NPs, ranging from 10 to 15 nm (Figure 3b), while the nanoparticle aggregates shown in Figure 3b reached a height of up to 25 nm and a length of up to 600 nm. The high affinity of SiO2 NPs for EPS was also supported by the fact that SiO2 NPs withstand the rising step during sample preparation, which was required to remove the excess salt, and that SiO2 NPs were found exclusively on the EPS fibrils, and not on the bare mica surface.
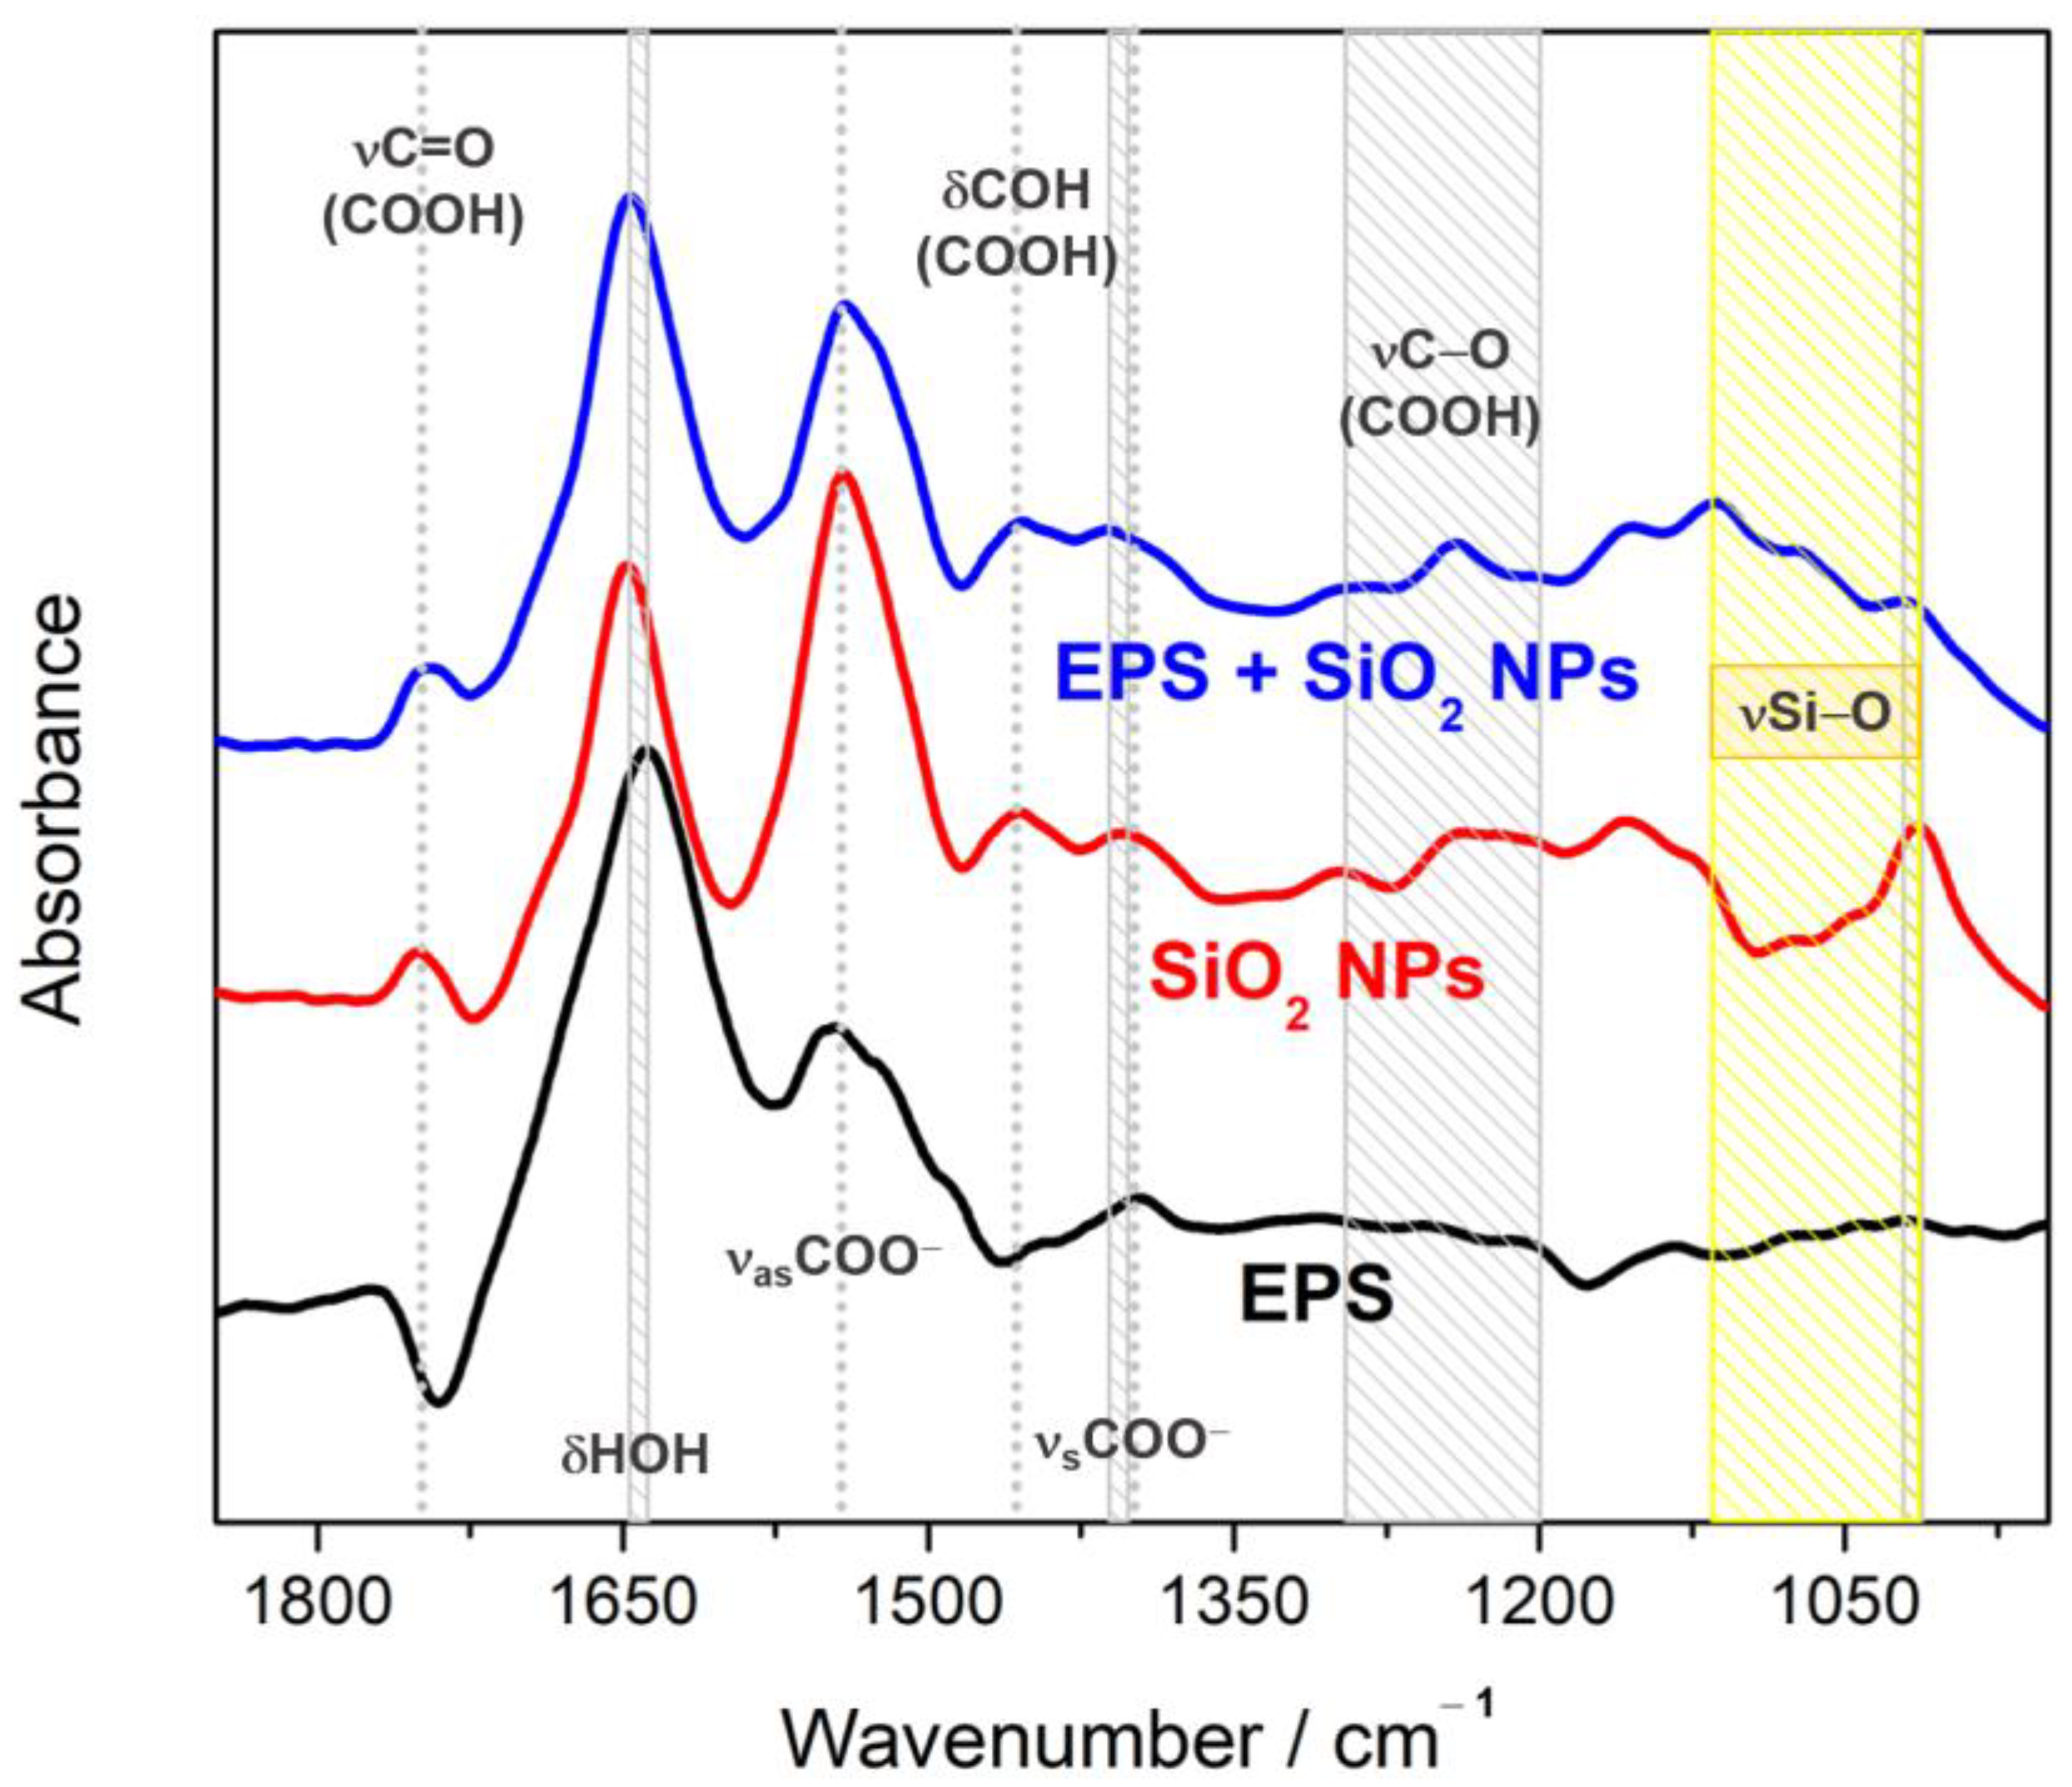
The interactions between isolated EPS and SiO2 NPs in their mixture (EPS + SiO2 NPs) were further investigated by FTIR spectroscopy. Since EPS is a complex mixture of biological material including polysaccharides, proteins, lipids, and nucleic acids, the FTIR spectrum of EPS alone is rather difficult to untangle [41,42,43]. With the aim of detecting and ultimately characterizing the interaction between EPS and NPs in assigning the FTIR spectrum of their mixture, we focused on the spectral range 1850–950 cm−1 which most exhaustively reflects the involvement of the individual functional groups of the constituent components in the formation of their supramolecular assemblies (Figure 4).
In the FTIR spectrum of pure EPS (black curve in Figure 4), the most prominent (very strong) signal occurs at 1639 cm−1 and is followed by a strong band with maximum at 1547 cm−1. Besides the weak signal with a maximum at 1396 cm−1, EPS does not show any other distinguished maxima in the examined spectral region. Based on the assignment made by Zhou and co-workers [44], the strongest band (1639 cm−1) can be attributed to the stretching of the Amide I band (νC=O), which could be superimposed with the residual water (H2O) bending (δHOH), while the band at 1547 cm−1 could be assigned to both the Amide II band (δNH) and the antisymmetric stretching of the deprotonated carboxylic groups (νasCOO−). In agreement with the latter assignment, the weakest band (1396 cm−1) probably originates from the symmetric stretching of deprotonated carboxylic groups (νsCOO−) [45]. The continuum of absorption in the spectral window from 1350 cm−1 to 1200 cm−1, regardless of its weakness or lack of distinguished maxima, implies the presence of C−O moieties in EPS [46,47].
However, in the presence of SiO2 NPs, EPS shows a slightly different response, which apparently cannot be considered a simple superposition of the FTIR spectra of EPS (black curve in Figure 4) and SiO2 NPs (red curve in Figure 4). First, in the FTIR spectrum of the mixture of EPS and SiO2 NPs (blue curve in Figure 4), the bands originating from Amide I and Amide II bands, δHOH, protonated and deprotonated carboxylic (COO(H)) groups, and the Si−O moieties can be seen. The signal of Amide I/residual water (δHOH) in the FTIR spectrum of the EPS + SiO2 NPs mixture appears at 1646 cm−1, as do the signals arising from Amide II/νasCOO− and νsCOO− bands generated by the amide/deprotonated carboxylic group (COO−) with maxima at 1541 cm−1 and at 1410 cm−1, respectively. The band associated with the stretching of the Si−O bond (νSi−O) appears at about 1013 cm−1 [48,49] in the FTIR spectra of both pure SiO2 NPs (red curve) and, although with lower intensity, broader and slightly up-shifted (1020 cm−1), those of the EPS + SiO2 NPs mixture (blue curve). Second, and most importantly, the envelope comprising of the signatures of Si−O moieties (spectral region 1110–1050 cm−1, yellow rectangle in Figure 4) qualitatively differs for the FTIR spectra of SiO2 NPs and its mixture with EPS. In particular, in the FTIR spectrum of the mixture of EPS and SiO2 NPs, there is an additional spectral feature at 1067 cm−1 that does not appear in the spectrum of any pure component (neither in the spectrum of SiO2 NPs nor in the spectrum of EPS). Since Si−O moieties leave their signature in the mentioned spectral region [48], we are inclined to attribute that band to the signature of the interaction, which is most likely of an electrostatic nature, between SiO2 NPs and EPS. Interestingly, the appearance of bands in the spectral region 1300–1200 cm−1 in the mixture of EPS and SiO2 NPs suggests that SiO2 NPs establish electrostatic interaction primarily with the polysaccharides of EPS. (For a comparison of the FTIR spectrum of SiO2 NPs in SW and UPW, see Supplementary Materials, Figure S2).
The results obtained, both AFM imaging results revealing supramolecular organization at the nanoscale and FTIR results revealing molecular-level interaction, confirmed the interaction of isolated EPS and silica NPs. Since this interaction decreases the degree of aggregation of the NPs, it may prolong their presence in the water column and make NPs available to higher organisms. These results are consistent with our previous work investigating the interaction between silica and silver NPs (Ag NPs) and isolated diatom EPS suspended in UPW [29,50]. In these works, NPs were also detected exclusively on polysaccharide fibrils. However, the EPS suspension was prepared by dissolving the EPS in UPW, neglecting the effect of the high ionic strength of seawater on the supramolecular structure of EPS and the physicochemical properties of the NPs.
To some extent, our findings agree with other studies that have investigated the interactions between metallic oxides and microbial macromolecules. In particular, Adeleye and Keller [41] investigated the interaction of TiO2 NPs with EPS from freshwater and marine microalgae and used transmission electron microscopy (TEM) and FTIR spectroscopy to show that naturally occurring EPS can alter the surface properties and fate of TiO2 NPs in natural waters. Further, Zhou and co-workers [44] also showed that the amino and aromatic carboxylic groups in EPS are involved in the interaction between Ag NPs and EPS.
3.3. Interaction of SiO2 NPs with Released EPS at the Single-Cell Level
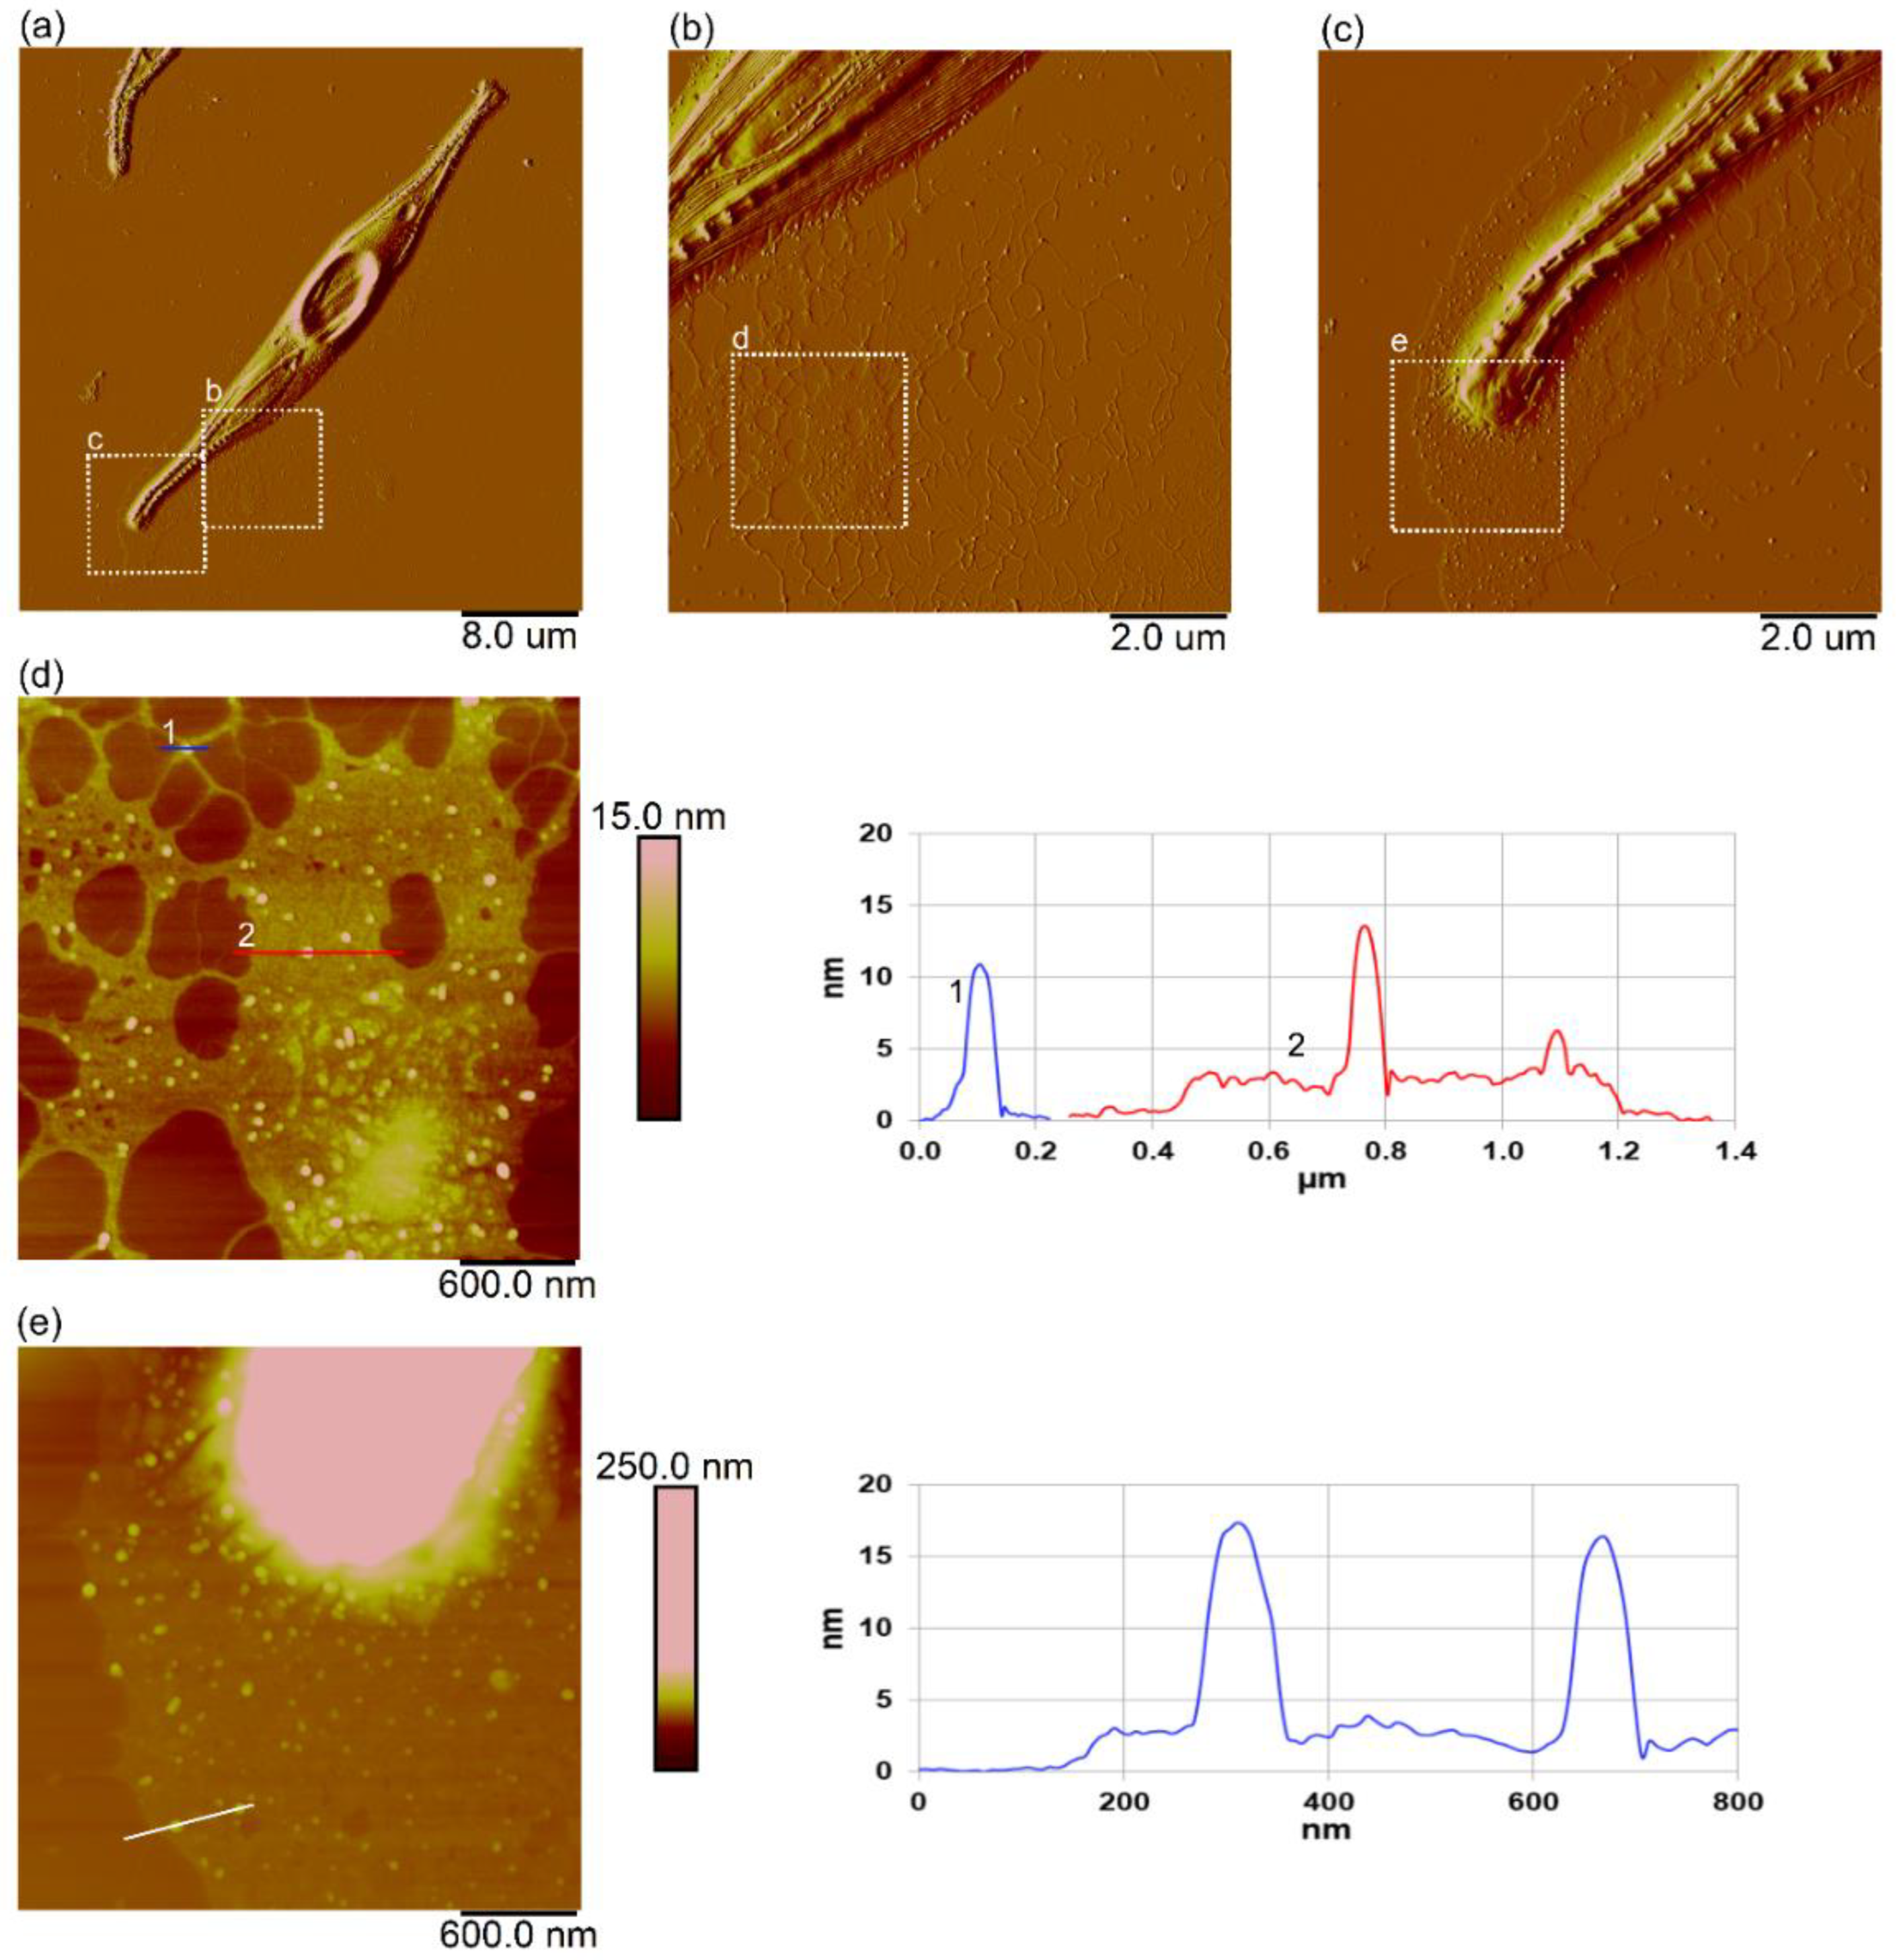
To study the interaction between SiO2 NPs and EPS at the single-cell level without isolating EPS from the culture medium, SiO2 NPs were added directly to the C. closterium culture and analyzed by AFM when the culture reached the stationary phase, when higher production of EPS is expected. AFM images of C. closterium culture spiked with SiO2 NPs (10 µg mL−1, 15th day of incubation) are presented in Figure 5. The cell of C. closterium had the typical shape for this species, with characteristic morphological cell parts [51]) and a cell length of 40 µm. AFM images show that SiO2 NPs were predominantly attached to EPS around the cell and also on the surface of the cell (Figure 5a,b). EPS near the cell formed a layer of a few nm height, while at a greater distance from the cell, the fibrils forming a network were observed (Figure 4b–e). SiO2 NPs were attached to the EPS and were mostly found as individual NPs with a height of 10 to 15 nm. On the contrary, in the C. closterium culture that was not spiked with SiO2 NPs, no particles were found attached to EPS released from the cells (Supplementary Material, Figure S3).
In our recent research, we have shown that modified polystyrene nanoplastics, both carboxy- and amino-modified, established the interaction with EPS released by C. closterium [16]. Pletikapić and co-workers [29] used AFM to show that Ag NPs adsorb on the cell (and penetrate through the cell wall), as well as to the surrounding EPS. Other research groups usually examined the interactions of different NPs with EPS as part of toxicity experiments, i.e., the influence of interactions between EPS and NPs on the cell population was usually explored. Zhou and co-workers [44] investigated the role of EPS in the bioaccumulation and toxicity of Ag NPs on Chlorella pyrenoidosa and found that EPS alleviated the algal toxicity of Ag. Natarajan and co-workers [52] found that the layer of algal exudates surrounding polystyrene nanoplastics lessened the toxic effects of these NPs towards marine microalgae Chlorella sp. Giri and Mukherjee [53] also showed that ageing with algal EPS reduced the toxic effects of polystyrene NPs in the freshwater microalgae Scenedesmus obliquus. The study of the effect of EPS on the toxicity of TiO2 NPs toward Chlorella pyrenoidosa by Gao and co-workers [54] showed that the presence of EPS on the cell surface promoted heteroaggregation between nTiO2 and algal cells and induced greater TiO2 accumulation on the algal surface; however, the internalization of nTiO2 by algal cells was limited by the presence of EPS. In contrast to the above-mentioned examples of the positive effect of EPS on the toxicity of NPs toward algae, Zheng and co-workers [47] reported that EPS had no discernible effect on the interaction of Chlorella vulgaris with silver ions released by Ag NPs and also on the effect of Ag NPs on algal growth.
4. Conclusions
In the marine environment, the coexistence of different electrolytes and natural organic matter can make the aggregation of nanoparticles quite complicated. The results of this study show that the aggregation behavior of SiO2 NPs (diameter of 12 nm) differs greatly in the presence of microalgal extracellular polymers. The incorporation of SiO2 NPs into the fibrillar network formed from isolated EPS of diatom Cylindrotheca closterium, predominantly as individual NPs (height range 10–15 nm) or as nanoscale aggregates (height up to 25 nm, length up to 600 nm), was visualized by AFM, and their interaction at the molecular level was confirmed by FTIR. The interaction of SiO2 NPs and EPS was further confirmed at the single-cell level by directly imaging EPS released around cells of C. closterium spiked with SiO2 NPs (10 μg mL−1), which showed incorporation of predominantly single NPs in the EPS network. On the contrary, SiO2 NPs dispersed in seawater in the absence of EPS show enhanced aggregation, with aggregate sizes reaching 990 ± 170 nm and a 2.7-fold lower absolute ζ-potential value compared to that measured in ultrapure water, confirming lower SiO2 NP stability in seawater. Overall, our results show that the presence of EPS biopolymers alters the aggregation affinity of SiO2 NPs in the marine environment. These results could be most important during the microalgal blooms, when increased EPS production is expected, because EPS, by scavenging and stabilizing SiO2 NPs, could prolong their presence in the water column and pose a threat to organisms at higher trophic levels. Ultimately, this interaction could explain the persistence in the water column not only of SiO2 NPs but very likely of other engineered NPs, regardless of the high ionic strength of seawater.
Supplementary Materials
The following supporting information can be downloaded at: https://www.mdpi.com/article/10.3390/w15030519/s1, Figure S1: AFM images of extracellular polymers (EPS, 100 µg mL−1) isolated from Cylindrotheca closterium culture, prepared in natural filtered seawater. Images were acquired using tapping mode in air and presented as height with scan sizes 10 µm × 10 µm (a,b) and 5 µm × 5 µm (c), vertical scale 8 nm.; Figure S2: The comparison of FTIR spectra of SiO2 NPs in SW and UPW. FTIR spectra (1850–950 cm−1) of SiO2 NPs dissolved in SW (red curve) and UPW (orange curve); The displacement of distinguished bands is highlighted using gray or yellow rectangles; Figure S3. AFM images of Cylindrotheca closterium cell (a,b) with released EPS (c) from control culture (culture not spiked with SiO2 NPs). Images are acquired using contact mode in air with scan sizes: 20 µm × 20 µm (a), 8 µm × 8 µm (b), 1.5 µm × 1.5 µm (c) and presented as deflection (a,b) and height data (c). Vertical profile along the indicated line shows EPS fibril heights.
Author Contributions
Conceptualization, T.M.R. and P.V.; methodology, P.V., D.B., D.D.J., and T.M.R.; investigation, P.V., L.P., D.B., D.D.J., and T.M.R.; writing—original draft preparation, P.V., D.B., and T.M.R.; writing—review and editing, T.M.R.; supervision, T.M.R.; funding acquisition, D.B. and T.M.R. All authors have read and agreed to the published version of the manuscript.
Funding
This work was supported by the Croatian Science Foundation, Project No. IP-2018-01-5840 (“From algal cell surface properties to stress markers for aquatic systems”) and UIP-2020-02-7669 (“Model of demyelination on a molecular scale at physiological and pathological conditions”).
Data Availability Statement
Not applicable.
Acknowledgments
The authors thank Zdeslav Zovko (Ruđer Bošković Institute, Zagreb, Croatia) for collecting natural Adriatic seawater and for dissolved organic carbon analysis.
Conflicts of Interest
The authors declare no conflict of interest. The funders had no role in the design of the study; in the collection, analyses, or interpretation of data; in the writing of the manuscript; or in the decision to publish the results.
References
- ISO ISO/TR 18401:2017; Nanotechnologies—Plain Language Explanation of Selected Terms from the ISO/IEC 80004 Series. ISO: Geneva, Switzerland, 2017.
- Jarvie, H.P.; AL-Obaidi, H.; King, S.M.; Bowes, M.J.; Lawrance, J.; Drake, A.F.; Green, M.A.; Dobson, P. Fate of Silica Nanoparticles in Simulated Primary Wastewater Treatment. Environ. Sci. Technol. 2009, 43, 8622–8628. [Google Scholar] [CrossRef] [PubMed] [Green Version]
- Napierska, D.; Thomassen, L.C.; Lison, D.; Martens, J.A.; Hoet, P.H. The Nanosilica Hazard: Another Variable Entity. Part. Fibre Toxicol. 2010, 7, 39. [Google Scholar] [CrossRef] [PubMed] [Green Version]
- Van Hoek, J.; Heideman, G.; Noordermeer, J.; Dierkes, W.; Blume, A. Implications of the Use of Silica as Active Filler in Passenger Car Tire Compounds on Their Recycling Options. Materials 2019, 12, 725. [Google Scholar] [CrossRef] [PubMed] [Green Version]
- Carlsson, N.; Gustafsson, H.; Thörn, C.; Olsson, L.; Holmberg, K.; Åkerman, B. Enzymes Immobilized in Mesoporous Silica: A Physical–Chemical Perspective. Adv. Colloid Interface Sci. 2014, 205, 339–360. [Google Scholar] [CrossRef]
- Fenollosa, R.; Garcia-Rico, E.; Alvarez, S.; Alvarez, R.; Yu, X.; Rodriguez, I.; Carregal-Romero, S.; Villanueva, C.; Garcia-Algar, M.; Rivera-Gil, P.; et al. Silicon Particles as Trojan Horses for Potential Cancer Therapy. J. Nanobiotechnol. 2014, 12, 35. [Google Scholar] [CrossRef]
- Santos, H.A.; Mäkilä, E.; Airaksinen, A.J.; Bimbo, L.M.; Hirvonen, J. Porous Silicon Nanoparticles for Nanomedicine: Preparation and Biomedical Applications. Nanomedicine 2014, 9, 535–554. [Google Scholar] [CrossRef]
- Slowing, I.; Viveroescoto, J.; Wu, C.; Lin, V. Mesoporous Silica Nanoparticles as Controlled Release Drug Delivery and Gene Transfection Carriers. Adv. Drug Deliv. Rev. 2008, 60, 1278–1288. [Google Scholar] [CrossRef]
- Baun, A.; Hartmann, N.B.; Grieger, K.; Kusk, K.O. Ecotoxicity of Engineered Nanoparticles to Aquatic Invertebrates: A Brief Review and Recommendations for Future Toxicity Testing. Ecotoxicology 2008, 17, 387–395. [Google Scholar] [CrossRef]
- Moore, M.N. Do Nanoparticles Present Ecotoxicological Risks for the Health of the Aquatic Environment? Environ. Int. 2006, 32, 967–976. [Google Scholar] [CrossRef]
- Angel, B.M.; Batley, G.E.; Jarolimek, C.V.; Rogers, N.J. The Impact of Size on the Fate and Toxicity of Nanoparticulate Silver in Aquatic Systems. Chemosphere 2013, 93, 359–365. [Google Scholar] [CrossRef]
- Ates, M.; Daniels, J.; Arslan, Z.; Farah, I.O. Effects of Aqueous Suspensions of Titanium Dioxide Nanoparticles on Artemia Salina: Assessment of Nanoparticle Aggregation, Accumulation, and Toxicity. Environ. Monit. Assess. 2013, 185, 3339–3348. [Google Scholar] [CrossRef] [Green Version]
- Wang, H.; Burgess, R.M.; Cantwell, M.G.; Portis, L.M.; Perron, M.M.; Wu, F.; Ho, K.T. Stability and Aggregation of Silver and Titanium Dioxide Nanoparticles in Seawater: Role of Salinity and Dissolved Organic Carbon: Stability and Aggregation of Silver and Titanium Dioxide. Environ. Toxicol. Chem. 2014, 33, 1023–1029. [Google Scholar] [CrossRef] [PubMed]
- Boughbina-Portolés, A.; Sanjuan-Navarro, L.; Moliner-Martínez, Y.; Campíns-Falcó, P. Study of the Stability of Citrate Capped AgNPs in Several Environmental Water Matrices by Asymmetrical Flow Field Flow Fractionation. Nanomaterials 2021, 11, 926. [Google Scholar] [CrossRef] [PubMed]
- Gondikas, A.; Gallego-Urrea, J.; Halbach, M.; Derrien, N.; Hassellöv, M. Nanomaterial Fate in Seawater: A Rapid Sink or Intermittent Stabilization? Front. Environ. Sci. 2020, 8, 151. [Google Scholar] [CrossRef]
- Mišić Radić, T.; Vukosav, P.; Komazec, B.; Formosa-Dague, C.; Domazet Jurašin, D.; Peharec Štefanić, P.; Čačković, A.; Juraić, K.; Ivošević DeNardis, N. Nanoplastic-Induced Nanostructural, Nanomechanical, and Antioxidant Response of Marine Diatom Cylindrotheca Closterium. Water 2022, 14, 2163. [Google Scholar] [CrossRef]
- Navarro, E.; Baun, A.; Behra, R.; Hartmann, N.B.; Filser, J.; Miao, A.-J.; Quigg, A.; Santschi, P.H.; Sigg, L. Environmental Behavior and Ecotoxicity of Engineered Nanoparticles to Algae, Plants, and Fungi. Ecotoxicology 2008, 17, 372–386. [Google Scholar] [CrossRef] [PubMed] [Green Version]
- Verdugo, P. Polymer Gel Phase Transition in Condensation-Decondensation of Secretory Products. In Responsive Gels: Volume Transitions II; Dušek, K., Ed.; Advances in Polymer Science; Springer: Berlin/Heidelberg, Germany, 1993; Volume 110, pp. 145–156. ISBN 978-3-540-56970-1. [Google Scholar]
- Aluwihare, L.I.; Repeta, D.J.; Chen, R.F. A Major Biopolymeric Component to Dissolved Organic Carbon in Surface Sea Water. Nature 1997, 387, 166–169. [Google Scholar] [CrossRef]
- Martin, J.H.; Fitzwater, S.E. Dissolved Organic Carbon in the Atlantic, Southern and Pacific Oceans. Nature 1992, 356, 699–700. [Google Scholar] [CrossRef]
- Sharp, J.H. Marine Dissolved Organic Carbon: Are the Older Values Correct? Mar. Chem. 1997, 56, 265–277. [Google Scholar] [CrossRef]
- Dautović, J.; Vojvodić, V.; Tepić, N.; Ćosović, B.; Ciglenečki, I. Dissolved Organic Carbon as Potential Indicator of Global Change: A Long-Term Investigation in the Northern Adriatic. Sci. Total Environ. 2017, 587–588, 185–195. [Google Scholar] [CrossRef]
- Ciglenečki, I.; Vilibić, I.; Dautović, J.; Vojvodić, V.; Ćosović, B.; Zemunik, P.; Dunić, N.; Mihanović, H. Dissolved Organic Carbon and Surface Active Substances in the Northern Adriatic Sea: Long-Term Trends, Variability and Drivers. Sci. Total Environ. 2020, 730, 139104. [Google Scholar] [CrossRef]
- Lin, D.; Drew Story, S.; Walker, S.L.; Huang, Q.; Cai, P. Influence of Extracellular Polymeric Substances on the Aggregation Kinetics of TiO2 Nanoparticles. Water Res. 2016, 104, 381–388. [Google Scholar] [CrossRef] [PubMed]
- Morelli, E.; Gabellieri, E.; Bonomini, A.; Tognotti, D.; Grassi, G.; Corsi, I. TiO2 Nanoparticles in Seawater: Aggregation and Interactions with the Green Alga Dunaliella Tertiolecta. Ecotoxicol. Environ. Saf. 2018, 148, 184–193. [Google Scholar] [CrossRef] [PubMed]
- Zhang, S.; Jiang, Y.; Chen, C.-S.; Creeley, D.; Schwehr, K.A.; Quigg, A.; Chin, W.-C.; Santschi, P.H. Ameliorating Effects of Extracellular Polymeric Substances Excreted by Thalassiosira Pseudonana on Algal Toxicity of CdSe Quantum Dots. Aquat. Toxicol. 2013, 126, 214–223. [Google Scholar] [CrossRef]
- Adeleye, A.S.; Conway, J.R.; Perez, T.; Rutten, P.; Keller, A.A. Influence of Extracellular Polymeric Substances on the Long-Term Fate, Dissolution, and Speciation of Copper-Based Nanoparticles. Environ. Sci. Technol. 2014, 48, 12561–12568. [Google Scholar] [CrossRef] [PubMed] [Green Version]
- Miao, A.-J.; Schwehr, K.A.; Xu, C.; Zhang, S.-J.; Luo, Z.; Quigg, A.; Santschi, P.H. The Algal Toxicity of Silver Engineered Nanoparticles and Detoxification by Exopolymeric Substances. Environ. Pollut. 2009, 157, 3034–3041. [Google Scholar] [CrossRef]
- Pletikapić, G.; Žutić, V.; Svetličić, V.; Vinković Vrček, I. Atomic Force Microscopy Characterization of Silver Nanoparticles Interactions with Marine Diatom Cells and Extracellular Polymeric Substance. J. Mol. Recognit. 2012, 25, 309–317. [Google Scholar] [CrossRef]
- Summers, S.; Henry, T.; Gutierrez, T. Agglomeration of Nano- and Microplastic Particles in Seawater by Autochthonous and de Novo-Produced Sources of Exopolymeric Substances. Mar. Pollut. Bull. 2018, 130, 258–267. [Google Scholar] [CrossRef]
- Grassi, G.; Gabellieri, E.; Cioni, P.; Paccagnini, E.; Faleri, C.; Lupetti, P.; Corsi, I.; Morelli, E. Interplay between Extracellular Polymeric Substances (EPS) from a Marine Diatom and Model Nanoplastic through Eco-Corona Formation. Sci. Total Environ. 2020, 725, 138457. [Google Scholar] [CrossRef]
- Guillard, R.R.L. Culture of Phytoplankton for Feeding Marine Invertebrates. In Culture of Marine Invertebrate Animals; Smith, W.L., Chanley, M.H., Eds.; Springer: Boston, MA, USA, 1975; pp. 29–60. ISBN 978-1-4615-8716-3. [Google Scholar]
- Magaletti, E.; Urbani, R.; Sist, P.; Ferrari, C.R.; Cicero, A.M. Abundance and Chemical Characterization of Extracellular Carbohydrates Released by the Marine Diatom Cylindrotheca Fusiformis under N- and P-Limitation. Eur. J. Phycol. 2004, 39, 133–142. [Google Scholar] [CrossRef]
- Balnois, E.; Wilkinson, K.J. Sample Preparation Techniques for the Observation of Environmental Biopolymers by Atomic Force Microscopy. Colloid. Surf. A 2002, 207, 229–242. [Google Scholar] [CrossRef]
- Mišić Radić, T.; Svetličić, V.; Žutić, V.; Boulgaropoulos, B. Seawater at the Nanoscale: Marine Gel Imaged by Atomic Force Microscopy. J. Mol. Recognit. 2011, 24, 397–405. [Google Scholar] [CrossRef] [PubMed]
- Pletikapić, G.; Mišić Radić, T.; Zimmermann, A.H.; Svetličić, V.; Pfannkuchen, M.; Marić, D.; Godrijan, J.; Žutić, V. AFM Imaging of Extracellular Polymer Release by Marine Diatom Cylindrotheca Closterium (Ehrenberg) Reiman & J.C. Lewin. J. Mol. Recognit. 2011, 24, 436–445. [Google Scholar] [CrossRef] [PubMed]
- Canet-Ferrer, J.; Coronado, E.; Forment-Aliaga, A.; Pinilla-Cienfuegos, E. Correction of the Tip Convolution Effects in the Imaging of Nanostructures Studied through Scanning Force Microscopy. Nanotechnology 2014, 25, 395703. [Google Scholar] [CrossRef]
- Derjaguin, B.; Landau, L.D. Theory of the Stability of Strongly Charged Lyophobic Sols and of the Adhesion of Strongly Charged Particles in Solutions of Electrolytes. Acta Physicochim. U.R.S.S. 1941, 14, 633–662. [Google Scholar] [CrossRef]
- Verwey, E.J.W.; Overbeek, J.T.G. Theory of Stability of Lyophobic Colloids; Elsevier: Amsterdam, The Netherlands, 1948. [Google Scholar]
- Loosli, F.; Omar, F.M.; Carnal, F.; Oriekhova, O.; Clavier, A.; Chai, Z.; Stoll, S. Manufactured Nanoparticle Behavior and Transformations in Aquatic Systems. Importance of Natural Organic Matter. Chimia 2014, 68, 783–787. [Google Scholar] [CrossRef]
- Adeleye, A.S.; Keller, A.A. Interactions between Algal Extracellular Polymeric Substances and Commercial TiO2 Nanoparticles in Aqueous Media. Environ. Sci. Technol. 2016, 50, 12258–12265. [Google Scholar] [CrossRef] [Green Version]
- Rehman, Z.U.; Vrouwenvelder, J.S.; Saikaly, P.E. Physicochemical Properties of Extracellular Polymeric Substances Produced by Three Bacterial Isolates from Biofouled Reverse Osmosis Membranes. Front. Microbiol. 2021, 12, 668761. [Google Scholar] [CrossRef]
- Bao, P.; Xia, M.; Liu, A.; Wang, M.; Shen, L.; Yu, R.; Liu, Y.; Li, J.; Wu, X.; Fang, C.; et al. Extracellular Polymeric Substances (EPS) Secreted by Purpureocillium Lilacinum Strain Y3 Promote Biosynthesis of Jarosite. RSC Adv. 2018, 8, 22635–22642. [Google Scholar] [CrossRef] [Green Version]
- Zhou, K.; Hu, Y.; Zhang, L.; Yang, K.; Lin, D. The Role of Exopolymeric Substances in the Bioaccumulation and Toxicity of Ag Nanoparticles to Algae. Sci. Rep. 2016, 6, 32998. [Google Scholar] [CrossRef]
- Mao, Y.; Li, H.; Huangfu, X.; Liu, Y.; He, Q. Nanoplastics Display Strong Stability in Aqueous Environments: Insights from Aggregation Behaviour and Theoretical Calculations. Environ. Pollut. 2020, 258, 113760. [Google Scholar] [CrossRef] [PubMed]
- Eboigbodin, K.E.; Biggs, C.A. Characterization of the Extracellular Polymeric Substances Produced by Escherichia Coli Using Infrared Spectroscopic, Proteomic, and Aggregation Studies. Biomacromolecules 2008, 9, 686–695. [Google Scholar] [CrossRef]
- Zheng, S.; Zhou, Q.; Chen, C.; Yang, F.; Cai, Z.; Li, D.; Geng, Q.; Feng, Y.; Wang, H. Role of Extracellular Polymeric Substances on the Behavior and Toxicity of Silver Nanoparticles and Ions to Green Algae Chlorella Vulgaris. Sci. Total Environ. 2019, 660, 1182–1190. [Google Scholar] [CrossRef]
- Capeletti, L.B.; Zimnoch, J.H. Fourier Transform Infrared and Raman Characterization of Silica-Based Materials; IntechOpen: Rijeka, Croatia, 2016; ISBN 978-953-51-2681-2. [Google Scholar]
- Oufakir, A.; Khouchaf, L.; Elaatmani, M.; Zegzouti, A.; Louarn, G.; Fraj, A.B. Study of Structural Short Order and Surface Changes of SiO2 Compounds. MATEC Web Conf. 2018, 149, 01041. [Google Scholar] [CrossRef]
- Urbani, R.; Paola, S.; Pletikapić, G.; Mišić Radić, T.; Svetličić, V.; Žutić, V. Diatom Polysaccharides: Extracellular Production, Isolation and Molecular Characterization. In The Complex World of Polysaccharides; Karunaratne, D.N., Ed.; InTechOpen: Rijeka, Croatia, 2012; pp. 345–370. ISBN 978-953-51-0819-1. [Google Scholar]
- Mišić Radić, T.; Čačković, A.; Penezić, A.; Dautović, J.; Lončar, J.; Omanović, D.; Juraić, K.; Ljubešić, Z. Physiological and Morphological Response of Marine Diatom Cylindrotheca Closterium (Bacillariophyceae) Exposed to Cadmium. Eur. J. Phycol. 2021, 56, 24–36. [Google Scholar] [CrossRef]
- Natarajan, L.; Omer, S.; Jetly, N.; Jenifer, M.A.; Chandrasekaran, N.; Suraishkumar, G.K.; Mukherjee, A. Eco-Corona Formation Lessens the Toxic Effects of Polystyrene Nanoplastics towards Marine Microalgae Chlorella Sp. Environ. Res. 2020, 188, 109842. [Google Scholar] [CrossRef] [PubMed]
- Giri, S.; Mukherjee, A. Ageing with Algal EPS Reduces the Toxic Effects of Polystyrene Nanoplastics in Freshwater Microalgae Scenedesmus Obliquus. J. Environ. Chem. Eng. 2021, 9, 105978. [Google Scholar] [CrossRef]
- Gao, X.; Yang, K.; Lin, D. Influence of Extracellular Polymeric Substance on the Interaction between Titanium Dioxide Nanoparticles and Chlorella Pyrenoidosa Cells. Sci. Total Environ. 2021, 778, 146446. [Google Scholar] [CrossRef]
Figure 1.
AFM characterization of SiO2 nanoparticles (10 µg mL−1) in ultrapure water (a,b) and in filtered natural seawater (c,d). Images are acquired using tapping mode in air and presented as height (a,b,d) and amplitude data (c), with scan sizes: 5 µm × 5 µm (a); 1 µm × 1 µm (b); 2 µm × 2 µm (c); 1 µm × 1 µm (d) with vertical profiles along indicated lines showing particle heights. Line crossing nanoparticle and belonging vertical profile along indicated line in (b) are shown in the same color and indicated by the same number.

Figure 2.
AFM images of extracellular polymers (EPS) isolated from Cylindrotheca closterium culture (200 µg mL−1, suspension prepared in filtered natural seawater) showing a fibrillar network. Images were acquired using tapping mode in air and presented as height data with scan sizes 5 µm × 5 µm (a); and 1 µm × 1 µm (b). A vertical profile along the indicated line shows fibril heights.

Figure 3.
AFM images of suspensions of extracellular polymers (EPS, 200 µg mL−1) spiked with SiO2 (10 µg mL−1) prepared in filtered natural seawater. AFM images were acquired using tapping mode in air and presented as height data, with scan sizes 5 µm × 5 µm (a); and 1.5 µm × 1.5 µm (b,c). Corresponding vertical profiles along the indicated lines show particle and fibril heights. Line crossing nanoparticles and belonging vertical profile along indicated line in (b) are shown in the same color and indicated by the same number.

Figure 4.
Normalized and stacked FTIR spectra (1850–950 cm−1) of EPS (black curve), SiO2 NPs (red curve), and their mixture EPS + SiO2 NPs (blue curve) prepared in SW obtained after SW spectra subtraction. The positions of the discussed bands are designated with dotted gray lines (if their maximum position is maintained across different systems) or as rectangles that emphasize their displacement (gray) or qualitatively different spectral envelope (yellow).

Figure 5.
AFM images of Cylindrotheca closterium cells spiked with SiO2 (10 µg mL−1) nanoparticles showing C. closterium cell and released EPS with embedded SiO2 nanoparticles. Images were acquired using contact mode in air and presented as amplitude data (a℃c) and height (d,e). Scan sizes 40 µm × 40 µm (a); 10 µm × 10 µm (b,c); 3 µm × 3 µm (d,e) with vertical profiles along indicated lines showing the height of EPS and embedded nanoparticles. Line crossing EPS and nanoparticles and belonging vertical profile along indicated line in (d) are shown in the same color and indicated by the same number.


Table 1.
Physicochemical characterization of SiO2 nanoparticles (10 μg mL−1) in ultrapure water (UPW) and filtered natural seawater (SW) by DLS and ELS.
Table 1.
Physicochemical characterization of SiO2 nanoparticles (10 μg mL−1) in ultrapure water (UPW) and filtered natural seawater (SW) by DLS and ELS.
| Time/h | Particle Hydrodynamic Diameter (dh) as Measured by DLS/nm (vol. %) | Zeta Potential (ζ)/mV | ||
|---|---|---|---|---|
| UPW | SW | UPW | SW | |
| 0 | 21.4 ± 1.1 | 54 ± 14 (53.6 %) 345 ± 68 (21.2%) | −14.2 ± 3.2 | −6.0 ± 1.0 |
| 1 | 21.2 ± 0.8 | 780 ± 120 | −13.1 ± 2.2 | −7.3 ± 0.7 |
| 24 | 20.9 ± 0.4 | 990 ± 170 | −17.5 ± 3.3 | −6.4 ± 0.8 |
Disclaimer/Publisher’s Note: The statements, opinions and data contained in all publications are solely those of the individual author(s) and contributor(s) and not of MDPI and/or the editor(s). MDPI and/or the editor(s) disclaim responsibility for any injury to people or property resulting from any ideas, methods, instructions or products referred to in the content. |
© 2023 by the authors. Licensee MDPI, Basel, Switzerland. This article is an open access article distributed under the terms and conditions of the Creative Commons Attribution (CC BY) license (https://creativecommons.org/licenses/by/4.0/).
Share and Cite
MDPI and ACS Style
Vukosav, P.; Pašalić, L.; Bakarić, D.; Domazet Jurašin, D.; Mišić Radić, T. Interaction of Silica Nanoparticles with Microalgal Extracellular Polymers. Water 2023, 15, 519. https://doi.org/10.3390/w15030519
AMA Style
Vukosav P, Pašalić L, Bakarić D, Domazet Jurašin D, Mišić Radić T. Interaction of Silica Nanoparticles with Microalgal Extracellular Polymers. Water. 2023; 15(3):519. https://doi.org/10.3390/w15030519
Chicago/Turabian StyleVukosav, Petra, Lea Pašalić, Danijela Bakarić, Darija Domazet Jurašin, and Tea Mišić Radić. 2023. "Interaction of Silica Nanoparticles with Microalgal Extracellular Polymers" Water 15, no. 3: 519. https://doi.org/10.3390/w15030519
Note that from the first issue of 2016, this journal uses article numbers instead of page numbers. See further details here.