
Appraisal of Groundwater Vulnerability Pollution Mapping Using GIS Based GOD Index in Tiruchendur, Thoothukudi District, India

 ,
,  and
and
Abstract
:1. Introduction
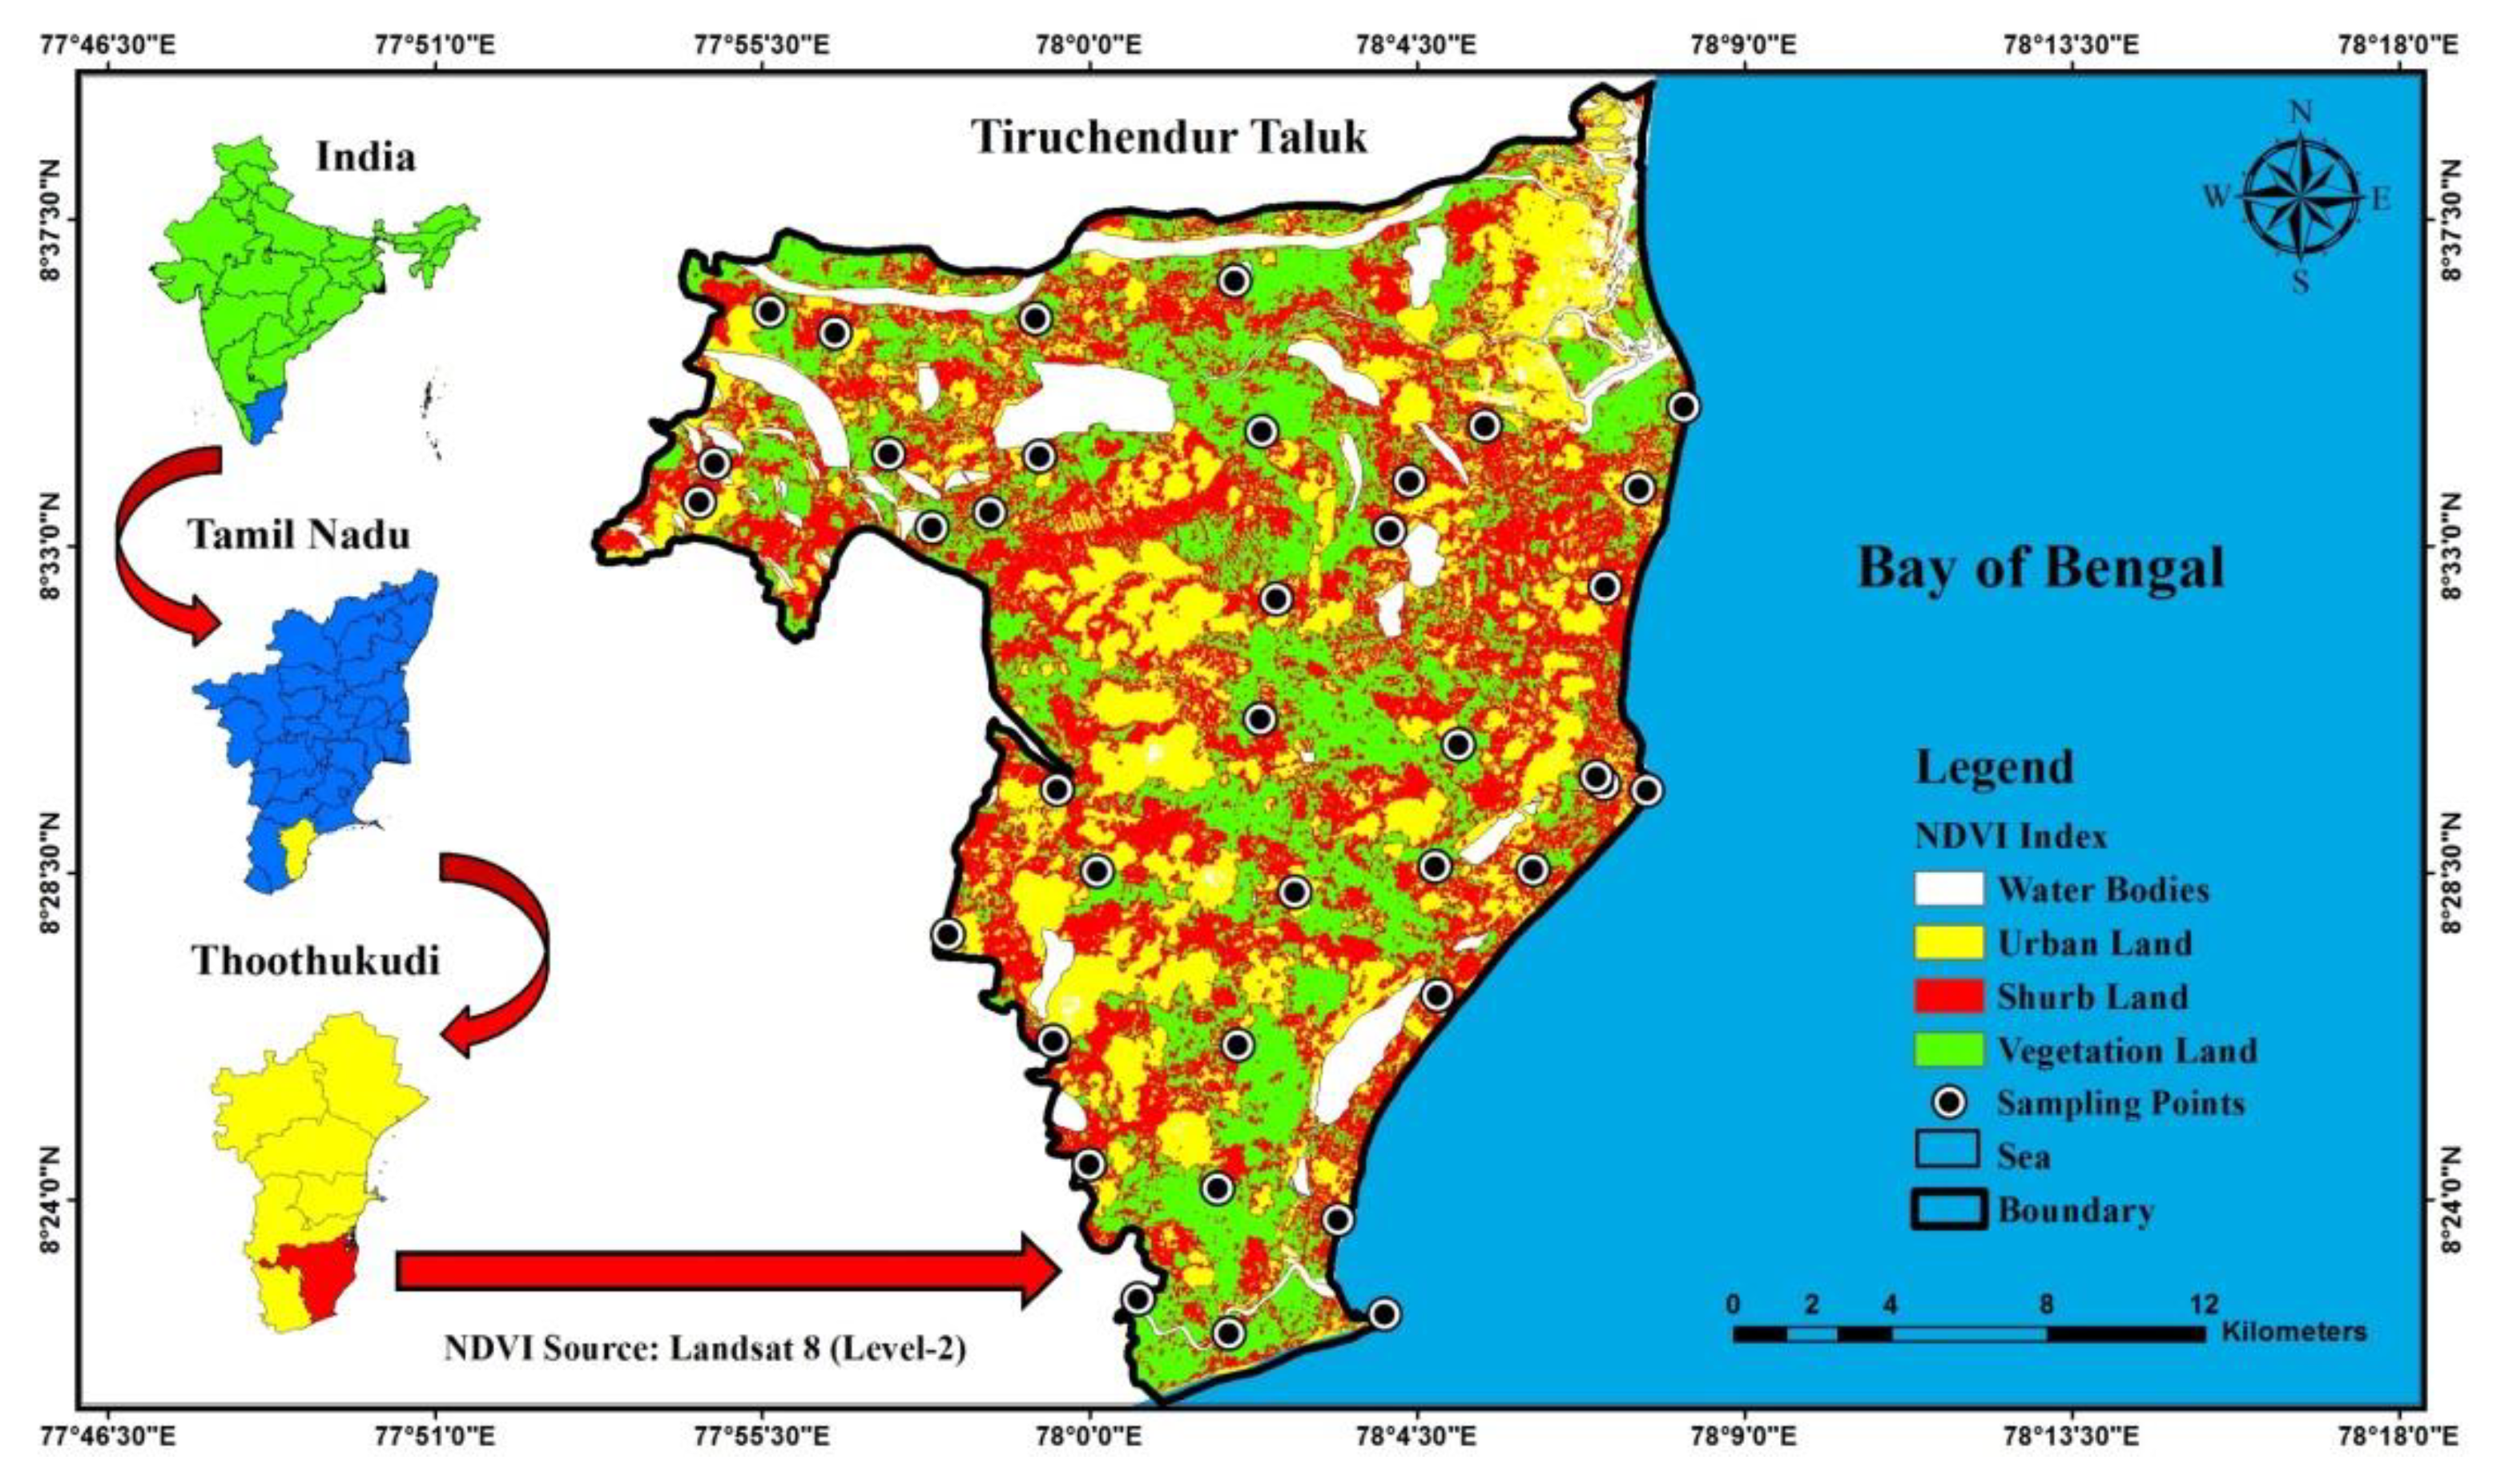
Study Area
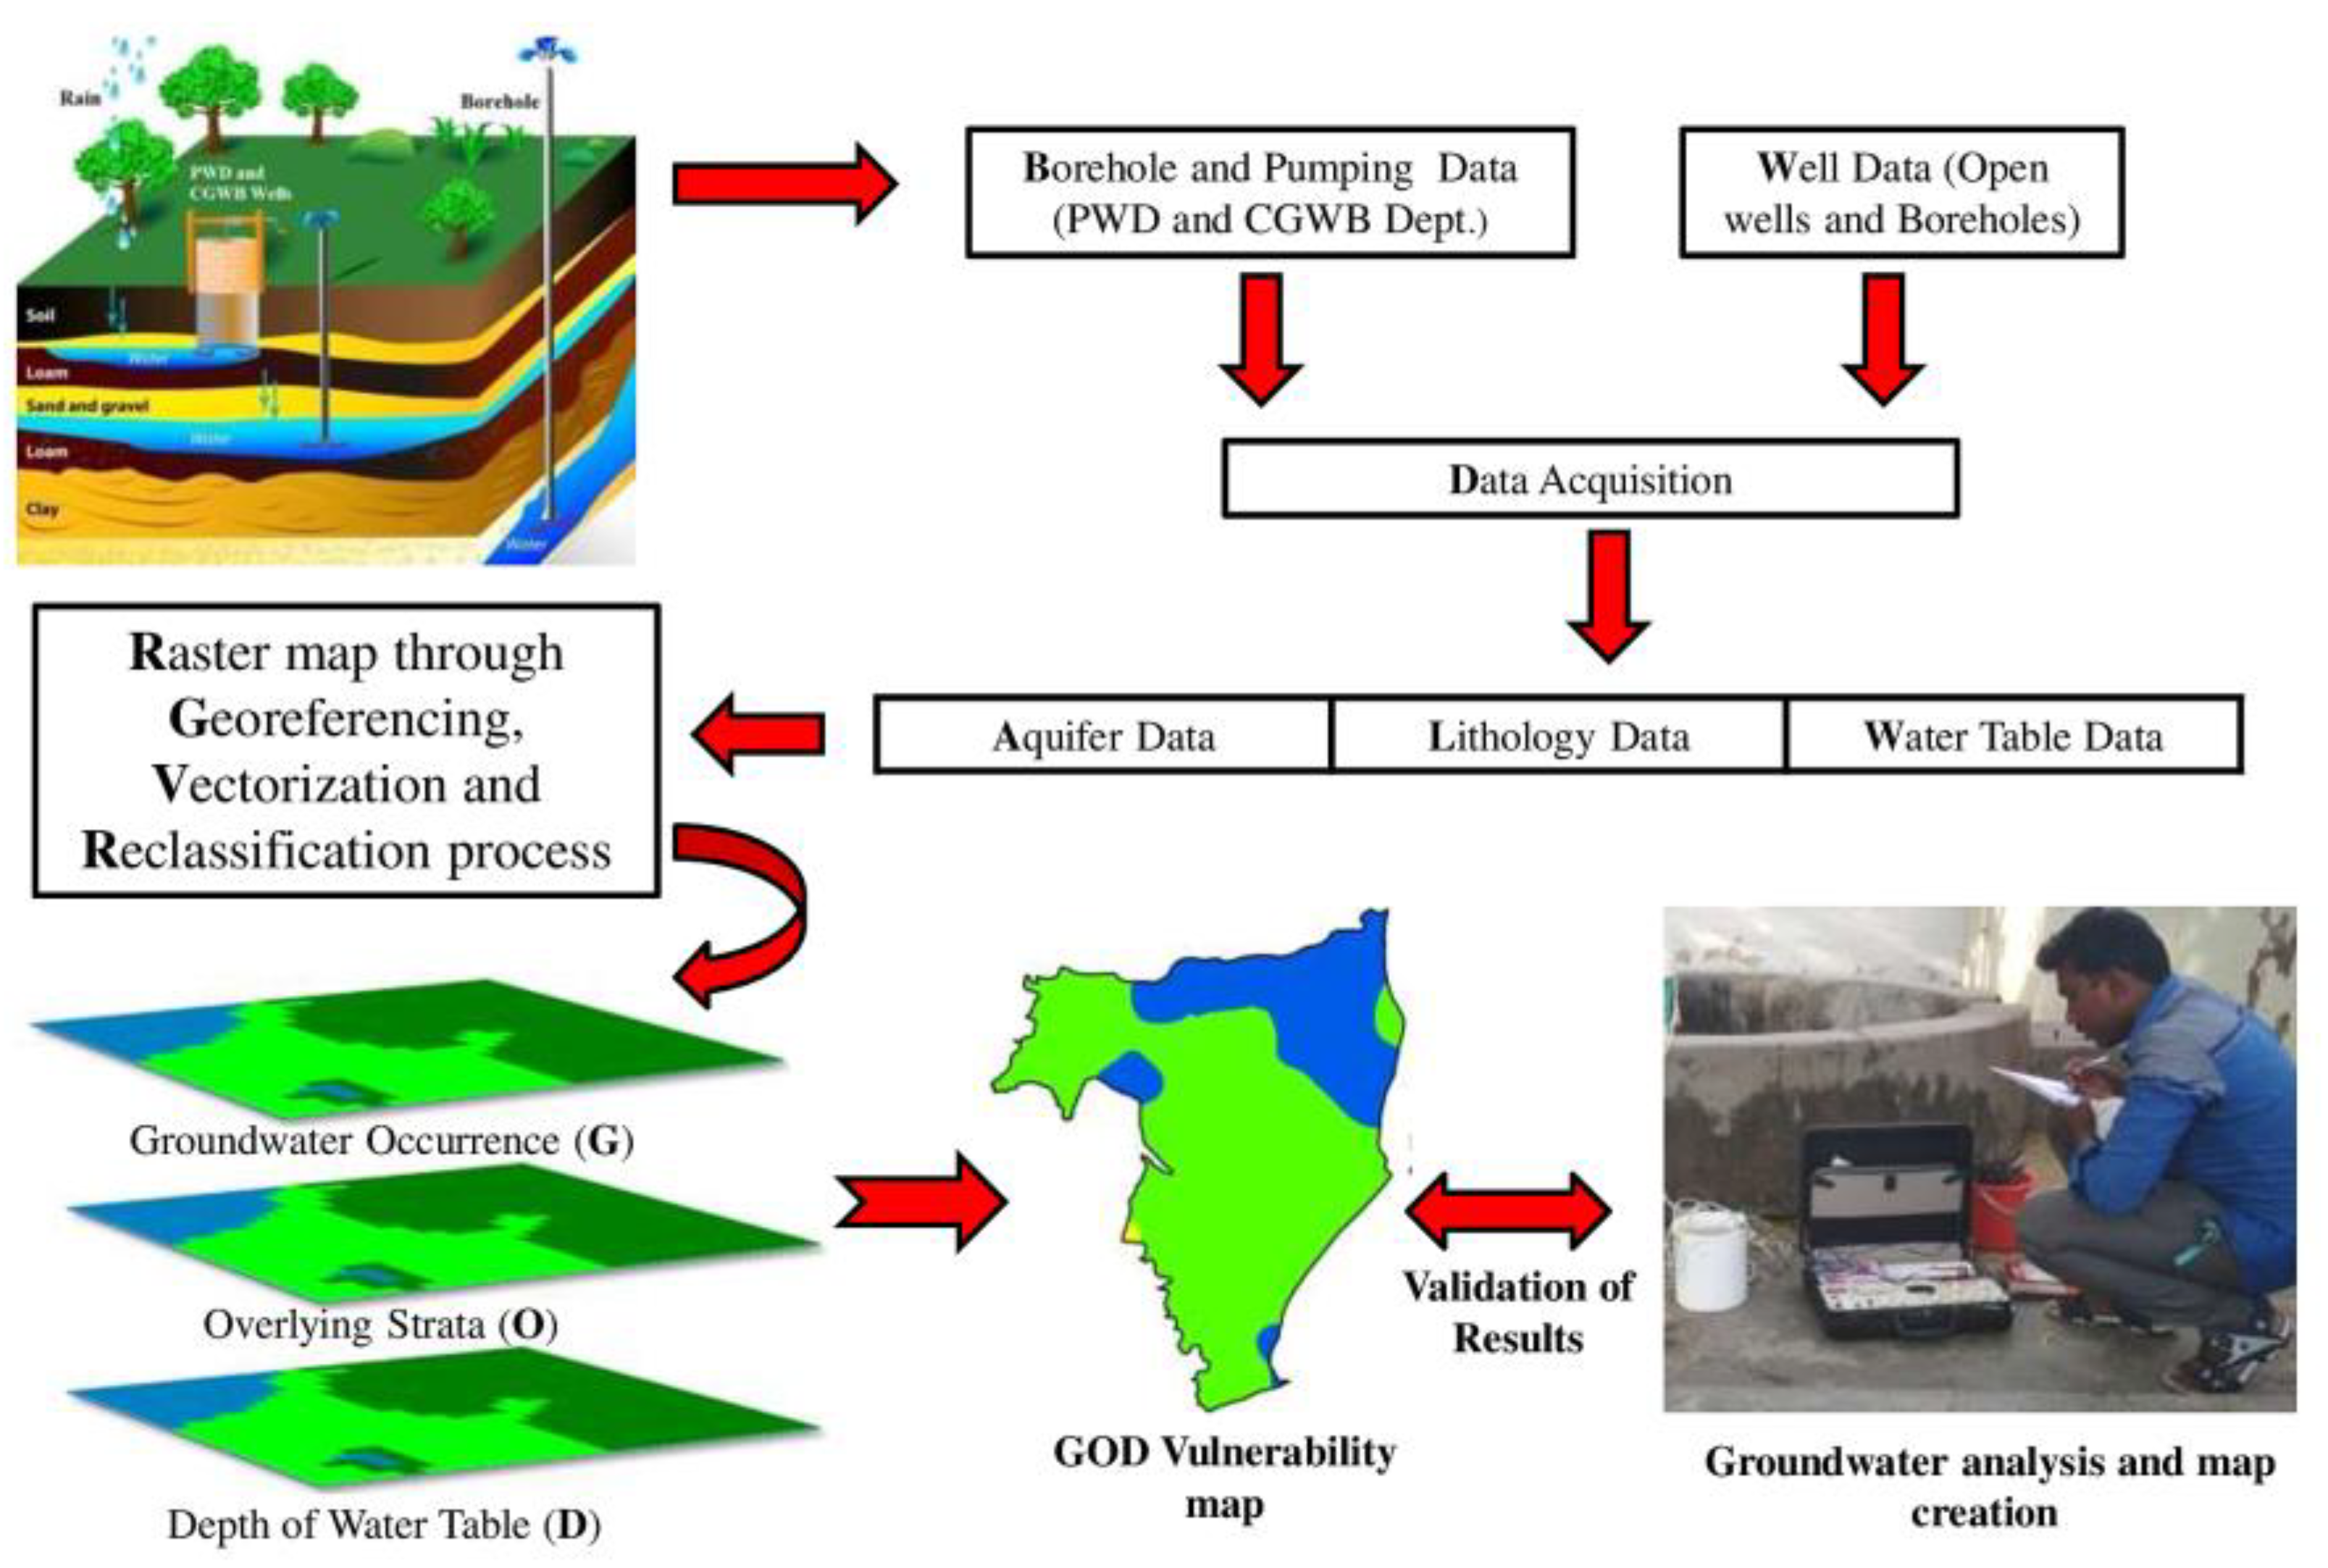
2. Materials and Methods
2.1. Sampling and Analytic Techniques
2.2. Groundwater Vulnerability Assessment
2.3. Computation of GOD’s Indicators
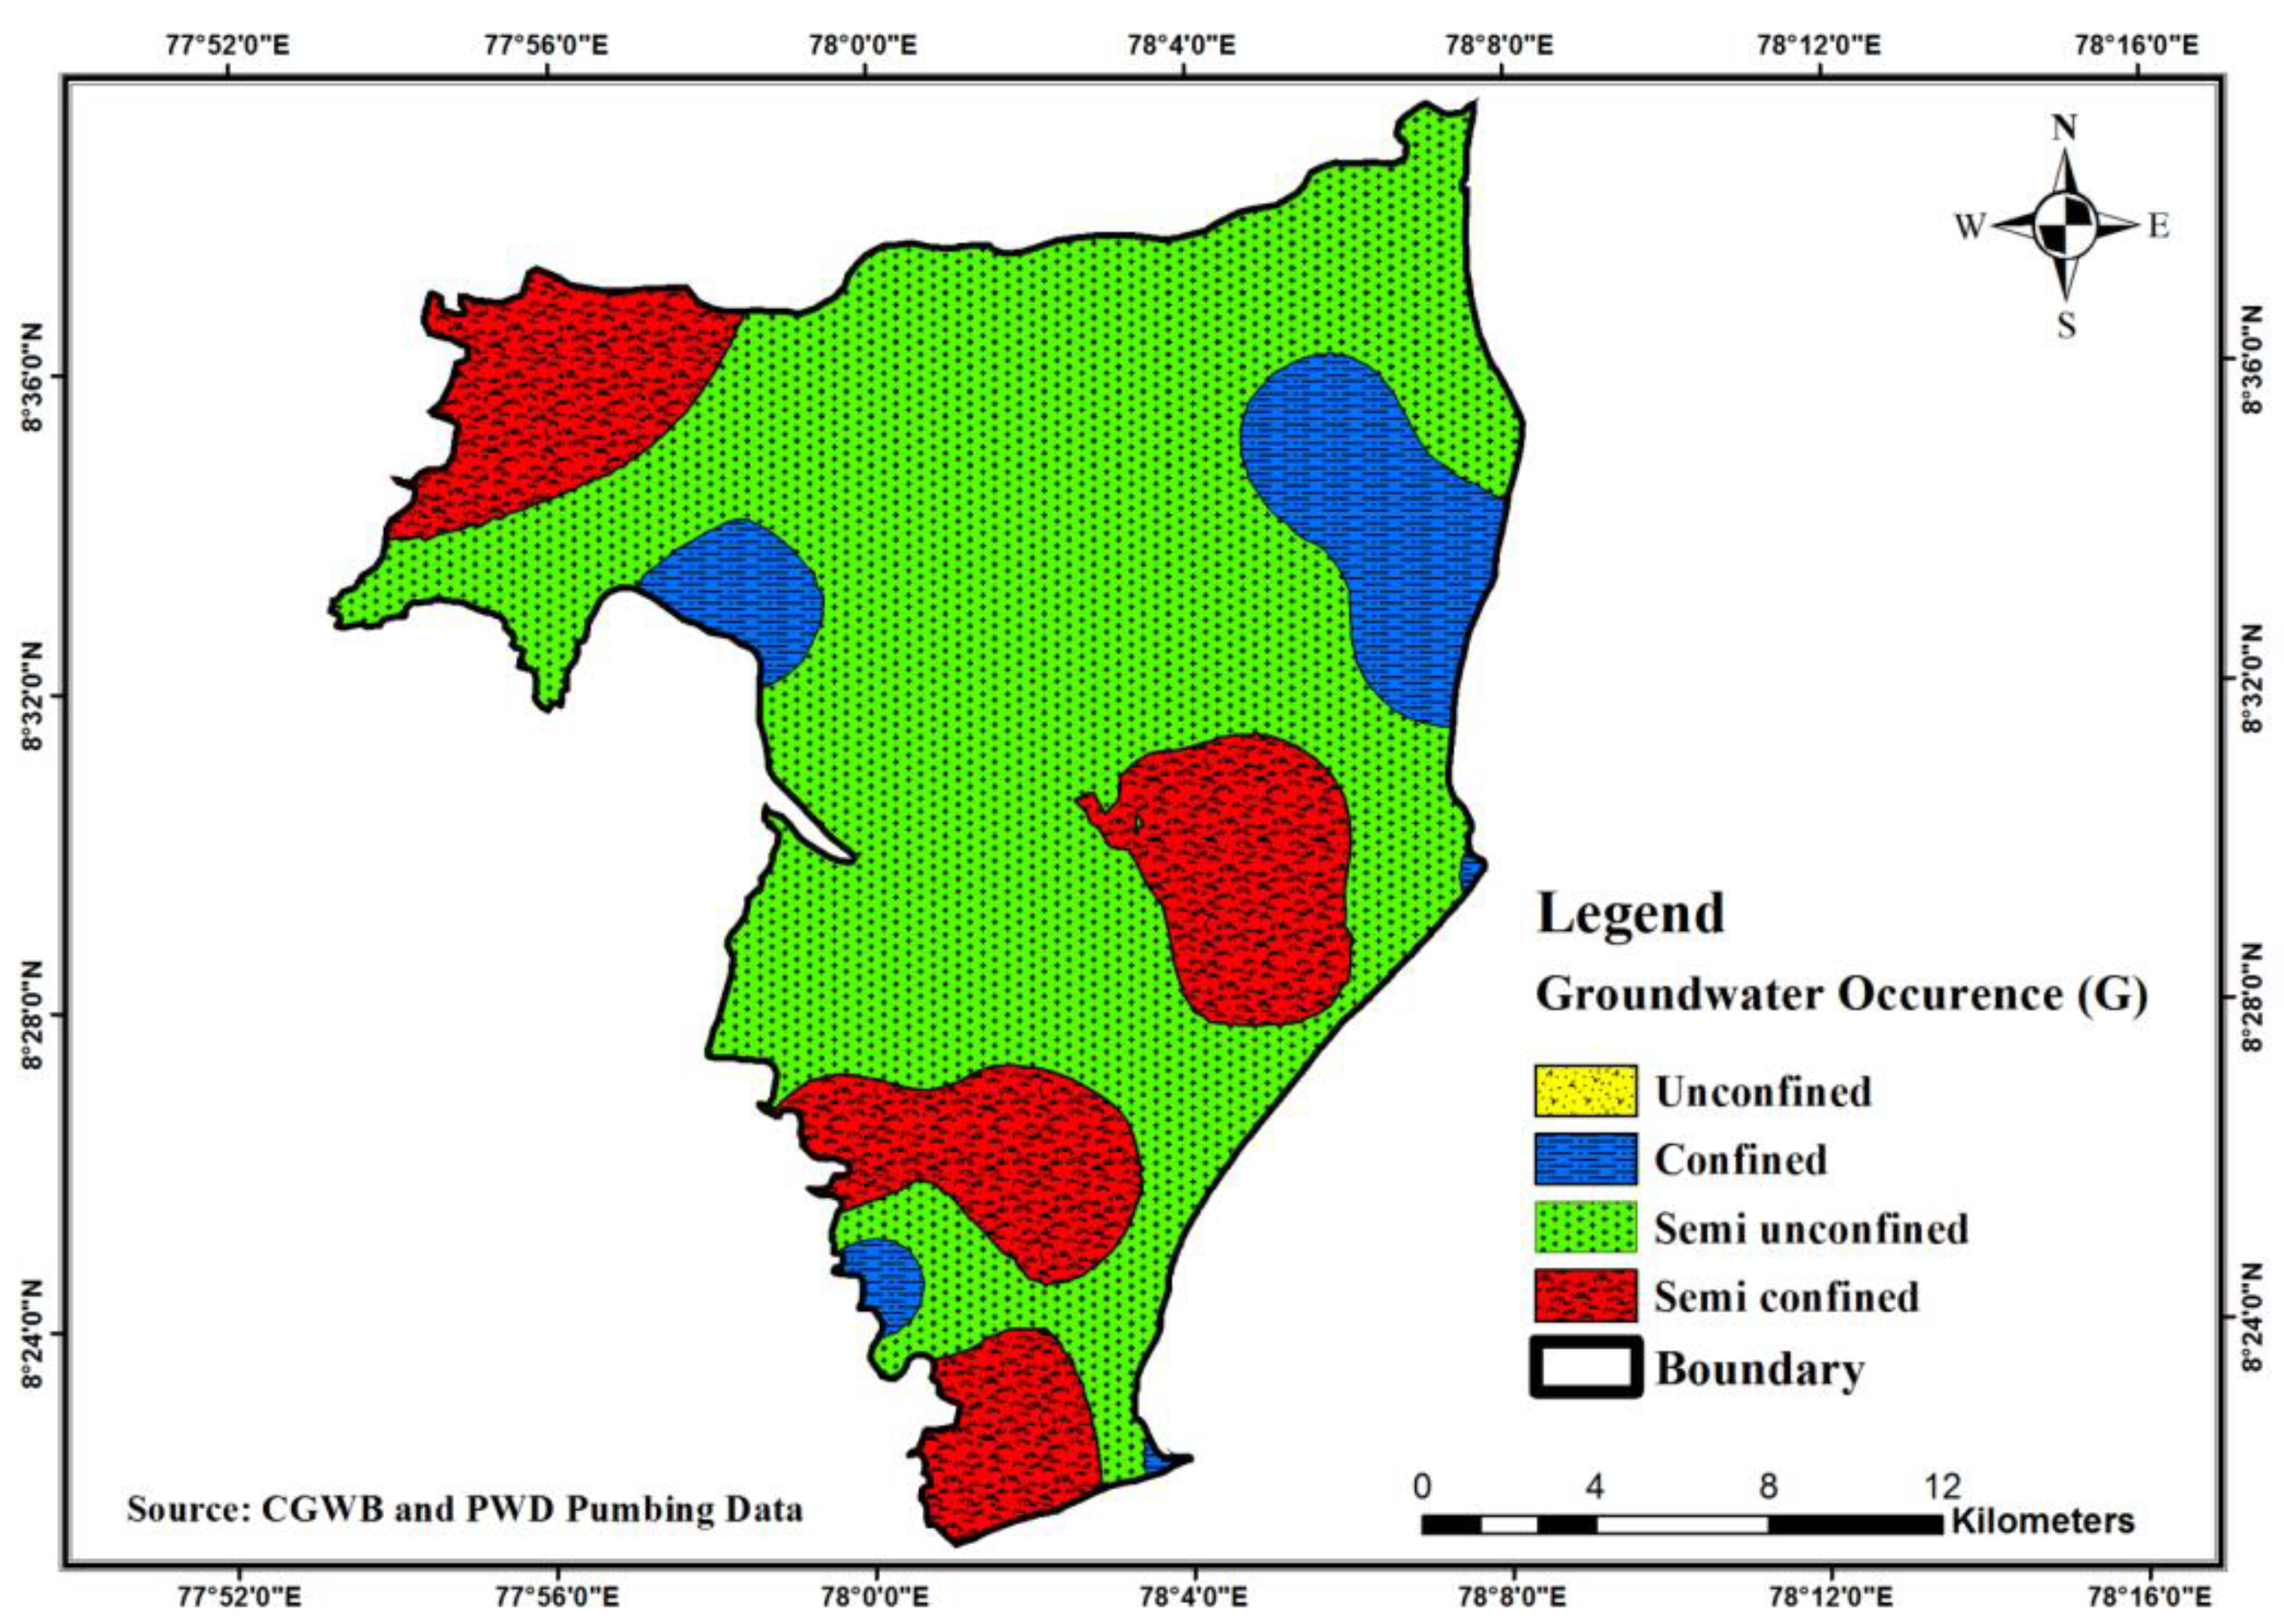
2.3.1. Groundwater Occurrence (G)
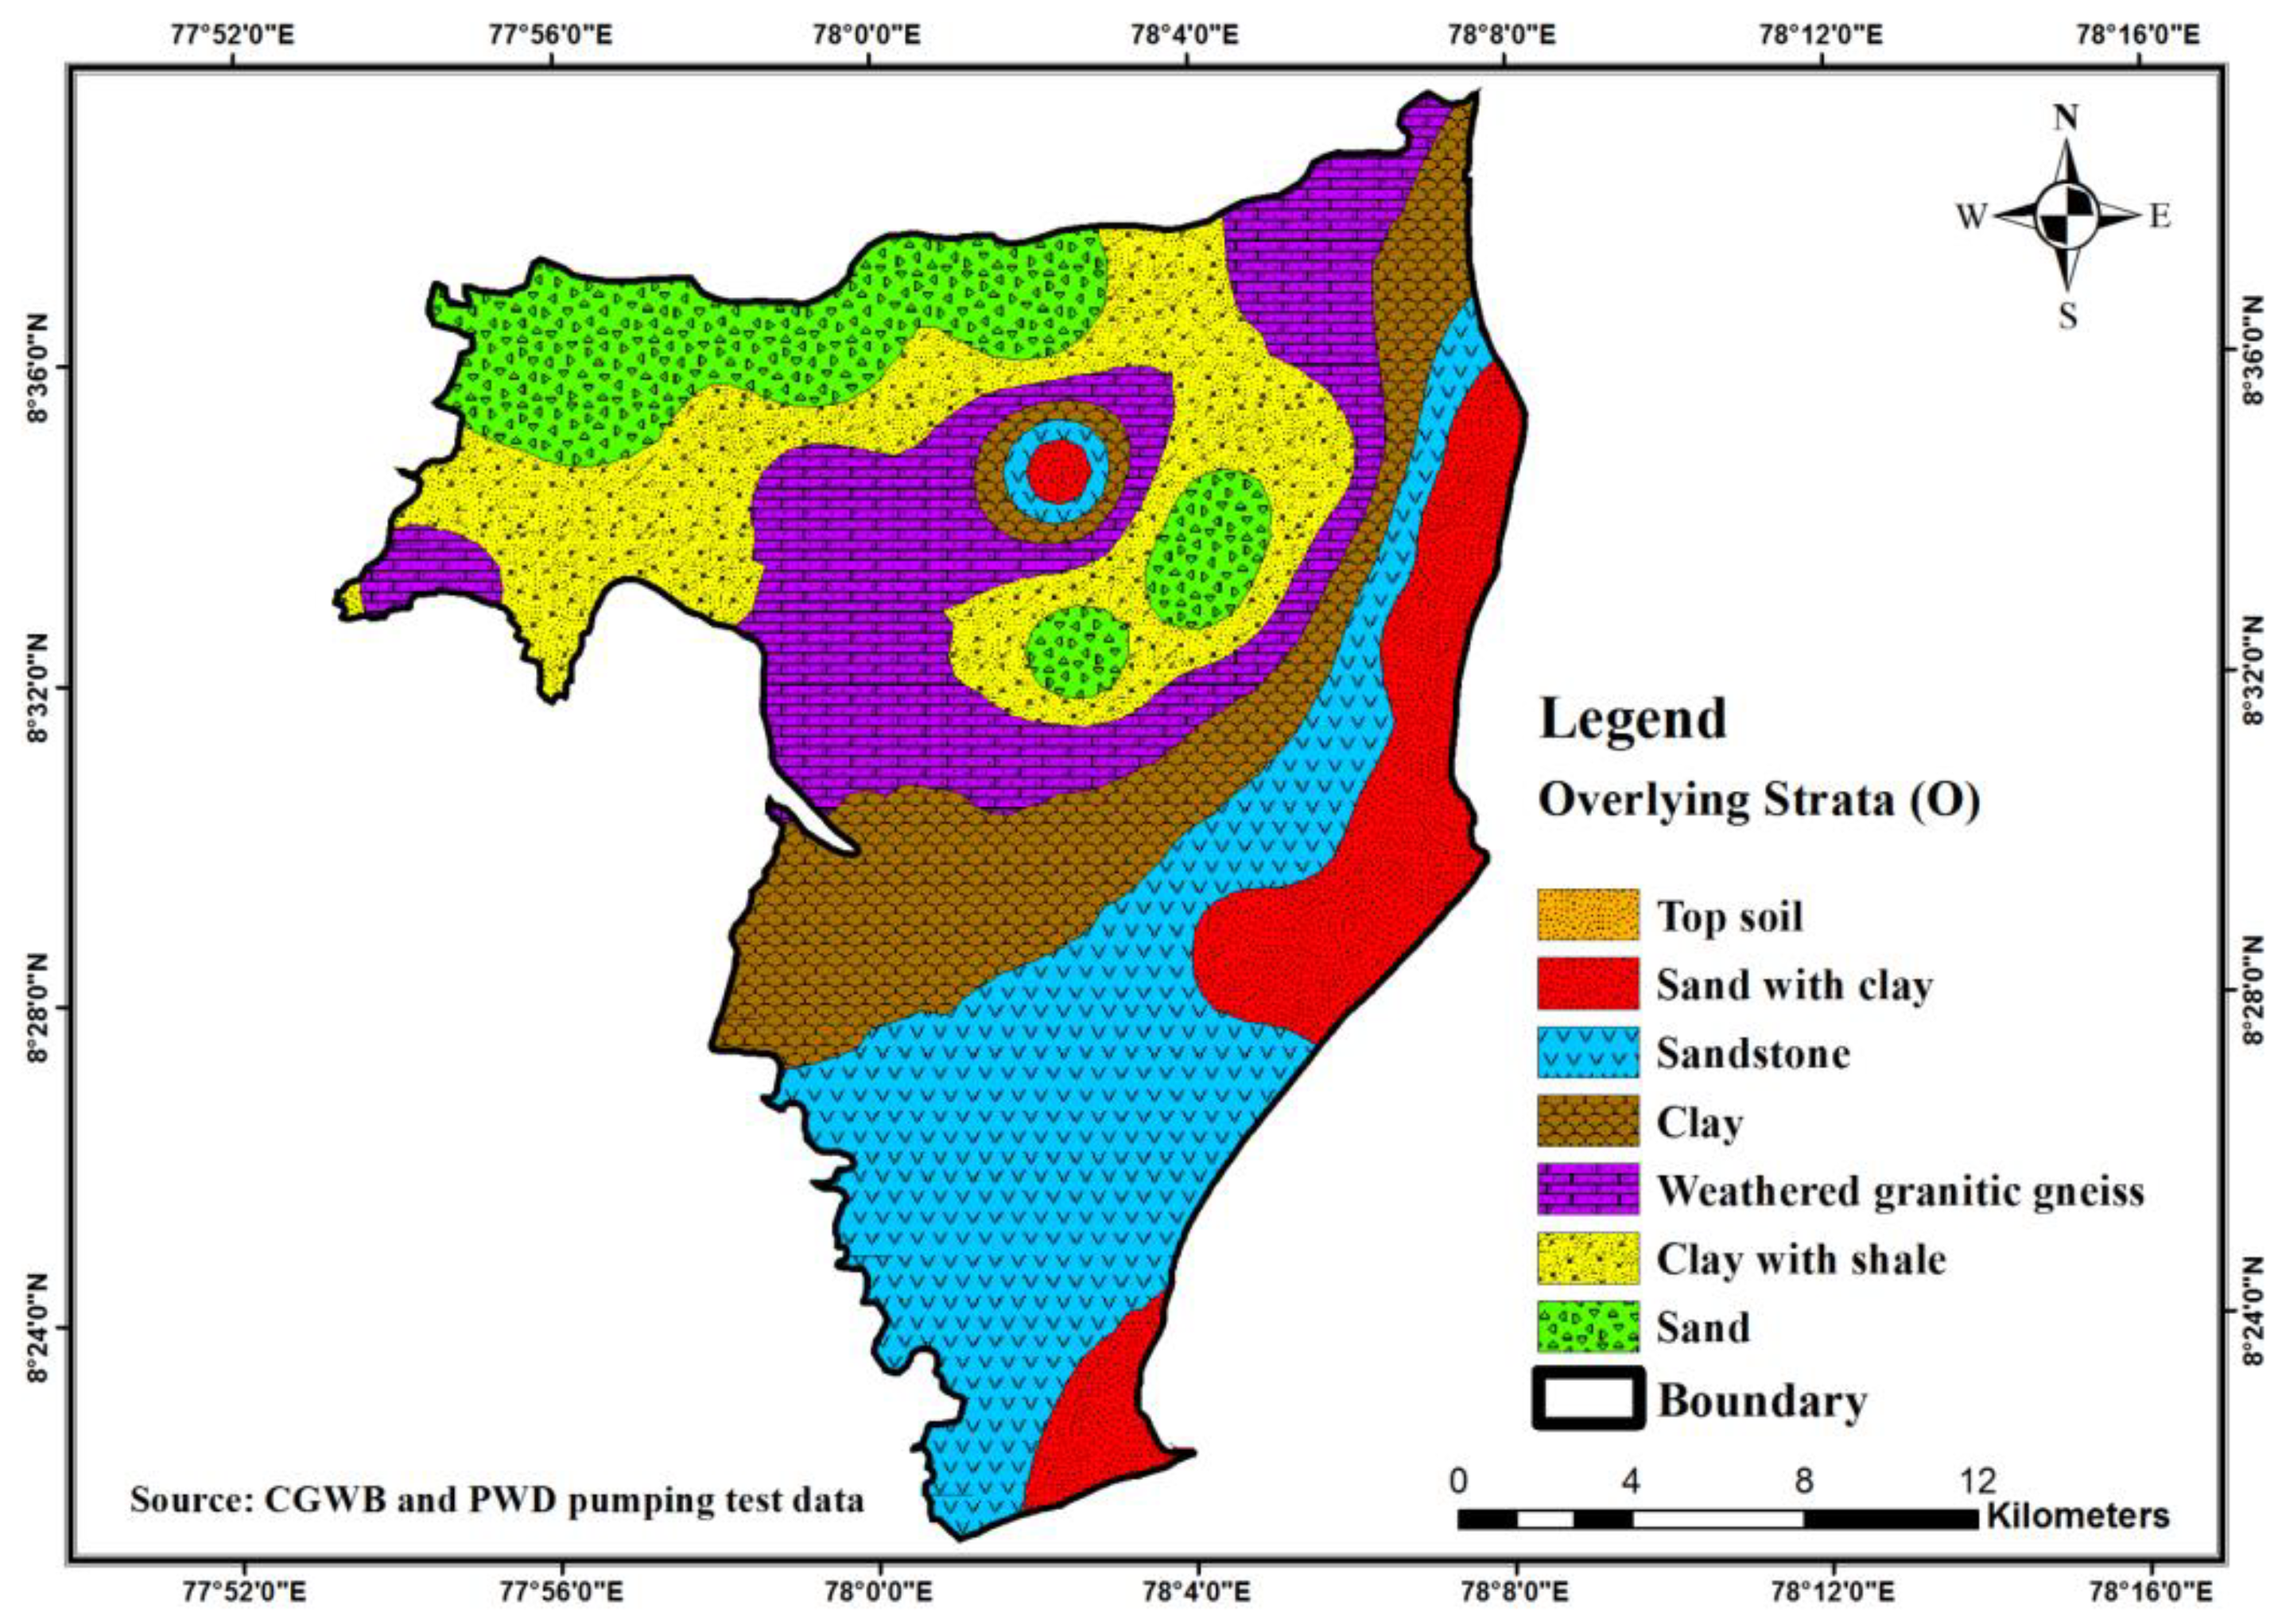
2.3.2. Overlying Aquifer Class (O)
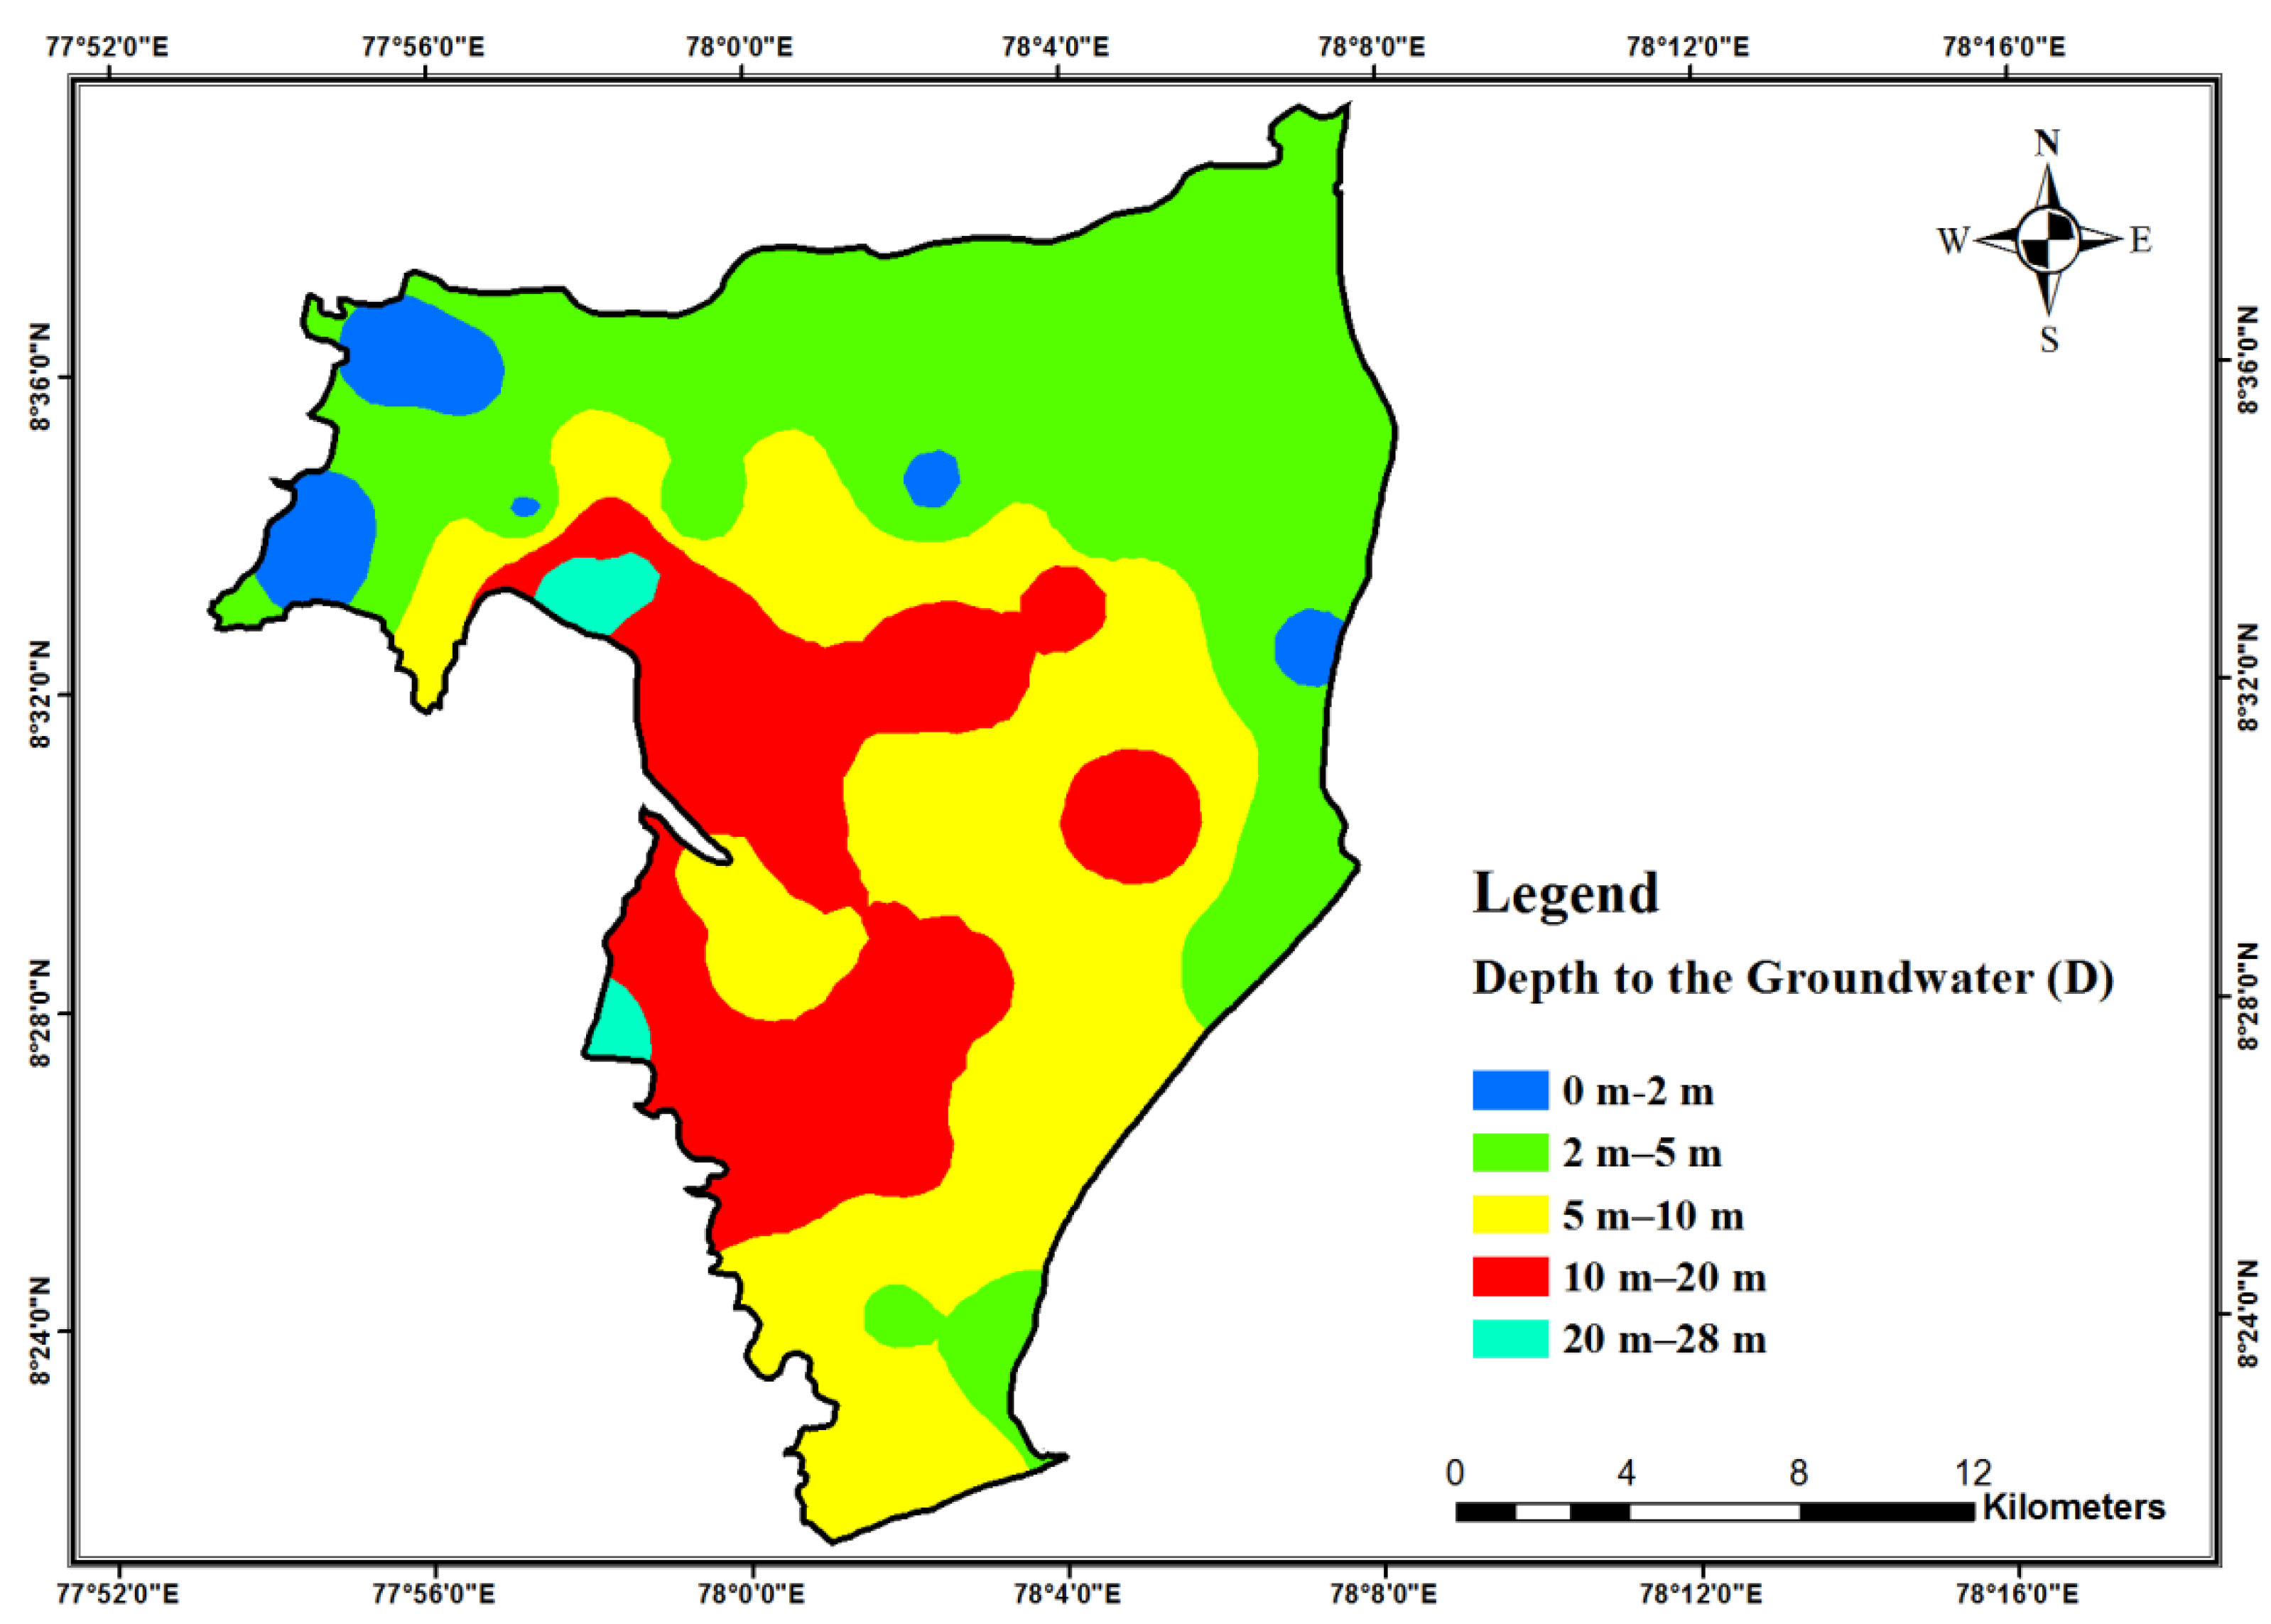
2.3.3. Depth to Groundwater (D)
2.4. Method to Model Validation
3. Results and Discussion
3.1. Geochemical Assessment for Drinking and Irrigation
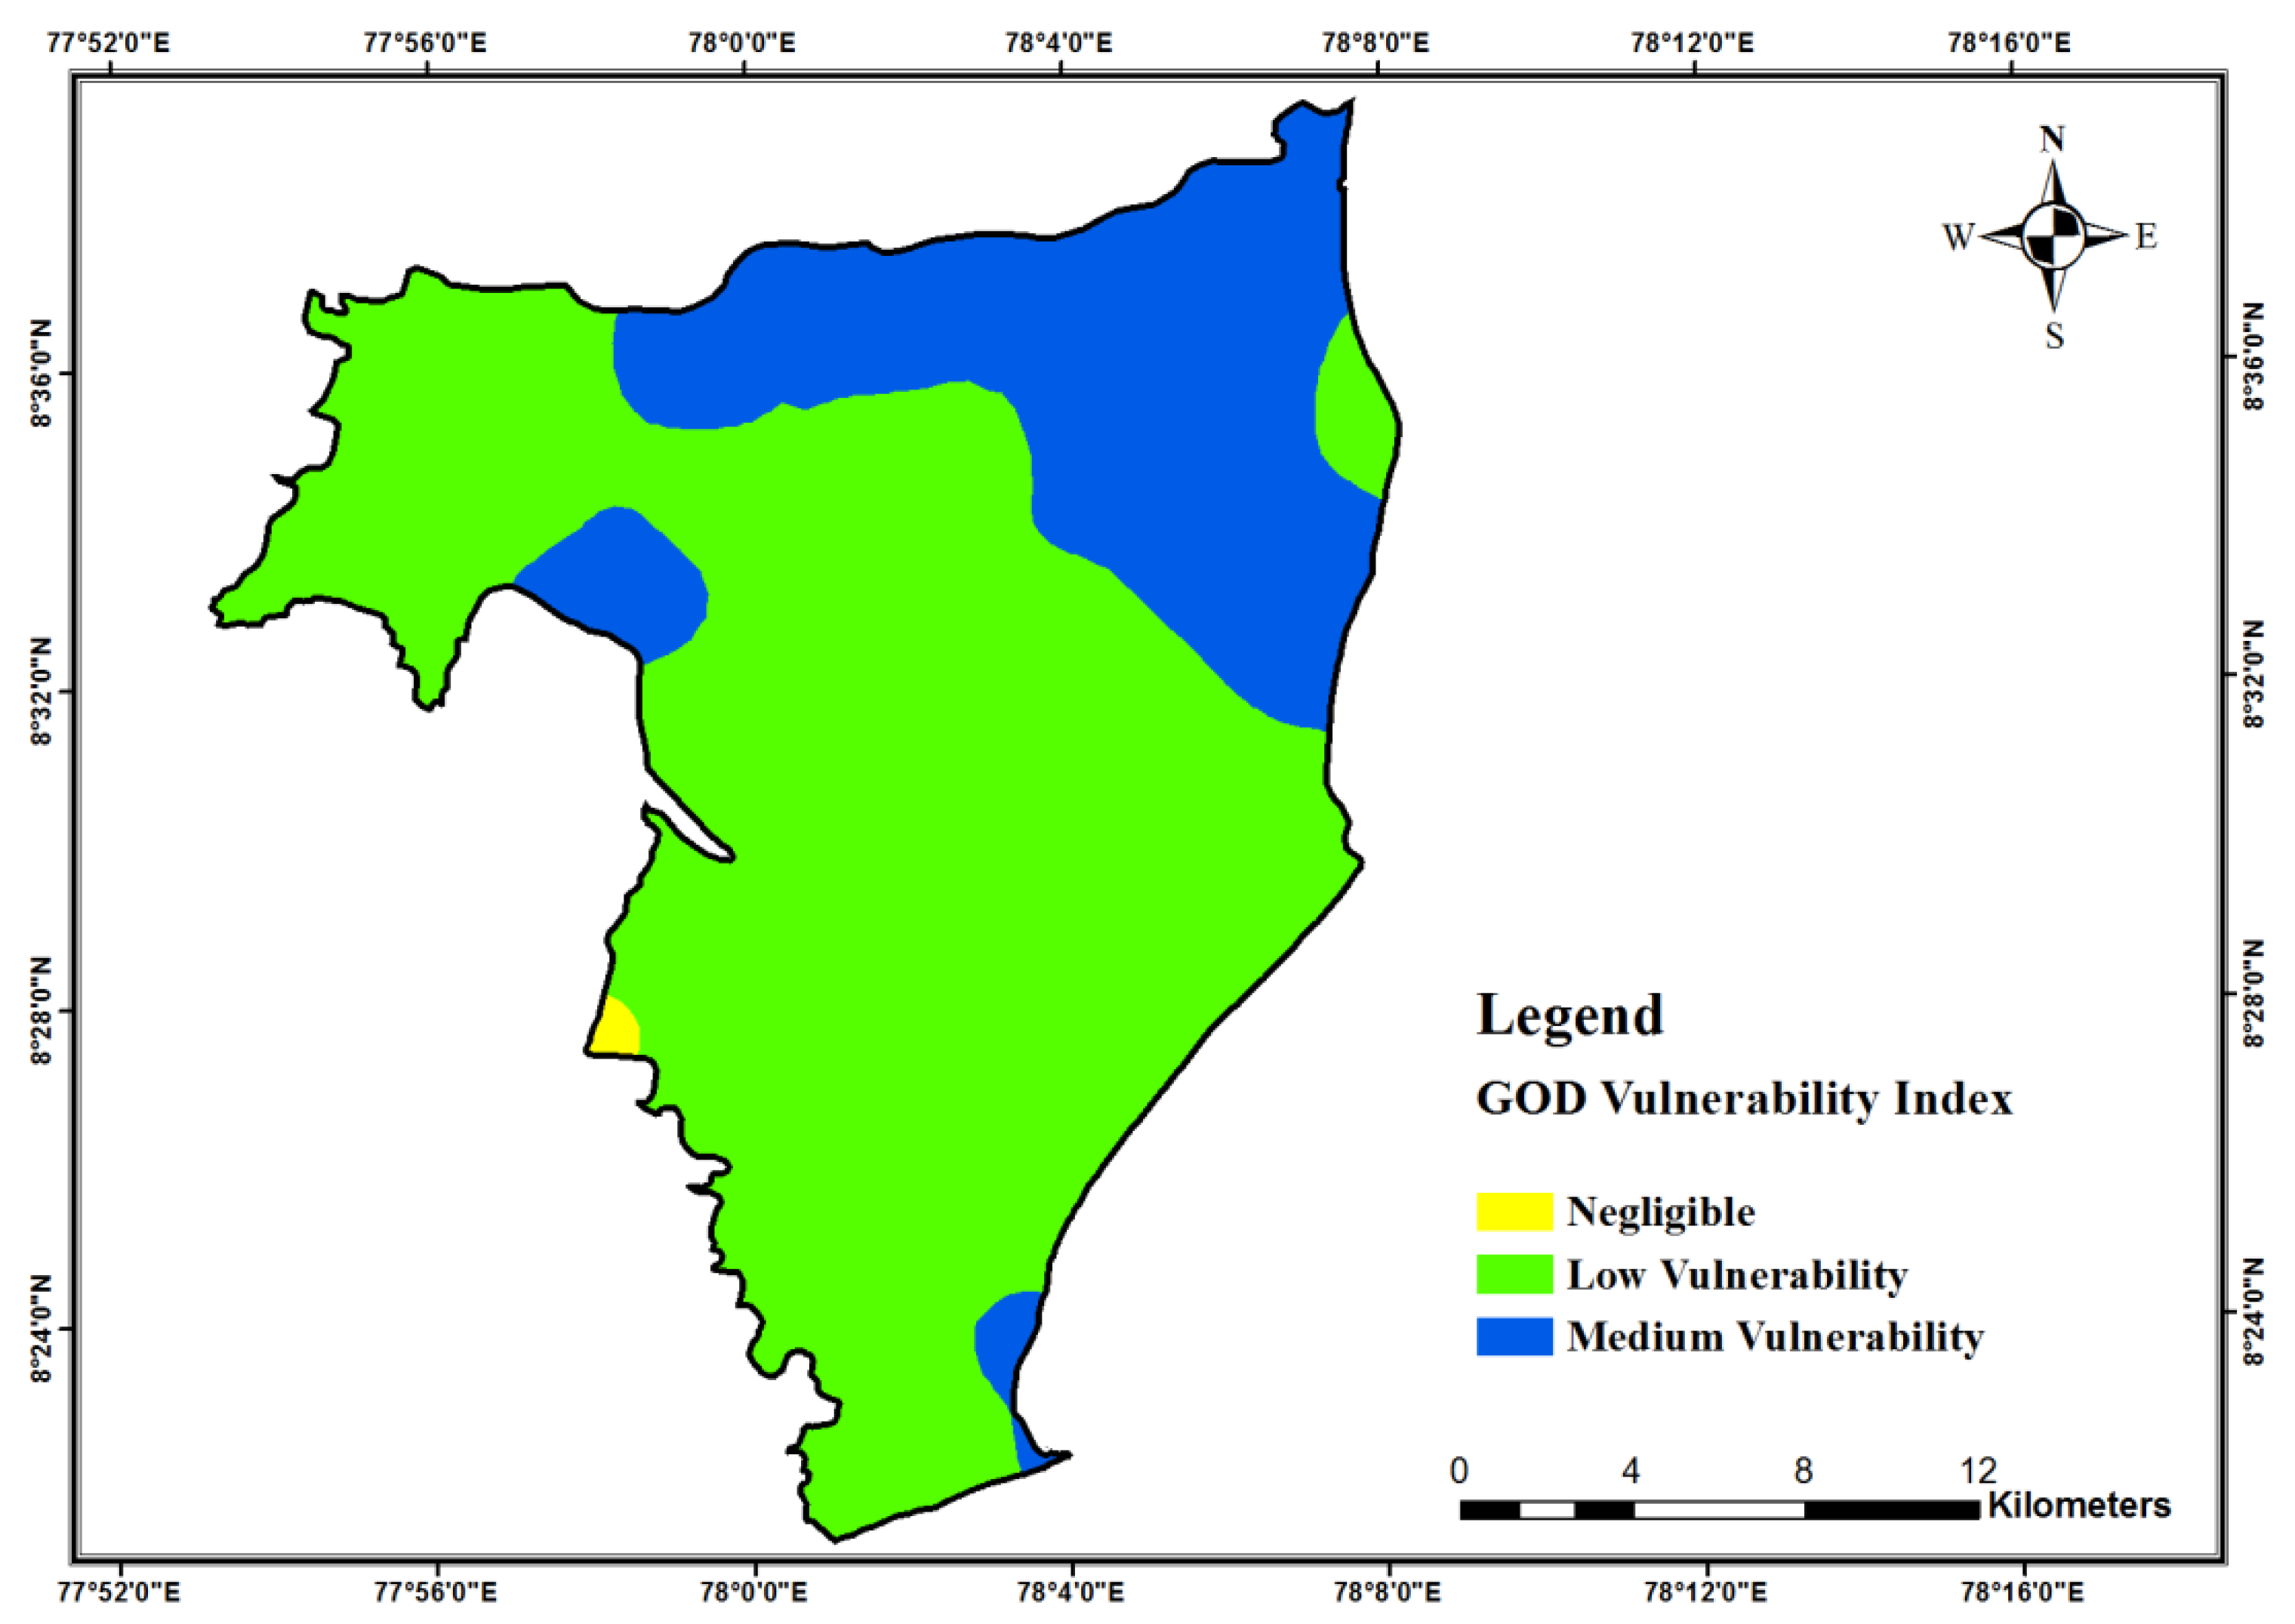
3.2. GOD Vulnerability Map
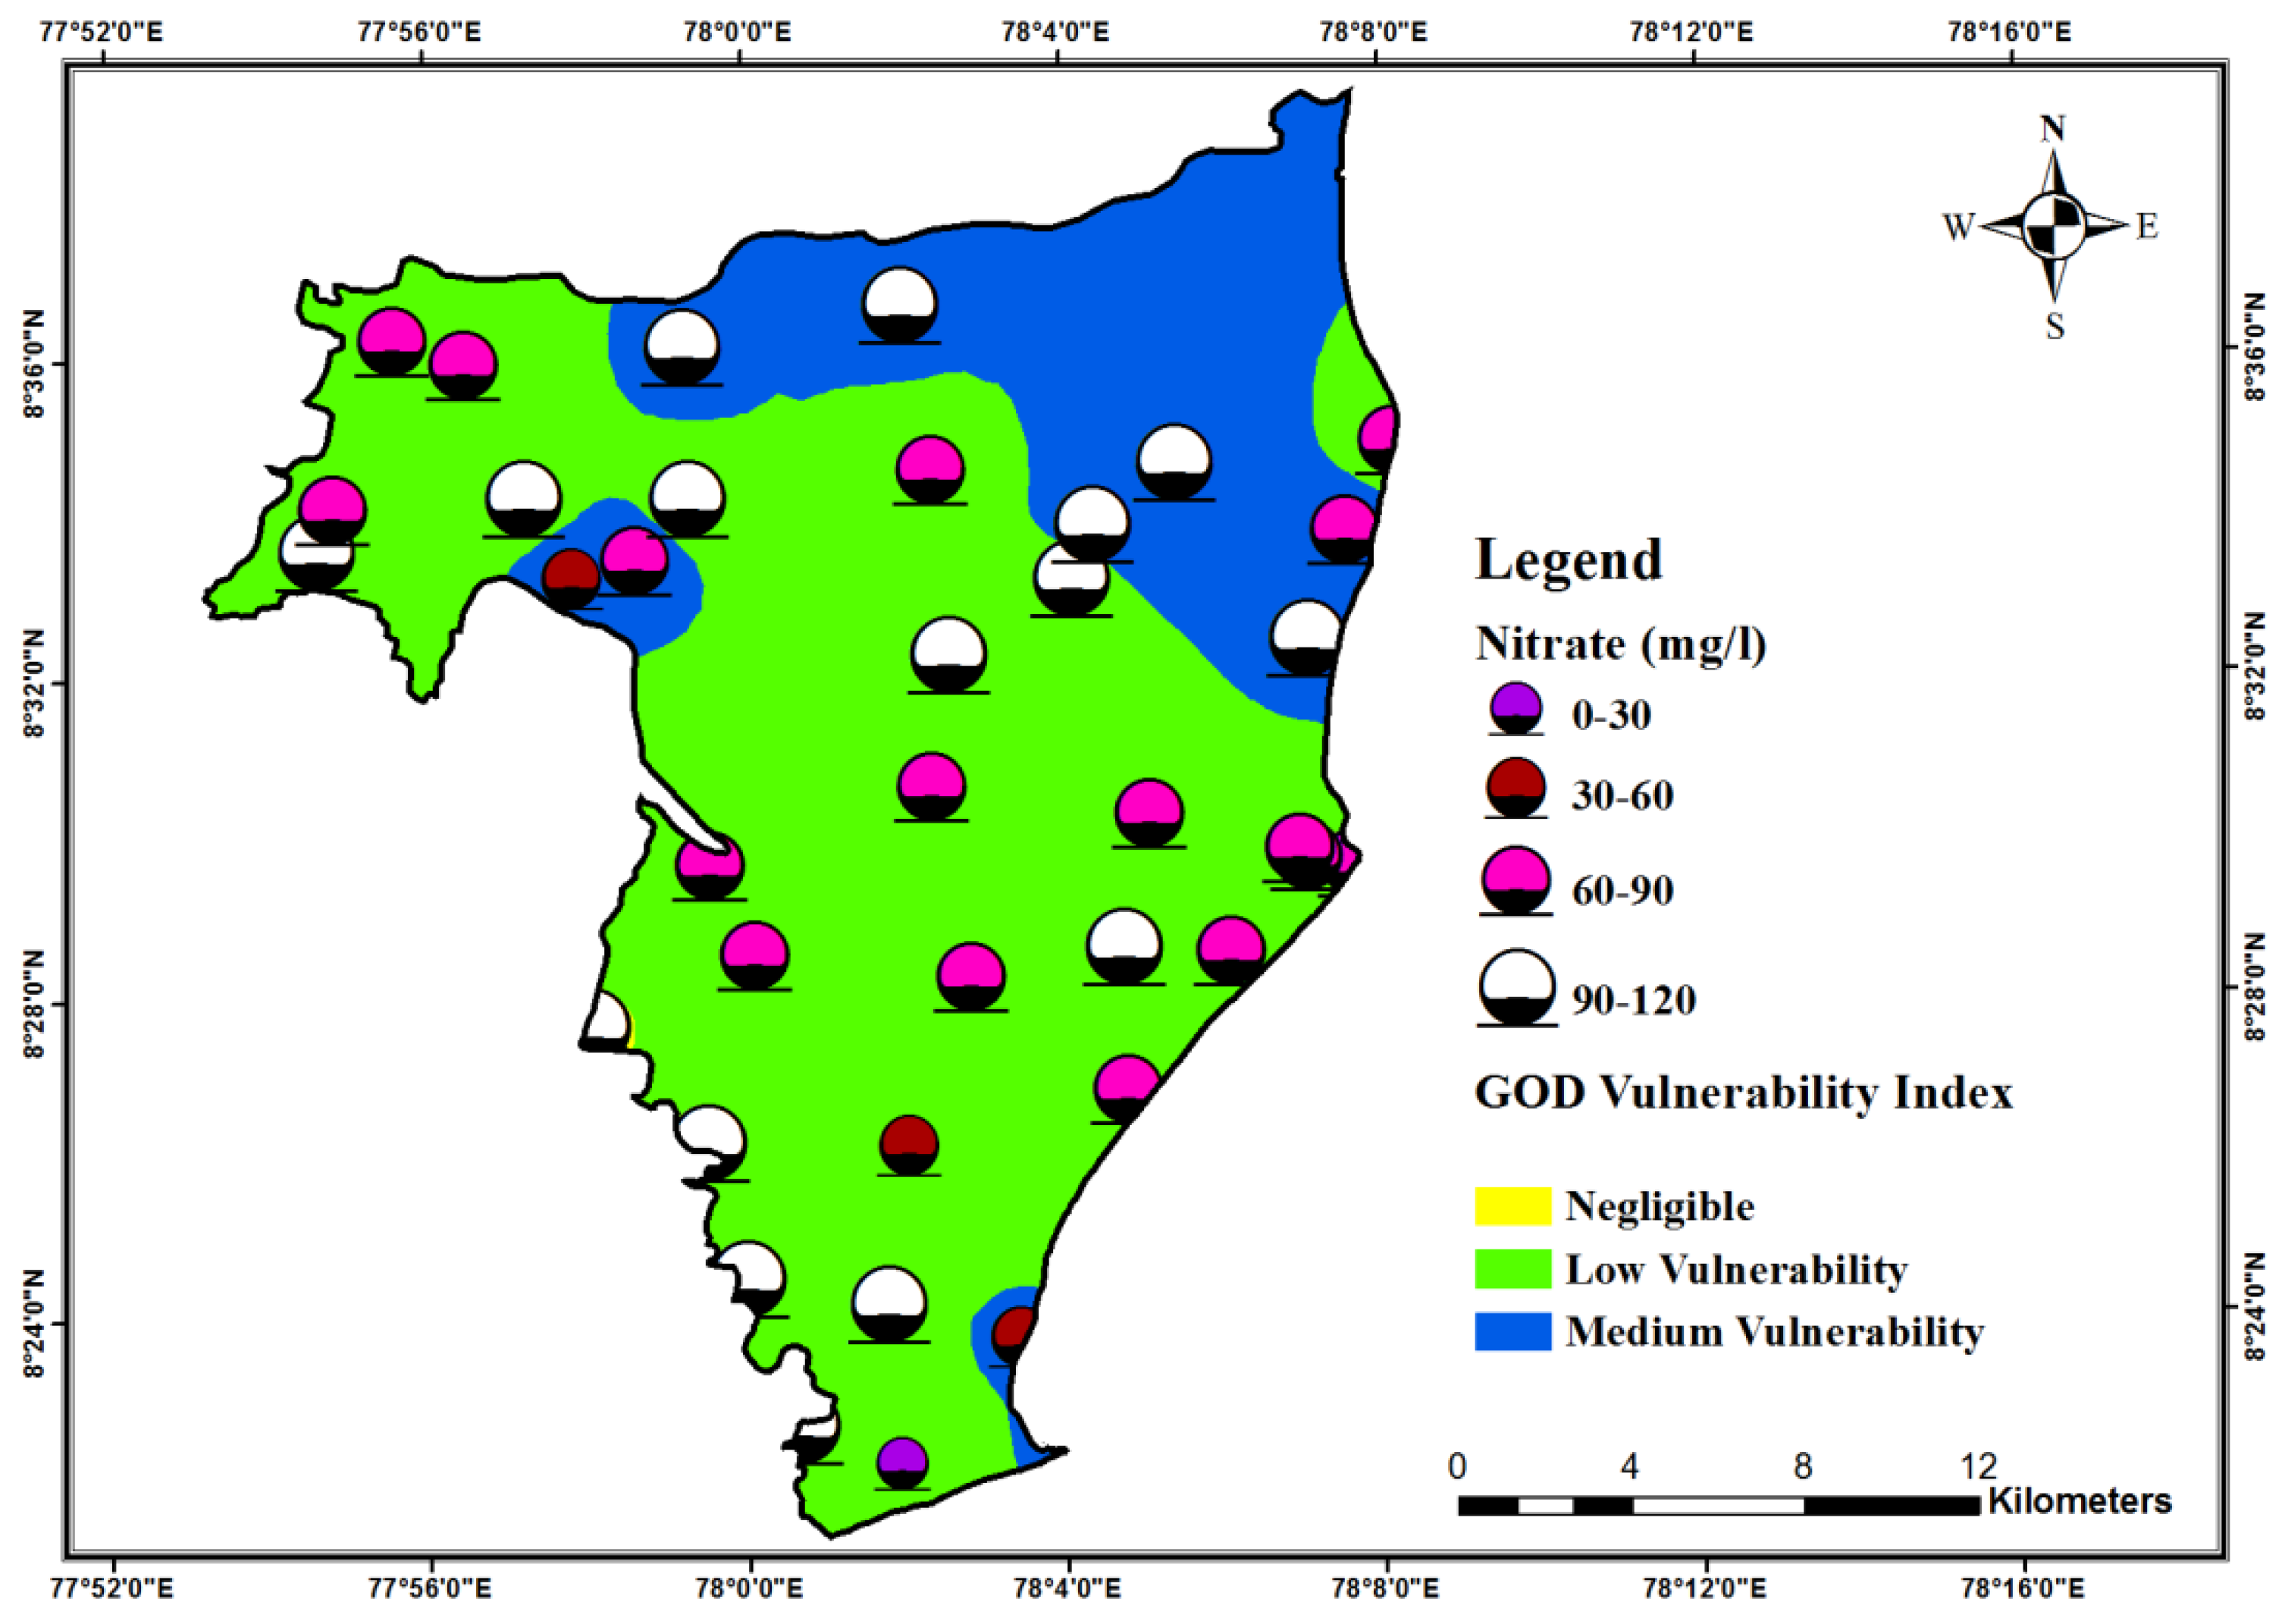
3.3. GOD Model Validate with Geochemical Parameters
3.4. Mitigation of Groundwater Sources from Vulnerability
4. Conclusions
Author Contributions
Funding
Data Availability Statement
Conflicts of Interest
References
- Rahman, M.R.; Islam, A.R.M.T.; Shammi, M. Emerging trends of water quality monitoring and applications of multivariate tools. Water Eng. Model. Math. Tools 2021, 14, 271–283. [Google Scholar]
- Rakib, M.; Sasaki, J.; Matsuda, H.; Quraishi, S.B.; Mahmud, J.; Doza, B.; Ullah, A.A.; Fatema, K.J.; Newaz, A.; Bhuiyan, M.A. Groundwater salinization and associated co-contamination risk increase severe drinking water vulnerabilities in the southwestern coast of Bangladesh. Chemosphere 2020, 246, 125646. [Google Scholar] [CrossRef]
- Ghazavi, R.; Ebrahimi, Z. Assessing groundwater vulnerability to contamination in an arid environment using DRASTIC and GOD models. Int. J. Environ. Sci. Technol. 2015, 2015, 2909–2918. [Google Scholar] [CrossRef] [Green Version]
- Bera, A.; Mukhopadhyay, B.P.; Chowdhury, P.; Ghosh, A.; Biswas, S. Groundwater vulnerability assessment using GIS-based DRASTIC model in Nangasai River Basin, India with special emphasis on agricultural contamination. Ecotoxicol. Environ. Saf. 2021, 214, 112085. [Google Scholar] [CrossRef]
- Popescu, I.C.; Gardin, N.; Brouyére, S.; Dassargues, A. Groundwater vulnerability assessment using physically based modeling: From challenges to pragmatic solutions. In Model CARE 2007 Proceedings, Calibration and Reliability in Ground-Water Modeling; Refsgaard, J.C., Kovar, K., Haarder, E., Nygaard, E., Eds.; IAHS Publication: Wallingford, UK, 2008; No. 320. [Google Scholar]
- Oroji, B. Groundwater vulnerability assessment with using GIS in Hamadan–Bahar plain, Iran. Appl. Water Sci. 2019, 9, 196. [Google Scholar] [CrossRef] [Green Version]
- Agyemang, A. Vulnerability Assessment of Groundwater to NO3 Contamination Using GIS, DRASTIC Model and Geostatistical Analysis. Master’s Thesis, Department of Geosciences, East Tennessee State University, Johnson City, TN, USA, 2017. Paper 3264. Available online: https://dc.etsu.edu/etd/3264 (accessed on 8 December 2017).
- Knouz, N.; Boudhar, A.; Bachaoui, E.M.; Saadi, C. Comparative approach of three popular intrinsic vulnerability methods: Case of the Beni Amir groundwater (Morocco). Arab. J. Geosci. 2018, 11, 281. [Google Scholar] [CrossRef]
- Civita, M. Le Carte Della Vulnerability à Degli Acquiferi All’inquinamento: Teoria e Practica [Contamination Vulnerability Mapping of the Aquifer: Theory and Practice]; Pitagora: Bologna, Italy, 1994; Volume 13. [Google Scholar]
- Aller, L. DRASTIC: A Standardized System for Evaluating Ground Water Pollution Potential Using Hydrogeologic Settings; Robert, S., Ed.; Kerr Environmental Research Laboratory: Ada, OK, USA, 1985. [Google Scholar]
- Ribeiro, R.J. A Sociedade Contra o Social: O Alto Custo da Vida Pública No Brasil: Ensaios. Companhia das Letras: Sao Paulo, Brazil, 2000; pp. 1–233. [Google Scholar]
- Foster, S. Fundamental concepts in aquifer vulnerability, pollution risk and protection strategy. In: Van Duijvenbooden W, Van Waegeningh HG (eds), Vulnerability of soil and groundwater to pollutants. Proc. Inf. TNO Comm. Hydrol. Res. Hague 1987, 38, 69–86. [Google Scholar]
- Akinlalu, A.A.; Mogaji, K.A.; Adebodun, T.S. Assessment of aquifer vulnerability using a developed “GODL” method (modified GOD model) in a schist belt environ, Southwestern Nigeria. Environ. Monit. Assess. 2021, 193, 1–27. [Google Scholar] [CrossRef] [PubMed]
- Boufekane, A.; Saighi, O. Application of groundwater vulnerability overlay and index methods to the Jijel plain area (Algeria). Groundwater 2018, 56, 143–156. [Google Scholar] [CrossRef] [Green Version]
- Kerzabi, R.; Mansour, H.; Yousfi, S.; Marín, A.I.; Navarro, B.A.; Bensefia, K.E. Contribution of remote sensing and GIS to mapping groundwater vulnerability in arid zone: Case from Amour Mountains- Algerian Saharan Atlas. J. Afr. Earth Sci. 2021, 182, 104277. [Google Scholar] [CrossRef]
- Lisboa, É.G.; Mendes, R.L.R.; Figueiredo, M.M.P.; Bello, L.A.L. Fuzzy-Probabilistic Model for a Risk Assessment of Groundwater Contamination: Application to an Urban Zone in the City of Belém, Pará, Brazil. Water 2020, 12, 1437. [Google Scholar] [CrossRef]
- Islam, T.; Foysol Mahmud, M.; Zafor, A. GIS based vulnerability assessment of shallow groundwater pollution in the southwest region of Bangladesh using GOD method. In Proceedings of International Conference on Planning, Architecture & Civil Engineering; Rajshahi University of Engineering & Technology: Rajshahi, Bangladesh, 2021. [Google Scholar]
- Voudouris, K. Assessing groundwater pollution risk in Sarigkiol basin, NW Greece. In River Pollution Research Progress; Nova Science Publishers Inc.: New York, NY, USA, 2009; pp. 265–281. [Google Scholar]
- Jesuraja, J.; Sekar, S.; Roy, P.D.; Senapathi, V.; Chung, S.Y.; Perumal, M.; Nath, A.V. Groundwater pollution index (GPI) and GIS-based appraisal of groundwater quality for drinking and irrigation in coastal aquifers of Tiruchendur, South India. Environ. Sci. Pollut. Res. 2021, 28, 29056–29074. [Google Scholar] [CrossRef]
- Jesuraja, K.; Selvam, S.; Murugan, R. GIS-based assessment of groundwater quality index (DWQI and AWQI) in Tiruchendur Coastal City, Southern Tamil Nadu, India. Environ. Earth Sci. 2021, 80, 1–17. [Google Scholar] [CrossRef]
- Selvam, S. Irrigational Feasibility of Groundwater and Evaluation of Hydrochemistry Facies in the SIPCOT Industrial Area, South Tamilnadu, India: A GIS Approach. Water Qual. Expo. Heal. 2014, 7, 265–284. [Google Scholar] [CrossRef]
- Selvam, S.; Jesuraja, K.; Venkatramanan, S.; Chung, S.; Roy, P.; Muthukumar, P.; Kumar, M. Imprints of pandemic lockdown on subsurface water quality in the coastal industrial city of Tuticorin, South India: A revival perspective. Sci. Total. Environ. 2020, 738, 139848. [Google Scholar] [CrossRef]
- Selvam, S.; Jesuraja, K.; Roy, P.D.; Venkatramanan, S.; Chung, S.; Elzain, H.E.; Muthukumar, P.; Nath, A.V.; Karthik, R. Assessment of groundwater from an industrial coastal area of south India for human health risk from consumption and irrigation suitability. Environ. Res. 2021, 200, 111461. [Google Scholar] [CrossRef]
- Singaraja, C. Relevance of water quality index for groundwater quality evaluation: Thoothukudi District, Tamil Nadu, India. Appl. Water Sci. 2017, 7, 2157–2173. [Google Scholar] [CrossRef]
- Singaraja, C.; Chidambaram, S.; Anandhan, P.; Prasanna, M.V.; Thivya, C.; Thilagavathi, R.; Sarathidasan, J. Determination of the utility of groundwater with respect to the geochemical parameters: A case study from Tuticorin District of Tamil Nadu (India). Environ. Dev. Sustain. 2013, 16, 689–721. [Google Scholar] [CrossRef]
- Singaraja, C.; Chidambaram, S.; Jacob, N.; Johnson Babu, G.; Selvam, S.; Anandhan, P.; Rajeevkumar, E.; Balamurugan, K.; Tamizharasan, K. Origin of high fluoride in groundwater of the Tuticorin district, Tamil Nadu. India Appl. Water Sci. 2018, 8, 54. [Google Scholar] [CrossRef] [Green Version]
- Selvam, S.; Manimaran, G.; Sivasubramanian, P.; Balasubramanian, N.; Seshunarayana, T. GIS-based Evaluation of Water Quality Index of groundwater resources around Tuticorin coastal city, south India. Environ. Earth Sci. 2013, 71, 2847–2867. [Google Scholar] [CrossRef]
- Chandrasekar, N.; Selvakumar, S.; Srinivas, Y.; Wilson, J.S.J.; Peter, T.S.; Magesh, N.S. Hydrogeochemical assessment of groundwater quality along the coastal aquifers of southern Tamil Nadu, India. Environ. Earth Sci. 2013, 71, 4739–4750. [Google Scholar] [CrossRef]
- APHA. Standard Method for Examination of Water and Wastewater, 21st ed.; APHA, AWWA, WPCF: Washington, DC, USA, 2005. [Google Scholar]
- Feumba, R. Hydrogéologieet Evaluation de la Vulnérabilité des Nappesdanslebassin Versant de Besseke (Douala, Cameroun). Ph.D. Thesis, University of Yaoundé I Cameroon, Yaounde, Cameroon, 2015; p. 254. [Google Scholar]
- Mfonka, Z.; Ngoupayou, J.N.; Ndjigui, P.D.; Kpoumie, A.; Zammouri, M.; Ngouh, A.N.; Rasolomanana, E.H. A GIS-based DRASTIC and GOD models for assessing alterites aquifer of three experimental watersheds in Foumban (West-ern-Cameroon). Groundw. Sustain. Dev. 2018, 7, 250–264. [Google Scholar] [CrossRef]
- Huang, C.-C.; Yeh, H.-F.; Lin, H.-I.; Lee, S.-T.; Hsu, K.-C.; Lee, C.-H. Groundwater recharge and exploitative potential zone mapping using GIS and GOD techniques. Environ. Earth Sci. 2012, 68, 267–280. [Google Scholar] [CrossRef]
- Foster, S.; Hirata, R. Groundwater Risk Assessment—A Methodology Using Available Data, 1st ed.; Technical report; Pan American Center for Sanitary Engineering and Environmental Sciences (CEPIS): Lima, Peru, 1988. [Google Scholar]
- Thirumalaivasan, D.; Karmegam, M.; Venugopal, K. AHP-DRASTIC: Software for specific aquifer vulnerability as-sessment using DRASTIC model and GIS. Environ. Model. Softw. 2003, 18, 645–656. [Google Scholar] [CrossRef]
- Elmeknassi, M.; El Mandour, A.; Elgettafi, M.; Himi, M.; Tijani, R.; El Khantouri, F.A.; Casas, A. A GIS-based approach for geospatial modeling of groundwater vulnerability and pollution risk mapping in Bou-Areg and Gareb aquifers, northeastern Morocco. Environ. Sci. Pollut. Res. 2021, 28, 51612–51631. [Google Scholar] [CrossRef]
- Hasan, M.; Islam, A.; Alam, J.; Peas, M.H. Groundwater vulnerability assessment in Savarupazila of Dhaka district, Bangladesh—A GIS-based DRASTIC modeling. Groundw. Sustain. Dev. 2019, 9, 100220. [Google Scholar] [CrossRef]
- Barbulescu, A. Assessing Groundwater Vulnerability: DRASTIC and DRASTIC-Like Methods: A Review. Water 2020, 12, 1356. [Google Scholar] [CrossRef]
- Ravbar, N.; Goldscheider, N. Comparative application of four methods of groundwater vulnerability mapping in a Slovene karst catchment. Hydrogeol. J. 2009, 17, 725–733. [Google Scholar] [CrossRef] [Green Version]
- Pusatli, O.T.; Camur, M.Z.; Yazicigil, H. Susceptibility indexing method for irrigation water management planning: Applications to K. Menderes river basin, Turkey. J. Environ. Manag. 2009, 90, 341–347. [Google Scholar] [CrossRef]
- Saidi, S.; Bouri, S.; Ben Dhia, H.; Anselme, B. A GIS-based susceptibility indexing method for irrigation and drinking water management planning: Application to Chebba–Mellouleche Aquifer, Tunisia. Agric. Water Manag. 2009, 96, 1683–1690. [Google Scholar] [CrossRef]
- WHO. Guidelines for Drinking-Water Quality, Recommendations, 3rd ed.; WHO: Geneva, Switzerland, 2014; Volume 1, p. 668. [Google Scholar]
- Richards, L.A. Diagnosis and Improvement of Saline and Alkalinesoils; Salinity Laboratory Staff, Ed.; US Department of Agriculture: Washington, DC, USA, 1954.
- Subramanian, S.; Sujatha, K.; Balasubramanian, A.; Thirugnanasambandam, R.; Radhakrishnan, V. Hydrogeology along Tuticorin Coast, Tamil Nadu; Groundwater Development Problems in Southern Kerala: Southern Kerala, India, 1993; Volume 1, pp. 26–34. [Google Scholar]
- Mondal, N.C.; Singh, V.S.; Rangarajan, R. Aquifer characteristics and its modeling around an industrial complex, Tuticorin, Tamil Nadu, India: A case study. J. Earth Syst. Sci. 2009, 118, 231–244. [Google Scholar] [CrossRef] [Green Version]
- Singaraja, C.; Chidambaram, S.; Anandhan, P.; Prasanna, M.V.; Thivya, C.; Thilagavathi, R.; Sarathidasan, J. Geochemical evaluation of fluoride contamination of groundwater in the Thoothukudi District of Tamilnadu, India. Appl. Water Sci. 2014, 4, 241–250. [Google Scholar] [CrossRef]
- Selvam, S.I.J.D.; Mala, R.I.J.D.; Muthukakshmi, V. A hydrochemical analysis and evaluation of groundwater quality index in Thoothukudi district, Tamilnadu, South India. Int. J. Adv. Eng. Appl. 2013, 2, 25–37. [Google Scholar]
- Singaraja, C.; Chidambaram, S.; Anandhan, P.; Prasanna, M.V.; Thivya, C.; Thilagavathi, R. A study on the status of saltwater intrusion in the coastal hard rock aquifer of South India. Environ. Dev. Sustain. 2014, 17, 443–475. [Google Scholar] [CrossRef]
- Sivakumar, K.; Priya, J.; Muthusamy, S.; Saravanan, P.; Jayaprakash, M. Spatial diversity of major ionic absorptions in groundwater: Recent study from the industrial region of Tuticorin, Tamil, Nadu, India. Enviro. Geo. Chem. Acta 2016, 3, 138–147. [Google Scholar]
- Viveka, B.; Arunkumar, V.; Vasanthi, D. Assessment of Groundwater Quality in Coastal Areas of Thoothukudi District, Tamil Nadu. Madras Agric. J. 2019, 106, 1. [Google Scholar] [CrossRef]
- Selvam, S.; Jesuraja, K.; Venkatramanan, S.; Roy, P.D.; Kumari, V.J. Hazardous microplastic characteristics and its role as a vector of heavy metal in groundwater and surface water of coastal south India. J. Hazard. Mater. 2020, 402, 123786. [Google Scholar] [CrossRef] [PubMed]
- Singha, S.S.; Pasupuleti, S.; Singha, S.; Singh, R.; Venkatesh, A.S. A GIS-based modified DRASTIC approach for geo-spatial modeling of groundwater vulnerability and pollution risk mapping in Korba district, Central India. Environ. Earth Sci. 2019, 78, 1–19. [Google Scholar] [CrossRef]
- Abbasnia, A.; Yousefi, N.; Mahvi, A.H.; Nabizadeh, R.; Radfard, M.; Yousefi, M.; Alimohammadi, M. Evaluation of groundwater quality using water quality index and its suitability for assessing water for drinking and irrigation purposes: Case study of Sistan and Baluchistan province (Iran). Hum. Ecol. Risk Assess. Int. J. 2019, 25, 988–1005. [Google Scholar] [CrossRef]
- Gopinath, S.; Srinivasamoorthy, K.; Saravanan, K.; Prakash, R.; Karunanidhi, D. Characterizing groundwater quality and seawater intrusion in coastal aquifers of Nagapattinam and Karaikal, South India using hydrogeochemistry and modeling techniques. Hum. Ecol. Risk Assess. Int. J. 2019, 25, 314–334. [Google Scholar] [CrossRef]
- Rabeiy, R.E. Assessment and modeling of groundwater quality using WQI and GIS in Upper Egypt area. Environ. Sci. Pollut. Res. 2017, 25, 30808–30817. [Google Scholar] [CrossRef]
- Sajil Kumar, P.; James, E. Identification of hydrogeochemical processes in the Coimbatore district, Tamil Nadu, India. Hydrol. Sci. J. 2016, 61, 719–731. [Google Scholar] [CrossRef]
- Selvam, S.; Manimaran, G.; Sivasubramanian, P. Hydrochemical characteristics and GIS-based assessment of groundwater quality in the coastal aquifers of Tuticorin corporation, Tamilnadu, India. Appl. Water Sci. 2012, 3, 145–159. [Google Scholar] [CrossRef] [Green Version]
- WHO. Guidelines for Drinking Water Quality: Fourth Edition Incorporating the First Addendum; World Health Organization: Geneva, Switzerland, 2017. [Google Scholar]
- Madison, R.J.; Brunett, J.O. Overview of the occurrence of nitrate in ground water of the United States. In National Water Summary 1984-Hydrologic Events, Selected Water-Quality Trends, and Ground-Water Resources; Water-Supply Paper 2275; U.S. Geological Survey: Reston, VA, USA, 1985; pp. 93–105. [Google Scholar] [CrossRef]
- Satheeskumar, V.; Subramani, T.; Lakshumanan, C.; Roy, P.D.; Karunanidhi, D. Groundwater chemistry and demarcation of seawater intrusion zones in the Thamirabarani delta of south India based on geochemical signatures. Environ. Geochem. Heal. 2020, 43, 757–770. [Google Scholar] [CrossRef] [PubMed]


| Parameters | Type | Ratting |
|---|---|---|
| GroundwaterOccurrence (G) | No aquifer | 0 |
| Aquifer confined and artesian | 0.1 | |
| Confined and non-artesian aquifer | 0.2 | |
| Semi-Confined Aquifer | 0.3 | |
| Aquifer with fairly permeable cover | 0.4-0.6 | |
| Unconfined aquifer | 0.7–1 | |
| Overlyinglithology ofaquifer (O) | Residual soil | 0.4 |
| Alluvial silt, clay, marl, fine limestone | 0.5 | |
| Wind, silt, tuff, igneous rock, and fractured metamorphic | 0.6 | |
| Sand and gravel, sandstone, tuff | 0.7 | |
| Gravel (colluviums) | 0.8 | |
| Limestone | 0.9 | |
| Fractured or karst limestone | 1 | |
| Depth to the groundwater(D) | 0–2 | 1 |
| 2–5 | 0.9 | |
| 5–10 | 0.8 | |
| 10–20 | 0.7 | |
| 20–50 | 0.6 | |
| 50–100 | 0.5 | |
| >100 | 0.4 |
| Vulnerability Class | GOD Index |
|---|---|
| 0 | No Vulnerability |
| 0–0.1 | Negligible |
| 0.1–0.3 | Low Vulnerability |
| 0.3–0.5 | Medium Vulnerability |
| 0.5–0.7 | High Vulnerability |
| 0.7–1 | Very High Vulnerability |
| Scale of Category | EC in µS/cm | NO3− in mg/L | ||||||
|---|---|---|---|---|---|---|---|---|
| Drinking [39,40,41] | Irrigation [41,42] | Drinking [39,40,41] | Irrigation [41,42] | |||||
| Grade | % of Samples | Grade | % of Samples | Grade | % of Samples | Grade | % of Samples | |
| Very good | 0–180 | 0–250 | 0–10 | 31 | 0–10 | 31 | ||
| Good | 180–400 | 3 | 250–750 | 13 | 10–25 | 24 | 10–30 | 24 |
| Usable | 400–2000 | 50 | 750–2000 | 40 | 25–50 | 24 | 30–50 | 24 |
| Usable with caution | 2000–3000 | 3 | 2000–3000 | 3 | 50–100 | 18 | ||
| Harmful | >3000 | 44 | >3000 | 44 | >50 | 21 | >100 | 3 |
| Year | Pollution Source | Flagged Pollutants and Parameters | Reference |
|---|---|---|---|
| 1993 | Over exploitation | Groundwater salinity and quality | [43] |
| 2009 | Domestic effluents | Groundwater Contamination | [44] |
| 2011 | anthropogenic contamination (likesalt pans and fertilizer) | To enhance the Na+ and Cl− | [45] |
| 2011 | Industrial activities | Fluoride contamination | [21] |
| 2012 | Infiltration process from sewers canals, unprotected drains and industrial effluents | To increase the TDS > 1500 mg/L | [46] |
| 2012 | Salt pans | Enhance alkaline nature | [47] |
| 2012 | Industrial effluents | Metal pollution | [45] |
| 2012 | Agricultural return flow, domestic sewage, septic tanks or other anthropogenic activities | Nitrate pollution | [46] |
| 2013 | Seawater influence or salt pan deposits or ionic exchangeprocess | Increase Na+ in groundwater | [48] |
| 2014 | Owing to the modern day issues of sea level rise, irregular patterns of rainfall due to climate change | Increased demand of groundwater | [49] |
| 2014 | Chemical industries, salt, flower dying, copper wire, copper alloy, alkali chemicals and fertilizers, petro-chemicals & plastics industries | Overall groundwater quality | [21] |
| 2018 | Urbanization, Over exploitation and Industrialization | To decrease the groundwater quality | [50] |
| 2019 | Rural and private septic systems, sinkholes, municipal sewage systems and tourism | To increase micro plastic in groundwater | [23] |
| 2020 | Fishing industries | High organic compounds in the groundwater | [51] |
Disclaimer/Publisher’s Note: The statements, opinions and data contained in all publications are solely those of the individual author(s) and contributor(s) and not of MDPI and/or the editor(s). MDPI and/or the editor(s) disclaim responsibility for any injury to people or property resulting from any ideas, methods, instructions or products referred to in the content. |
© 2023 by the authors. Licensee MDPI, Basel, Switzerland. This article is an open access article distributed under the terms and conditions of the Creative Commons Attribution (CC BY) license (https://creativecommons.org/licenses/by/4.0/).
Share and Cite
Sekar, S.; Kamaraj, J.; Poovalingam, S.; Duraisamy, R.; Senapathi, V.; Sang Yong, C. Appraisal of Groundwater Vulnerability Pollution Mapping Using GIS Based GOD Index in Tiruchendur, Thoothukudi District, India. Water 2023, 15, 520. https://doi.org/10.3390/w15030520
Sekar S, Kamaraj J, Poovalingam S, Duraisamy R, Senapathi V, Sang Yong C. Appraisal of Groundwater Vulnerability Pollution Mapping Using GIS Based GOD Index in Tiruchendur, Thoothukudi District, India. Water. 2023; 15(3):520. https://doi.org/10.3390/w15030520
Chicago/Turabian StyleSekar, Selvam, Jesuraja Kamaraj, Sivasubramanian Poovalingam, Radhika Duraisamy, Venkatramanan Senapathi, and Chung Sang Yong. 2023. "Appraisal of Groundwater Vulnerability Pollution Mapping Using GIS Based GOD Index in Tiruchendur, Thoothukudi District, India" Water 15, no. 3: 520. https://doi.org/10.3390/w15030520